1. Introduction
The urbanization of society in the physical sense causes major changes in local microclimatic conditions and affects air quality. One of the most commonly measured and best-documented parameters of microclimatic conditions is the increase in soil and air temperature. This well-known parameter is called the urban heat island. The main cause of this phenomenon is the concentration of a disproportionately large number of concrete objects (buildings), asphalt surfaces (streets, sidewalks, etc.) and other materials in one relatively large area, which, compared to natural materials and surfaces, green and water surfaces, and especially areas under forest, exhibit increased heat accumulation. The property of heat accumulation in these areas also occurs as a consequence of intensive traffic and industrial activity, which, at the same time, results in increased aerothermal pollution. The increased concentration of gases resulting from emissions due to heat transfer by radiation leads to greater heat retention, which significantly increases the air temperature in the urban environment. Urban heat islands are not spatially homogeneous. The structure of urban space is the main factor in this inhomogeneity. The state of urban heat islands is most often described using a quantity called heat island intensity. This quantity is defined as the difference in air temperature in an urban and corresponding rural environment [
1,
2,
3,
4]. Their intensity does not increase continuously from the periphery to the city center, which will be shown in this paper.
While changes in surface materials and urban geometry are primary drivers of the passive heating of a city, the UHI phenomenon is further amplified by direct anthropogenic heat emissions. Among these, vehicular traffic stands out as a major and dynamic contributor, releasing not only significant thermal energy but also air pollutants that alter the radiative properties of the urban atmosphere. This study, therefore, transitions from the general UHI context to a specific focus on traffic, as it represents a critical intersection of heat and pollution generation at the microscale, directly impacting both the thermal environment and local air quality. This link forms the central hypothesis of our investigation.
The aim of this paper is to quantify the impact and establish analytical dependence between urban (building layout, green space coverage, traffic intensity) and meteorological (air temperature, relative humidity, CO2 concentration, solar radiation intensity, wind speed and direction) parameters on the value of urban heat island intensity, as well as determine the impact of urban heat islands on increased energy consumption (for cooling buildings, etc.) by applying modern experimental and numerical methods.
The study focusses on two key aspects:
The methodology: Traffic flows at seven busy Belgrade intersections were measured and COPERT was used to calculate emissions (CO2, VOCs, NOx, CO, PM). CO2 served as a critical input (SCO2) for the model.
Modeling: A numerical 3D model links the dispersion of pollutants with heat transfer. The effective atmospheric emission coefficient (€’a) is directly linked to the local CO2 concentration, so that the transport-derived CO2 is the central variable in the simulation of urban temperature changes.
Focusing on traffic-related CO2 emissions reveals hotspots at street level within urban heat islands. A validated numerical model shows that air temperatures near busy roads can be several degrees higher, quantifying the dynamic contribution of traffic. This approach provides usable insights for urban planning and enables targeted measures such as low-emission zones, traffic diversions or the promotion of public transport as well as strategies for green spaces.
2. Experimental Methods
This section constitutes the first phase of the applied methodology, the experimental phase. It provides a detailed description of the field measurements carried out in both urban and rural environments, including temperature, humidity, solar radiation, wind characteristics, and traffic intensity. The aim of this phase is to obtain reliable data for quantifying the urban heat island intensity (UHII) and for generating input parameters for the subsequent numerical simulations. In this study, the urban heat island intensity (UHII) is rigorously defined as the difference between the air temperature measured at a representative urban location and that measured at a corresponding rural reference location under comparable meteorological conditions.
UHII is defined as the air temperature difference between the selected urban site (measured at 2 m above ground in the city center of Belgrade) and the rural reference site (Vinča settlement, also at 2 m height). The averaging period will be explicitly stated as hourly mean values, with both long-term (March–September 2015) and short-term (daily) sampling windows. The exact formula is: UHII = Turban (t) − Trural (t), where Turban (t) and Trural (t) denote the measured air temperatures at the urban and rural stations at time.
The most important characteristic of urban heat islands is the UHII. This quantity is defined as the difference in air temperature between urban and rural environments. Experimental measurements in this paper were used to determine the value of the UHII in a selected urban area of the city of Belgrade, as well as to analyze the impact of UHII on energy consumption. At a selected urban location in the city of Belgrade, in the immediate vicinity of the building of the Higher Textile School for Design, Technology and Management, as well as in a representative rural environment, the settlement of Vinča with Vinča Institute of Nuclear Sciences, detailed measurements of air temperature, radiant temperature, relative humidity, air velocity and solar radiation intensity were carried out. These parameters were used to calculate and estimate the impact of certain parameters on the value of UHII and as input data for the mathematical–numerical model. In addition, the number of vehicles, classified into seven typical categories, was measured in the urban location, which was used to calculate the emission of certain air pollutants due to traffic in the selected urban environment. The obtained emission values were used to form a base of pollutants from traffic in the urban environment, while the carbon dioxide value was also used as input data for a mathematical–numerical model.
Air temperature, carbon dioxide concentration, and air temperature values were measured at additional locations in the urban environment, more precisely in the immediate vicinity of the aforementioned school building, and the obtained results were used to validate the mathematical–numerical model. During the experimental measurement, modern measuring equipment was used, and the measurement procedures and processing of measured values with measurement uncertainty were carried out in accordance with applicable international regulations and standards. The experimental research was conducted in the period March–September 2015.
The urban site was located in the immediate vicinity of the Higher Textile School for Design, Technology and Management, in the Belgrade city center. This area is characterized by dense built-up structures, asphalt roads, and limited vegetation, with about only 8.5% of the total surface covered by greenery. The rural reference site was situated within the park of the Vinča Institute of Nuclear Sciences in the settlement of Vinča, surrounded predominantly by natural land cover and vegetation, with a negligible proportion of impervious surfaces.
The settlement of Vinča, located in the immediate vicinity of Belgrade, was chosen as a representative rural environment for this experimental research. The local meteorological station, installed within the Vinča Institute of Nuclear Sciences, measures physical parameters that are used to calculate the UHII. The physical parameters measured at the local meteorological station are: ambient air temperature, relative humidity, air velocity intensity and air flow direction, solar radiation, and diffuse radiation.
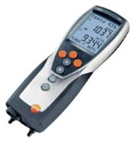
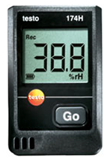
The location of the city center of Belgrade was chosen as a representative urban environment in this research. The measurement was carried out in the period from 2 March 2015 until 24 September 2015. Experimental measurements at this location can be divided into measurements taken over a longer period of time and daily or instantaneous measurements. All measuring instruments are calibrated in accredited laboratories of the Vinča Institute of Nuclear Sciences. Measurements of external temperature and relative humidity were carried out using a Testo 174H logger (Testo, Inc. 40 White Lake Rd. Sparta, NJ 07871, USA) throughout the entire research period. The intensity of direct solar radiation is measured with an instrument called a pyrheliometer, while the intensity of diffuse, global and reflected radiation is measured with a pyranometer. The instruments used for experimental measurements operate on the principle of thermocouples.
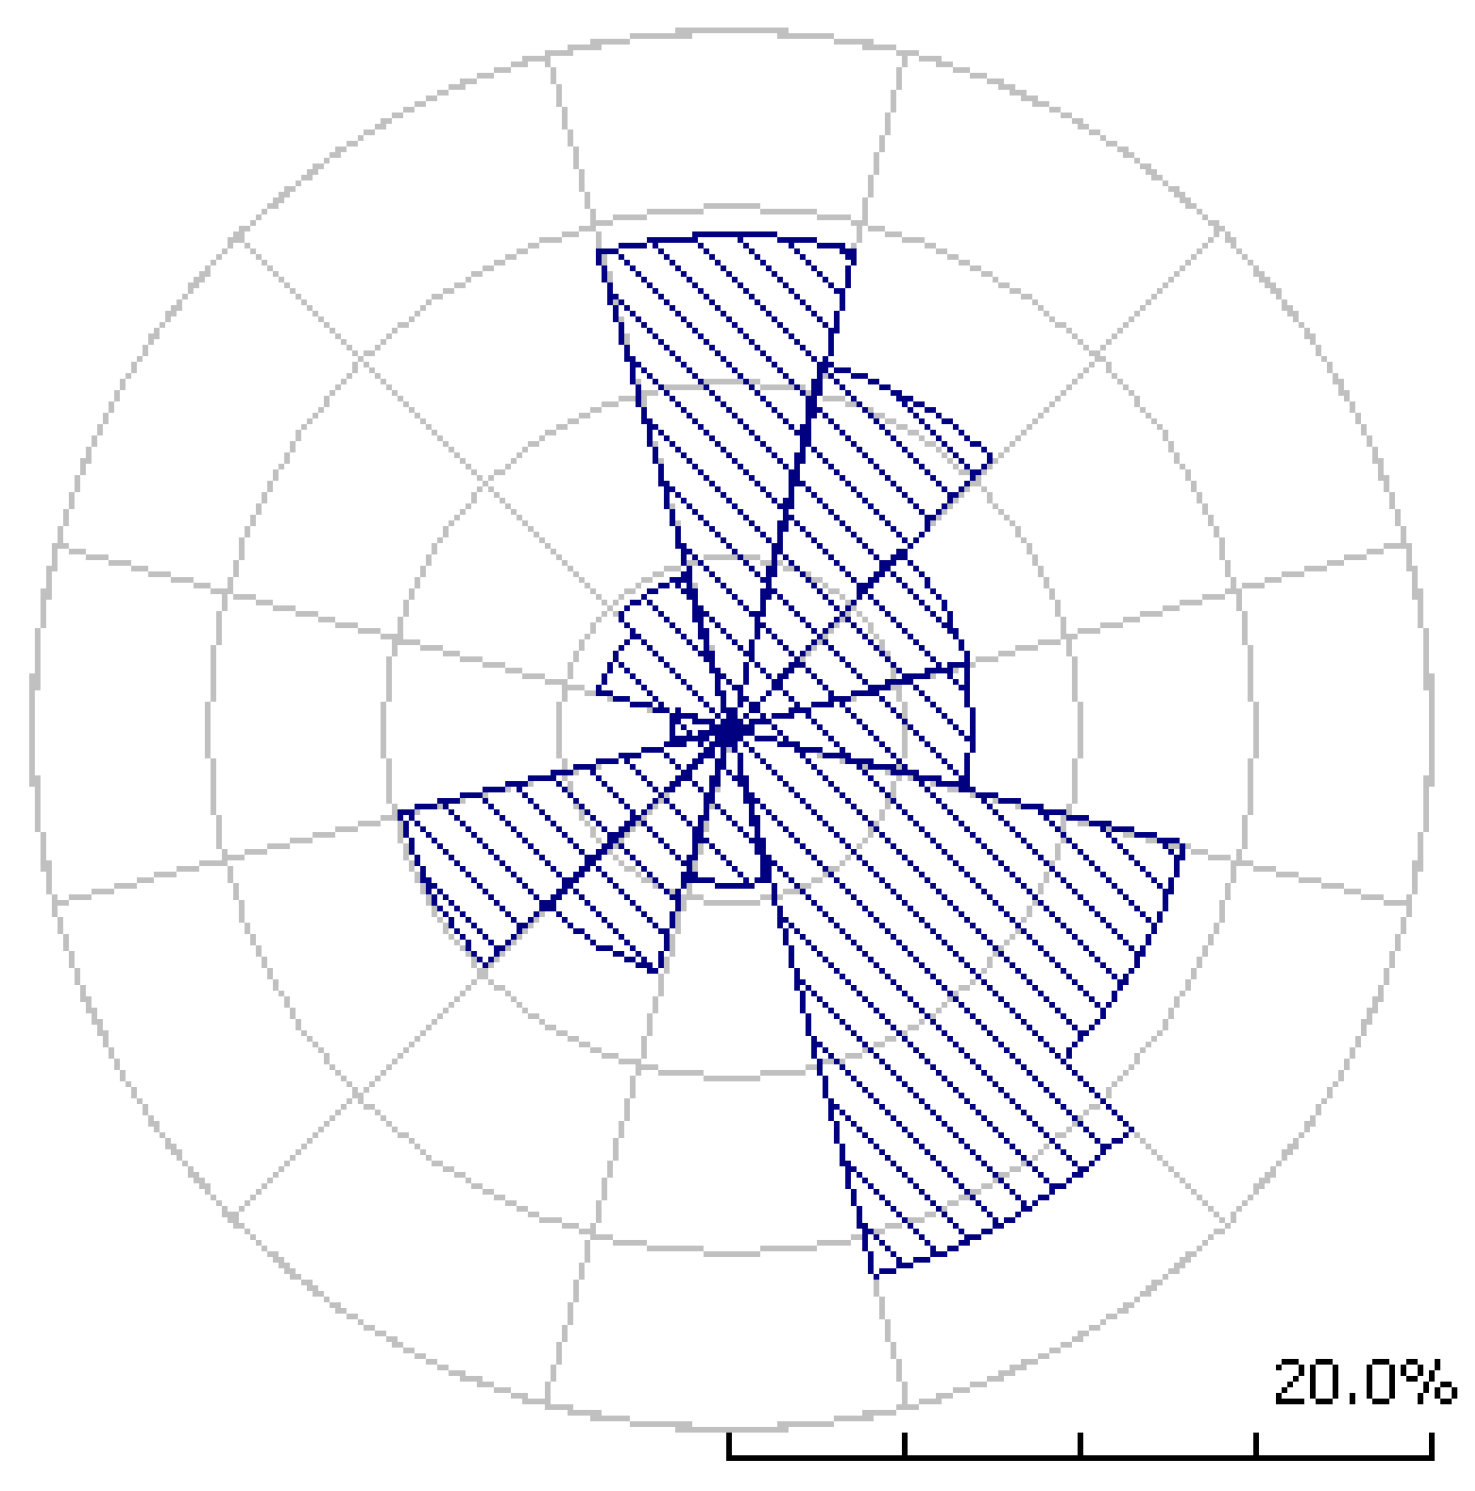
Based on the measured data, a wind rose was obtained for a given object (
Figure 1), as well as a Weibull distribution of wind gust intensity for the meteorological station in urban location:
Traffic flow measurements were conducted at the seven busiest intersections located within a 500 m radius of the installed meteorological station in the city center. Vehicles were counted using manual monitoring in the period from 6:00 h to 19:00 h for three intersections and in the period from 6:00 h to 22:00 h for four intersections. Each registered vehicle is classified into one of seven categories: bicycle, motorcycle, passenger car, van, bus, light commercial vehicle, and heavy commercial vehicle.
The analysis of the measured data on vehicle flow was performed using the COPERT software tool (COPERT 4 version 11.2) (Computer Program to Calculate Emissions from Road Transport). The software was created with the aim of assessing the emissions of the most significant harmful substances and certain heavy metals emitted by different categories of vehicles (passenger cars, light and heavy goods vehicles, mopeds and motorcycles). For the calculation of exhaust emissions, in addition to the vehicle category obtained through manual monitoring, the input data used were the division of vehicles by type of fuel used, which was obtained based on statistical data and the database owned by the software itself for each country, the average speed of the vehicle and the distance traveled. The length of the path traveled by the vehicle is only observed for the physical model that was created. COPERT calculates emissions based on emission factors for each individual harmful substance. Based on the input data, CO2, VOC, NOx, CO and PM pollution are obtained at street level and intersection level. The results of the amount of street pollution from traffic intensity obtained by simulations using the COPERT Street Level software are shown in
Appendix A,
Table A1.
The determination of radiant temperature was performed by measuring the temperature of a black globe. This theory was explained in detail by L.A. Kuehn et al. in [
32]. The temperature measured with a black globe is the result of heat gained and lost through radiation and convection [
33]. The temperature of the black globe is a weighted average of the mean radiant temperature and the ambient (air) temperature. During the summer period, when the highest ambient temperature values are expected at a representative urban location, measurements of the parameters required for calculating the radiation temperature were performed.
Based on a detailed analysis of the intensity of total solar radiation measured in rural and urban areas using installed local meteorological stations, a high correlation was observed for the summer months of measurement. From the above, it can be concluded that the heat gains from solar radiation for rural and urban areas are of approximate intensity. This conclusion indicates that the UHII for the measurement period depends only on the structure of the city.
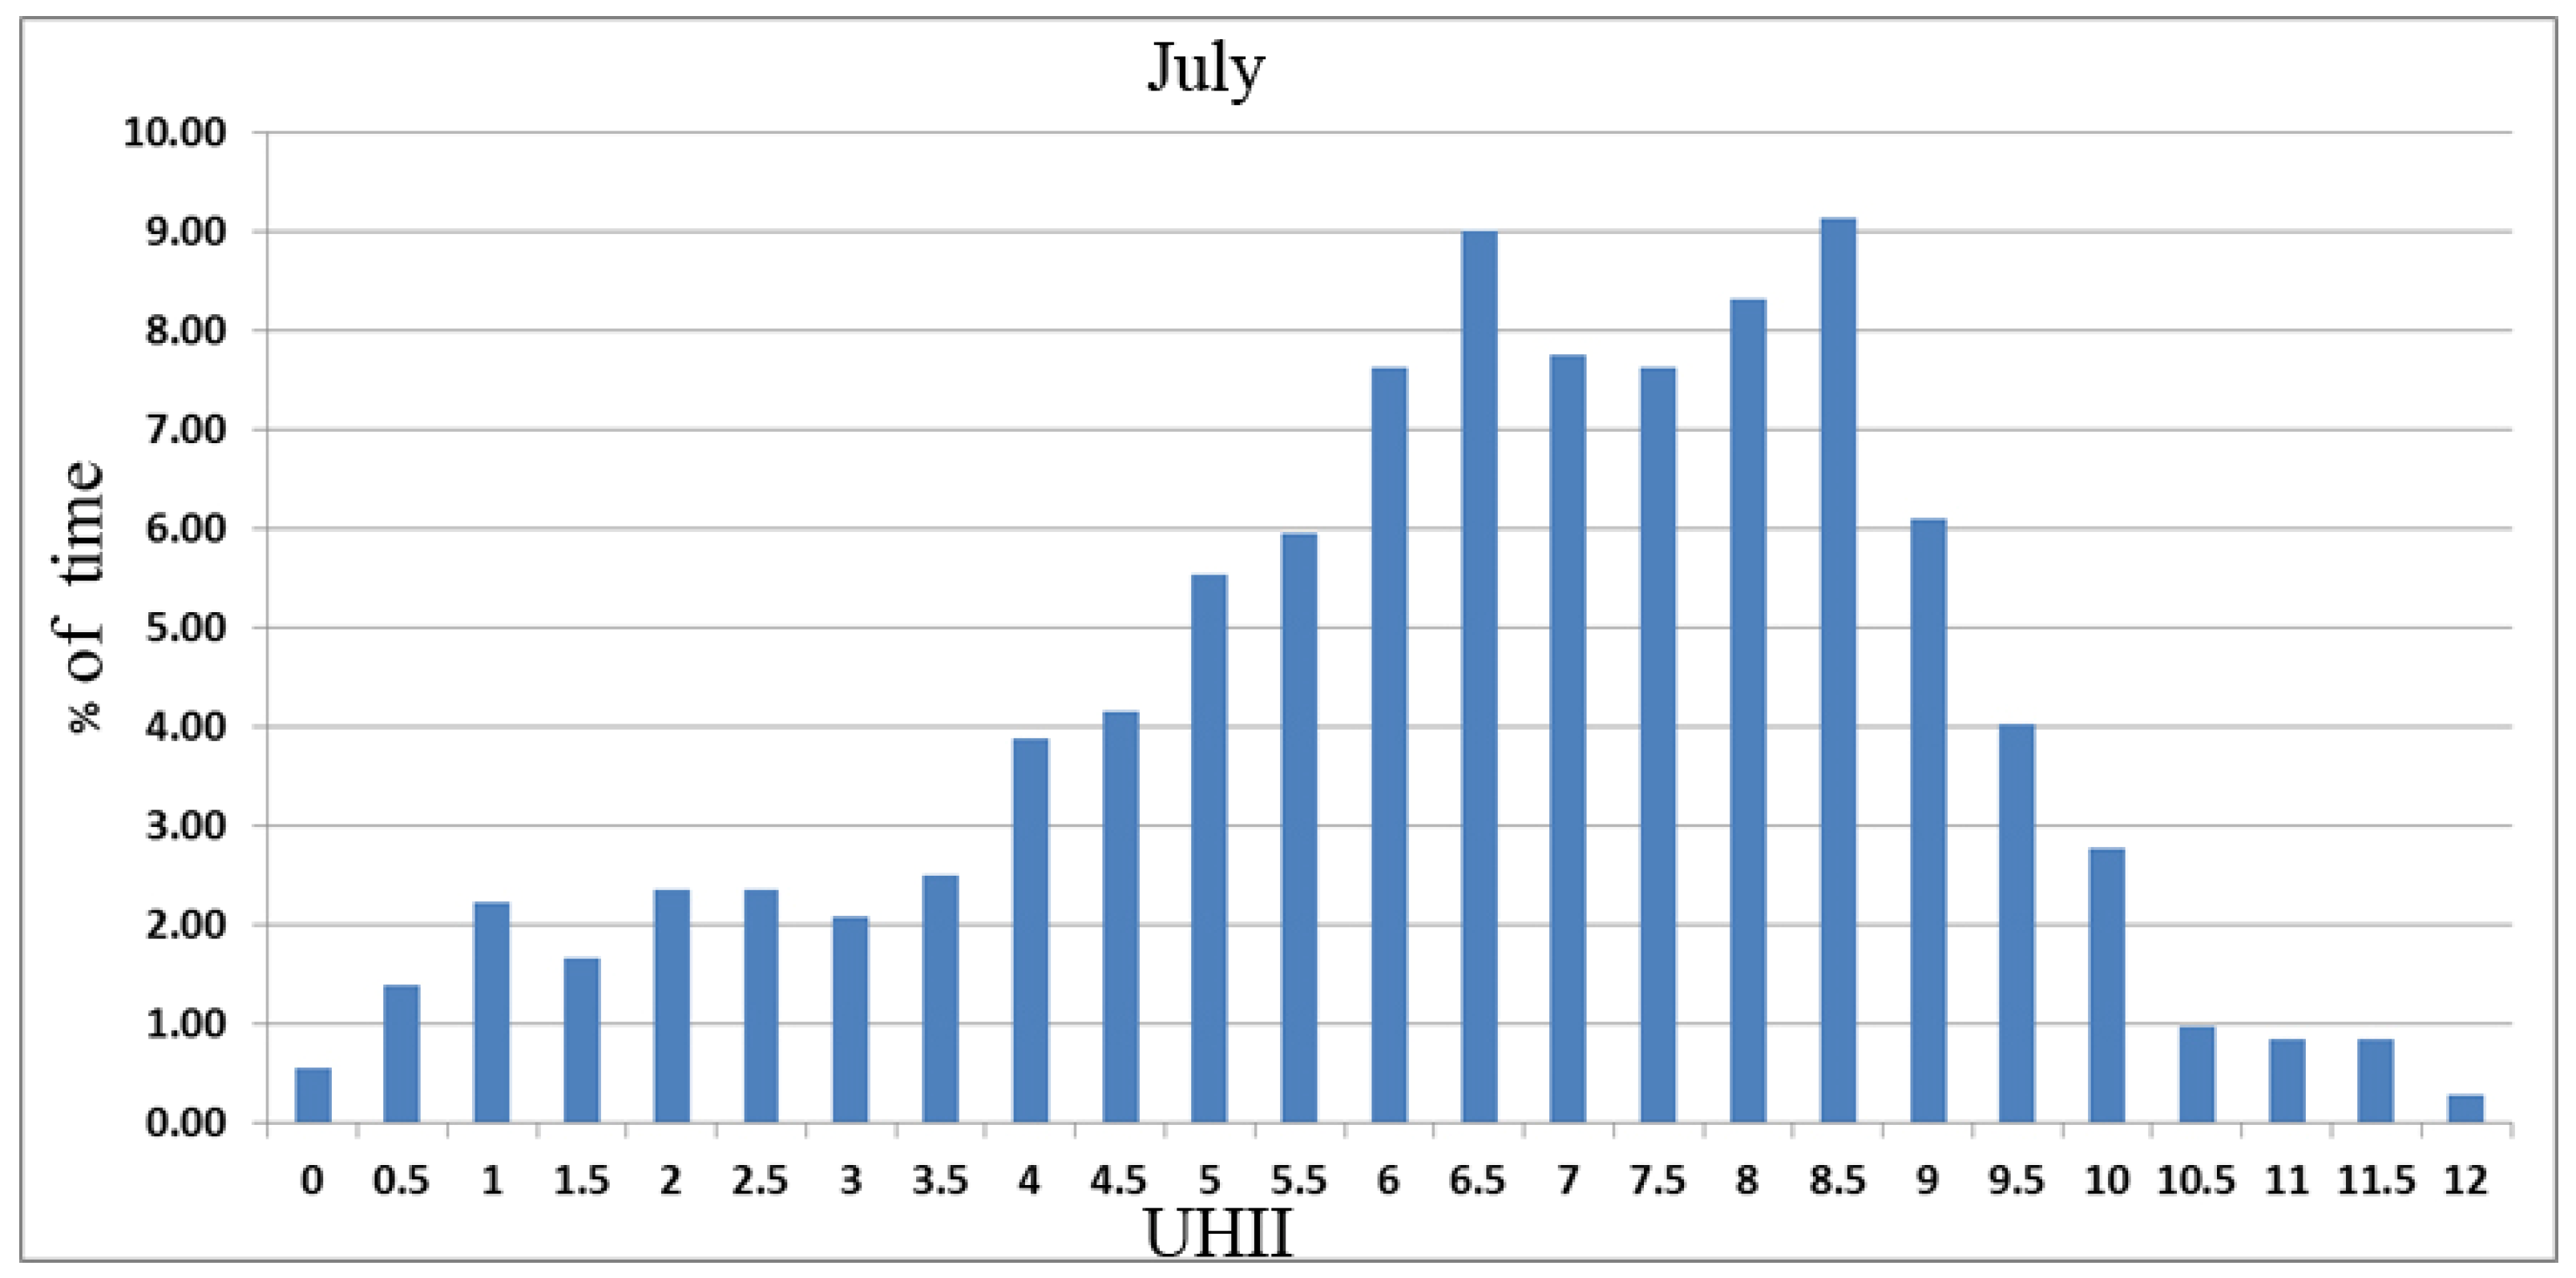
Figure 2 shows the frequency of UHII values for the month of July, when the highest temperature value was measured of 46.1 °C at a representative urban location. The maximum value of the UHII in July ranged up to 12 °C, but the largest percentage, i.e., more than 65% of the time, the value of the UHII ranged in the interval 5–9 °C. Furthermore, higher values of UHII were observed during the night period.
At higher wind speeds, air mixing is more frequent and a decrease in ambient temperature is possible, and this also affects the lower value of the UHII. Measured wind speed data for urban and rural environments were used to analyze the impact of wind on the UHII. The obtained results show that the UHII decreases with increasing air flow, and that the measured wind speed is significantly higher in rural areas compared to urban areas. Regarding temperature, there is a greater correlation between the UHII and urban temperature, while this correlation with rural temperature is very small.
3. Mathematical–Numerical Model
This section represents the second phase of the methodology, the simulation phase. It introduces the mathematical–numerical model developed to simulate the dynamic behavior of temperature, velocity, and pollutant concentration fields in the urban environment. The experimental data obtained in the previous phase were used as input and boundary conditions, enabling validation of the model and ensuring consistency between measured and simulated results.
The paper presents a developed numerical–analytical model that predicts the dynamic behavior of the temperature, velocity and carbon dioxide concentration fields in urban environments. By analyzing the obtained experimental and numerical results, the dependence of the UHII on urban and meteorological parameters was established. The reliability of the numerical model for predicting the dynamic behavior of the temperature, velocity and carbon dioxide concentration fields in the urban environment was tested.
For the description of the current thermal processes for the observed case, assumptions are given on the basis of which the main transport equations used to describe the three-dimensional turbulent flow with heat transfer are defined. It is necessary to introduce basic assumptions for the class of flows modeled in this study:
- The flow is stationary, i.e., steady flow. This assumption is justified given that there are very small temporal changes in the physical parameters of the air state in the computational domain, during the time interval for which the calculation was performed. In mathematical terms, this assumption implies that all partial derivatives of physical parameters with respect to time are equal to zero.
- The flow is turbulent. As this class of flow is characterized by large local values of Reynolds number, a turbulent flow regime is present. In mathematical terms, this fact conditioned the modeling of turbulence; therefore, the standard two-equation k-ε (epsilon) turbulence model was adopted.
- In the observed problem, all three forms of heat transfer are present: conduction, convection, and radiation. When modeling the process of heat transfer by conduction and convection, both heat transfer mechanisms are calculated simultaneously, both through the base medium (air) and through the solid body. When modeling heat transfer by radiation, the basic medium (air) was treated as a non-transparent medium. Due to the introduction of the assumption of a non-transparent medium, it is necessary to define functional relations for determining the effective air emissivity coefficients and the radiation scattering coefficients in the air depending on the local concentration of carbon dioxide and water vapor in the air. In mathematical terms, when developing the radiation model, the concept of modeling heat transfer by radiation was adopted by applying the gradient approach model, which implies that the heat flux of heat transfer by radiation is defined in the form of a gradient (equivalent to the classical approach of the formulation of heat transfer by conduction).
- We consider air to be an ideal gas. This assumption ensures that the developed mathematical model has a unique solution (the number of relations equal to the number of independent variables).
The basic balance equations are used, i.e., when modeling turbulent fluid flow with heat transfer, the fluid flow is described with two scalar and one vector partial differential equation, which are formed on the basis of three basic conservation laws: conservation of mass or quantity (continuity equation), conservation of momentum (Navier–Stokes vector equation for viscous fluid), and the First Law of Thermodynamics (energy conservation). The CO
2 concentration maintenance equation was also used:
where
CCO2 is the averaged
CO2 concentration in the air,
Uj is the component of the averaged fluid velocity in direction
j,
DCO2,air is the mass diffusion coefficient of
CO2 in the air, and
SCO2 is the source term for
CO2.
To model the kinematic turbulent viscosity
νt a standard two-equation k-ε model was used. The two-equation k–ε model belongs to the group of Reynolds-averaged Navier–Stokes equations—RANS models [
34]. RANS equations describe the behavior of averaged (mean) flow quantities, while the effects of turbulence (Reynolds stress tensor and turbulent heat flux vector) are modeled using turbulent kinematic viscosity (an eddy viscosity assumption). This significantly reduces the required calculation time and the required level of computing resources, making the two-equation k–ε model applicable to a wide range of engineering problems [
35].
In the standard k–ε model, the unknown quantity
νt is determined by applying the Boussinesq hypothesis on turbulent viscosity related to Reynolds stresses to the mean velocity gradients. This hypothesis assumes that the amount of motion caused by turbulent eddies can be modeled by introducing an additional quantity—turbulent viscosity. The above assumption was made based on an analogy with the way in which the amount of motion caused by the molecular motion of gas particles is described by molecular viscosity. Through the rate of dissipation of turbulent kinetic energy, the characteristic length scale
l and the characteristic time scale
τ of turbulence can be expressed, so that the turbulent kinematic viscosity
νt is obtained using the following expression:
where
Cμ is the empirical constant of the turbulent model,
Cμ = 0.09.
Partial differential equations for the kinetic energy of turbulence
k and the rate of dissipation of kinetic energy of turbulence
ε are obtained by a semi-empirical modeling technique [
36]. The values of the coefficients appearing in these differential equations were determined experimentally [
37].
For the radiation heat transfer model in this study, a gradient model was adopted. The main drawback of the above model is the necessity of calculating the effective radiation coefficient, but in a mathematical and numerical sense it is the most suitable for treating the phenomenon of heat transfer by radiation in a space with solid bodies such as residential buildings, public buildings, etc. A new physical quantity was introduced—radiant temperature, which is a consequence only of radiation effects. The radiation conduction coefficient is determined as a function of: the radiant temperature, the emissivity coefficient
ε’, the scattering coefficient
s’ per unit length, and the distance between two adjacent surfaces (walls) of a solid body
XGAP, using the following expression:
By introducing the assumption that, based on dimensional uniqueness, the terms along 4
σTa3 can be summed, the final form of the expression for the reciprocal of the effective thermal conductivity for a gray medium is obtained.
In order to fully define the radiative heat transfer model, it is necessary to determine the values of the atmospheric emissivity coefficient and the scattering coefficient per unit length. The process of determining the effective atmospheric emissivity coefficient and scattering coefficient is very complex given the fact that their values are influenced by a number of different atmospheric parameters:
ε(u(P⁄P0)n),
P0,
T. In the previous expression,
u is the optical thickness which is a function of the pressure value
P, the atmospheric pressure value
P0, and the average air temperature
T. The value of the exponent
n ranges from a minimum of approximately 0.7 m
−1 for the case of low atmospheric optical thickness to approximately 1.0 m
−1 for cases of high atmospheric optical thickness. For the purposes of determining the atmospheric emissivity coefficient, the following expression was adopted in this study [
36]:
Considering the atmospheric conditions during the measurement campaign (clear weather without clouds), constant values of relative air humidity and ozone concentration were adopted, while the concentration of carbon dioxide is directly related to the traffic intensity in the observed domain (part of the city). Based on the above, it is assumed that the first three terms in Equation (5) are constant and that the effective atmospheric emissivity coefficient and the scattering coefficient are defined by a function whose value depends only on the local carbon dioxide concentration [
36].
To fully define the mathematical model, it is necessary to select the type and value of boundary conditions for each of the calculation quantities, i.e., for each transport equation of the model. The input data of atmospheric parameters, used to define the boundary conditions, were taken from the meteorological station. The size of the computational domain was 1536 m × 1425 m × 200 m. The flow quantities at the entrance to the computational domain are defined to represent the real flow in the atmospheric boundary layer. The boundary condition for the velocity at the entrance to the computational domain is defined by a velocity value with a vertical logarithmic distribution. The average wind speed values were determined based on the results of wind speed measurements on a meteorological station installed on the building of the Higher Textile School for Design, Technology and Management located within the calculation domain.
The velocity boundary condition for all outputs of the computational domain is that the velocity gradient value is equal to zero in the direction normal to the plane of the boundary surface. Analogously, as boundary conditions for turbulent kinetic energy and its dissipation at the output boundaries of the computational domain, the conditions that their gradients are equal to zero are set. The mean value of the experimentally measured air temperature was used as the boundary condition for the temperature at the entrance to the computational domain. As a boundary condition at all outputs from the computational domain, the condition that the temperature gradient value is equal to zero in the direction normal to the surface was used. The mean value of the measured CO2 concentration was taken as the boundary condition for the CO2 concentration at the entrance to the computational domain. As a boundary condition at all outputs from the computational domain, the value of the CO2 concentration gradient was set to be zero in the direction normal to the surface. The values of the original SCO2 members for CO2 concentration were determined based on pollutant measurements (passenger and public vehicle transport) at various locations in the urban environment. The obtained current values at each measurement point are time-averaged and incorporated into the CO2 concentration maintenance equation.
3.1. Numerical Model
The numerical simulations were carried out using the commercial CFD software CHAM PHOENICS (version PHOENICS 2015-19), which is based on the Finite Volume Method (FVM). The flow was considered steady, justified by the short, 1 h intervals simulated, during which temporal changes in atmospheric parameters are minimal. Turbulence model: The standard two-equation k-ϵ (epsilon) model was used to represent the turbulent flow regime, which is suitable for atmospheric boundary layer simulations [
34,
35]. Discretization and convergence: All transport equations were solved using the Hybrid Difference Scheme (HDS). A comprehensive grid independence study was conducted, resulting in the selection of a final mesh consisting of 2,167,500 finite volumes, ensuring an optimal balance between accuracy (deviation less than 1%) and computational cost. The convergence criterion was satisfied when the normalized residuals for all transport equations (velocity components, pressure, temperature, k, and ϵ) fell below 1 × 10
−2.
3.2. Computational Domain and Boundary Conditions
The numerical simulations were conducted within a three-dimensional computational domain measuring 1536 m × 1425 m × 200 m (x × y × z). The domain size was selected to minimize the potential influence of boundary effects on the flow field and scalar transport, ensuring that the simulated region of interest remained unaffected by artificial numerical constraints imposed by the domain boundaries [
37].
Boundary Conditions
Inlet (Windward Boundary).
At the inlet, the incoming wind field was prescribed using a logarithmic vertical profile representative of the atmospheric boundary layer. Reference wind speed values were derived from measured hourly averages obtained during the field campaign. Scalar quantities such as temperature and CO2 concentration were imposed as uniform inlet profiles, reflecting the mean values recorded at the school in city meteorological station for the corresponding simulation hour.
Outlet and Lateral Boundaries.
To allow for undisturbed outflow, a zero-gradient condition (∂Φ/∂xi = 0) was applied for all transported variables (Φ). This approach permits the natural exit of momentum, heat, and mass fluxes from the domain while preventing non-physical backflow into the computational space.
Solid Boundaries (Building Surfaces and Ground).
All building façades and the ground surface were treated as no-slip walls (Ui = 0), ensuring realistic representation of shear stresses at solid–fluid interfaces. Surface thermal boundary conditions were defined by imposing measured surface temperatures corresponding to different times of day. Specifically, values were extracted from field observations, differentiating between morning, afternoon, and evening periods.
Heat Transfer and Radiative Processes.
The air was considered a non-transparent (gray) participating medium within the employed radiation model. A crucial aspect of the setup was the explicit coupling between the effective atmospheric emissivity coefficient (ϵ
a′) and the local CO
2 concentration. This formulation accounts for the role of traffic-induced CO
2 as an active agent in modifying radiative heat transfer, thereby directly influencing the urban surface energy balance and the near-surface thermal environment [
36].
Operational Scenarios
The simulations were designed to capture the diurnal variability of the urban microclimate under extreme thermal stress conditions. Accordingly, three distinct cases were defined, each corresponding to a characteristic time window during the representative hot day of 5 July 2015:
Case S1 (Morning): 08:00–09:00 h.
Case S2 (Afternoon): 14:00–15:00 h.
Case S3 (Evening): 18:00–19:00 h.
For each case, the boundary conditions were adapted based on field measurements, ensuring that the numerical results faithfully reproduced the prevailing meteorological and environmental conditions.
In this paper, the mathematical model is approximately solved using the finite volume method. Equations written in the form of the finite volume method are by definition conservation laws. The creation of the numerical network was achieved using the cut cell method (Cartesian grid method or embedded boundary method), which is available in the commercial software CHAM PHOENICS under the name Parabolic Hyperbolic Or Elliptic Numerical Integration Code Series [
38]. This option allows for very easy and efficient mesh (grid) creation for complex geometries. This software uses a line-by-line iteration method. The line-by-line iteration method consists of solving finite volume differential equations along a single line using the Thomas algorithm (tridiagonal matrix algorithm).
The development of numerical methods has led to the definition of various differential schemes. The presented numerical model uses linear difference schemes, known in the literature as the central difference scheme—CDS, upwind (upstream) difference scheme—UDS, and hybrid difference scheme—HDS. The value of the dependent variable in a given cell can be determined based on the downstream and one or two upstream values. The first interpolation approach is that the value of the dependent variable on the surface (side) is equal to the arithmetic mean value at neighboring nodes, which is the approach of the central differential scheme. This scheme is suitable for Peclet numbers with low values, but in regions with a high-value Peclet number, it gives unrealistic (unbounded) values. For these reasons, the UDS was developed. There it is assumed that the value of the dependent variable in the cell face is the same as the value at the cell’s upstream node.
This scheme is unconditionally bounded and very stable, but has a large numerical diffusivity when the flow is at an angle to the grid. For these reasons, HDS is most often used, taking the good properties of CDS and UDS, with respect to the value of the Peclet number in a given cell. The HDS is adopted for all simulations in this study. A variant of the HDS was used, which, at low-value Peclet numbers, operates in the mode of the CDS, while at high-value Peclet numbers it operates with the contribution of the UDS up to 75%. The exact contribution of the UDS depends on the local value of the Peclet number in each cell of the computational domain, but due to the stability of the solution in the iterative process, it does not exceed the above-mentioned value of 75%.
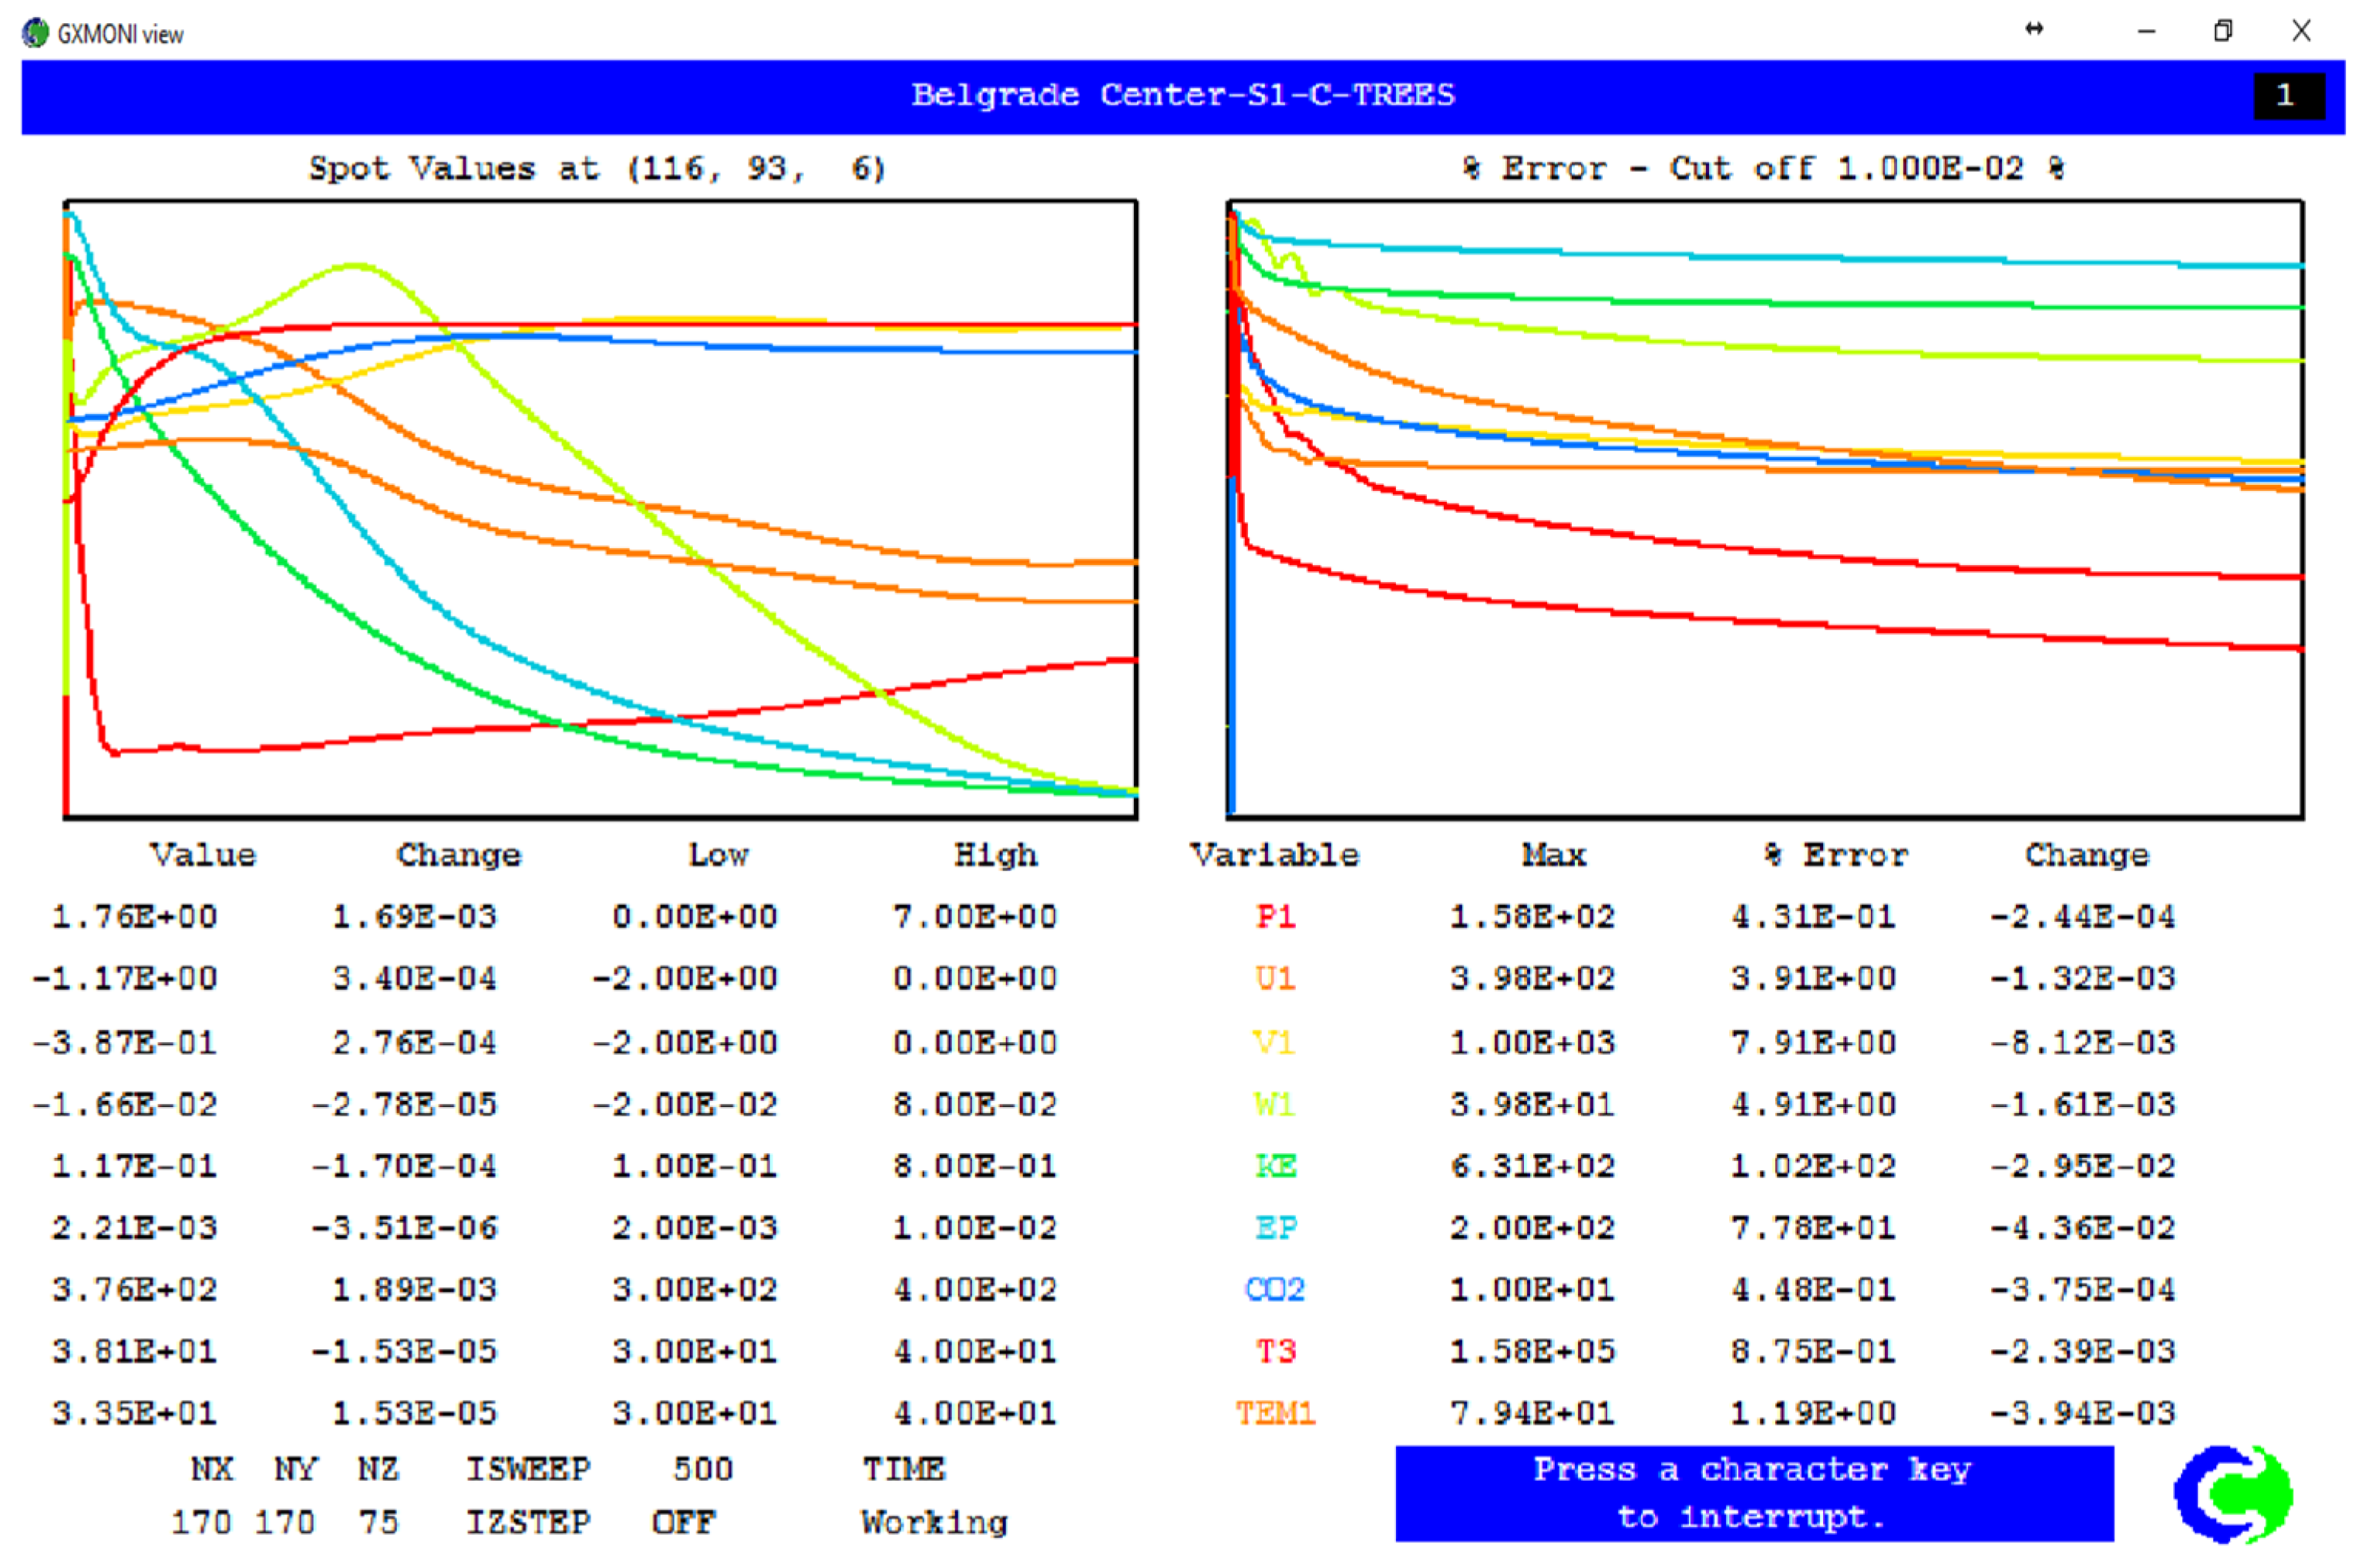
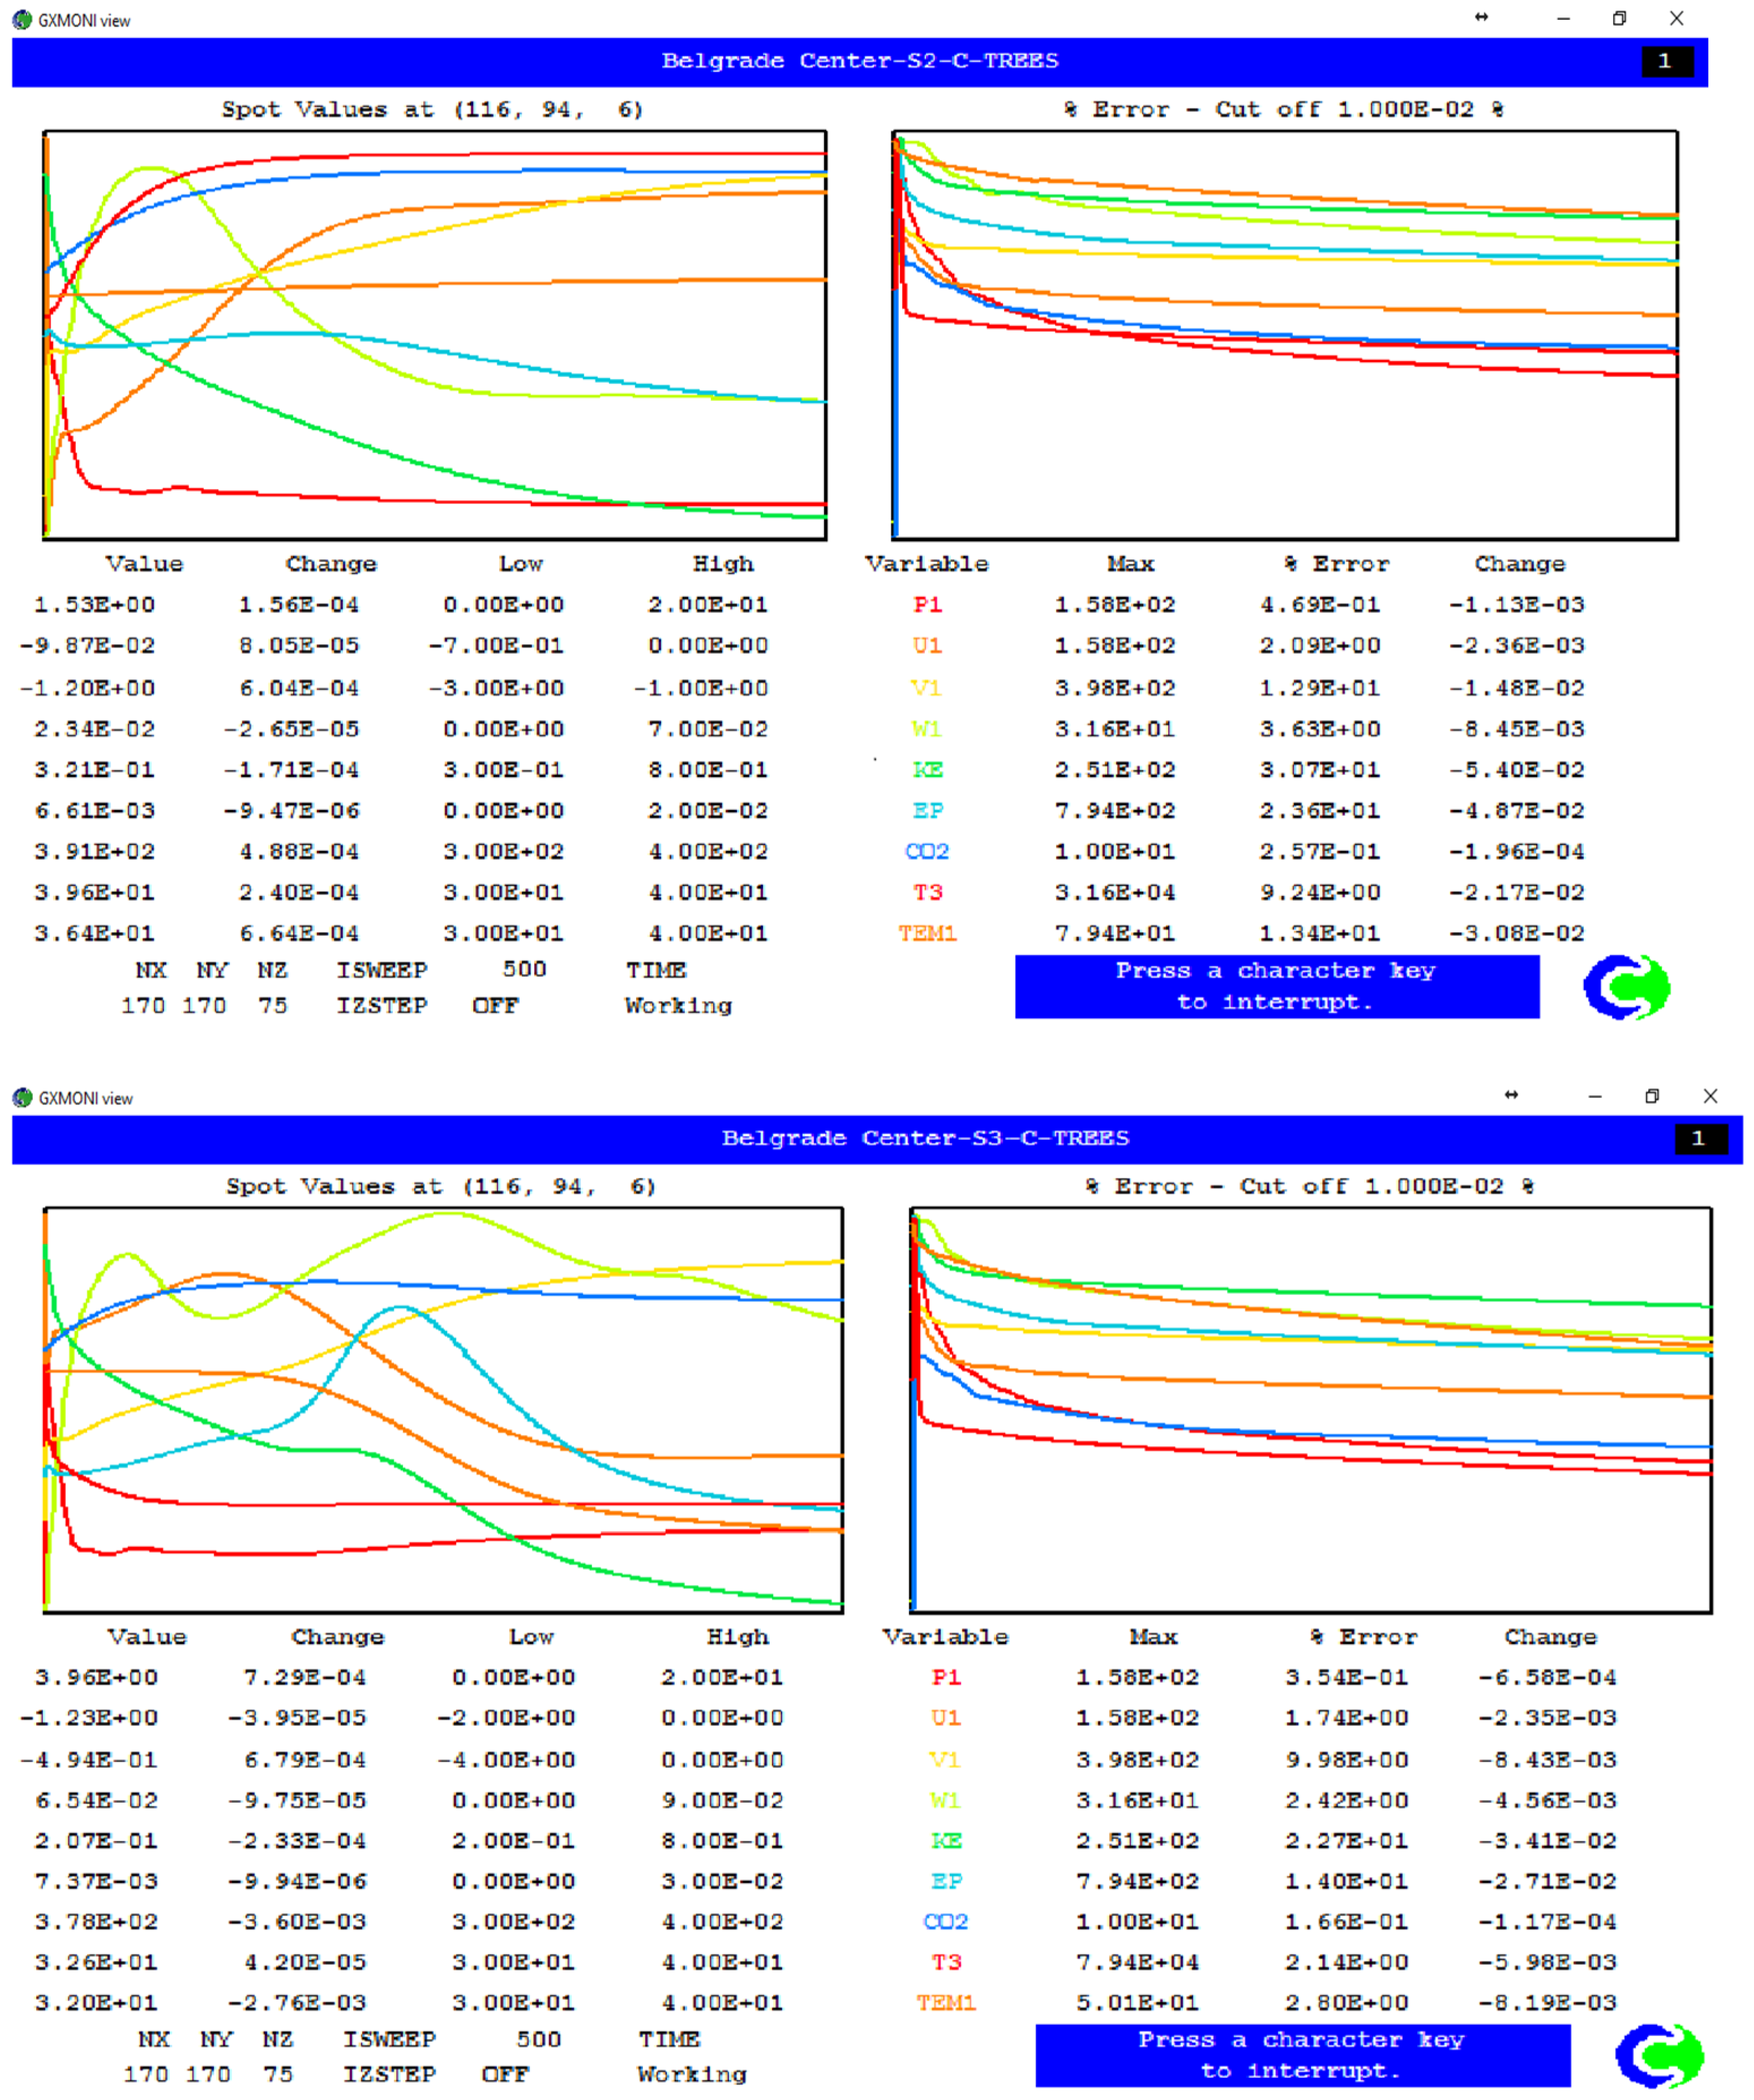
The convergence criterion was set so that the normalized residuals for all solved transport equations (velocity, pressure, temperature, k, ε, etc.) were below 1 × 10⁻². In addition to monitoring the residuals, the stabilization of key variable values at predefined control points was also tracked. All simulations were initially run for 500 iterations, which demonstrated a converged and stable solution, although computations were continued for several thousand iterations to ensure full convergence, as shown in the convergence plots. Spatial discretization was performed using HDS, and the system of equations was solved iteratively using a line-by-line procedure.
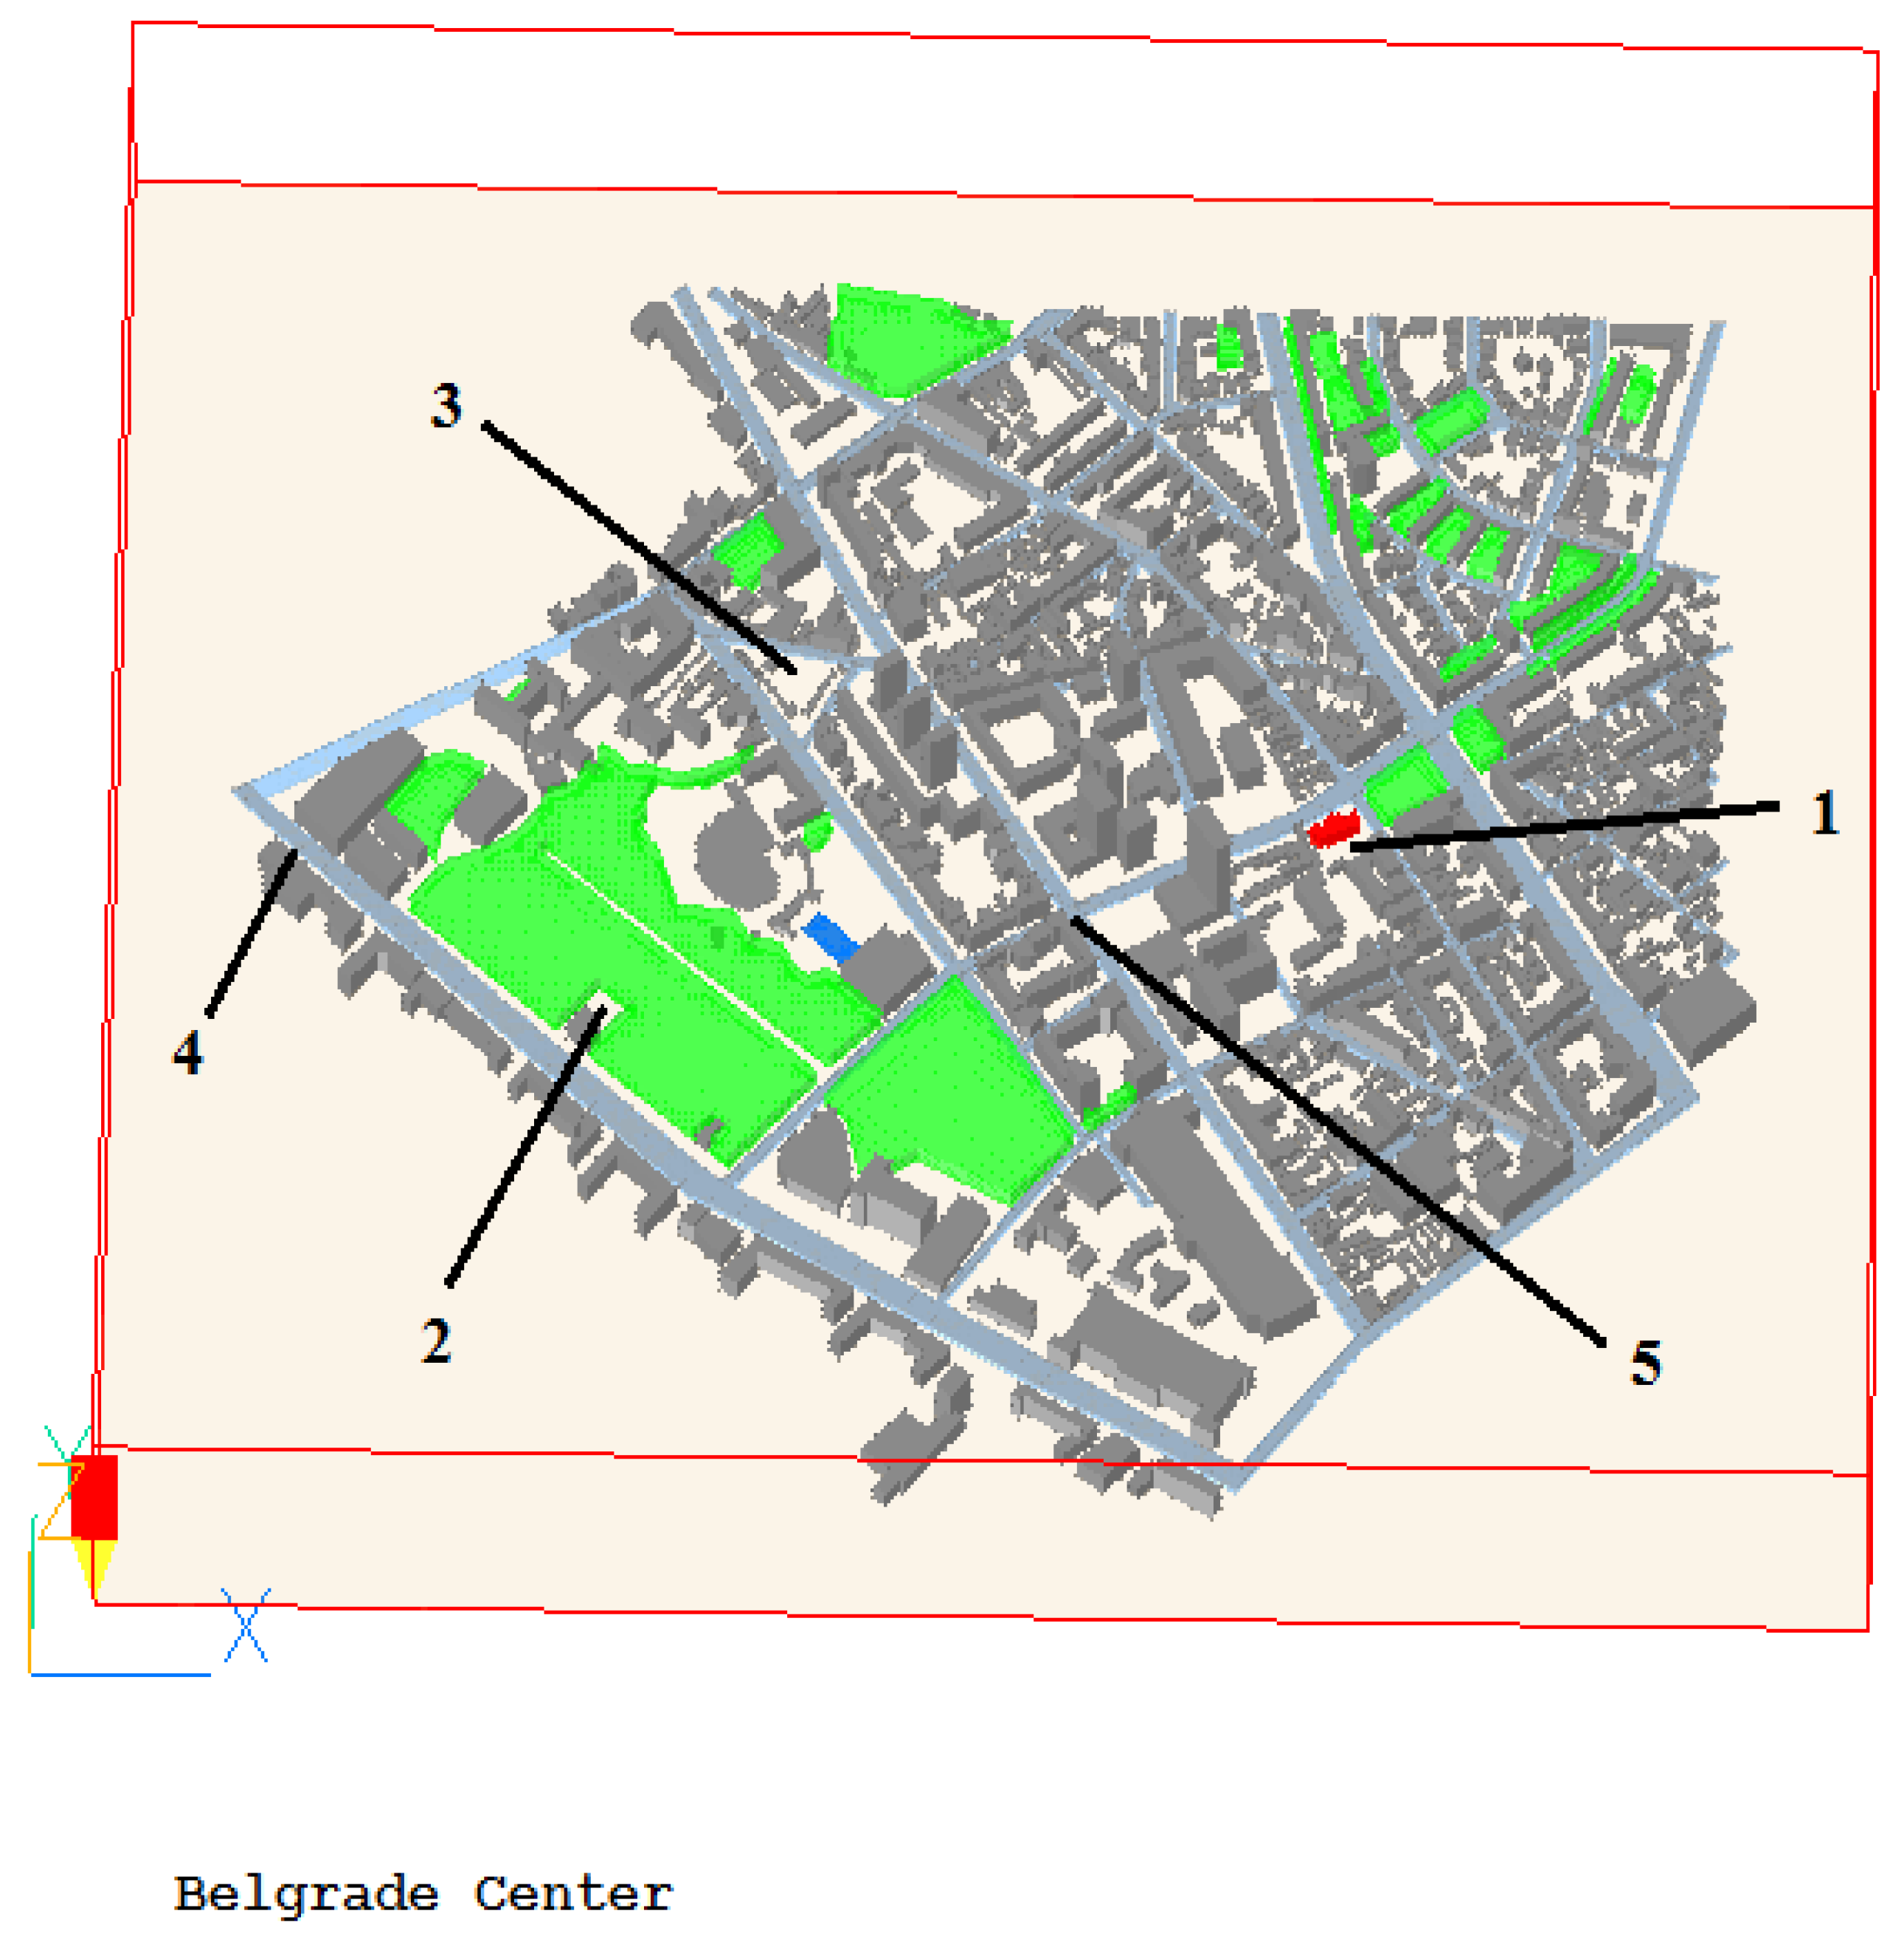
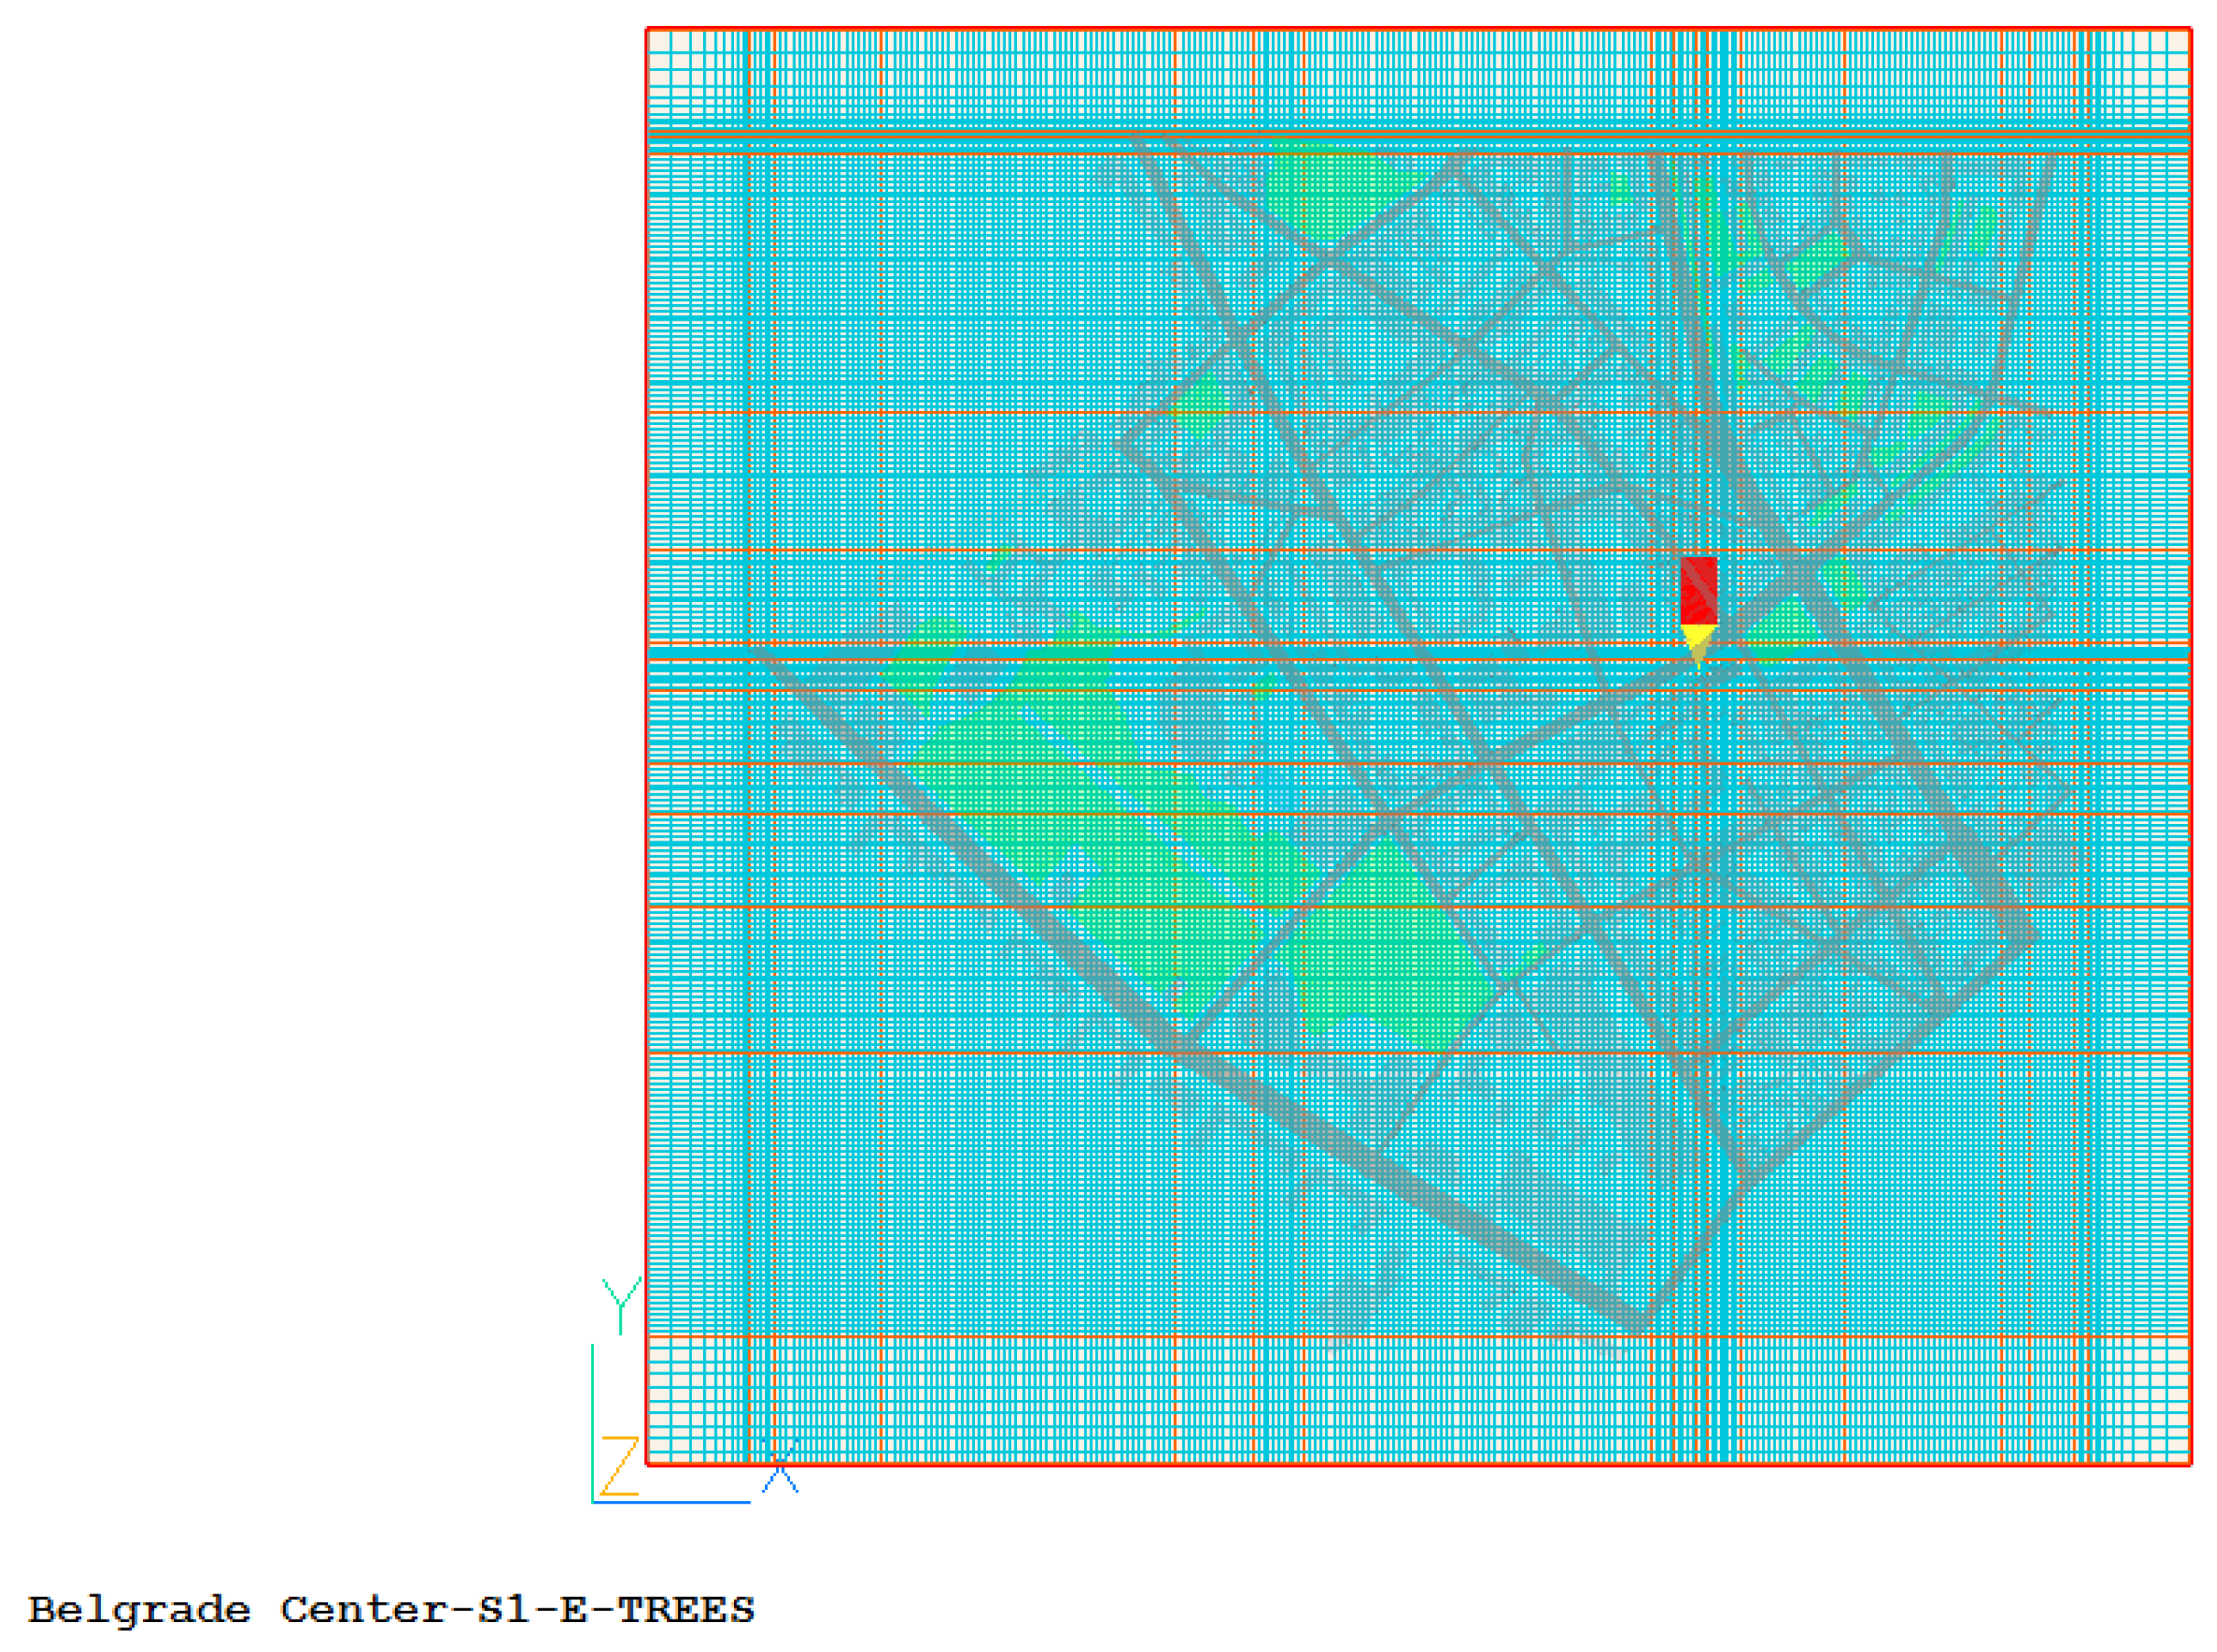
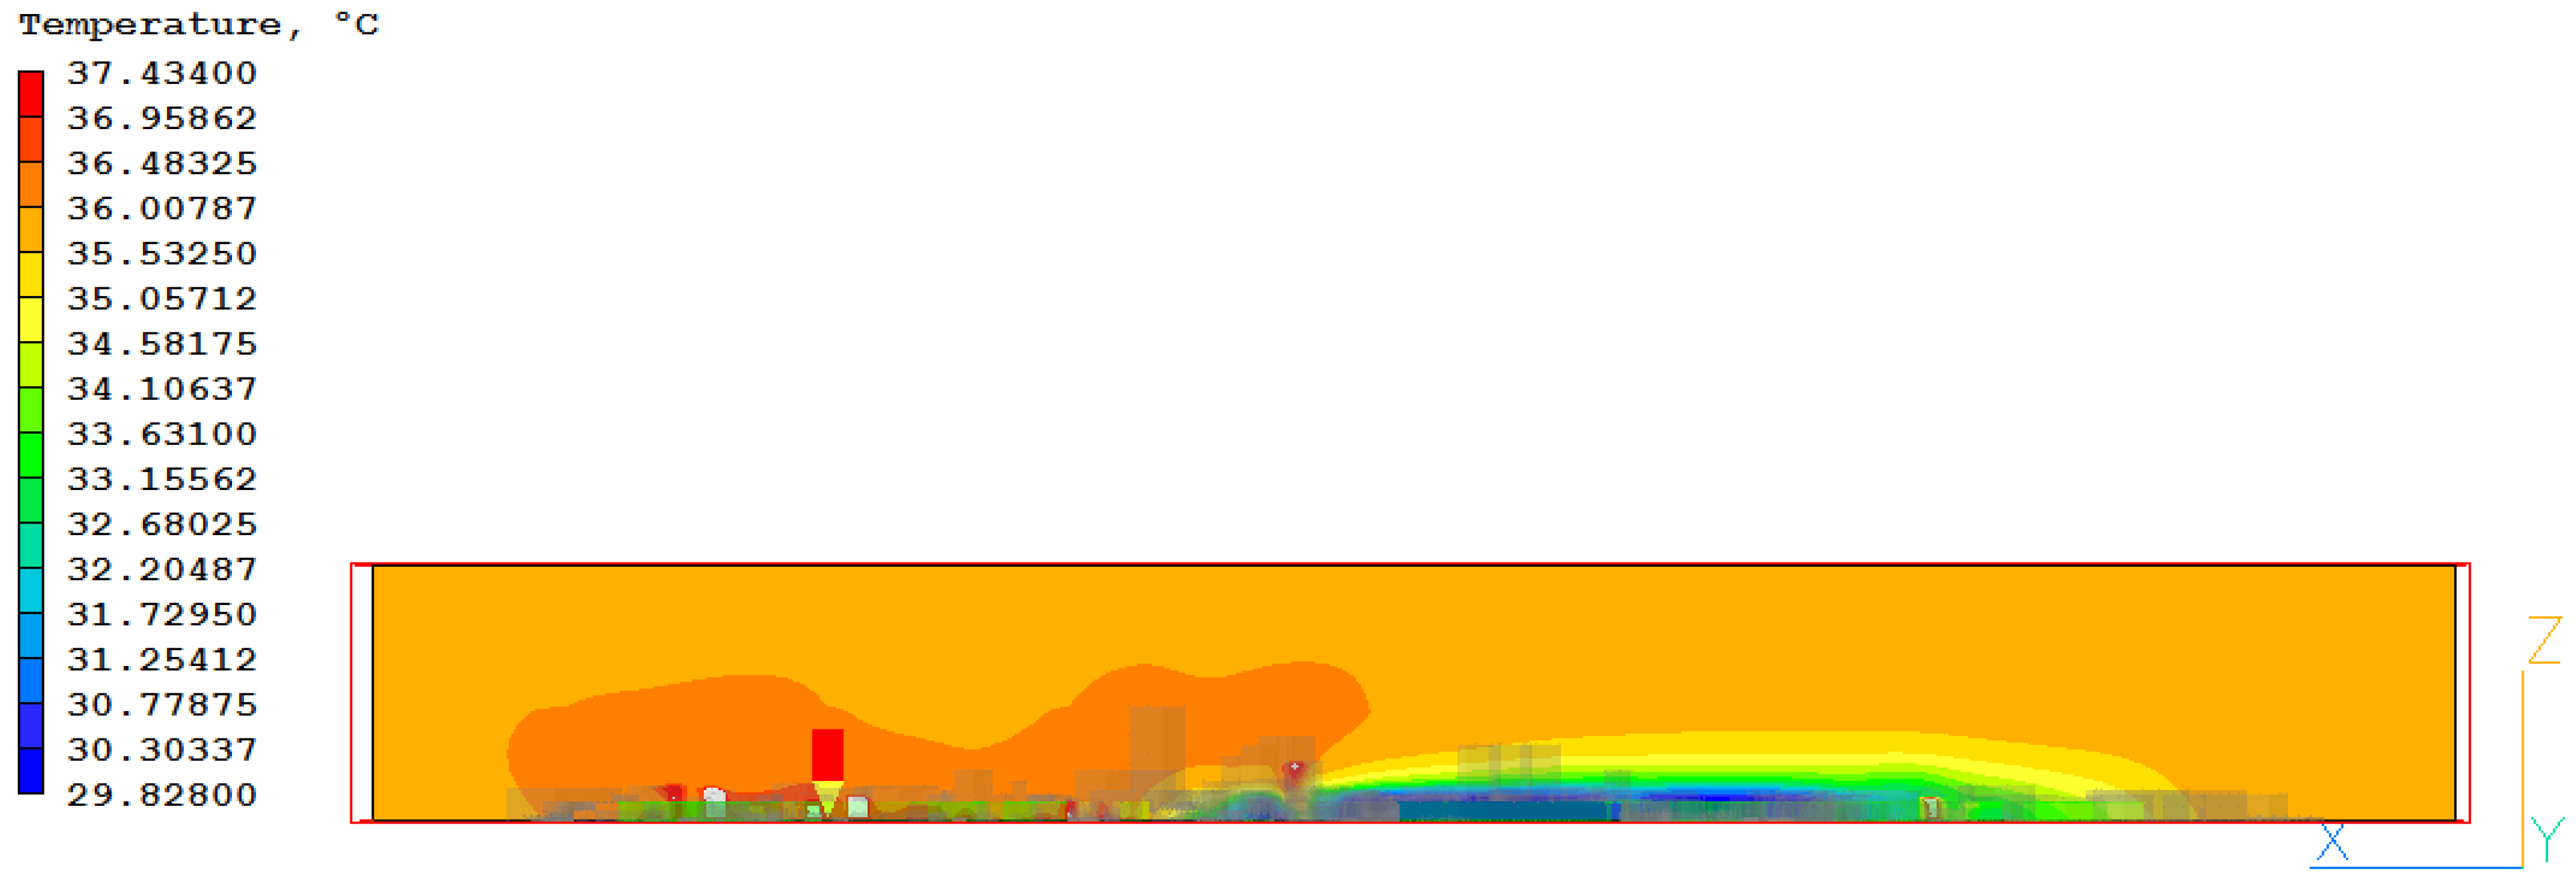
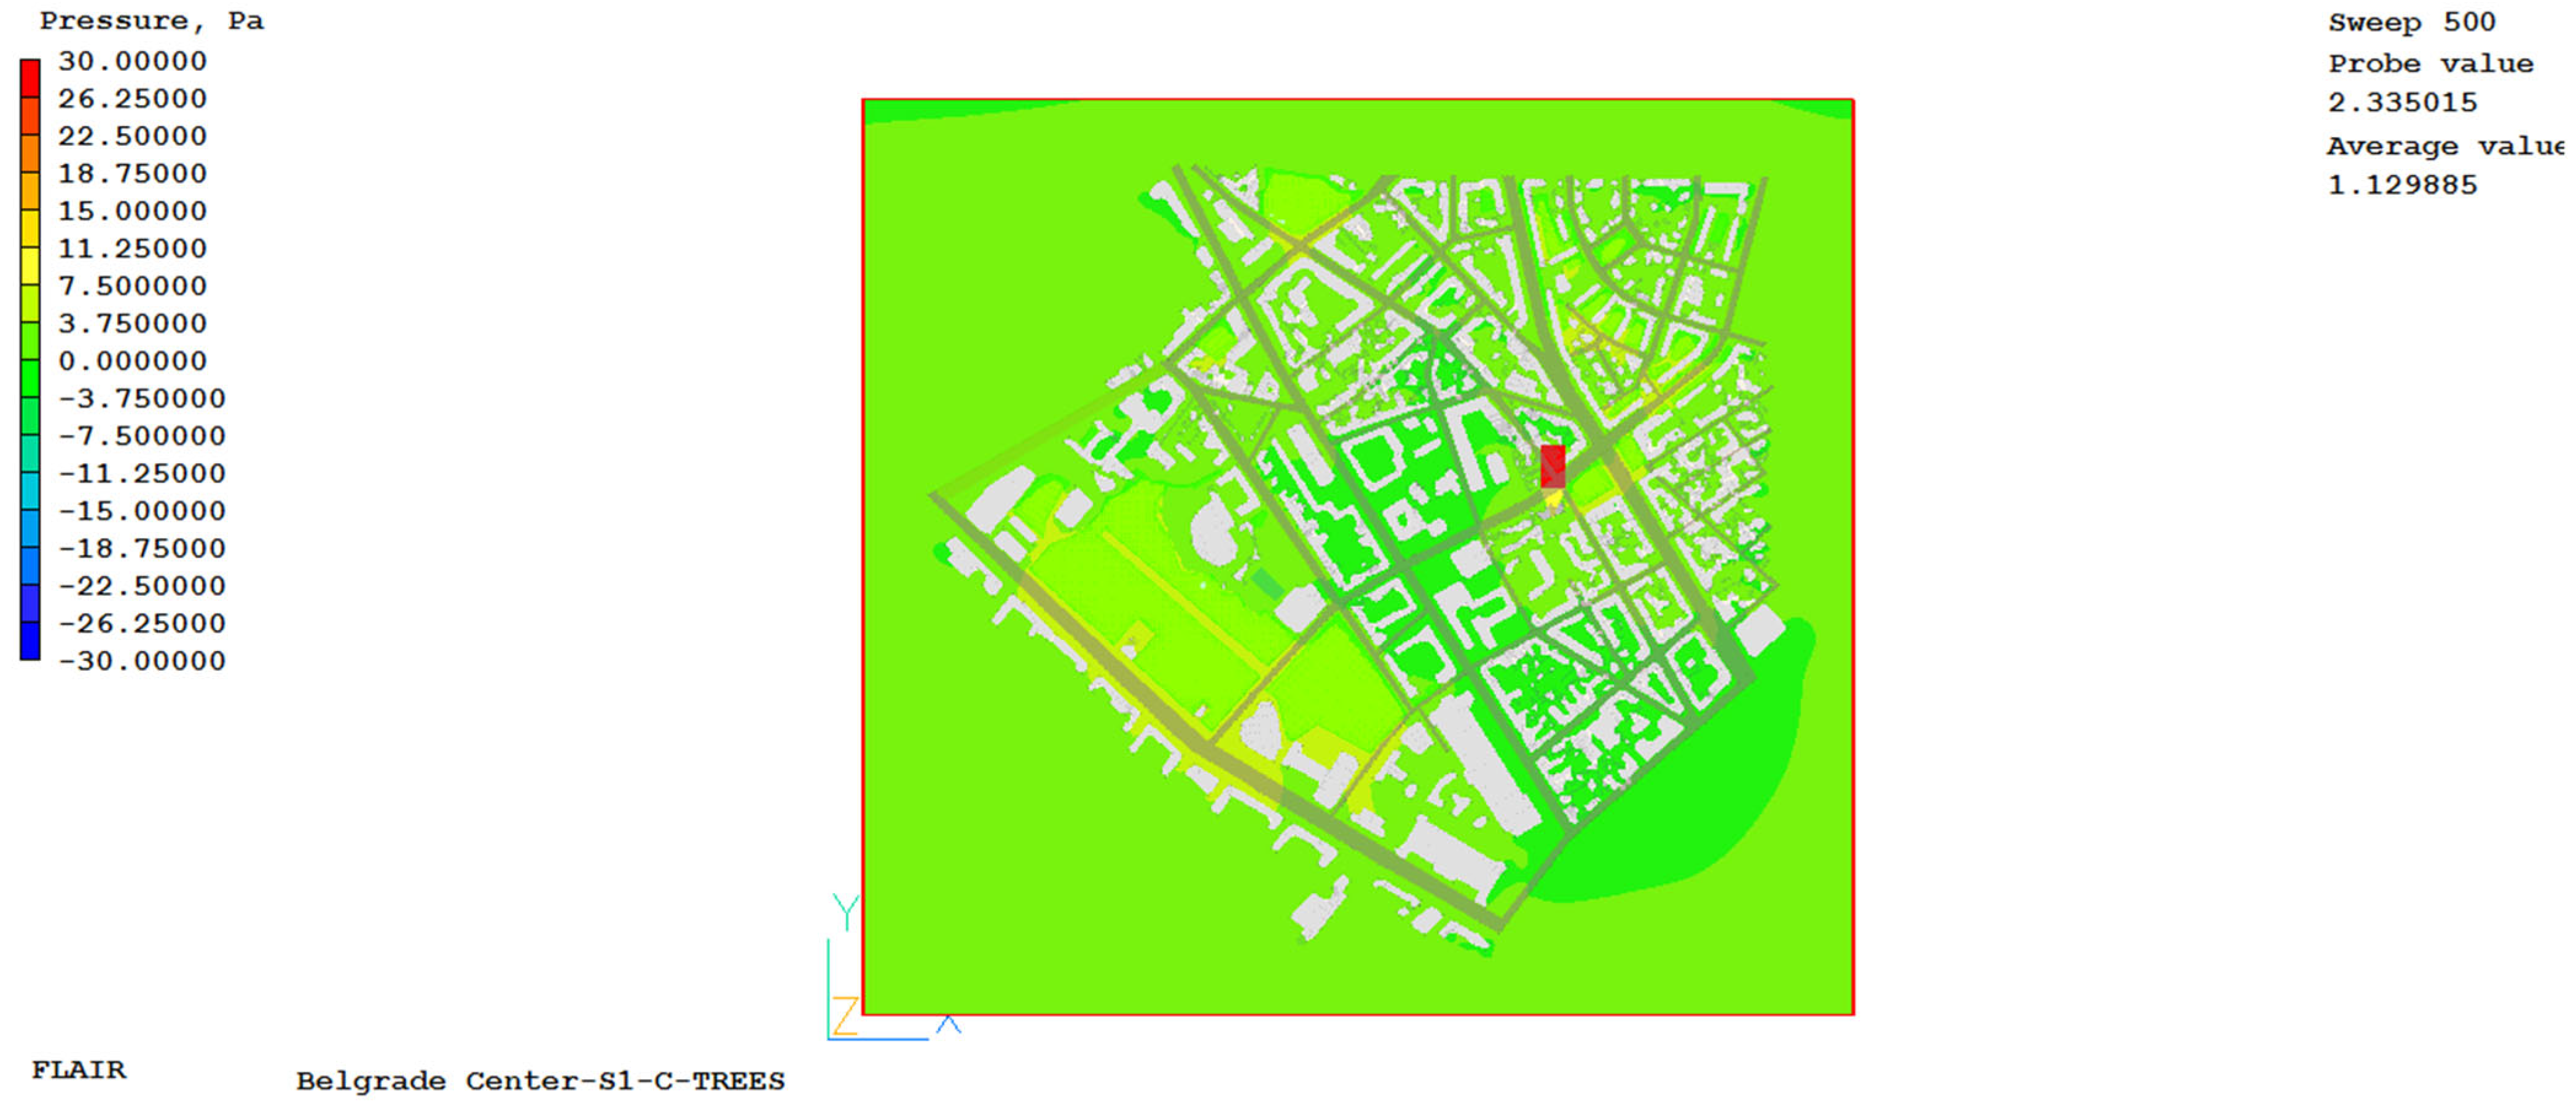
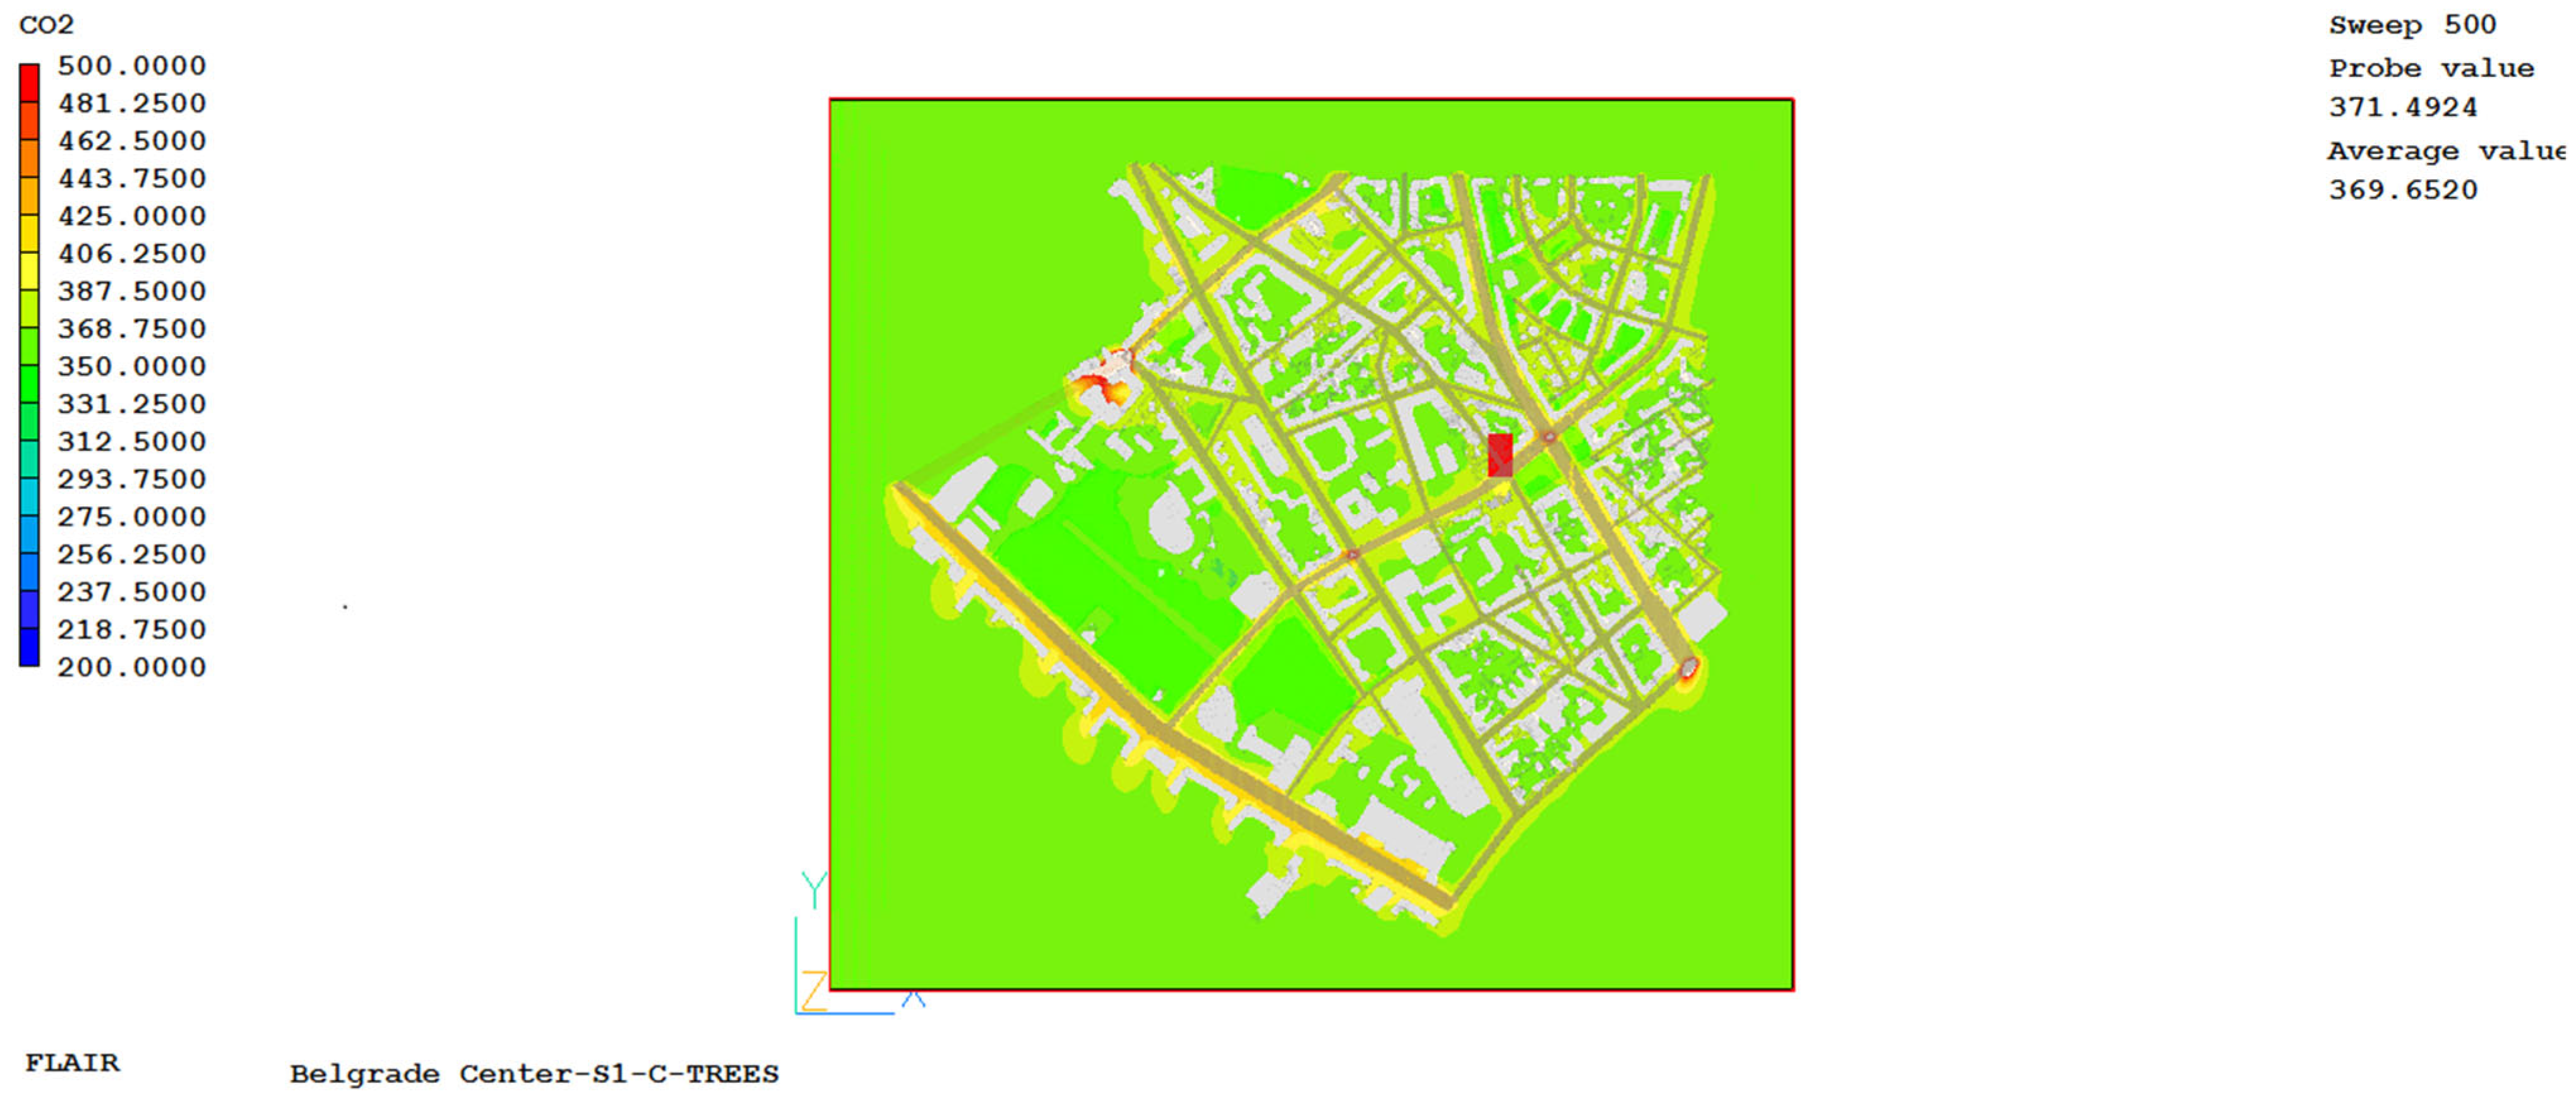
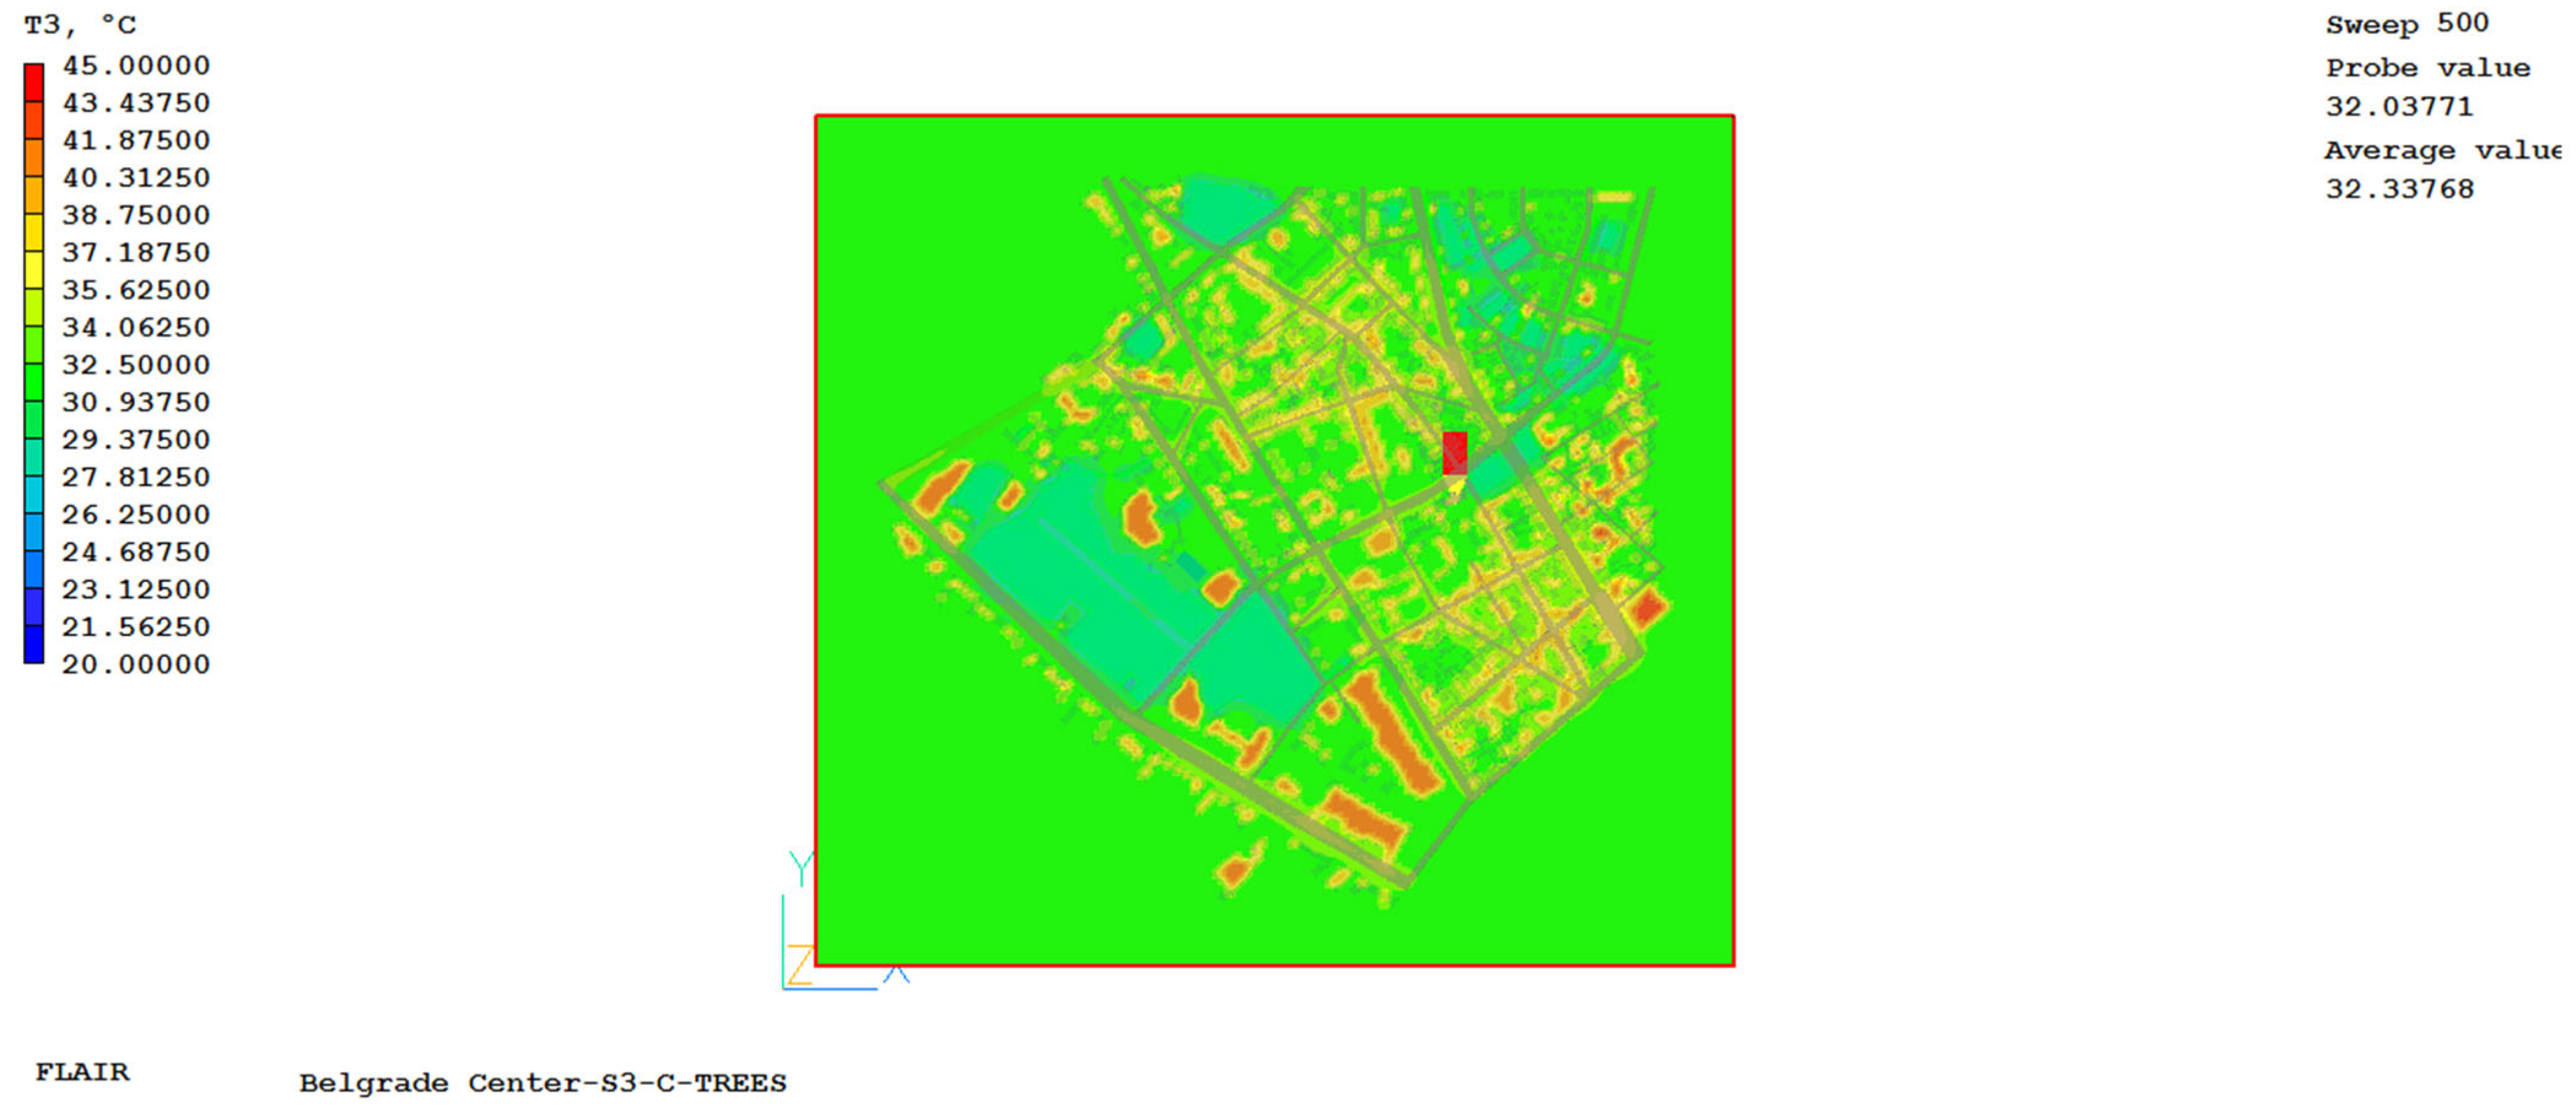
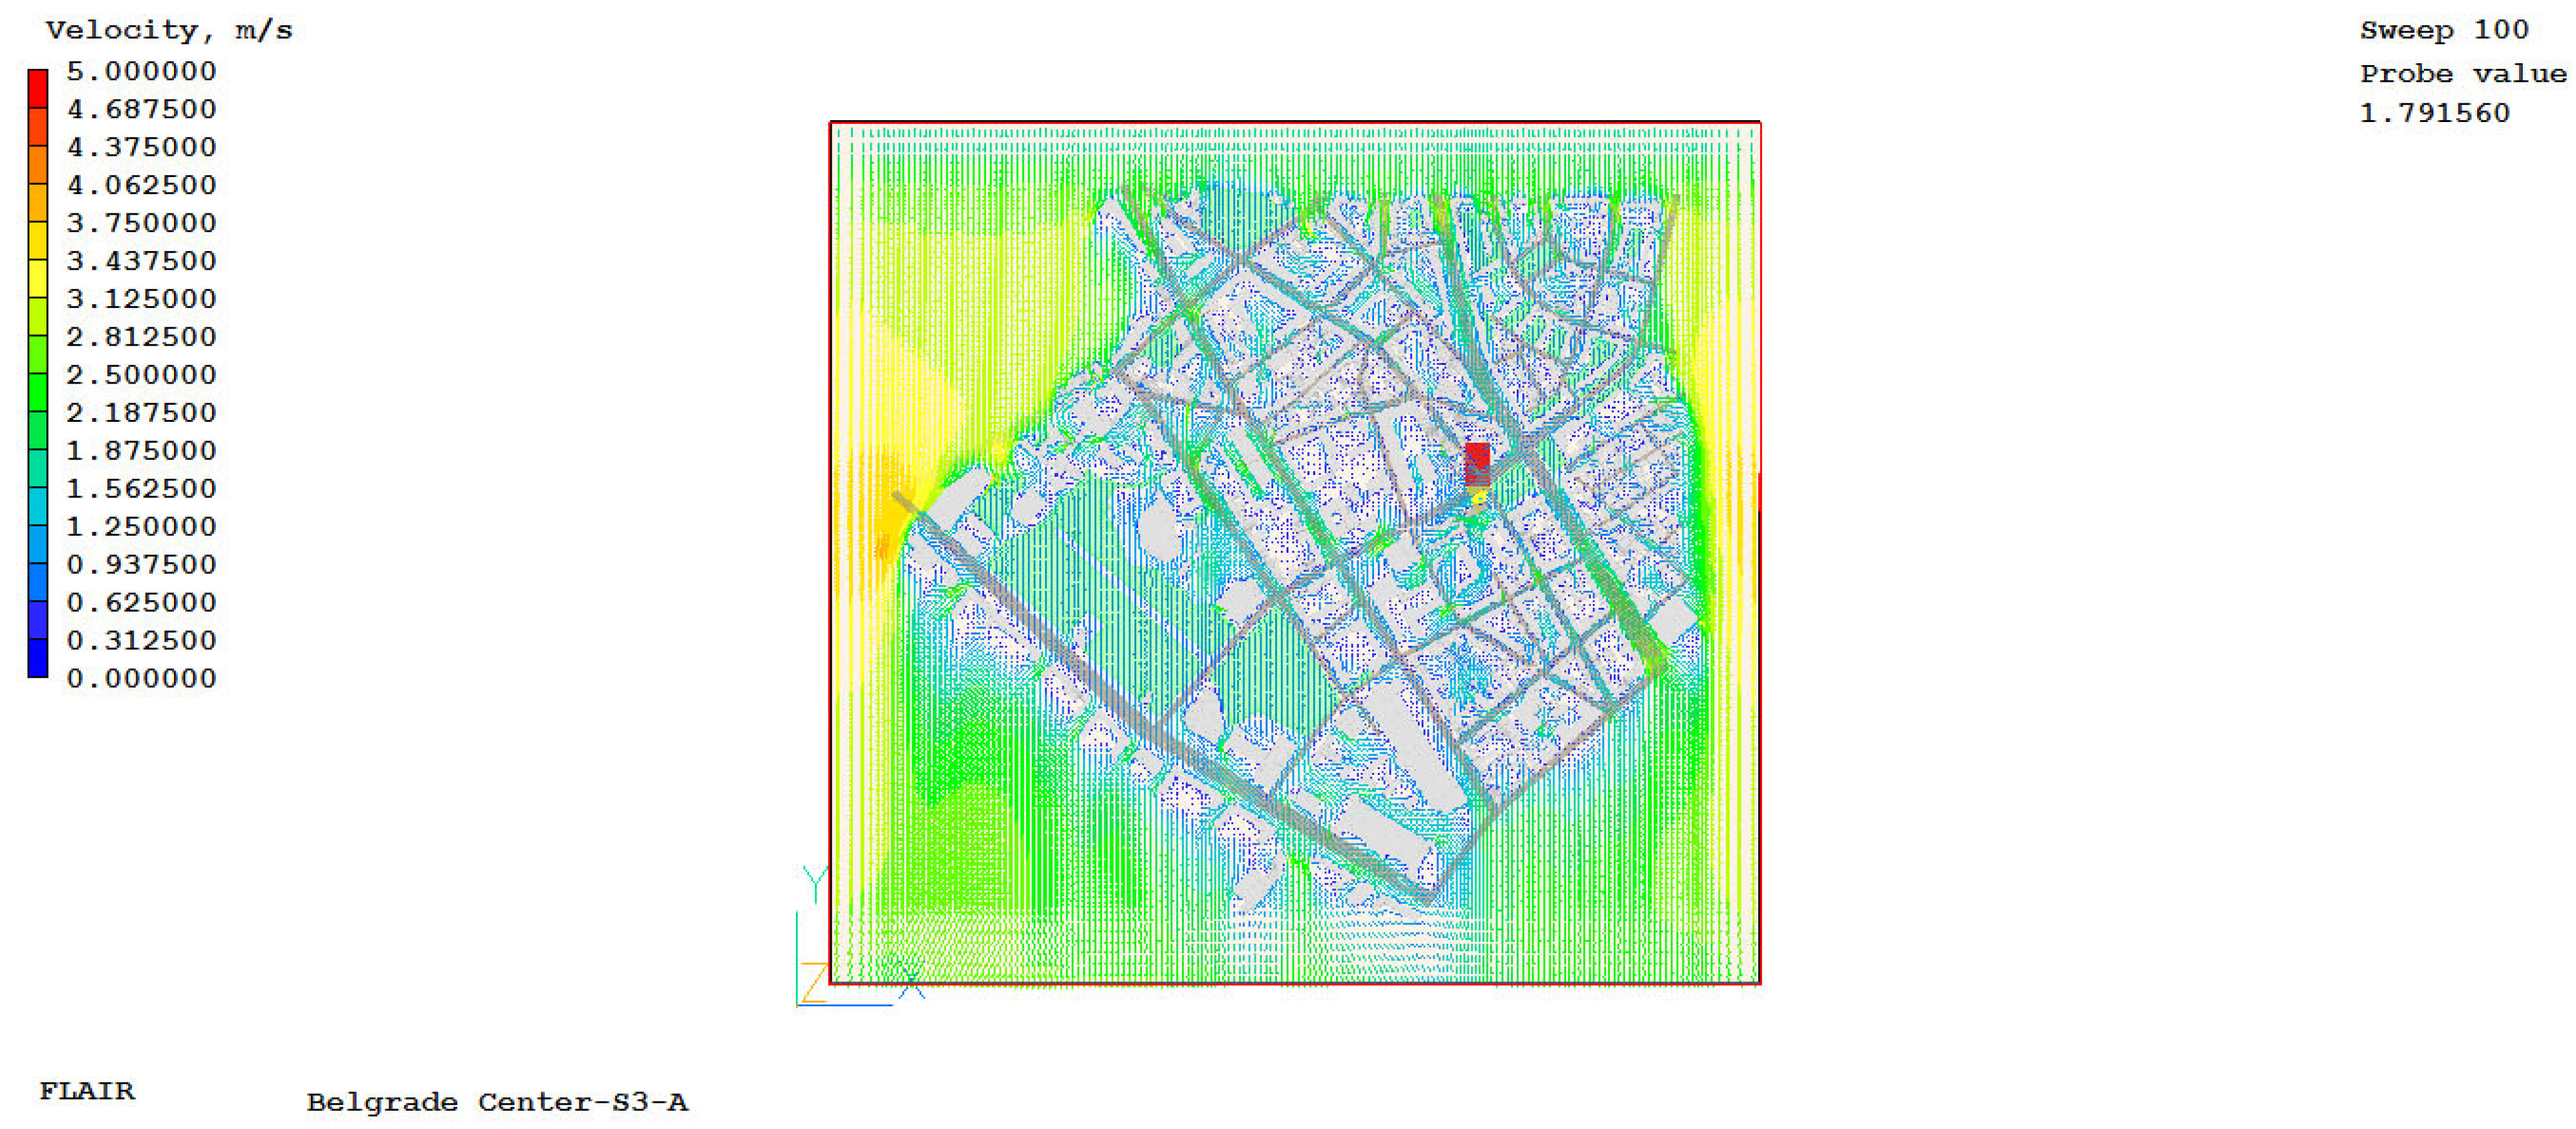
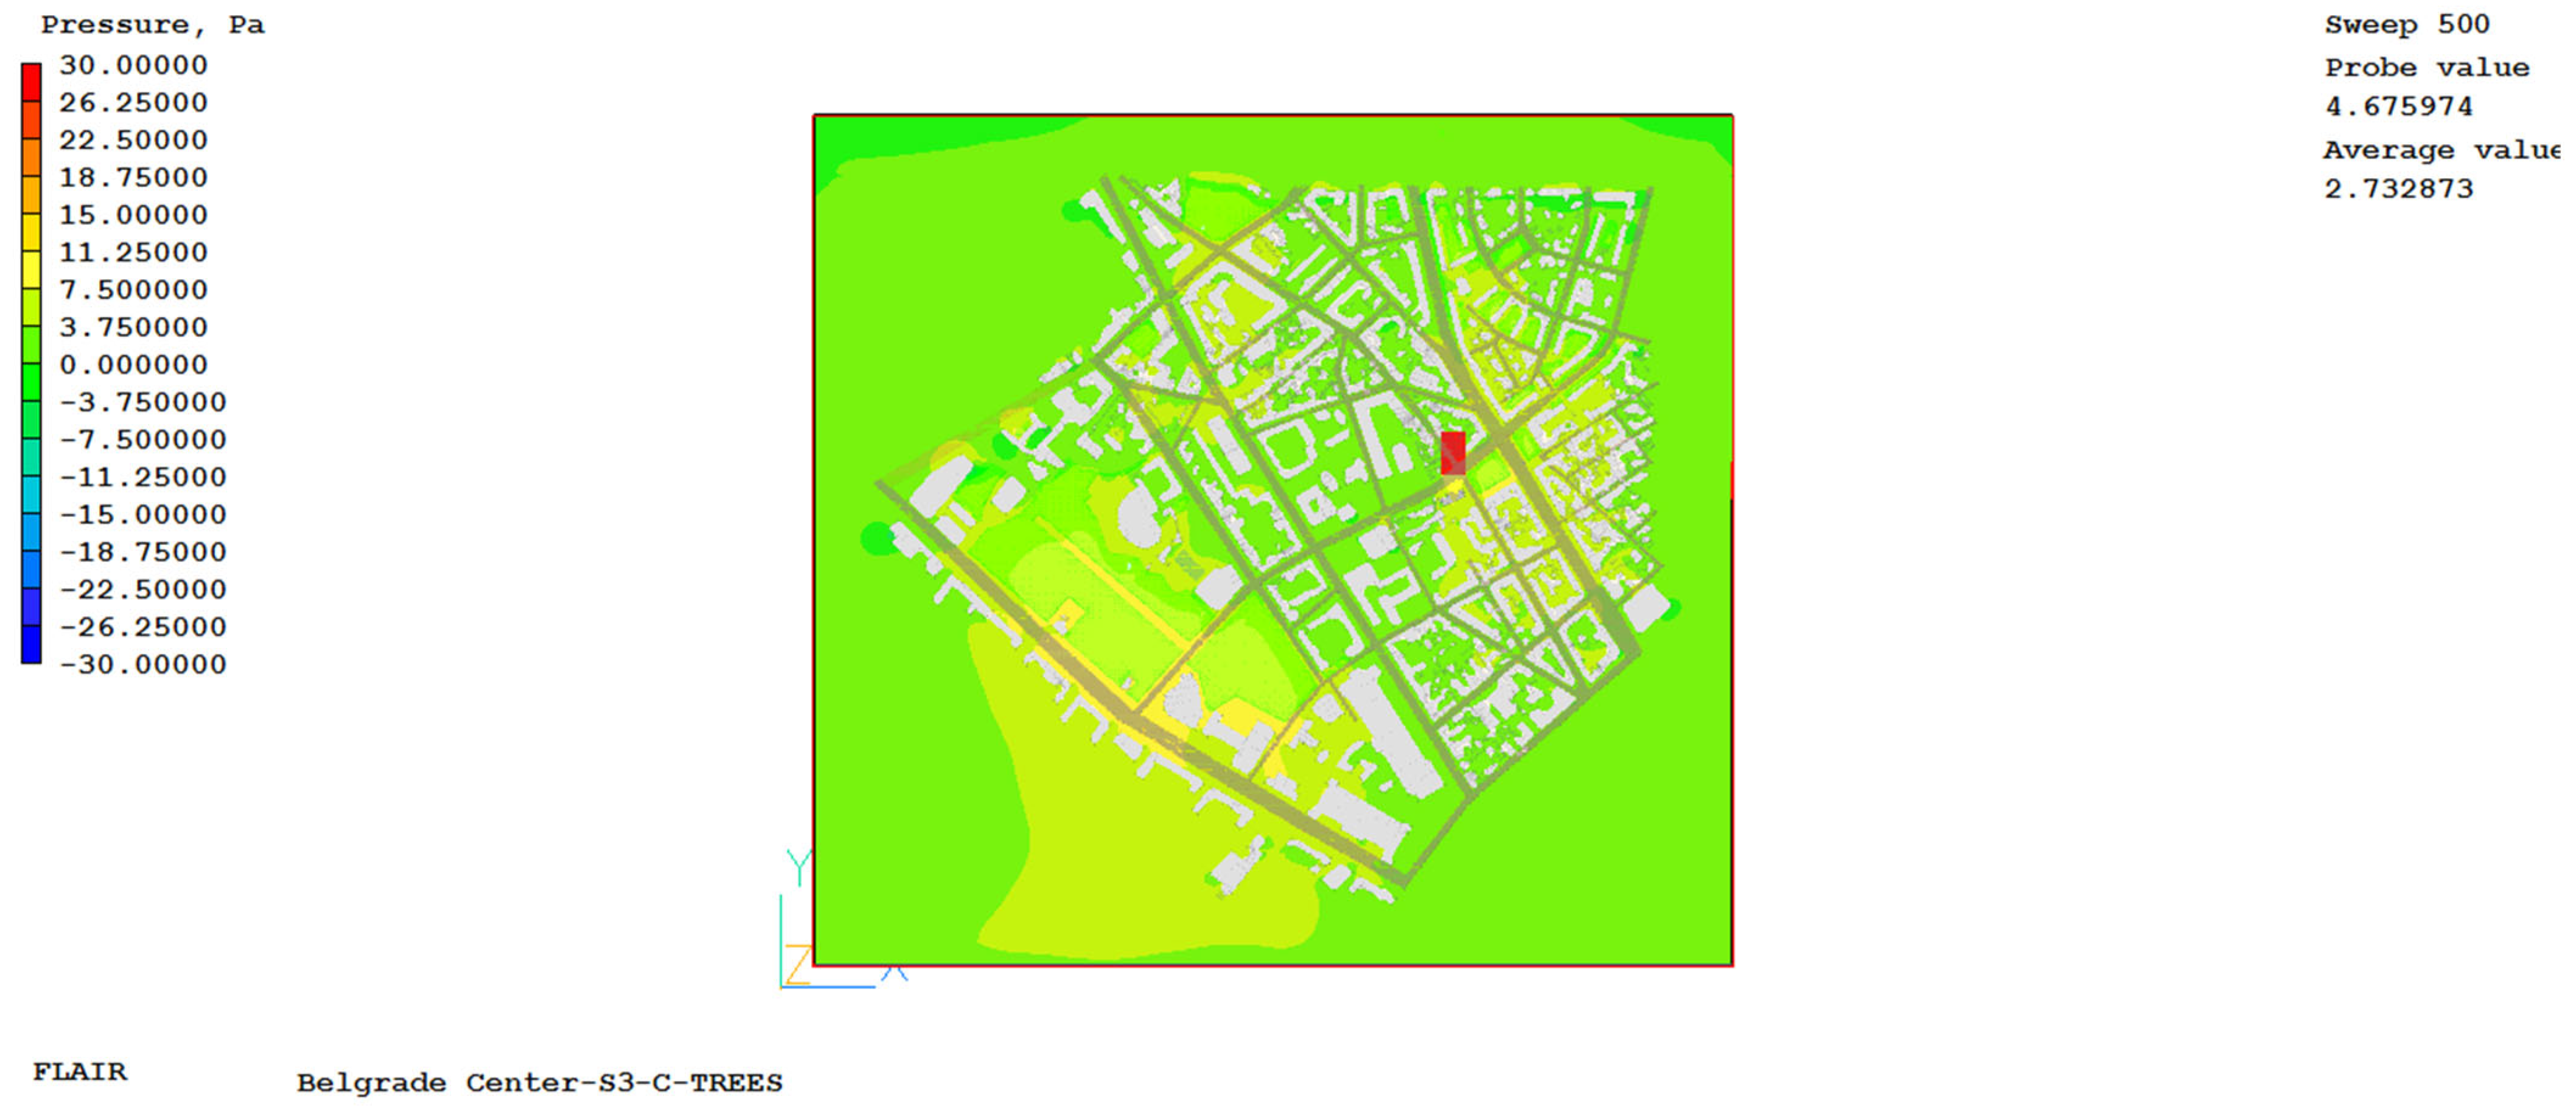
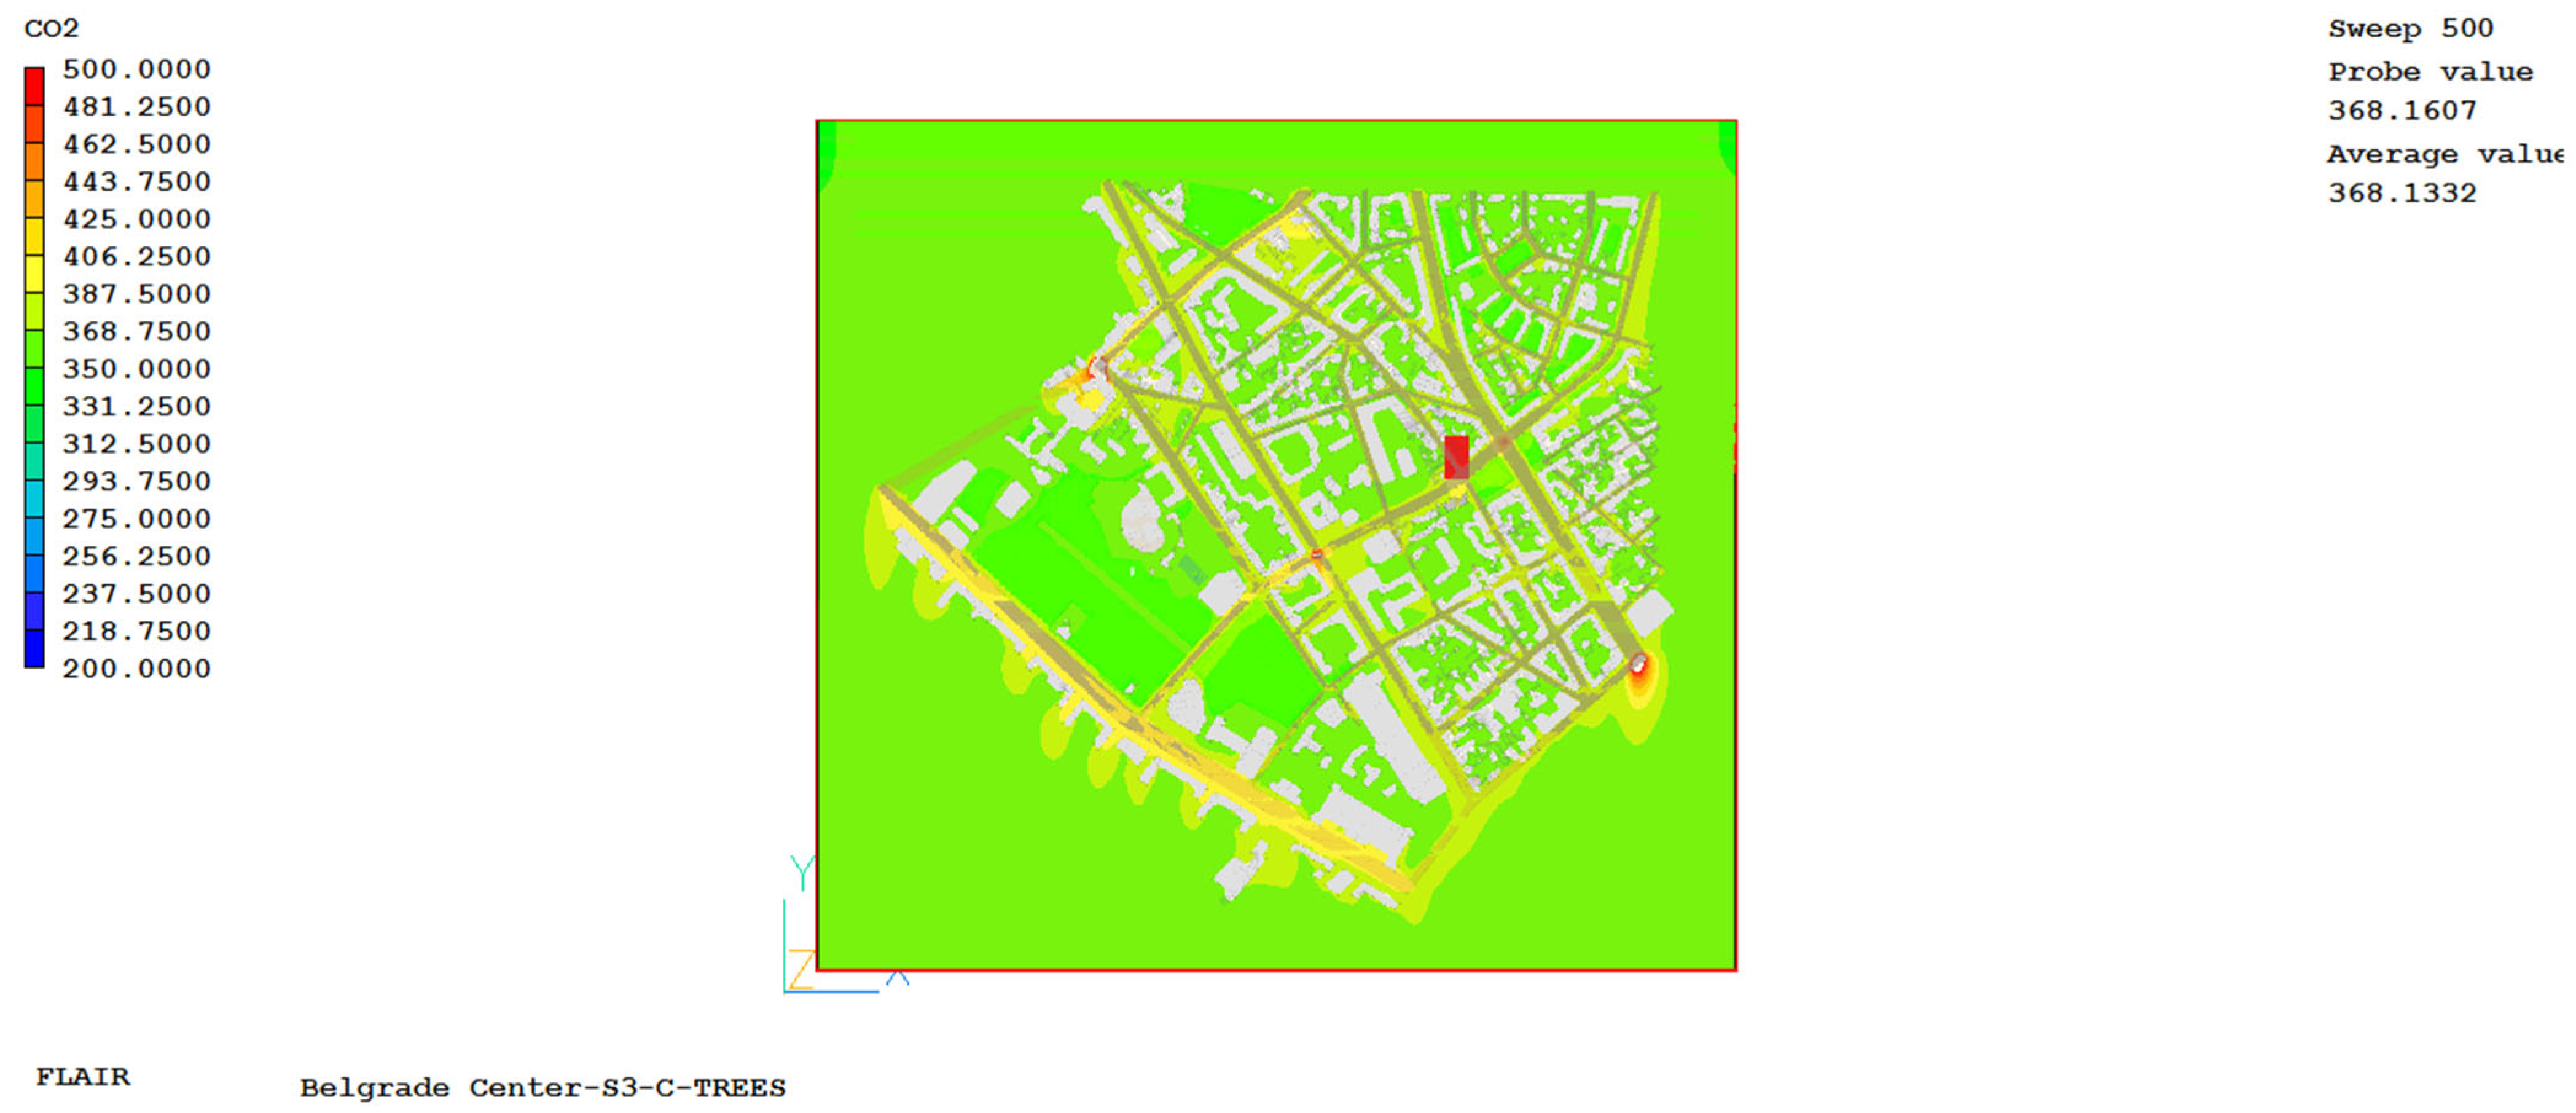
Five urban locations were selected where detailed measurements were made and marked on a three-dimensional numerical model. After creating the model geometry, the thermophysical properties of the material, boundary conditions, and numerical grid of the computational domain were defined. The number of cells in the computational grid was adjusted to help make the grid denser around the areas (buildings, streets, parks) that are the subject of this research, so that the flow in the immediate vicinity around the buildings could be determined with satisfactory accuracy. Graphical representations of the three-dimensional numerical model and the convergence flow processes for cases S1-C, S2-C and S3-C are given in
Appendix B,
Figure A1,
Figure A2,
Figure A3 and
Figure A4.
The Influence of Vegetation and Wind on the UHII
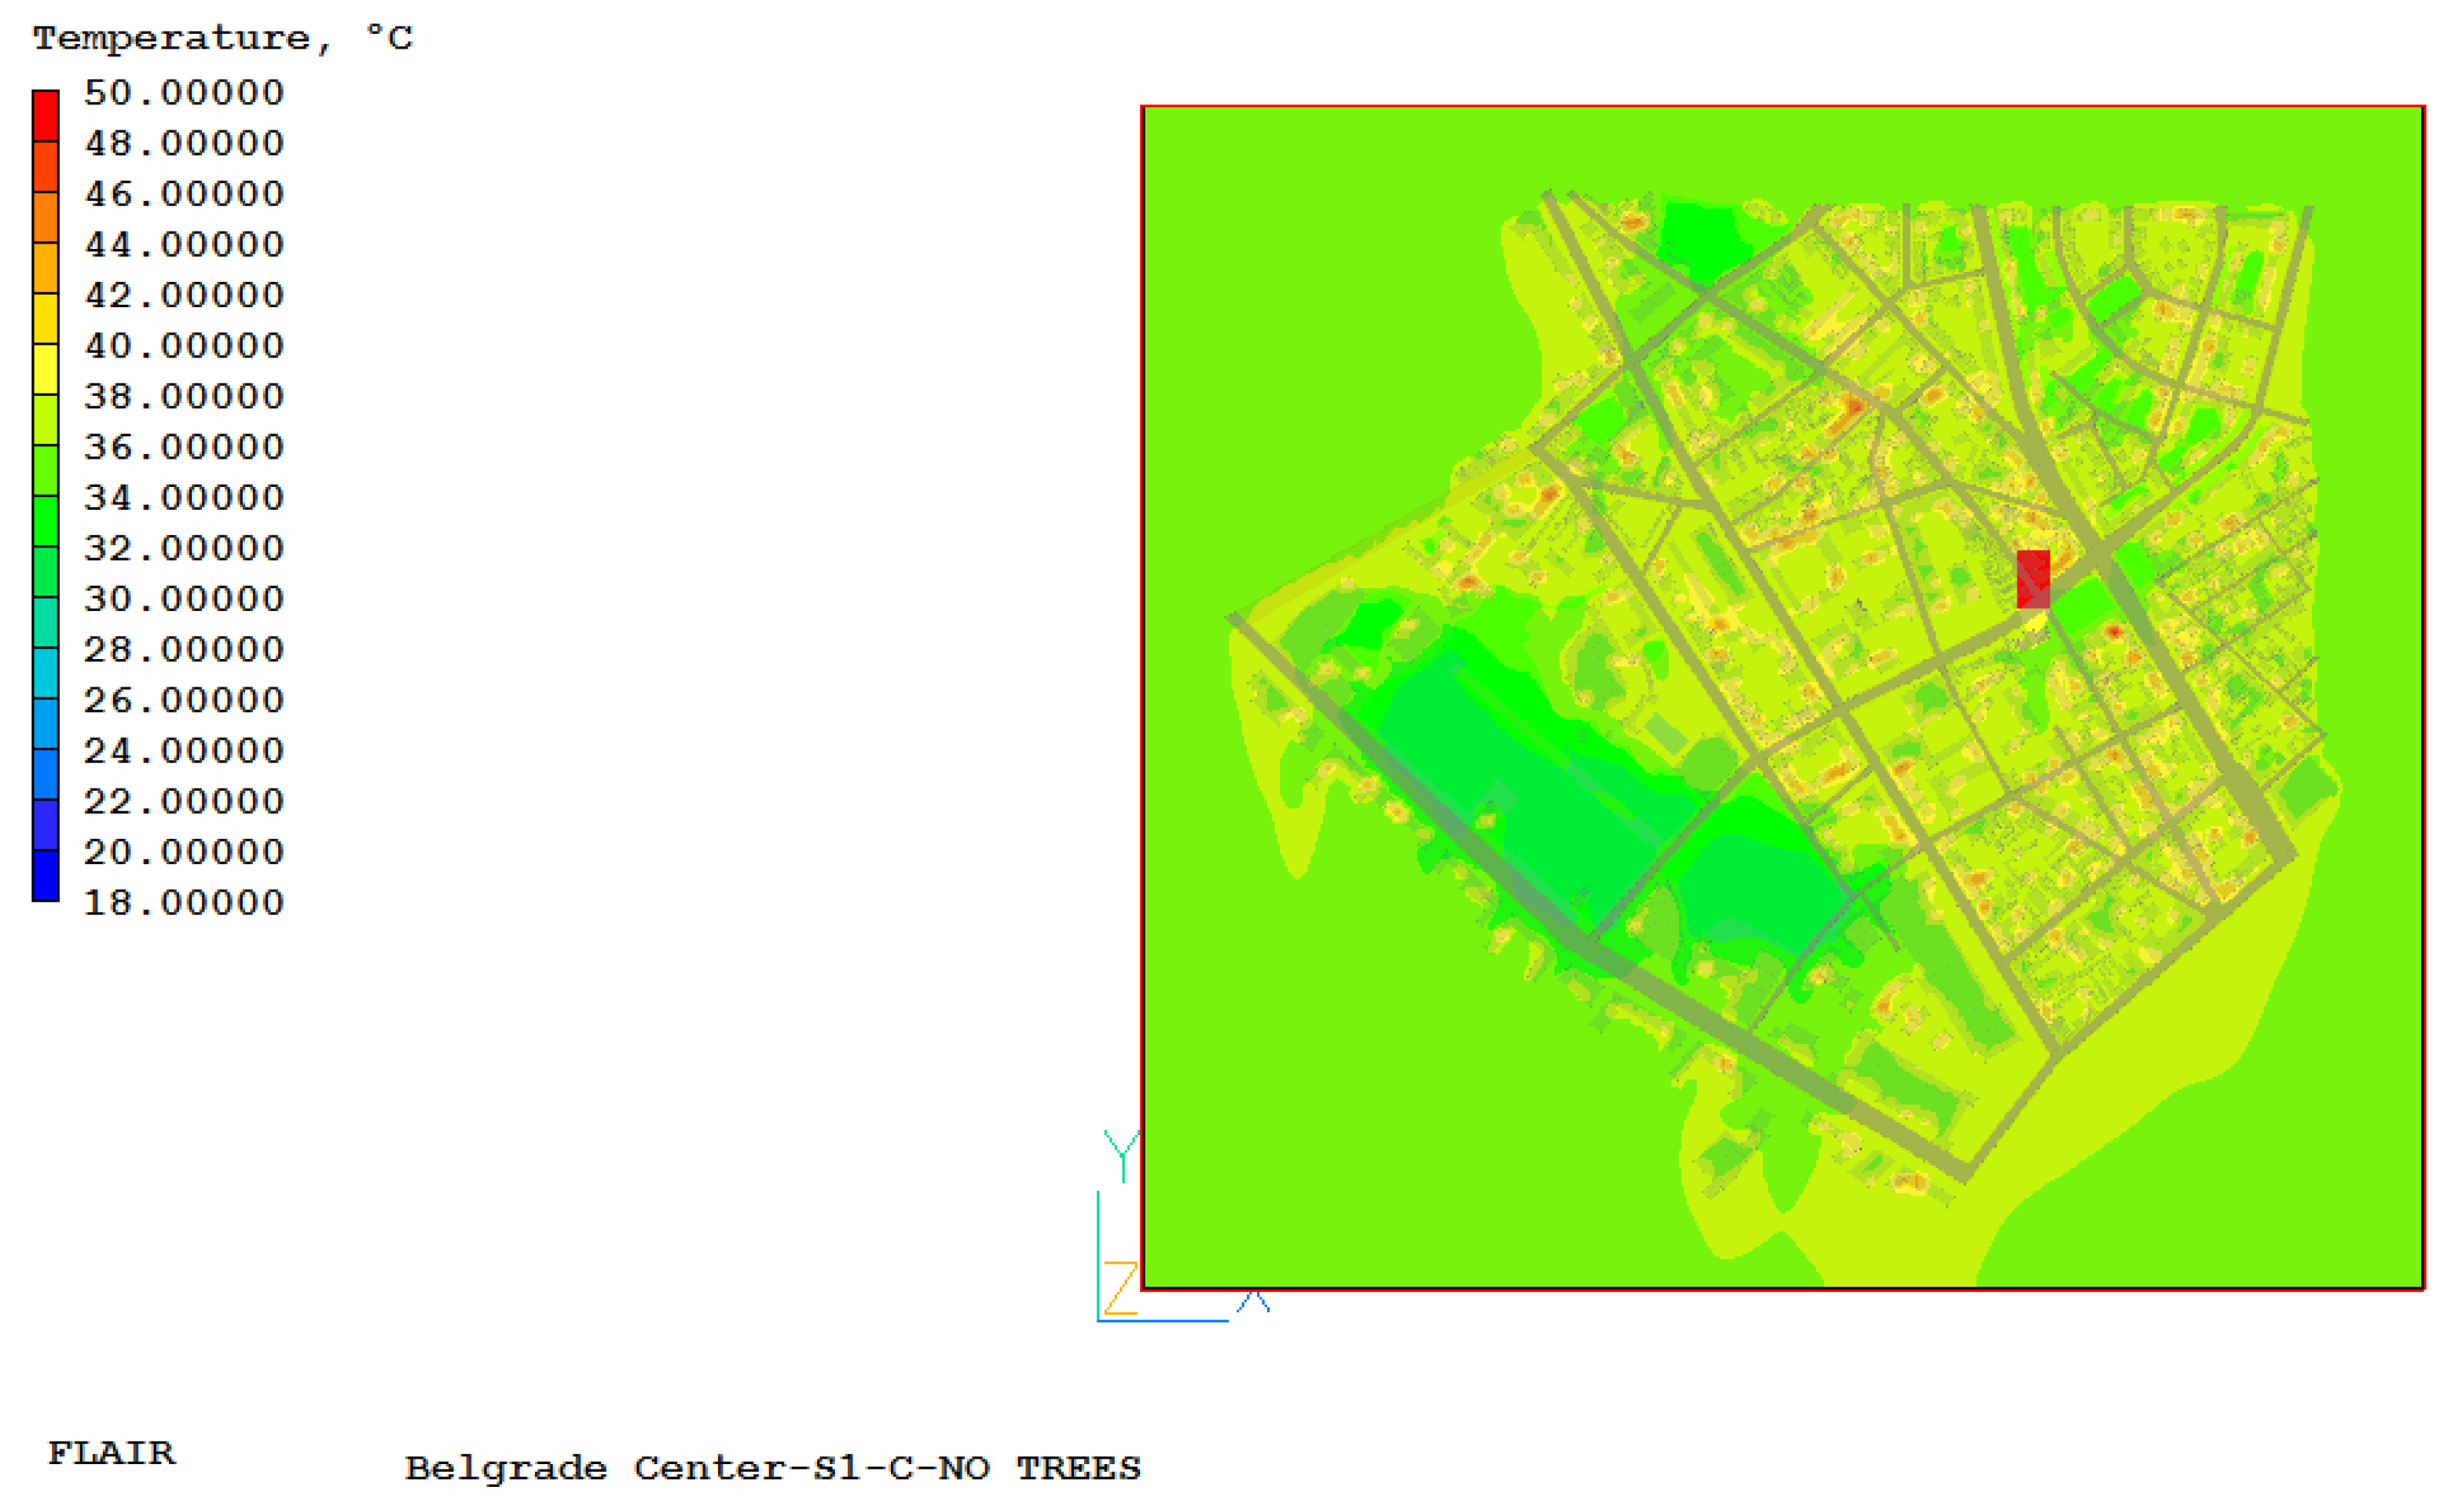
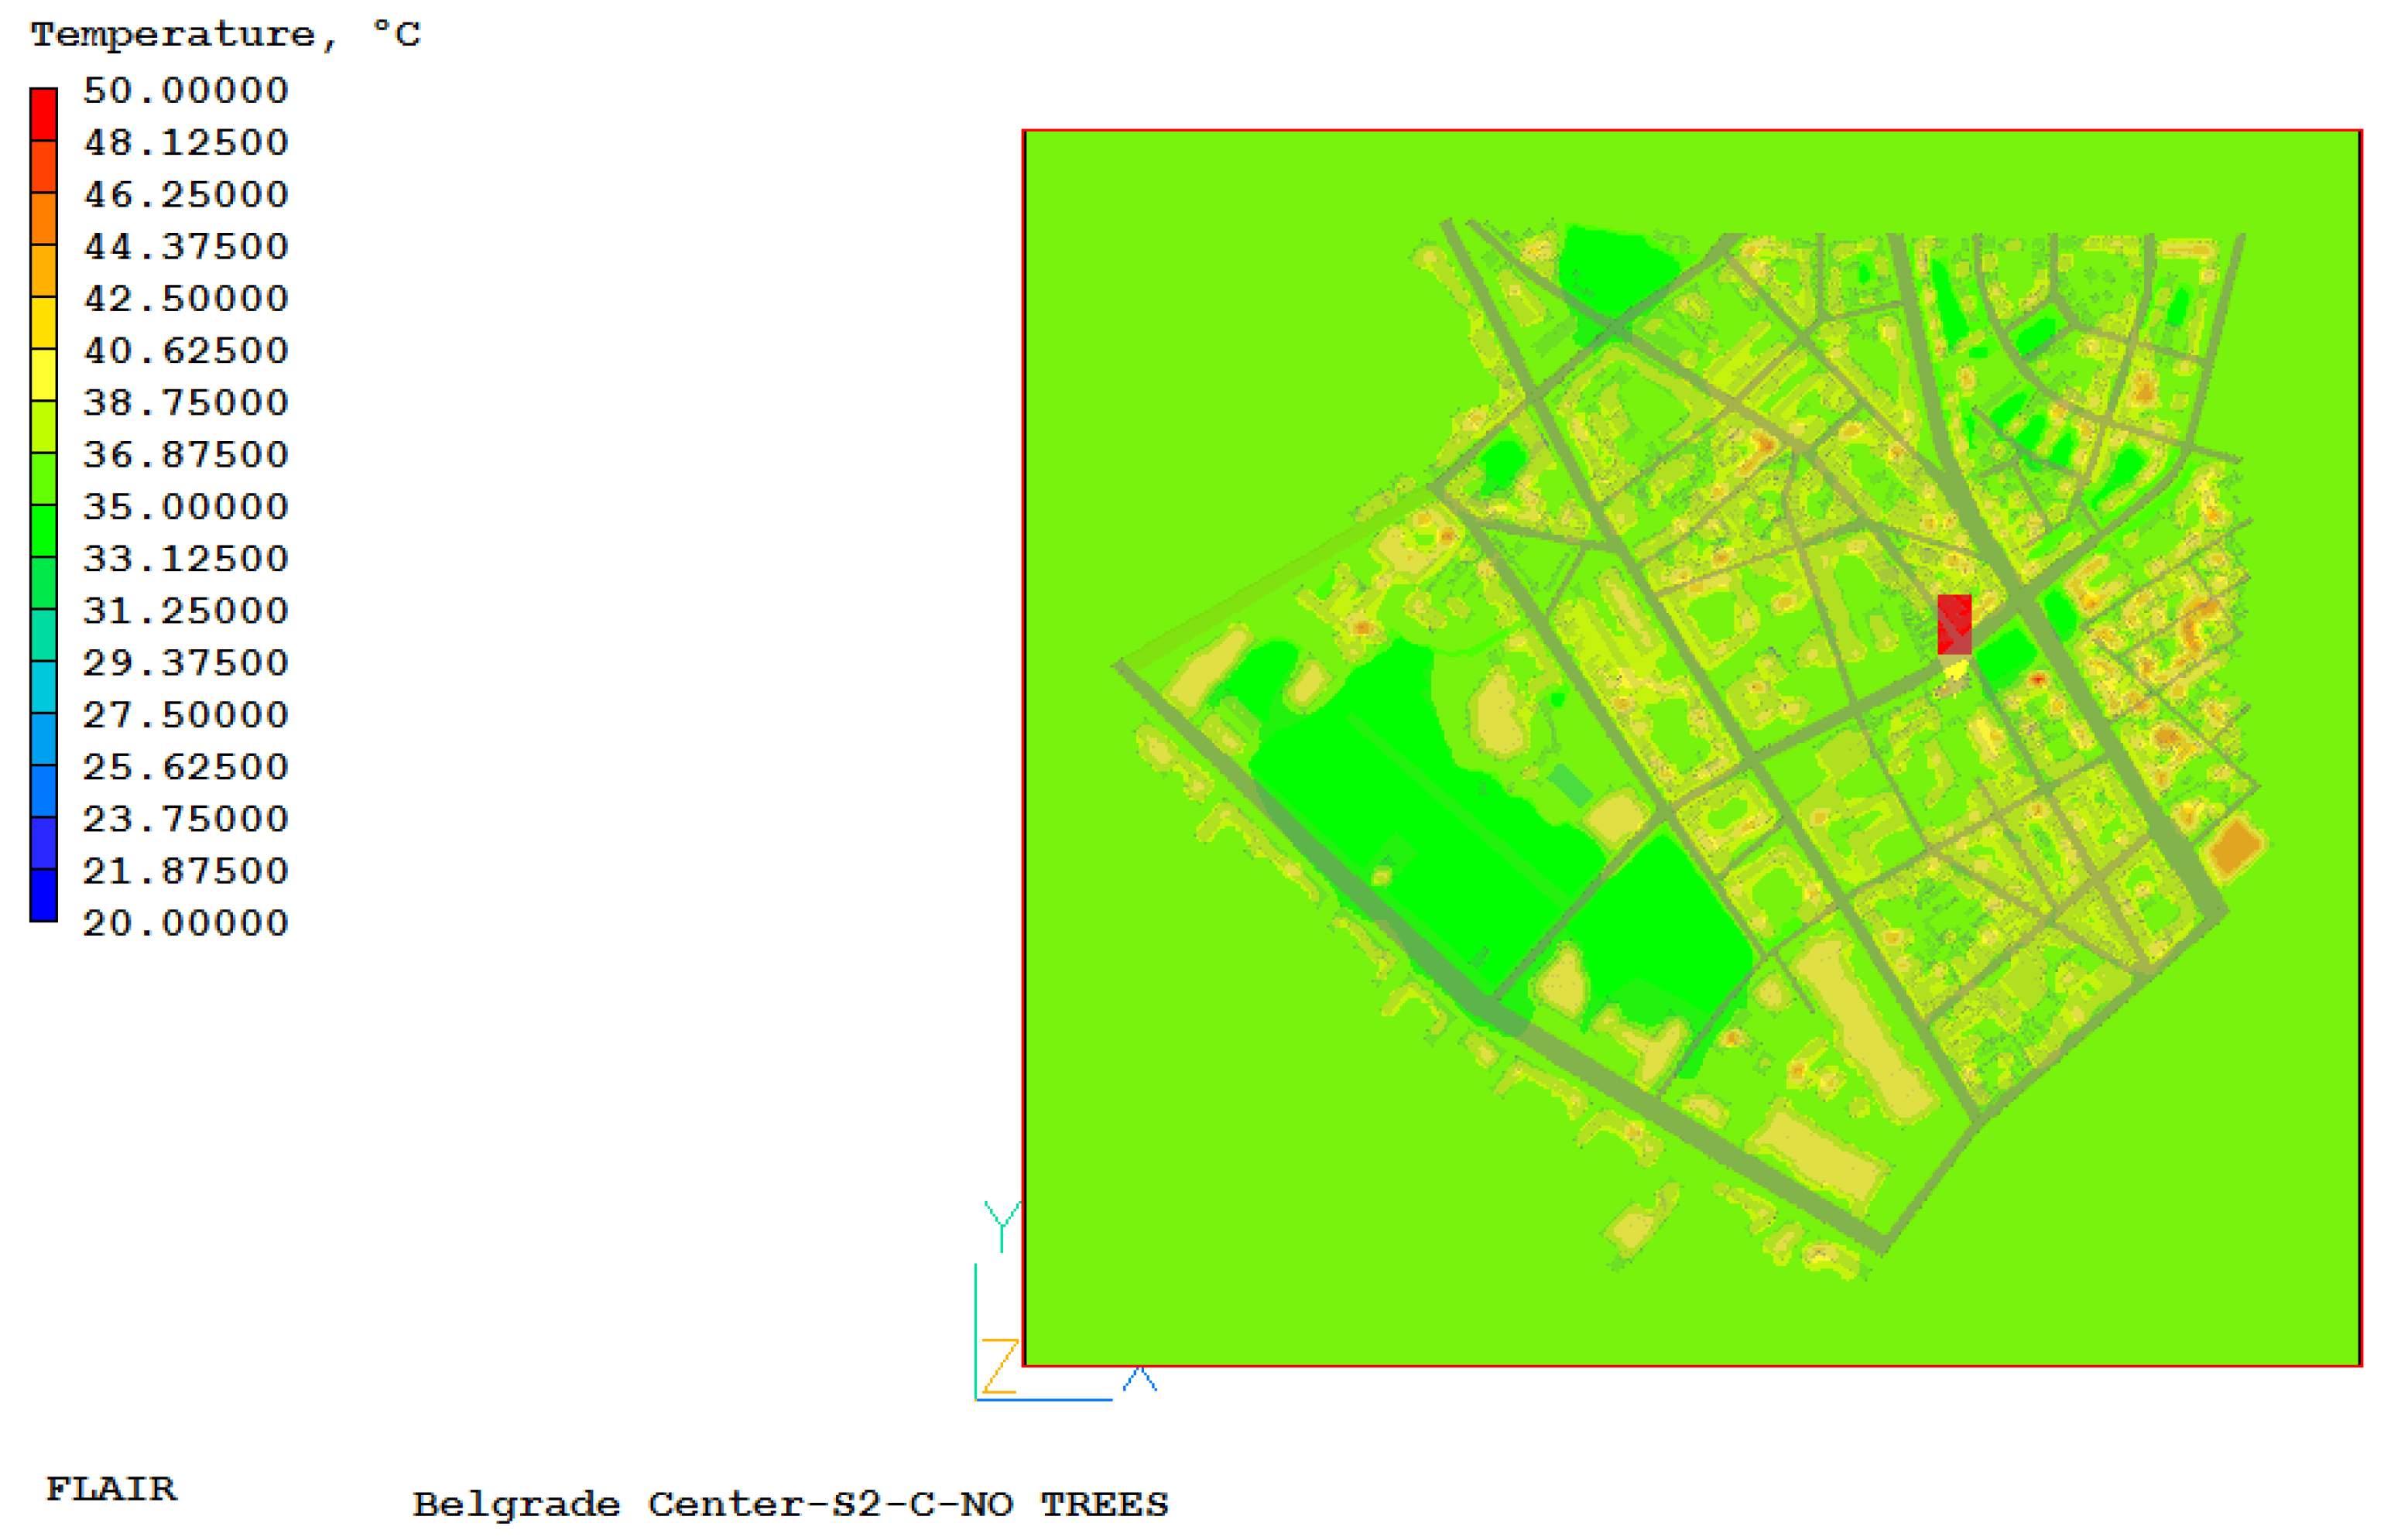
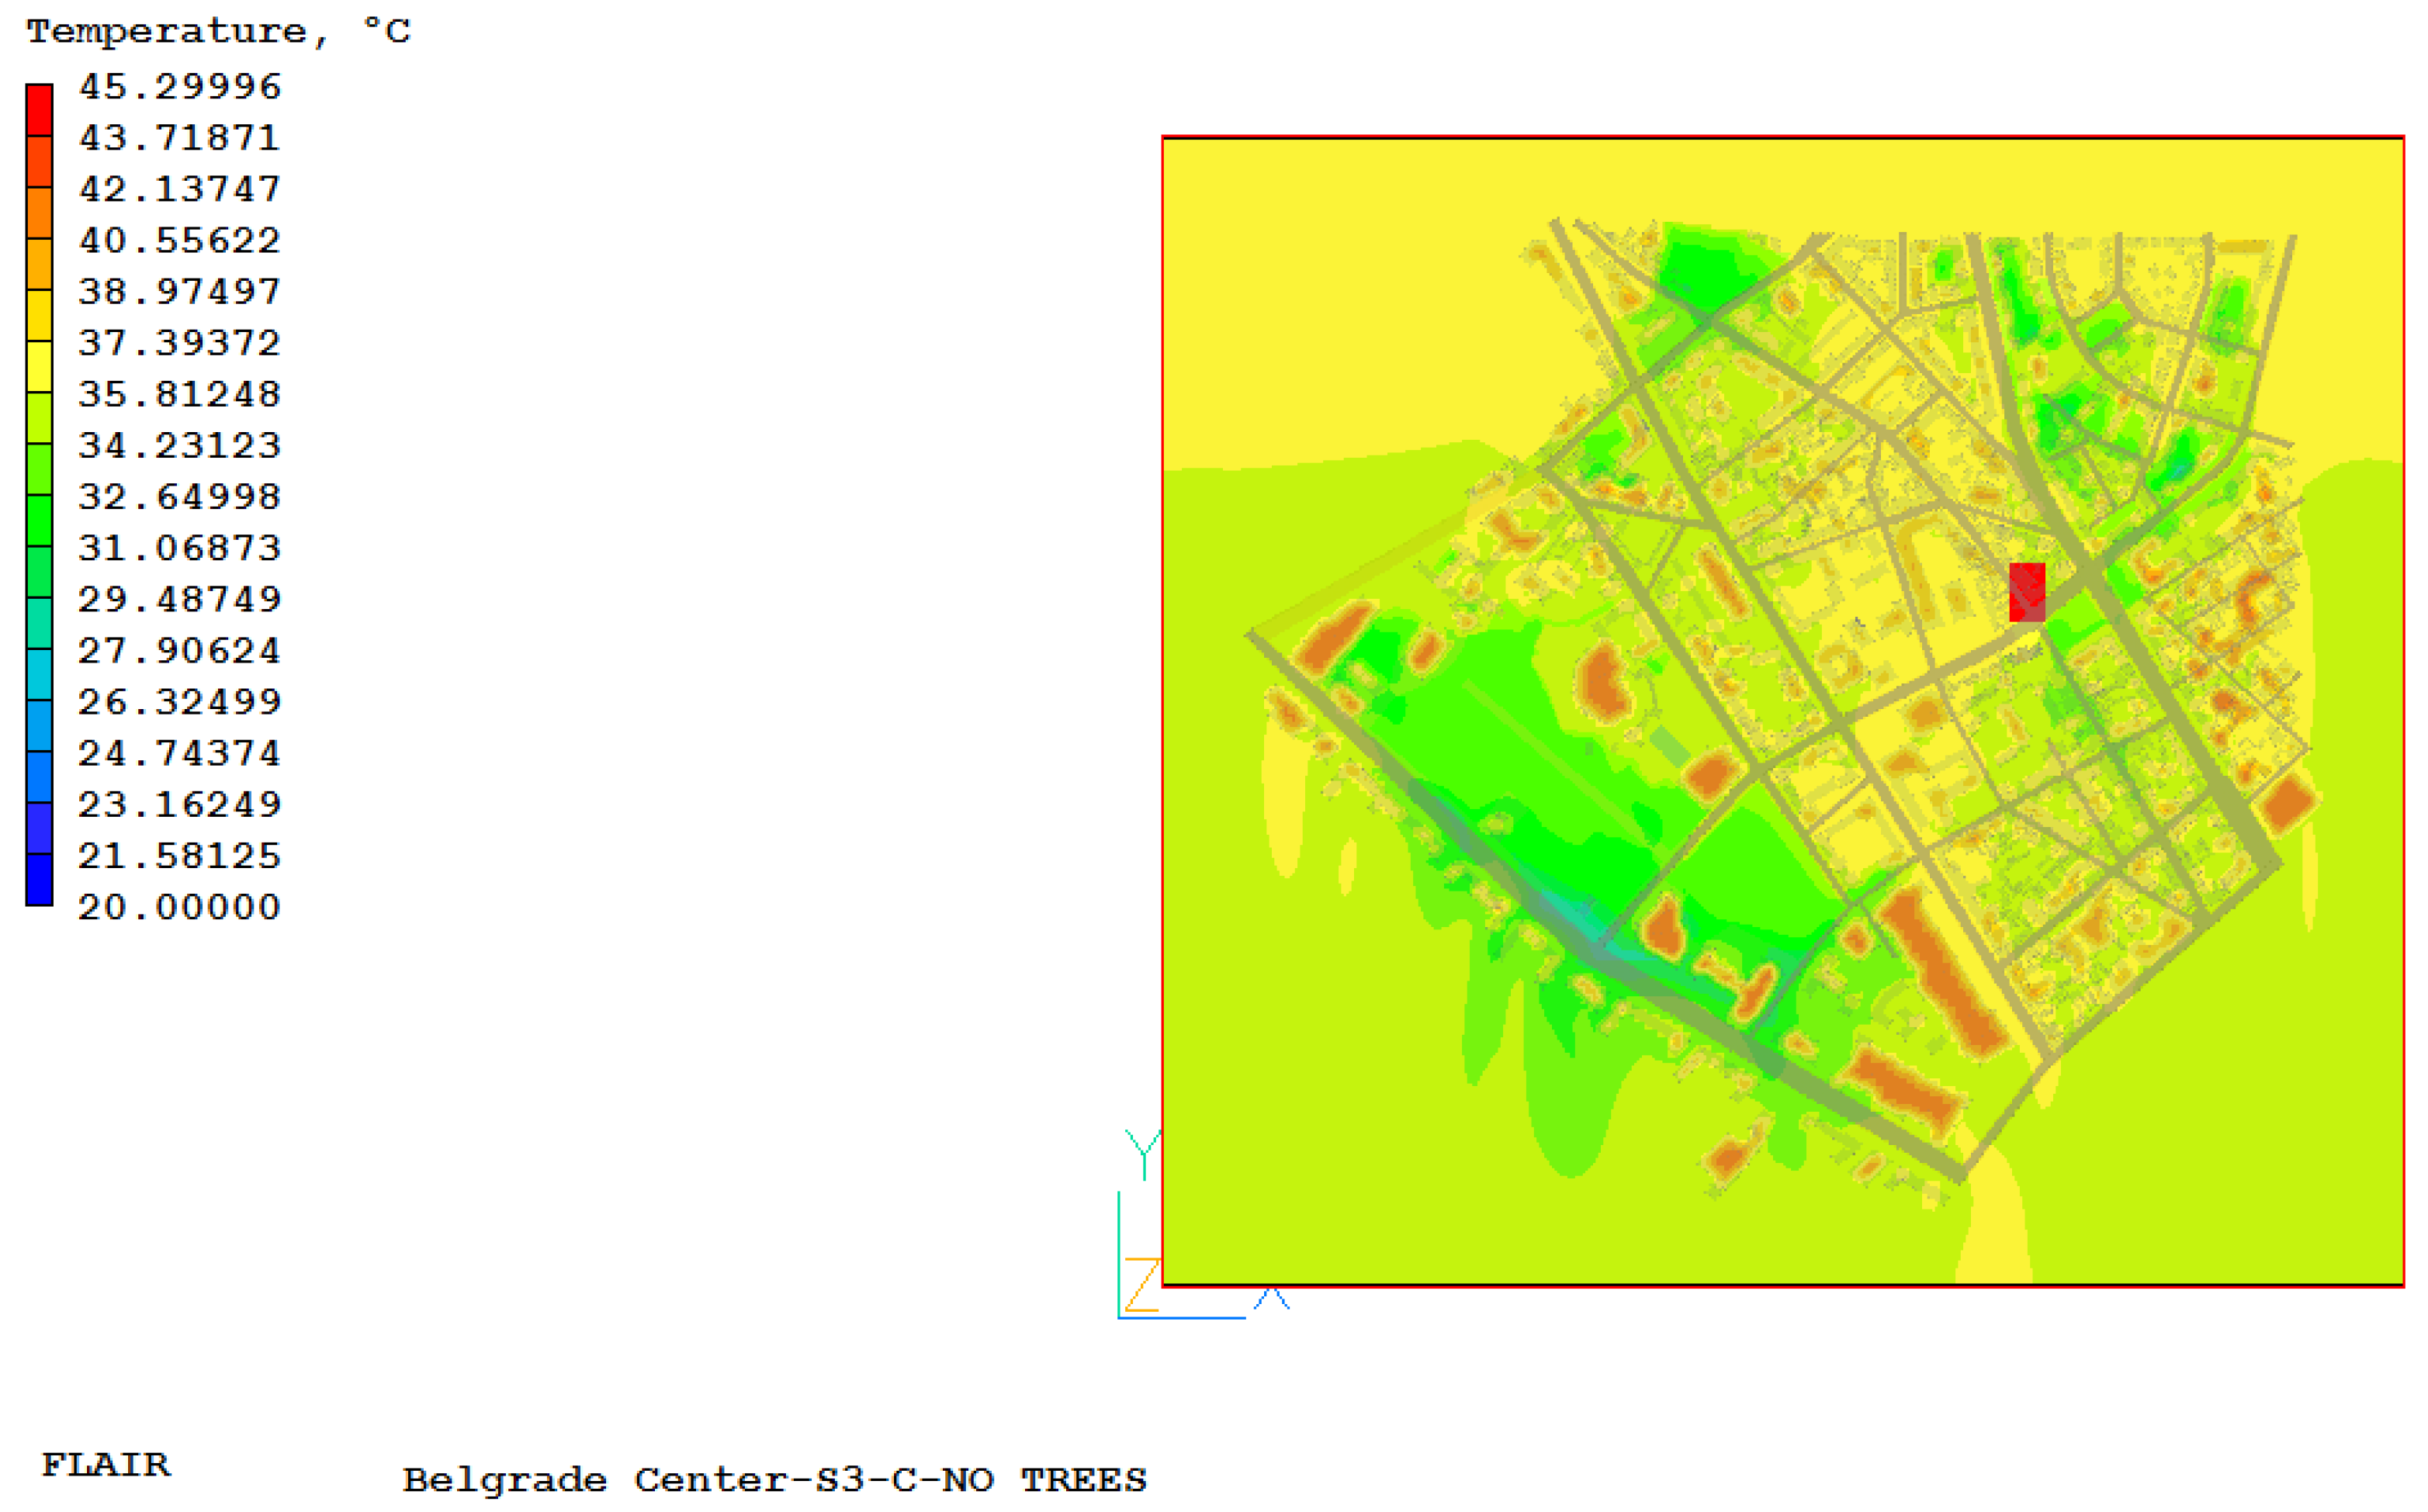
In order to show the impact of trees on the UHII, three additional numerical simulations were performed for the already defined cases with the same boundary conditions that we did in the previous analysis, except that in the parts where there were trees, there is now only a grassy surface (no trees). The objective of this ‘no-tree’ scenario was to assess the cumulative thermal impact of replacing forested areas with lawn. The simulation therefore quantifies the combined effects of the loss of shading, the cessation of evapotranspiration from tree canopies, and altered local wind patterns, without separating the individual contribution of each mechanism. In
Table A2,
Table A3 and
Table A4,
Appendix C, the simulation values in the case where there were trees are shown in green. Based on all of the above, it can be concluded that trees greatly affect the air temperature in the urban environment, and therefore the UHII and the energy needs of buildings located in that area. Based on numerical simulations, with and without trees in the urban environment, it can be concluded that the presence of trees in the urban environment significantly affects the temperature in the vicinity of parks and larger areas where trees are located. With a detailed analysis based on
Figure A5,
Figure A6 and
Figure A7,
Appendix C, it can be concluded that the average air temperature for the observed urban area is higher in the range of 1.5 °C to 3 °C depending on the observed time of day. In addition to the increased temperature, the thermal comfort coefficient for most of the observed locations increased by one, as shown in
Table A2,
Table A3 and
Table A4,
Appendix C.
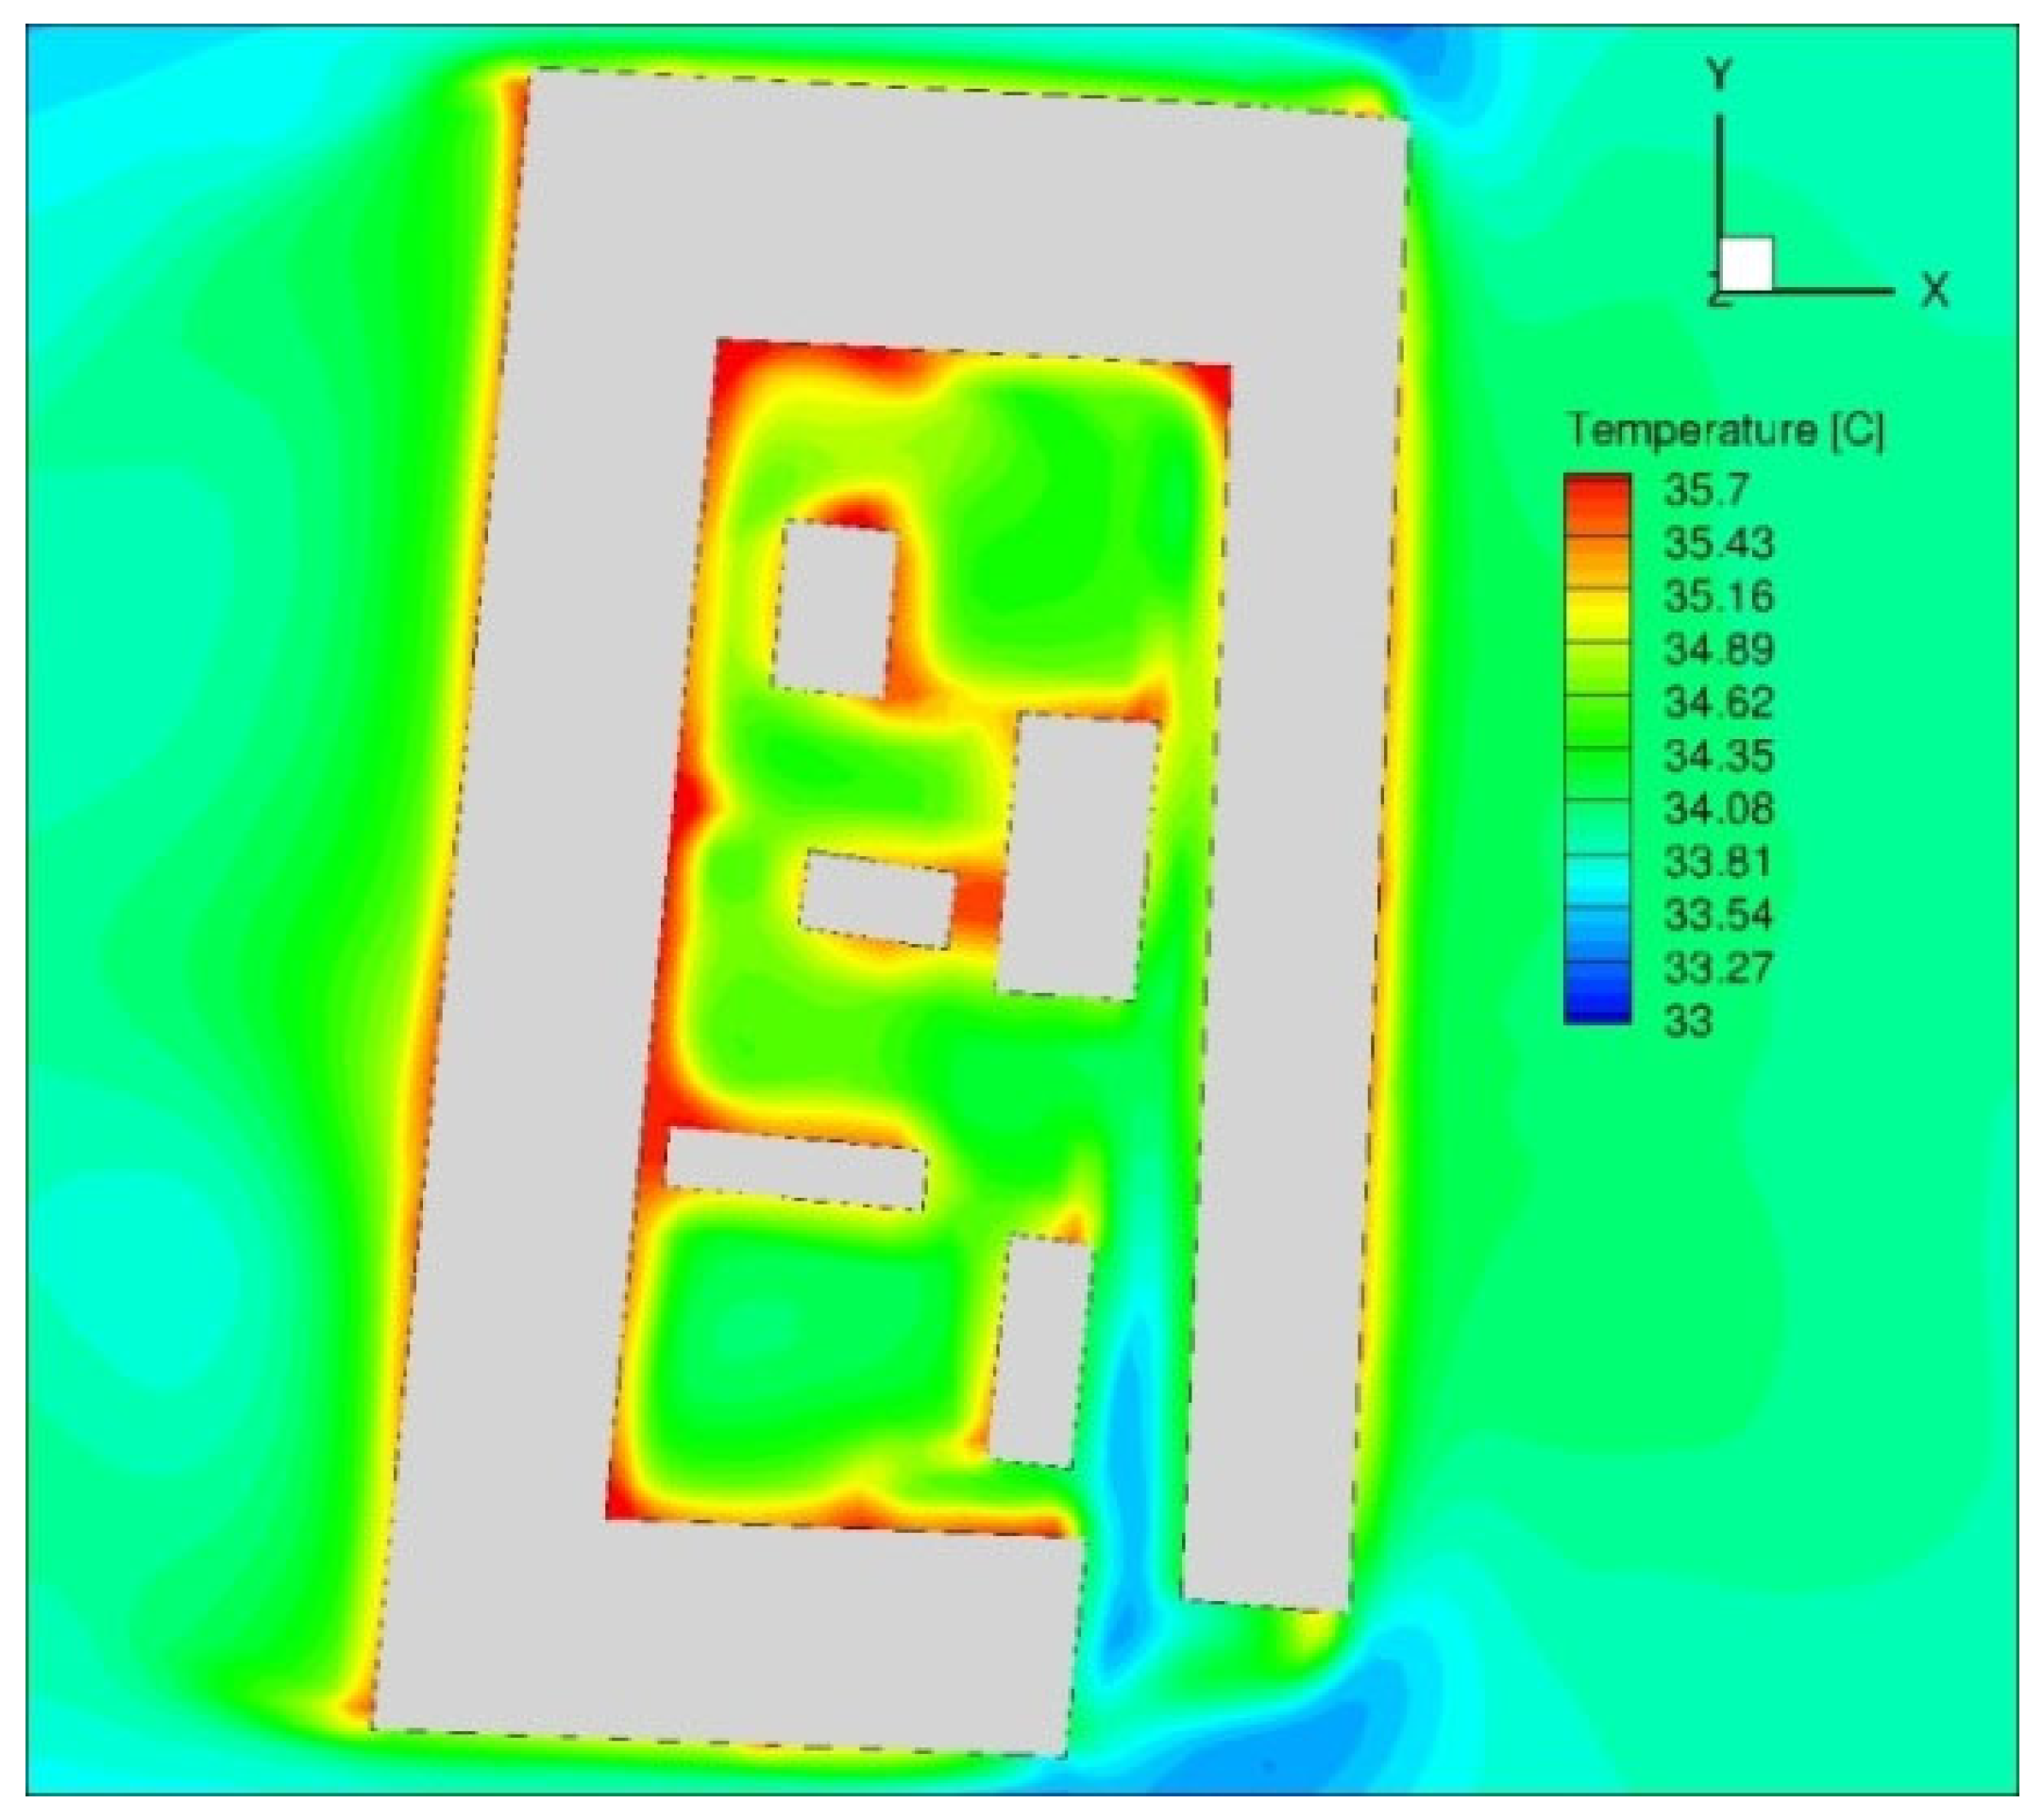
As an example of one result obtained,
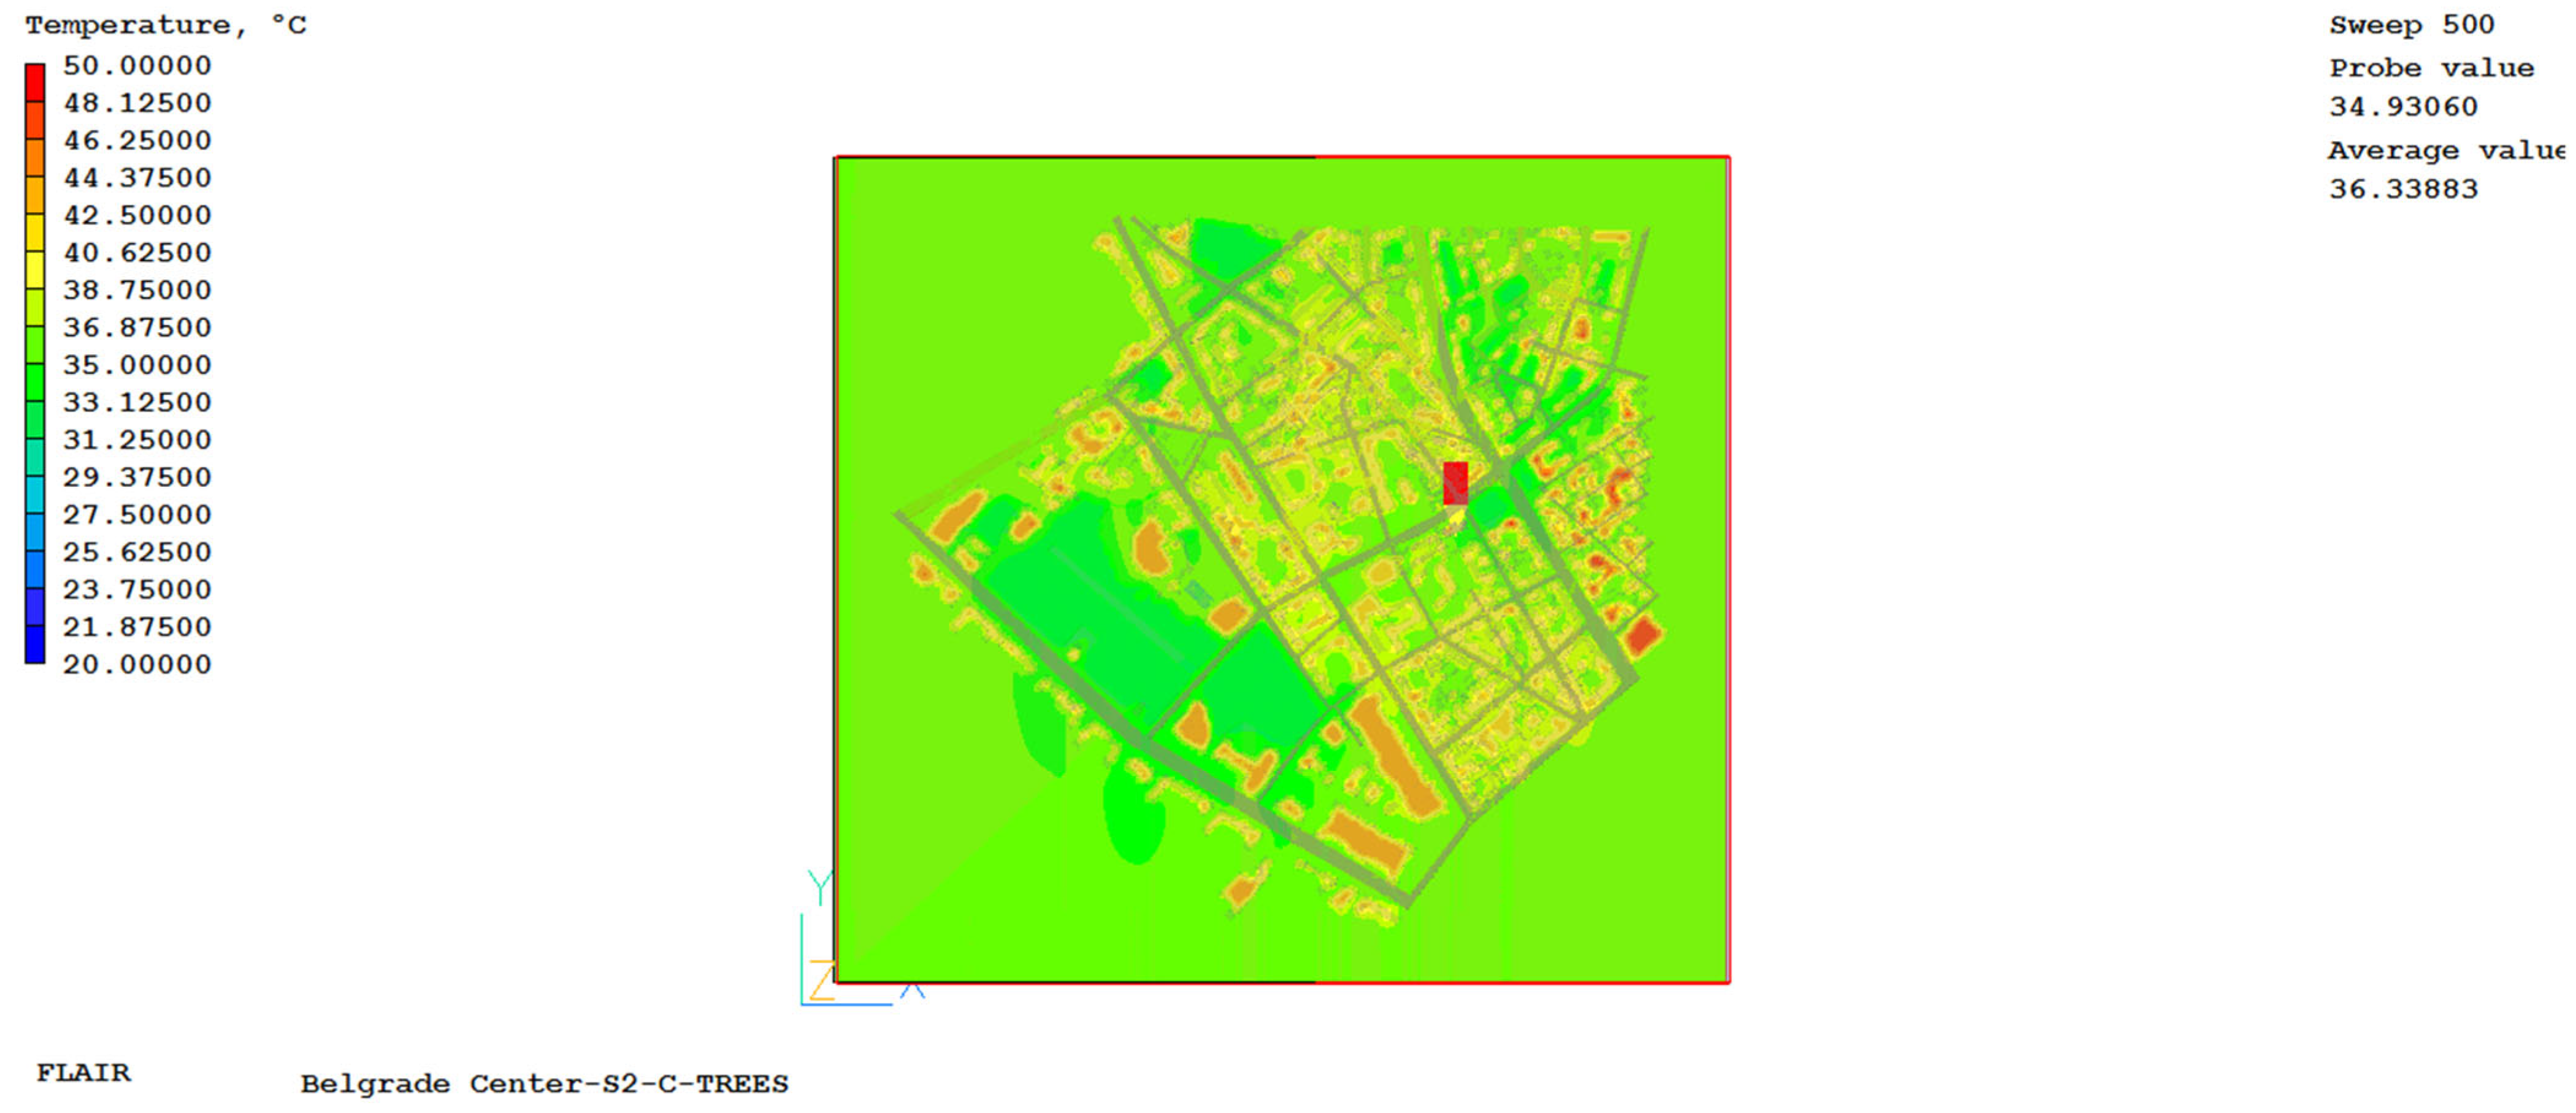
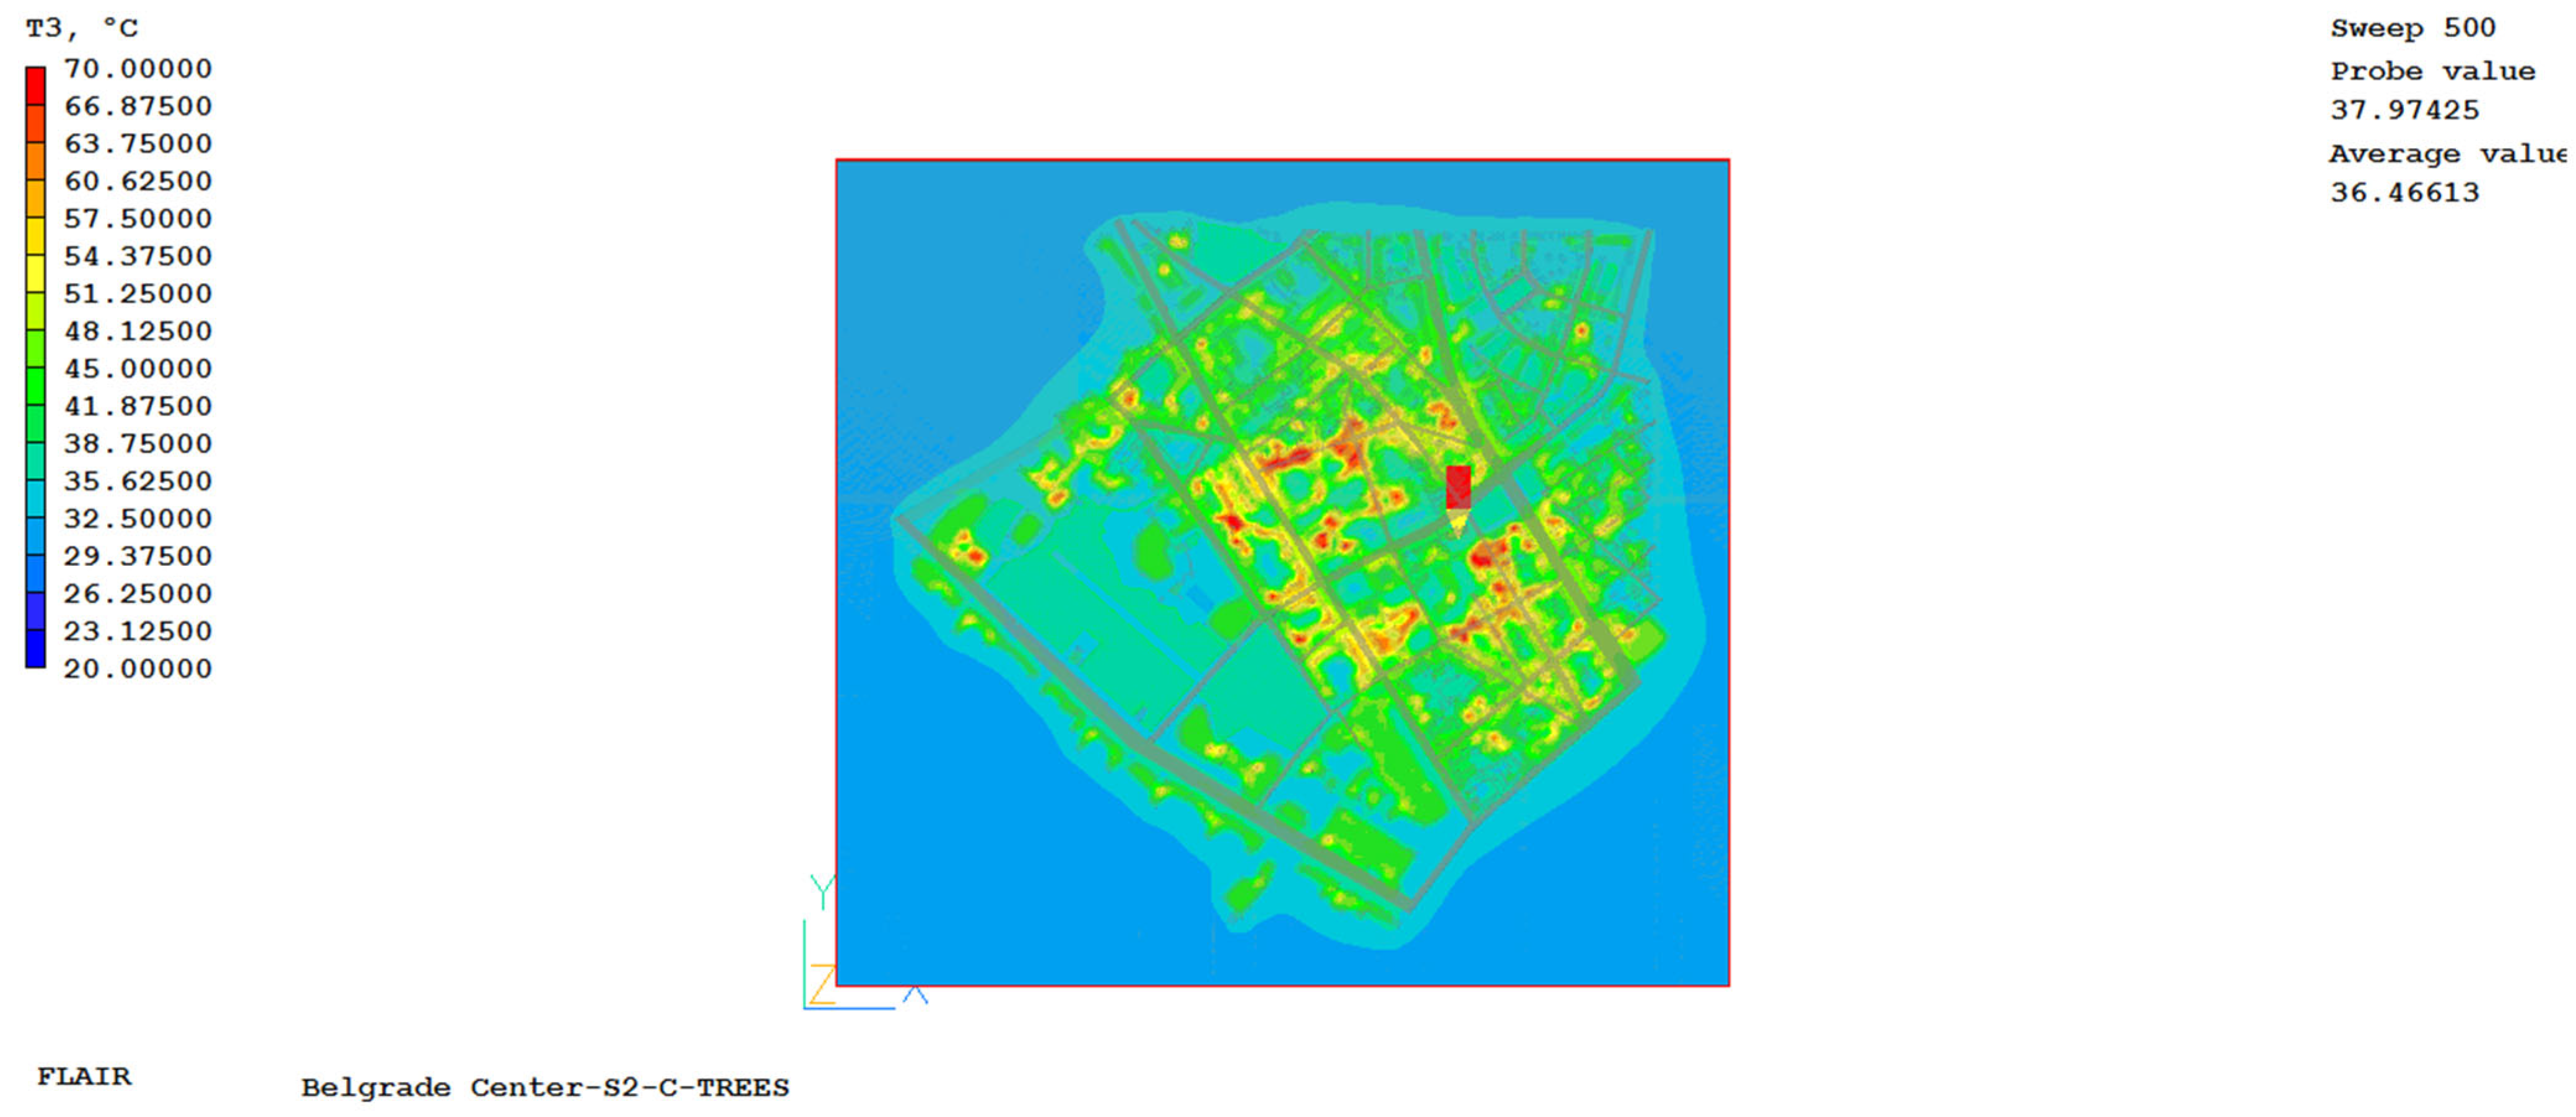
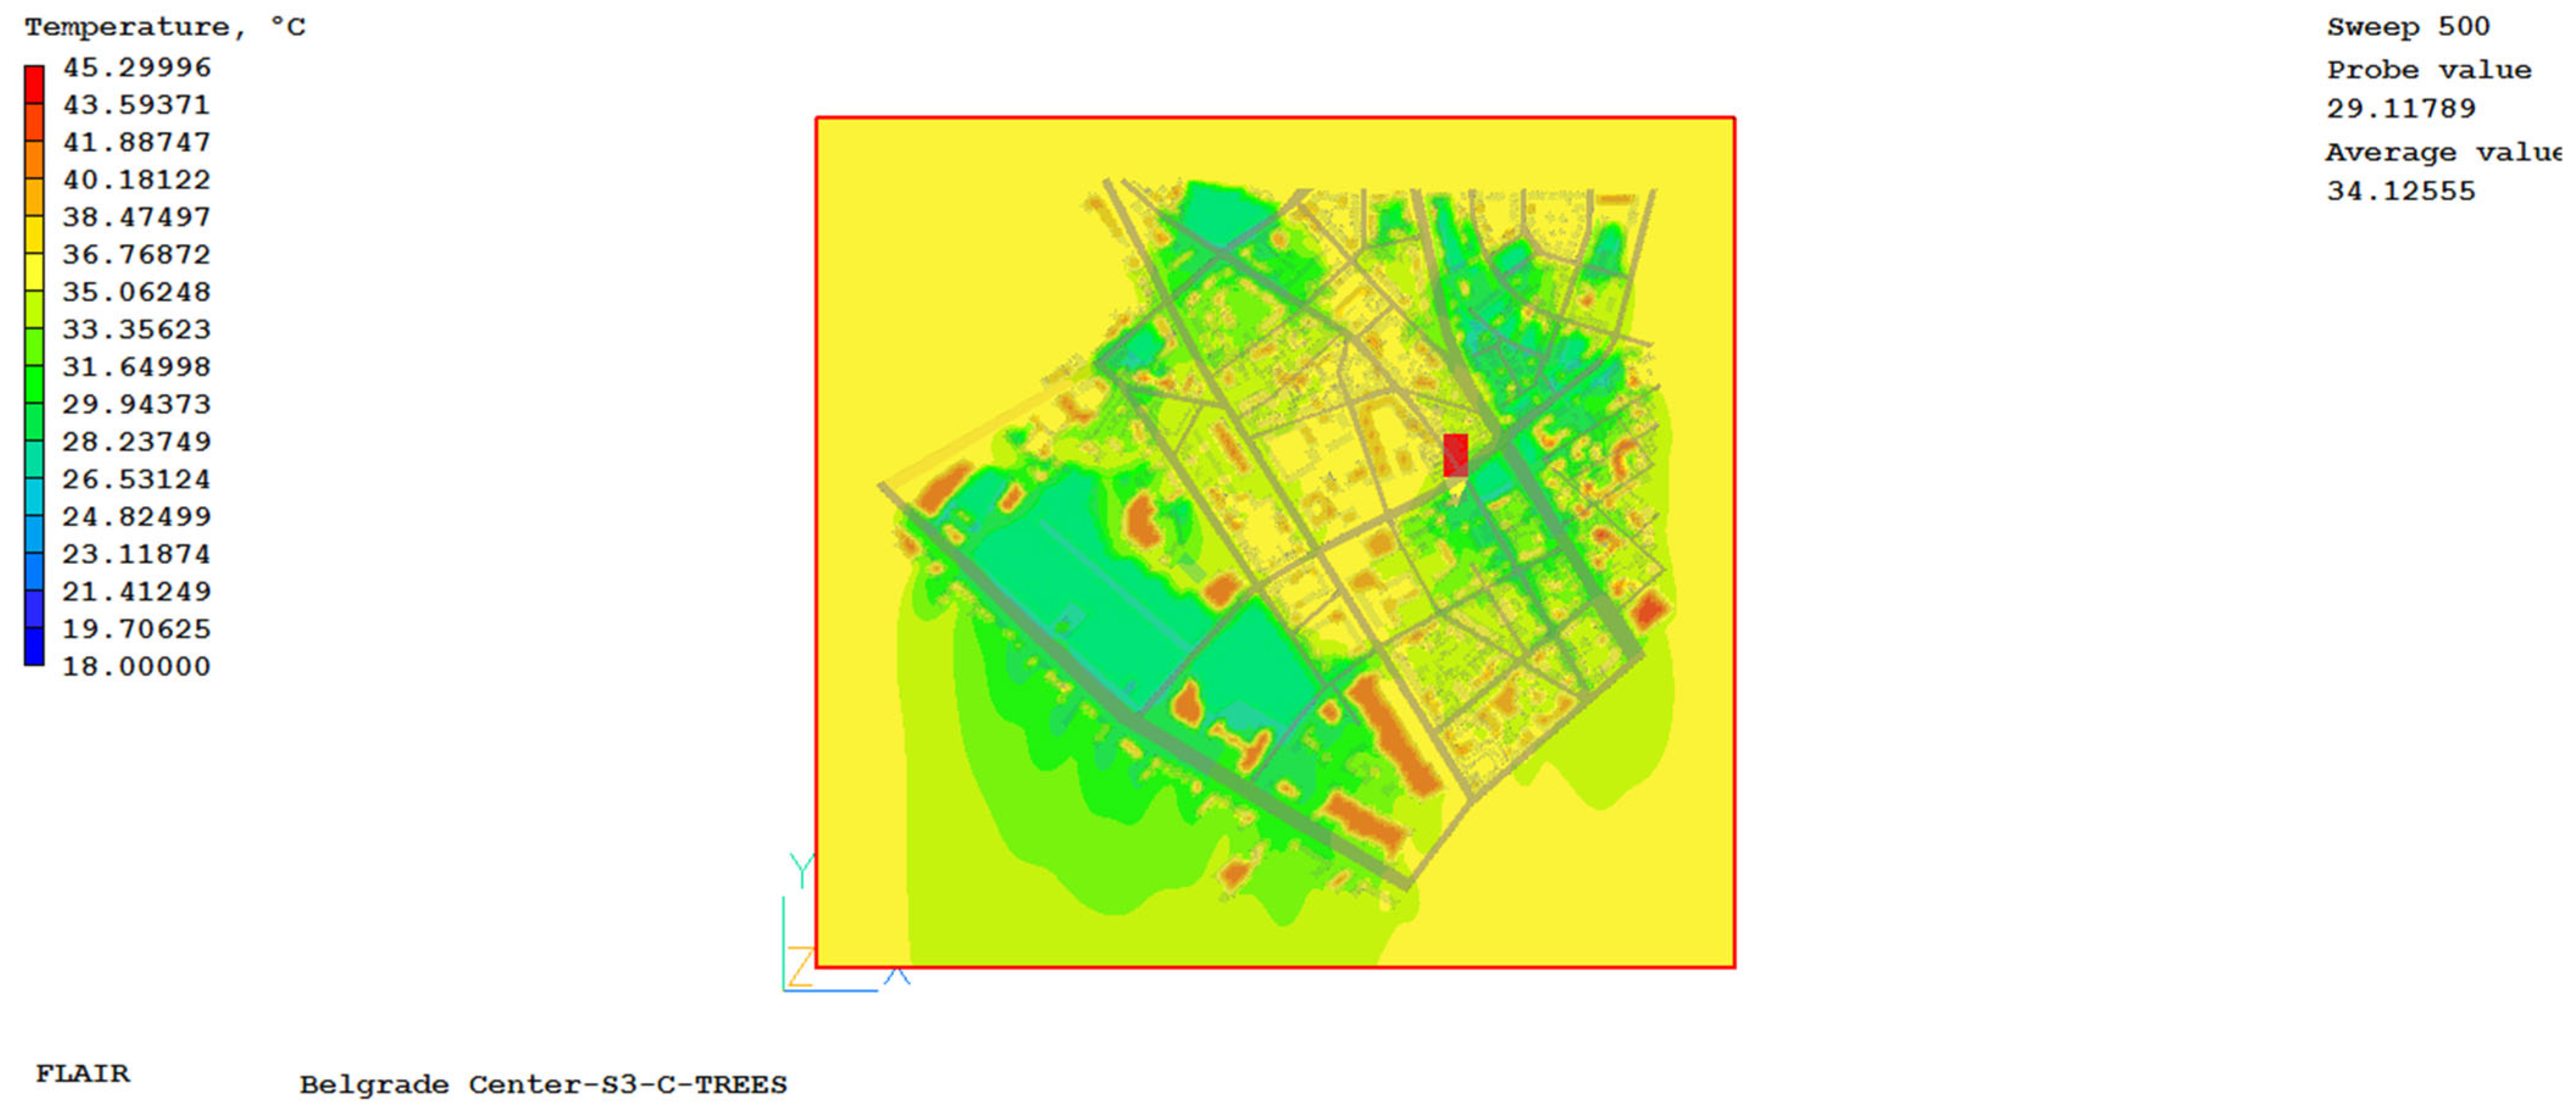
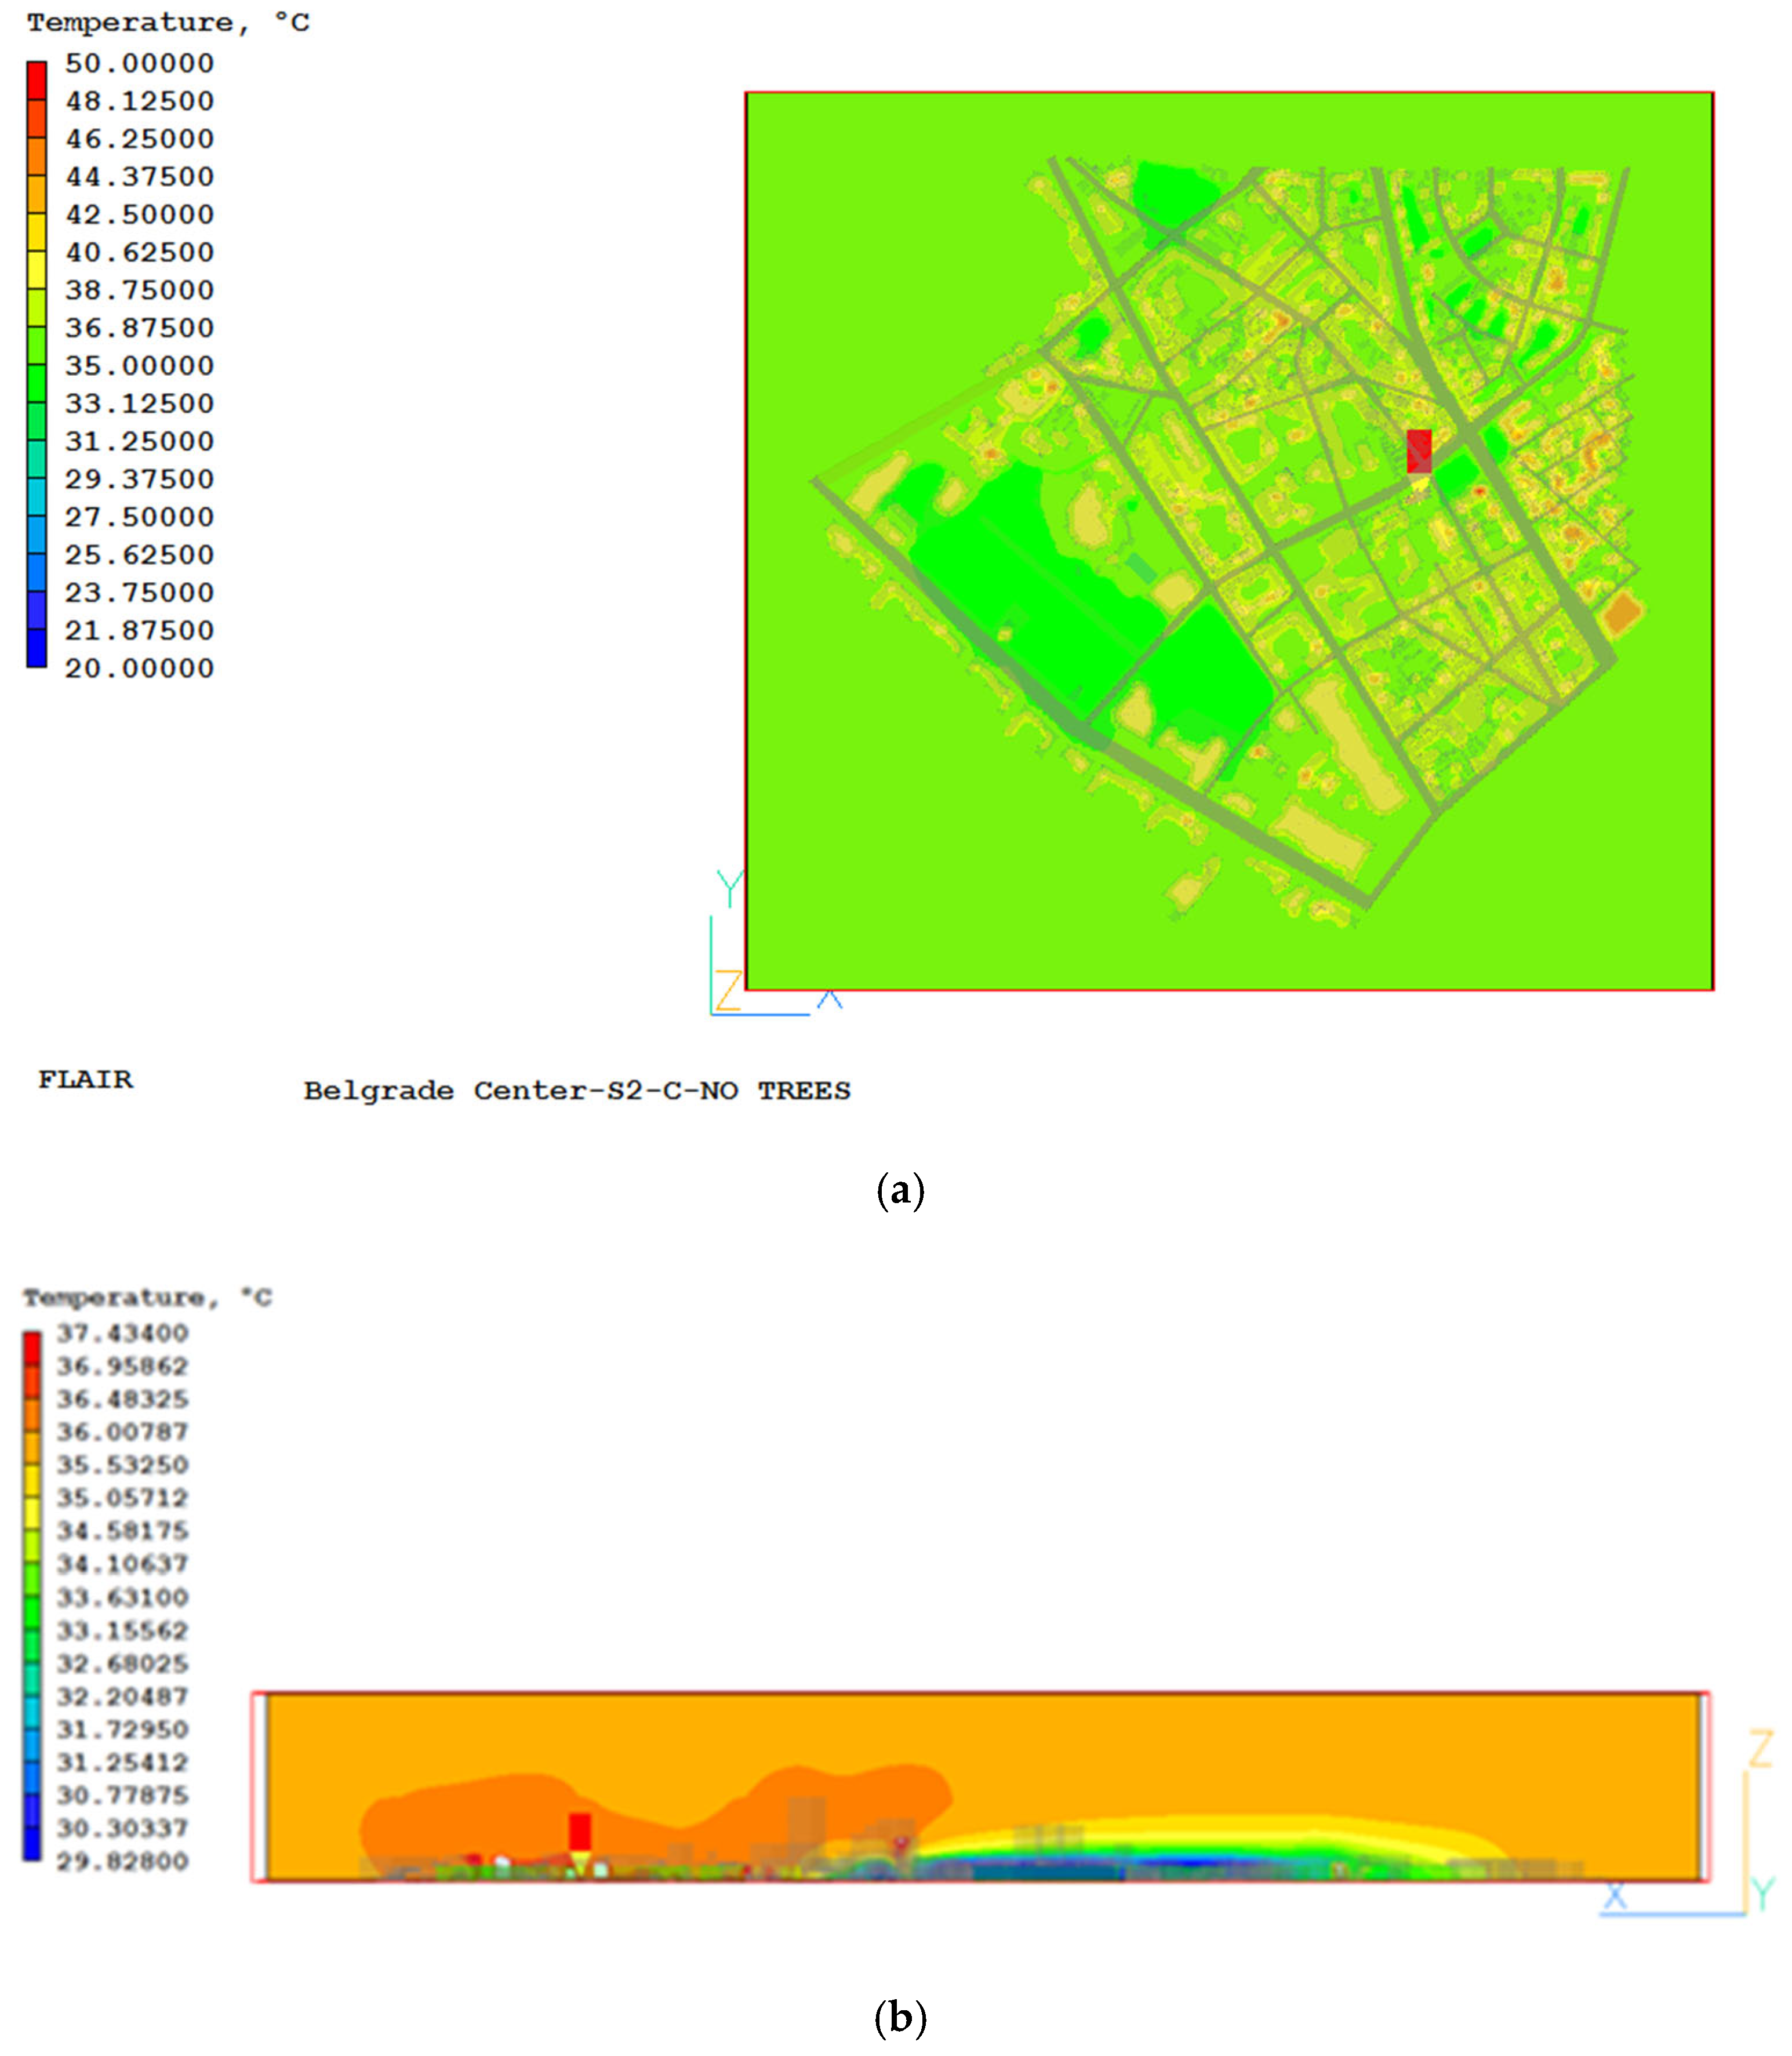
Figure 3 shows the air temperature field at a height of 1.85 m for the case S2-C-NO TREES.
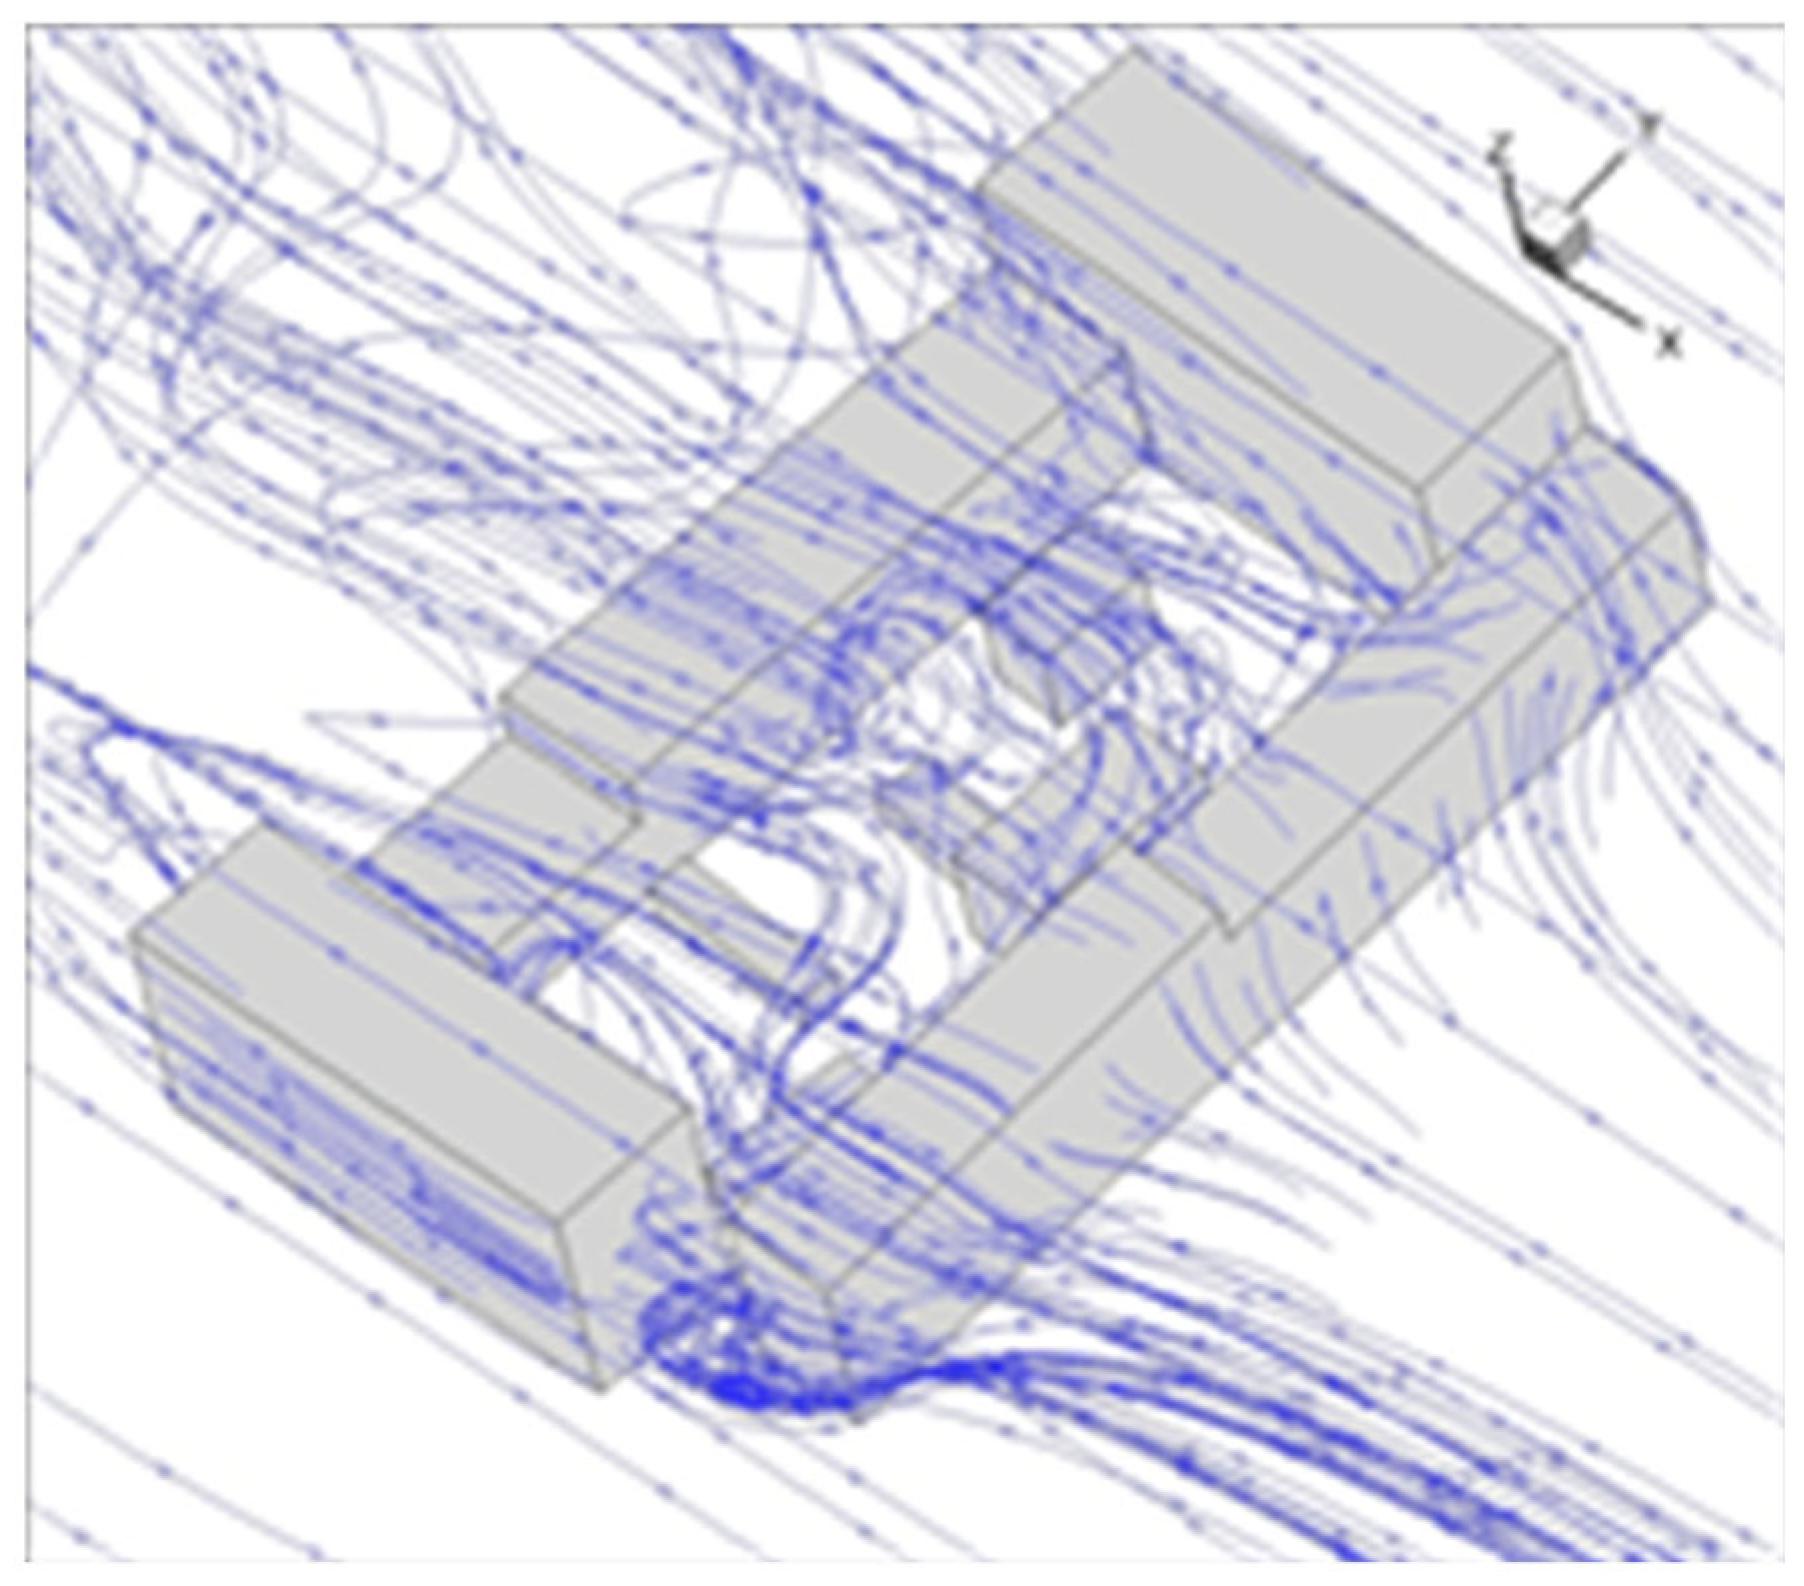
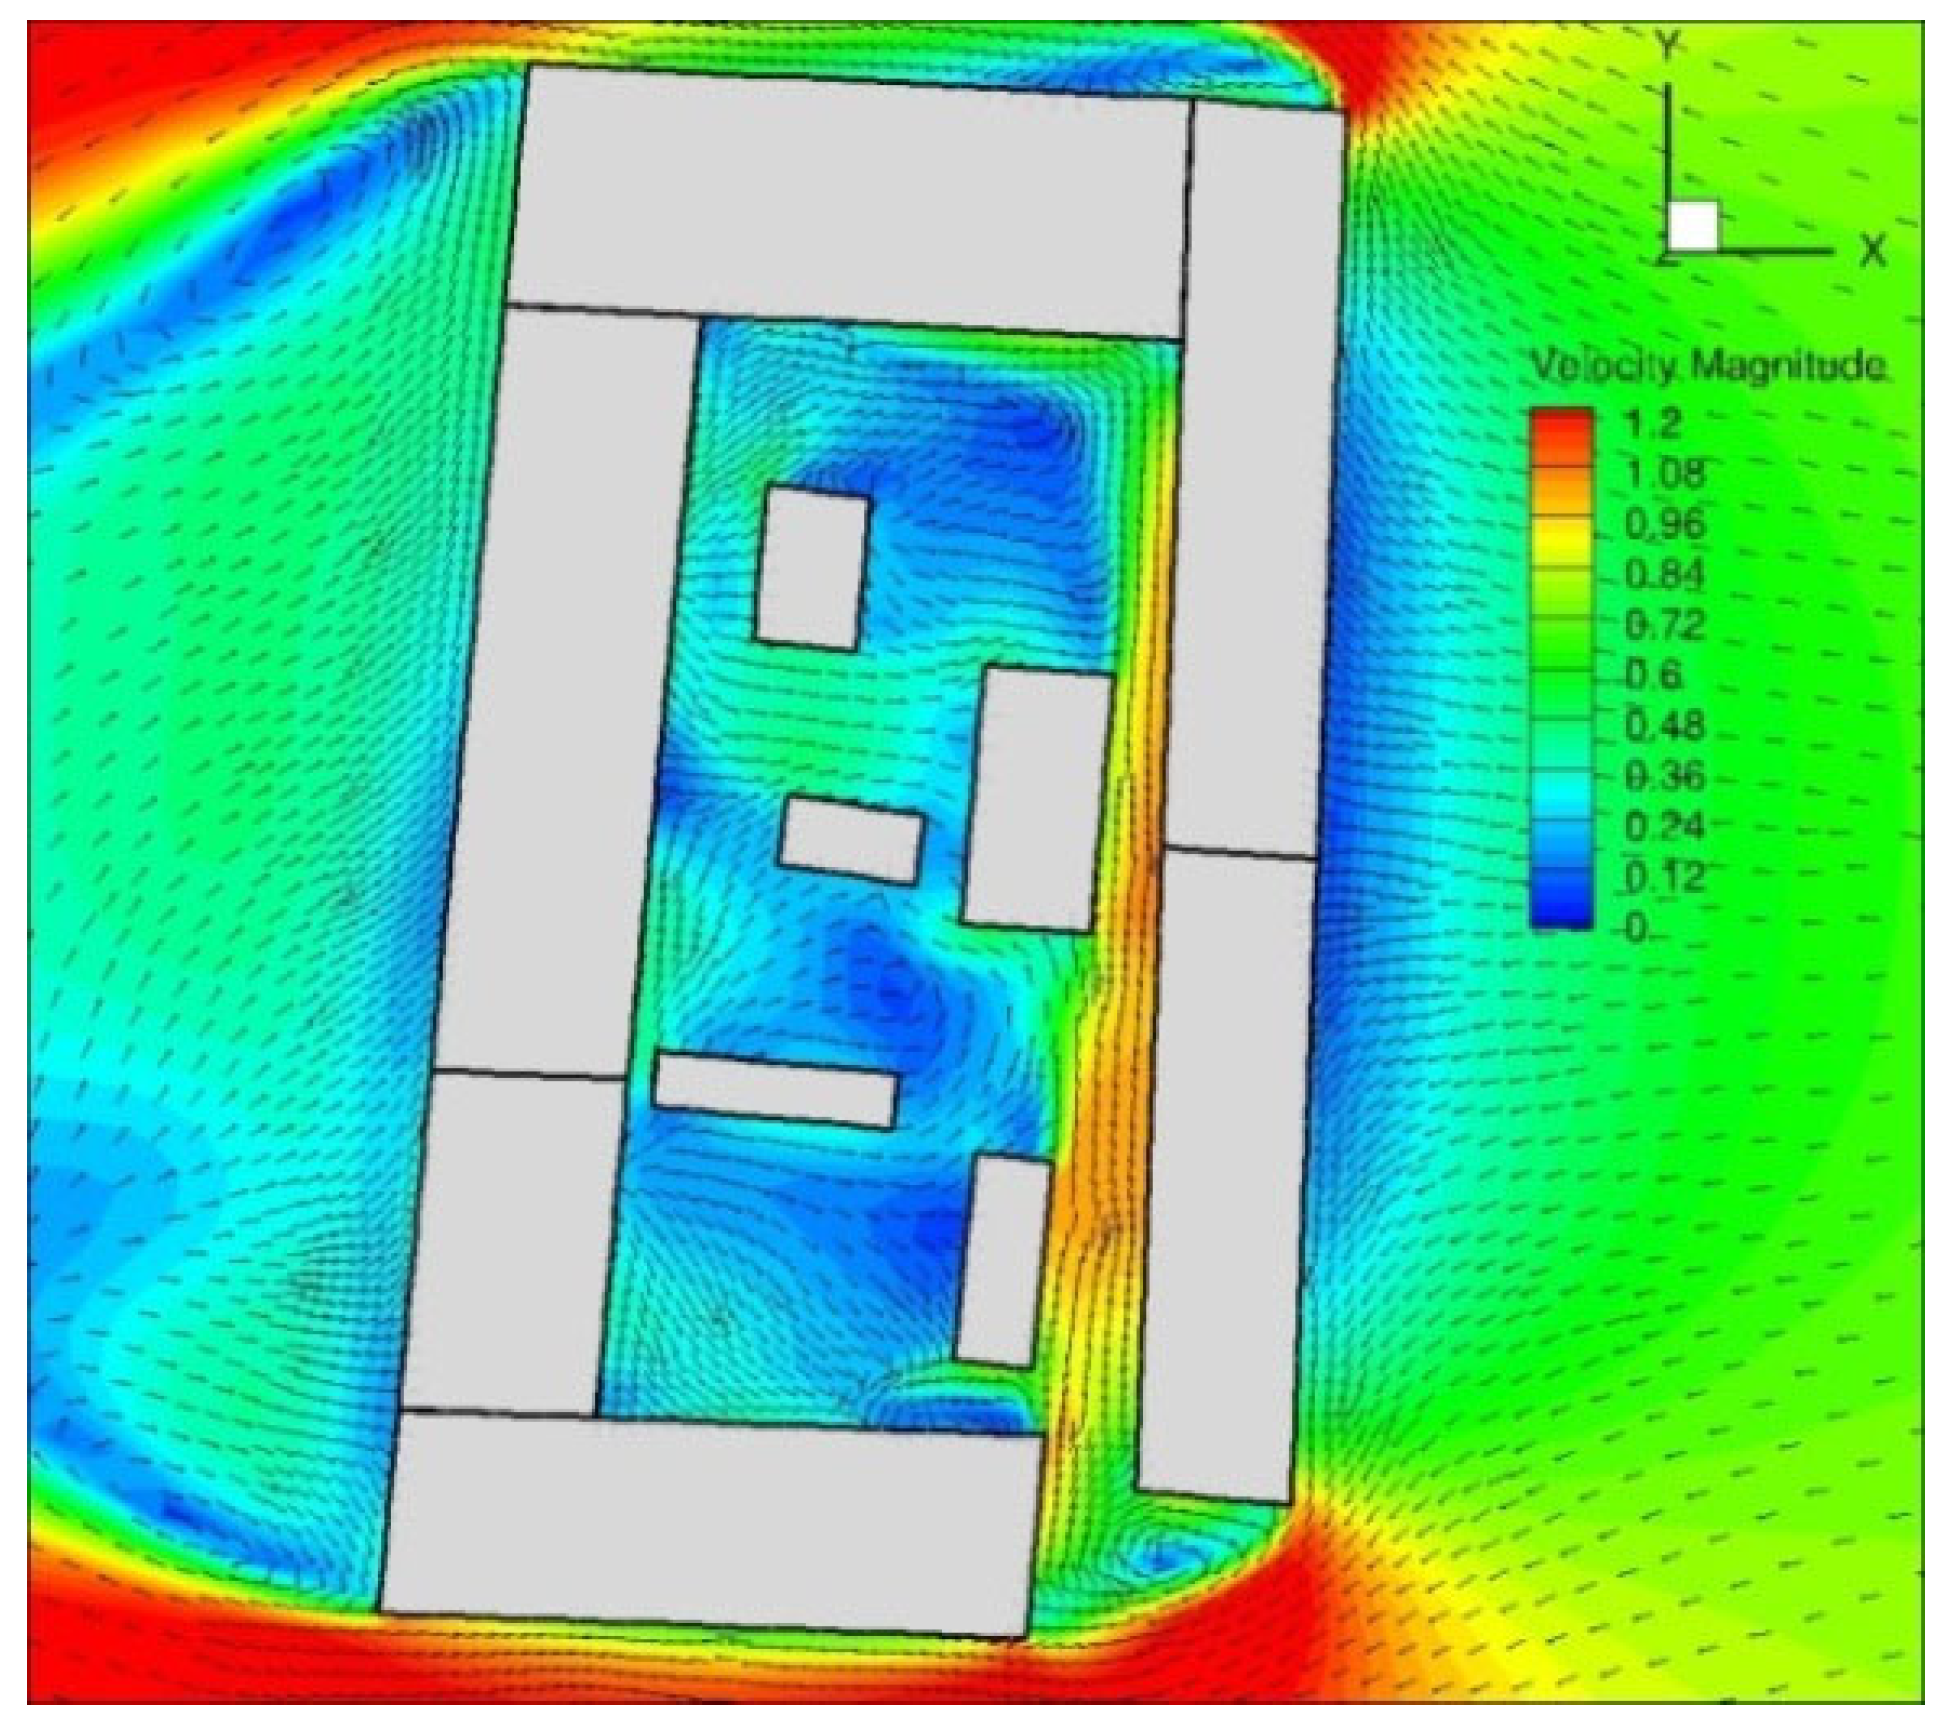
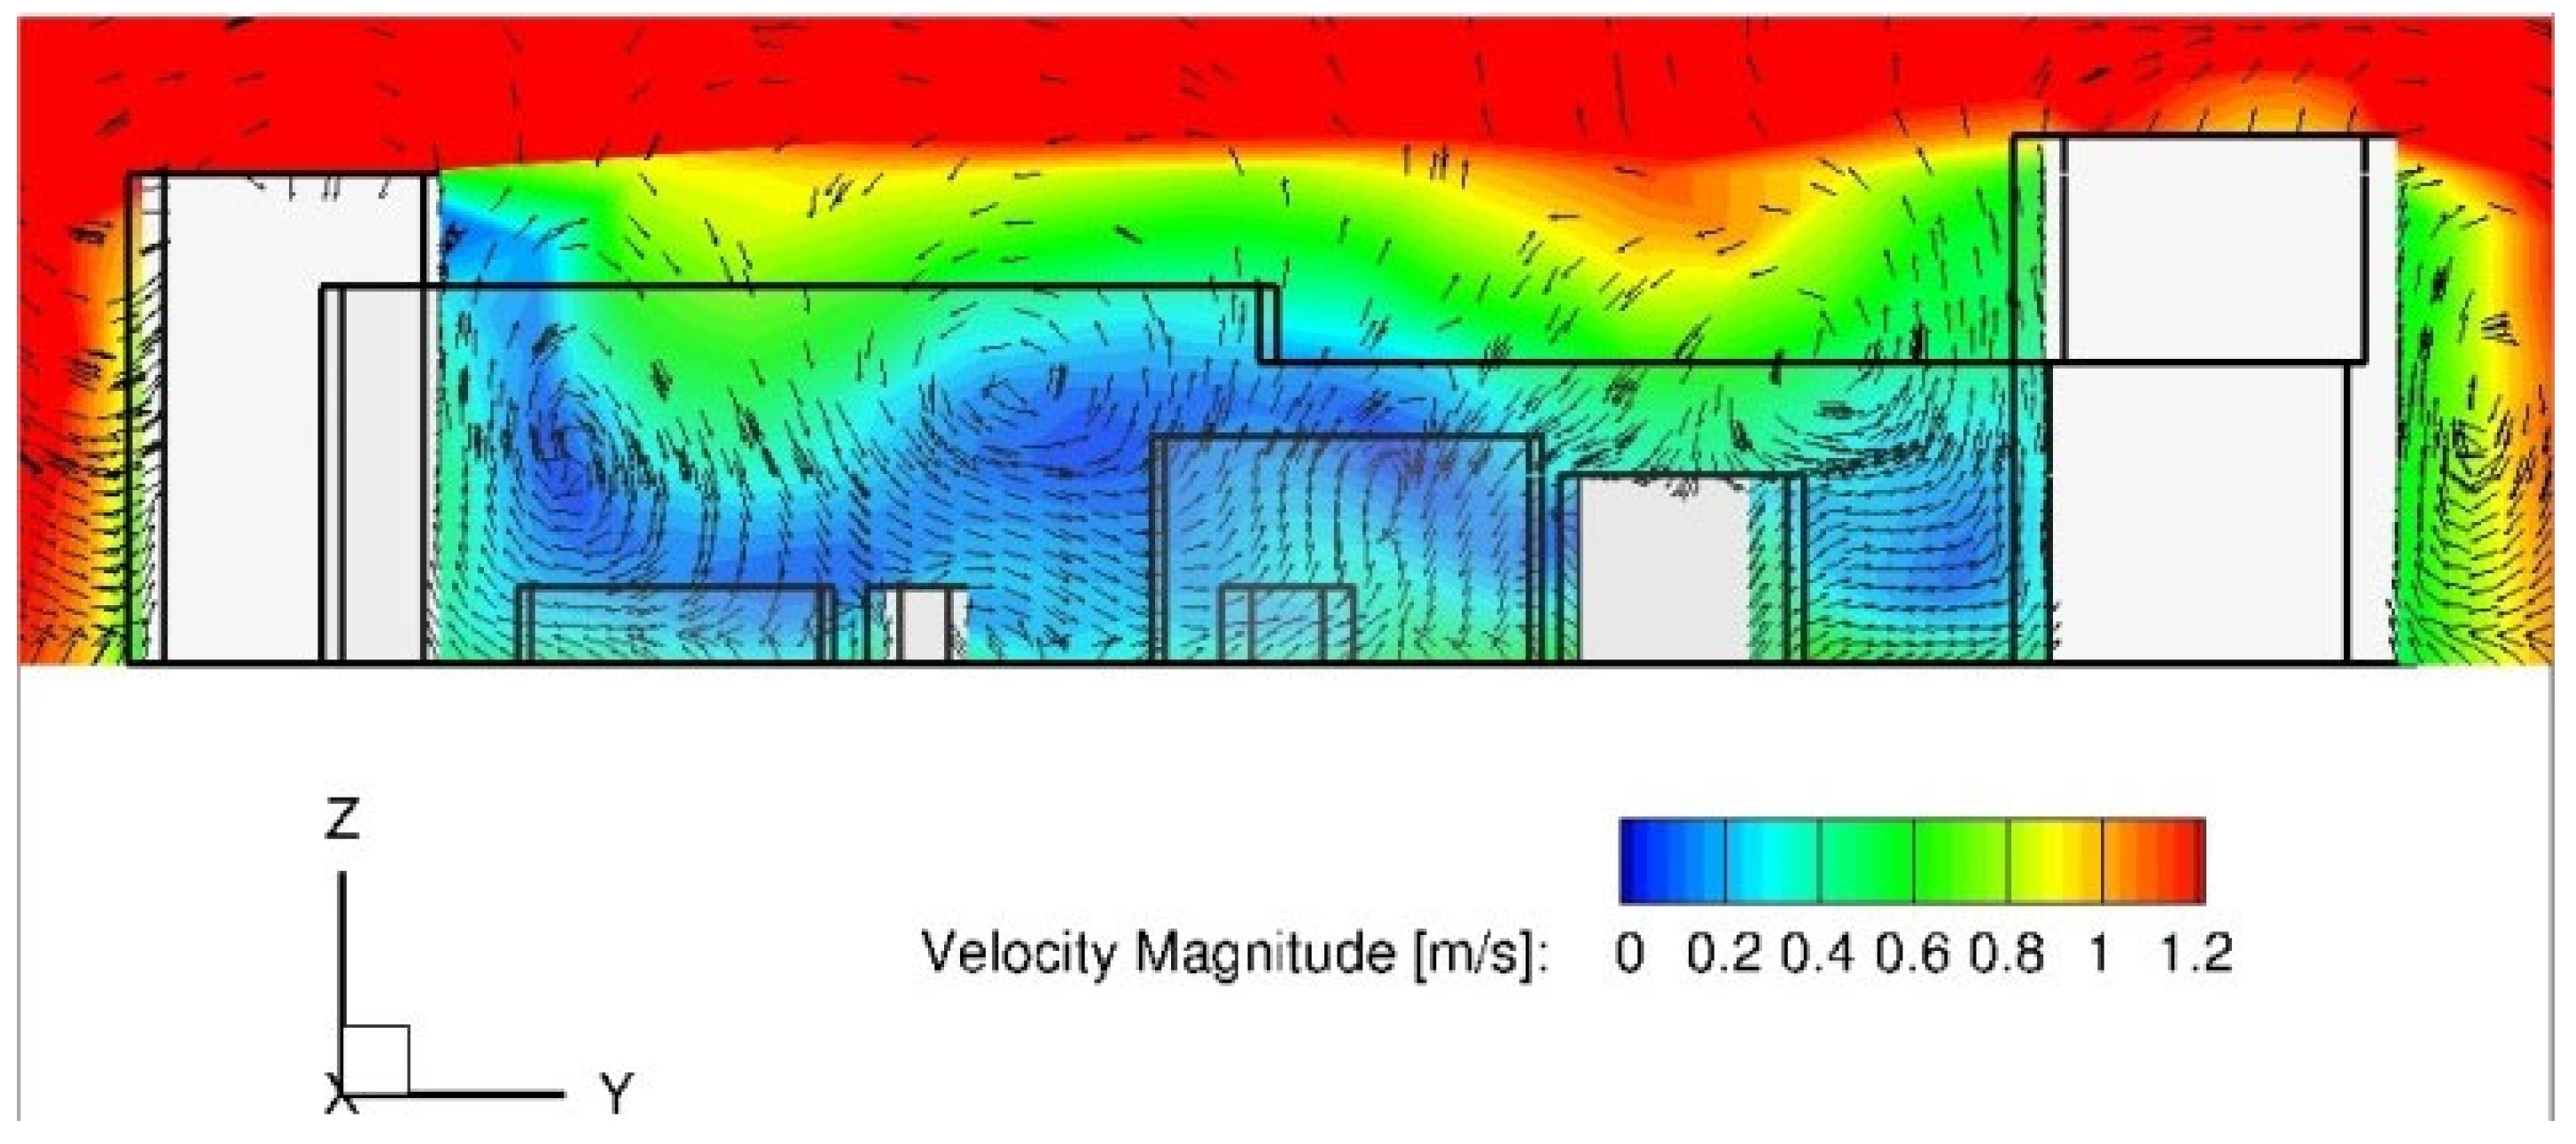
Given the good agreement between experimental and numerical results, the influence of wind on the local value of the external air temperature was analyzed using the example of a closed block of buildings from the observed urban environment, located in the immediate vicinity of a meteorological station placed on a school building. A detailed analysis of the flow field results inside a closed block of buildings showed that the negative effect leading to an increase in temperature in the blocks themselves is the appearance of quasi-stationary vortex structures. It has also been shown that the development of horizontal vortex zones is caused by the presence of lower buildings within a closed building block, as can be seen in
Figure A7,
Appendix C. Their presence intensifies heat transfer near ground level in such a way that when air comes into contact with the building envelope, convective heat transfer occurs from the wall to the air. Afterwards, the heat gained by transfer from the wall to the air is further transferred to the surface of the cavity opening where it mixes with the incoming cold air stream.
Figure A8,
Figure A9 and
Figure A10,
Appendix C show the occurrence of quasi-stationary vortex structures for the S2-C case.
4. Numerical Simulation Results
Based on numerical simulations, we obtained data on the spatial distribution of ambient air temperature, radiant air temperature, air velocity, spatial distribution of partial water vapor pressure, and carbon dioxide concentration for the observed urban area. Based on these data, the values of the UHII and the universal thermal climate index were calculated for all locations, both those where experimental meteorological measurements were made and those where they were not. A representative example is a numerical simulation for 5 July 2015, which is one of the two hottest days for three different periods of the day, divided into 3 cases: case S1 covering the period from 8 to 9 a.m., case S2 covering the afternoon period from 2 to 3 p.m., and case S3 covering the pre-evening part of the day, i.e., the period from 6 to 7 p.m.
This temperature increase of 1.5 °C to 3 °C represents the net result of several interconnected physical processes that were not individually quantified in this study. The model inherently accounts for changes in radiative heat transfer (shading) and surface properties. However, the current analysis does not isolate the specific thermal contribution of evapotranspiration from that of shading or altered air mixing (natural ventilation). Therefore, the observed temperature rise should be interpreted as a consequence of their combined influence.
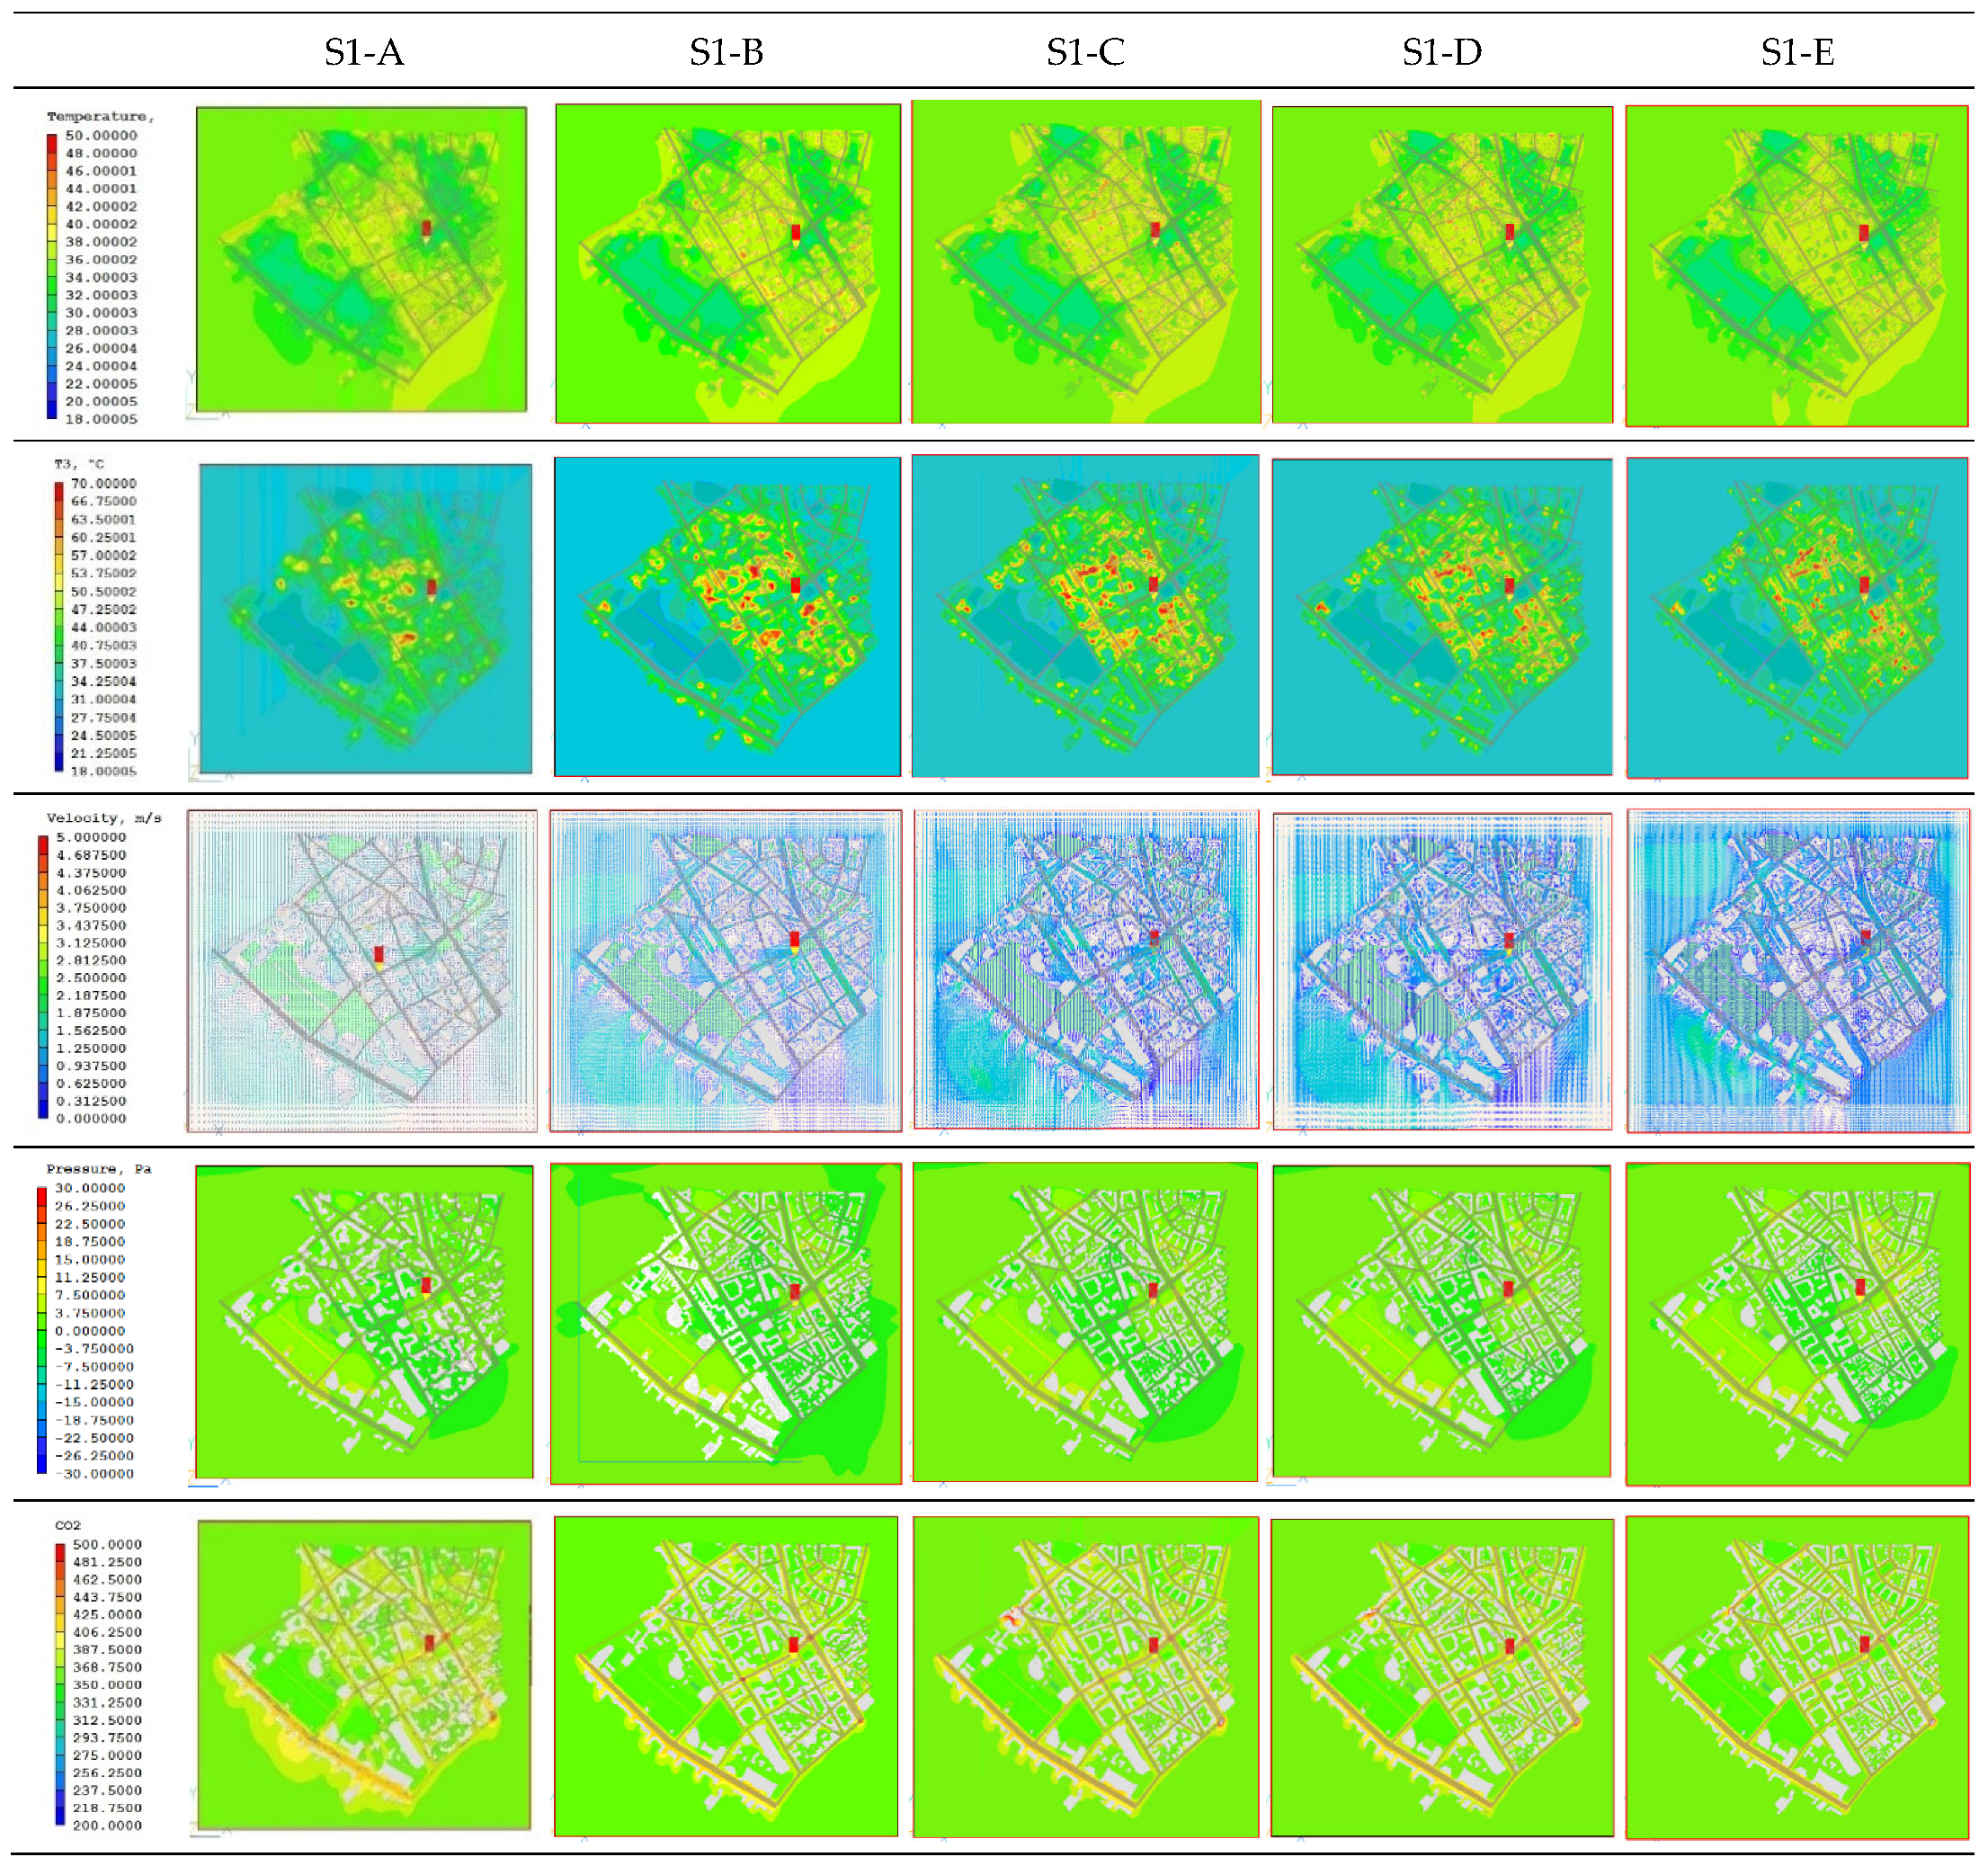
The grid independence study was performed for case S1, for 5 numerical grids that were classified by fineness (number of finite volumes) into the following cases: S1-A consisting of 430,000 finite volumes, S1-B consisting of 1,232,622 finite volumes, S1-C consisting of 2,167,500 finite volumes, S1-D consisting of 3,244,032 finite volumes, and S1-E consisting of 7,161,165 finite volumes. Based on the analysis of all the obtained results, the S1-C network was adopted for further calculation and research. The main reason for choosing this grid is that compared to the S1-D and S1-E grids, the results differ by less than 1%, and the time required for solution convergence is significantly shorter, while the differences in the results are negligibly small, as highlighted.
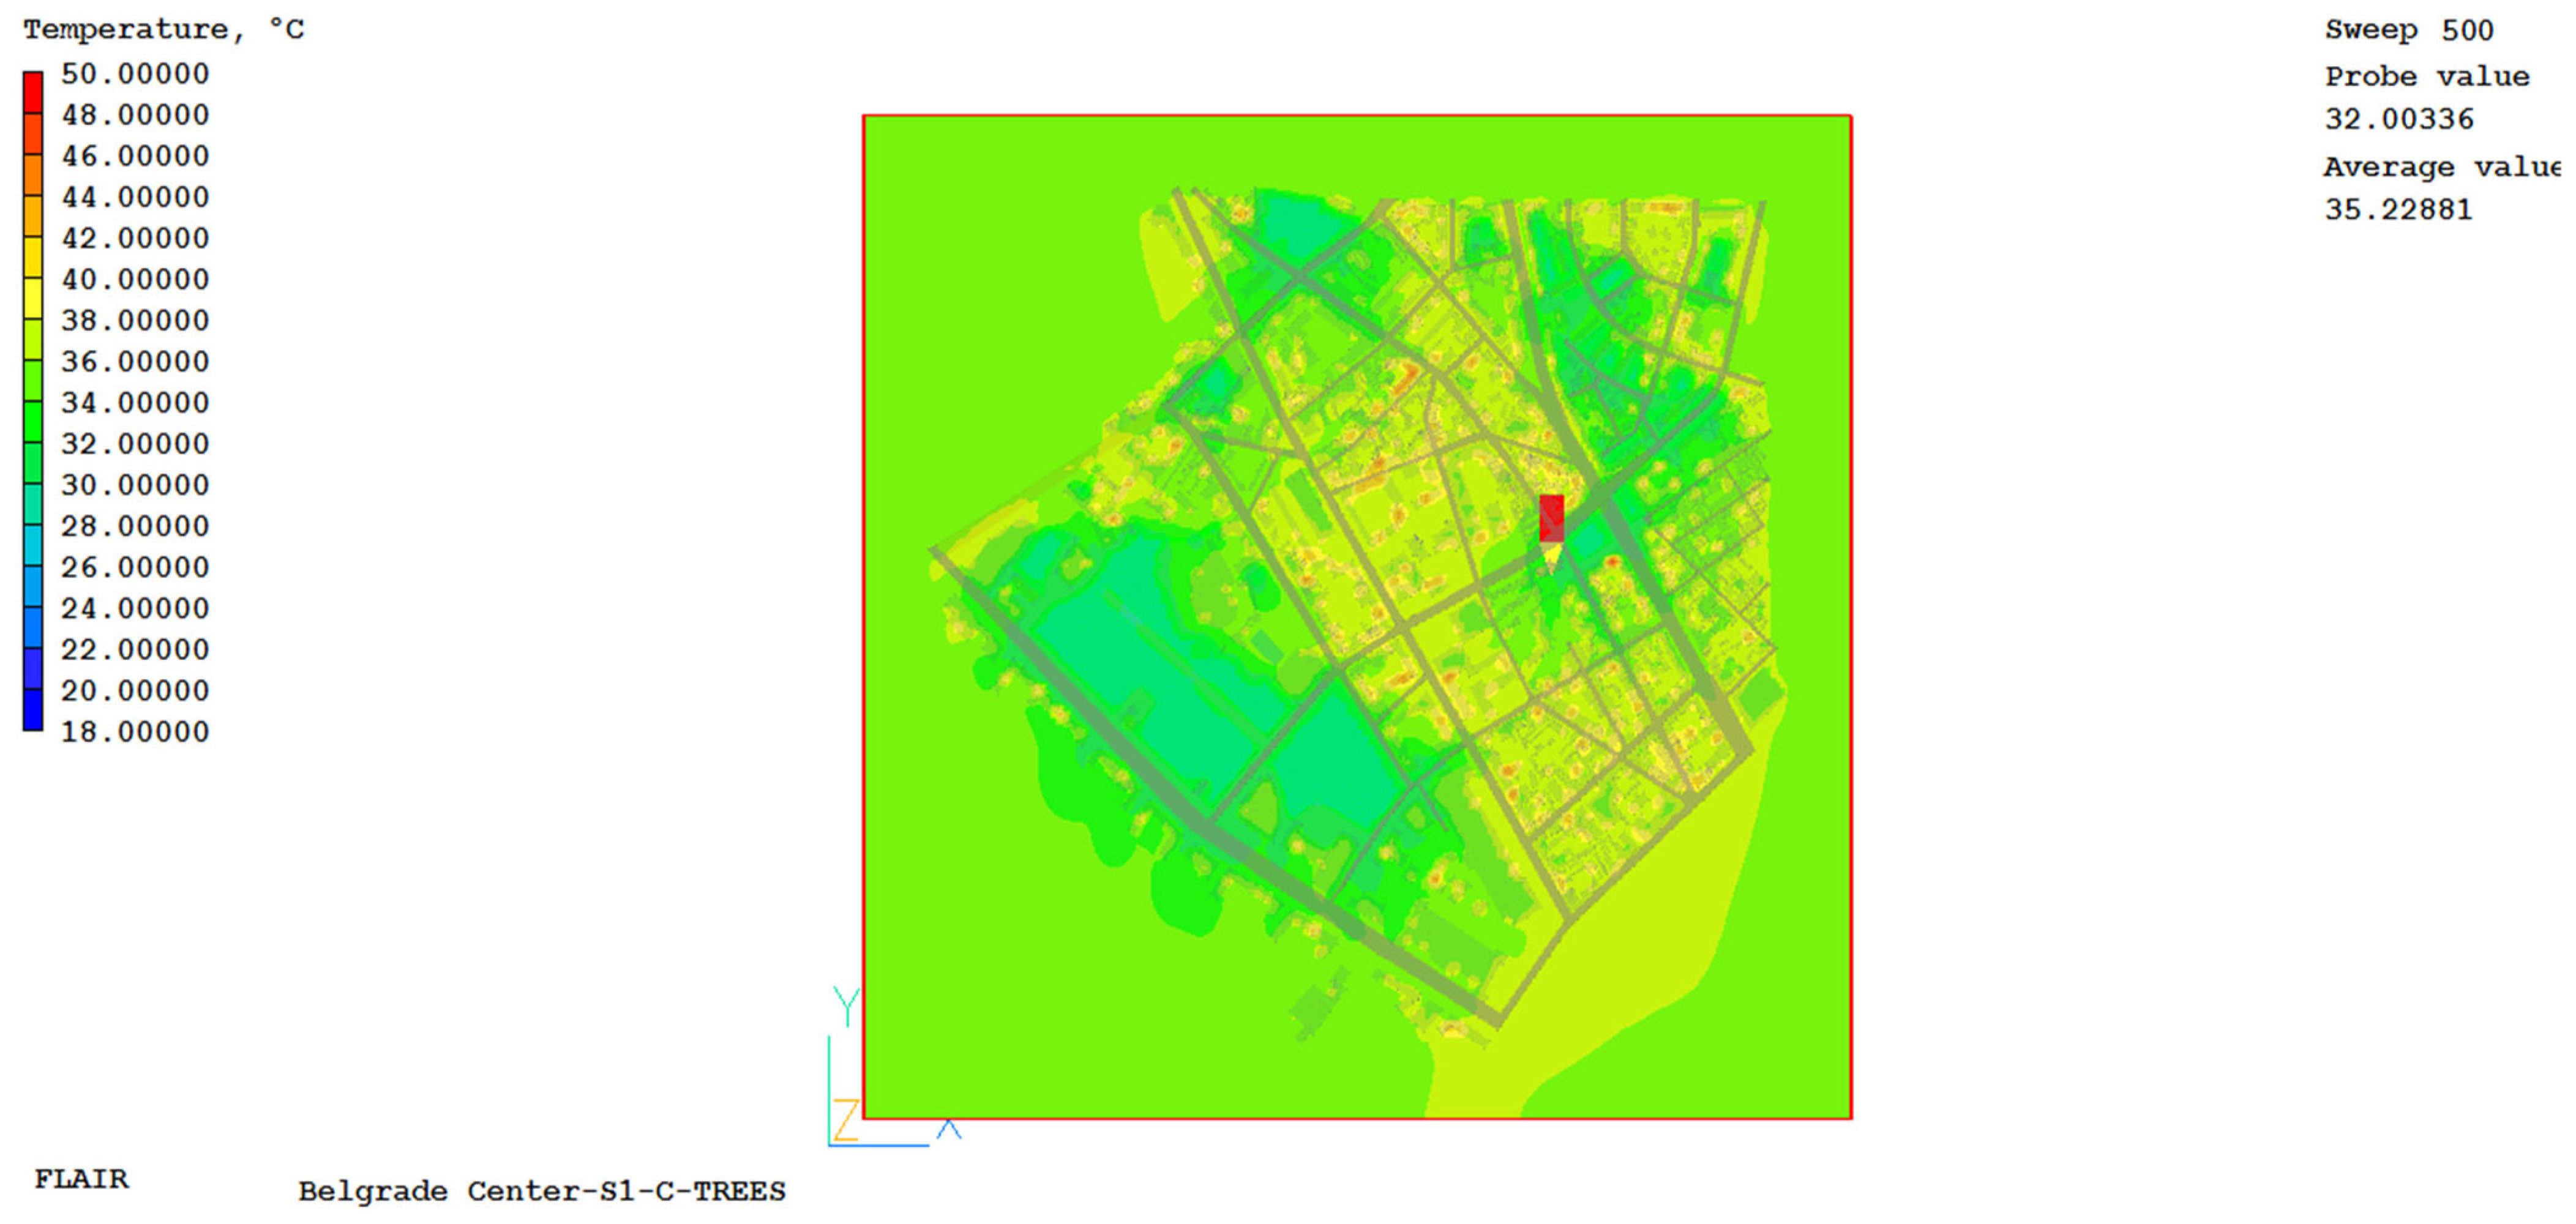
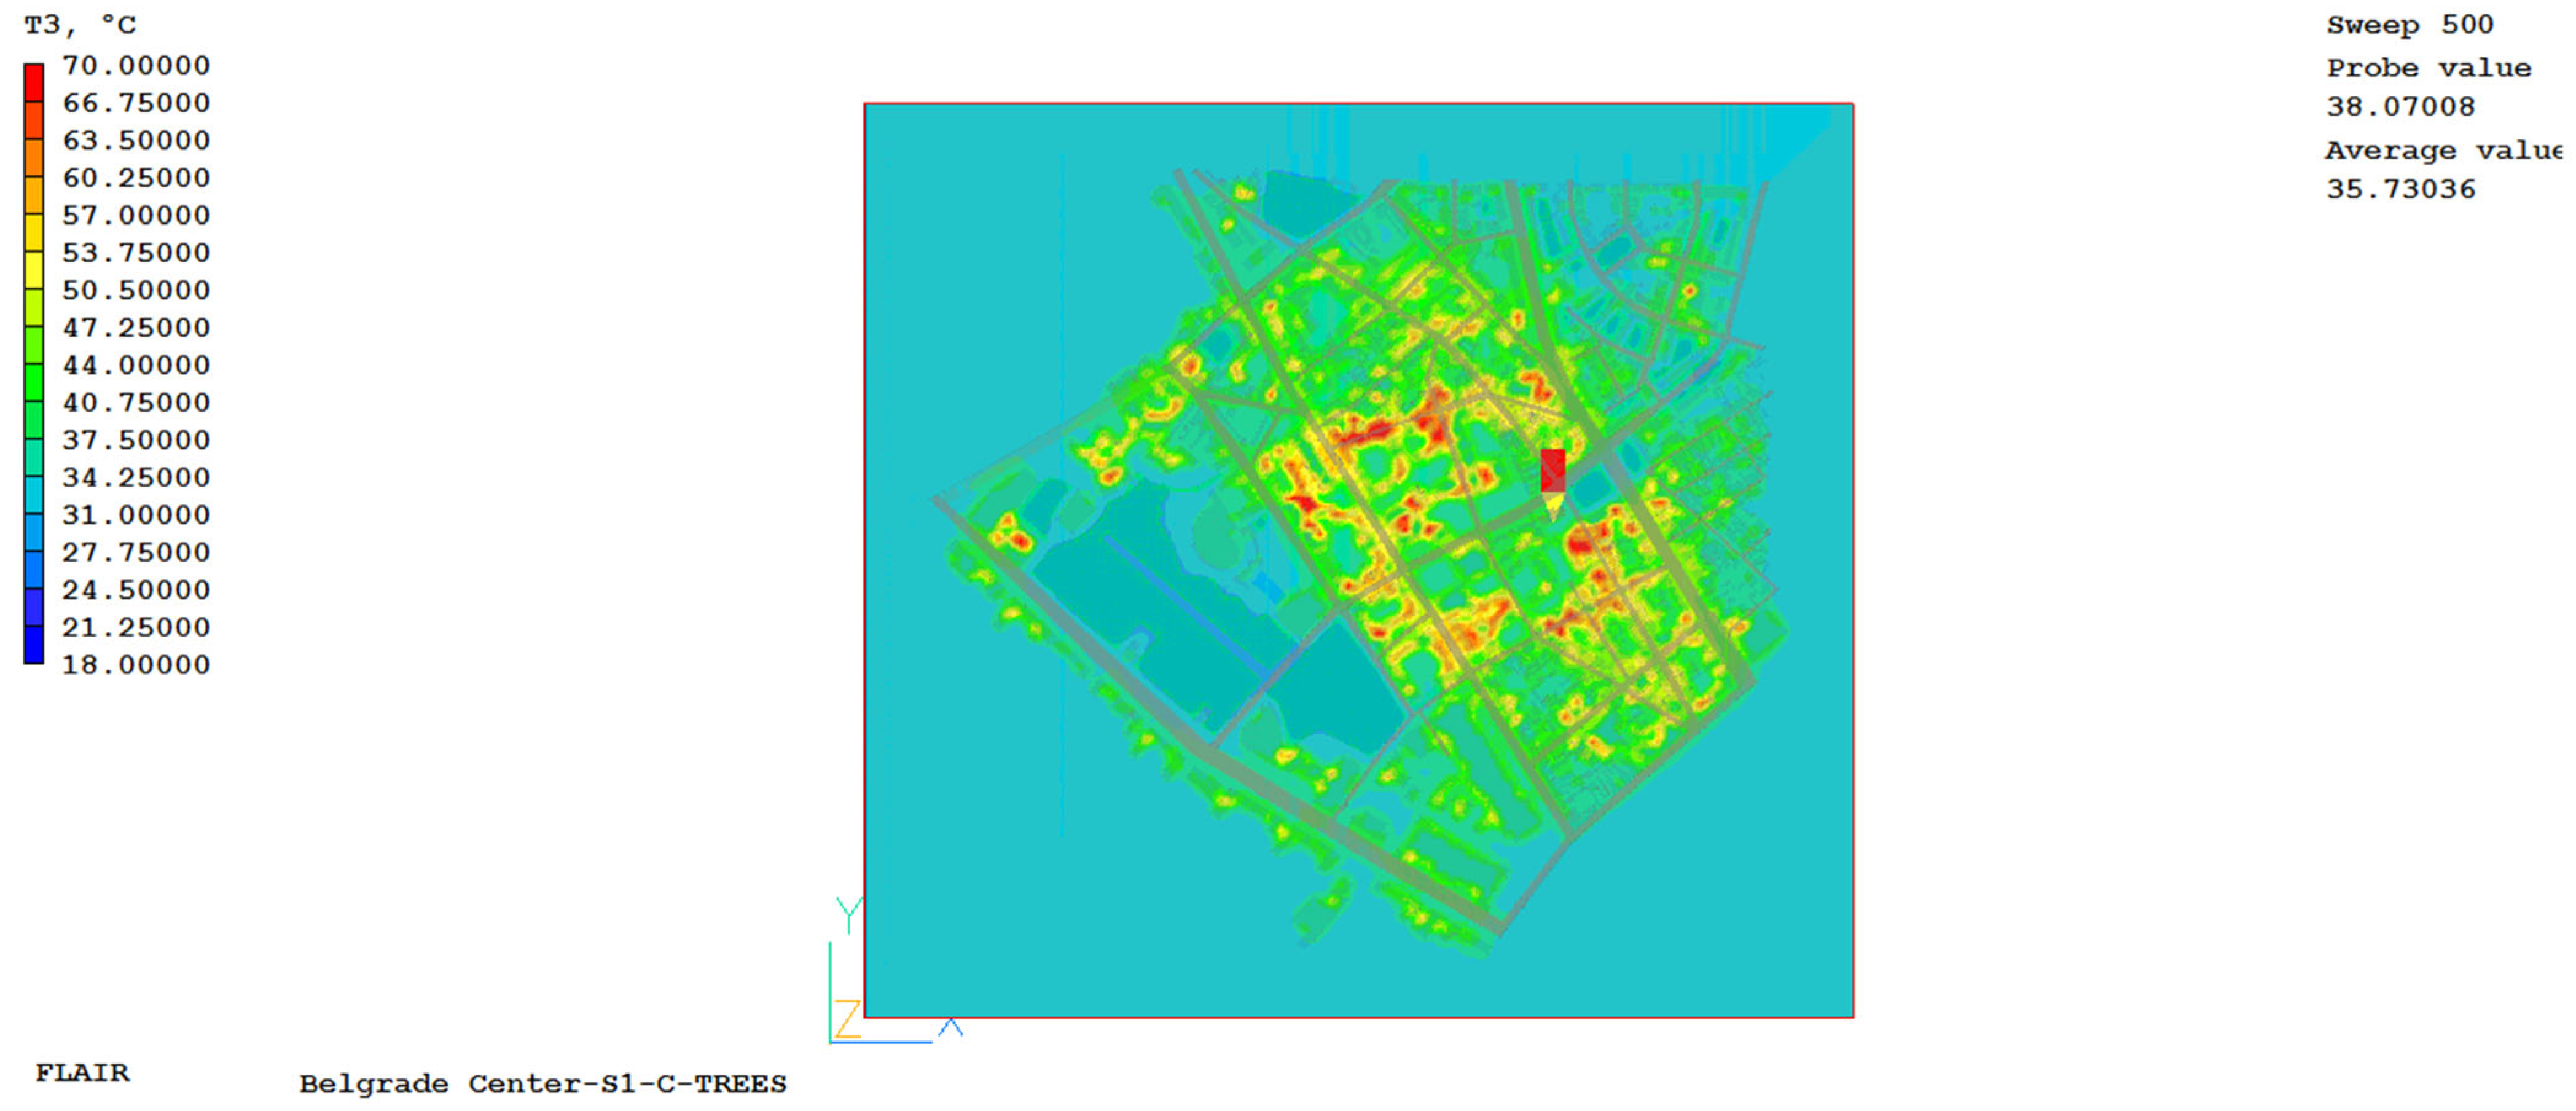
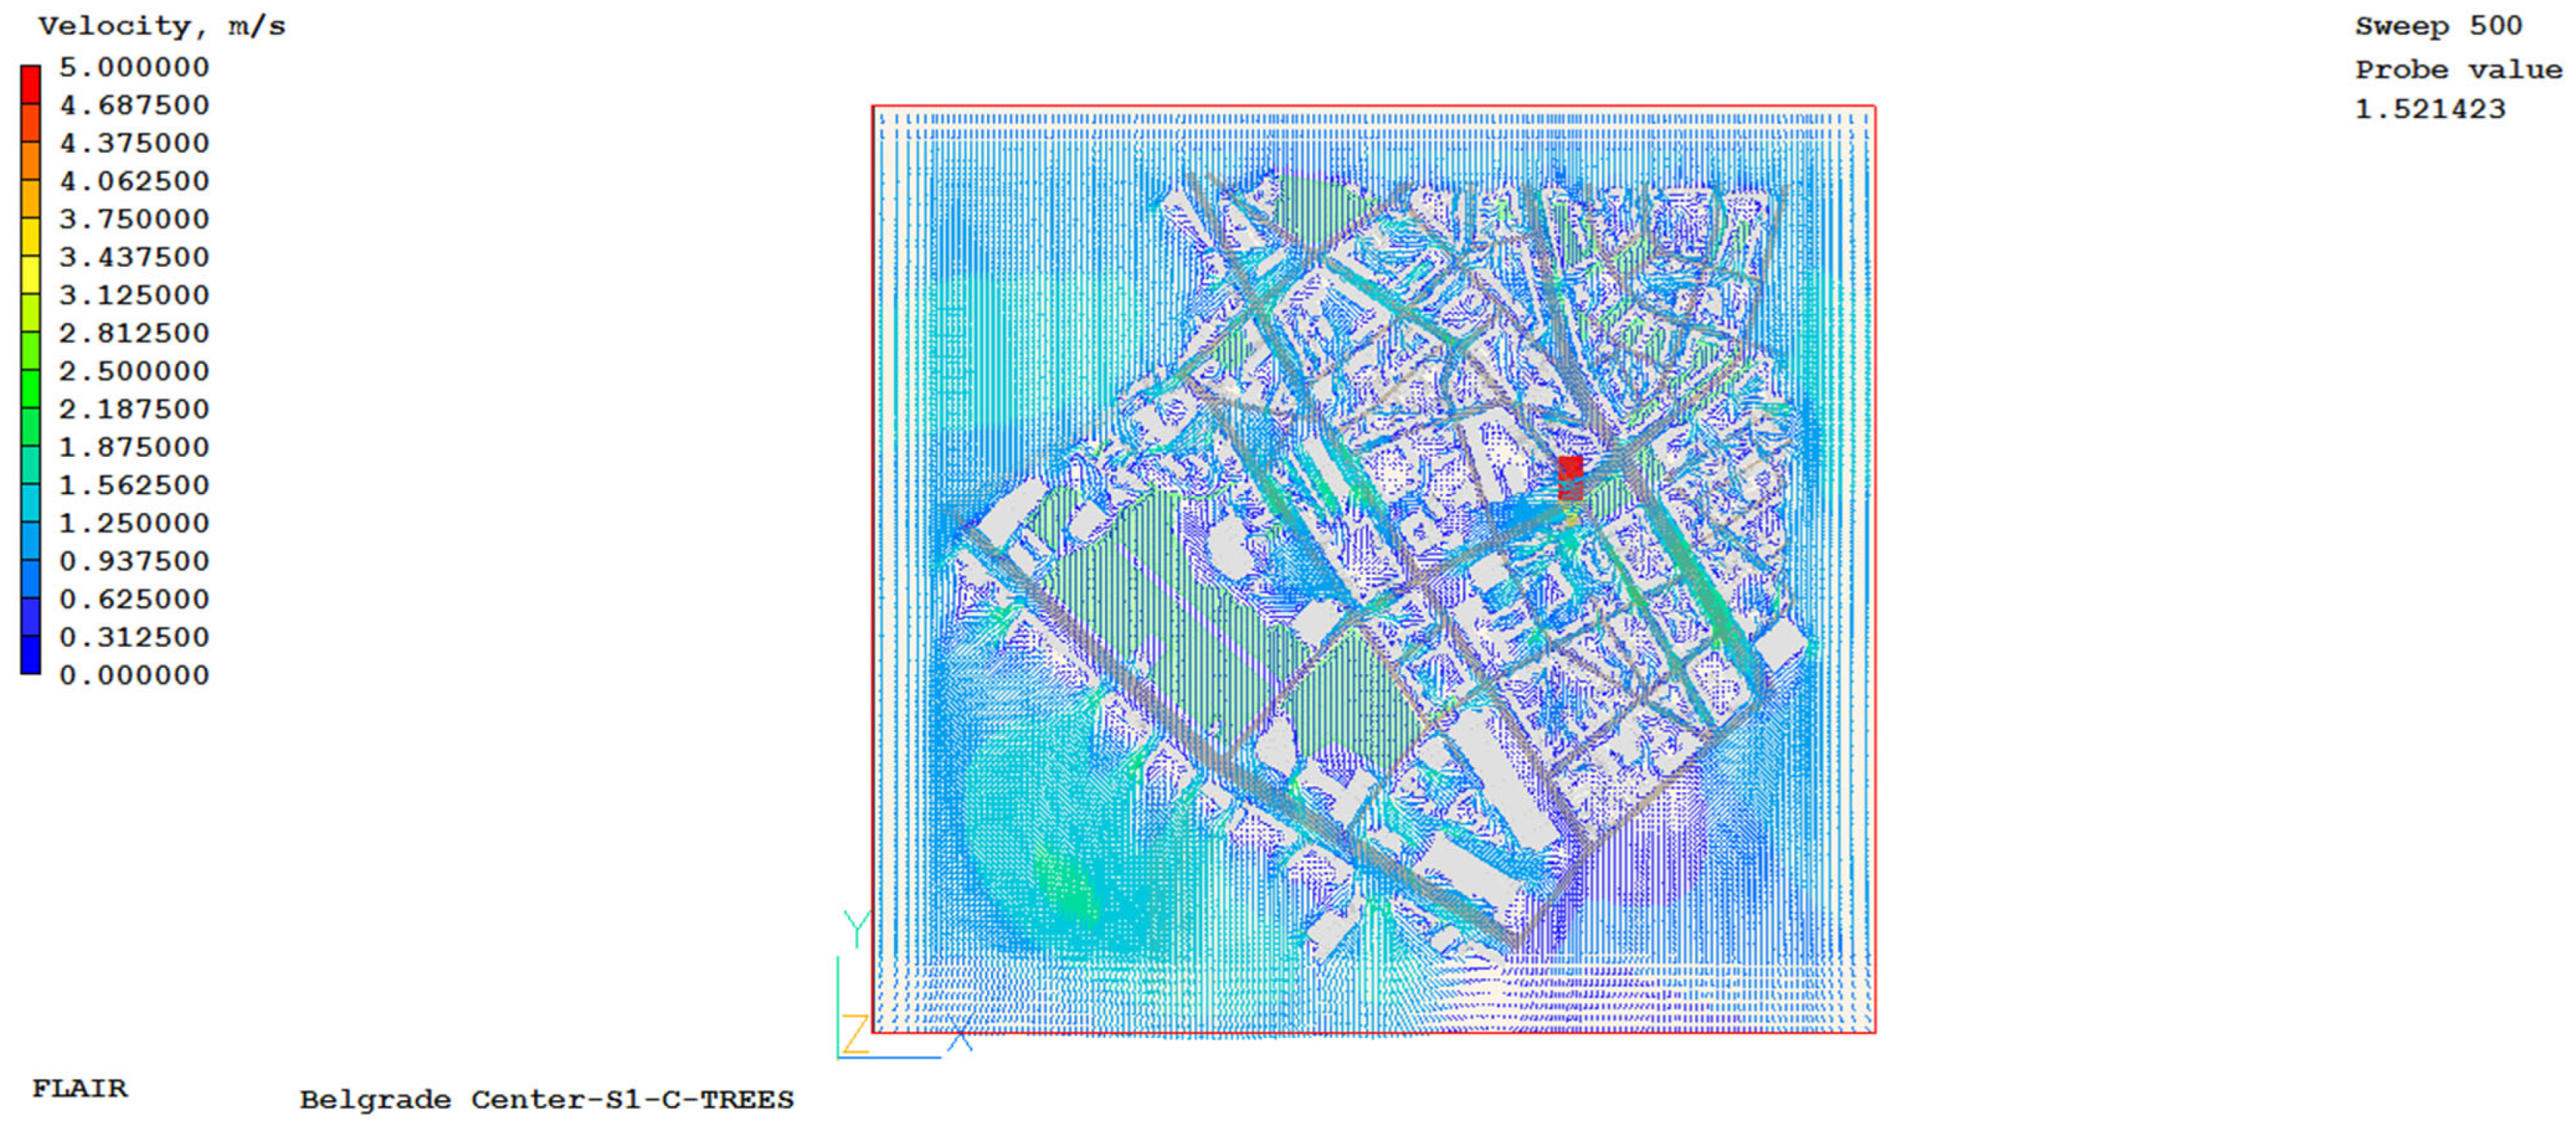
The values of ambient air temperature, radiant air temperature, air velocity, partial water vapor pressure, and carbon dioxide concentration at five control points, obtained by numerical simulations after 500 iterations, are shown in
Table A5,
Table A6,
Table A7,
Table A8 and
Table A9,
Appendix D. The control points coincided with the places where experimental measurements of the mentioned meteorological quantities were made. A graphical representation of the results obtained from numerical simulations for case S1, differing in numerical grid density, is shown in
Figure A13,
Appendix D. Given that the average height at which experimental measurements of meteorological quantities were made was 1.85 m, the results of numerical simulations are shown for the horizontal plane at this height.
Table A10,
Table A11 and
Table A12,
Appendix E, show the obtained results from numerical simulations for different time periods in the morning (S1), afternoon (S2) and evening (S3), using a grid with 2,167,500 final volumes. In addition to these values, the tables also show the universal thermal climate index values and the heat load value for different categories of people.
Figure A14,
Figure A15,
Figure A16,
Figure A17 and
Figure A18,
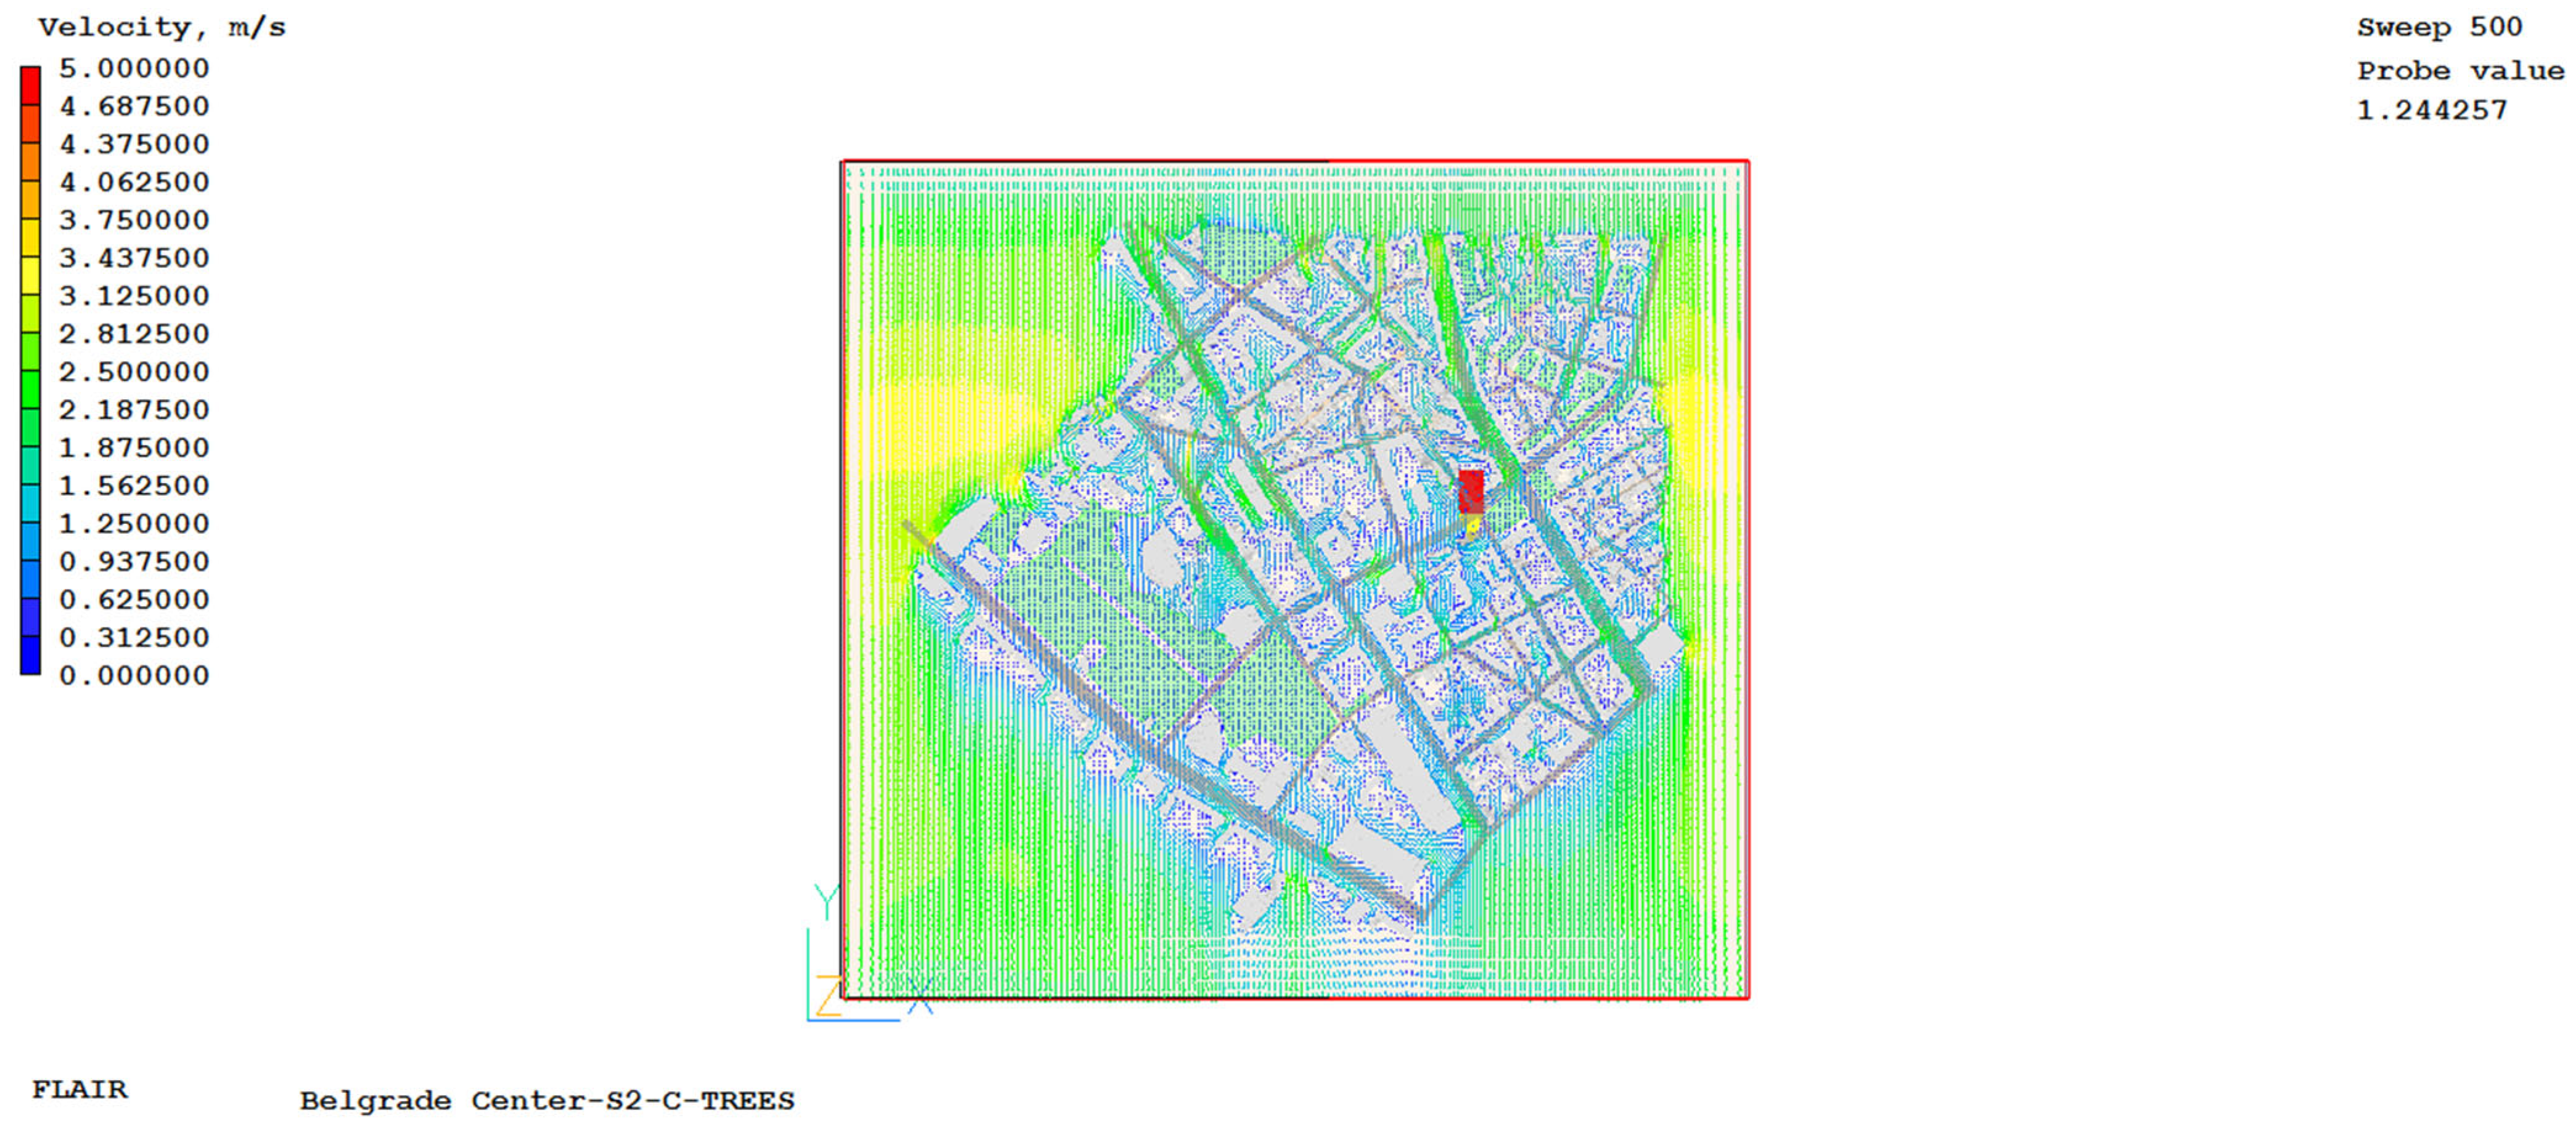
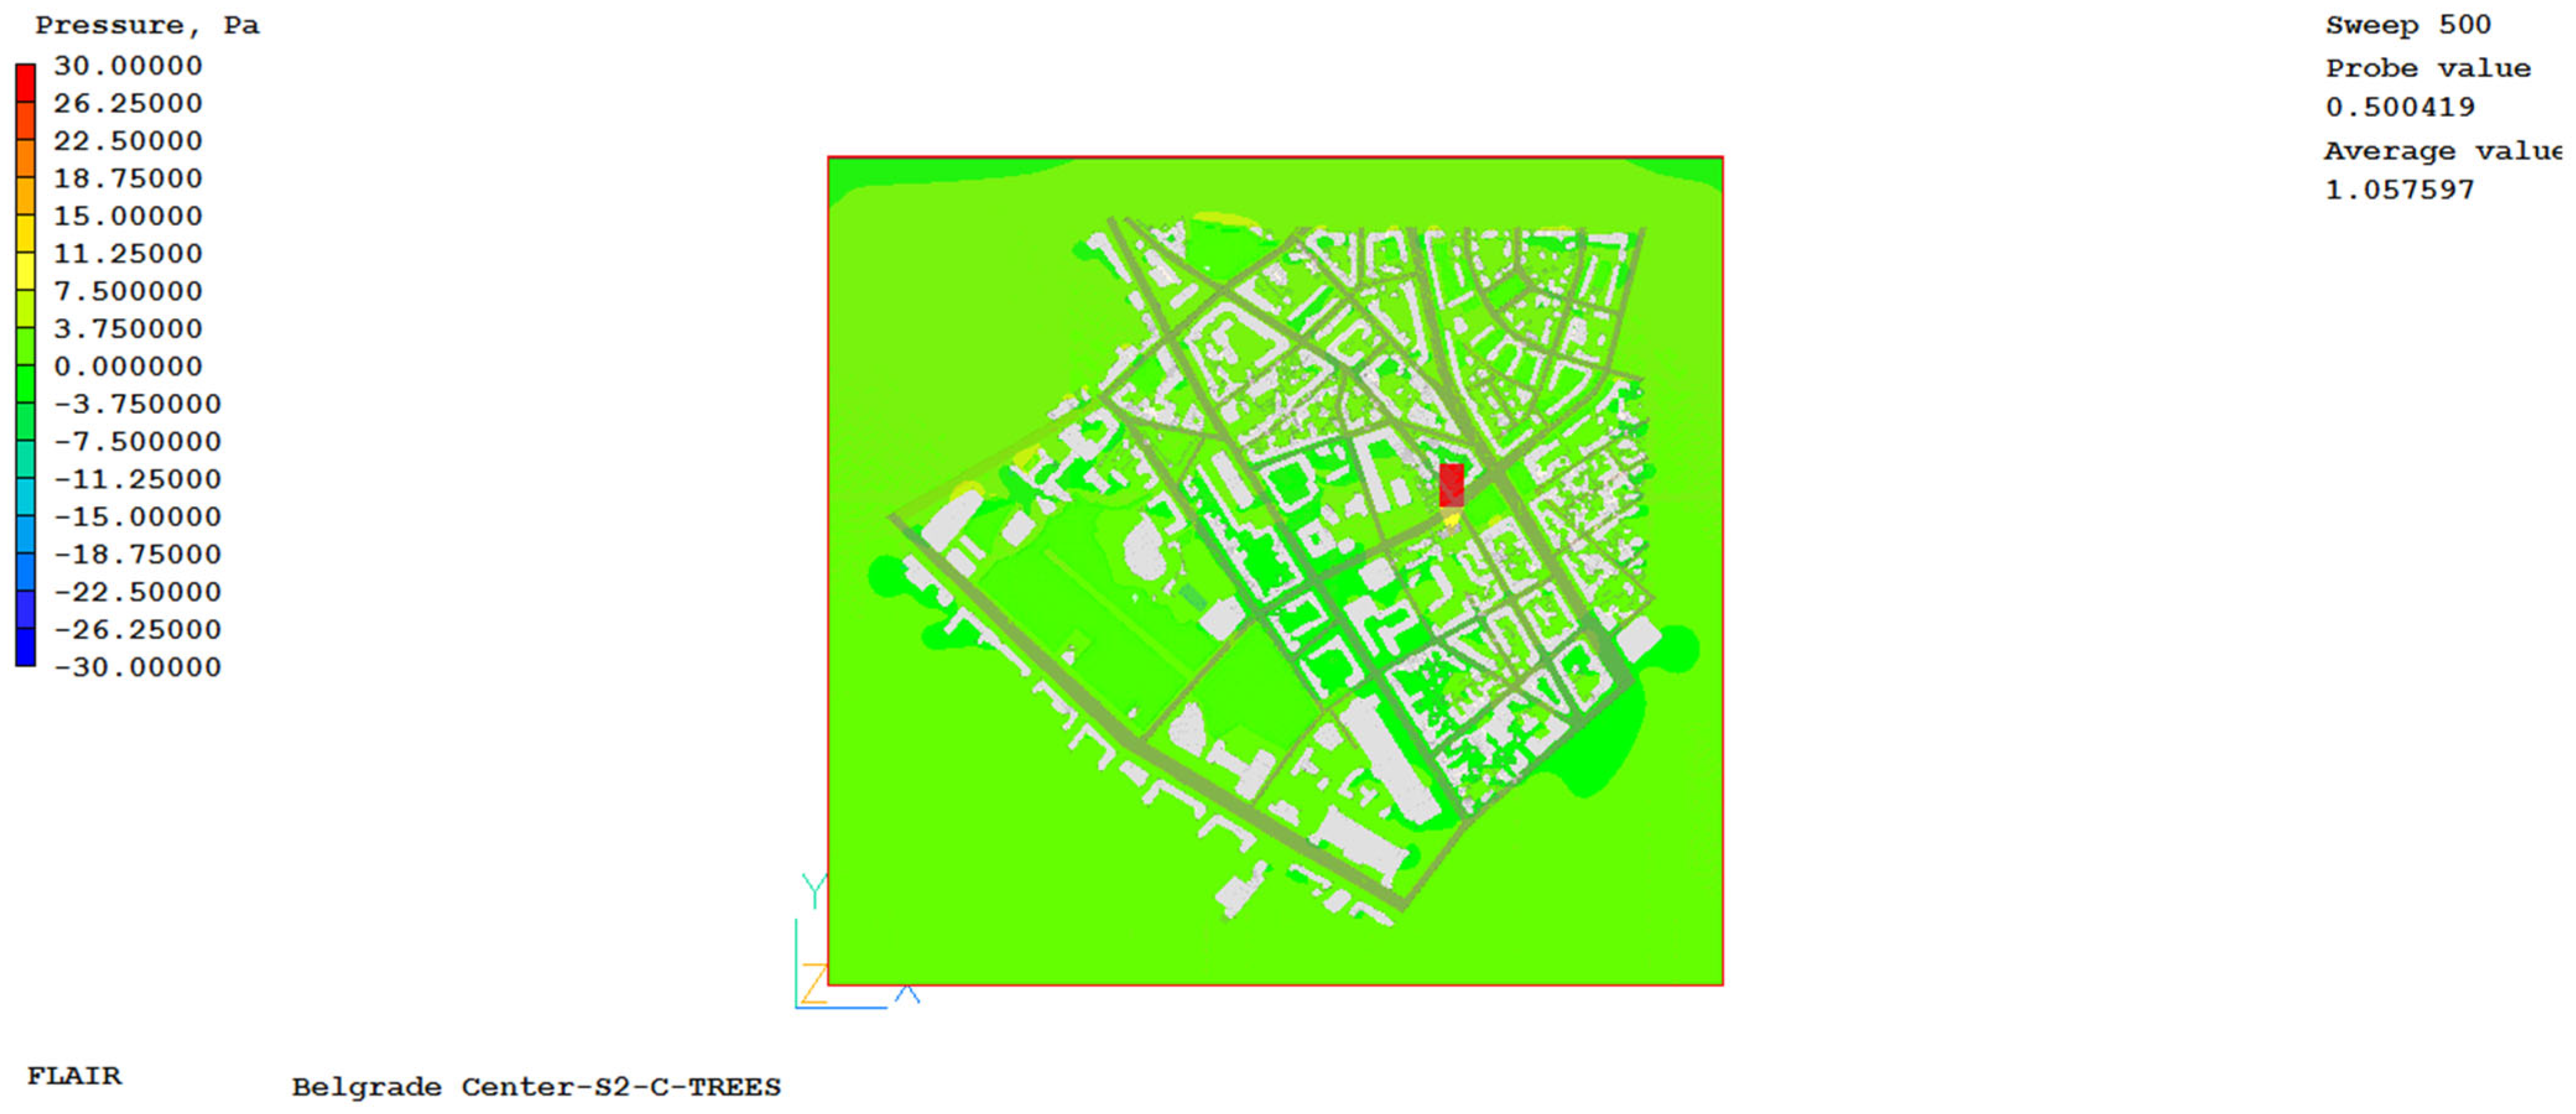
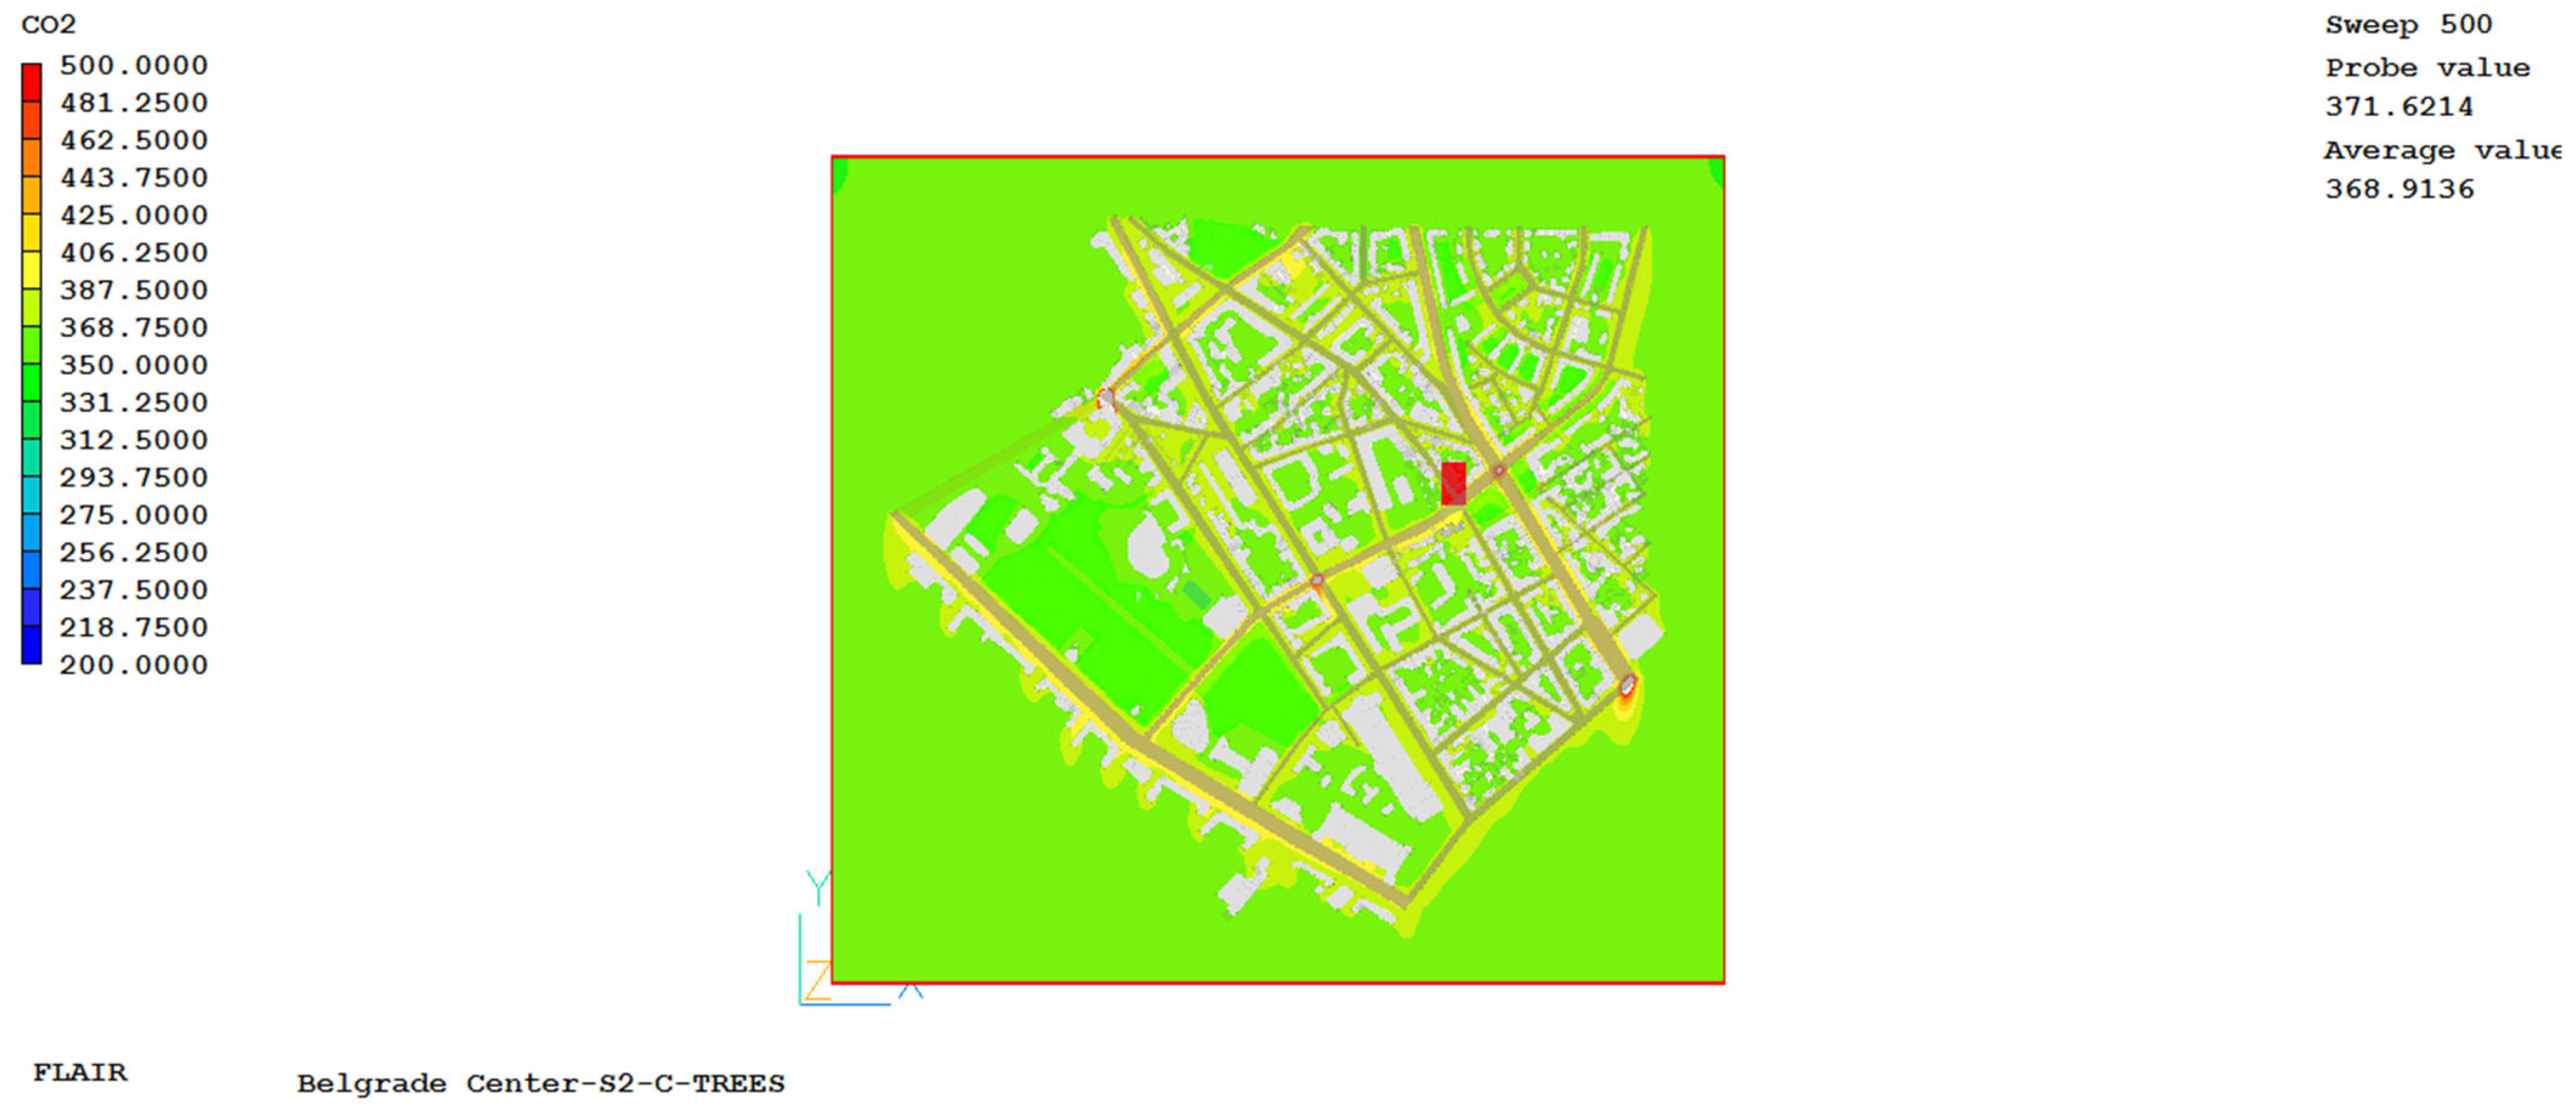
Appendix E, show the values obtained by numerical simulations for the created numerical model at a height of 1.85 m for the field of air temperature, air velocity, radiant air temperature, carbon dioxide concentration and partial water vapor pressure when experimental measurements were also performed at all locations in order to validate the values of the numerical simulations. The results are shown in the example of one day for three different cases.
Figure A14,
Figure A15,
Figure A16,
Figure A17 and
Figure A18,
Appendix E, show the result values related to the case S1, in the morning from 08 to 09 h, and whose values for 5 selected city locations are shown in
Table A10,
Appendix E.
Figure A19,
Figure A20,
Figure A21,
Figure A22 and
Figure A23,
Appendix E, show the result values related to the case S2, in the afternoon from 2 to 3 p.m. and whose values for 5 selected city locations are shown in
Table A11,
Appendix E.
Figure A24,
Figure A25,
Figure A26,
Figure A27 and
Figure A28,
Appendix E, show the result values related to the case S3, in the evening from 6 pm to 9 am, and whose values for 5 selected city locations are shown in
Table A12,
Appendix E.
A list of all instruments used in the study, their calibration sources, measurement accuracy and uncertainty, measurement intervals, installation heights, and protection details is provided in
Appendix F,
Table A13.
Validation of the accuracy of the results was performed based on the relative error between the value of the physical parameter at the measurement site obtained experimentally and the value of the physical parameter at the measurement site obtained by numerical simulation.
Table 1 summarizes the relative error values of numerical models compared to experimental data for air temperature, carbon dioxide, and calculated radiant temperature in the vicinity of the school building. The criteria for a valid model are adopted so that the relative error for physical parameters is less than 5%, while for radiant temperature, the relative error is assumed to be less than 10% because this value is obtained based on measurements of multiple parameters. In
Table 1, fields with measurement points where parameter values do not meet the set relative error value are colored red.
Ta is air temperature and
Tmrt is the mean radiant temperature.
The few highlighted values that slightly exceed the predefined error thresholds can be attributed to the inherent complexities of modeling dynamic urban microclimates. The minor discrepancy in air temperature (Ta) is likely due to localized thermal fluctuations not fully captured by the model’s grid resolution. The deviation for CO2 at a high-traffic intersection (point 5) can be explained by the stochastic nature of vehicle emissions (e.g., sudden accelerations), which create transient peaks that a model with time-averaged emission sources cannot perfectly replicate. Similarly, the larger error for mean radiant temperature (Tmrt) in the morning case (S1-C) is attributed to the complex effects of low sun angles and dynamic shadows, which are challenging for a steady-state radiation model to capture precisely. The model’s accuracy for Tmrt in other periods of the day was excellent.
Verification of numerical results was performed for each series of calculations and for all selected locations. It is concluded that the results of numerical simulations compared to the measured results have acceptable deviations, which is one of the conditions for this model to be used for further analysis and calculations.
While the detailed CFD analysis focuses on a representative hot day to investigate microscale mechanisms, long-term measurements provide essential seasonal context.
Table 2 summarizes the monthly statistics from the entire measurement campaign (March–September 2015). The data clearly shows a seasonal trend, with the mean monthly UHI intensity peaking in July at 6.2 °C, coinciding with the month of highest average and maximum temperatures. This seasonal data provides a robust framework for the detailed daily analysis and confirms that the conditions on 5 July, while extreme, are part of a broader seasonal pattern of urban heating.
By analyzing the results obtained by simulation and the results measured in the rural area, the following conclusions emerge: the obtained values of UHII for the selected urban environment and for the selected time period are highest in the evening hours, after sunset, where its average value is 9.5 °C, in the morning hours this value is 8.1 °C, while it is lowest in the afternoon when it drops to 4.8 °C for the observed day. Also, it can be clearly observed that in areas where there are green areas, parks, the value of the UHII and air temperatures are lower compared to parts where there are only buildings. Based on the results obtained, it is evident that the ambient and radiant temperature near streets with more frequent traffic, but also in places with a higher density of buildings, is significantly higher than in other parts of the city, which means that in these areas the UHII has the highest value.
Figure A11 and
Figure A12,
Appendix C, clearly show the difference between the two urban environment structures consisting of buildings and other similar objects that have high heat absorption and a large area covered by vegetation. In the part of the city where there are only buildings, the air temperature is higher and a heat island is created at the city level. This directly results in an increase in temperature in those parts of the city, which further negatively affects external thermal comfort, but also leads to higher energy consumption for cooling the interior of those buildings. In the observed urban area, the area under vegetation occupies 8.5% of the total area. In the case of no vegetation, the average outdoor ambient temperature of the observed domain increases from 2% in the morning to 4% in the evening.
Analysis of the obtained results confirmed the need for and advantage of using a detailed methodology of computer simulations to determine the temperature field, radiant temperature, flow velocity and carbon dioxide concentration in a complex urban environment. Such simulations can significantly provide more accurate meteorological data that can be used to calculate the energy required for cooling in buildings.
5. Discussion
This study, as a continuation of our previous studies [
39,
40], successfully combined in situ measurements with a validated numerical model to investigate the relationship between traffic-induced pollution and Urban Heat Island (UHI) intensity in a complex urban core. The findings provide a quantitative basis for understanding the primary mechanisms shaping the local microclimate and its thermal characteristics.
The results strongly suggest that elevated UHI intensity is driven by several interacting factors. A primary mechanism is the dual role of vehicular traffic, which acts both as a direct source of thermal energy and as an indirect one through emissions. The clear correlation between traffic density, elevated CO2 concentrations, and localized temperature hotspots indicates that pollutants accumulate in street canyons, where they impede the escape of longwave radiation and intensify local heating. Concurrently, the significant cooling effect of urban vegetation was quantified, with the “no-tree” scenario demonstrating that its removal results in an average air temperature increase of 1.5 °C to 3 °C. This highlights the cumulative importance of shading and evapotranspiration in mitigating urban heat. Furthermore, the simulations revealed how urban geometry can exacerbate these conditions through the formation of quasi-stationary vortex structures within building blocks, which trap warm air and reduce natural ventilation, creating persistent hotspots.
The UHI intensities observed in this Belgrade case study are consistent with and expand upon previous local and international research. Historically, the UHI in Belgrade showed a gradual increase over the 20th century, rising from approximately 0.1 °C to 0.9 °C. More recent studies focusing on high-traffic areas identified intensities between 1.5 and 6.1 °C. Our findings, with a typical summer intensity between 5 and 9 °C and a peak value of 12 °C in July, represent a significant intensification, placing Belgrade’s city center on par with other major European capitals. For instance, reported UHI intensities have reached up to 7 °C in London, 8 °C in Paris, 10 °C in Athens, and 12 °C in Łódź, Poland. This comparison underscores the generalizability of our findings to other large, dense urban environments in continental Europe. Furthermore, our confirmation that the UHI intensity is greatest at night aligns with well-established findings in urban climatology, which attribute this to the slow nocturnal release of heat from materials with high thermal capacity, such as concrete and asphalt.
It is important to acknowledge the limitations of this work. The numerical model employed steady-state assumptions for specific time windows, providing snapshots of thermal conditions rather than a fully transient daily cycle. Moreover, while the cooling benefit of vegetation was quantified as a whole, the model in its current form did not separate the individual contributions of shading, evapotranspiration, and their influence on air mixing. The study also focused on a single, albeit complex, urban area, meaning the direct transferability of results may be limited.
The data on vehicle fleet composition (percentage shares of passenger cars, buses, light and heavy-duty vehicles, etc.) and distribution by fuel type (petrol, diesel) were obtained from the built-in database of the COPERT software package, which contains specific statistical data for the vehicle fleet in the Republic of Serbia for the year under study. This approach follows the standard methodology recommended by the European Environment Agency (EEA) for official traffic emission calculations. We acknowledge that using aggregated national-level statistical data introduces some uncertainty, as the local vehicle fleet composition may differ from the national average.
Despite these constraints, the findings carry significant implications for urban planning and policy. The strong, quantified link between green spaces and lower temperatures provides compelling evidence for prioritizing the preservation and expansion of urban parks and canopy cover as a direct UHI mitigation strategy. Similarly, the connection between traffic, pollution, and thermal hotspots suggests that traffic management policies can be effective microclimate regulation tools. Looking forward, future research should aim to address this study’s limitations by employing transient simulations and developing models capable of local energy-balance diagnostics to disentangle the specific effects of shading and evapotranspiration. Applying this validated methodology to other urban typologies would further enhance our understanding and ability to design more resilient and comfortable cities.
6. Conclusions and Future Research
This study presents the results of research into the impact of UHII on the heating of the environment as well as on the energy consumption for cooling in buildings in larger urban areas. The research is based on the results of experimental determination of the required quantities and the results obtained by applying modern numerical methods and tools. Data on air temperature values recorded at 4 meteorological stations in different parts of the city of Belgrade (Mostar, Novi Beograd, Stari Grad and Vračar) during 2015 were collected and processed. At two previously selected locations in the city of Belgrade, ambient air temperatures, radiant temperatures, relative air humidity, solar and diffuse radiation intensity, wind speed and direction were measured. One of the selected locations is located in an urban area in the immediate vicinity of the building of the Higher Textile School for Design, Technology and Management. The second location was chosen in a rural area and is located in the park of the Vinča Institute of Nuclear Sciences in the settlement of Vinča. The measured values were used to estimate the UHII and as input data for the formed mathematical–numerical models.
Traffic flow measurements were carried out at seven selected intersections at the city location. For a determined number of vehicles, previously classified into seven categories according to the level of pollutant emissions, the amount of emissions generated by traffic was calculated. The results of measurements of air temperature, carbon dioxide concentration and radiant temperature in the immediate vicinity of the school building were used to validate the mathematical–numerical model. The measuring equipment is described in detail and measurement standards and procedures, as well as the method of data collection and processing, are given. Through field measurements, the spatial and temporal parameters of the complex operating mode of building use were determined. The collected and processed results of the presented measurements represent an extensive and complex database for continued research in this area, but also for some other scientific research. The advantage of the numerical simulations used in this research is that such simulations allow us to obtain different fields of temperature, wind speed and carbon dioxide concentration that correspond to different urban configurations by changing the input data and geometry. Thanks to these results, we can advance urban planning and improve outdoor thermal comfort, all in the interest of significantly greater use of urban spaces during summer periods of extreme temperatures.
Through a critical evaluation of the results, it was shown that UHII is not a homogeneous phenomenon but is highly dependent on specific operational conditions and urban micro-geometry, which represents the key finding of this study. Quantification of the influence of key urban factors confirmed that the removal of green infrastructure leads to an increase in the average air temperature in the observed domain in the range of 1.5 °C to 3 °C, directly worsening the UTCI thermal comfort index. These specific operational conditions contribute to the highest recorded UHII in the selected urban area reaching up to 12 °C in July, while average values during the summer period range between 5 °C and 9 °C. Such a thorough examination of specific operational conditions is essential for accurately understanding microclimatic changes and guiding future urban planning decisions.
This paper demonstrates the advantage of using numerical software for detailed characterization of current-thermal quantities and dispersion of a non-reactive pollutant (carbon dioxide). As the model for the selected complex urban environment of the city of Belgrade showed high accuracy, agreement of simulated and measured data, for the assessment of current fields and carbon dioxide concentration fields, it can be considered that this model is a useful tool for assessing the impact of other pollutants on the urban environment. Also, this numerical–mathematical model can be easily applied to other urban environments. Given that this is a very complex urban geometry, the size of the selected and calculated domain is large, and the difference between the obtained simulated and measured values is below 5%, it can be considered that the model met the goal and provided a realistic estimate of the observed parameters.
Building on the findings of this study, we present the following actionable recommendations. First, the quantified cooling effect of vegetation underscores the importance of mandating green spaces, such as parks and tree-lined streets in all new urban development and regeneration projects. Second, given the strong relationship between traffic emissions and localized heat islands, cities should priorities sustainable urban mobility plans that reduce vehicle density in central areas. Third, the demonstrated role of urban geometry in trapping heat and pollutants should be incorporated into building codes and zoning regulations, promoting designs that enhance natural ventilation. Together, these measures can foster more resilient, energy-efficient, and livable urban environments.
In further research, it is possible to apply the developed model to a large number of other locations and extend it to conditions of stable and unstable, not just neutral, atmospheres, which was considered in this work. Furthermore, future research should focus on refining the numerical model to enable a local energy-balance diagnostic. This would allow for the quantitative separation of the individual cooling effects of vegetation, such as shading, evapotranspiration, and their influence on natural ventilation (wind flow). Such a detailed analysis would provide a deeper understanding of the underlying mechanisms and offer more targeted strategies for urban planners to mitigate the urban heat island effect. In addition, in future work, it is planned to develop a numerical analysis that will take into account the results of numerical simulations of the air velocity field due to the influence of the shape of buildings and entire urban environments. This approach can improve urban microclimate conditions and outdoor thermal comfort in open spaces. Such analyses, in the early design phase, can contribute to the construction of more pleasant urban units, which will condition the use of those spaces to a greater extent.
