Article

Models for Predicting the Long-Term Strength of Rheonomic Materials

by
Alibay Iskakbayev
1,2,
Bagdat Teltayev
1,*,
Cesare Oliviero Rossi
3,*,
Yerbol Aitbayev
1 and
Azamat Zhaisanbayev
4
1
U. Joldasbekov Institute of Mechanics and Engineering, Almaty 050010, Kazakhstan
2
Department of Mechanics, Al-Farabi Kazakh National University, Almaty 050040, Kazakhstan
3
Department of Chemistry and Chemical Technologies, University of Calabria, 87036 Rende, Italy
4
LLP “Road Research and Production Center”, Almaty 050064, Kazakhstan
*
Authors to whom correspondence should be addressed.
Appl. Sci. 2025, 15(20), 11236; https://doi.org/10.3390/app152011236
Submission received: 25 August 2025 / Revised: 26 September 2025 / Accepted: 10 October 2025 / Published: 20 October 2025
(This article belongs to the Section Materials Science and Engineering)

Abstract

Reliable modeling and prediction of the long-term strength of materials are relevant, as they allow for accurate determination of the service life of structures and components made from these materials. The aim of this work is to develop models of the long-term strength of rheonomic materials under constant stress and step loading using the principle of damage accumulation, as well as a model for predicting their long-term strength under constant stress based on short-term test data. Using the developed models, the long-term strength of optical fiber with a moisture of 30% and 85% under constant stress from 1600 to 2100 MPa and aluminum alloy under a step change of stress at a temperature of 180 °C were predicted with high accuracy; the long-term strength of pearlitic steel was predicted based on short-term tests under constant stress at temperatures from 98 °C to 293 °C. The developed models have important practical significance, as they can be used for modeling and predicting the long-term strength of rheonomic materials in practice, particularly in cases where the conditions of their operation and loading history are known.

1. Introduction

The main tasks of solid mechanics include modeling the processes of deformation and destruction of materials and structures.
Mechanics is a huge area of modern science, which has many directions (both theoretical and applied) and is being developed intensively. Classical parts of mechanics include theoretical mechanics, solid mechanics, fluid and gas mechanics, elasticity theory, viscoelasticity theory, plasticity theory, creep theory, machine and mechanism theory, mechanics of materials, and others.
Currently, mechanics of materials is a very popular area of science. Using it, the mechanical behavior of materials is modeled at different levels (nano-, micro-, meso-, and macrolevels). In this case, models of mechanics can be divided into scleronomic and rheonomic. The governing equations of scleronomic models are invariant with respect to time transformations. Rheonomic models are described by operator relations that are explicitly time-dependent.
Many natural and artificial materials are rheonomic, since their mechanical characteristics depend on the magnitude of a load, the rate, and the duration of loading. The long-term strength of a large number of solid materials (metals, alloys, polymers, composite materials, wood, concretes, glasses, etc.) has been extensively studied by S.N. Zhurkov and his colleagues since the 1950s [1,2]. Without exception, all the results obtained have shown that the destruction of materials does not occur instantaneously, but rather takes place over a certain period of time, which is a function of the stress, temperature, and structural parameters of the materials. Therefore, taking into account the time factor when determining the mechanical characteristics of materials is a fundamental approach to modeling their actual operating conditions.
Despite the importance of considering the rheological behavior of materials in determining and modeling their mechanical properties, the factor of time is often ignored or incorrectly accounted for in science and practice. For example, in Kazakhstan, the strength of all types of road asphalt concrete for all operating conditions is determined by testing their cylindrical samples at a single loading rate of 3 mm/min [3]. Even modern researchers acknowledge that the testing of materials such as concrete [4] and soil [5] does not fully account for the complete history of loading.
But, it should be noted that many researchers in the field of materials understand the special importance of their long-term strength and durability for practice. Thus, in [6], by using alternative matrices, the long-term mechanical properties of short thermoplastic natural fiber compounds are improved. Their long-lasting mechanical properties are evaluated by the creep test results. The long-term compressive strength of polymer concretes is studied in [7]. The long-term mechanical properties and durability of high-strength concrete containing a high volume of local fly ash are evaluated in article [8]. It is encouraging that there is a book dedicated to the long-term strength of materials, which includes both theoretical and experimental aspects of the problem [9].
A dependence of the mechanical characteristics of rheonomic materials on time can be explained by an accumulation of damage under loads [10]. As the first work in which the principle of damage accumulation was used to develop a theory of wear of ball bearings, one can cite the article by Palmgren in 1924 [11]. Then, the idea of damage accumulation was used by Langer (1937) in the theory of fatigue strength [12]. Probably the most famous works in this area of science are those of Bailey [13] and Robinson [14]. In the article by Kachanov [15], a similar idea was used in modeling long-term strength. Subsequently, the principle of damage accumulation was successfully applied to the study of the strength and durability of many materials and structural elements, and with its use, well-known theories in mechanics were created [16,17,18]. At present, the principle of damage accumulation is successfully applied in modeling the mechanical behavior of many materials. For example, in articles [19,20], this principle is successfully used to determine the mechanical characteristics of road asphalt concrete that are important in practice.
The aim of this work is to develop models of the long-term strength of rheonomic materials under constant stress and step loading using the principle of damage accumulation, as well as a model for predicting their long-term strength under constant stress based on short-term test data.
The scientific novelty of the work lies in the fact that the developed models take into account the history (sequence) of loading, which allows mathematically describing and predicting the long-term strength of rheonomic materials with high accuracy.
The article first presents the results of testing road asphalt concretes for creep under direct tension at temperatures of +50 °C and +60 °C, and shows that their long-term strength (time of failure) is accurately approximated by a power function.
Using the developed models, the long-term strength of an optical fiber with a moisture of 30% and 85% under constant stress from 1600 to 2100 MPa and an aluminum alloy under a step change of stress at a temperature of 180 °C were predicted with high accuracy; and the long-term strength of a pearlitic steel was predicted based on short-term tests under constant stress at temperatures from 98 °C to 293 °C.

2. General Model of Long-Term Strength

2.1. Integral Equation

The expression for the instantaneous strength of a rheonomic material, taking into account the accumulation of damage, is represented by the following integral equation:
σ = σ t + 0 t t τ σ τ d τ ,
where
σ —instantaneous strength;
σ t —long-term strength;
t —time of destruction of material samples under tension;
t τ —a kernel of material damage.

2.2. Damage Kernel

For a rheonomic material with a long-term strength limit, we represent the damage kernel as an exponential function:
t τ = λ e β t τ ,
where λ , β are parameters λ > 0 and β > 0 .

2.3. Definition of Parameters λ and β

Substituting expression (2) into integral Equation (1), with σ = c o n s t we obtain the following:
σ = σ ( t ) 1 + λ β 1 e β t .
By testing a material sample for creep, it is possible to determine the following:
σ i t e i = σ i ,   i = 1 n ;   n 4 ,
where t e i is the destruction time found from the experiment.
Taking into account Equality (4), using Equation (3) for four values of strength σi and failure time t e i (i = 1…4), the following two equalities can be written:
σ 1 = 1 + λ β 1 e β t e 1 = σ 2 1 + λ β 1 e β t e 2 ,
σ 3 = 1 + λ β 1 e β t e 3 = σ 4 1 + λ β 1 e β t e 4 .
Equalities (5) and (6) can be transformed into the following:
β λ = σ 2 1 e β t e 2 σ 1 1 e β t e 1 σ 1 σ 2 1 ,
β λ = σ 4 1 e β t e 4 σ 3 1 e β t e 3 σ 3 σ 4 1 .
Since the left-hand sides of Equations (7) and (8) are the same, their right-hand sides must also be equal. Then, the following equation is valid:
σ 3 σ 4 σ 1 e β t e 1 σ 2 e β t e 2 σ 1 σ 2 σ 3 e β t e 3 σ 4 e β t e 4 = 0 .
Equation (9) contains four values of stress and four values of material failure time, which are already known from the creep experiments. It contains only one unknown parameter β. Therefore, the value of parameter β can be determined from it. A simple way to determine the β parameter from this equation is by a simple substitution.
By substituting the found value of parameter β into Equations (7) and (8), we can determine two values of parameter λ: λ1 and λ2. The average value of parameter λ can be taken as the calculated value:
λ = λ 1 + λ 2 2 .

2.4. Instantaneous Strength

Having known values of parameters λ and β, long-term strength σi, and destruction time t i , using Expression (3), we can calculate the values of the instantaneous strength of the material:
σ i = σ i 1 + λ β 1 e β t e i ,   I = 1 4 .
The average value of instantaneous strength is taken as the calculated value:
σ = 1 4 i = 1 4 σ i .

2.5. Time of Destruction

It is natural to assume that the instantaneous strength of a rheonomic material does not depend on stress; it can also be assumed that for small temperature changes, it does not depend on temperature.
From Equation (3), we determine the time of destruction of the material during creep:
t = 1 β l n 1 σ σ 1 β λ 1 .

2.6. Long-Term Strength Under Step Loading

Let a sample of a rheonomic material be under constant stress, σ 1 , for time t1 < t 1 , and then be under stress, σ 2 , for a time t 2 until the onset of failure ( t 2 ).
Total failure time is as follows:
t = t 1 + t 2 .
The sum of the partial times can be written in the following form [21]:
A = t 1 t 1 + t 2 t 2 ,
where t 1 and t 2 are the long-term strengths (durability) of the material at stresses σ 1 and σ 2 , respectively.
If the Bailey–Robinson principle is satisfied, the following equality is valid:
A = 1 ,
which does not depend on the sequence of load application (Figure 1a,b).
It is known that in cases where a smaller load is applied first, then a larger one (Figure 1a), a reduced value of A is obtained (i.e., A < 1); and in cases where a larger load is applied first, then a smaller one (Figure 1b), the opposite result occurs: A > 1 [22].
We will write an equation for the damage accumulation of the hereditary type in the following form:
C 0 t t τ 1 α d   σ τ = 1 ,
where α 0 , 1 , C > 0 ;
t —time of destruction;
τ —integration parameter: τ ( 0 , t ) .
Next, we will analyze two processes of damage accumulation when the following are true:
σ t = σ 1 h t + σ 2 σ 1 h t t 1 ,
σ 2 > σ 1 ,
σ t = σ 4 h t + σ 3 σ 4 h t t 3 ,
σ 3 > σ 4 ,
where h   ( t ) —Heavisine function [23,24].
Substituting Expression (5) into Integral (4), we obtain the following:
C σ 1 t 1 + t ¯ 2 ( 1 α ) + σ 2 t ¯ 2 ( 1 α ) σ 1 t ¯ 2 ( 1 α ) = 1 ,
where t = t 1 + t 2 = t 1 + t ¯ 2 .
Substituting Expression (6) into Integral (4), we obtain the following:
C σ 3 t 3 + t ¯ 4 ( 1 α ) + σ 3 t ¯ 4 ( 1 α ) σ 4 t ¯ 4 ( 1 α ) = 1 ,
where t = t 3 + t 4 = t 3 + t ¯ 4 .
Since the right-hand sides of Equations (7) and (8) are equal, we can write the following:
σ 1 ( t 1 + t ¯ 2 ) ( 1 α ) + σ 2 σ 1 t ¯ 2 ( 1 α ) σ 3 t 3 + t ¯ 4 ( 1 α ) σ 4 σ 3 t ¯ 4 ( 1 α ) = 0 ,
In Equations (20)–(22), t ¯ 2 и t ¯ 4 are the values of the failure time of the material samples in loading cases 1 (Figure 1a) and 2 (Figure 1b), respectively.
As can be seen, Equation (22) contains four values of stress and four values of failure time, which are known from the step load testing of material samples. It contains only one unknown parameter: α; from it, the values of the parameter α can be determined. A simple way to determine the parameter α from this equation is by a simple substitution.
With a known value of the parameter α, two values of the parameter C can be determined from Equations (20) and (21):
C 1 = σ 1 t 1 + t ¯ 2 ( 1 α ) + σ 2 + σ 1 t ¯ 2 ( 1 α ) 1 ,
C 2 = σ 3 t 3 + t ¯ 4 ( 1 α ) + σ 4 σ 3 t ¯ 4 ( 1 α ) 1 .
The average value of parameter C can be taken as the calculated value:
C = C 1 + C 2 2 .
The above procedures, together, provide a mathematical modeling of the long-term strength of a rheonomic material under step loading for cases where testing of material samples continues until their complete destruction.
To predict the long-term strength (the failure time t ¯ 2 or t ¯ 4 ) of the material in cases of loading the test specimens according to the schemes shown in Figure 1a,b, Equations (7) and (8) are used. Each of them contains three unknowns: the parameters α, C and the failure time t ¯ 2 (or t ¯ 4 ). Their values can be determined by adopting one of the optimization methods, for example, the Marquardt–Levenberg method [25,26,27].

3. Materials and Methods

3.1. Materials

A hot fine-grained dense asphalt concrete of type B and stone mastic asphalt concretes (SMA) without and with polymer (SBS), meeting the requirements of the standards ST RK 1225-2019 [28] and ST RK 2373-2019 [29], were prepared using bitumens meeting the requirements of the standard ST RK 1373-2013 [30].
Composition of the fine-grained dense asphalt concrete: crushed stone—43% (5–10 mm—20%, 10–15 mm—13%, and 15–20 mm—10%), sand—50%, mineral powder—7%, and bitumen—4.8%.
Composition of the SMAs: crushed stone—75% (5–10 mm—12% and 10–20 mm—63%), sand—14%, mineral powder—11%, stabilizer—0.32%, bitumen—5.4%, adhesion promoter—0.35%, and polymer (SBS)—3.5%.

3.2. Sample Preparation

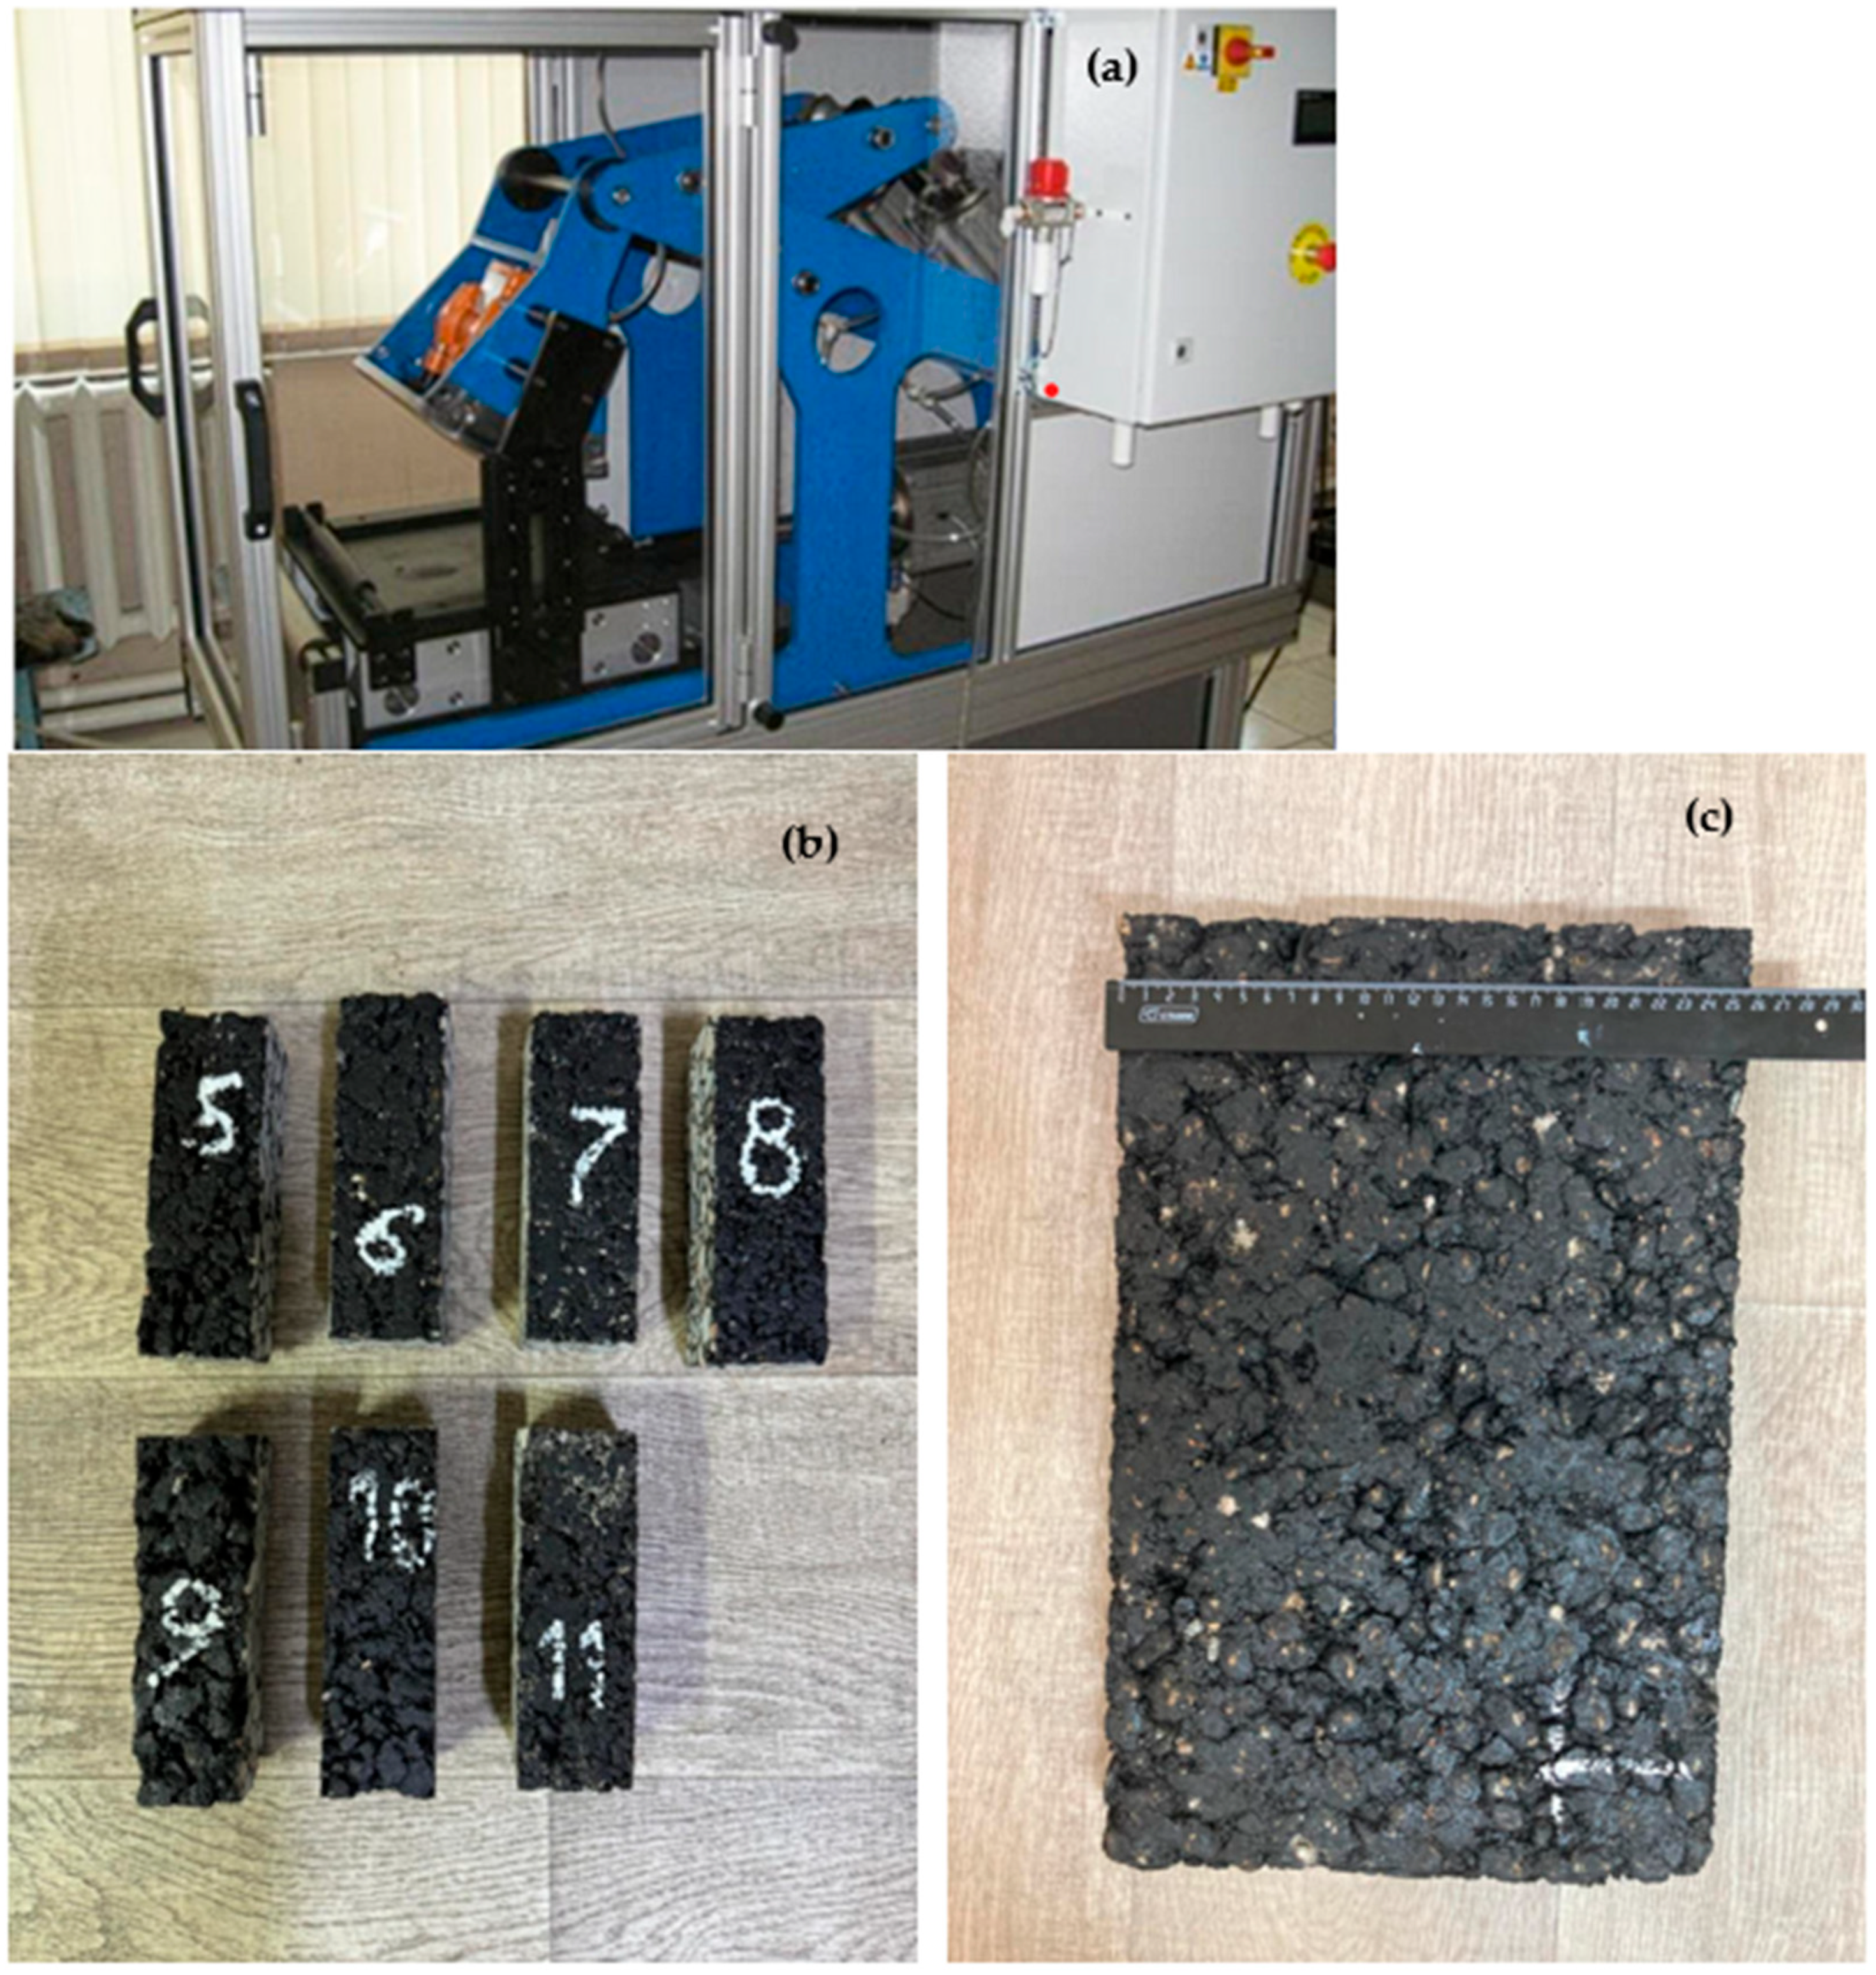
The asphalt concrete samples in the shape of a rectangular beam with dimensions of 50 × 50 × 150 mm (Figure 2b) were prepared as follows. First, the asphalt concrete samples were prepared on a roller compactor (Figure 2a) in the form of a slab with dimensions of 350 × 350 × 50 mm (Figure 2c), according to the standard EN 12697-26-2003 [31], which were then cut into the above beams.

3.3. Testing

The asphalt concrete samples (beams) were tested for creep under uniaxial tension at temperatures of 50 and 60 °C until complete failure at several stresses. In individual tests, temperature and stress were maintained at constant levels throughout the experiment. The tests were carried out in a special installation with a heat chamber (Figure 3a,b). The elongation of the samples over time was measured by two indicators of a clock type and recorded with a video camera, which were then processed and analyzed.

4. Results and Discussion

4.1. Long-Term Strength of Asphalt Concrete

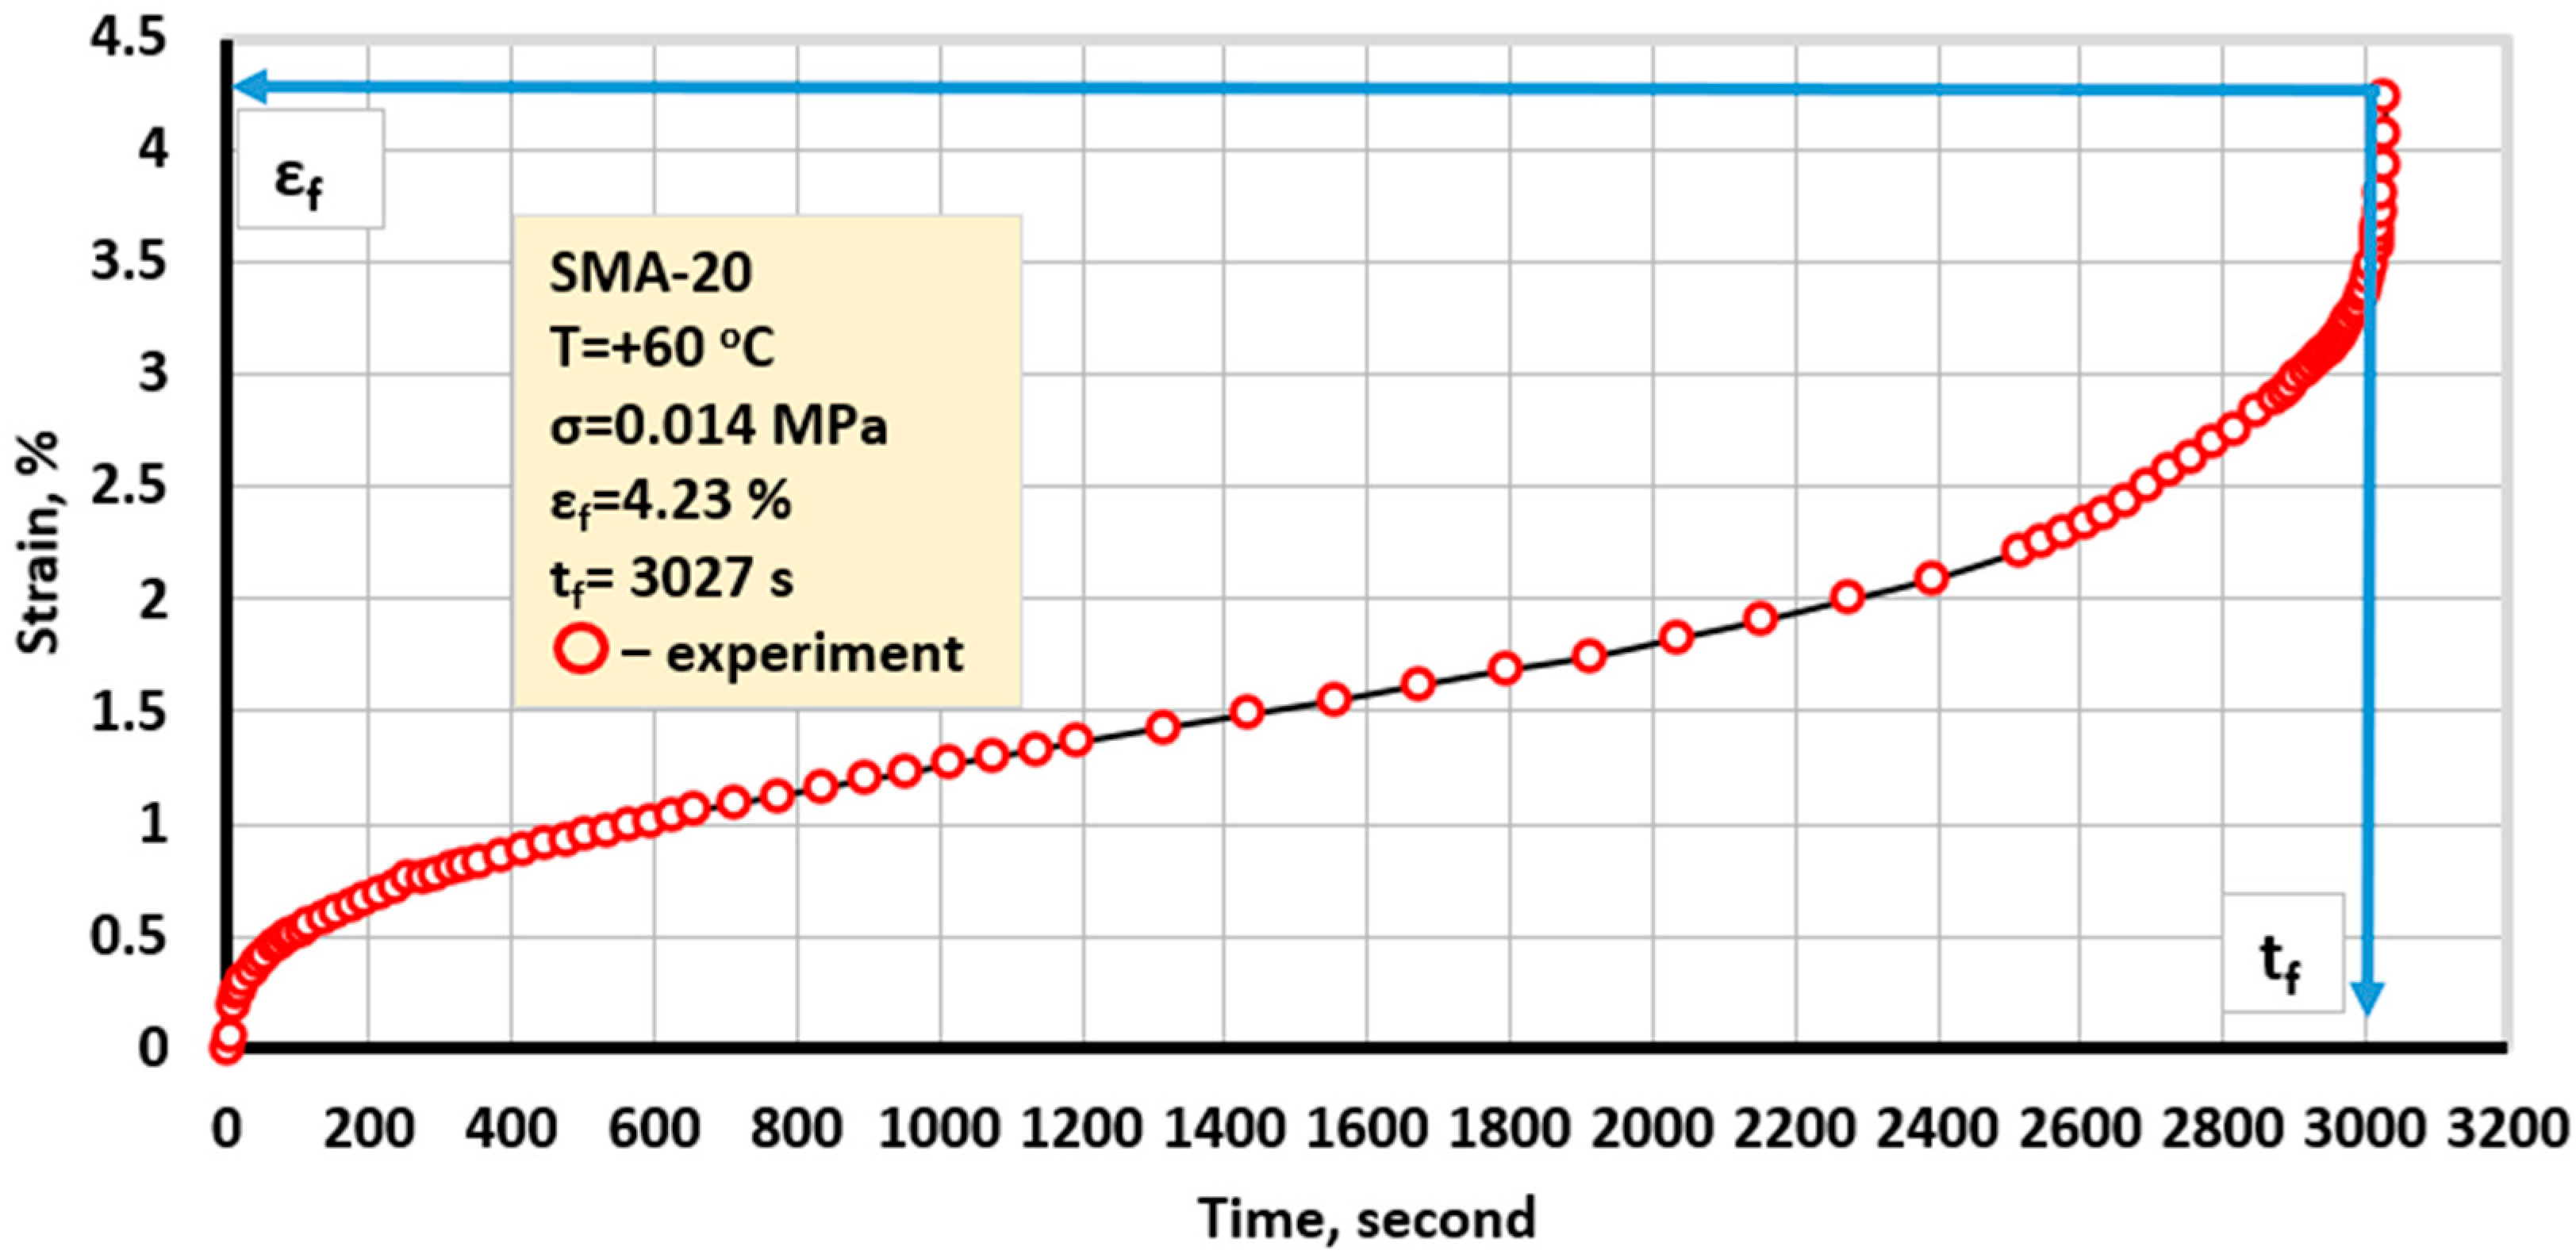
Figure 4 and Figure 5 show the creep curves of the asphalt concretes (SMA-20 and SMA-20+SBS), which were constructed based on the results of creep tests of the asphalt concrete samples until complete failure. The failure time (long-term strength) of the asphalt concretes is denoted as tf.
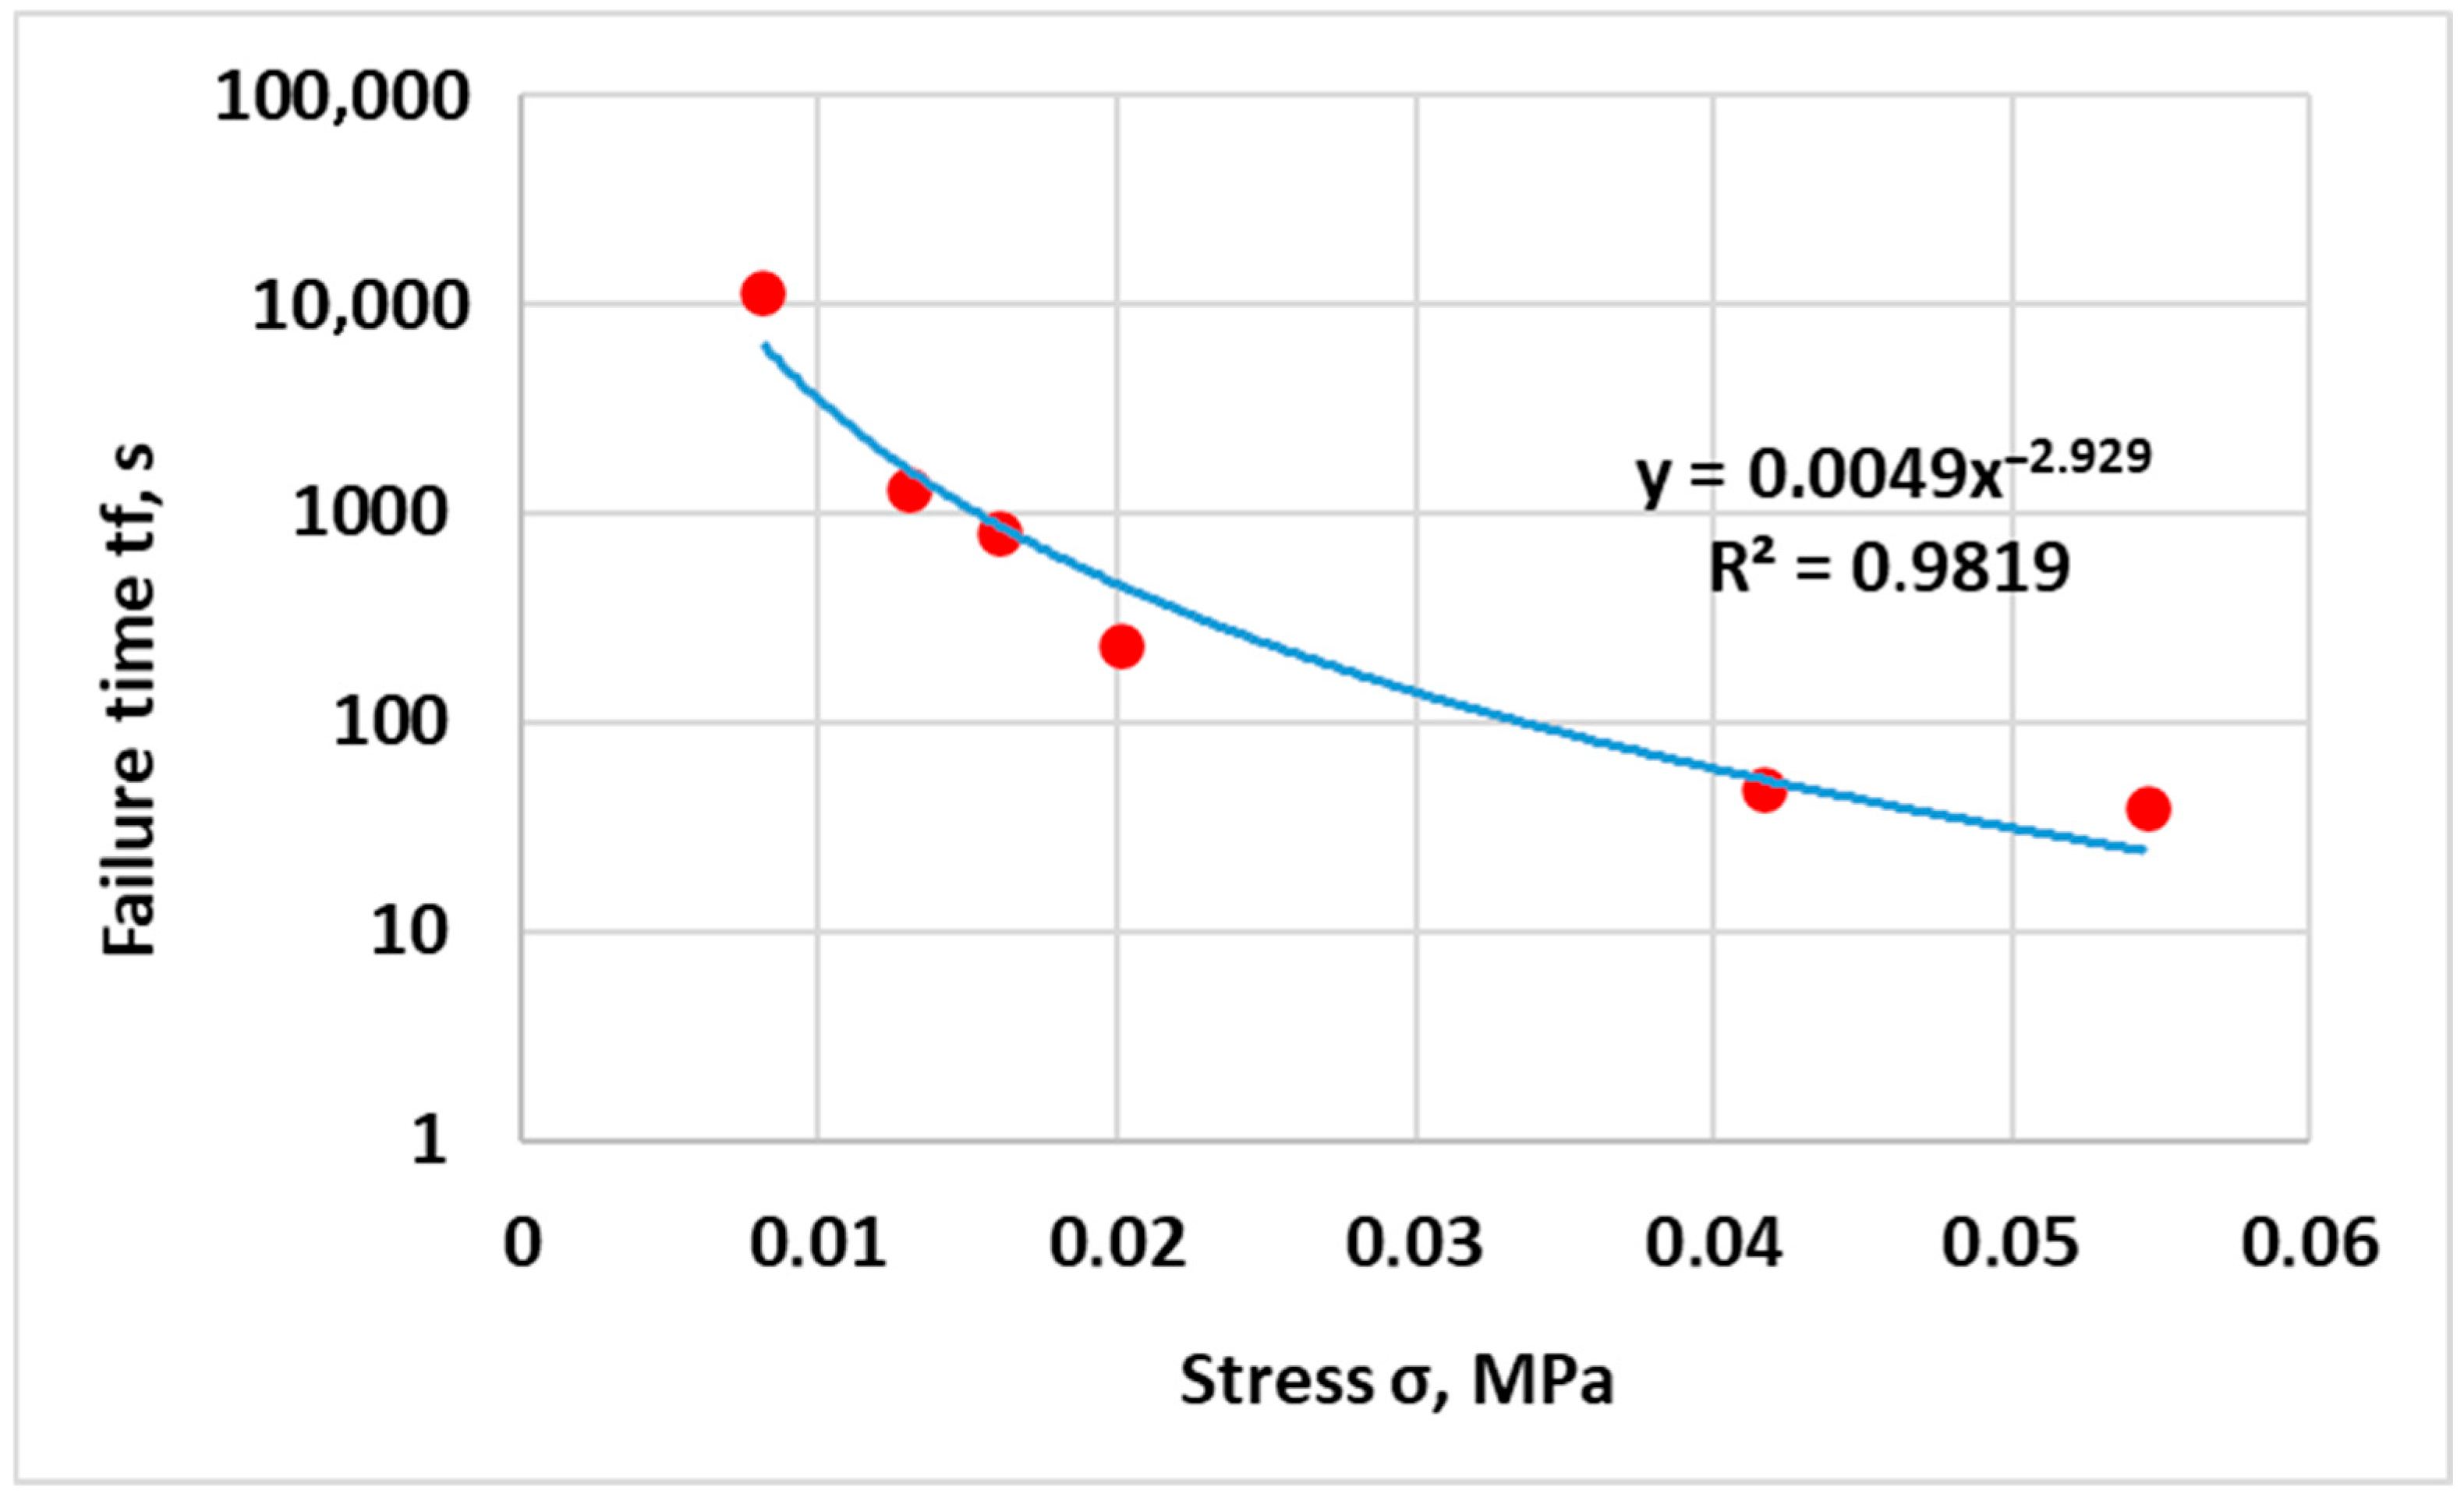
Figure 6 shows the relationship between stress and failure time (i.e., long-term strength) of fine-grained dense asphalt concrete. As can be seen, the long-term strength of the asphalt concrete can be accurately approximated by a power function.
The creep test results of the asphalt concrete, as given above, demonstrate how the long-term strength of rheonomic materials can be experimentally determined. The approximation of the long-term strength of the asphalt concrete as a function of the applied constant stress is one of the simplest mathematical models describing the long-term strength of rheonomic materials. Such models automatically take into account the loading history and the principle of damage accumulation. But, they are quite suitable for solving some scientific and practical problems.

4.2. Long-Term Strength Under Constant Stress

To assess the accuracy of the proposed model for long-term strength under constant stress, we compare the results obtained experimentally in the article [32] and calculations using the proposed model. In this article, an optical fiber at 30% and 85% moisture was tested for creep to failure under stresses from 1600 to 2100 MPa. The experimentally obtained values of failure time (te) are presented in the second column of Table 1.
Using the values of stress σ and destruction time te, according to Expressions (7)–(10) for the optical fiber at 30% moisture, the following values of the parameters (β, λ) of the damage kernel (2) were obtained:
β = 8.555 × 10⁻⁵ s−1; λ1 = 1.4013 × 10⁻⁵ s−1;
λ2 = 1.4017 × 10⁻⁵ s−1; λ = 1.4015 × 10⁻⁵ s−1.
According to Expressions (11) and (12), the following values of instantaneous strength were found:
σ*1 = 2187.85 MΠa; MPa; σ*2 = 2187.86 MΠa; MPa;
σ*3 = 2187.94 MΠa; MPa; σ*4 = 2187.93 MΠa; MPa;
σ* = 2187.89 MΠa. MPa.
Now, using Equation (13), we determine the calculated values of the destruction time tcal (the third column of Table 1).
Similarly, we find the values of the parameters of the damage kernel, instantaneous strength, and calculated values of the destruction time of the optical fiber at 85% moisture:
β = 1 × 10⁻⁴ s−1; λ1 = 0.3499 × 10⁻⁴s−1;
λ2 = 0.3499 × 10⁻⁴ s−1; λ = 0.3499 × 10⁻⁴ s−1.
σ*1 = 2041.74 MΠa; MPa; σ*2 = 2041.74 MΠa; MPa;
σ*3 = 2041.74 MΠa; MPa; σ*4 = 2041.74 MΠa; MPa;
σ* = 2041.74 MΠa. MPa.
The calculated failure time (tcal) is also included in Table 1.
The data in Table 1 show that the experimental and calculated values of the failure time (long-term strength) of the optical fiber at both moisture levels (30% and 85%) coincide with very high accuracy.

4.3. Long-Term Strength Under Step Loading

In [33], samples of an aluminum alloy were tested for long-term strength under constant stresses and step loading at a temperature of 180 °C. The experimentally obtained values of the failure time (t*) and the values of the corresponding constant stresses are provided below:
σ = 98.3 MPa. t* = 2605 h;
σ = 126.3 MPa. t* = 645 h;
σ = 140.6 MPa. t* = 376 h.
In the above-mentioned work, at the same temperature, the aluminum alloy samples were tested under step loading. The experimental and calculated characteristics of the aluminum alloy samples are presented in Table 2, indicating the following: te is the destruction time determined experimentally; tBR is the destruction time determined by the Bailey–Robinson principle; tcal is the destruction time determined by the proposed model; ∆1 is the difference in the destruction time values determined experimentally and by the Bailey–Robinson principle; ∆2 is the difference in the destruction time values determined experimentally and by the proposed model.
A comparative analysis of the results obtained experimentally using the Bailey–Robinson principle and the proposed model shows the following: (1) the accuracy of the Bailey–Robinson principle, as expected, turned out to be very low, where the deviations of the results are from 18% to 73%; (2) the proposed model describes the long-term strength of the aluminum alloy under step loading with high accuracy, where the deviations of the calculated time values from the experimental ones do not exceed 1.3%; such high accuracy is ensured by the fact that the proposed model takes into account the history (sequence) of loading.

4.4. Prediction of Long-Term Strength from Short-Term Test Data

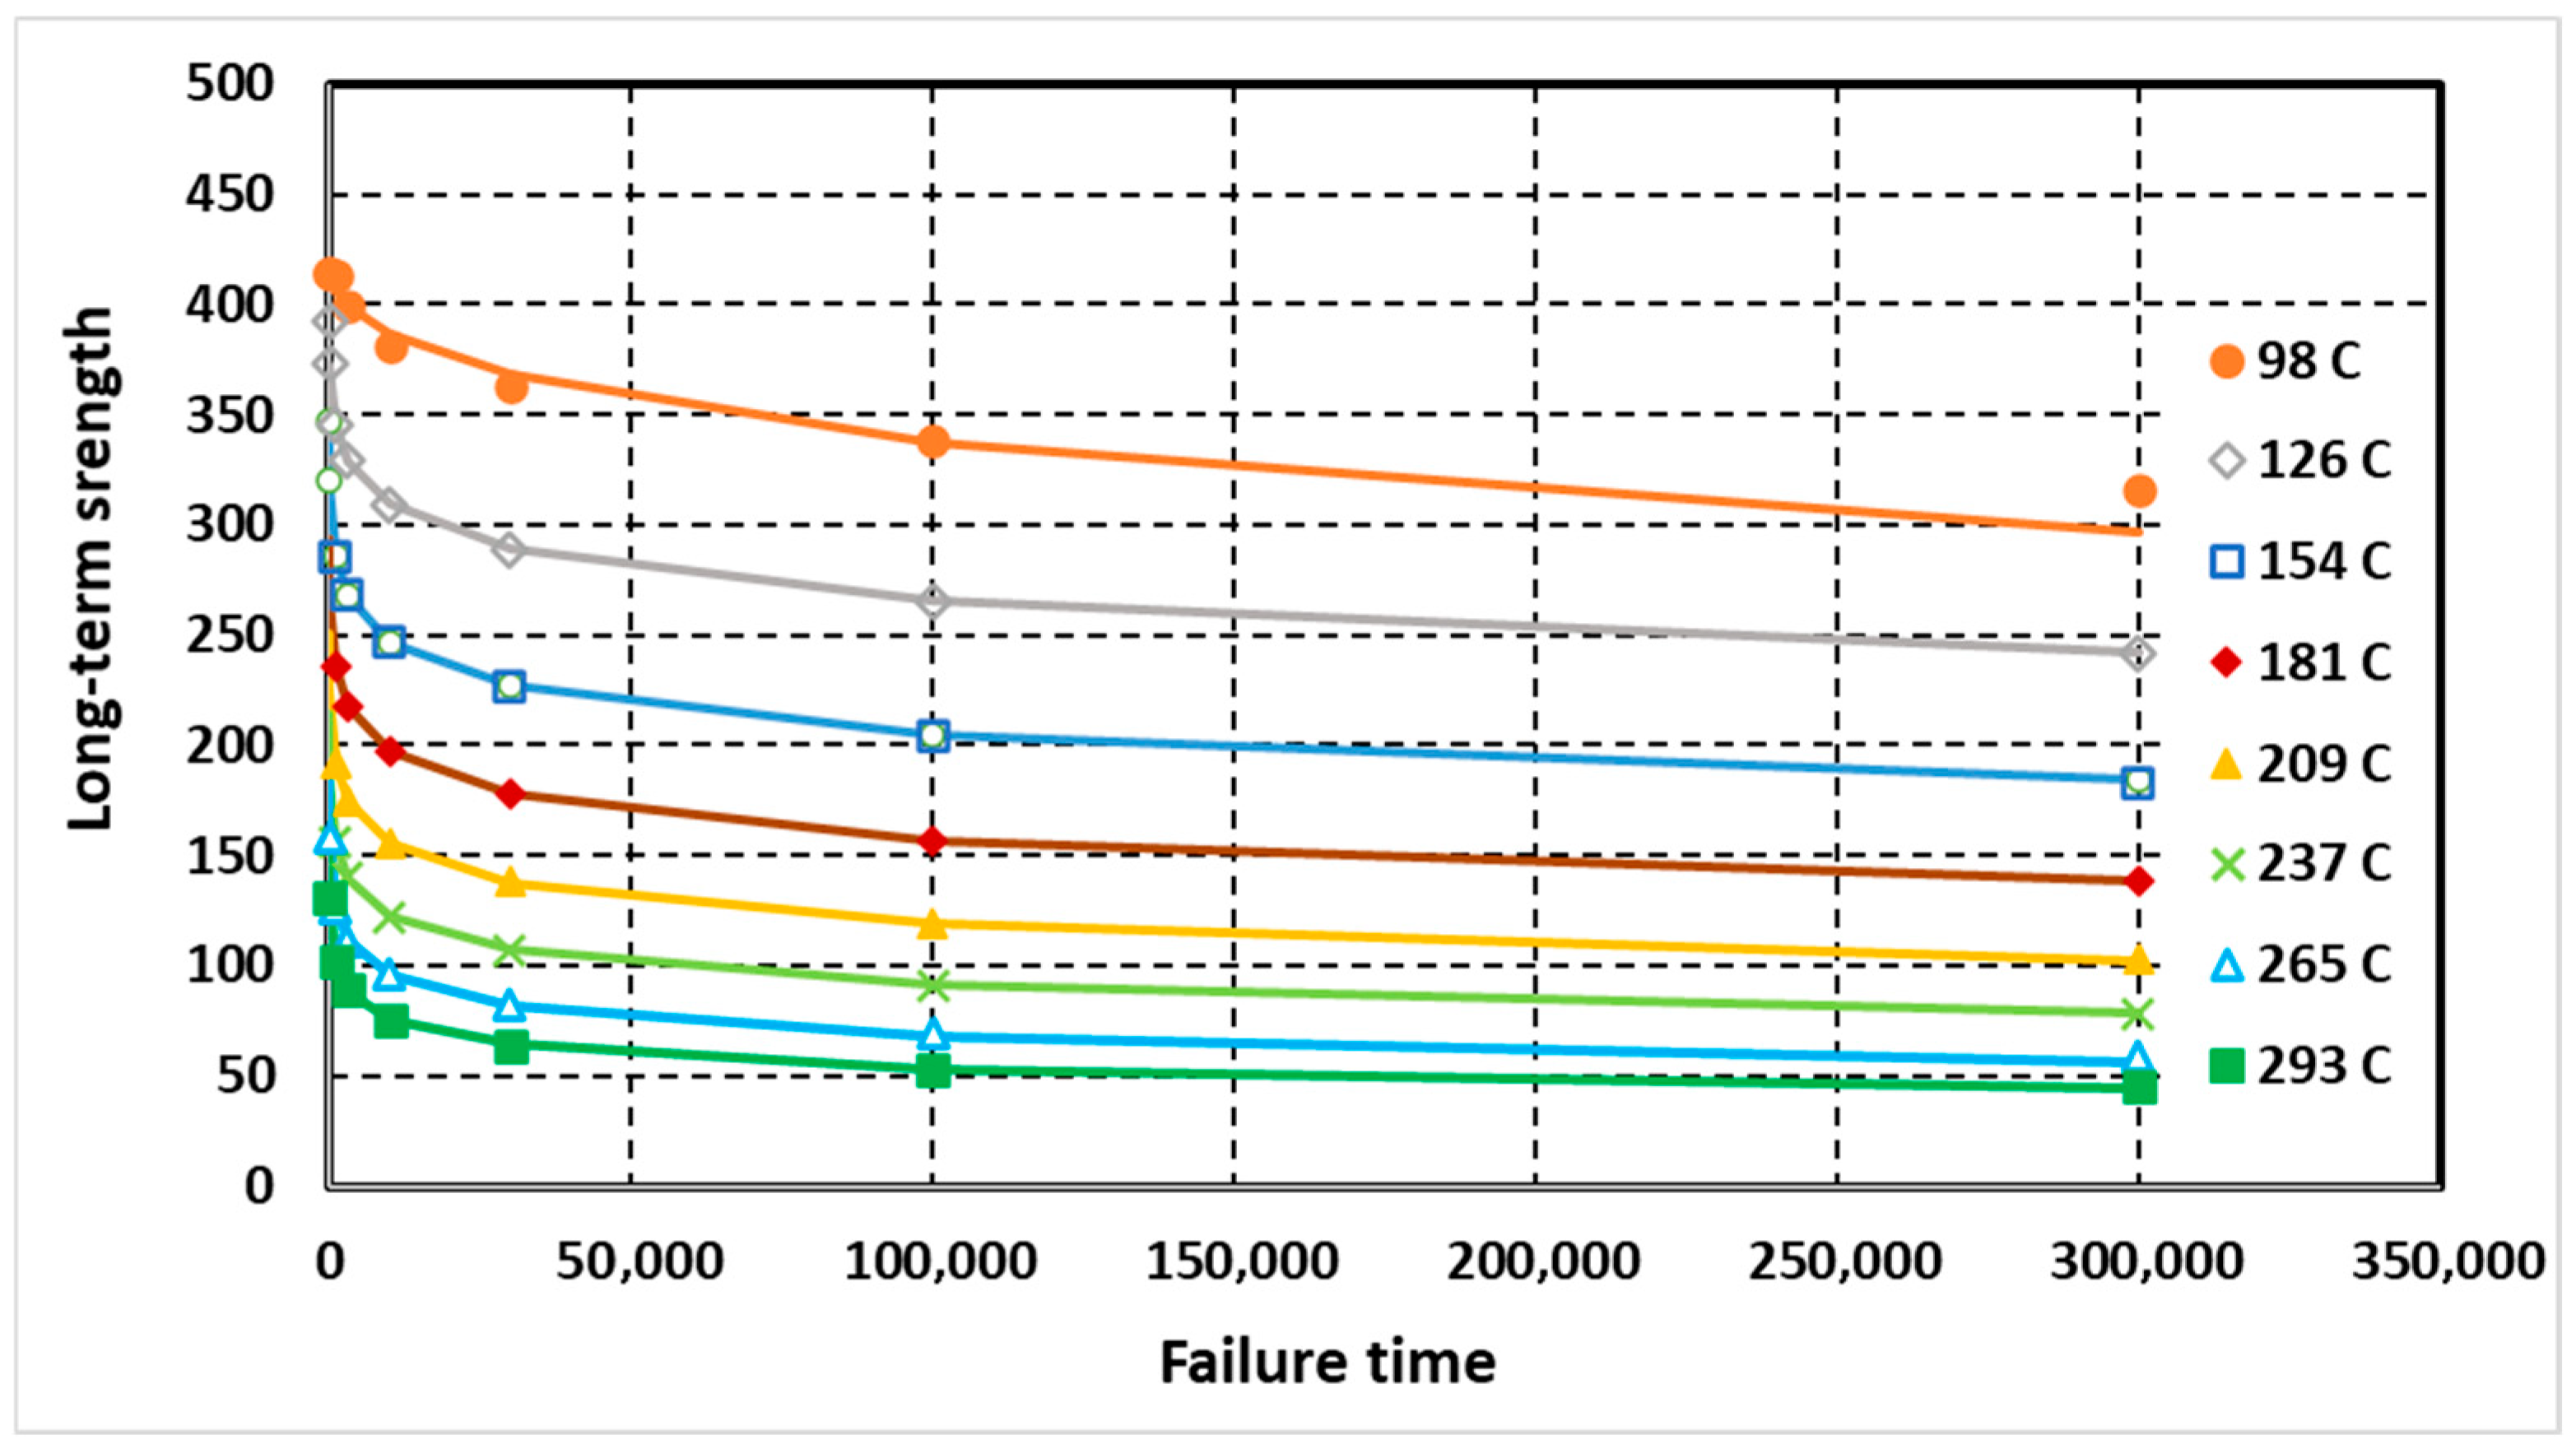
Figure 7 shows the experimentally determined (point markers) and calculated values (lines) of the long-term strength of the pearlitic steel grade ASTMX2M1 at temperatures from 98 °C to 293 °C [34,35]. In this case, the long-term strength values up to 3 × 10⁴ h (inclusive) were determined experimentally, and for test durations equal to 105 and 3 × 10⁵ h, they were predicted using the ASME method [36].
The values of the parameters α and δo, calculated using the method, are provided in Table 3.
The obtained results showed that the parameter α is practically independent of temperature. It can be taken equal to 0.8. The parameter δo and the instantaneous strength of the steel σ depend on temperature. At the same time, with an increase in temperature, the parameter δo increases, and the instantaneous strength decreases. In the considered temperature range from 98 °C to 293 °C (temperature change by 195 °C), the parameter δo changes by 469 times, i.e., by more than two orders of magnitude, and the instantaneous strength by 1.7 times. The proposed method allows one to reliably extrapolate the results of the short-term strength of the pearlitic steel to its long-term strength.

5. Conclusions

  • A simple model was formulated in the form of a power function, achieving high accuracy (R2 = 0.9819) and easily describing the long-term strength of the asphalt concrete. In cases where the long-term strength of rheonomic materials and the corresponding stress values are known from experiments, the simplest functions and equations can be used as models.
  • The developed models of long-term strength of rheonomic materials, particularly in the form of an integral equation with a kernel in the form of a power function that takes into account the accumulation of damage over time, adequately describe the long-term strengths of several types of materials. Using the developed models, the long-term strength of an optical fiber with moisture of 30% and 85% under constant stress from 1600 to 2100 MPa and an aluminum alloy under a step change in stress at a temperature of 180 °C were predicted with high accuracy; the long-term strength of a pearlitic steel was predicted based on short-term tests under constant stress at temperatures from 98 °C to 293 °C.
It is proposed to use the developed models for modeling and predicting the long-term strength of rheonomic materials in practice in cases where the conditions of their operation and loading history are known.
3.
Using the developed models, it is possible to predict the long-term strength of rheonomic materials under variable environmental and operational conditions; in these cases, the mechanical characteristics included in the models should be represented as functions of environmental and operational parameters.

Author Contributions

Conceptualization, A.I. and B.T.; Methodology, A.I. and B.T.; Investigation, A.I., B.T., C.O.R., Y.A., and A.Z.; Writing—Original Draft Preparation, A.I. and B.T.; Writing—Review and Editing, A.I., B.T., C.O.R., Y.A., and A.Z.; Supervision, B.T. All authors have read and agreed to the published version of the manuscript.

Funding

This research was supported by the Fundamental Research Grant from the Ministry of Science and Higher Education of the Republic of Kazakhstan (Grant Number: BR20280990, U.Joldasbekov IME).

Institutional Review Board Statement

Not applicable.

Informed Consent Statement

Not applicable.

Data Availability Statement

The original contributions presented in the study are included in the article; further inquiries can be directed to the corresponding author.

Conflicts of Interest

Author Azamat Zhaisanbayev was employed by the LLP “Road Research and Production Center” (Almaty, Kazakhstan). The remaining authors declare that the research was conducted in the absence of any commercial or financial relationships that could be construed as a potential conflict of interest.

References

  1. Zhurkov, S.N. Kinetic Concept of Solid Body Strength. News Acad. Sci. USSR Ser. Inorg. Mater. 1967, 3, 1767–1777. [Google Scholar]
  2. Regel, V.R.; Slutsker, A.I.; Tomashevskiy, E.Y. Kinetic Nature of Solid Body Strength; Nauka: Moscow, Russia, 1974. [Google Scholar]
  3. ST RKSTRK1218-2003; Organic Binding Materials for Road and Airfield Construction. Test Methods; Kazakhstan Institute of Standardization and Metrology: Astana, Kazakhstan, 2003.
  4. Chai, Q.; Huang, S.; Wan, F.; Wu, F. A New Experimental Method to Measure and Calculate the Tensile Strength of Concrete. Front. Mater. 2023, 10, 1216747. [Google Scholar] [CrossRef]
  5. Stefanow, D.; Dudziński, P.A. Soil Shear Strength Determination Methods—State of the Art. Soil Tillage Res. 2021, 208, 104881. [Google Scholar] [CrossRef]
  6. Cosse, R.L.; van der Most, T.; Voet, V.S.D.; Folkersma, R.; Loos, K. Improving the Long-Term Mechanical Properties of Thermoplastic Short Natural Fiber Compounds by Using Alternative Matrices. Biomimetics 2025, 10, 46. [Google Scholar] [CrossRef]
  7. Sokołowska, J.J. Long-Term Compressive Strength of Polymer Concrete-like Composites with Various Fillers. Materials 2020, 13, 1207. [Google Scholar] [CrossRef]
  8. Ho, L.S.; Huynh, T.-P. Long-Term Mechanical Properties and Durability of High-Strength Concrete Containing High-Volume Local Fly Ash as a Partial Cement Substitution. Results Eng. 2023, 18, 101113. [Google Scholar] [CrossRef]
  9. Chudnovsky, A.; Sehanobish, K. Long-Term Strength of Materials: Reliability Assessment and Lifetime Prediction of Engineering Structures, 1st ed.; CRC Press: Boca Raton, FL, USA, 2023; pp. 1–224. [Google Scholar] [CrossRef]
  10. Novozhilov, V.V. On the prospects of a phenomenological approach to the problem of destruction. In Mechanics of Deformable Bodies and Structures; Nauka: Moscow, Russia, 1975; pp. 349–359. [Google Scholar]
  11. Palmgren, A. Die lebensdauer von Kugellagern. Z. Vereines Dtsch. Ingenieure 1924, 14, 339–341. [Google Scholar]
  12. Langer, B.F. Fatigue failure from stress cycles of varying amplitude. J. Appl. Mech. 1937, 59, A160–A162. [Google Scholar] [CrossRef]
  13. Bailey, J. Attempt to correlate some tensile strength measurement on glass. Glass Ind. 1939, 20, 21–30. [Google Scholar]
  14. Robinson, E.L. Effect of temperature variation on the long time rupture strength of steels. Trans. ASME 1952, 74, 777–780. [Google Scholar] [CrossRef]
  15. Kachanov, L.M. On the fracture time under creep conditions. News USSR Acad. Sci. Dept. Tech. Sci. 1958, 8, 26–31. [Google Scholar]
  16. Rabotnov, Y.N. Continuum Mechanics, 2nd ed.; Nauka: Moscow, Russia, 1988. [Google Scholar]
  17. Kachanov, L.M. Introduction to Continuum Damage Mechanics; Martinus Nijhoff Publishers: Dordrecht, The Netherlands, 1986. [Google Scholar]
  18. Voyiadjis, G.Z. (Ed.) Handbook of Damage Mechanics: Nano to Macro Scale for Materials and Structures, 2nd ed.; Springer: Cham, Switzerland, 2022. [Google Scholar] [CrossRef]
  19. Iskakbayev, A.; Teltayev, B.B.; Rossi, C.O.; Yensebayeva, G.; Abu, B.; Kutimov, K. Impact of loading rate on asphalt concrete deformation and failure. Mag. Civ. Eng. 2020, 8, 10008. [Google Scholar]
  20. Teltayev, B.B.; Iskakbayev, A.I.; Abu, B.D. Steady-state deformation of asphalt concrete. Constr. Build. Mater. 2022, 349, 128754. [Google Scholar] [CrossRef]
  21. Lokoschenko, A.M.; Namestnikova, I.V.; Shesterikov, S.A. Description of epy long-term strength under stepwise stress changes. Strength Mater. 1981, 10, 47–51. [Google Scholar]
  22. Bykov, D.L. Modelling damage accumulation in filled polymers. Fatigue Fract. Eng. Mater. Struct. 1999, 11, 981–988. [Google Scholar] [CrossRef]
  23. Han, X.; Kloeden, P.E. Sigmoidal approximations of Heaviside functions in neural lattice models. J. Differ. Equ. 2020, 268, 5283–5300. [Google Scholar] [CrossRef]
  24. Hatano, N.; Ikeda, M.; Ishikawa, I.; Sawano, Y. Heaviside function as an activation function. J. Appl. Anal. 2022, 29, 1–22. [Google Scholar] [CrossRef]
  25. Marumo, N.; Okuno, T.; Takeda, A. Majorization-minimization-based Levenberg-Marquardt method for constrained nonlinear least squares. Comput. Optim. Appl. 2023, 84, 833–874. [Google Scholar] [CrossRef]
  26. Shao, W.Y.; Fan, J.Y. On the complexity of a stochastic Levenberg-Marquardt method. J. Inequal. Appl. 2024, 20, 1011–1027. [Google Scholar] [CrossRef]
  27. Iskakbayev, A.; Teltayev, B.; Aitbayev, Y.; Zhaisanbayev, A. Accelerated creep of asphalt concrete at medium temperatures. Appl. Sci. 2024, 14, 9393. [Google Scholar] [CrossRef]
  28. ST RK 1225-2019; Road, Airfield Asphalt Concrete Mixtures and Asphalt Concrete. Technical specifications; National Standard of Republic of Kazakhstan: Nur-Sultan, Kazakhstan, 2019.
  29. ST RK 2373-2019; Road, Airfield Stone-Mastic Asphalt Concrete Mixtures and Stone-Mastic Asphalt Concrete. Technical Specifications; National Standard of Republic of Kazakhstan: Nur-Sultan, Kazakhstan, 2019.
  30. ST RK 1373-2013; Bitumens and Bitumen Binders, Oil Road Viscous Bitumens. Technical Specifications; National Standard of Republic of Kazakhstan: Nur-Sultan, Kazakhstan, 2013.
  31. BS EN 12697-26; Bituminous Mixtures, Test Method for Hot Mix Asphalt. Part 26: Specimen Prepared by Roller Compactor; BSI: London, UK, 2003.
  32. Ermolov, S.B.; Potapov, Y.N. To assess the durability of polymers in a wide temperature-time range. Mech. Polym. 1976, 4, 746–749. [Google Scholar]
  33. Goldhoff, R.M. The effect of creep prestrain on creep rupture properties of variable notch sensitivity Cr-Mo-V steel. Mater. Res. 1962, 1, 26–32. [Google Scholar]
  34. Arshakuni, A.L. Prediction of the long-term strength of metals. Mech. Solids 1997, 32, 108–114. [Google Scholar]
  35. ASME. Gases of ASME Boiler and Pressure Vessel Code. ASME: New York, NY, USA, 1988; Volume 159. [Google Scholar]
  36. Larson, F.R.; Miller, I. A time-temperature relationship for rupture and creep stresses. Trans. ASME 1952, 74, 765–775. [Google Scholar] [CrossRef]
Figure 1. Step loading schemes: (a)—a smaller load is applied first, then a larger one; (b)—a larger load is applied first, then a smaller one.
Applsci 15 11236 g001
Figure 2. The roller compactor and the asphalt concrete samples: (a) the roller compactor; (b) the asphalt concrete samples in the shape of a rectangular beam; (c) the asphalt concrete sample in the shape of a slab.
Applsci 15 11236 g002
Figure 3. The installation with a heat chamber for testing: (a) a general view of the installation; (b) the heat chamber.
Applsci 15 11236 g003
Figure 4. Creep curve of SMA-20 (a result of testing one sample of the asphalt concrete).
Applsci 15 11236 g004
Figure 5. Creep curve of SMA-20+SBS (a result of testing one sample of the asphalt concrete).
Applsci 15 11236 g005
Figure 6. Long-term strength of the asphalt concrete (in the figure, each point represents the average test result of 4 to 6 asphalt concrete samples).
Applsci 15 11236 g006
Figure 7. Experimental (point markers) and calculated values (lines) of long-term strength of the pearlitic steel grade ASTMX2M1.
Applsci 15 11236 g007
Table 1. Destruction time of the optical fiber at 30% and 85% moisture.
Stress σ, MPaFailure Time, sDifference, %
Experimental teCalculated tcal
moisture W = 30%
21003446.403448.60+0.06
20009957.149960.03+0.03
195015,965.5415,959.08−0.04
190030,286.0030,266.88−0.06
moisture W = 85%
2000614.80614.800
19002397.082397.080
17008541.458541.450
160015,550.5115,550.530
Table 2. Experimental and calculated characteristics of the aluminum alloy under step loading.
Loading SchemeStress, MPaDuration of the First Step t1, hTime of Destruction, hDifference
First Step
σ1
Second Step
σ2
teTBRtcal12
Figure 1a126.3140.6115237309240+30.9+1.3
Figure 1b140.6126.3114573449573−21.60
Figure 1b140.698.369259021272600−17.9+0.4
Figure 1a98.3140.6211200346200+73.00
Table 3. Values of parameters α, δo and instantaneous strength of the pearlitic steel.
Temperature T, °CParameters Instantaneous   Strength   σ , MPa
αδo, hour(α−1)
980.501250.000368414.96
1260.80.012449430.49
1540.8250.024532420.41
1810.80.024883352.28
2090.78750.029114306.74
2370.7968750.040985282.95
2650.781250.049509257.40
2930.7968750.070326244.94
Disclaimer/Publisher’s Note: The statements, opinions and data contained in all publications are solely those of the individual author(s) and contributor(s) and not of MDPI and/or the editor(s). MDPI and/or the editor(s) disclaim responsibility for any injury to people or property resulting from any ideas, methods, instructions or products referred to in the content.