1. Introduction
Reinforced concrete (RC) is considered an artificial rock created by humans, making it a durable material that can withstand various environmental conditions [
1]. However, in coastal areas, excessive chlorides can lead to electrochemical corrosion of the reinforcing steel [
2]. As a result, RC structures in these environments often experience premature damage [
3]. The primary reason for this deterioration is the failure to consider the interaction between the structure and its environment [
4]. The extent of deterioration depends on both the aggressiveness of the environment and the permeability of the concrete [
5], which is influenced by factors such as the degree of hydration, the water-to-cement (w/c) ratio, and the quality of the materials used. Therefore, in adverse climatic conditions, special designs are necessary to ensure the durability of concrete [
4]. This involves creating a network of finer pores with lower permeability to prevent harmful external agents, such as chlorides, from penetrating the material [
6,
7].
Regulations have evolved to include durability criteria that specify minimum cement contents ranging from 300 to 450 kg/m
3 [
8]. This change results in stronger, less permeable, and more durable concrete. However, it also comes with increased costs and reduced energy efficiency. The manufacturing of one ton of cement emits between 820 and 1000 kg of CO
2 [
9,
10], with an average estimate around 850 kg of CO
2 per ton of clinker [
11]. According to the International Energy Agency [
12], the cement industry is the second largest industrial emitter of CO
2. In 2022, its global production reached 4.1 billion metric tons [
13], accounting for approximately 8 to 10% of global CO
2 emissions [
10,
14]. In response to these challenges, the industry has initiated promising sustainability efforts over the past decade, aiming to achieve zero emissions by 2050 [
9,
15].
There is a growing demand for eco-friendly materials to help reduce the negative impact on the environment [
16]. In response to the challenges of achieving both energy efficiency and durability, sustainable concrete has emerged. This type of concrete utilizes innovative techniques that consume less carbon and energy compared to traditional concrete [
17,
18]. Sustainable concrete replaces cement with industrial waste materials [
1], such as pozzolanic ashes, which enhance the density of the cement paste [
19]. This alteration leads to a reduction in pore continuity, making it more difficult for chlorides to penetrate [
20,
21]. Furthermore, the ashes fill the voids left by sand within the granular structure [
22]. Consequently, this results in concrete that requires smaller amounts of cement while exhibiting lower permeability and greater durability [
23].
In recent years, several studies have explored the potential of using various materials as alternatives to traditional pozzolans in concrete. Examples of these materials include corn stover ash [
24], ternary mixtures of volcanic ash with steel fibers [
25], banana leaf ash [
26], rice husk ash [
27], basil ash [
28], coconut shell ash [
29], oat husk ash [
30], and cashew leaf ash [
31], among others. Most of these studies primarily focus on evaluating the mechanical properties of the concrete, while the influence of these pozzolans on durability and energy efficiency remains underexplored. Traditionally, strength tests have been the main criterion for concrete acceptance. However, evolving regulations now require a more comprehensive evaluation that also includes durability. A significant challenge is the lack of a universal test for accurately assessing durability [
32], which has become a key focus for structural engineers, designers, and architects. Many previous studies either do not address durability or rely on indirect methods such as water absorption, porosity determination, or the Rapid Chloride Permeability Test (RCPT) [
33]. The disadvantage of the methods mentioned is that they do not directly measure chloride permeability, and they require many hours for sample preparation and testing [
7]. As an alternative for evaluating durability in this study, the electrical resistivity (ER) test was utilized. This test offers several advantages over previous methods: (1) the procedure and sample preparation are much simpler [
7], (2) it can be completed in less than five minutes per specimen, and (3) it is a non-destructive test that can be performed before the strength test. The ease of application has led to an increase in the use of ER as a quality control tool over the last three decades [
34] because it correlates with key stages in the life cycle of a structure: the initiation period (chloride penetration) and the propagation period (corrosion rate). As such, it serves as an indicator of susceptibility to chloride penetration [
35].
This study investigates the impact of Volcanic Ash (VA) and Sugarcane Bagasse Ash (SCBA) on the electrical resistivity (ER) of green concretes, as well as the overall performance of the material. Previous research has examined ER and pozzolanic additions separately; however, there is limited comparative analysis on how these additions affect ER, energy efficiency, and the reduction in heat generated during hydration. The ER technique was selected to monitor these experimental mixtures to predict the likelihood of corrosion in reinforced concrete structures and assess their feasibility for application in the coastal areas of the Gulf of Mexico, which are characterized by high chloride concentrations. The sustainability of the concrete was evaluated by analyzing the energy efficiency implications of replacing various percentages of cement with pozzolanic materials. This research contributes valuable insights into the ER of sustainable concretes with water-to-cement ratios greater than 0.45, as well as the environmental viability of their production. Additionally, the study provides information regarding the reduction in the heat of hydration (or fresh temperature) for each type of mix, which may indicate the potential for using these sustainable concretes for thermal insulation purposes and their possible impact on building sustainability.
The study focuses on the durability of concrete (measured through ER), because the research was carried out in the Veracruz-Boca del Río metropolitan area (VBMA), which belongs to the coasts of the Gulf of Mexico. This region stands out for its corrosive aggressiveness along with the city of Coatzacoalcos [
36,
37,
38]. The atmospheric classification of the VBMA, according to the international standard ISO 9223 [
39], corresponds to a C-5 environment (very high corrosivity) [
36]. This classification is due to its temperatures, which can reach above 40 °C in summer, a relative humidity above 80% and the high concentrations of chlorides and SO
2. Thus, durable concretes are required for the construction of structures, without losing the sustainable construction trends that currently prevail in the construction industry. Furthermore, if sustainable concretes based on binary and ternary mixtures of this research are suitable for the VBMA with high levels of corrosivity, they may also be applicable to the rest of the coastal areas of the Gulf of Mexico that have lower categories of corrosion.
2. Materials and Methods
2.1. Electrical Properties of Concrete
When discussing concrete, the focus is often on its mechanical properties, such as compressive strength, modulus of elasticity, and plasticity. However, the electrical properties—specifically resistivity and conductivity—are also crucial. These properties reflect how concrete responds to electric current and are influenced by the material’s structure [
40]. Electrical conductivity measures a material’s ability to conduct electric current, while electrical resistivity (ER), the inverse of conductivity, indicates the material’s capacity to resist the flow of current per unit volume. For ER calculations, a sample with a cross-section of 1 m
2 and a thickness of 1 m is considered, with the unit of measurement expressed in Ω cm [
40,
41]. According to Ohm’s Law, ER can be determined using Equation (1). Finally, clearing from Equation (1) the value of ρ, Equation (2) is obtained, which allows the ER to be calculated.
where
electrical resistivity [Ω]
V = voltage between the electrodes [volts]
I = intensity of the electric current flowing through the material [amperes]
ρ = electrical resistivity [Ω cm] o [Ω m]
L = length of the conductive material [m] o [cm]
A = area or cross-section [m2] o [cm2]
Materials can be classified based on their behavior concerning electricity into three categories: (1) insulators, (2) conductors, and (3) semiconductors [
42]. In its dry state, concrete has a high electrical resistivity (ER) [
43] and is considered a dielectric (insulating) material [
44]. However, in humid environments, the ER can decrease significantly due to the presence of water and ion migration, causing concrete to behave more like a semiconductor [
45]. This is why the ER can vary widely, ranging from 10
6 Ω-m in oven-dried samples to 10
1 Ω-m in saturated concrete [
46,
47,
48].
Several factors influence the electrical resistivity of concrete, including: (1) the degree of saturation of the material, (2) the microstructure of the paste, and (3) temperature changes. The degree of saturation is crucial because electric current is transported by ions dissolved in the pore solution. Increased humidity and larger interconnected pores lead to lower ER values. Therefore, ER serves as an indirect indicator of both porosity and water saturation in the material [
41]. Additionally, the microstructure of the paste is largely determined by the water-to-cement (w/c) ratio, which affects both its porosity and permeability. Lower water-to-cement (w/c) ratios, extended curing times (hydration), and the incorporation of reactive minerals all contribute to an increase in the electrical resistivity (ER) [
46]. Additionally, temperature changes impact the ER; higher temperatures result in an increase in ion concentration in the pore solution and a decrease in the ER [
49,
50]. Based on laboratory studies conducted by various researchers, Polder [
35] determined that the ER varies by 3% for saturated concrete and 5% for dry concrete with each degree Kelvin of temperature change. Therefore, it is advisable to maintain a reference temperature between 20 °C and 23 °C [
35,
47,
49]. If the cylinder temperature deviates from this range, adjustments should be made using the Arrhenius Law, as represented in Equation (3).
where
resistivity to the temperature of reference (23 °C) [Ω m]
resistivity to the temperature of the trial [Ω m]
energy of activation by conduction [kJ/mol]
universal constant of the gases [8.314 J/(mol °K)]
temperature of the test [°K]
temperature of reference, for example, at 23 °C [296.15 °K]
The electrical resistivity (ER) of concrete allows for the assessment of several important factors: (a) hardening in the fresh state, (b) degree of curing, (c) resistance to chloride penetration and carbonation, and (d) the corrosion rate of the embedded steel by indicating the level of humidity within the concrete [
51]. The use of ER has become more widespread because it serves multiple purposes: (1) evaluating the risk of corrosion, (2) quality control in concrete production [
46], and (3) assessing the hydration process. Initially, the electrical resistivity of concrete is very low, but as cement hydrates and the concrete sets and hardens, the resistivity increases in tandem with the mechanical strength. In concrete without additives, a higher electrical resistivity indicates lower porosity and greater mechanical strength, as it suggests a higher solid phase per unit volume [
41].
2.2. Measurement Techniques and Regulations for ER
There are three techniques for evaluating electrical resistivity:
1. sulk electrical resistivity (BER): This technique is measured using the direct method.
2. surface electrical resistivity (SER): This is measured using the Wenner method.
3. embedded electrodes: This method is used for measuring fresh concrete.
In Mexico, the Standard NMX-C-514-ONNCCE-2019 [
52] outlines the procedures for measuring the electrical resistivity (ER) of concrete and identifies two types of resistivity:
1. apparent resistivity (AR): This is measured in unsaturated concrete that contains water within in situ concrete elements. The AR measurement utilizes either the 4-point or the Wenner method.
2. wet electrical resistivity (WER): This is measured in a laboratory on concrete samples (cylinders or cores) that have been saturated with water for at least 24 h. Both the direct method and the Wenner method can be applied for WER measurements.
The standard recommends using an alternating current (AC) source for these measurements, as direct current (DC) can cause polarization of the metal electrodes, leading to inaccurate results.
At the international level, the ASTM C 1876 standard [
53] has established guidelines for measuring apparent electrical resistivity in situ, while the AASHTO standard T 358 [
54] assesses the surface resistance of concrete. Additionally, the AASHTO TP 119 standard [
55] specifies the procedure for determining mass electrical resistivity.
2.3. Experimental Design
The experimental design was divided into three parts (
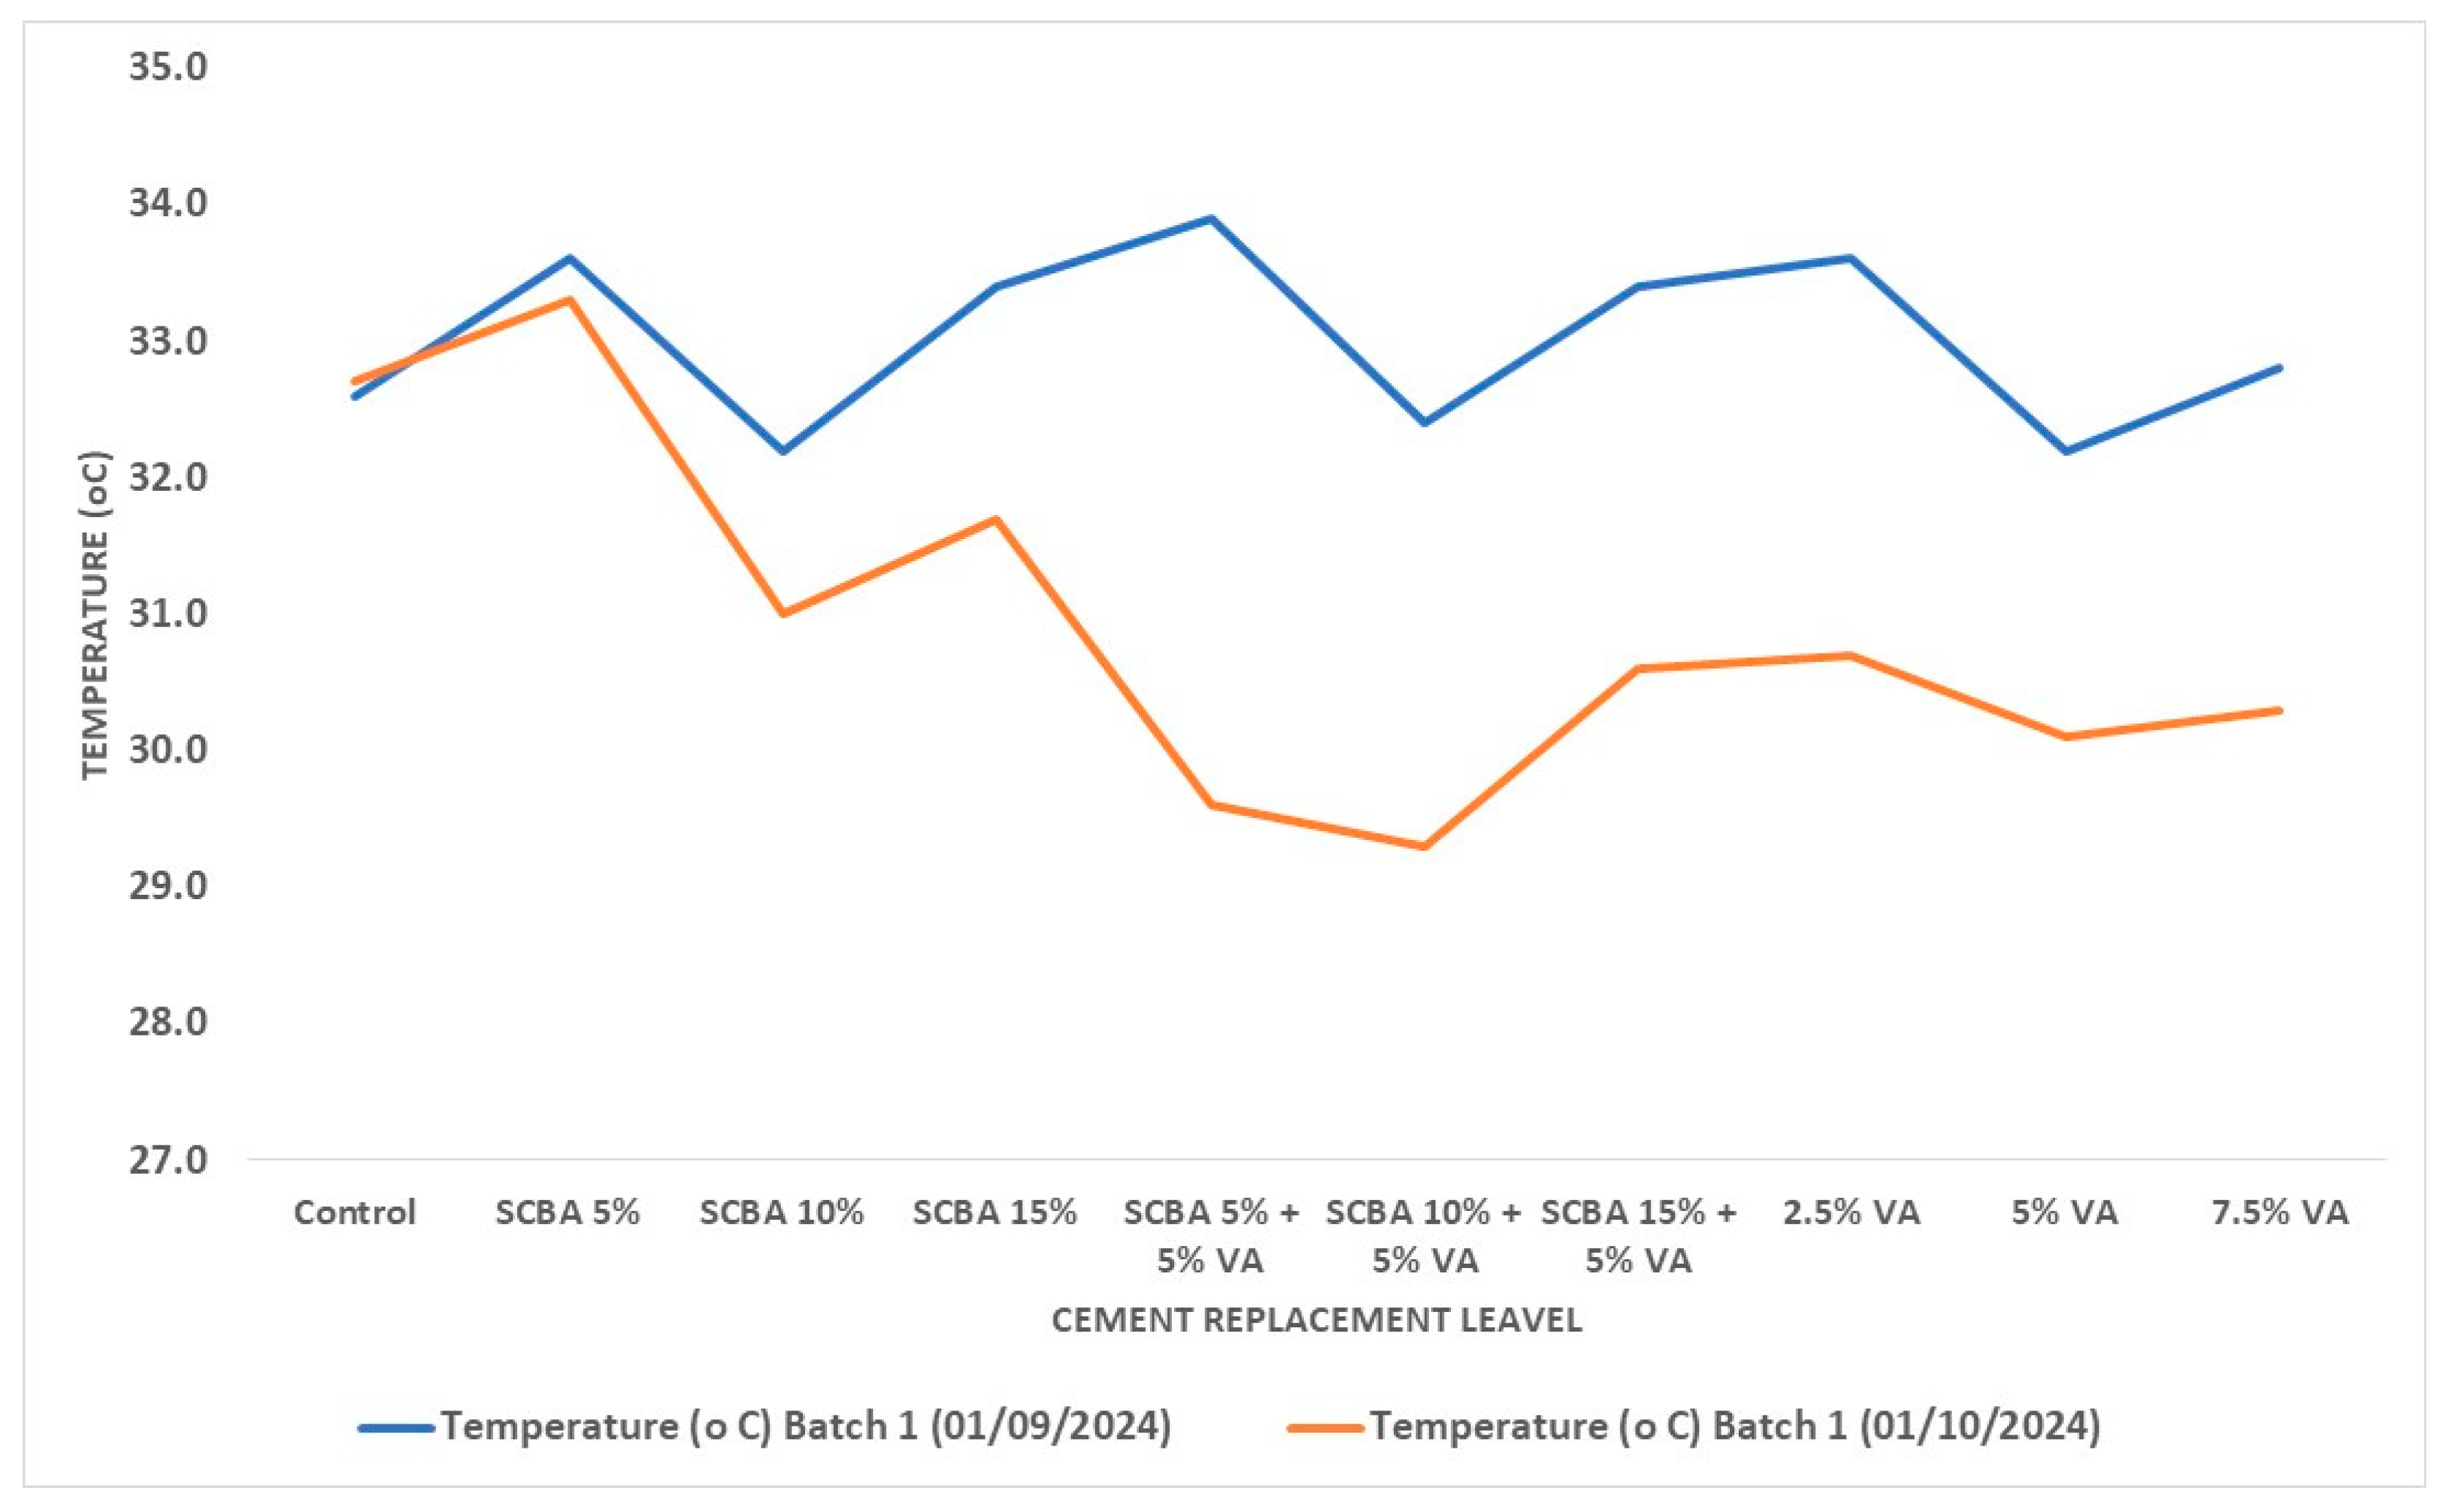
Figure 1). The first stage involved characterizing the materials. In the second stage, we manufactured concrete mixtures and determined their mechanical and electrical properties. Finally, the third stage included an analysis of the energy efficiency of each mixture. Several variables were kept constant throughout the experiment, including the water-to-cement (w/c) ratio, the granulometry of the aggregates, the type of cement, and the method of curing. We considered three independent variables: (1) the type of pozzolan, (2) the percentage of the addition, and (3) the duration of the tests. A noise factor identified in the study was the relative humidity (RH) of the environment on the day of casting. For fresh concrete, we evaluated the following properties: (1) slump (ASTM C 143) [
56], (2) unit weight (ASTM C 138) [
57], and (3) temperature (ASTM C 1064) [
58]. For hardened concrete, we measured two output variables: (1) compressive strength (ASTM C 39) [
59] and (2) bulk electrical resistivity (REM) according to NMX-C-514-ONNCCE.
2.4. Materials Used
The concrete mixes were prepared using CPC 30 R RS cement produced in Mexico, along with river sand, gravel, and water sourced from the municipal water supply of Veracruz City and Port, located in the Gulf of Mexico region.
2.5. Collection and Processing of SCBA and VA
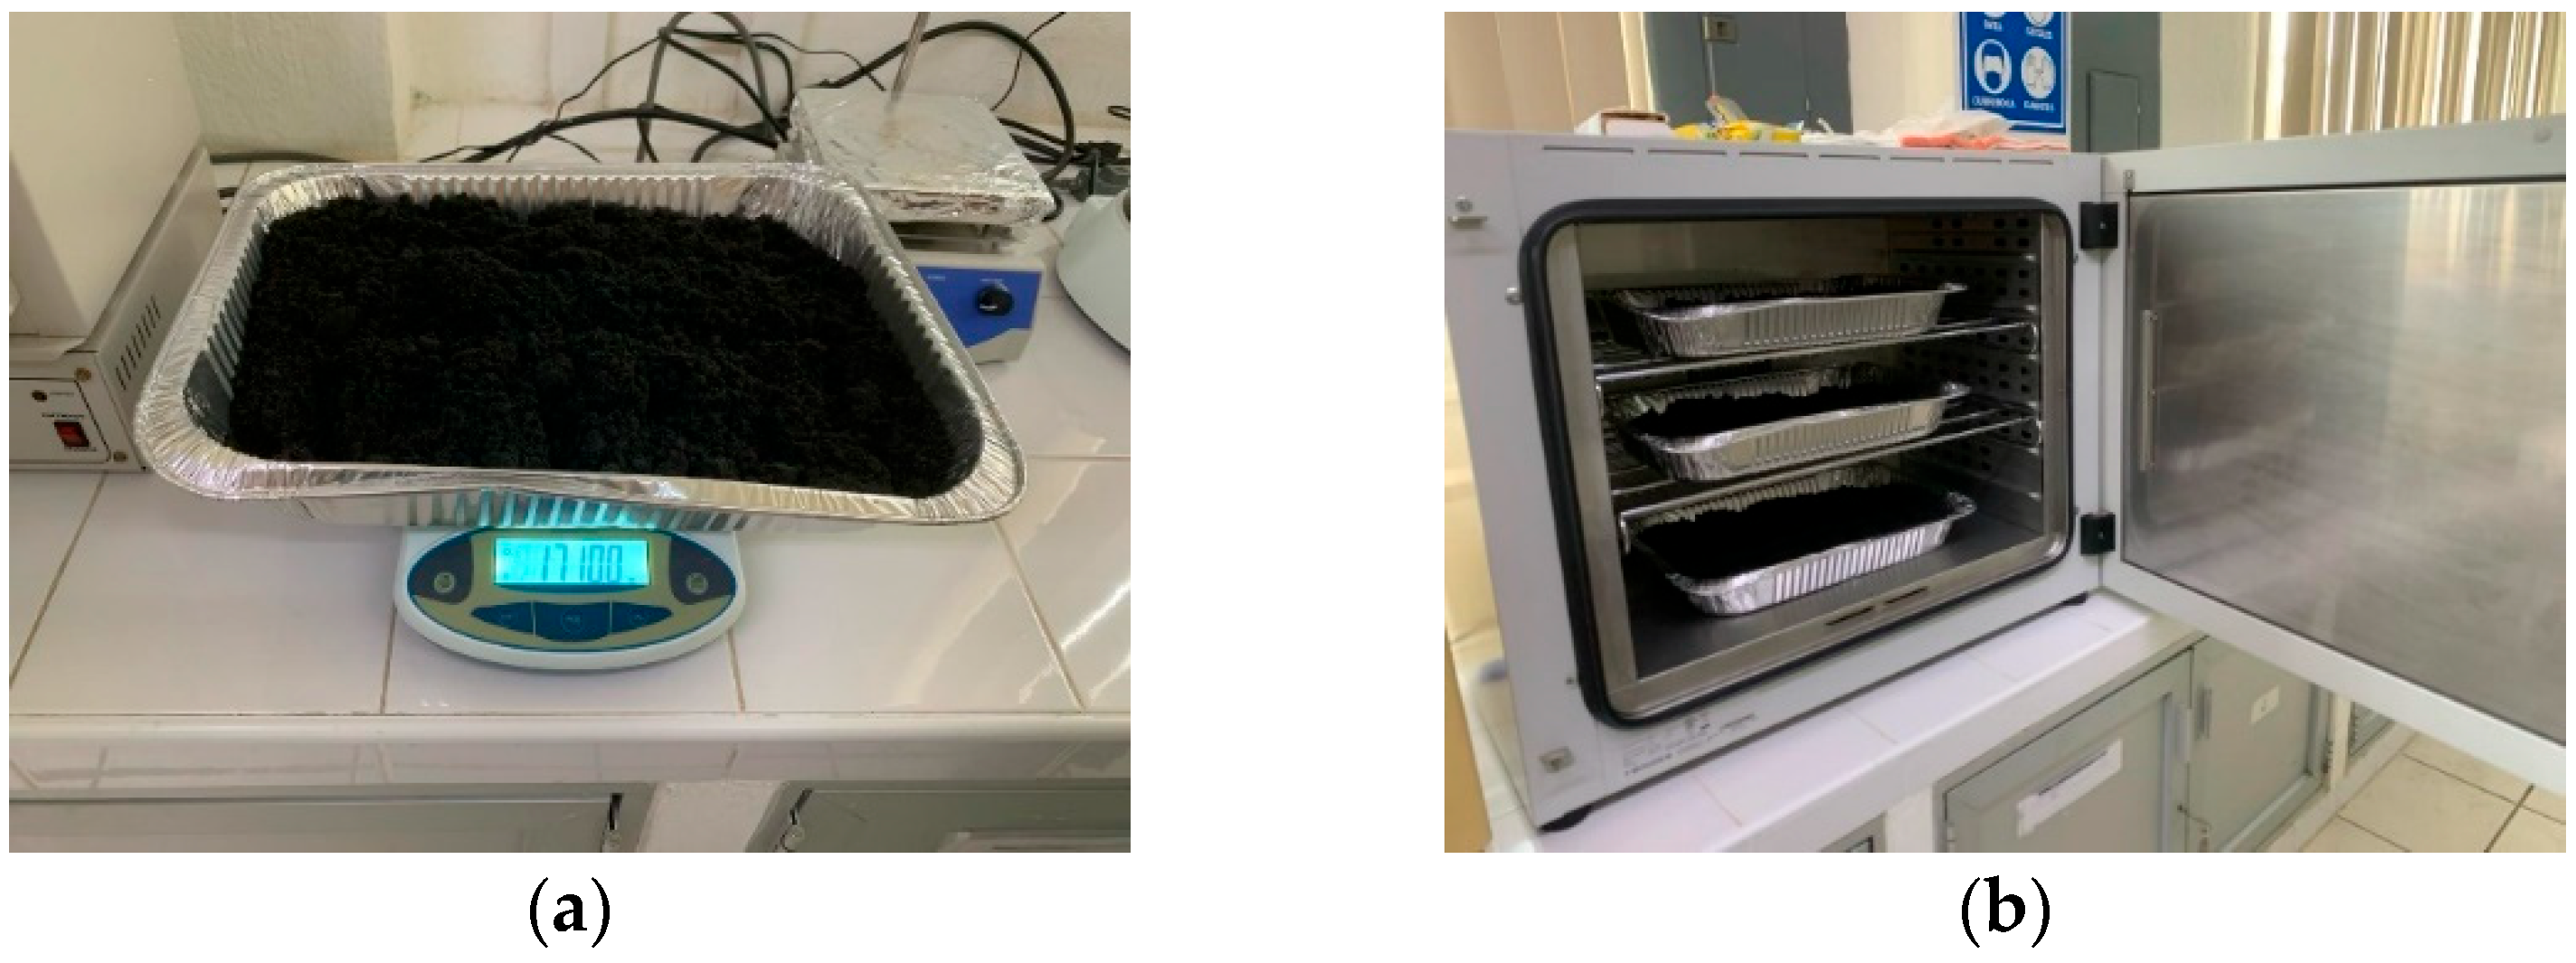
The sugarcane bagasse ash (SCBA) was obtained in March 2024 through a donation from the La Gloria Sugar Mill, which is situated 42 km from Veracruz City and Port, Mexico. According to the information provided by the sugar mill, the combustion process occurs at temperatures between 850 °C and 900 °C. The ashes are collected in a wet form from the bottom of the boiler at the sugar mill. In the laboratory, the wet ashes were placed in an industrial dryer at 100 °C for 8 h to remove moisture (
Figure 2). After drying, the ashes were sieved using a No. 100 mesh screen.
The volcanic ash was collected in a dry state in Puebla, Mexico, eliminating the need for any additional drying process. This ash originates from the eruptions of the Popocatépetl Volcano in mid-2024. However, there was an issue with the ash containing organic residue, which was removed by sieving through 100 and 200 mesh screens.
2.6. Characterization of Materials
2.6.1. Sand and Gravel
The sand was spread out and left to dry naturally for 24 h before being sieved through a No. 4 mesh screen, with any retained material discarded. The gravel was sieved through a 1-inch mesh screen and then washed. After washing, it was spread out and allowed to dry naturally for 48 h. The volumetric weight of the stone aggregates was determined according to ASTM C 29 [
60]. The samples were saturated for 24 h, after which the density and percentage absorption of the fine aggregate were measured following ASTM C 128 [
61], while the coarse aggregate was assessed according to ASTM C 127 [
62]. The granulometric analysis of the stone aggregates was conducted in accordance with the ASTM C 136 standard [
63], with results complying with ASTM C 33 [
64]. A summary of the obtained properties is presented in
Table 1.
2.6.2. Chemical Analysis of SCBA, VA and Cement
The results from the X-ray Fluorescence (XRF) studies on the SCBA, VA, and cement samples are presented in
Table 2. It is evident from the table that both the SCBA and VA meet the ASTM C 618 [
65], which qualifies them as pozzolanic additives.
Using X-ray Diffraction (XRD), the crystallographic phases of the materials were identified. The qualitative analysis confirmed the composition of both the cement and the sugarcane bagasse ash (SCBA). As illustrated in
Figure 3, the mineralogical composition of CPC 30 R RS cement shows that tricalcium silicate is the predominant phase, making up nearly 57% of the clinker composition. Additionally, the magnesium oxide (MgO) content is 1.4%, which is below the 4% limit set by the standard. The percentage of gypsum also remains within the permitted 5% as per NMX-C-414-ONNCCE-2017 [
66]. Furthermore, the content of tricalcium aluminate (C3A) does not exceed the 8% threshold specified in the ASTM C 150 standard for type V cements [
67].
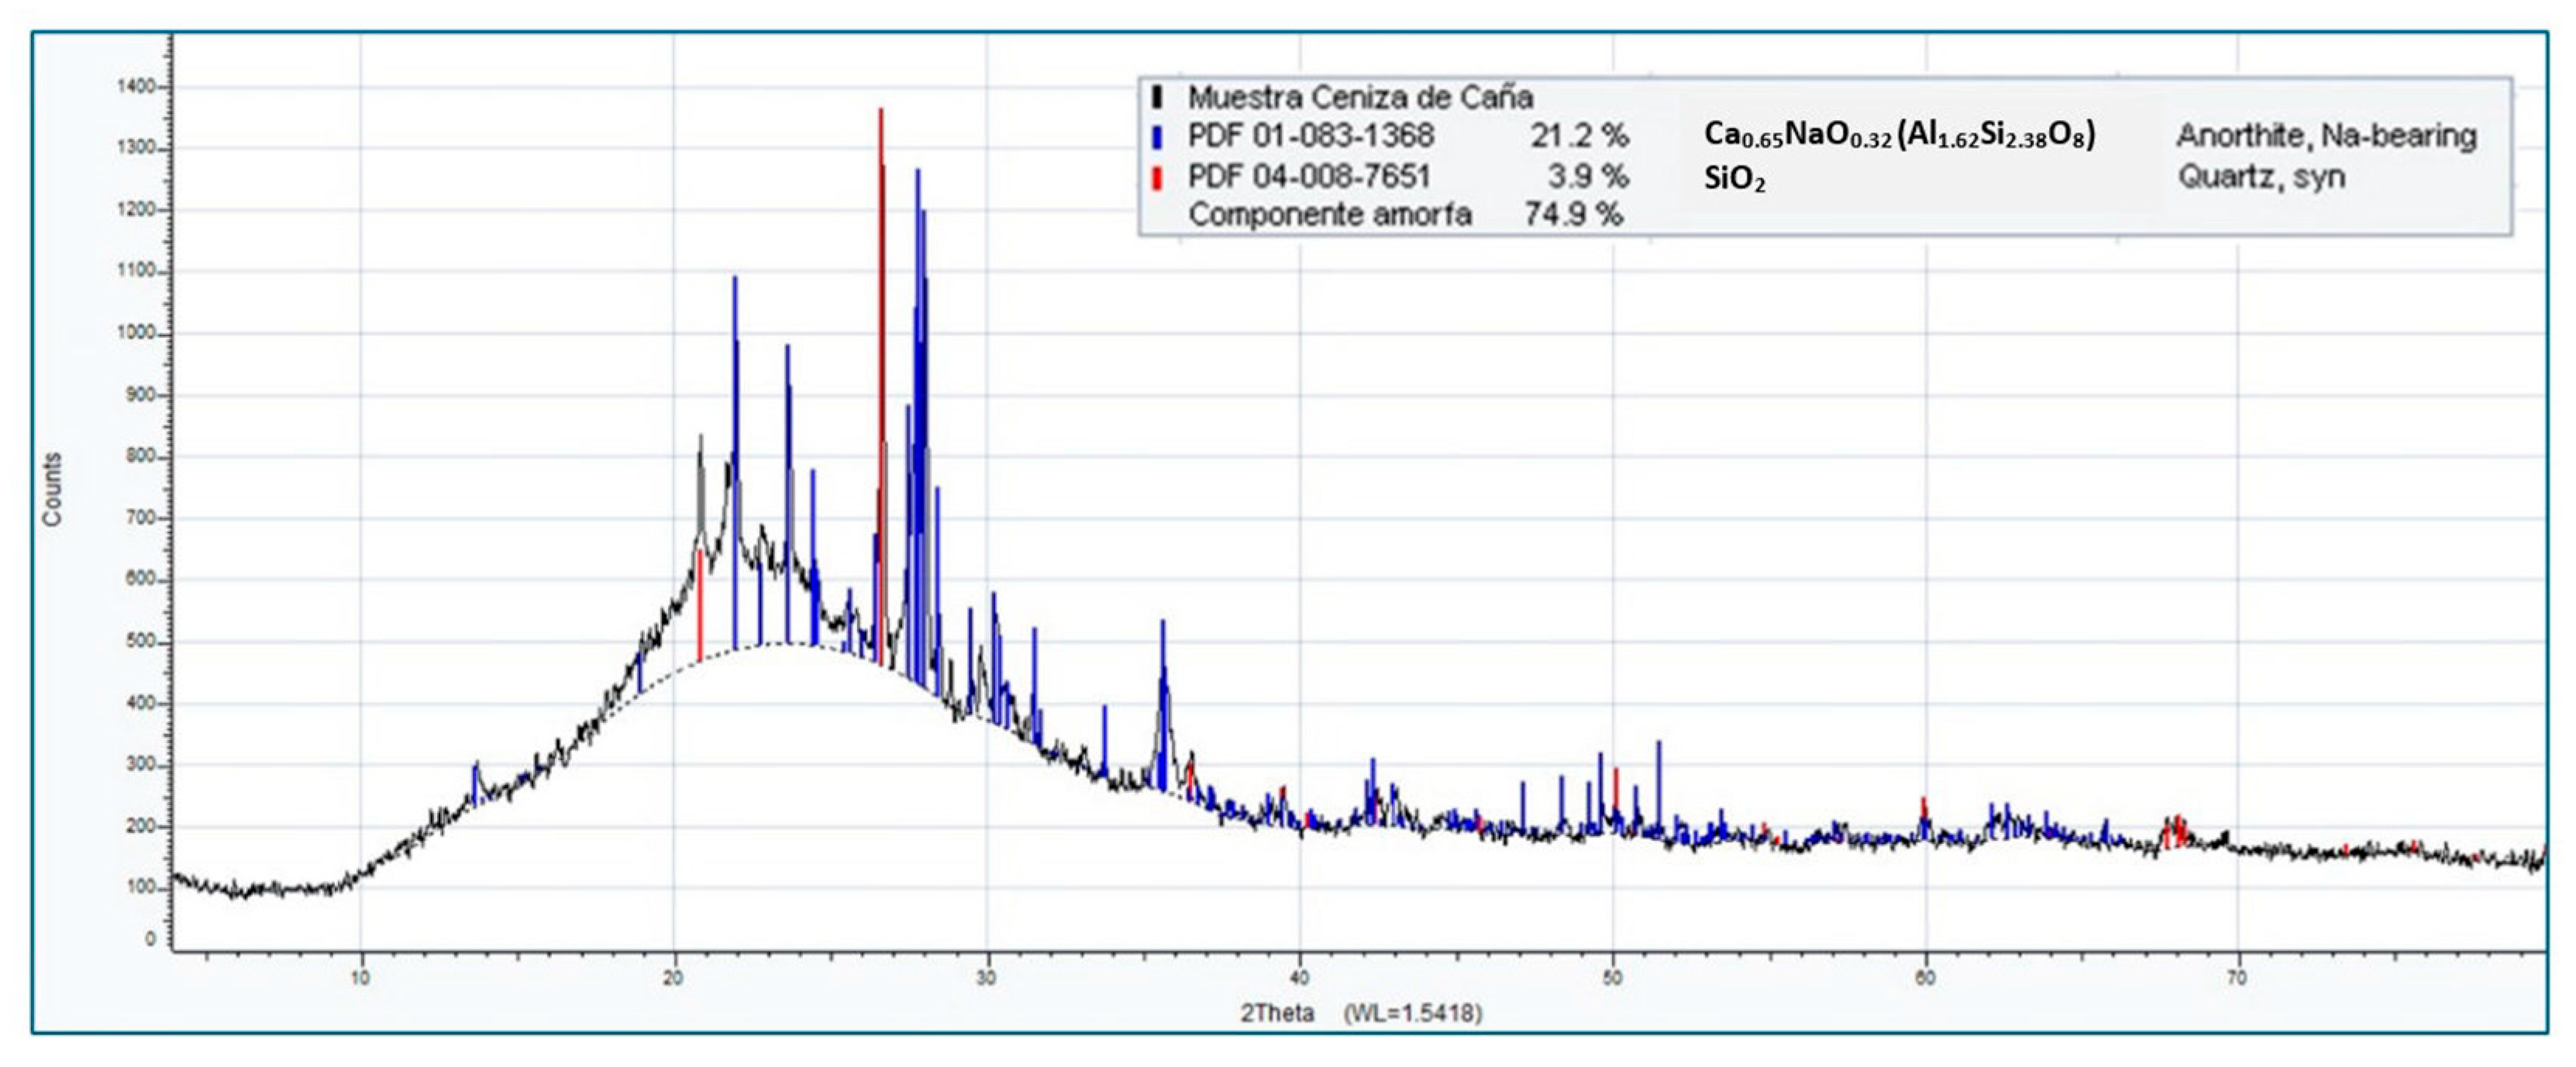
The X-ray diffraction (XRD) analysis, as shown in
Figure 4, revealed that the amorphou s component of the sugarcane bagasse ash (SCBA) makes up 74.9%. This finding aligns with the chemical composition presented in
Table 2, obtained through X-Ray fluorescence (XRF), which indicates that silica (SiO
2) is the predominant component of the ash. Furthermore, the diffractogram of the SCBA indicates the presence of 3.9% quartz, which is crystalline SiO
2, and 21.2% anorthite crystals. The formation of these crystalline components is attributed to the burning of the SCBA under uncontrolled conditions in boilers, where ash may contain crystalline silica at temperatures exceeding 800 °C [
68].
2.7. Preparation of Concrete Mixtures
2.7.1. Control Mix
The control mix was formulated using the ACI method 211.1 [
69], for a slump between 7.5–10 cm, with a water-to-cement (w/c) ratio of 0.57. River sand and gravel sourced from the Veracruz-Boca del Río metropolitan area in Mexico were employed, as detailed in
Table 1. The cement used in the mix was CPC 30 RS, and its chemical composition is provided in
Table 2. The water used for all mixtures was obtained from the local supply network, which has a pH of 7.0, meeting the requirements of ASTM C 1602 [
70] and NMX-C-122-ONNCCE-2019 [
71]. No additives or superplasticizers were included in this mix or in the variations with different percentages of additions.
Table 3 presents the proportions per cubic meter of concrete for the control mix.
2.7.2. Mixtures with Pozzolanic Additives
Two types of additions were used to evaluate the effect of the expanded recycling (ER): (1) artificial pozzolan (sugarcane bagasse ash, SCBA) and (2) natural pozzolan (volcanic ash, VA). Their chemical compositions are respectively shown in
Table 2. Three types of green concrete mixtures were designed, each incorporating three different replacement percentages. These include: (1) Binary mixtures with SCBA, (2) Ternary mixtures with VA and SCBA in proportions of 1:1, 1:2, and 1:3 (where VA and SCBA together replace 20% of the cement by weight), and (3) Binary mixtures with VA. This results in a total of nine green concrete mixtures, along with one control mixture. The nomenclature for each of the mixtures is provided in
Table 4.
Given that the modulus of fineness (MF) of the sand used is 2.9, the porosity of the sustainable concrete was decreased by substituting 5% of the fine aggregate with silica sand. The proportions of each type of concrete are detailed in
Table 5a–c.
2.7.3. Mixture Manufacturing Procedure
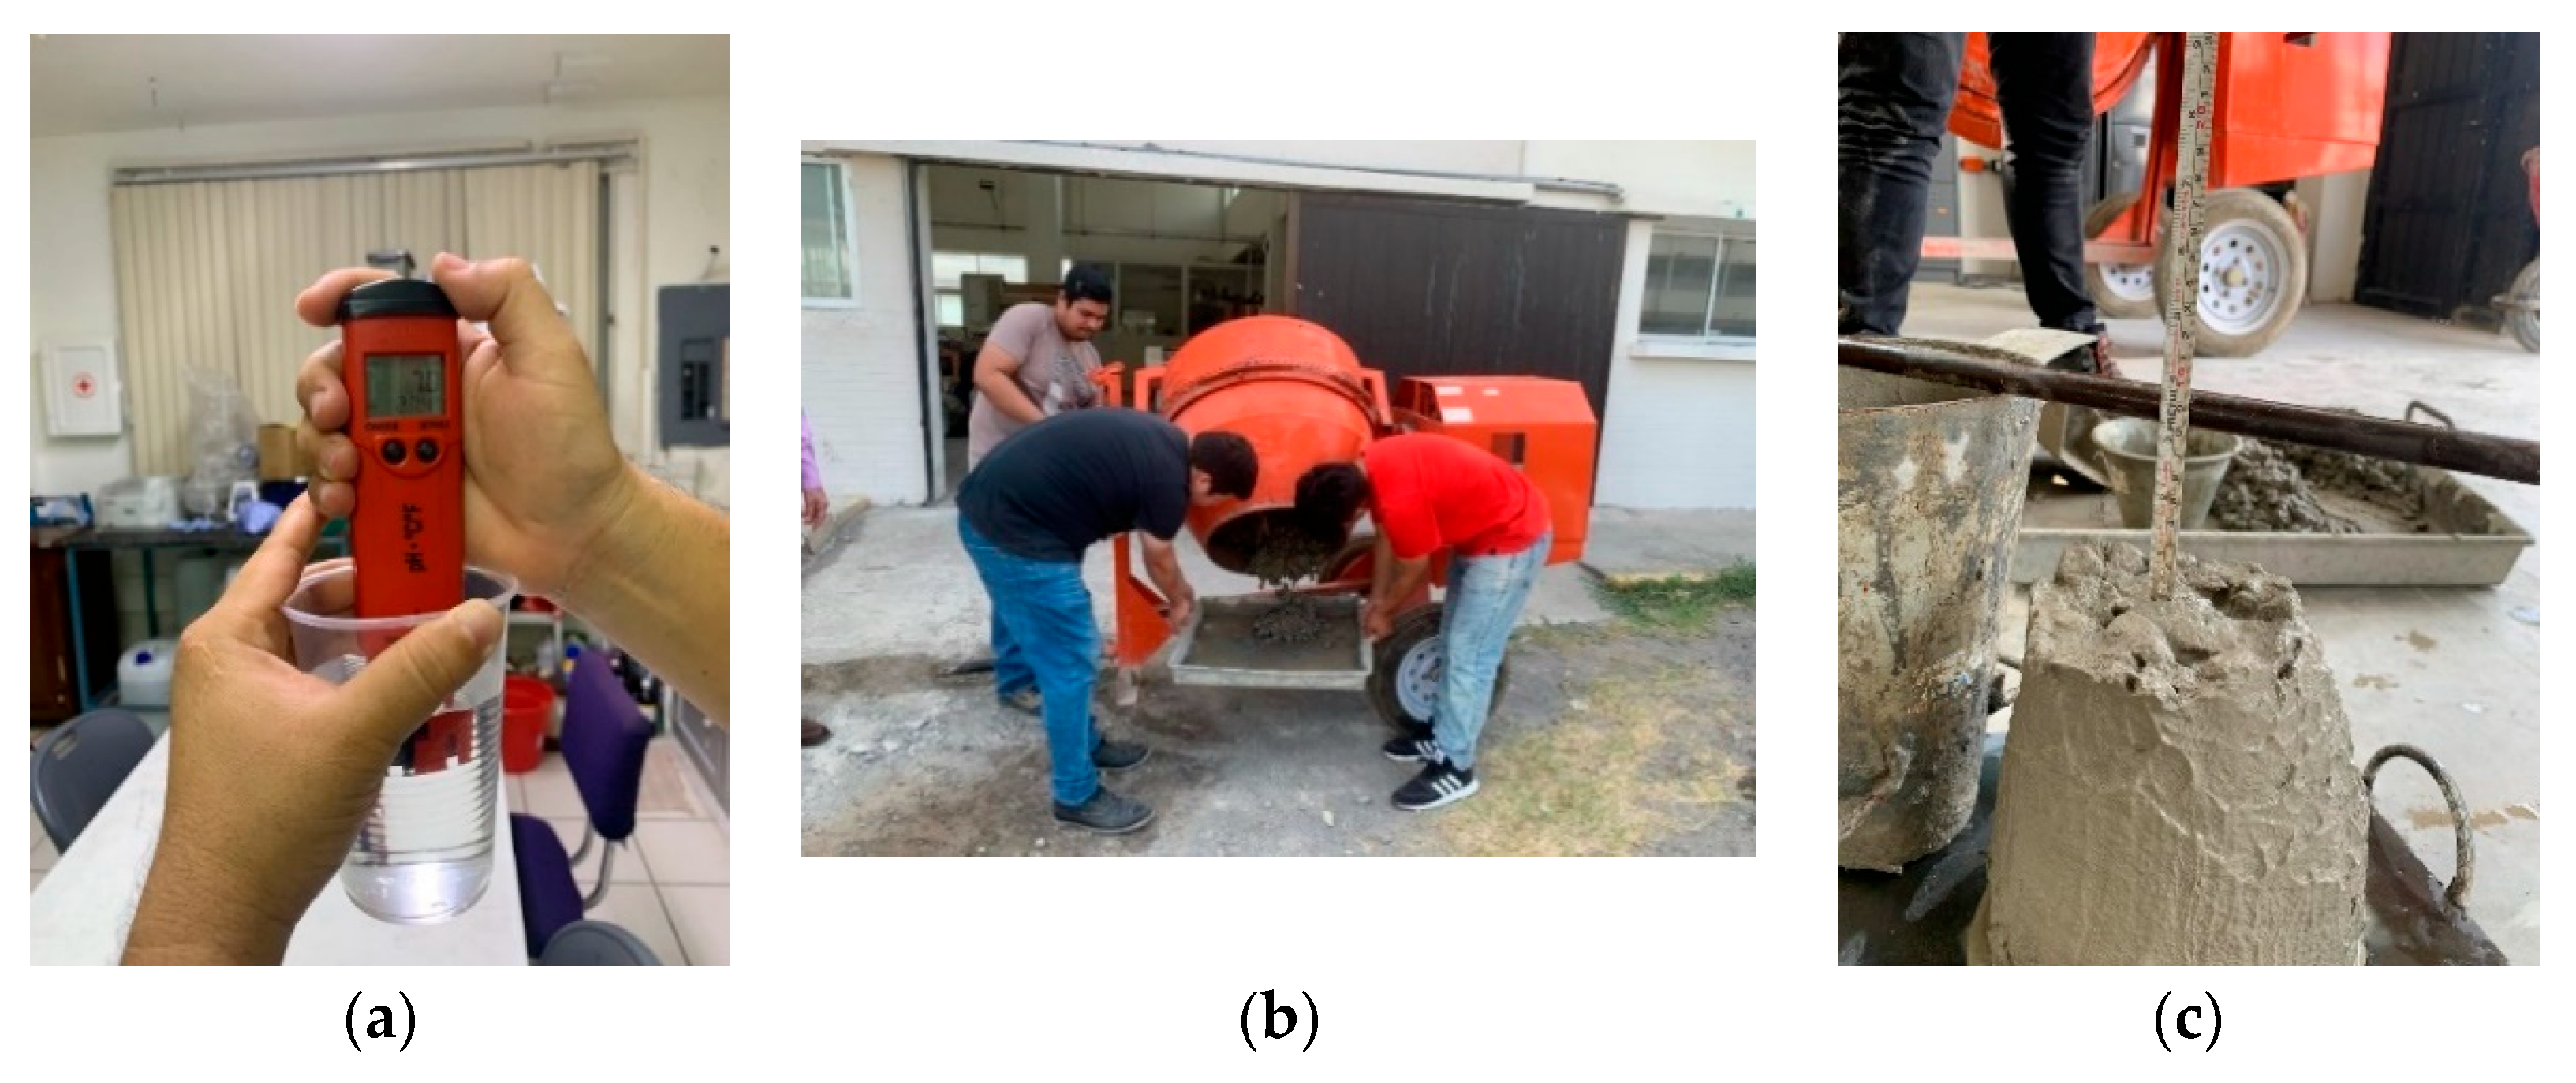
The materials were weighed, and the water’s pH level was verified to be at 7.0 (
Figure 5a). The VAs were incorporated during the manufacturing process, while the SCBAs were pre-mixed with the cement before the mixture was introduced into the mixer (
Figure 5b). Finally, the slump of the mixture was measured (
Figure 5c).
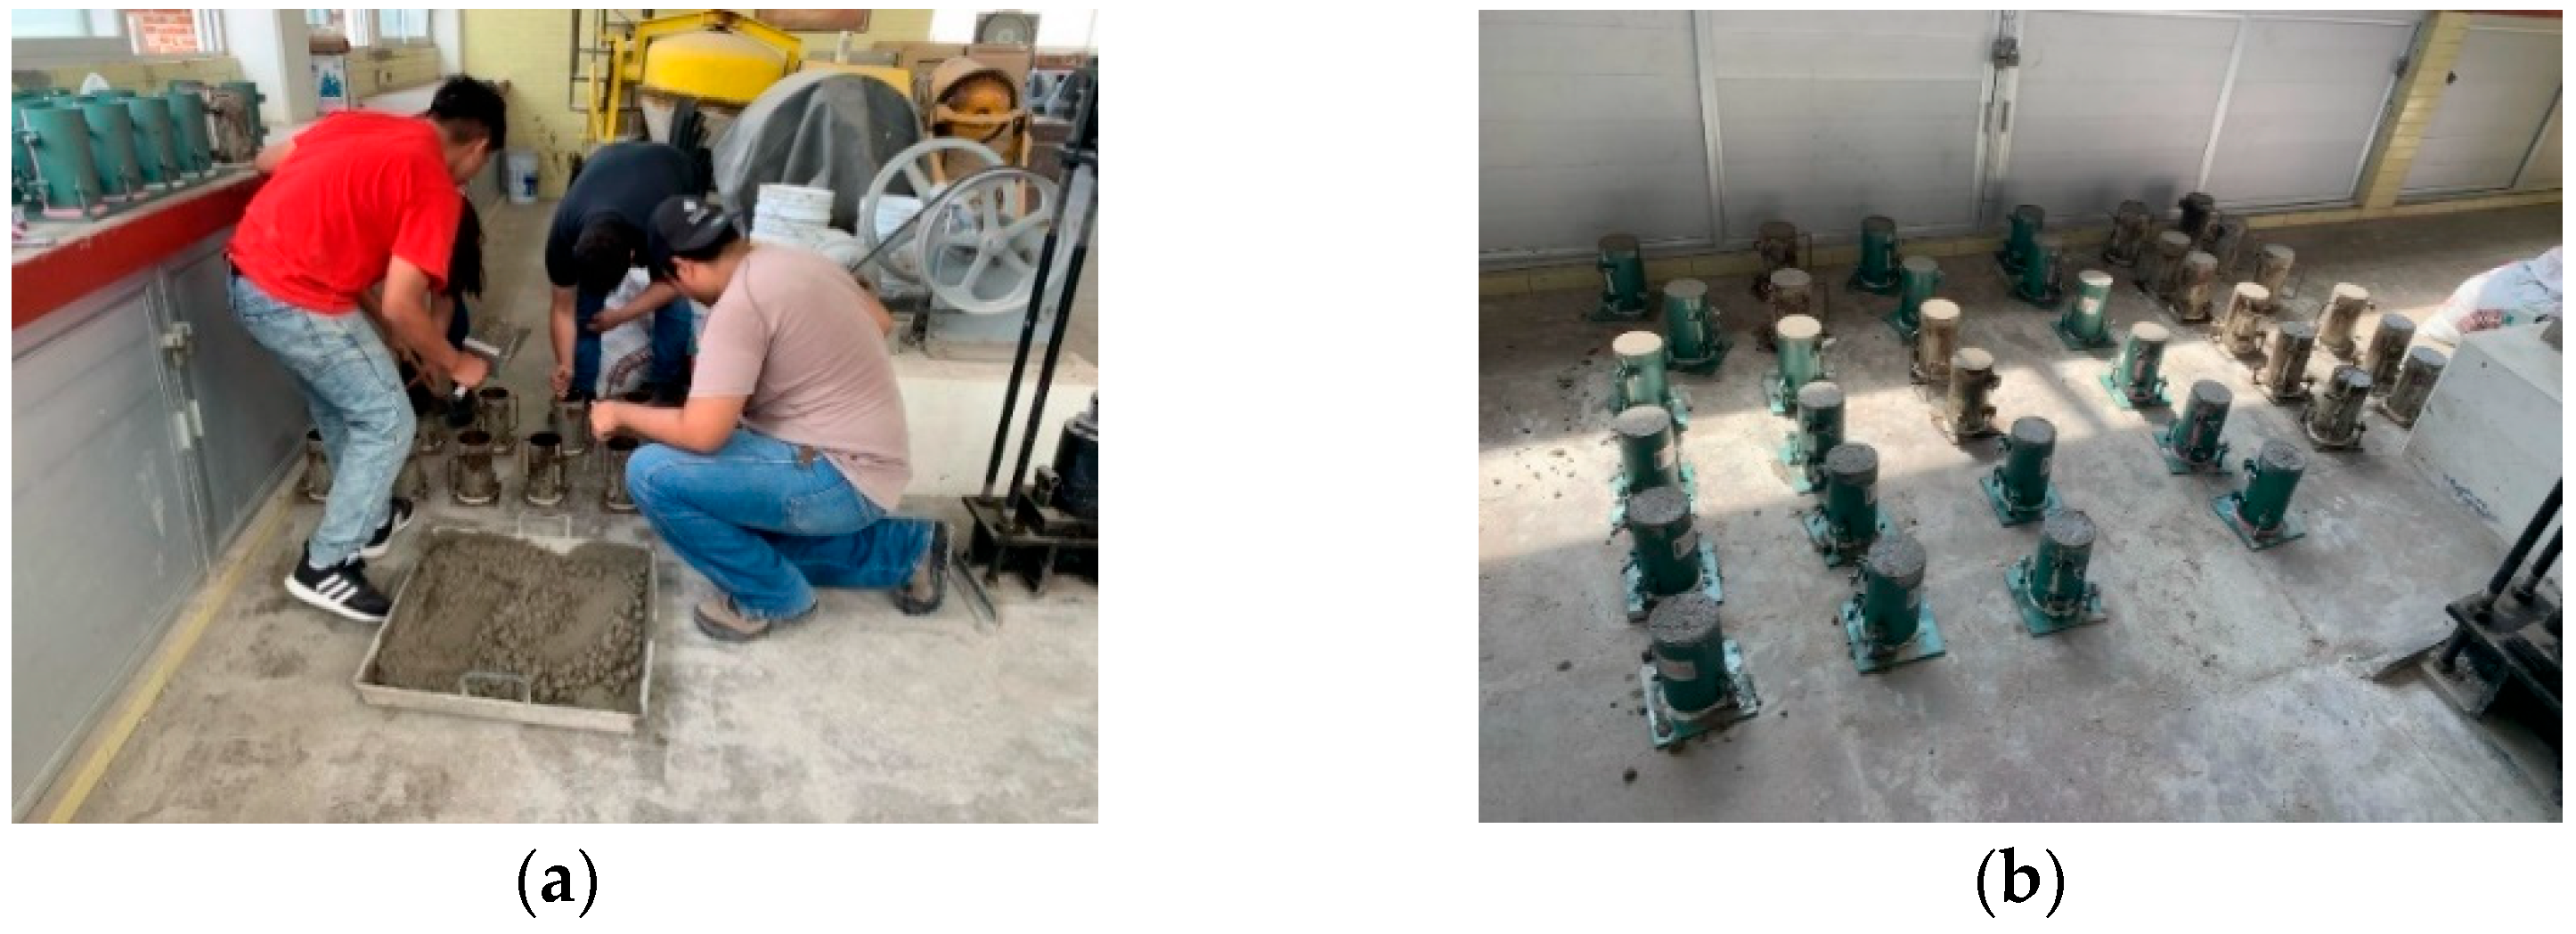
Metal molds that comply with ASTM C 470 [
72] were utilized for this process. The specimens were created following the guidelines of ASTM C 192 [
73]. (
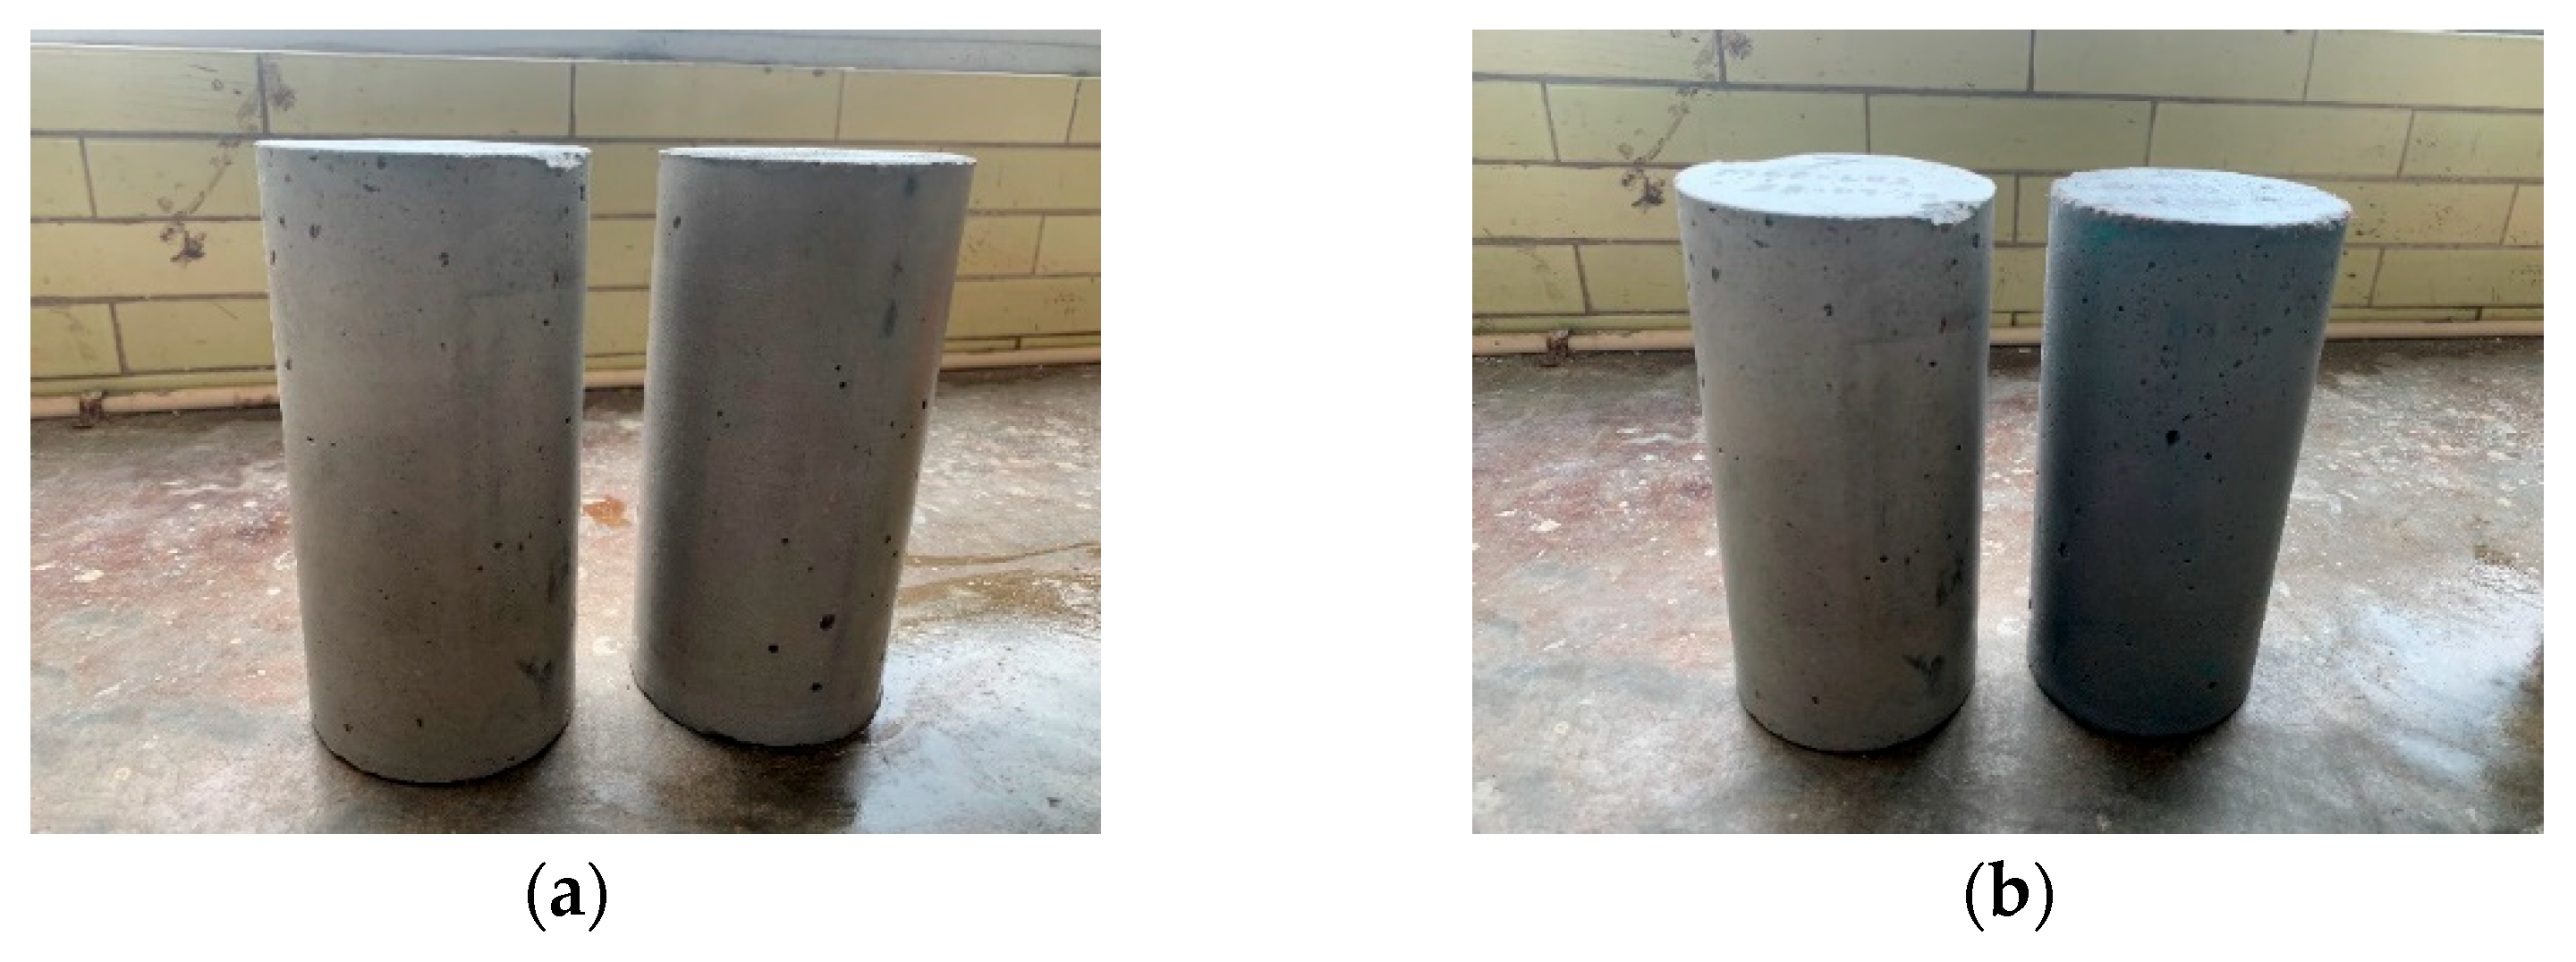
Figure 6a), and modeling clay was used as a sealant to prevent water loss through the joints. After the manufacturing process was completed, the specimens were stored in the laboratory (
Figure 6b). They were removed from the molds 24 h later and labeled according to the nomenclature provided in
Table 4.
The curing procedure involved immersing the specimens in a storage tank filled with water and lime for a duration of 90 days. A total of 180 cylindrical specimens, each measuring 10 cm in diameter and 20 cm in height, were produced for each type of mixture, with 18 specimens manufactured per type, cast in two separate batches; of which 150 cylinders were for compression tests and 30 cylinders for carbonation tests and absorption tests.
2.8. Laboratory Tests
2.8.1. Compressive Strength Test
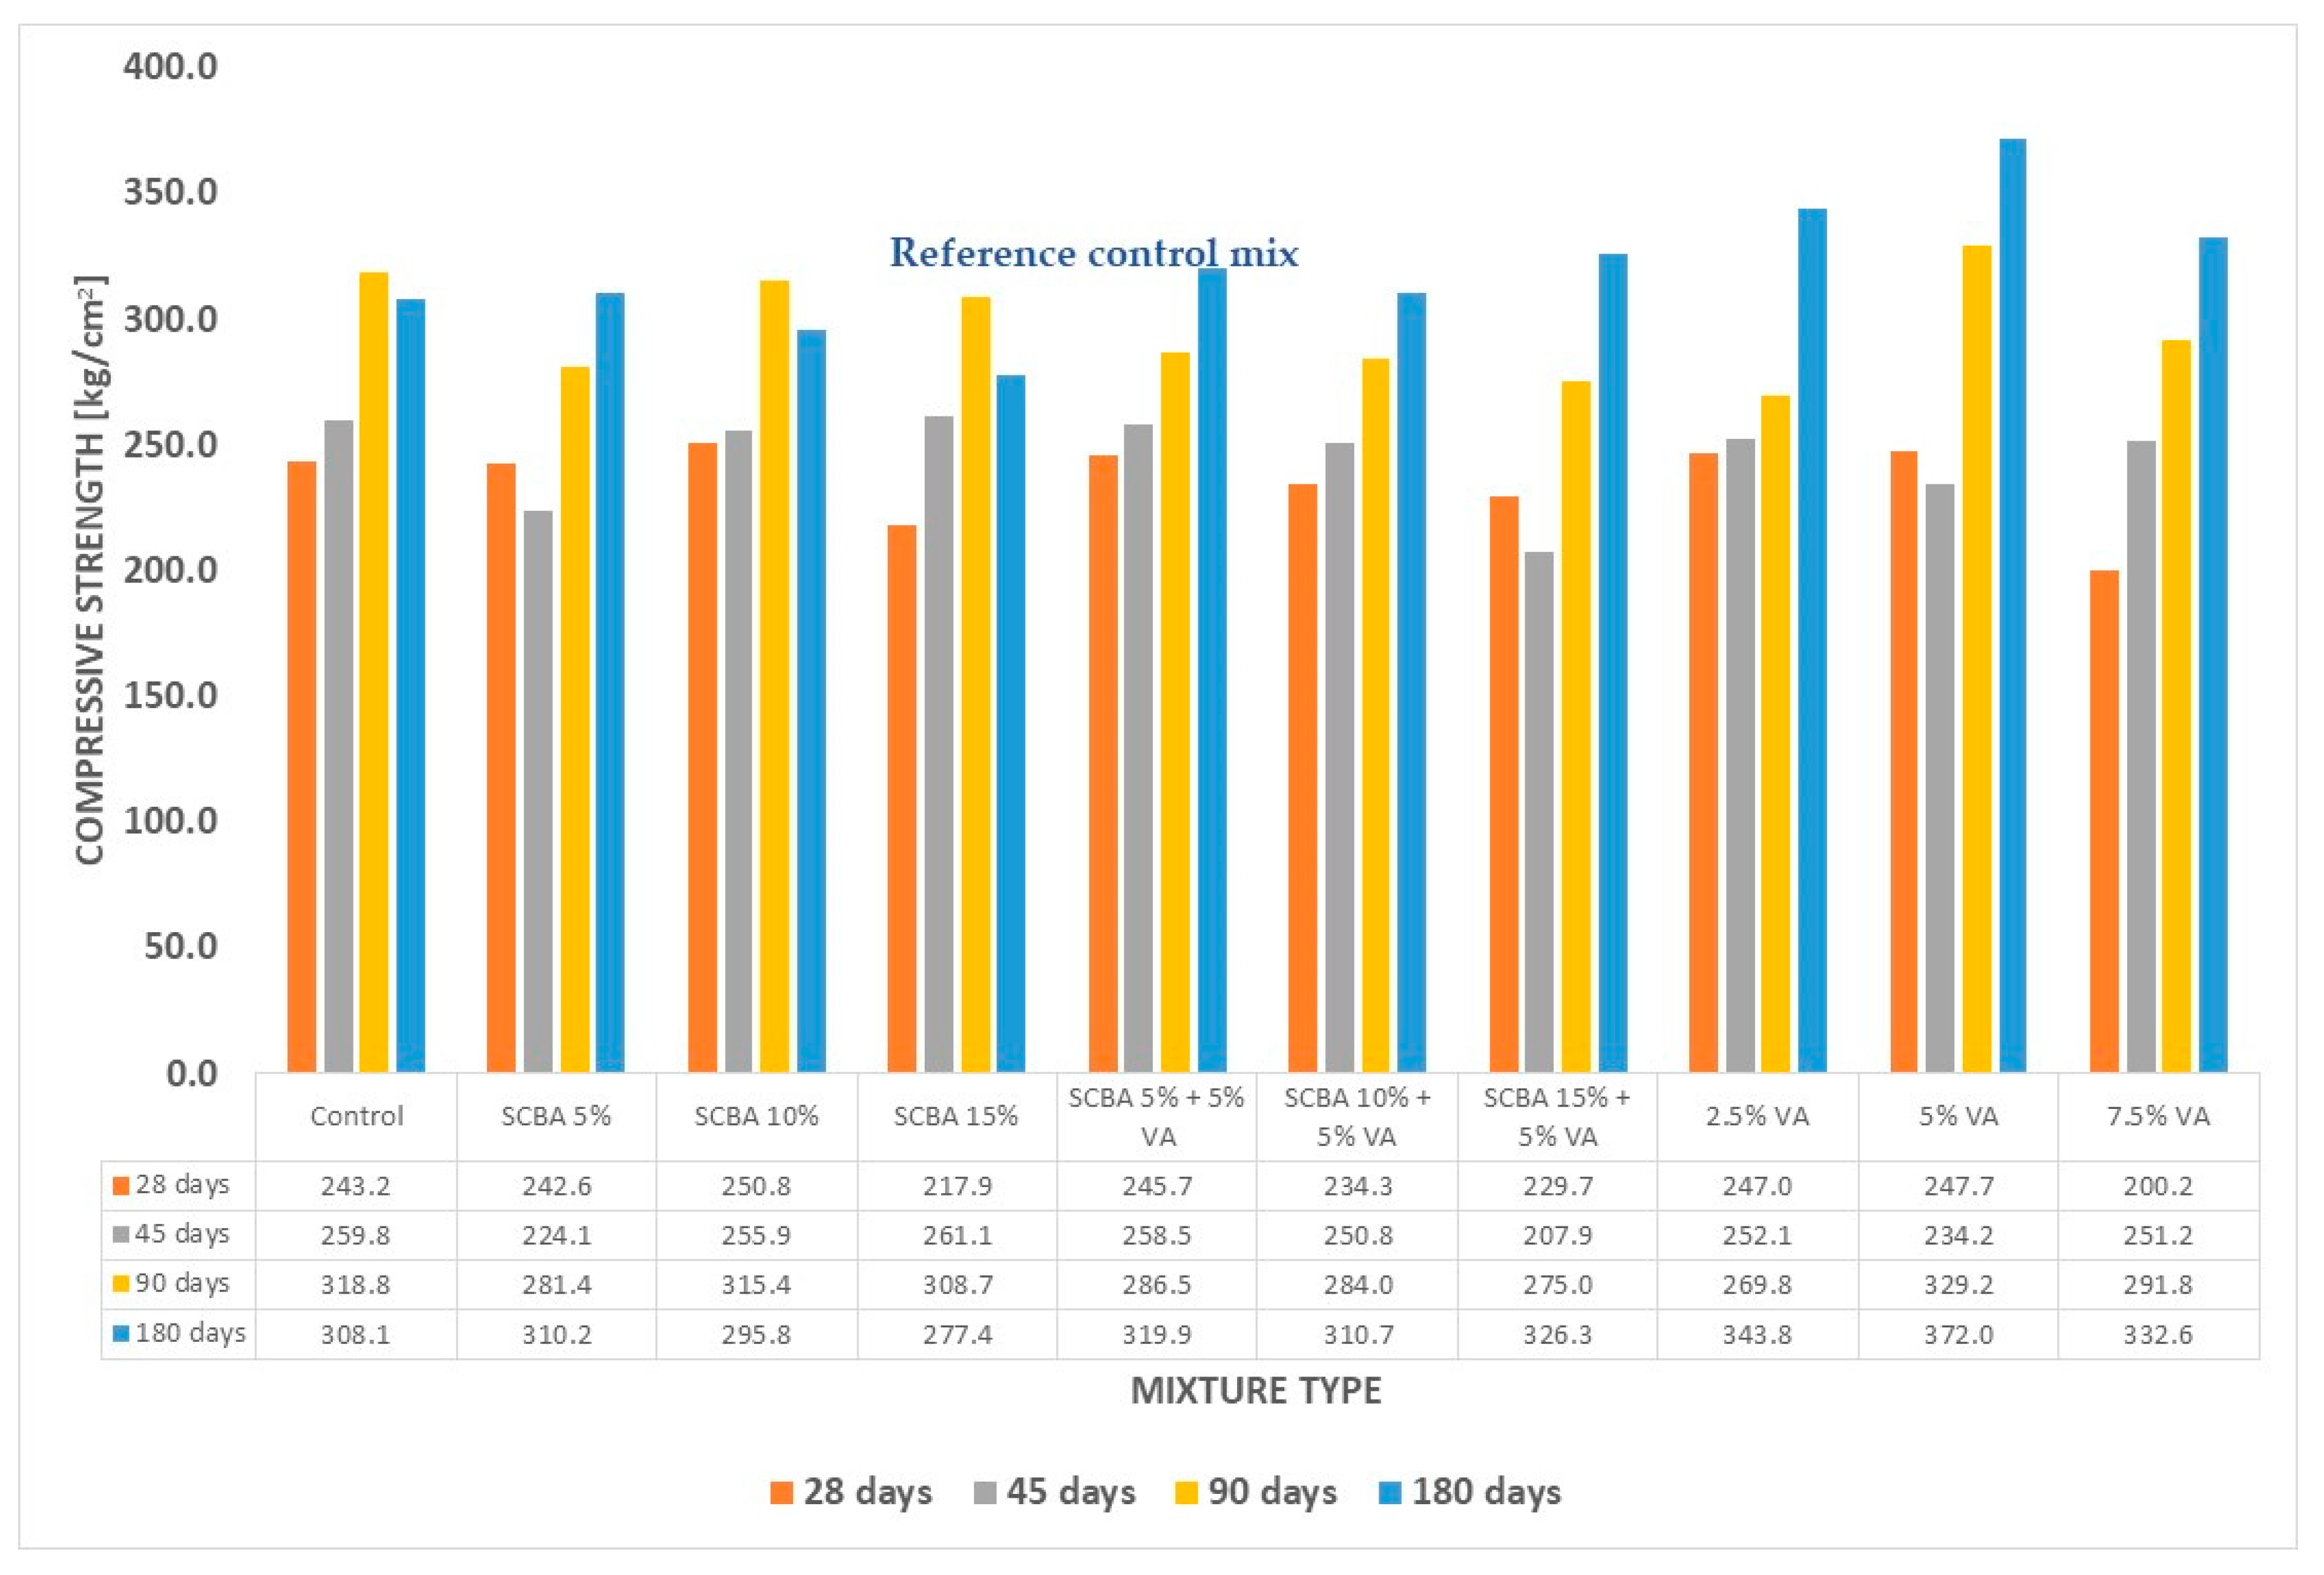
The test was conducted in accordance with ASTM C 39 [
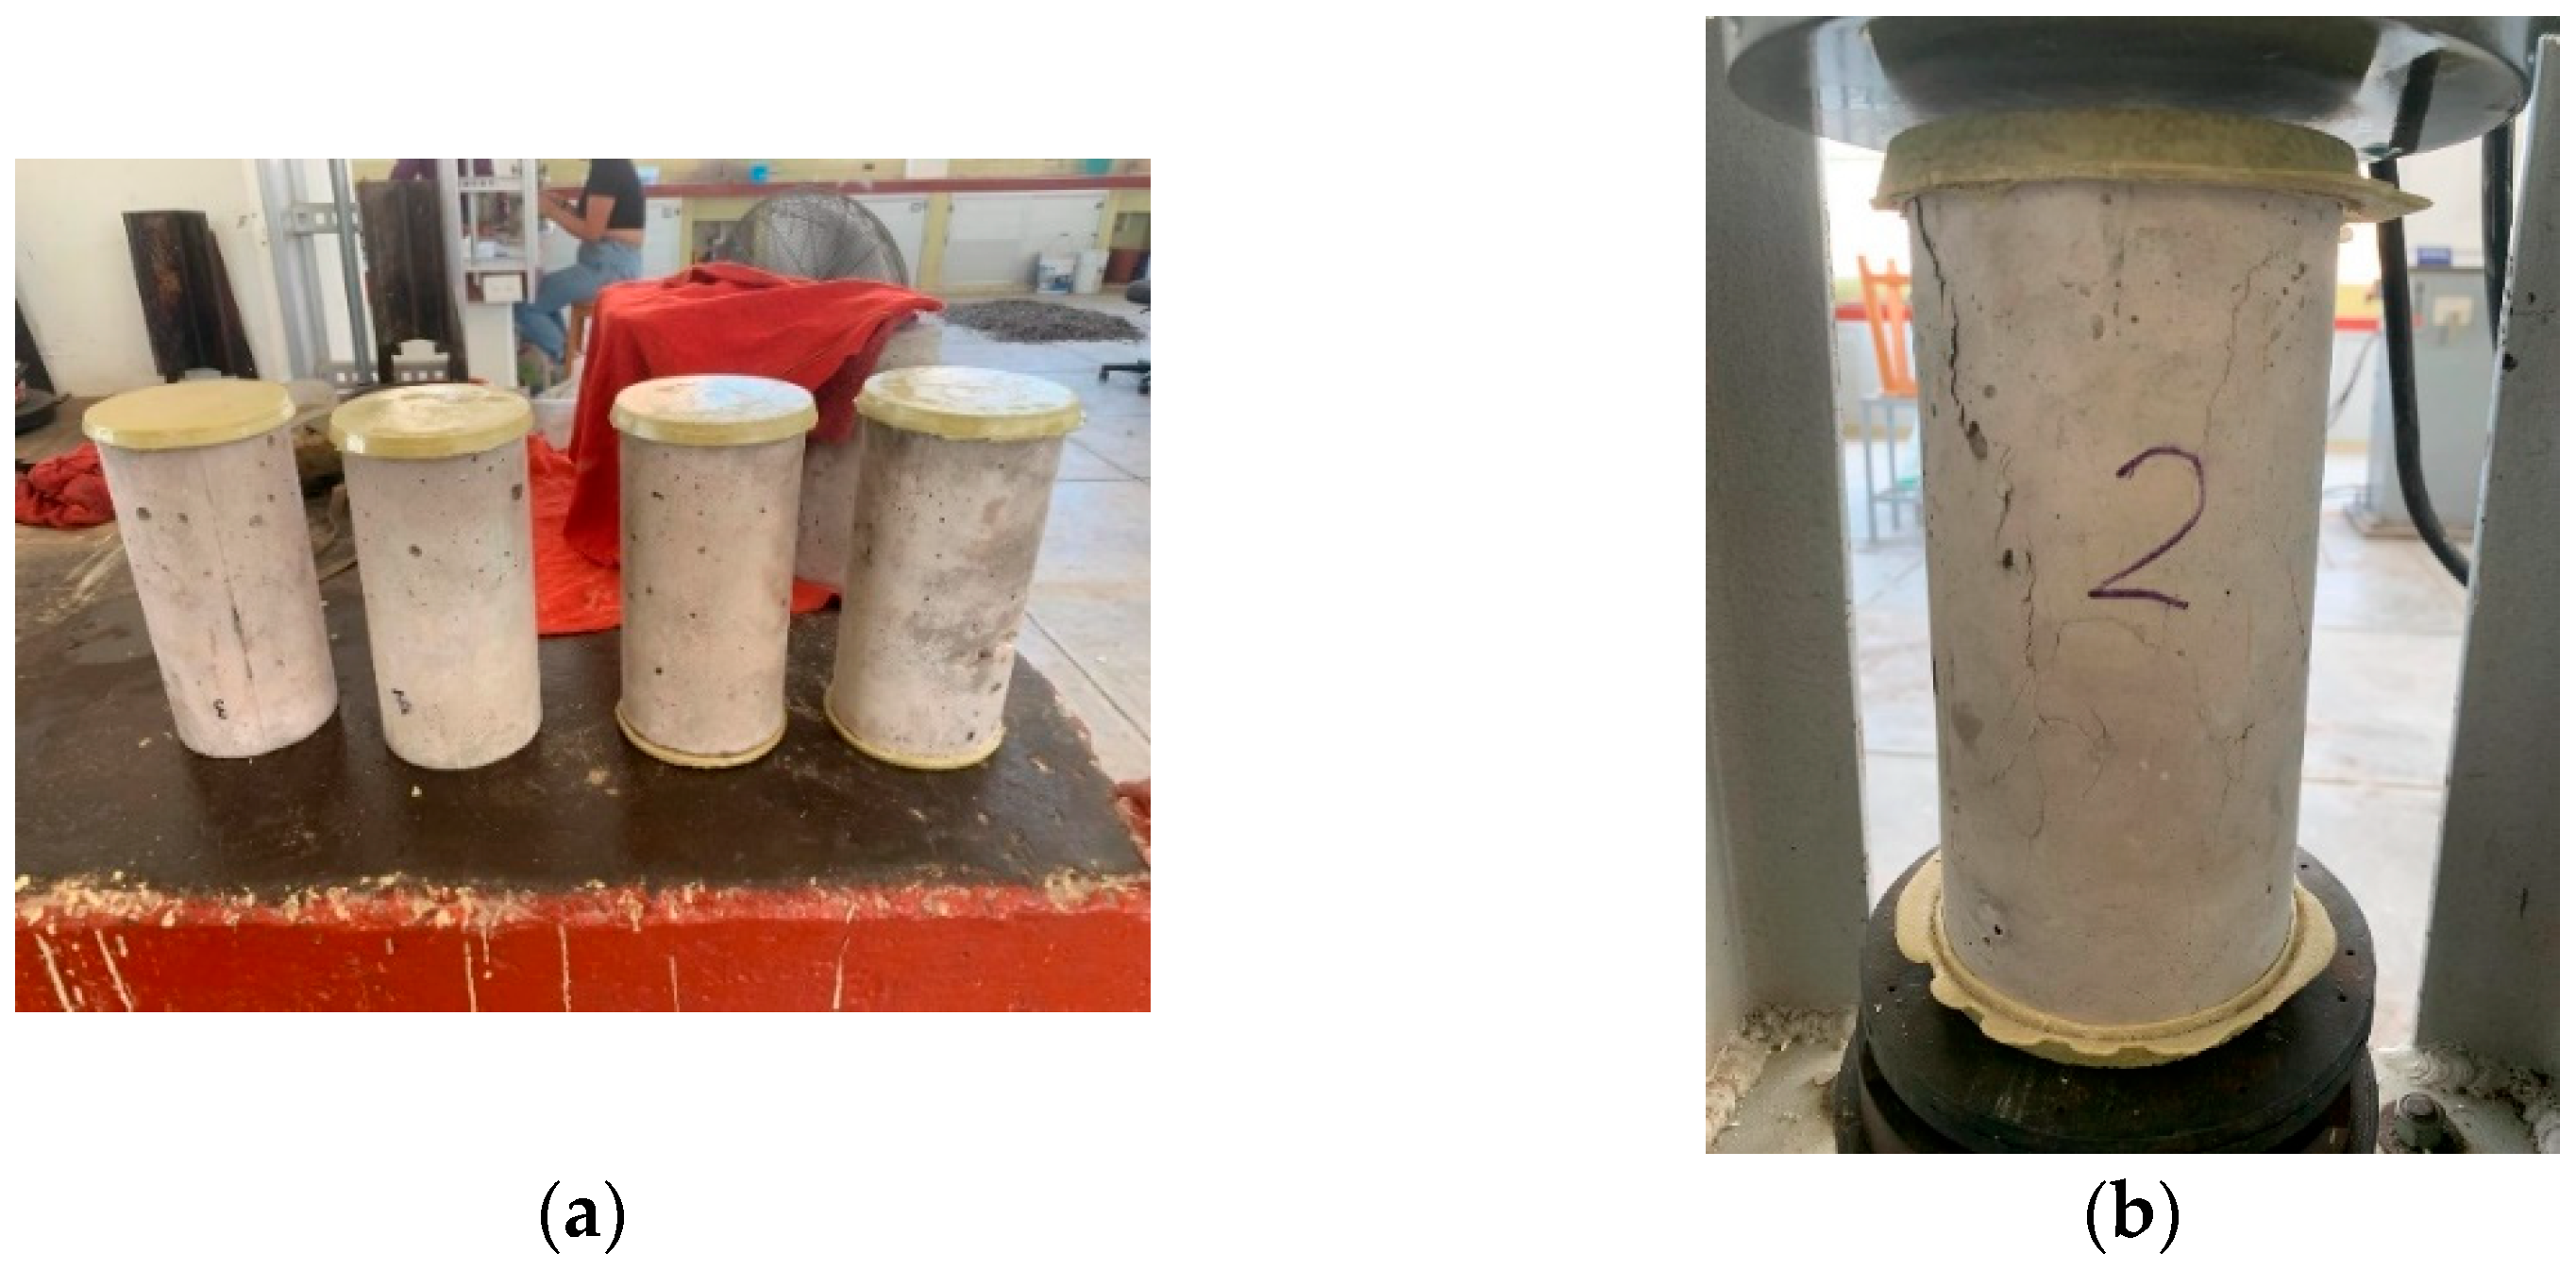
59]. Each sample was taken out of the curing chamber, surface dried with a flannel cloth, measured, weighed, and tested at 7, 28, 45, 90 and 180 days. The heading was performed using sulfur mortar, as specified in ASTM C 617 [
74] (
Figure 7a). The test was carried out on an ELVEC machine with a capacity of 120 tons, featuring an electric pump (
Figure 7b). Three repetitions were performed for each type of mixture.
2.8.2. Bulk Electrical Resistivity Test
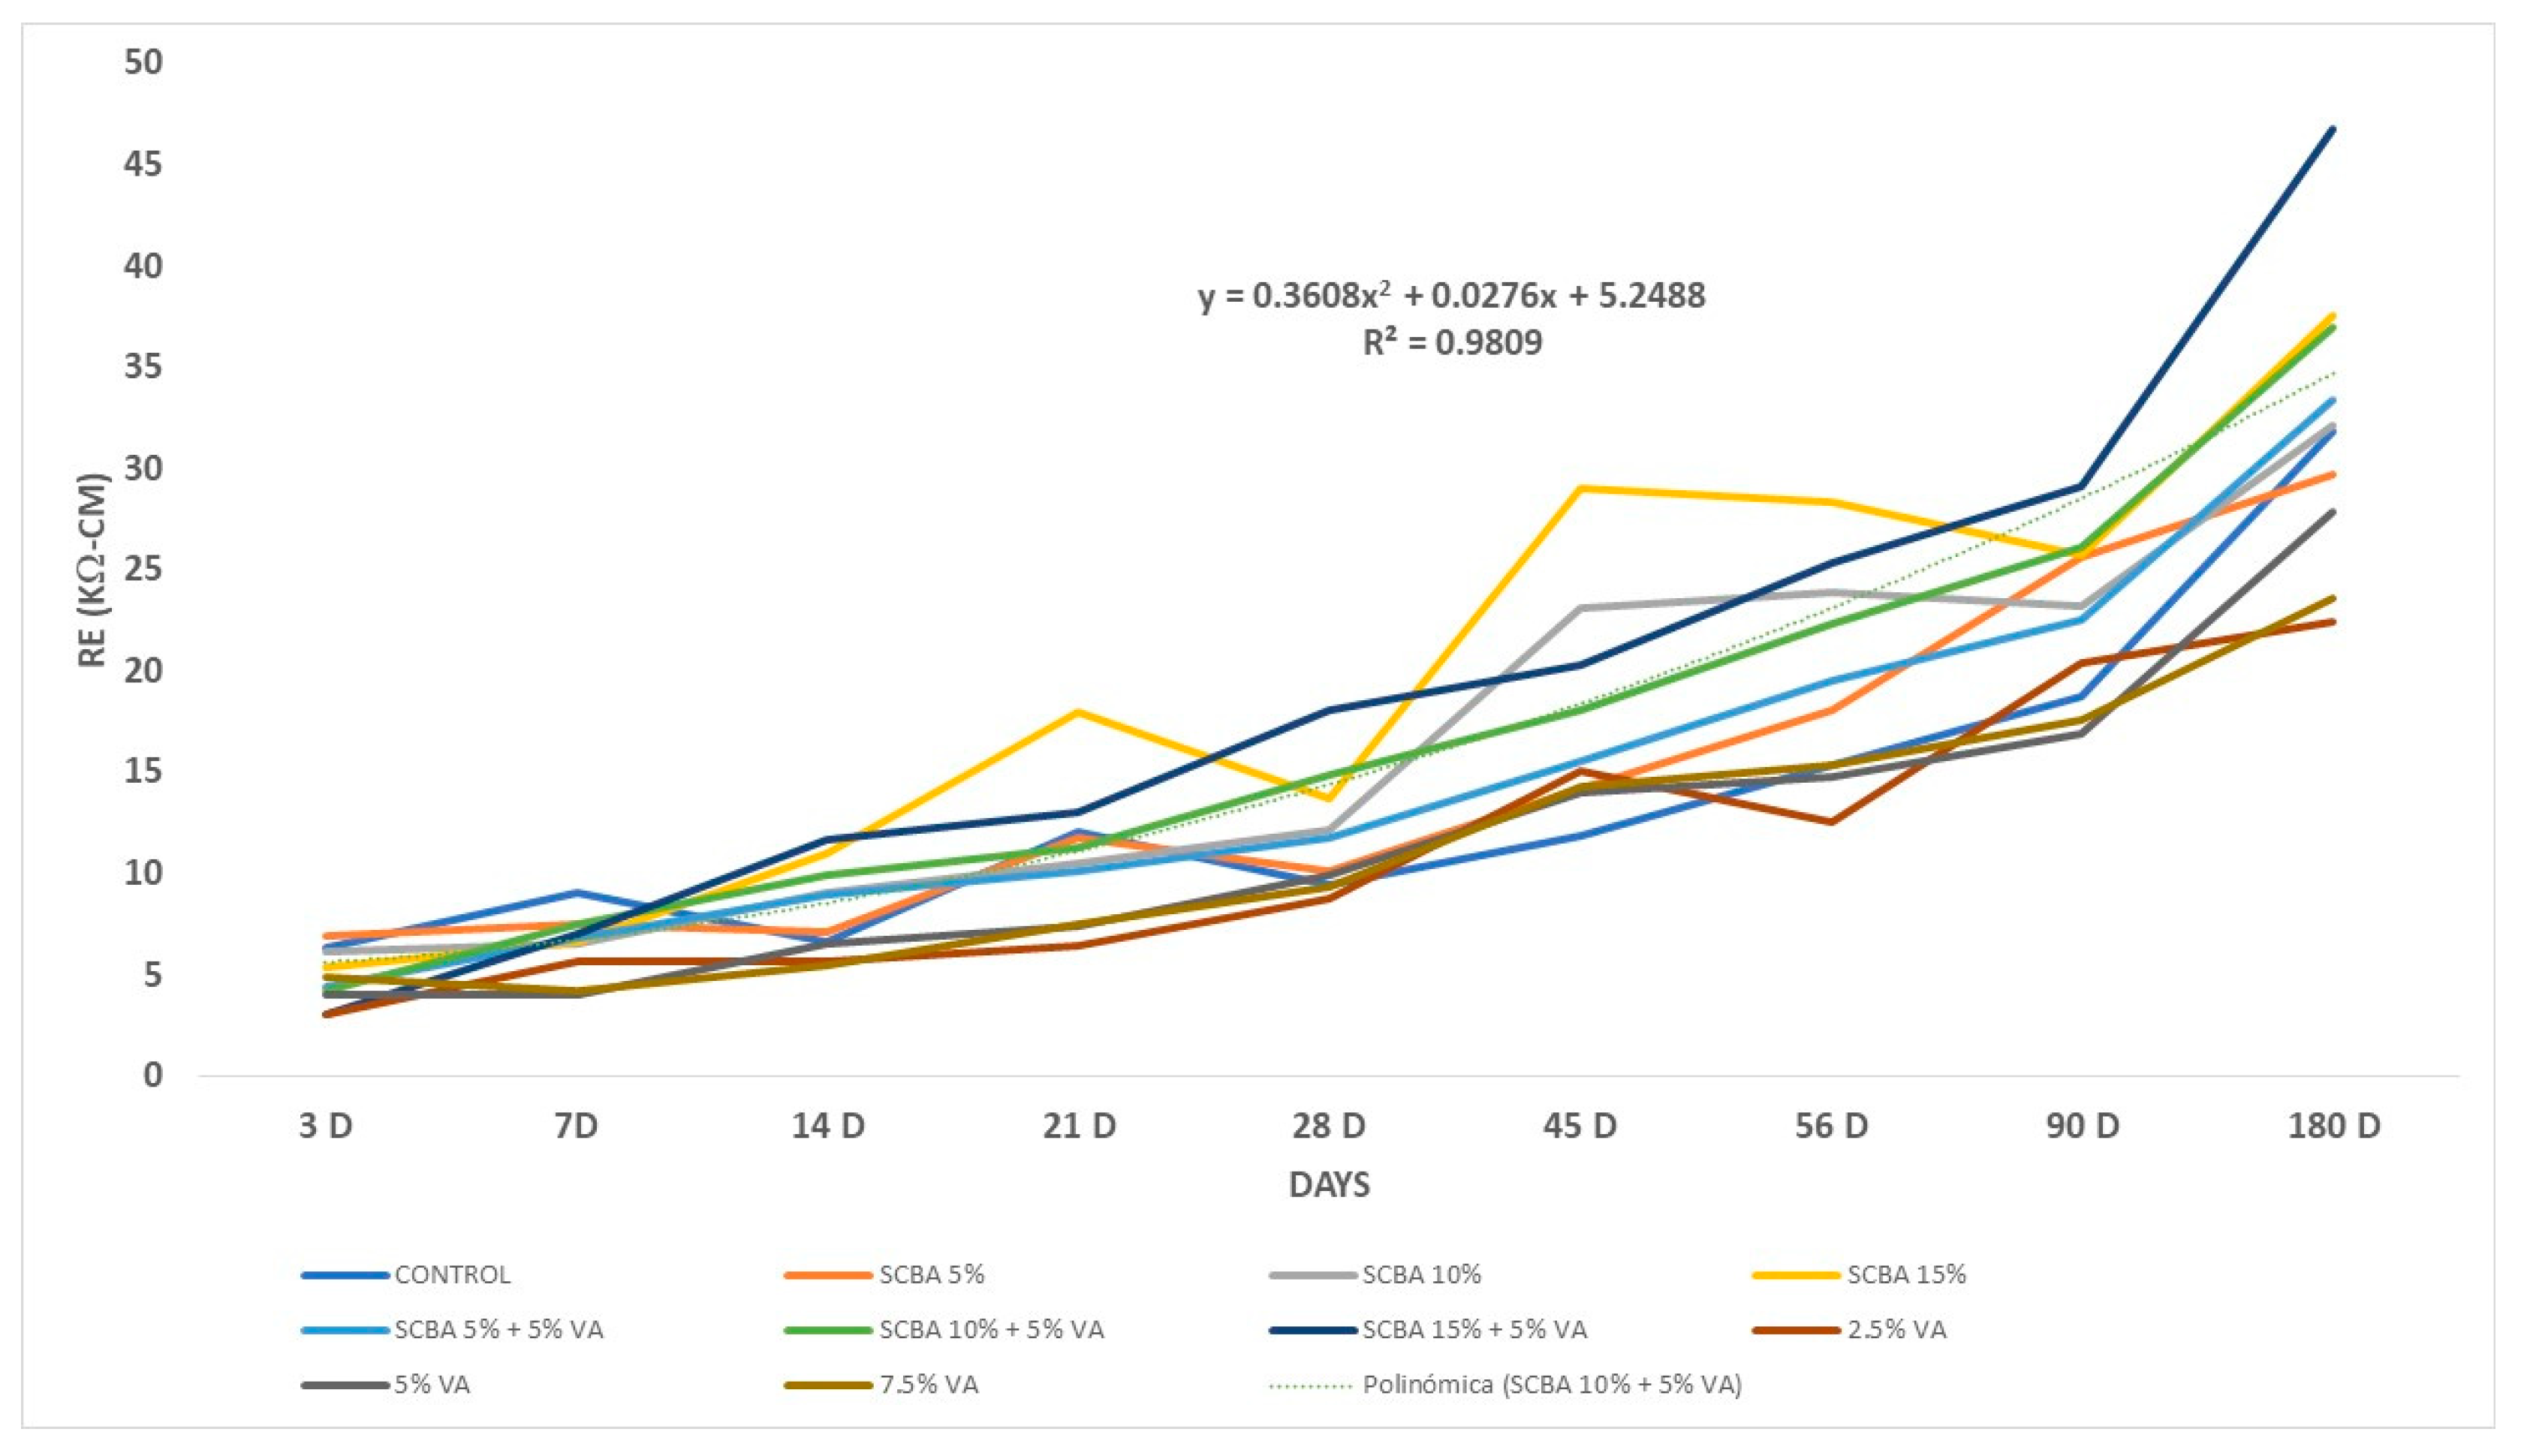
The bulk electrical resistivity (BER) was measured using a direct method, which involved placing two metal electrodes at the base and top of the cylinder. Two wet sponges were positioned between the metal plates and the bottom of the cylinder. A known current and voltage were then passed through the system using an ETCR model 3200C soil resistivity meter, applying alternating current (AC) (
Figure 8a). The electrical resistance (R) was measured by evaluating each specimen twice, and the average value was used. With the dimensions of each specimen, the electrical resistivity (ρ) was calculated using Equation (2). Temperature readings were taken with a FLUKE brand infrared thermometer, model 62 MAX (
Figure 8b), to apply temperature corrections according to Equation (3).
2.8.3. Carbonation Test
The high alkalinity of concrete (pH between 12–14) is due to the calcium, sodium and potassium hydroxides formed during hydration [
75]. When atmospheric CO
2 enters through the pores of the concrete, it reacts mainly with calcium hydroxide forming carbonates, which reduce the pH of the paste to values below 9 [
76]. Since the carbonation mechanism is very slow, most of the literature adopts accelerated carbonation tests (under constant temperature and humidity conditions) to estimate natural carbonation, which does not always represent a real field scenario [
77].
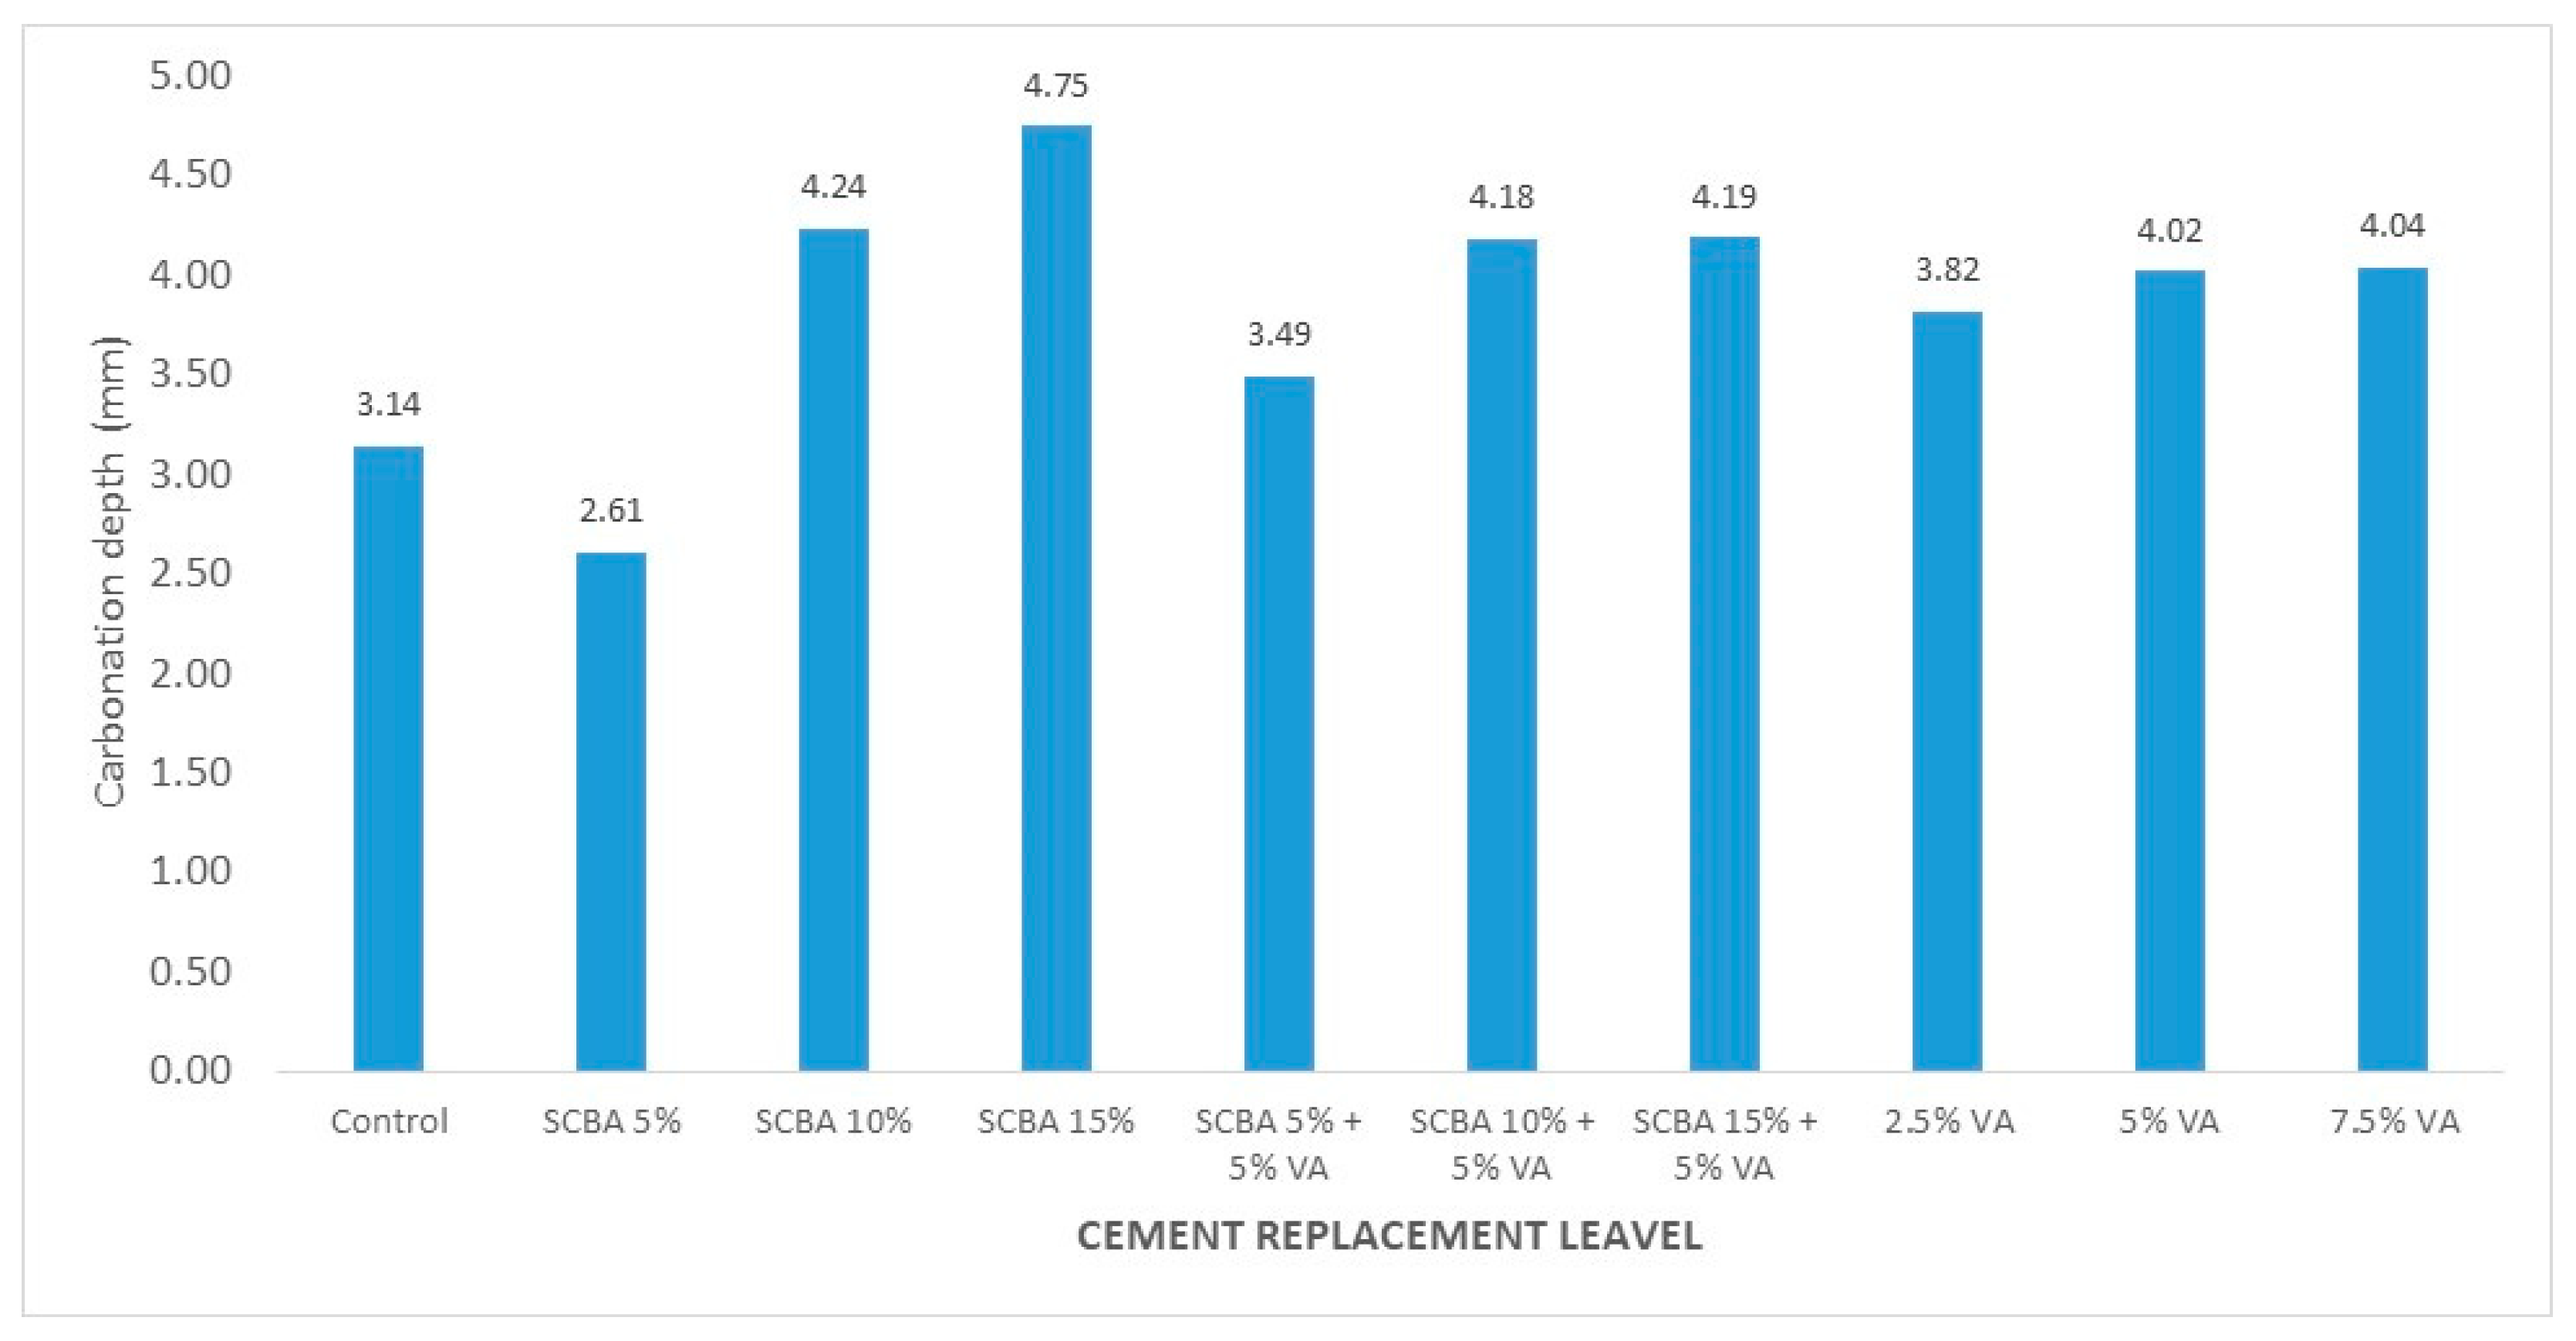
For this reason, in this study natural carbonation tests were carried out based on the NMX-C-515-ONNCCE-2016 standard [
78]. The samples were kept under exposed conditions inside the materials laboratory for a period of 12 months, exposed to the tropical climate. This type of climate favors carbonation compared to a temperate climate, so it is considered a critical environment [
77].
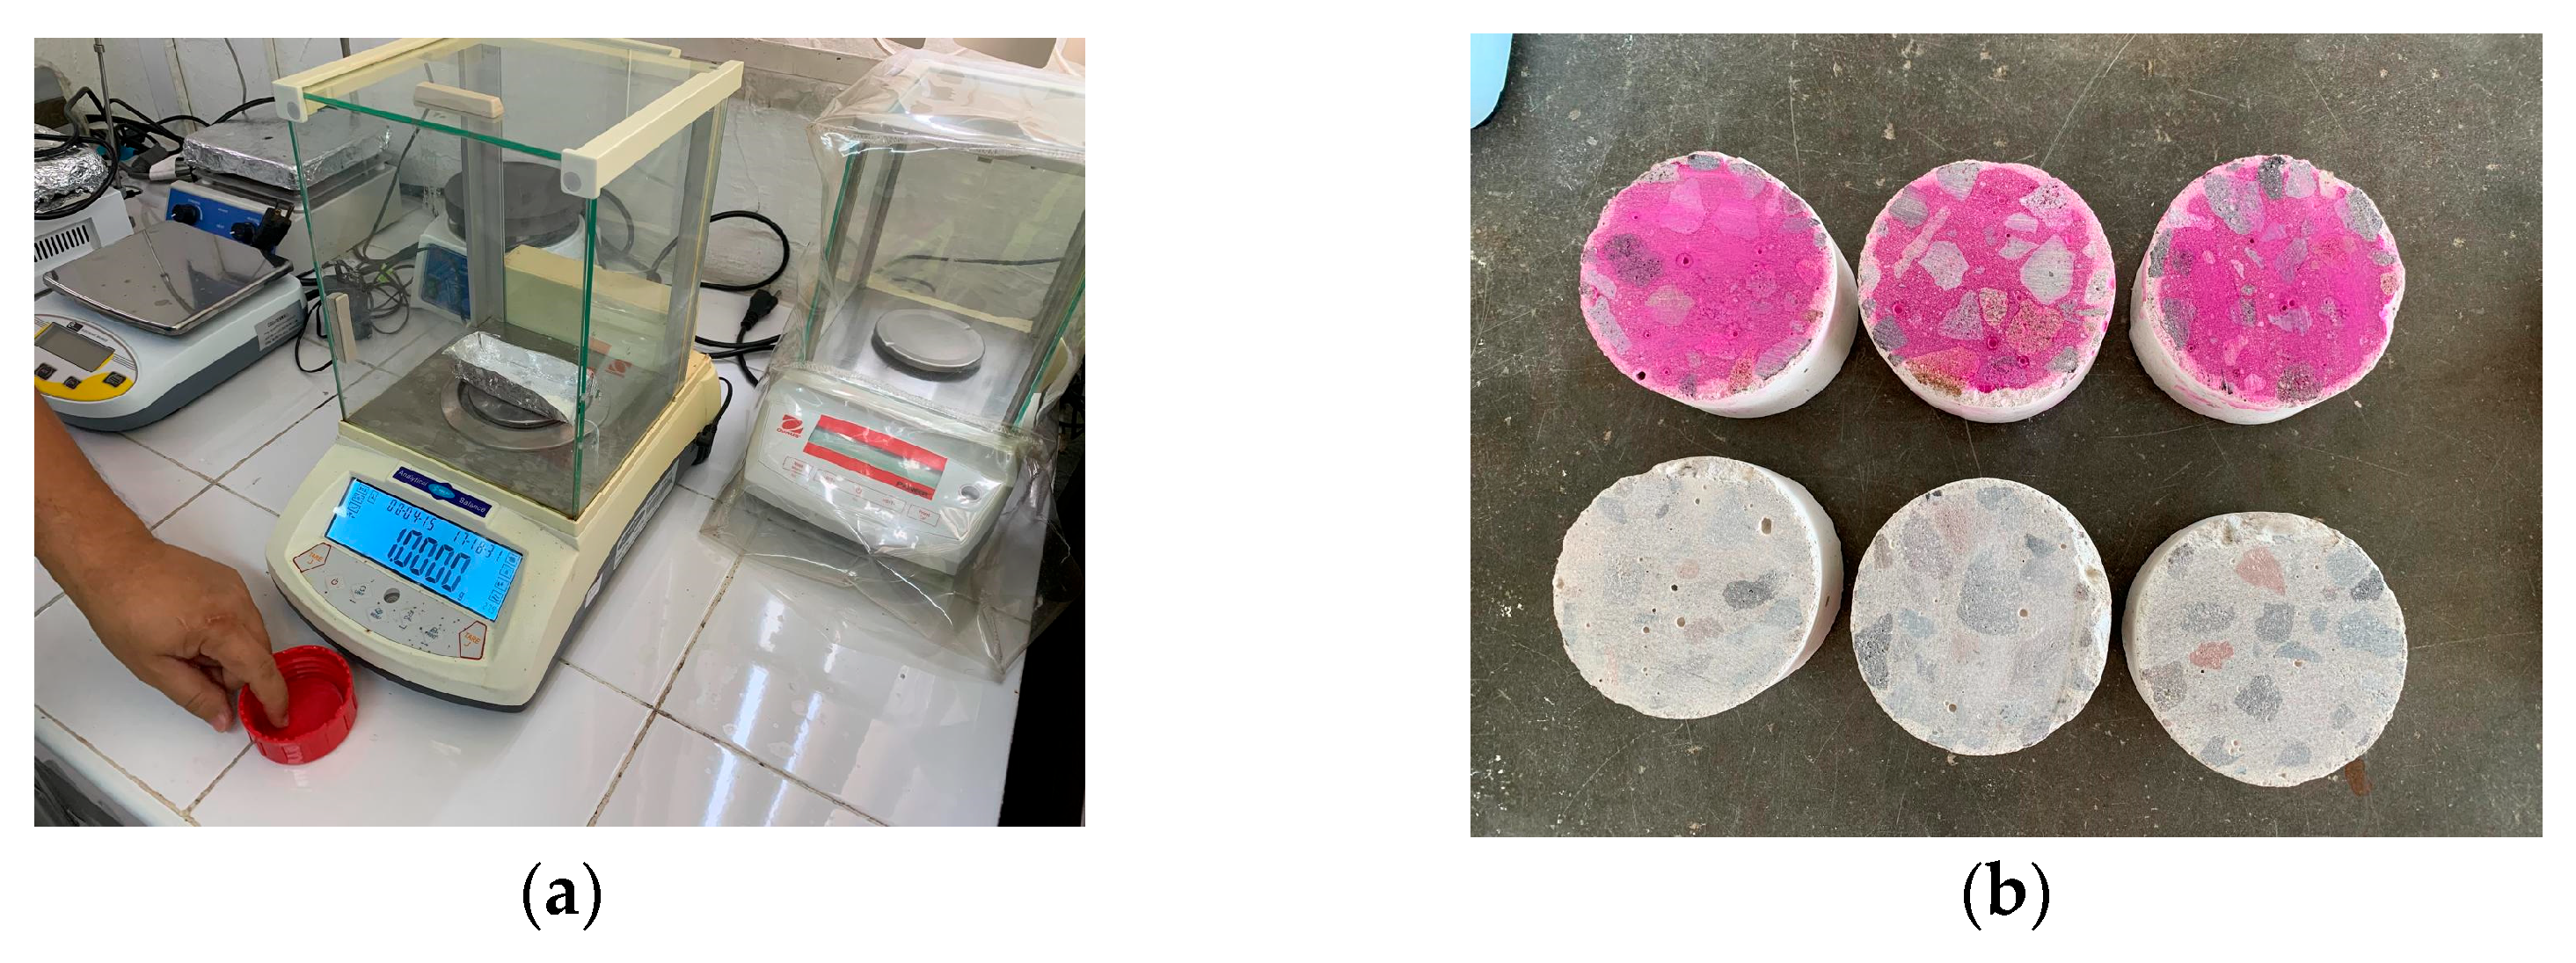
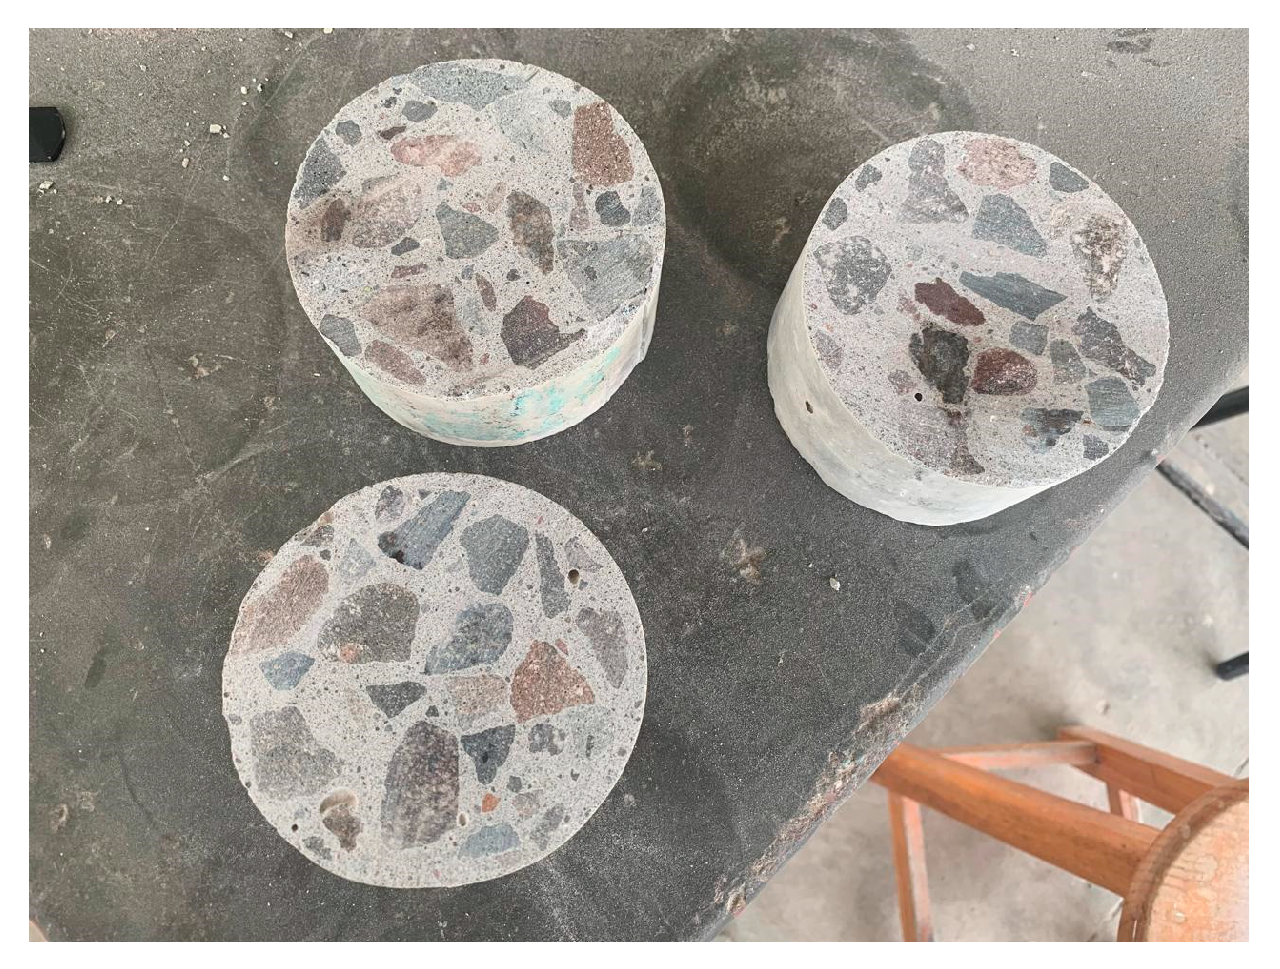
The test method consists of cutting a concrete sample and applying a phenolphthalein solution (1 g of phenolphthalein and 100 mL of isopropyl alcohol) uniformly to the surface to be tested using a spray bottle within a maximum of 15 min from the fracture (
Figure 9a,b). The depth of the colorless zone was subsequently measured using a digital vernier caliper at four points along two perpendicular diameters. The carbonation depth is the average of these four points.
2.8.4. Water Absorption by Immersion
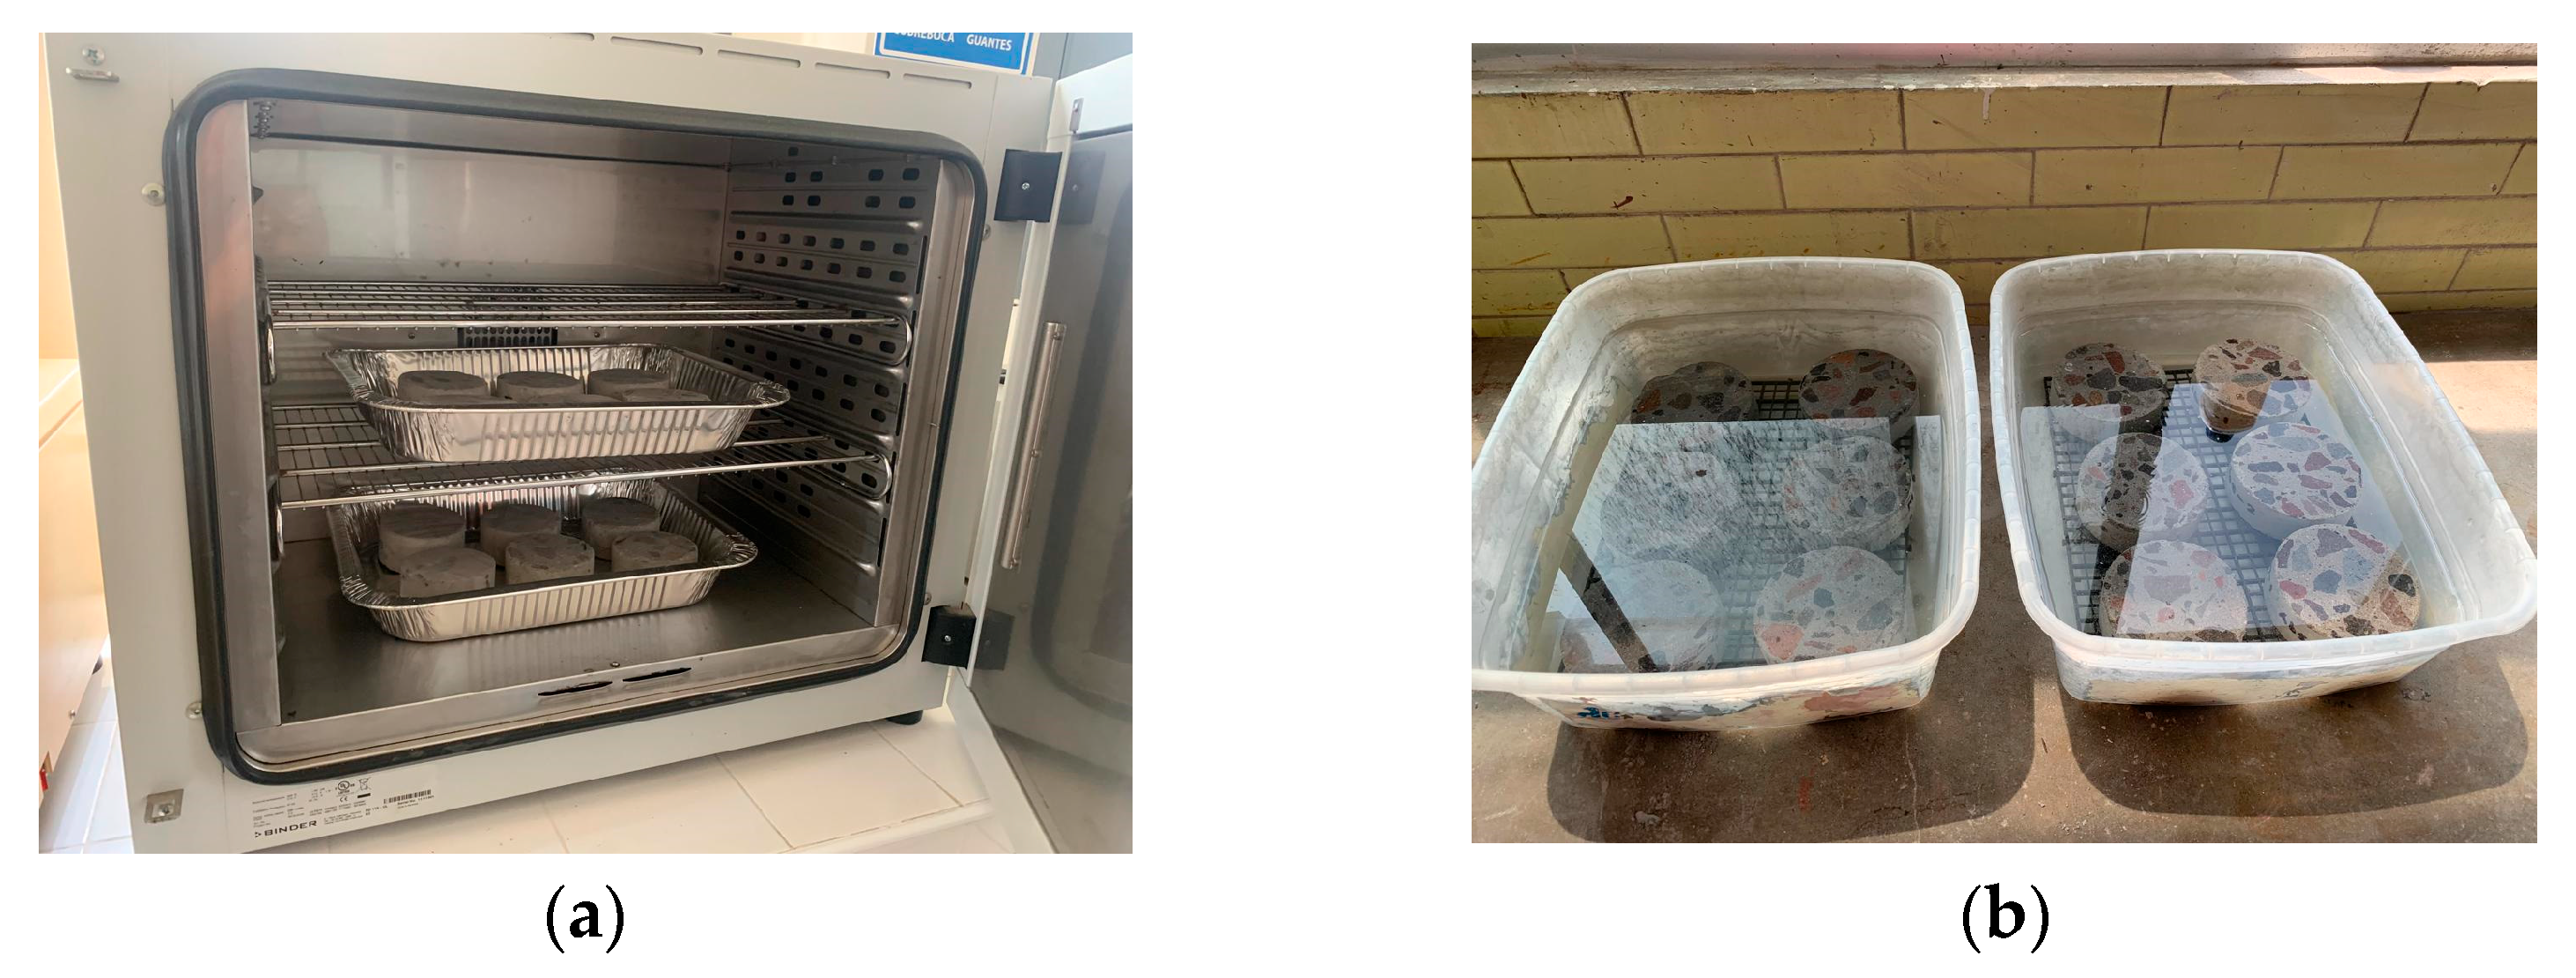
The test was carried out under ASTM C 642 Standard [
79], which indicates that the sample must be at least three individual portions of concrete (in this case cylinder pieces) if the volume of each portion is not less than 350 cm
3. The samples were subjected to a drying process at 105 °C for 24 h (
Figure 10a). They were subsequently allowed to cool, and their mass was determined. They were then immersed in water to achieve saturation (
Figure 10b), verifying that up to two successive mass values of the surface-dried sample at 24-h intervals show a mass increase of less than 0.5% of the highest value.
4. Conclusions
The use of sustainable concrete is a viable alternative to traditional structural concrete, especially in coastal areas, where it can help prevent or reduce premature deterioration due to its durability. Additionally, it has been confirmed that Electrical Resistivity (ER) is an effective technique for predicting the durability of concrete. One of its key advantages is that it is a non-destructive test that can be correlated with the Rapid Chloride Penetration Test (RCPT). ER testing can be completed in a shorter time, resulting in lower costs for monitoring the quality control of concrete mixtures.
The results of the study indicate that the two mixtures with the best performance in terms of sustainability, durability, and resistance were the ternary mixtures (5% VA-15% SCBA and 5% VA-10% SCBA). These mixtures outperformed the one with 15% SCBA. The findings indicate that SCBA produced under uncontrolled conditions at the sugar mill possesses pozzolanic properties, enhancing the compressive strength of the concrete. As a result, these mixtures exhibit durability improvements of 24% to 37%, depending on the percentage of replacement used. This increase in durability, due to an increase in ER, is corroborated by the results of the absorption test, where it is observed that as the substitution percentages increase, the absorption rate decreases. This indicates that the permeability of the samples is reduced due to the pozzolanic activity, while at the same time increases durability. However, a drawback is the reduced workability of these mixtures, which can be improved by using a control mixture to achieve higher slumps, specifically between 15 and 17 cm. While VA has superior properties compared to SCBA, it requires more time to develop strength. Therefore, further research is needed to explore methods for accelerating the development of mechanical strength.
Natural pozzolans offer several advantages over artificial pozzolans, primarily due to their lower processing requirements. For instance, the volcanic ash (VA) does not need a pre-drying process. Additionally, when combined in ternary mixtures with sugarcane bagasse ash (SCBA), VA can lead to a 37–39% improvement in durability. This enhancement is particularly beneficial for exposed concrete in coastal regions that face highly aggressive environmental conditions. While increasing the replacement percentages of SCBA and VA can improve the ER values, it is important to exercise caution with the maximum replacement levels. In many cases, although the durability may increase, short-term compressive strength could be compromised. Therefore, it is advisable to select replacement values that optimize both durability and compressive strength.
When it comes to sustainability, all mixtures that include pozzolanic additions demonstrate improved energy efficiency compared to the control mixture, resulting in a reduction of CO2 emissions ranging from 4.2% to 16.8%. Considering the importance of local availability, the feasibility of using Sugar Cane Bagasse Ash (SCBA) is favorable, as the State of Veracruz is Mexico’s leading producer of sugarcane
In conclusion, the methodology proposed in this study can be utilized for further research on the addition of pozzolanic materials to concrete, examining their effects not only on strength parameters but also on durability and sustainability.

