Article

A Full Pulse Acoustic Monitoring Method for Detecting the Interface During Concrete Pouring in Cast-in-Place Pile

1
Science and Technology Innovation Center of Hubei Institute of Urban Geological Engineering, Wuhan 430050, China
2
State Key Laboratory of Geomechanics and Geotechnical Engineering Safety, Institute of Rock and Soil Mechanics, Chinese Academy of Sciences, Wuhan 430071, China
*
Author to whom correspondence should be addressed.
Appl. Sci. 2025, 15(20), 11205; https://doi.org/10.3390/app152011205
Submission received: 28 September 2025 / Revised: 16 October 2025 / Accepted: 17 October 2025 / Published: 19 October 2025

Abstract

As a key form of deep foundation in civil engineering, the concrete pouring quality of cast-in-place piles directly determines the integrity and long-term bearing performance of the pile body. Accurate monitoring of the pouring interface is critical to preventing defects such as mud inclusion and pile breakage. To address the limitations of existing monitoring methods for concrete pouring interfaces, this paper proposes a full-pulse acoustic monitoring method for the concrete pouring interface of cast-in-place piles. Firstly, by constructing a hardware system platform consisting of “multi-level in-borehole sound sources + interface acoustic wave sensors + orifice full-pulse receivers + ground processors”, differential capture of signals propagating at different depths is achieved through multi-frequency excitation. Subsequently, a waveform data processing method is proposed to realize denoising, enhancement, and frequency discrimination of different signals, and a target feature recognition model that integrates cross-correlation functions and signal similarity analysis is established. Finally, by leveraging the differential characteristics of measurement signals at different depths, a near-field measurement mode and a far-field measurement mode are developed, thereby establishing a calculation model for the elevation position of the pouring interface under different scenarios. Meanwhile, the feasibility of the proposed method is verified through practical engineering cases. The results indicate that the proposed full pulse acoustic monitoring method can achieve non-destructive, real-time, and high-precision monitoring of the pouring interface, providing an effective technical approach for quality control in pile foundation construction and exhibiting broad application prospects.

1. Introduction

Cast-in-place piles are widely used deep foundation structures in civil engineering, primarily functioning to transfer upper structural loads to deeper foundation soils and ensure overall structural stability and safety. Relevant studies have made valuable contributions to pile foundation quality evaluation: Jun et al. [1] extended tube wave detection technology to assess pile foundation quality, providing a non-destructive testing approach but with limitations in adapting to dynamic pouring processes; Pan et al. [2] proposed a hybrid ANFIS model based on metaheuristic optimization algorithms for pile quality estimation, which improved prediction accuracy but relied heavily on pre-existing dataset quality. Cai et al. [3] applied the reflection wave method to inspect compacted pile foundations in high-speed railway beam yards, achieving rapid defect localization but struggling with distinguishing subtle interface changes. As core vertical load-bearing components in major infrastructure such as bridges and high-rises, the concrete pouring quality of cast-in-place piles directly determines pile integrity and long-term bearing capacity. Precise positioning of the concrete pouring interface—including the initial interface between concrete and slurry, and interfaces between different concrete batches—is critical for judging pouring continuity and avoiding defects like mud inclusion or pile breakage. Zhang [4] studied the bearing characteristics of large-diameter ultra-long piles and emphasized that interface defects significantly reduce pile load-bearing capacity. Jin et al. [5] analyzed the dynamic response of deep-water bridge pier group piles under wave-current coupling, noting that interface discontinuities exacerbate structural vibration. Li et al. [6] investigated corrosion causes in highway tunnel concrete linings, revealing that interlayer defects at pouring interfaces accelerate corrosion.
According to statistical data, over 35% of pile foundation accidents in engineering practice stem from pouring interface defects such as honeycombs, holes, and interlayers. This highlights the engineering significance of precise monitoring for cast-in-place concrete pile pouring processes and interface quality. Li et al. [7] developed hidden block stone detection technology for pile foundations, demonstrating that real-time interface monitoring can prevent defect expansion. Kang et al. [8] used BP neural networks to predict crack deformation in heritage sites, underscoring the value of continuous data in early hazard identification. Gao et al. [9] proposed online monitoring for mud characteristic parameters in hydrological wells, showing that real-time parameter adjustment based on monitoring data improves pouring uniformity. Through precise monitoring, potential issues during concrete pouring can be identified and resolved promptly, ensuring pile quality and enhancing overall project safety and stability. The current pouring interface monitoring methods have notable limitations. The core drilling method, regarded as the “gold standard”, is a destructive post-inspection technique: Wang et al. [10] used borehole optical images for underwater cast-in-place pile defect detection, which required core sampling for verification and could not reflect dynamic pouring processes. Wang et al. [11] developed a multi-frequency ultrasonic method for damage zone detection in hydraulic structures, but the core drilling used for calibration only provided discrete sampling points. Xie et al. [12] proposed an underground space collapse rescue drilling safety assessment method, further confirming that core drilling fails to capture real-time interface changes. The ultrasonic rebound method is affected by signal attenuation in deep boreholes (>20 m) and fluctuations in concrete moisture content: Moayedi et al. [13] applied CPT-based neural networks to predict pile load-settlement responses, finding that ultrasonic rebound errors in deep piles often exceed 5 cm, unable to meet high-precision requirements. Traditional acoustic methods typically use single-frequency excitation: Nguyen et al. [14] studied cement post-grouting to improve pile load capacity, but single-frequency acoustic signals struggled to distinguish reflections from concrete, mud, and air in boreholes. Peyraube et al. [15] analyzed hydraulic conductivity using pumping test data, noting that signal confusion in single-frequency acoustic testing frequently leads to interface misjudgment.
Recent advances in full pulse acoustic technology have shown promise: Wang et al. [16] developed a multi-array ultrasonic scanning method for borehole quality inspection, achieving improved signal coverage but lacking multi-frequency differentiation. Wang et al. [17,18,19] and Guo et al. [20] designed an ultrasonic synthetic aperture imaging system for boreholes, which enhanced imaging resolution but did not address dynamic interface tracking. Liu et al. [21] applied time-shift cross-hole seismic full waveform inversion to cement mixing pile detection, improving inversion accuracy but requiring complex field deployment. Zhang et al. [22] proposed 3D high-precision imaging for pile-end karst, which focused on post-construction defect detection rather than real-time pouring monitoring. Overall, existing methods cannot simultaneously meet the “non-destructive, real-time, high-precision” requirements of complex engineering scenarios, necessitating breakthroughs in technological bottlenecks to develop a monitoring system adapted to dynamic pouring processes. To address these limitations, this study proposes a full pulse acoustic monitoring method for the concrete pouring interface of cast-in-place piles. A critical necessity for “multi-frequency full pulse” excitation lies in the fact that single-frequency acoustic signals cannot distinguish the reflection characteristics of different media (concrete, mud, air) in boreholes—multi-frequency excitation leverages differences in acoustic propagation (attenuation, reflection coefficient) across frequencies to accurately identify interface boundaries, overcoming signal confusion issues in traditional single-frequency methods. The technical solution revolves around the entire process of “full pulse signal capture–processing–recognition–calculation”. The novelty of this study lies in “multi-level sound sources + wavelet + cross-correlation”.

2. Methods

2.1. Basic Principle Framework

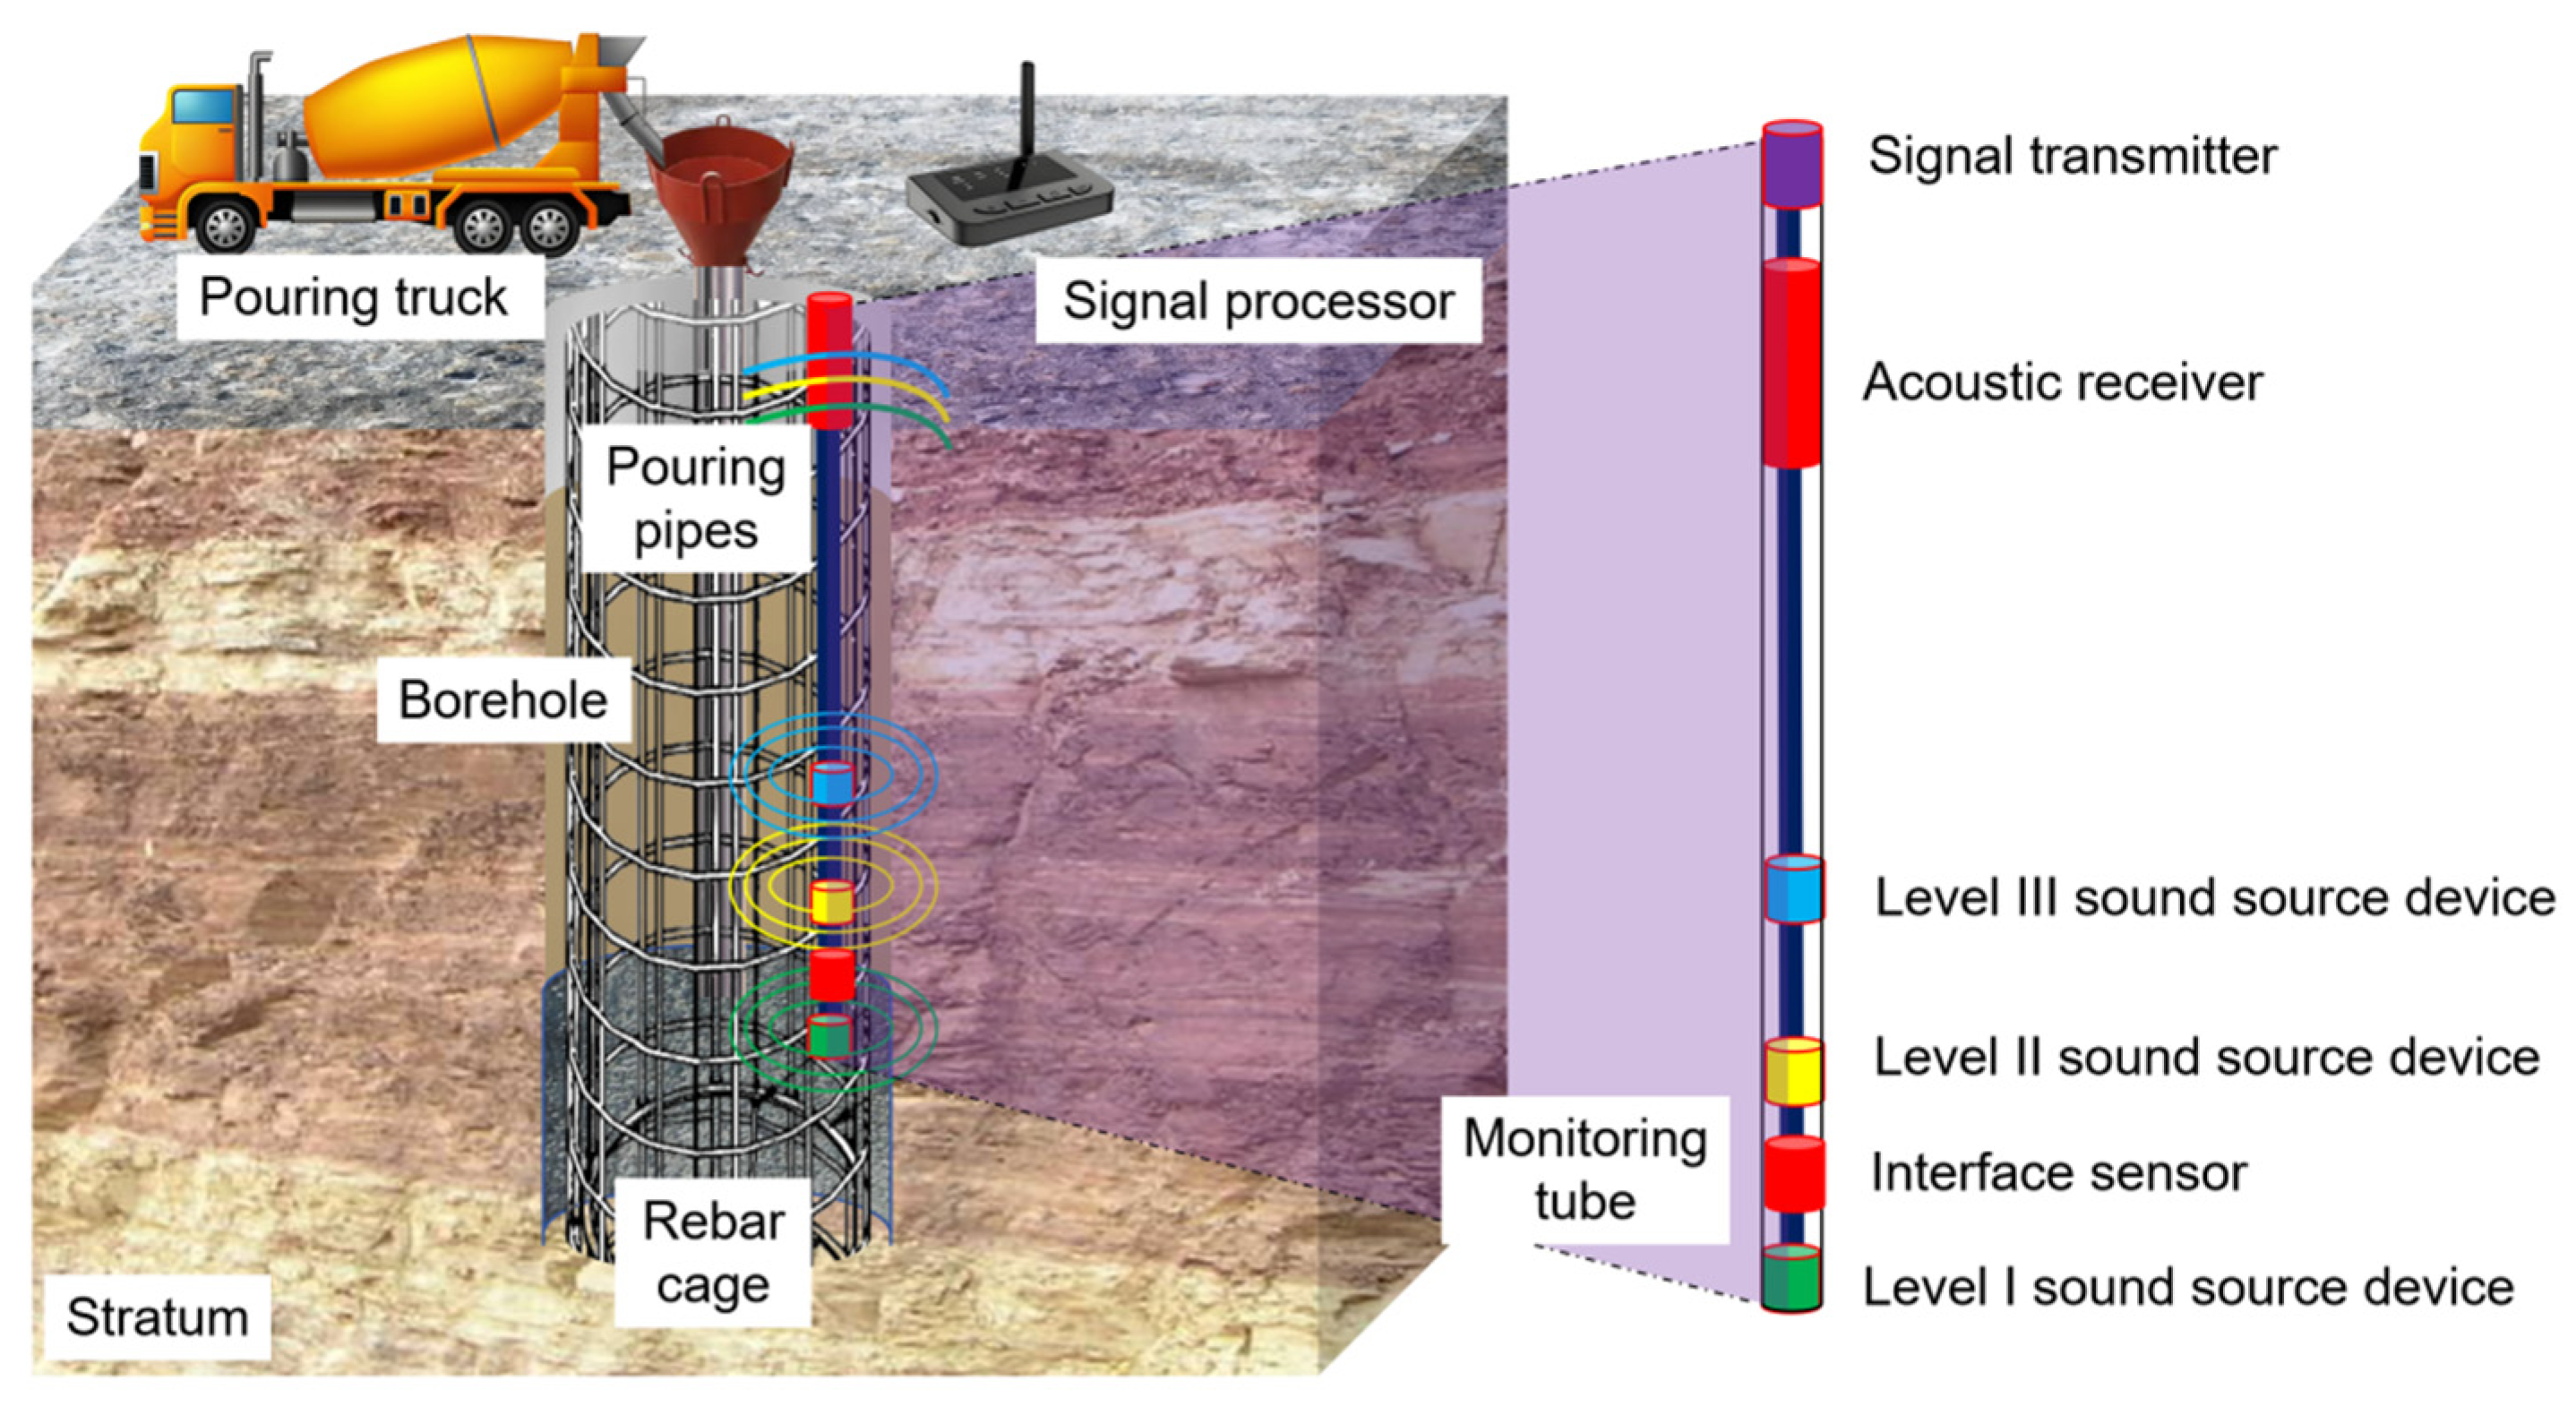
The basic principle of this method is to install sound source devices at different depths within the borehole and capture these sound source signals at the borehole opening. This method leverages the differential characteristics of acoustic wave signal propagation time in different media at various positions to detect the positional information of the concrete pouring interface. For extracting signal differences, full pulse inversion technology is primarily used to identify the propagation characteristics within concrete and the dynamic changes during the cast-in-place pile pouring process. The basic principle of this monitoring method is illustrated in Figure 1. The implementation of this method requires two types of equipment: a downhole monitoring tube and a ground-mounted signal processor. The downhole monitoring tube mainly comprises the Level I sound source, interface acoustic wave sensor, Level II sound source, Level III sound source, acoustic wave receiver, and signal transmitter. The assembly, consisting of the Level I sound source, interface acoustic wave sensor, Level II sound source, and Level III sound source, is installed in the required monitoring area for the pouring interface. In contrast, the assembly of the acoustic wave receiver and signal transmitter is placed at the borehole opening. The primary function of the Level I, Level II, and Level III sound sources is to generate acoustic signals of different frequencies. The acoustic wave receiver is responsible for receiving the acoustic signals emitted by the Level I, Level II, and Level III sound sources. The interface acoustic wave sensor both emits and receives acoustic signals, capturing the round-trip time of acoustic waves between its transducer and the concrete pouring interface. The signal transmitter’s main role is to transmit the collected signals to the ground-based signal processor, while signal storage, analysis, and display are performed by the signal processor.
The basic principle of the device is to lower the monitoring tube above the position that needs to be monitored on the pouring interface during the concrete pouring process of the borehole pile, and activate the monitoring tube and signal processor. During the operation of the device, the circuit in the monitoring tube drives the Level I sound source device, Level II sound source device, and Level III sound source device to simultaneously excite acoustic wave signals with different frequency characteristics. These acoustic wave signals propagate in the concrete and undergo reflection and refraction when encountering different medium interfaces (such as concrete pouring interfaces). Meanwhile, the interface acoustic wave sensor is a directional transducer. When the emitted acoustic wave signal encounters the concrete pouring interface in the propagation direction, its reflected echo signal is received by the interface acoustic wave sensor, which records the time it takes for the acoustic wave signal to travel back and forth in the medium. The orifice full pulse receiver captures all in borehole acoustic signals in real time. These signals are transmitted through signal transmitters to signal processors on the ground for further processing and analysis. The signal processor utilizes full pulse inversion technology to analyze these acoustic signals, thereby extracting the propagation characteristics in concrete and the dynamic changes during the pouring process of the cast-in-place pile. By comparing the propagation time differences in acoustic wave signals at different locations, the position of the concrete pouring interface can be accurately located. The core steps of this method mainly consist of waveform data processing, target feature recognition, and interface position calculation. Section 2.2 and Section 2.3 will provide a detailed description of these three parts.
To clarify the implementation process, a simplified process flow diagram (Figure 2) is first provided, covering four key stages: signal generation, capture, analysis, and interface estimation.
Signal Generation (Multi-level Sound Sources): Three levels of sound sources are pre-installed at fixed depths in the borehole monitoring tube. Each sound source emits continuous, stable pulse signals—high-frequency signals are sensitive to thin mud layers at the interface, medium-frequency signals balance penetration and resolution, and low-frequency signals reduce attenuation in deep concrete. This multi-frequency design directly addresses the limitation of traditional single-frequency methods (unable to distinguish different media).
Signal Capture (Sensors + Receiver): The interface acoustic wave sensor emits directional acoustic waves and captures their round-trip time to the pouring interface. The orifice full pulse receiver (mounted at the borehole opening) collects all acoustic signals propagated from the borehole (including direct signals from sound sources and reflected signals from the interface) in real time, ensuring no loss of effective information.
Signal Analysis (Data Processing + Feature Recognition): The ground processor first performs preprocessing (denoising, enhancement) on the captured signals, then uses wavelet analysis to separate multi-frequency signals, and finally identifies target features via cross-correlation and signal similarity analysis.
Interface Estimation (Dual-mode Calculation): Based on the interface position relative to the sensors, two calculation modes are activated: (1) Near-field mode (interface between sensor and Level II sound source): Uses the sensor’s round-trip time data for direct calculation (high precision). (2) Far-field mode (interface between Level II and Level III sound sources): Uses the propagation time difference between multi-level sound sources for indirect calculation (reduces sensor dependence).

2.2. Waveform Data Processing

After the acoustic wave receiver at the borehole orifice captures all acoustic signals in real-time with full pulses, the waveform data of these captured acoustic signals must first undergo pre-processing to handle complex signals within the borehole. This pre-processing step is critical for improving the accuracy and efficiency of subsequent feature recognition. Waveform data processing primarily includes three key steps: signal denoising, enhancement, and standardization. Specifically, signal denoising involves using filtering algorithms to remove background noise and interference components from acoustic signals, thereby ensuring signal quality. Signal enhancement focuses on amplifying weak components within the signal, which guarantees that all key information can be effectively captured. Signal standardization involves unifying processed acoustic signals to a consistent level, facilitating subsequent data analysis and comparison. Through this series of waveform data processing steps, the signal-to-noise ratio (SNR) of acoustic signals is significantly improved, laying a solid foundation for subsequent target feature recognition.
Wavelet analysis is a time-frequency analysis method in which the width of the window function can vary with the frequency of the signal. It decomposes the signal into a time scale phase space, with each scale corresponding to a certain frequency range. Wavelet transform has the characteristics of multi-resolution analysis and can effectively extract useful information from the signal. It is an ideal tool for processing nonlinear and non-stationary signals. Due to the use of Level I, Level II, and Level III sound sources in this method, which can excite acoustic signals with different frequency characteristics, the acoustic receiver needs to capture all acoustic signals in the borehole in full pulse real-time. Therefore, wavelet analysis method can be used to distinguish signals in different frequency ranges. Let ψ t be a square integrable function, i.e., ψ t L 2 R . If its Fourier transform satisfies the condition:
C ψ = + ψ ω 2 ω d ω <
Then ψ t is called a fundamental wavelet or mother wave, and the above equation is the wavelet tolerance condition, which implies that if ψ 0 = 0 , the mean of the analyzed signal is zero. The wavelet mother function ψ t is scaled a and time shifted b to obtain the wavelet function family ψ a , b t , which takes the form of:
ψ a , b t = a 1 2 ψ t b a                                         a , b R ;                           a > 0
ψ a , b t is a wavelet mother function that depends on parameters a and b . Changing the size of scale can transform the shape of the window, thereby adjusting the frequency range covered by the wavelet and achieving the translation of the wavelet window in the frequency domain. By changing the size of the time factor b, the position of the wavelet in the time domain window can be adjusted to achieve translation in the time domain. The continuous wavelet transform of signal s(t) is defined as:
W s a , b s t ,                 ψ s a , b t   a 1 2 + s t ψ * t b a d t ,             a 0
In the equation, ψ a , b * t is the conjugate function of ψ a , b t . For permissible wavelets, the inverse wavelet transform or reconstruction relationship is:
s t = 1 C ψ 0 + d a a 2 + W s a , b 1 a ψ t b a d b        
Wavelet transform has the property of “zoom”. When analyzing low-frequency signals, corresponding to large scales, its time window is large. When analyzing high-frequency signals, corresponding to small scales, its time window decreases. By using wavelet transform, it is possible to effectively distinguish and process acoustic signals with different frequency characteristics captured inside the borehole. By analyzing the wavelet coefficients at each scale, feature information corresponding to different frequency acoustic signals can be extracted. After completing wavelet analysis, other signal processing techniques such as Fourier transform, Hilbert transform, etc., can be further utilized to refine the analysis of acoustic signals, in order to extract more detailed information about the internal structure and pouring process of concrete. These processing results will provide strong support for subsequent target feature recognition and interface position calculation.

2.3. Target Feature Recognition and Interface Position Calculation

Once waveform data processing is completed, the workflow proceeds to the target feature recognition stage. The primary task of this stage is to extract key feature information related to the concrete pouring interface of cast-in-place piles from the processed acoustic signals. The excitation signals consist of Level III, Level II, and Level I signals, which are emitted by the corresponding Level III, Level II, and Level I sound sources, respectively. The received signals, which serve as the focus of target feature recognition, mainly include the Level III, Level II, and Level I signals—each corresponding to the excitation signal emitted by its namesake sound source. A schematic diagram of the target feature region is presented in Figure 3. Specifically, the target recognition region encompasses three types of acoustic information: (1) the acoustic information carried by the excitation signal from the Level III sound source as it propagates between the Level III sound source and the acoustic receiver; (2) the acoustic information carried by the excitation signal from the Level II sound source during its propagation between the Level II sound source and the acoustic receiver; and (3) the acoustic information carried by the excitation signal from the Level I sound source as it travels between the Level I sound source and the acoustic receiver. This feature information includes, but is not limited to, the reflection intensity, refraction angle, attenuation characteristics, and propagation time of the acoustic signal. For instance, reflection intensity reflects the energy loss of acoustic waves when they encounter the pouring interface; refraction angle reveals changes in the propagation direction of acoustic waves across different media; attenuation characteristics provide indirect insights into the internal structure and compactness of concrete; and propagation time is a key parameter for locating the position of the pouring interface. To accurately identify these target features, advanced signal processing algorithms are employed.
To identify and distinguish the Level III, Level II, and Level I signals within the target feature region, the cross-correlation function between the excitation signals and received signals should be calculated. This cross-correlation function contains information about the Green’s function between sound source A and receiving point B. The impulse response function of these two points (sound source A and receiving point B) can be derived, and theoretically, this Green’s function is consistent with the impulse response function obtained under active excitation-reception conditions. By analyzing the cross-correlation function, the propagation characteristics of acoustic signals emitted by different levels of sound sources in concrete can be identified, thereby enabling the determination of the target feature region. During the target feature recognition process, attention must also be paid to the frequency components of acoustic wave signals. Since different levels of sound sources excite acoustic signals of different frequencies, the propagation characteristics of these signals in concrete also differ. By analyzing the frequency components of acoustic signals, we can gain further insights into the internal structural characteristics and defect status of concrete.
In the time domain, three types of signals can be predicted based on the order of arrival time and the strength of energy of the acoustic wave signal. Specifically, the third-level signal takes the shortest time and receives the strongest amplitude of the acoustic wave. The duration of the second-level signal is followed by the strength of the received acoustic wave amplitude. Level I signals take the longest time and receive the weakest amplitude of acoustic waves. In addition, combining the similarity of signals to further distinguish acoustic wave signals. Assuming that the initial excitation signal and the received signal are T {m1, m2, m3, …} and R {n1, n2, n3, …}, respectively, the similarity between the signals is defined as:
ρ m , n t = N m t n t m t n t N m t 2 m t 2 N n t 2 n t 2
In the above equation, the description of ρ m , n t is the degree of similarity between the initial excitation signal and the reconstructed signal. If the two are completely identical after normalization, the correlation coefficient ρ m , n t = 1 , indicating that the received signal has the highest probability of being the target signal. If ρ m , n t 0 , then the two are not correlated, indicating that the probability of the received signal being the target signal is the smallest.
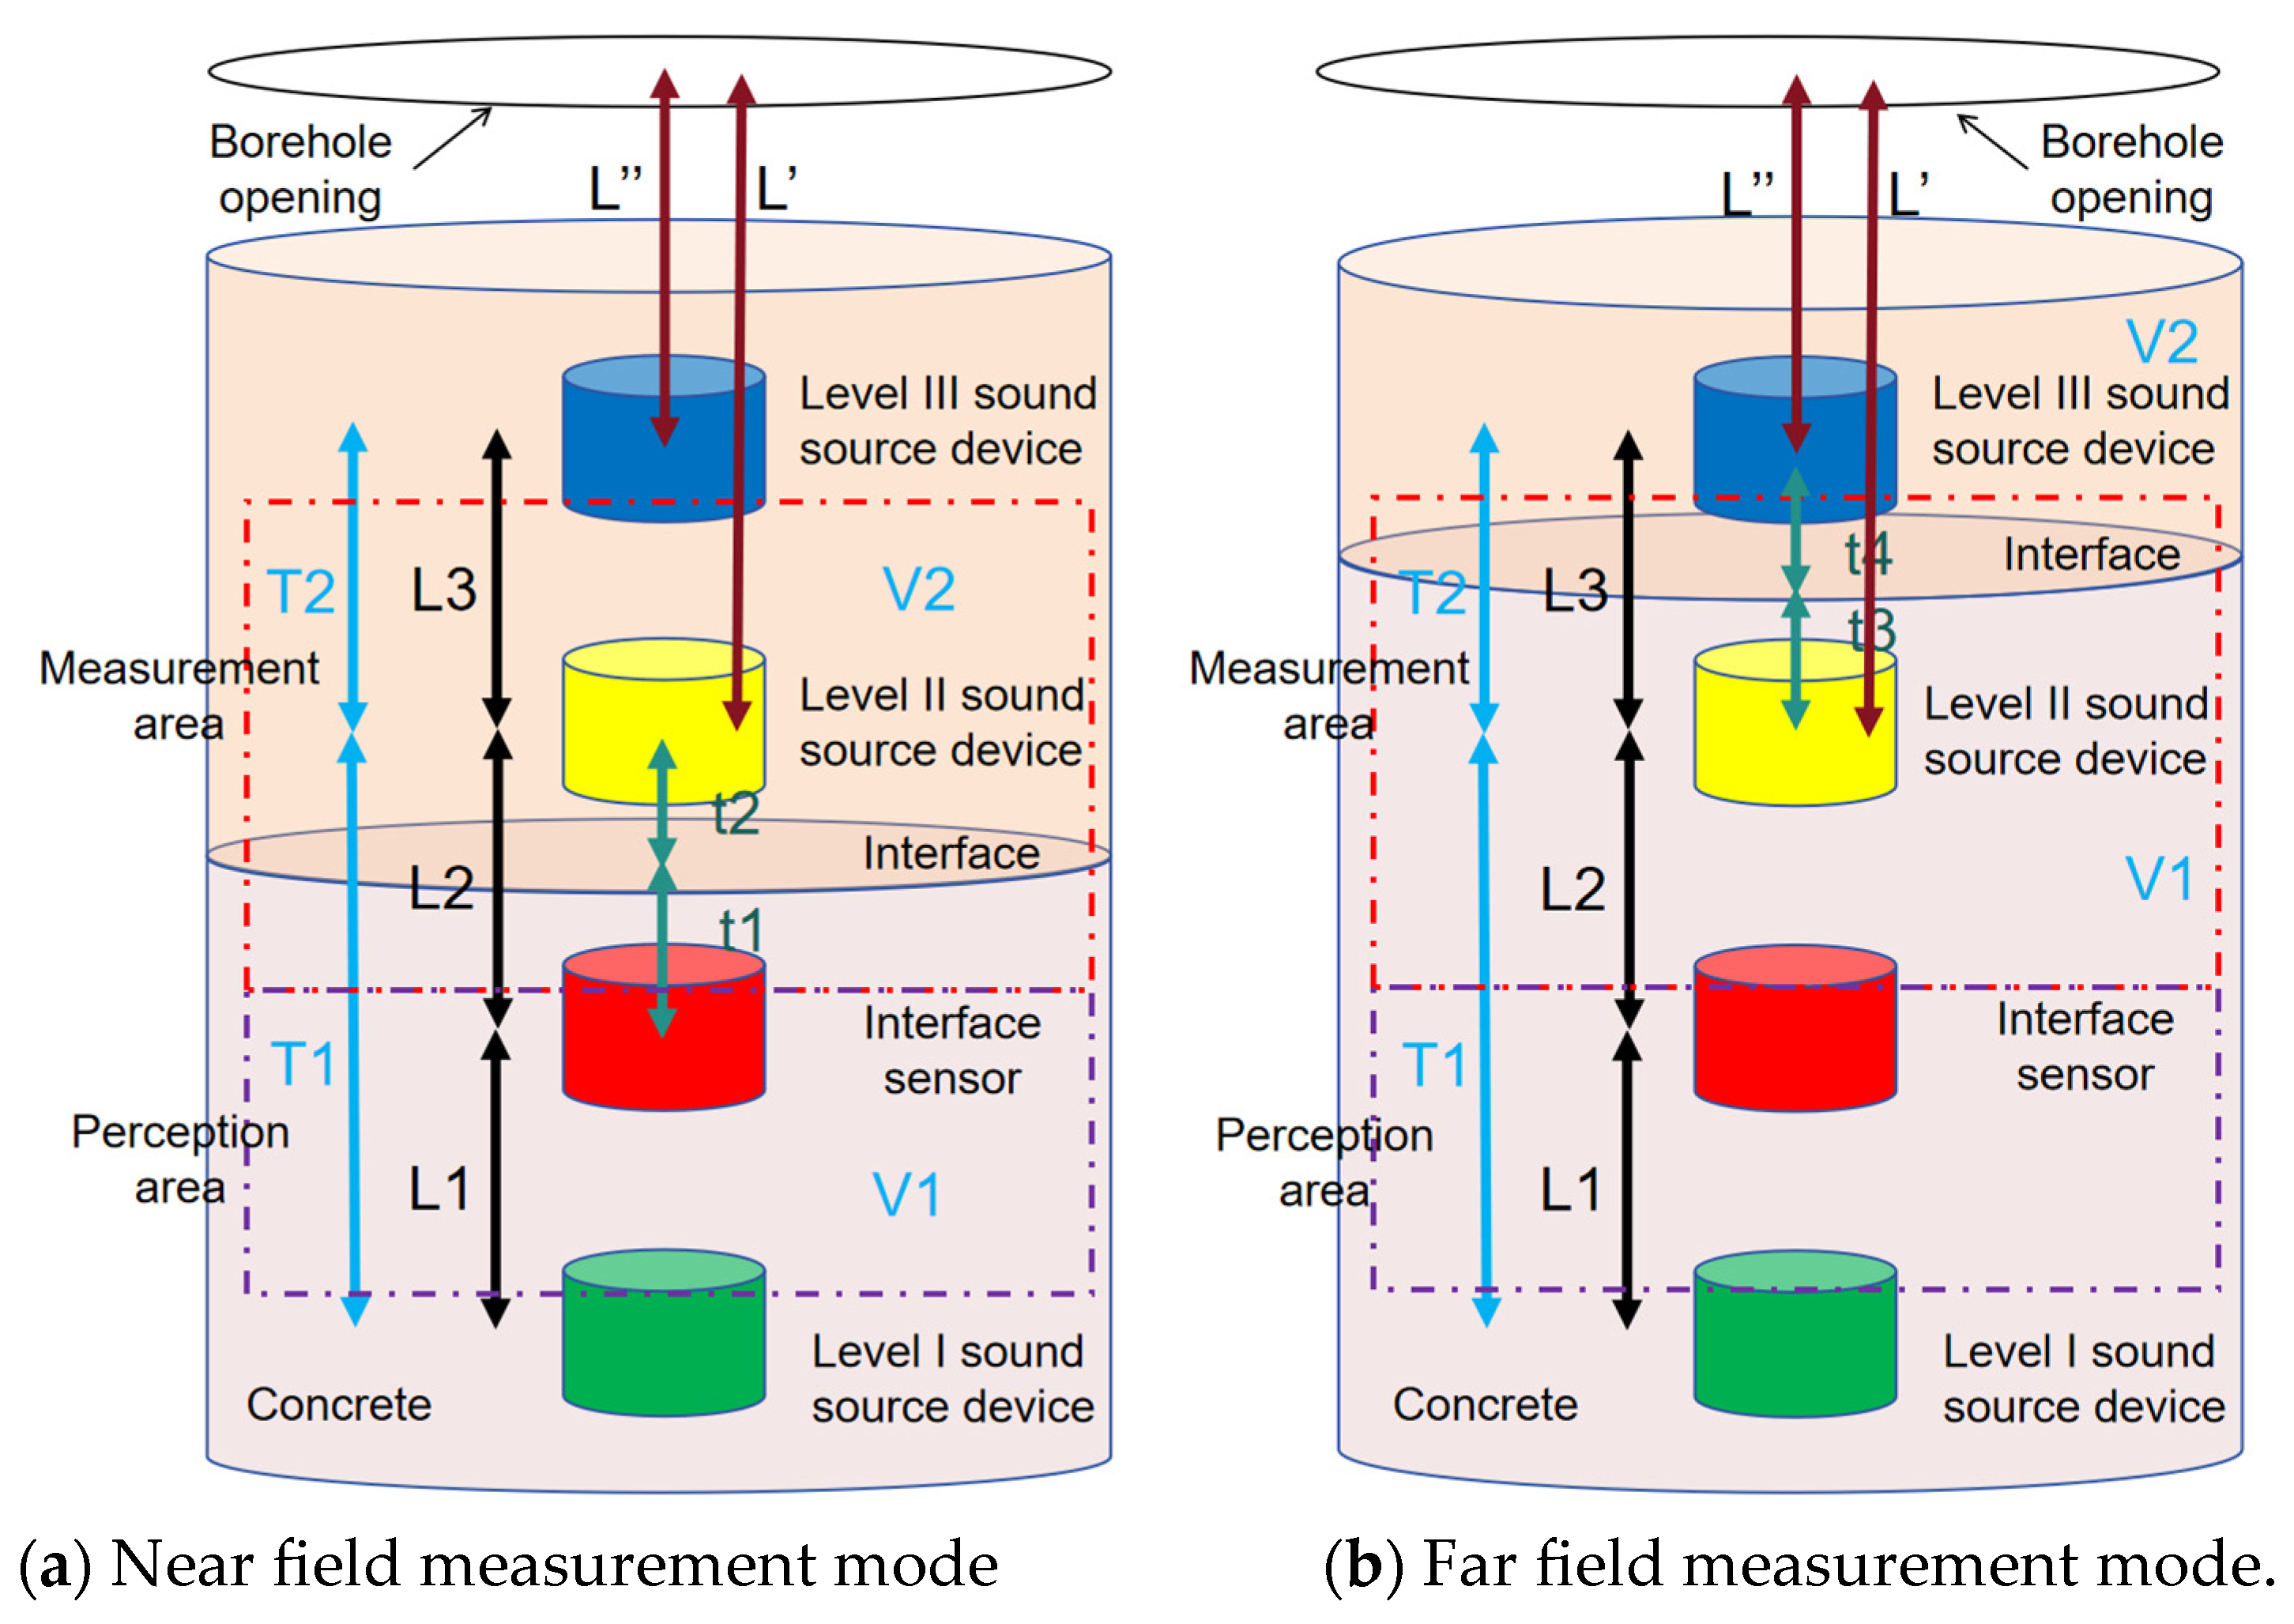
The extracted target features (e.g., T1, T2, V1) directly inform the interface position calculation, which relies on dividing the monitoring tube into ‘perception-measurement’ zones and ‘near-field-far-field’ modes to optimize accuracy. After completing waveform data processing and target feature recognition, calculating the position of the pouring interface becomes necessary. Based on the layout of the Level I sound source, interface acoustic wave sensor, Level II sound source, Level III sound source, and acoustic wave receiver inside the monitoring tube, the tube is divided into a sensing area and a measurement area. Specifically:
When the pouring interface is in the sensing area, the signal processor detects its entry and prepares for real-time measurement of the interface. This method defines the sensing area as the region between the Level I sound source and the interface acoustic wave sensor.
When the pouring interface is in the measurement area, the signal processor detects its entry and calculates the interface’s accurate real-time position. This method defines the measurement area as the region between the interface acoustic wave sensor and the Level III sound source.
When the pouring interface is at different positions within the measurement area, variations in the measurement accuracy of the interface acoustic wave sensor may occur. To achieve higher measurement accuracy, the measurement area is further divided into two modes:
Near-field measurement mode: Activated when the pouring interface is between the interface acoustic wave sensor and the Level II sound source. This mode relies heavily on data from the interface acoustic wave sensor (see Figure 4a).
Far-field measurement mode: Activated when the pouring interface is between the Level II and Level III sound sources. This mode relies minimally on data from the interface acoustic wave sensor (see Figure 4b).
In the pouring interface position measurement model, it is assumed that the acoustic wave transmission time between the first level sound source and the second level sound source is T1, and the acoustic wave transmission time between the second level sound source and the Level III sound source device is T2. T1 corresponds to the time difference between the first-level signal and the second-level signal. T2 corresponds to the time difference between the level II signal and the level III signal. The distance between the Level I sound source and the interface acoustic wave sensor is L1. The distance between the interface acoustic wave sensor and the Level II sound source is L2. The distance between the Level II sound source and the Level III sound source is L3. The acoustic wave velocity below the pouring interface is V1. The acoustic wave velocity above the pouring interface is V2. Therefore, in near-field measurement mode, the following relationship exists:
V 1 × t 1 + L 3 T 2 × t 2 = L 2 L 1 V 1 + t 1 + t 2 = T 1
Among them, t1: One-way sound propagation time from the interface acoustic sensor to the pouring interface (μs). L3: Distance between Level II and Level III sound sources (m). T2: Sound propagation time between Level II and Level III sound sources (μs). L2: Distance between the interface acoustic sensor and Level II sound source (m). L1: Distance between Level I sound source and the interface acoustic sensor (m). T1: Sound propagation time between Level I and Level II sound sources (μs). V1: Sound velocity in concrete below the pouring interface (m/s). V2: Sound velocity in slurry/concrete above the pouring interface (m/s). t2: One-way sound propagation time from Level III sound source to the pouring interface (μs). t1, L3, T2, L2, L1, and T1 are known quantities. T1 is the propagation speed between the interface sensing sensor and the interface, which can be determined by analyzing the first echo signal collected by the interface sensing sensor. T2 and V1 are unknown variables. The values of t2 and V1 can be obtained based on Equation (6).
V 1 = K 1 + K 2 L 3 × t 1 L 2 × T 2 + L 3 × T 1 2 × T 2 × t 1
Alternatively, it can be
V 1 = K 1 + K 2 + L 3 × t 1 + L 2 × T 2 L 3 × T 1 2 × T 2 × t 1
t 2 = T 1 t 1 + 2 × K 1 + K 2 + 2 × L 2 × T 2 4 × L 3
Alternatively, it can be
t 2 = T 1 t 1 2 × K 1 + K 2 2 × L 2 × T 2 4 × L 3
Among them,
K 1 = L 2 2 × T 2 2 2 × L 2 × L 3 × T 1 × T 2 + 2 × L 2 × L 3 × T 2 × t 1 K 2 = L 3 2 × T 1 2 2 × L 3 2 × T 1 × t 1 + L 3 2 × t 1 2 + 4 × L 1 × L 3 × T 2 × t 1
In practical calculations, there are corresponding constraints for selecting the specific values of t2 and V1. The specific constraints are as follows:
0 t 2 L 2 V 2 V 2 V 1 L 2 t 1
In the far-field measurement mode, since the pouring interface passes the Level II sound source and the distance between the interface acoustic wave sensor and the Level II sound source is relatively large, direct sensing of the pouring interface via the interface acoustic wave sensor tends to introduce substantial errors. To reduce reliance on data from the interface acoustic wave sensor, a calculation method for the interface position in the far-field measurement mode is established, with the corresponding expression given as follows:
t 3 + t 4 = T 2 v 1 × t 3 + V 2 × t 4 = L 3
Among them, V1, V2, T2, and L3 are known quantities, while t3 and t4 are unknown quantities. The values of t3 and t4 can be obtained based on Equation (13). We can obtain:
t 3 = L 3 V 2 × T 2 V 1 V 2 t 4 = V 1 × T 2 L 3 V 1 V 2
The calculation formula for the distance L between the location of the concrete pouring interface and the borehole opening is:
L = L + V 2 × t 2                           In   near - field   measurement   mode L = L + V 2 × t 4                         In   far - field   measurement   mode
Among them, L′ denotes the vertical distance between the Level II sound source (located inside the monitoring tube) and the borehole opening. L″ denotes the vertical distance between the Level III sound source (located inside the monitoring tube) and the borehole opening.
3. Case Analysis

Taking a concrete pouring trial installation project of a certain actual cast-in-place pile as an example, the full pulse acoustic monitoring method was used to monitor the pouring process in real time. The key parameters of the test pile and experimental conditions were strictly controlled to ensure the reliability of monitoring results, with detailed settings as follows:

3.1. Basic Pile and Concrete Mix Design Parameters

The cast-in-place pile was designed as a friction pile with a diameter of 1.2 m and an effective pile depth of 20.0 m (from the orifice elevation to the pile tip). The concrete used for pouring was C30 ready-mixed concrete, with a mix design optimized for workability and acoustic propagation stability (critical for avoiding artificial interference with acoustic wave signals). The specific mix proportion (by mass) was:
  • Cement: P·O 42.5 ordinary Portland cement, 320 kg/m3;
  • Coarse aggregate: Crushed limestone with a continuous gradation of 5–20 mm, 1180 kg/m3;
  • Fine aggregate: Medium sand with fineness modulus of 2.6, 650 kg/m3;
  • Mineral admixture: Class F fly ash, 55 kg/m3 (15% replacement rate of cement, improving concrete homogeneity);
  • Water-reducing agent: Polycarboxylate superplasticizer, 6.4 kg/m3 (slump controlled at 180 ± 10 mm to avoid segregation during pouring).
The concrete was transported by a concrete mixer truck and poured into the borehole through a tremie pipe (diameter 150 mm) to ensure continuous and stable pouring, preventing interface defects caused by discontinuous pouring.

3.2. Sensor Layout and Depth Intervals

To achieve differentiated capture of acoustic signals at different depths, the monitoring tube (PVC material, inner diameter 80 mm) was pre-embedded along the rebar cage, with multi-level sound sources and interface acoustic wave sensors installed at fixed depth intervals. The specific layout was:
  • Level I sound source (50 kHz): Installed at a depth of 18.5 m, mainly used to emit low-frequency acoustic signals with strong penetration (reducing attenuation in deep concrete);
  • Interface acoustic wave sensor (200 kHz): Fixed at a depth of 15.0 m, responsible for emitting and receiving directional acoustic waves to capture the round-trip time between the sensor and the pouring interface;
  • Level II sound source (75 kHz): Installed at a depth of 11.5 m, emitting medium-frequency signals that balance penetration and resolution (suitable for medium-depth interface recognition);
  • Level III sound source (100 kHz): Fixed at a depth of 8.0 m, emitting high-frequency signals sensitive to small interface changes (e.g., thin mud layers between concrete batches);
  • Orifice full pulse receiver: Mounted at the orifice (0 m depth), with a built-in high-sensitivity piezoelectric sensor to collect all acoustic signals propagated from the borehole.

3.3. Sampling Frequency and Signal Acquisition Parameters

To ensure real-time and continuous monitoring of the pouring interface, the signal acquisition system was set with optimized sampling parameters:
  • Sound source excitation frequency: The three levels of sound sources operated in a synchronous cycle, with each sound source excited once every 0.5 s (excitation duration 10 μs) to avoid signal overlap;
  • Orifice receiver sampling rate: 2 MHz (consistent with the Nyquist sampling theorem, ensuring no distortion of high-frequency signals up to 100 kHz);
  • Data sampling interval: The ground processor collected and stored integrated signal data (after denoising and feature extraction) every 8.57 s, resulting in 70 valid monitoring data points over the 10 min pouring period (10 min × 60 s/min ÷ 8.57 s/point ≈ 70 points). This sampling frequency balanced data density and storage efficiency—higher than the 1~2 min interval of traditional methods, ensuring no missing transient interface changes.

3.4. Monitoring Process and Result Analysis

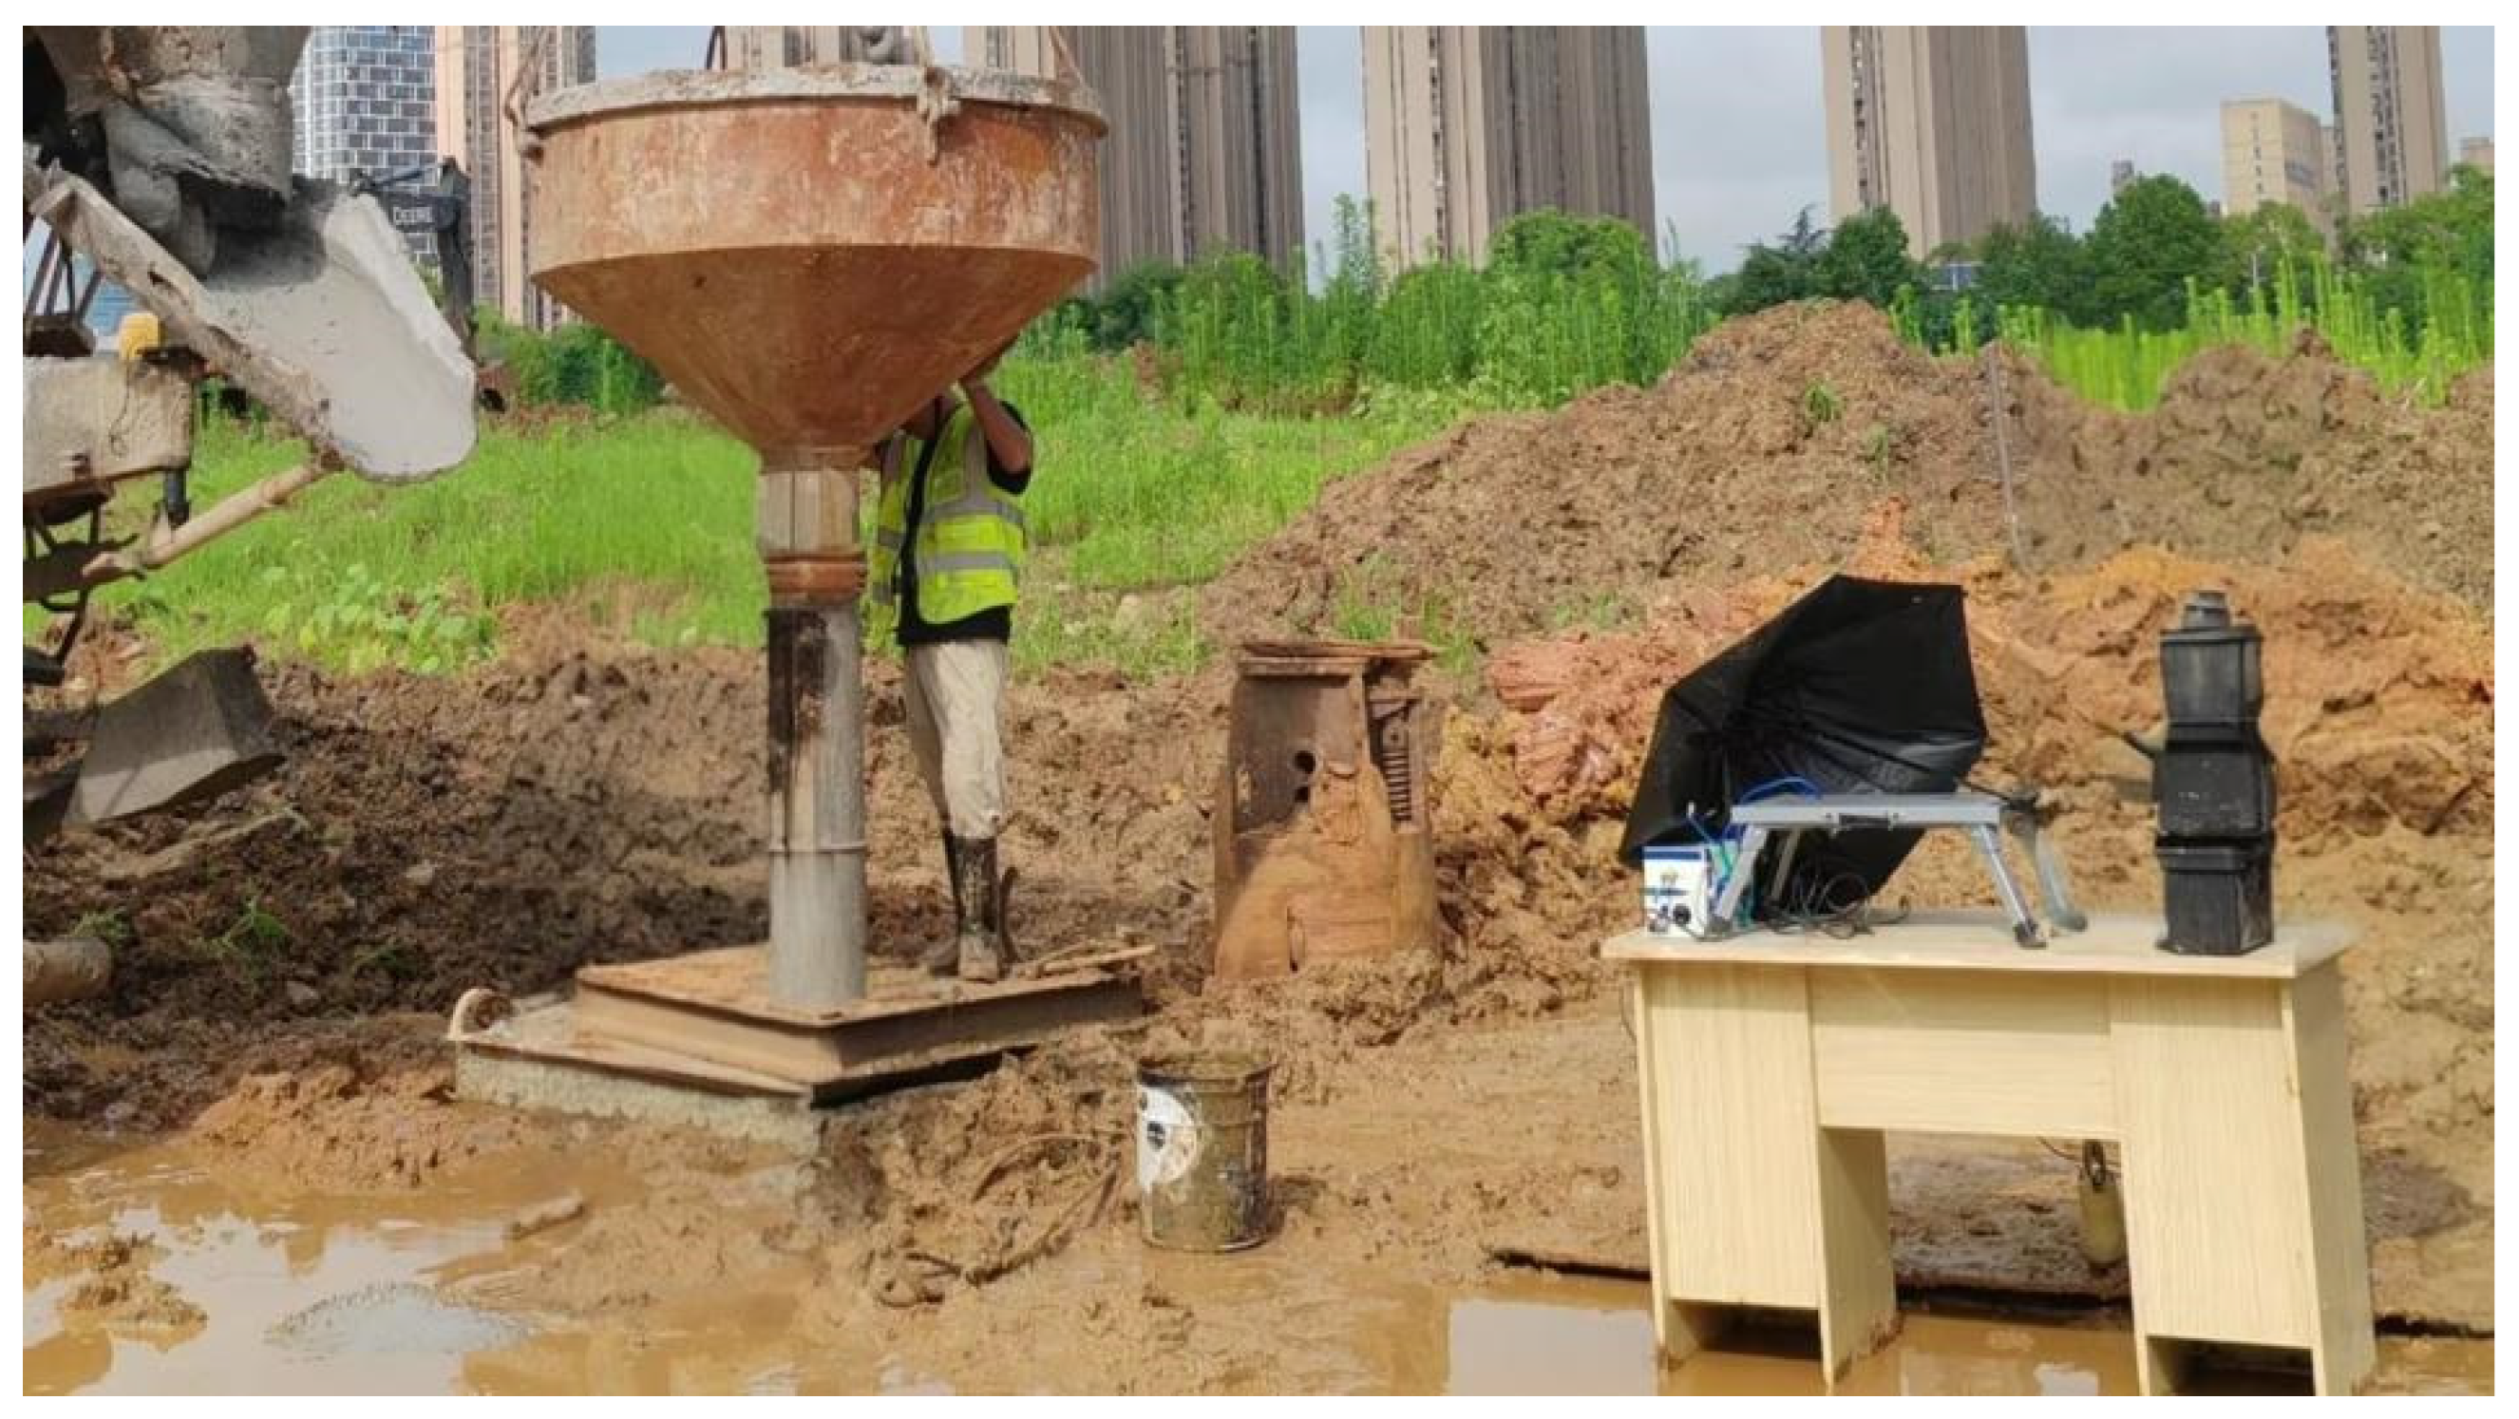
During the pouring process, the signal processor performed waveform data processing, target feature recognition, and interface position calculation in real time according to the method described in Section 2.1, Section 2.2 and Section 2.3. Figure 5 is the photo taken on site.
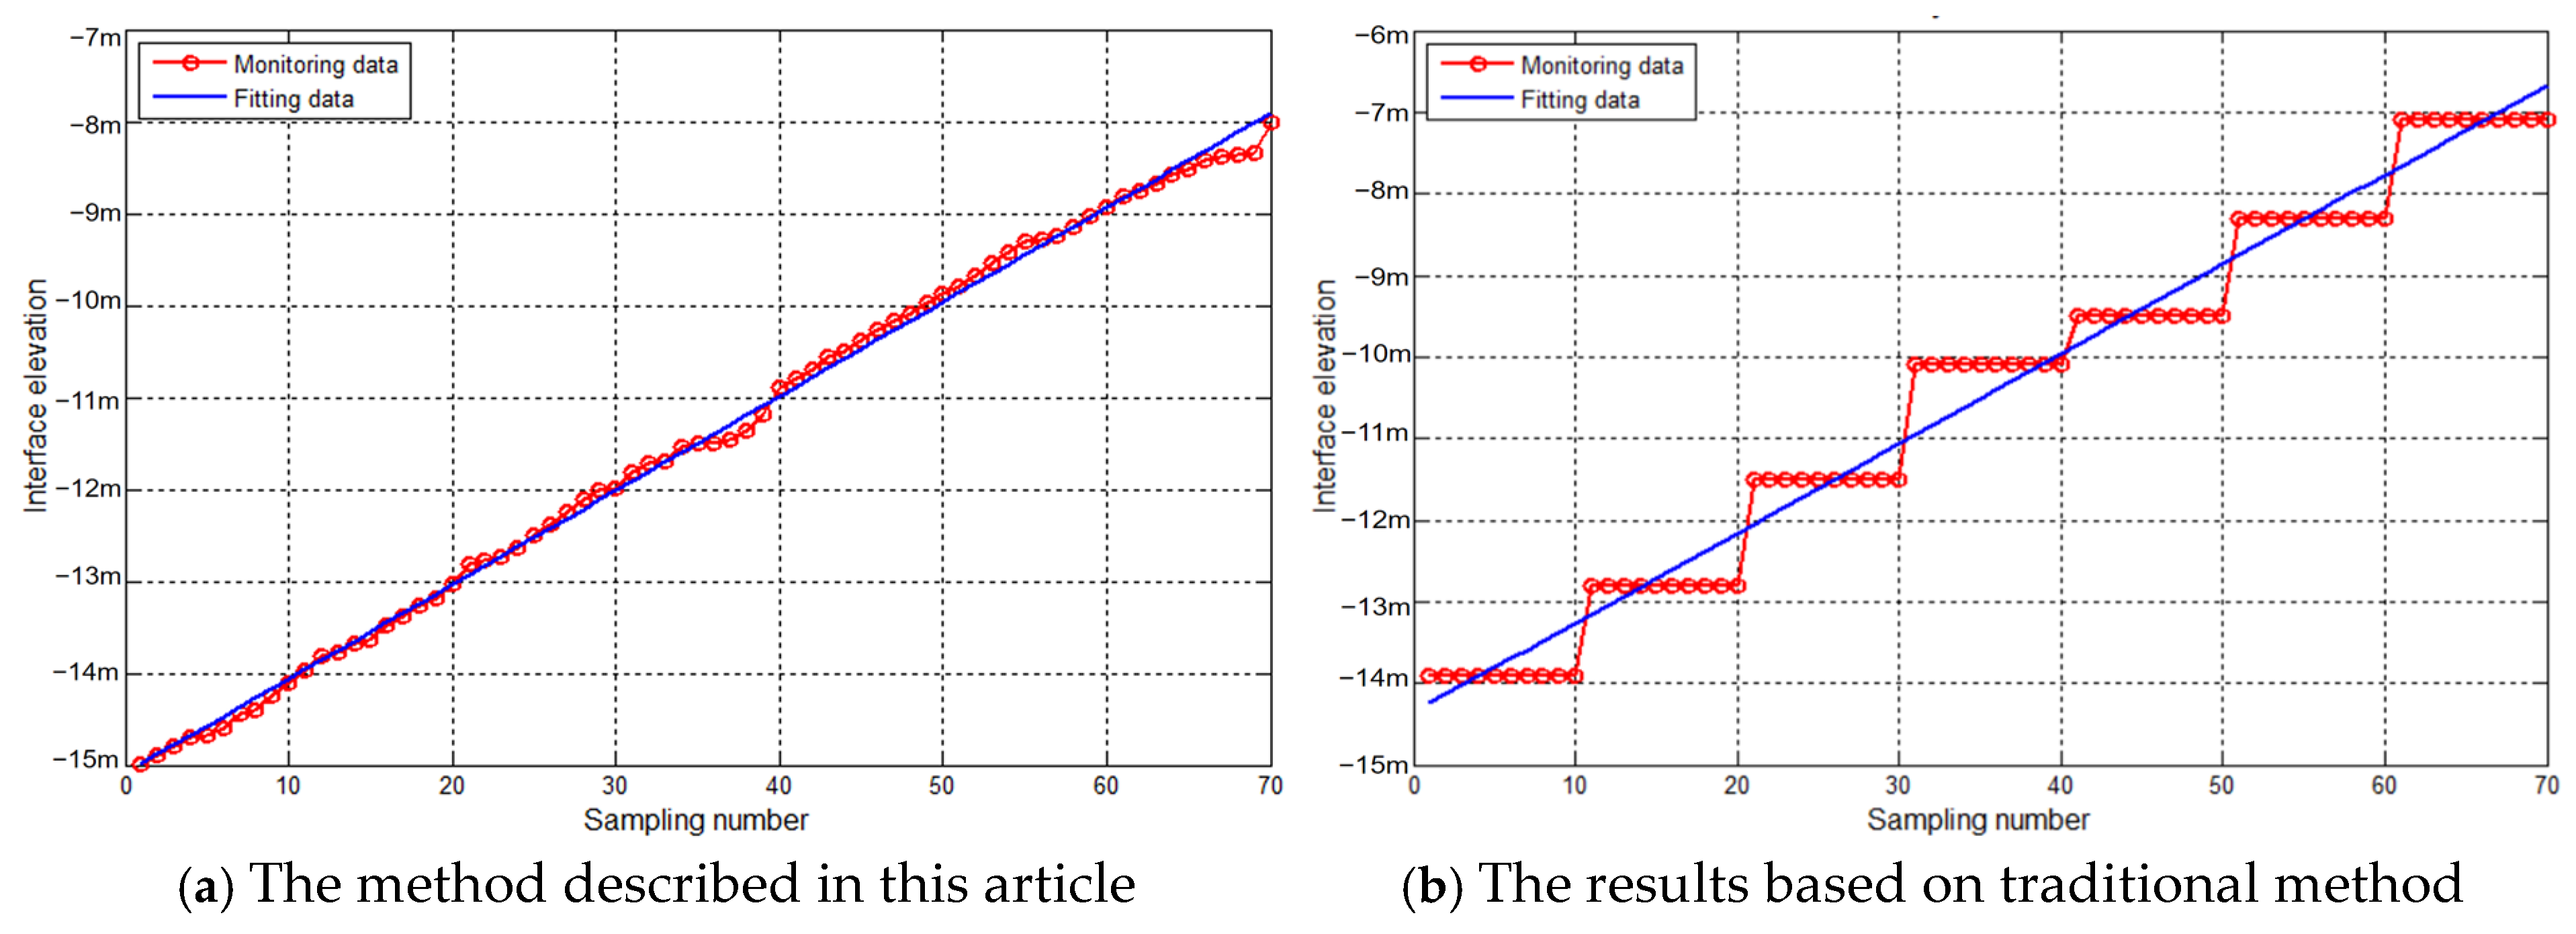
In the waveform data processing stage, the collected acoustic signals first undergo preprocessing—including denoising and filtering—to improve signal quality. Next, wavelet transform is applied to conduct time-frequency analysis on the acoustic signals, thereby extracting acoustic signals with distinct frequency characteristics. By analyzing the wavelet coefficients at each scale, feature information corresponding to acoustic signals of different frequencies is successfully extracted. In the target feature recognition stage, the cross-correlation function is obtained by calculating the cross-correlation between the excitation signal and the received signal. Based on this function, acoustic wave signals emitted by sound sources of different levels are identified. Further differentiation between Level III, Level II, and Level I signals is achieved through signal similarity analysis. Meanwhile, by analyzing the reflection intensity, refraction angle, attenuation characteristics, and propagation time of acoustic wave signals, key feature information related to the concrete placement interface of cast-in-place piles is extracted. In the interface position calculation stage, the monitoring area is divided into a near-field measurement mode and a far-field measurement mode in accordance with the measurement method described in this paper. The near-field measurement mode primarily monitors depths ranging from 11.5 to 15.0 m, while the far-field measurement mode focuses on depths of 8.0 to 11.5 m. When the borehole depth is set to 0 m, the corresponding interface monitoring elevation range is [−8 m, −15 m], with a concrete placement duration of 10 min. The depth variation in the monitoring interface measured by the method outlined in this paper is presented in Figure 6a. This article selects the traditional contact measurement method [17] as a comparative experiment for analysis, and the obtained interface changes are shown in Figure 6b.
Figure 6 shows that during the 10 min of pouring, the method proposed in this paper can continuously collect 70 monitoring data points, while the sampling method proposed in this paper can only intermittently collect a small amount of data; that is, the monitoring results obtained by traditional methods are discontinuous and mainly intermittent data. Our method continuously captures real-time pouring interface dynamics. Compared to traditional methods with a small number of discrete points, the trend of changes monitored in this article can more accurately grasp the true state of the pouring interface. In addition, the method proposed in this article was fitted using the minimum binary method to form a uniform growth curve of the pouring interface, as shown in Figure 6a. The linear equation is y = 0.102x − 15.087, and the corresponding sum of squared residuals is 0.6192. Fit the traditional method with the minimum binary method to form a uniform growth curve of the pouring interface, as shown in Figure 6b. The linear equation is y = 0.110x − 15.358, and the corresponding sum of squared residuals is 8.9587. By comparison, this shows that the method proposed in this article has a higher degree of goodness of fit and a smaller sum of squared residuals, indicating that the monitoring data obtained by this method is more accurate and reliable.
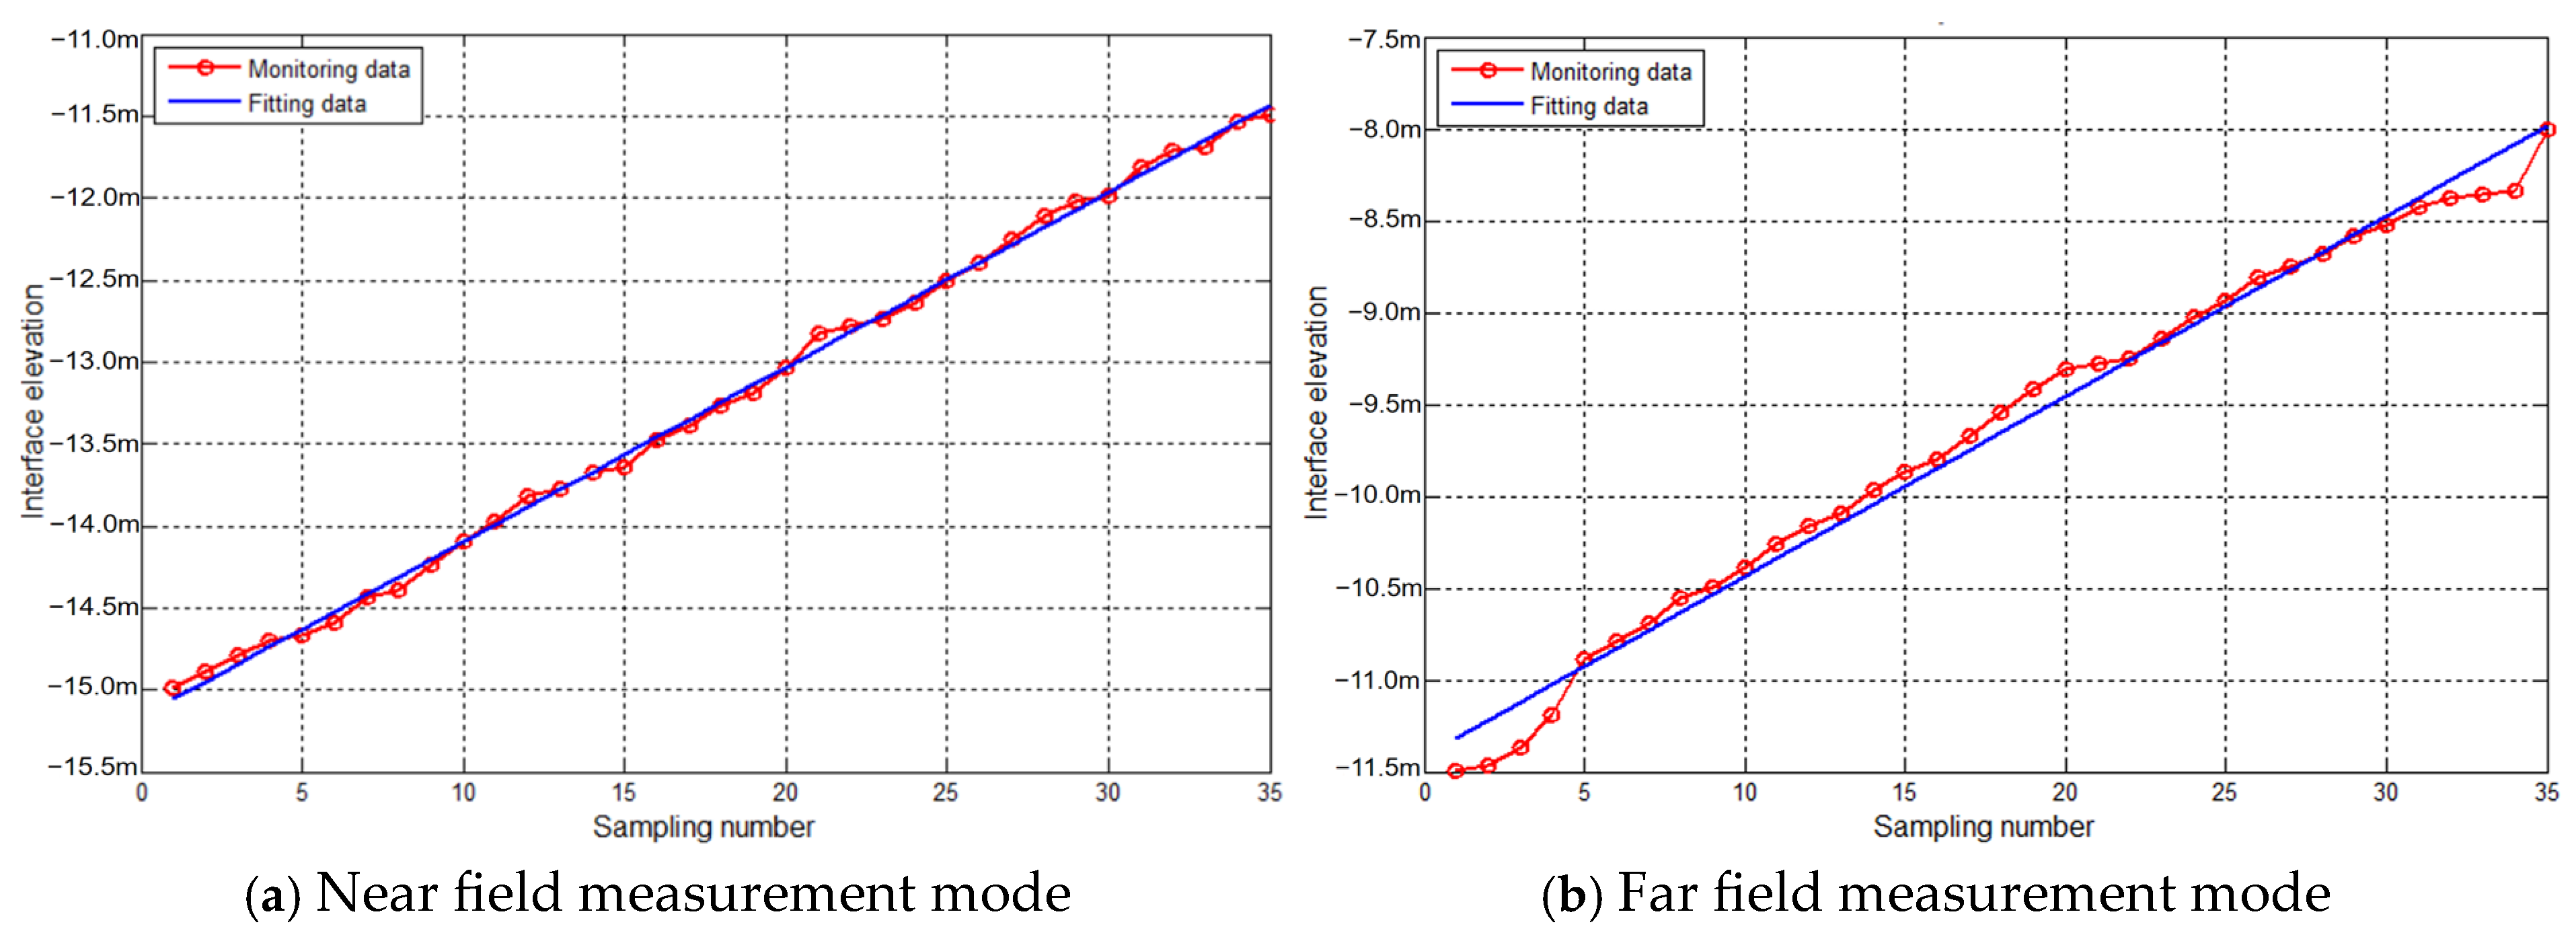
In addition, the results obtained from the near-field measurement mode and far-field measurement mode using the method proposed in this article are compared, and the results are shown in Figure 7. Figure 7a shows that the minimum binary method is used to fit the data obtained in near-field measurement mode, forming a uniform growth curve of the pouring interface. The linear equation is y = 0.107x − 15.163, and the corresponding residual sum of squares is 0.0773. Figure 7b shows that the minimum binary method is used to fit the data obtained in near-field measurement mode, forming a uniform growth curve of the pouring interface. The linear equation is y = 0.098x − 11.417, and the corresponding residual sum of squares is 0.4084. By comparison, this shows that the sum of squared residuals in near-field measurement mode is smaller than that in far-field measurement mode, indicating that the depth changes in the monitoring interface obtained in near-field measurement mode are more stable than those in far-field measurement mode. This is mainly due to the fact that in near-field measurement mode, the acoustic wave sensor can measure the sound velocity value of concrete in real time, providing more realistic data for the elevation calculation of the interface. Although the depth change in the monitoring interface in far-field measurement mode is not as stable as that in near-field measurement mode, the fluctuation amplitude does not change much, and high-precision interface monitoring can still be achieved.
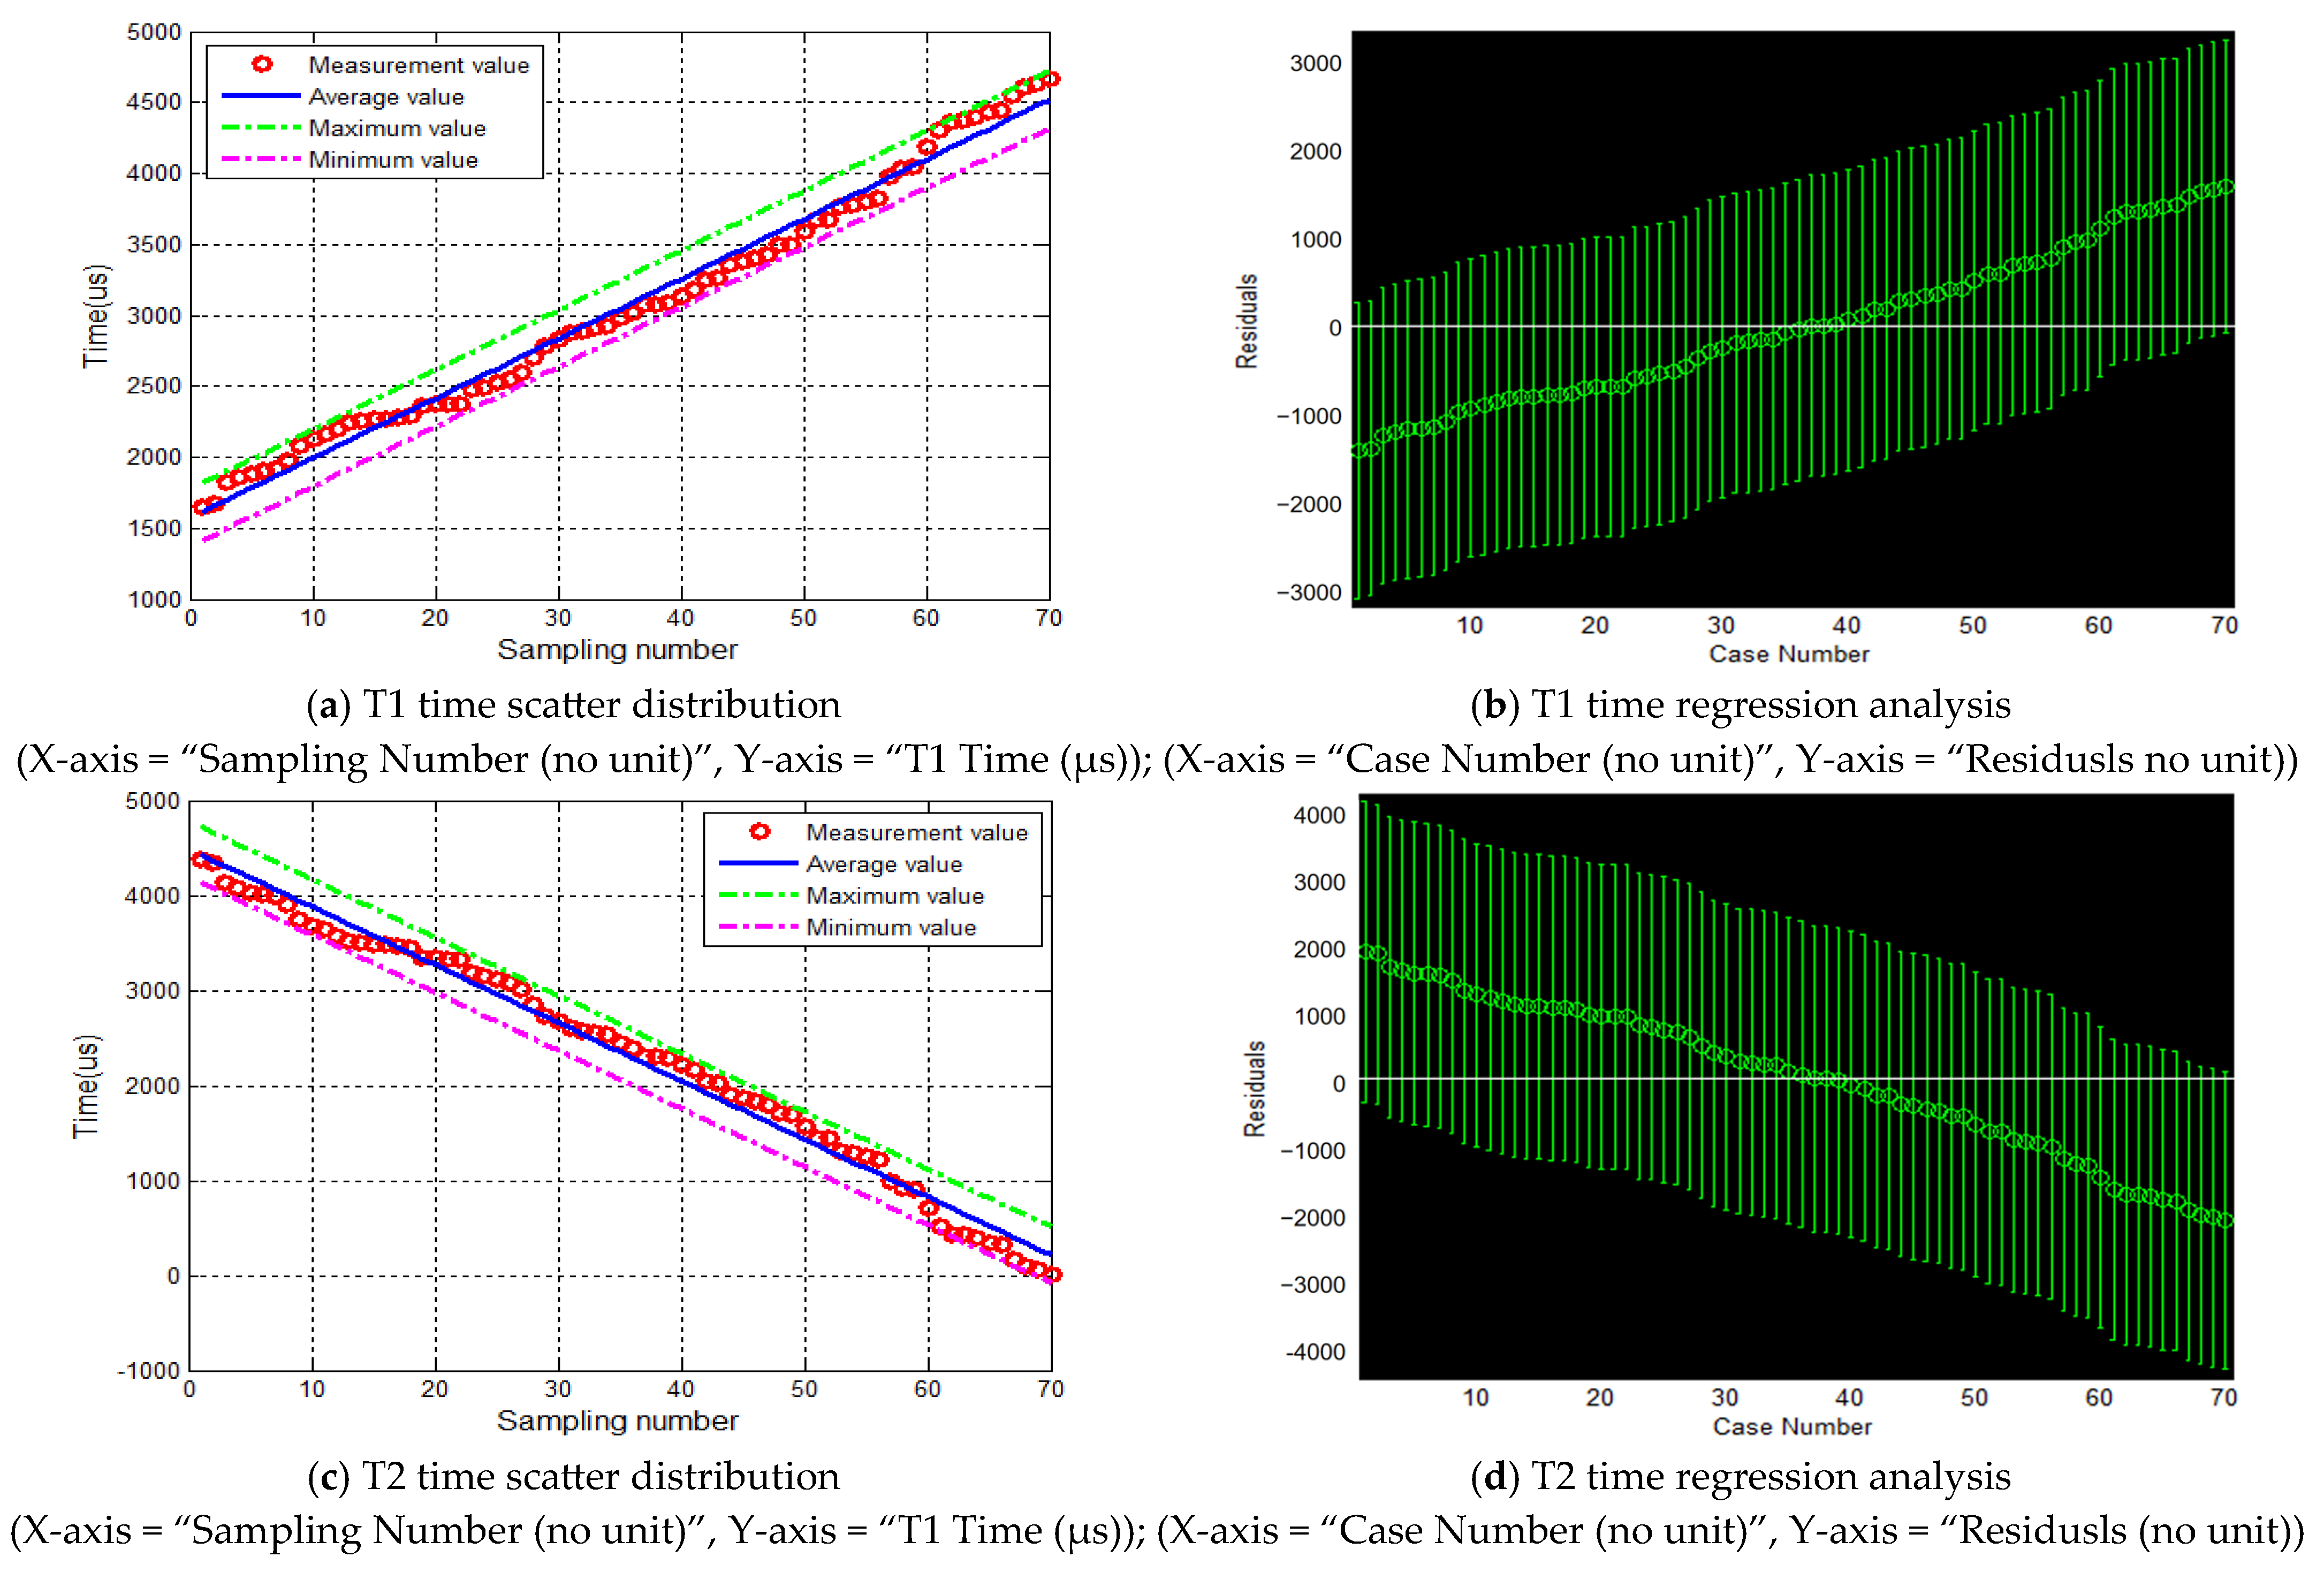
In the analysis of the acoustic wave propagation time T1 and T2, mathematical statistics and regression analysis were performed on the acoustic wave propagation time T1 and T2, respectively. The results are shown in Figure 8. Figure 8a and Figure 8b, respectively, reflect the scatter distribution and regression characteristics of the acoustic wave propagation time T1. Figure 8a,b show that the time T1 shows a trend of gradually increasing from 1560 µs to 4670 µs, and the distribution trends of its maximum, minimum, average, and residual values are relatively consistent, indicating that the target recognition accuracy of the acoustic wave propagation time T1 is high. Figure 8c and Figure 8d, respectively, reflect the scatter distribution and regression characteristics of the acoustic wave propagation time T2. Figure 8c,d show that time T2 shows a trend of gradually decreasing from 4500 µs to 0 µs, and the distribution trends of its maximum, minimum, average, and residual values are relatively consistent, indicating that the target recognition accuracy of acoustic wave transmission time T2 is high. Through the detailed analysis of the acoustic wave transmission times T1 and T2 mentioned above, the application effect of monitoring the concrete pouring interface in actual cast-in-place piles is further explored.
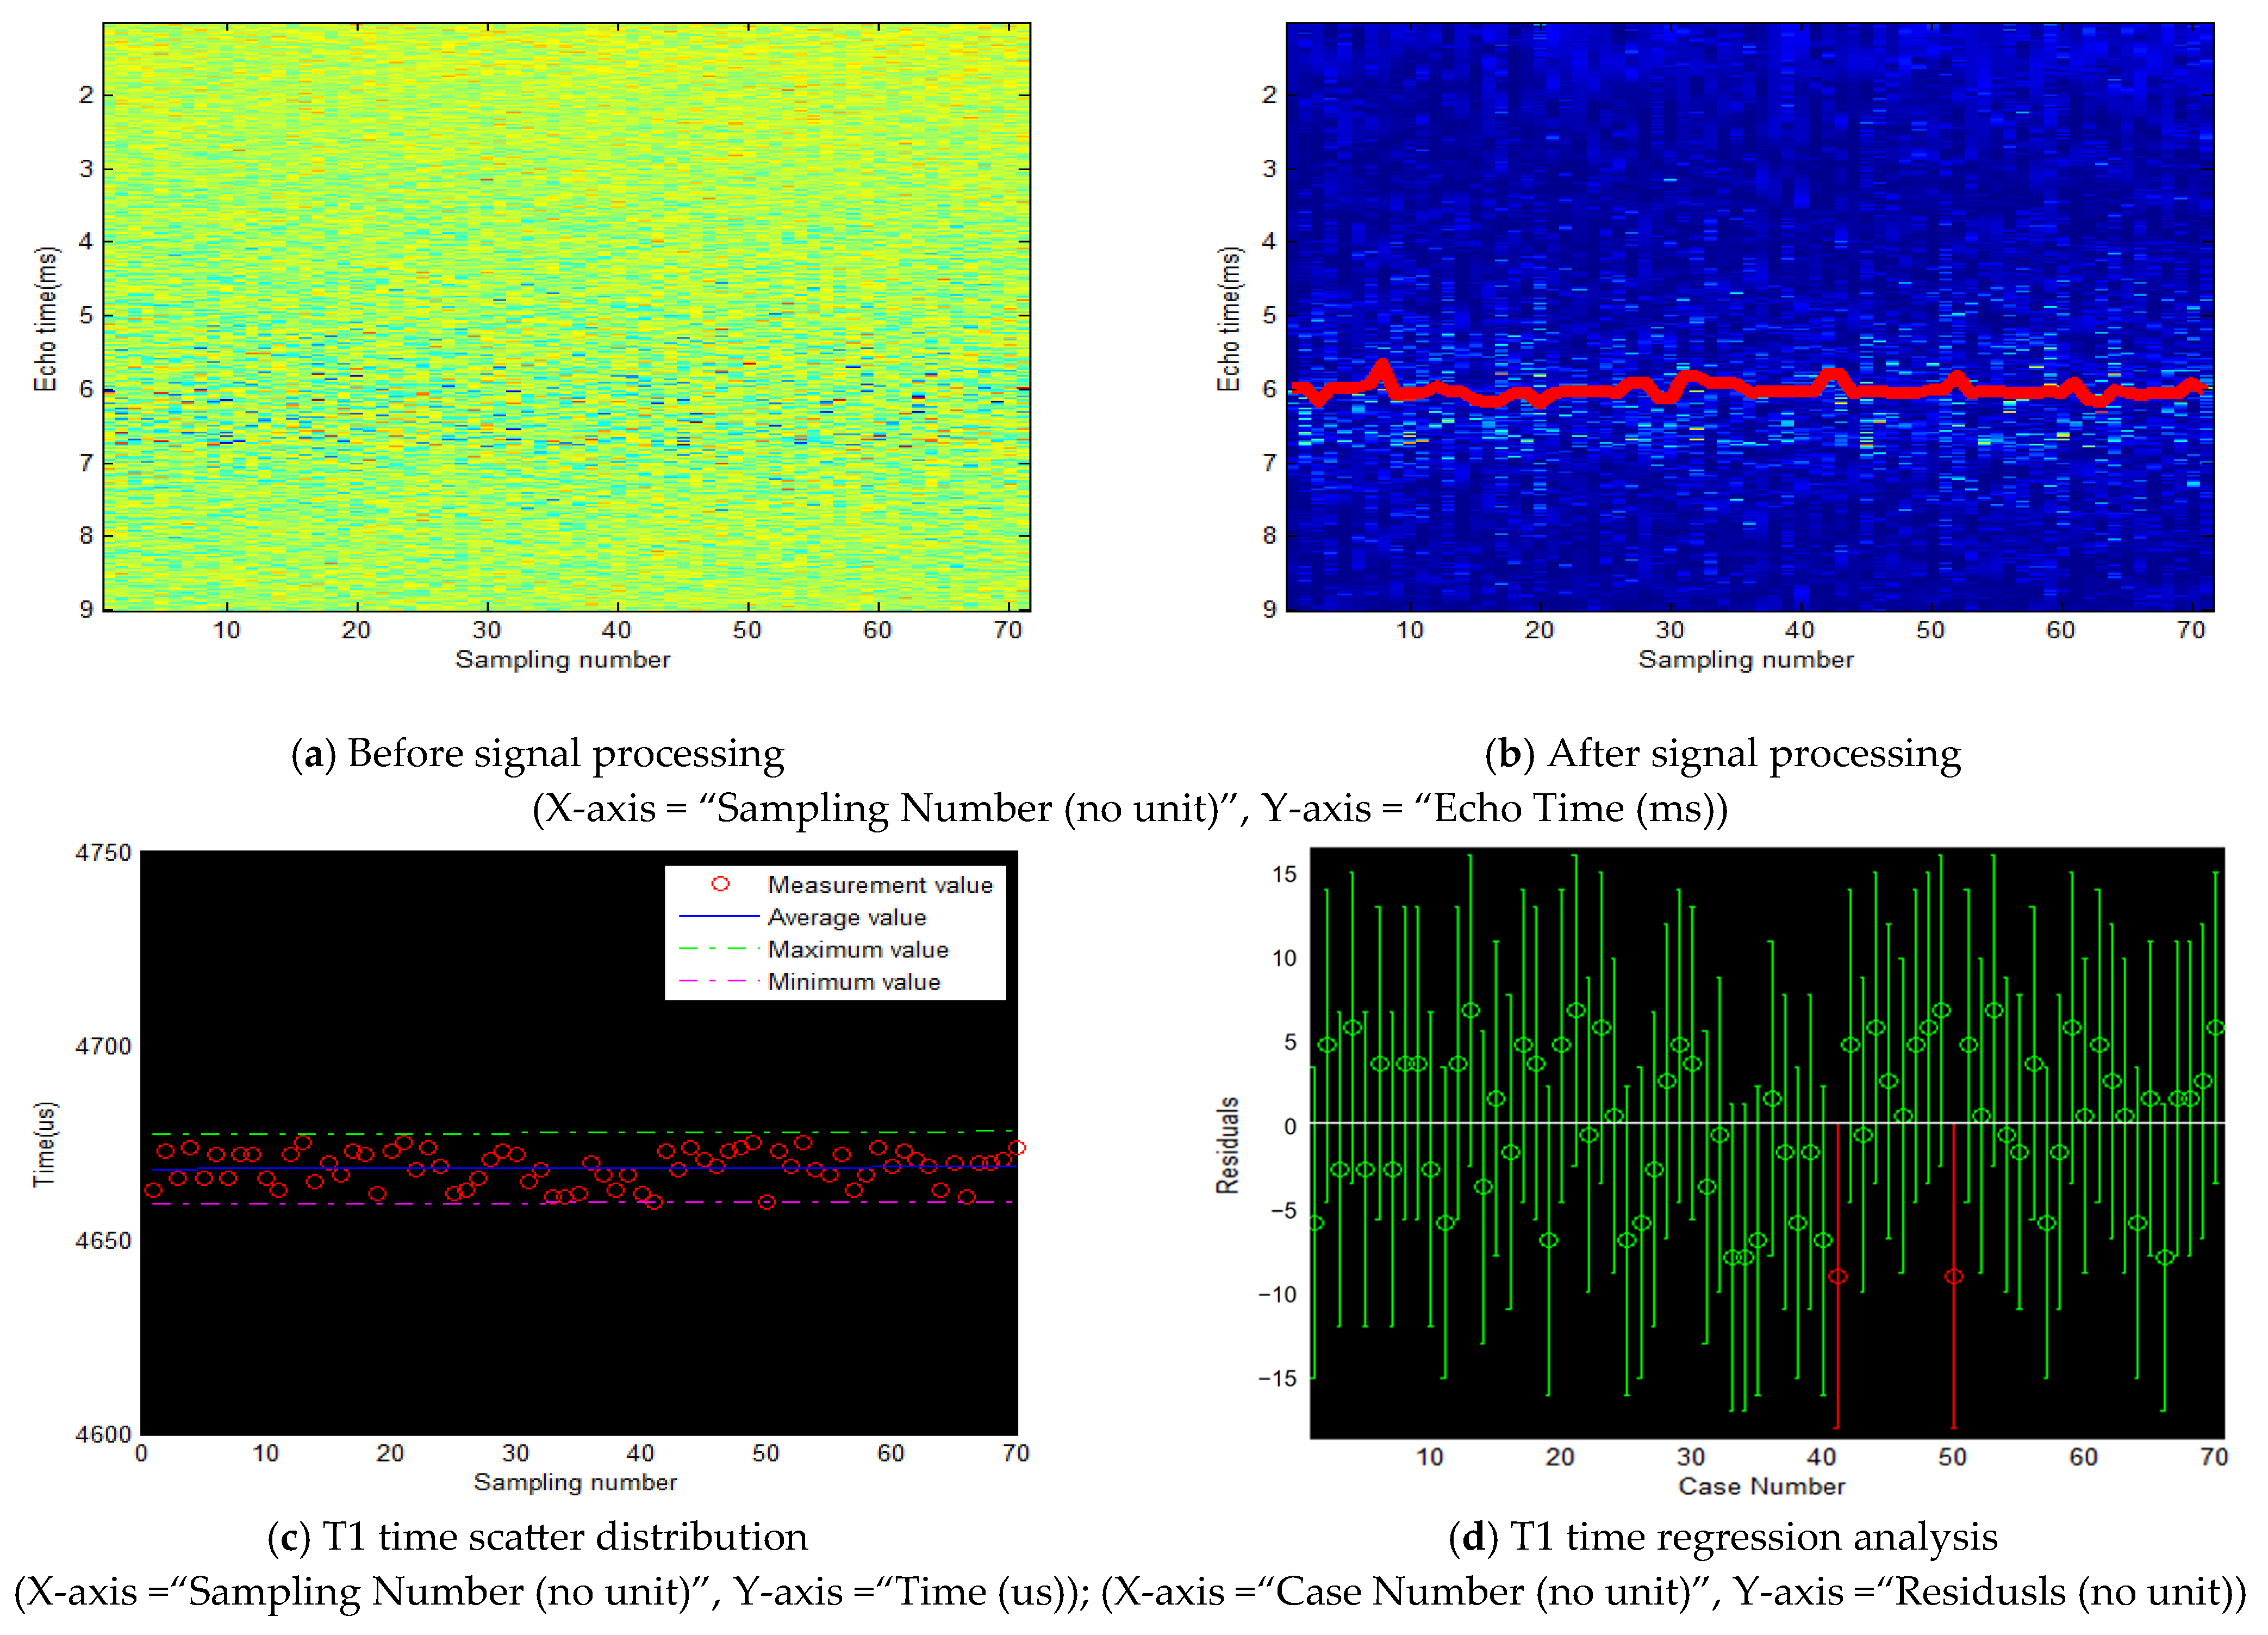
After completing the dynamic analysis, in order to evaluate the repeatability and reliability of the method, the pouring of concrete was stopped at an elevation of −8 m in the borehole, and static acoustic signal data was collected and analyzed. The analysis of the acoustic waves obtained by the interface acoustic wave sensor is shown in Figure 9. Figure 9a shows the raw signal obtained by the interface acoustic wave sensor, and Figure 9b shows the signal curve for processing the raw signal and identifying the first echo. Figure 9a,b show that the acoustic signals obtained by the interface acoustic wave sensor contain a lot of interference signals, and special processing of this information is needed to more accurately obtain its target feature points. The method proposed in this article can effectively identify the target feature points in the area. By continuously monitoring the same location, it is found that the data has good repeatability, indicating that the monitoring results are relatively stable.
Due to the concrete being poured into the borehole at an elevation of −8 m, the T2 time obtained is 0. So in the analysis of time T1, 70 equidistant lines were still selected to collect data for statistical analysis, as shown in Figure 9c,d. Figure 9c and Figure 9d show that time T1 is mainly distributed around 4670 µs and is relatively stable overall, indicating that the method proposed in this paper can effectively identify the signal transmission time corresponding to the target features. This article verifies the correctness and reliability of the method proposed in this article through a comprehensive analysis of dynamic and static factors. In summary, the full pulse acoustic monitoring method can achieve real-time monitoring of the concrete pouring interface of cast-in-place piles, with advantages such as continuous data collection, high accuracy, and strong adaptability. By applying the method described in this article, the elevation information of the pouring interface can be more accurately grasped, providing strong support for the construction quality control of cast-in-place piles.

4. Discussion

4.1. Effectiveness of the Proposed Method

The results of the engineering case confirm that the full pulse acoustic monitoring method addresses the key limitations of traditional techniques, and its technical advantages can be further elaborated from three aspects:
Firstly, multi-frequency excitation solves the problem of signal confusion in single-frequency acoustic methods. Traditional acoustic monitoring uses single-frequency signals, which cannot distinguish reflections from concrete, mud, and air in boreholes—leading to interface misjudgment. In this study, three levels of sound sources (50 kHz, 75 kHz, 100 kHz) were used for multi-frequency excitation: high-frequency signals (100 kHz) are sensitive to small interface changes (e.g., thin mud layers), medium-frequency signals (75 kHz) balance penetration and resolution, and low-frequency signals (50 kHz) reduce attenuation in deep concrete. Combined with wavelet transform, signals of different frequencies were accurately separated, and the similarity coefficient (>0.92) confirmed that target signals were not disturbed by heterogeneous media.
Secondly, the “near-field-far-field” dual-mode design optimizes monitoring accuracy across different depth ranges. The near-field mode (11.5–15.0 m) relies on real-time acoustic velocity data from the interface sensor, resulting in a residual sum of squares (0.0773) much smaller than that of the far-field mode (0.4084)—this is because the sensor directly measures the round-trip time of acoustic waves at the interface (Equation (6)), avoiding cumulative errors from multi-source signal extrapolation. The far-field mode (8.0–11.5 m) uses T1/T2 time differences for calculation, which reduces dependence on the sensor when the interface is far from the sensor and still maintains high precision (residual < 0.5). This dual-mode design fills the gap that traditional methods have large errors in both deep and shallow ranges.
Thirdly, continuous real-time monitoring meets the demand for dynamic pouring quality control. The proposed method collected 70 continuous data points in 10 min, while traditional methods only obtained intermittent data. The continuous fitting curve (residual sum of squares = 0.6192) can accurately capture the dynamic rise process of the pouring interface, enabling timely identification of abnormal phenomena (e.g., interface stagnation caused by insufficient concrete supply). In contrast, discrete data from traditional methods (residual = 8.9587) cannot reflect real-time changes, which may lead to missed detection of transient defects (e.g., instantaneous mud inclusion).

4.2. Limitations of the Method

Despite the verified effectiveness, the proposed method still has limitations in practical engineering applications, which need to be acknowledged and addressed in future research:
The concrete heterogeneity (e.g., uneven aggregate distribution, local porosity differences) can cause fluctuations in acoustic velocity (V1/V2 in Equations (6)–(13)). In the test pile, the concrete was mixed uniformly (slump = 180 ± 10 mm), so V1/V2 remained stable (variation < 3%). However, in engineering with large aggregate sizes (>50 mm) or segregated concrete, local acoustic velocity may deviate by more than 10%—leading to interface elevation calculation errors (up to ±3 cm). This is because the current method assumes uniform acoustic velocity in the monitoring range, and there is no correction mechanism for local heterogeneity.
The accuracy of the monitoring system depends on the installation precision of the multi-level sound sources and the interface sensor. The design requires the spacing between sound sources (L1/L2/L3) to have a tolerance of ±1 mm, but in actual construction, manual installation may lead to deviations of ±3 mm. Taking L2 (3.5 m) as an example, a 3 mm deviation will cause a T2 time error of 10 μs (calculated by V1 = 3500 m/s), and substituting into Equation (8) will result in an interface elevation error of 1.5 cm. In addition, if the sensor is tilted (angle > 5°), the acoustic wave propagation path will be elongated, further increasing measurement errors.
The borehole noise (e.g., mud flow, concrete pouring vibration, electrical interference from construction equipment) can reduce the signal-to-noise ratio (SNR) of received signals. In the test case, the SNR of the received signal was ~30 dB (after wavelet denoising), but in projects with high mud viscosity (>100 s) or strong vibration (e.g., adjacent pile driving), the SNR may decrease to <20 dB. Although cross-correlation analysis (Section 2.3) can suppress partial noise, strong noise may still cause missing or misjudgment of echo feature points—especially for low-frequency signals (50 kHz), which are more easily disturbed by low-frequency vibration.

4.3. Directions for Future Improvement

Aiming at the above limitations, future research can focus on three aspects to optimize the method: (1) Integrate ultrasonic CT technology to scan the internal structure of concrete in real time, establish a local acoustic velocity distribution model, and correct V1/V2 in Equations (6)–(8) to reduce errors caused by aggregate segregation. (2) Develop an automatic calibration system for sensors: Design a self-calibrating sound source module with laser ranging function, which can automatically measure and correct the spacing (L1/L2/L3) and tilt angle of the sensor during installation—reducing manual operation errors. (3) Enhance anti-noise performance using adaptive filtering: Combine wavelet transform with adaptive Kalman filtering to dynamically adjust the filtering threshold according to the real-time SNR of borehole signals, improving the recognition accuracy of echo features in high-noise environments.

5. Conclusions

The method described in this article, through the technical system of “multi-frequency excitation–wavelet analysis processing–segmented scenario calculation”, can achieve dynamic and accurate monitoring of the pouring interface of cast-in-place concreter pile, filling the gap that existing methods cannot balance “non-destructive, real-time, and high-precision”. By building a hardware combination system of Level I, Level II, and Level III sound sources and interface acoustic sensors, it is possible to capture acoustic signals of different depths and media in a differentiated manner. The combination of the orifice full pulse receiver and the ground processor ensures the integrity of signal acquisition and the timeliness of data analysis, providing hardware support for monitoring accuracy. The data processing and feature recognition methods are efficient and reliable. Wavelet analysis can accurately distinguish multi-frequency acoustic signals, and cross-correlation function and signal similarity analysis can accurately identify target features and effectively eliminate interference signals. The division of the “perception-measurement” dual zone and the “near-field-far-field” dual mode further optimizes the accuracy of interface position calculation and meets the needs of different monitoring scenarios. The engineering case verification is sufficient. Compared with traditional methods of intermittent and low-precision data collection, the full pulse acoustic monitoring method can continuously collect a large amount of effective data. The sum of squared residuals of the fitting curve is much lower than that of traditional methods. The static monitoring data has good repeatability, which confirms that this method has significant advantages in data continuity, accuracy, and stability, which can effectively guide the quality control of cast-in-place pile pouring.

Author Contributions

Conceptualization, M.C. and J.W.; methodology, J.W.; writing—original draft preparation, M.C. and J.W.; project administration, J.Z. and H.H.; funding acquisition, J.Z. and H.H. All authors have read and agreed to the published version of the manuscript.

Funding

This research was funded by the Open Foundation of Science and Technology Innovation Center of Hubei Institute of Urban Geological Engineering (No. KCJJ202401), the Key R&D Plan Project in Hubei Province (No. 2023BAB099), and the Hubei Provincial Natural Science Foundation of China (No. 2025AFD459).

Institutional Review Board Statement

Not applicable.

Informed Consent Statement

Not applicable.

Data Availability Statement

All data, models, and code generated or used during the study appear in the submitted article.

Acknowledgments

All the images and data are from our actual tests and are permitted by the owners. We are compliant with ethical standards, and all authors declare that this paper has no conflict of interest. Finally, we are grateful for the many helpful and constructive comments from many anonymous reviewers.

Conflicts of Interest

The authors declare no conflicts of interest.

References

  1. Yang, J.; Xuewen, L.; Sun, X. Extension of tube wave detection for quality evaluation of pile foundation. Geophys. Prospect. 2020, 68, 1476–1491. [Google Scholar] [CrossRef]
  2. Pan, B.; Fan, Z.; Zhu, N. Estimation of pile foundation quality using a hybrid ANFIS model based on metaheuristic optimization algorithm. Build. Mach. 2025, 7, 155–160. [Google Scholar]
  3. Cai, K. Quality inspection of compacted pile foundation for high-speed railway beam yard based on reflection wave method. Eng. Mach. Maint. 2023, 6, 248–250. [Google Scholar]
  4. Zhang, Z. Research on the bearing characteristics of large-diameter and ultra long piles. Civ. Eng. 2023, 12, 1448–1454. [Google Scholar]
  5. Jin, R.; Wu, W.; Chen, L. Study on Dynamic Response of Deep Water Bridge Pier Group Pile Foundation under Wave Current Coupling. Saf. Environ. Eng. 2025, 32, 136–142. [Google Scholar]
  6. Li, Y.; Zhu, D.; Tian, R.; Luo, C.; Huang, W. Research on the Causes and Laws of Corrosion in Concrete Lining of a Highway Tunnel in Guangdong Province. Saf. Environ. Eng. 2024, 31, 38–50. [Google Scholar]
  7. Li, J.; Ge, L.; Zhang, H.; Li, J.; Zhu, H.; Li, G. Research on Hidden Block Stone Detection Technology in Pile Foundation Engineering. Coalf. Geol. Explor. 2019, 47, 187–193. [Google Scholar]
  8. Kang, K.; Meng, Y.; Zheng, J.; Fu, Q.; Xu, G.; Cui, D. Analysis and Prediction of Crack Deformation Monitoring Data of Zhoukoudian Site Based on BP Neural Network. Saf. Environ. Eng. 2024, 31, 169–178. [Google Scholar]
  9. Gao, H.; Xu, Y.; Jiang, W.; Xian, T.; Liu, N.; Zhang, D.; Duan, L. On line monitoring technology for mud characteristic parameters in hydrological well drilling. Saf. Environ. Eng. 2024, 31, 209–218. [Google Scholar]
  10. Wang, J.; Liu, H. Defect detection method of underwater bored cast in place bored pile based on optical image in borehole. J. Civ. Struct. Health Monit. 2023, 14, 189–207. [Google Scholar] [CrossRef]
  11. Wang, J.; Chen, M.; Zhu, N.; Liu, H. A damage zone detection method in concrete hydraulic structures based on multi-frequency ultrasonic characteristics. Sci. Rep. 2025, 15, 11173. [Google Scholar] [CrossRef]
  12. Xie, Z.; Zhang, G.; Wei, X.; Zhang, N.; Wang, X.; Ni, X.; Zhou, Z.; Wang, X. Dynamic Safety Assessment and Early Warning Method and Integration for Underground Space Collapse Rescue Drilling Site. Coalf. Geol. Explor. 2025, 53, 259–270. [Google Scholar]
  13. Moayedi, H.; Hayati, S. Applicability of a CPT-Based Neural Network Solution in Predicting Load-Settlement Responses of Bored Pile. Int. J. Geomech. 2018, 18, 06018009. [Google Scholar] [CrossRef]
  14. Nguyen, V.L.; Nie, L.; Zhang, M. Method Cement Post-Grouting to Increase the Load Capacity for Bored Pile. Res. J. Appl. Sci. Eng. Technol. 2013, 5, 4727–4732. [Google Scholar] [CrossRef]
  15. Peyraube, N.; Villanueva, J.D.; Lastennet, R.; Denis, A.; Lavigne, Q.; Houillon, N.; Naessens, F.; El Oifi, B.; Mateo, S. Assessing the dispersion of hydraulic conductivity values estimated using the Dupuit, Thiem, and Boulton methods on repeated pumping tests in an unconfined aquifer. Hydrogeol. J. 2023, 31, 1863. [Google Scholar] [CrossRef]
  16. Wang, J.; Wang, C.; Han, Z.; Wang, Y.; Huang, J. Borehole quality inspection method of bored piles based on multi-array ultrasonic scanning technology. J. Civ. Struct. Health Monit. 2023, 14, 285–302. [Google Scholar] [CrossRef]
  17. Wang, J.; Han, Z.; Wang, Y.; Liu, H.; Wang, C.; Hu, S. Ultrasonic synthetic aperture imaging and multi frequency scanning detection system in boreholes. East China Geol. 2025, 46, 79–88. [Google Scholar]
  18. Wang, W.; Chen, M.; Dong, P. Research on the Application of A-Type Pulse Reflection Ultrasonic Testing Technology in Steam Turbine Generator Units. Large Mot. Technol. 2021, 5, 43–48. [Google Scholar]
  19. Wang, Y.; Tan, B.; Su, Y.; Zhang, K.; Wang, Z.; Ling, Z. Design of Excitation Circuit for Ultrasonic Array Logging Tool While Drilling. Logging Technol. 2024, 48, 341–347. [Google Scholar]
  20. Guo, M.; Hu, Y.; Yan, Y. Measurement of acoustic wave propagation time in stacked materials based on cross-correlation. J. Electron. Meas. Instrum. 2018, 32, 1–9. [Google Scholar]
  21. Liu, Y.; Enhedeliha, D.; Huang, Y.; Zhang, Y.; Yang, P. Application of Time Shift Cross Hole Seismic Full Waveform Inversion Method in Cement Mixing Pile Detection. Adv. Geophys. 2024, 39, 2078–2089. [Google Scholar]
  22. Zhang, B.; Zhang, Y.; Zhou, J. Three-dimensional high-precision imaging method for karst at the end of large-diameter piles. Appl. Acoust. 2024, 43, 1060–1069. [Google Scholar]
Figure 1. Basic principle of monitoring method.
Applsci 15 11205 g001
Figure 2. The simplified process flow diagram.
Applsci 15 11205 g002
Figure 3. Schematic diagram of target feature area.
Applsci 15 11205 g003
Figure 4. Schematic diagram of pouring interface position measurement model.
Applsci 15 11205 g004
Figure 5. On-site monitoring photo.
Applsci 15 11205 g005
Figure 6. Comparison of on-site interface elevation monitoring results. (X-axis = “Sampling Number (no unit)”, Y-axis = “Interface Elevation (m)”).
Applsci 15 11205 g006
Figure 7. Comparison of results under different measurement modes. (X-axis = “Sampling Number (no unit)”, Y-axis = “Interface Elevation (m)”).
Applsci 15 11205 g007
Figure 8. Comparison and analysis of different acoustic wave transmission times.
Applsci 15 11205 g008
Figure 9. Comparison of interface acoustic wave signal analysis.
Applsci 15 11205 g009
Disclaimer/Publisher’s Note: The statements, opinions and data contained in all publications are solely those of the individual author(s) and contributor(s) and not of MDPI and/or the editor(s). MDPI and/or the editor(s) disclaim responsibility for any injury to people or property resulting from any ideas, methods, instructions or products referred to in the content.