Article

Condition-Based Maintenance Plus (CBM+) for Single-Board Computers: Accelerated Testing and Precursor Signal Identification

1
Division of Mechanical Systems Engineering, Myongji University, Yongin 17058, Republic of Korea
2
Intergrated Product Support (IPS) Team, Hanwha Systems, Gumi 39370, Republic of Korea
*
Author to whom correspondence should be addressed.
Appl. Sci. 2025, 15(20), 11203; https://doi.org/10.3390/app152011203
Submission received: 20 September 2025 / Revised: 10 October 2025 / Accepted: 15 October 2025 / Published: 19 October 2025

Abstract

Condition-Based Maintenance Plus (CBM+) has been widely adopted in aerospace and mechanical systems, but its application to single-board computers (SBCs) remains difficult due to scarce failure data and subtle degradation signatures. This study investigates CBM+ for the MVME6100 SBC using accelerated life testing (ALT) to generate degradation trajectories and capture precursor signals. Temperature–humidity cycling and vibration tests were performed, while CPU temperature, memory temperature, and output voltage were continuously monitored. Under stable operation, signals followed ambient variations and showed little statistical drift, making degradation visually indistinguishable. However, precursors emerged before failure: CPU temperature exhibited abnormal behavior during thermal cycling, while vibration stress induced communication noise and irregular thermal behavior. These findings indicate that thermal responses provide reliable precursors for electronic degradation. To evaluate data-driven detection, two neural approaches were applied: an Autoencoder (AE) trained only on normal data and a Long Short-Term Memory (LSTM) network trained on both normal and faulty datasets. The Autoencoder reliably detected anomalies via reconstruction error, while the LSTM accurately classified health states and reproduced lifecycle progression. Together, the results demonstrate that precursor-informed CBM+ is feasible for SBCs and that a hybrid AE–LSTM framework enhances prognostics and health management in mission-critical electronics.

1. Introduction

Maintenance strategies have long been classified into corrective, preventive, and condition-based maintenance (CBM) according to ISO 13372 [1]. Among these, CBM provides clear advantages by linking maintenance decisions directly to the observed condition of equipment, thereby improving system availability and reducing costs [2]. Building upon CBM, Condition-Based Maintenance Plus (CBM+) extends the framework by incorporating reliability-centered maintenance methods [3], advanced prognostics, and decision support capabilities [4]. CBM+ has been recognized as a crucial methodology for enhancing operational readiness in complex engineering systems [5].
Over the past decades, CBM+ has been successfully applied in diverse domains. For instance, aerospace and defense platforms employ CBM+ to monitor avionics and propulsion subsystems, enabling accurate prediction of remaining useful life (RUL) [6,7]. In industrial sectors, offshore plants [8,9] and automotive applications [10,11] have reported reductions in unplanned downtime and maintenance costs through the use of integrated CBM platforms. These successes demonstrate the value of CBM+ in shifting from time-based or reactive maintenance toward predictive and proactive paradigms [12,13].
Nevertheless, extending CBM+ to electronic components remains a significant challenge. Unlike mechanical equipment, where degradation often manifests through measurable vibration or structural fatigue, electronic systems exhibit subtle, nonlinear, and sometimes abrupt degradation behaviors [14]. Identifying reliable precursor signals is complicated by their dependence on temperature variations, bit error rates, processor clock delays, and solder resistance changes [15,16]. Such measurements often require expensive instrumentation or intrusive monitoring, limiting their practical deployment. Moreover, prior research has largely concentrated on individual component-level studies, such as solder joint fatigue [17,18] or processor-level degradation [19], while system-level applications remain scarce.
A further challenge in CBM+ implementation lies in the scarcity of failure data. While real-world failure data provide the most reliable basis for training prognostic models, in practice such data are limited because failures are rare events. To overcome this, accelerated life testing (ALT) is often employed to generate degradation trajectories and capture precursor signals under controlled stress conditions [20,21]. In addition, when failure data are insufficient, machine learning approaches such as one-class neural networks —including Autoencoders—are frequently used to detect anomalies by learning only from normal operation data [22,23].
In this study, accelerated testing was conducted on MVME6100 single-board computers to obtain precursor signals. To address the complementary advantages of different neural architectures, a hybrid framework combining Autoencoder (AE) and Long Short-Term Memory (LSTM) networks was applied. The Autoencoder, trained solely on normal data, provided robust anomaly detection in data-scarce scenarios [22,23], while the LSTM, trained with both normal and fault data, enabled classification of fault states and modeling of degradation trajectories [24]. By integrating outputs from both models, a comprehensive judgment was achieved, leveraging the Autoencodr’s sensitivity to anomalies and the LSTM’s predictive capability for degradation progression.
Single-board computers (SBCs) represent a particularly critical case. SBCs are widely deployed in defense, aerospace, and industrial control systems, where they serve as core computing units [25,26]. The MVME6100, for example, is a high-reliability SBC frequently adopted in mission-critical defense platforms due to its stability and performance. However, its compact architecture, sensitivity to thermal stresses, and reliance on continuous uptime make it both essential and vulnerable to degradation. The difficulty of capturing reliable precursor signals at the SBC system level underscores the need for tailored CBM+ methodologies.
This study aims to address these challenges by applying CBM+ to the MVME6100 SBC. Specifically, accelerated environmental testing and accelerated vibration testing are conducted to capture degradation data. These data are then analyzed using artificial neural networks, with a focus on comparing Autoencoder and LSTM-based anomaly detection methods. By concentrating on the MVME6100 as a representative high-reliability SBC, this research contributes to expanding CBM+ applicability into electronic systems, providing both methodological insights and practical strategies.
The key contributions of this study are outlined below. First, we design and execute accelerated life testing (ALT) on MVME6100 single-board computers to elicit precursor signals measurable with practical, non-intrusive sensors. Second, we identify and analyze a reproducible pre-failure signature—CPU–memory temperature divergence after ambient compensation—which serves as a reliable early indicator of degradation. Third, we quantitatively compare the performance of Autoencoder and Long Short-Term Memory (LSTM) networks under both short and long temporal horizons and propose a hybrid CBM+ framework that leverages their complementary strengths for enhanced anomaly detection and lifecycle prediction.
The remainder of this paper is organized as follows. Section 2 describes the experimental setup, data acquisition procedures, labeling criteria, and neural network modeling approaches. Section 3 presents the DAQ signal analyses and model performance results. Section 4.1 discusses the key findings, limitations, and implications for deploying CBM+ in mission-critical electronics. Finally, Section 4.2 concludes this paper and outlines future research directions for improving statistical robustness and generalization across diverse SBC platforms.

2. Materials and Methods

2.1. Data Acquisition Strategy and Research Overview

To apply CBM+ to SBCs, both state-dependent data and degradation data over the full lifecycle are required. However, in real operational environments, collecting such data demands long-term monitoring, which is impractical given the rarity of failures. In particular, high-reliability SBCs such as the MVME6100 seldom fail under normal usage, making it difficult to obtain precursor signals. To address this limitation, accelerated life testing (ALT) was used to induce degradation and capture data in a manageable time frame [20,21].
In selecting stressors, we prioritized mechanisms that accelerate degradation with observable precursors rather than induce purely random failures and can be applied while the SBC remains powered for continuous monitoring. Consequently, temperature–humidity and vibration were chosen as representative stresses within our time and budget constraints.
In the temperature–humidity chamber tests (Figure 1a), the MVME6100 board was inserted into its backplane, and the backplane was connected to a power supply. To prevent CPU overheating and shutdown during operation, a 120 mm cooling fan was directed at the CPU heatsink to enforce forced convection. Power input lines, communication cables, and sensor wiring were routed through small feedthrough holes in the chamber wall to external sockets, the DAQ system, and a control PC. Thermocouples were mounted on the CPU heatsink and memory chips to monitor local thermal responses, while OS-level log data were collected via communication links. Two K-type thermocouples were used. The auxiliary fan is not part of the standard SBC equipment but was added to avoid safety shutdowns while preserving ALT.
In the vibration tests (Figure 1b), a custom jig was fabricated to mount the backplane securely onto the shaker platform, after which the MVME6100 board was socketed into the backplane. Because the board is socket-mounted, micro-motions could occur at the connector, but the board remained seated throughout the year-long tests. Thermocouples were firmly attached to the CPU heatsink and memory chips using adhesive cement to prevent detachment under vibration. To reduce shaker load, the power supply was placed on the ground and connected to the backplane via extended wiring. Communication cables were mechanically secured to avoid accidental disconnection during excitation. In total, six MVME6100 boards were used (four for temperature–humidity ALT and two for vibration ALT).

2.2. Temperature–Humidity Accelerated Testing Conditions

Temperature–humidity cycling tests were conducted to simulate long-term exposure to harsh environmental stressors. An environmental chamber imposed temperature cycles between −20 °C and 65 °C, while relative humidity was maintained up to 60% RH.
  • Temperature range: Temperature ranged from −20 °C to 65 °C, with a cycle duration of approximately 5 h.
  • Humidity: This was maintained up to 60% RH.
  • Procedure: Samples were alternately exposed to high-temperature/high-humidity and low-temperature conditions in repeated cycles. Over the longest run (∼16 months), this corresponds to ∼1900 chamber cycles.
Although military and industrial standards such as MIL-STD-810 and IEC 60068-2-30 often prescribe more severe conditions (e.g., up to 150 °C and 95% RH) for component-level qualification [27,28], such extreme stresses were not directly applicable in this study. This is because the single-board computer (SBC) had to remain powered on during the test in order to continuously acquire and log measurement signals. Excessively high temperatures could induce semiconductor malfunction or premature shutdown, while extreme humidity would risk condensation and short-circuiting. Therefore, the chamber temperature was limited to 65 °C and humidity to 60% RH, ensuring that the SBC operated continuously while still experiencing accelerated degradation stresses.
Even under these moderated conditions, extended testing led to observable degradation. In particular, prolonged humidity exposure produced visible condensation droplets and corrosion marks on the test boards, confirming that the applied stresses were sufficient to accelerate moisture-related degradation mechanisms.

2.3. Vibration Accelerated Testing Conditions

Complementary vibration tests were performed to replicate mechanical stresses. Modifying MIL-STD-810 Method 514 [29], the conditions were as follows:
  • Frequency range: The range was 5–20 Hz.
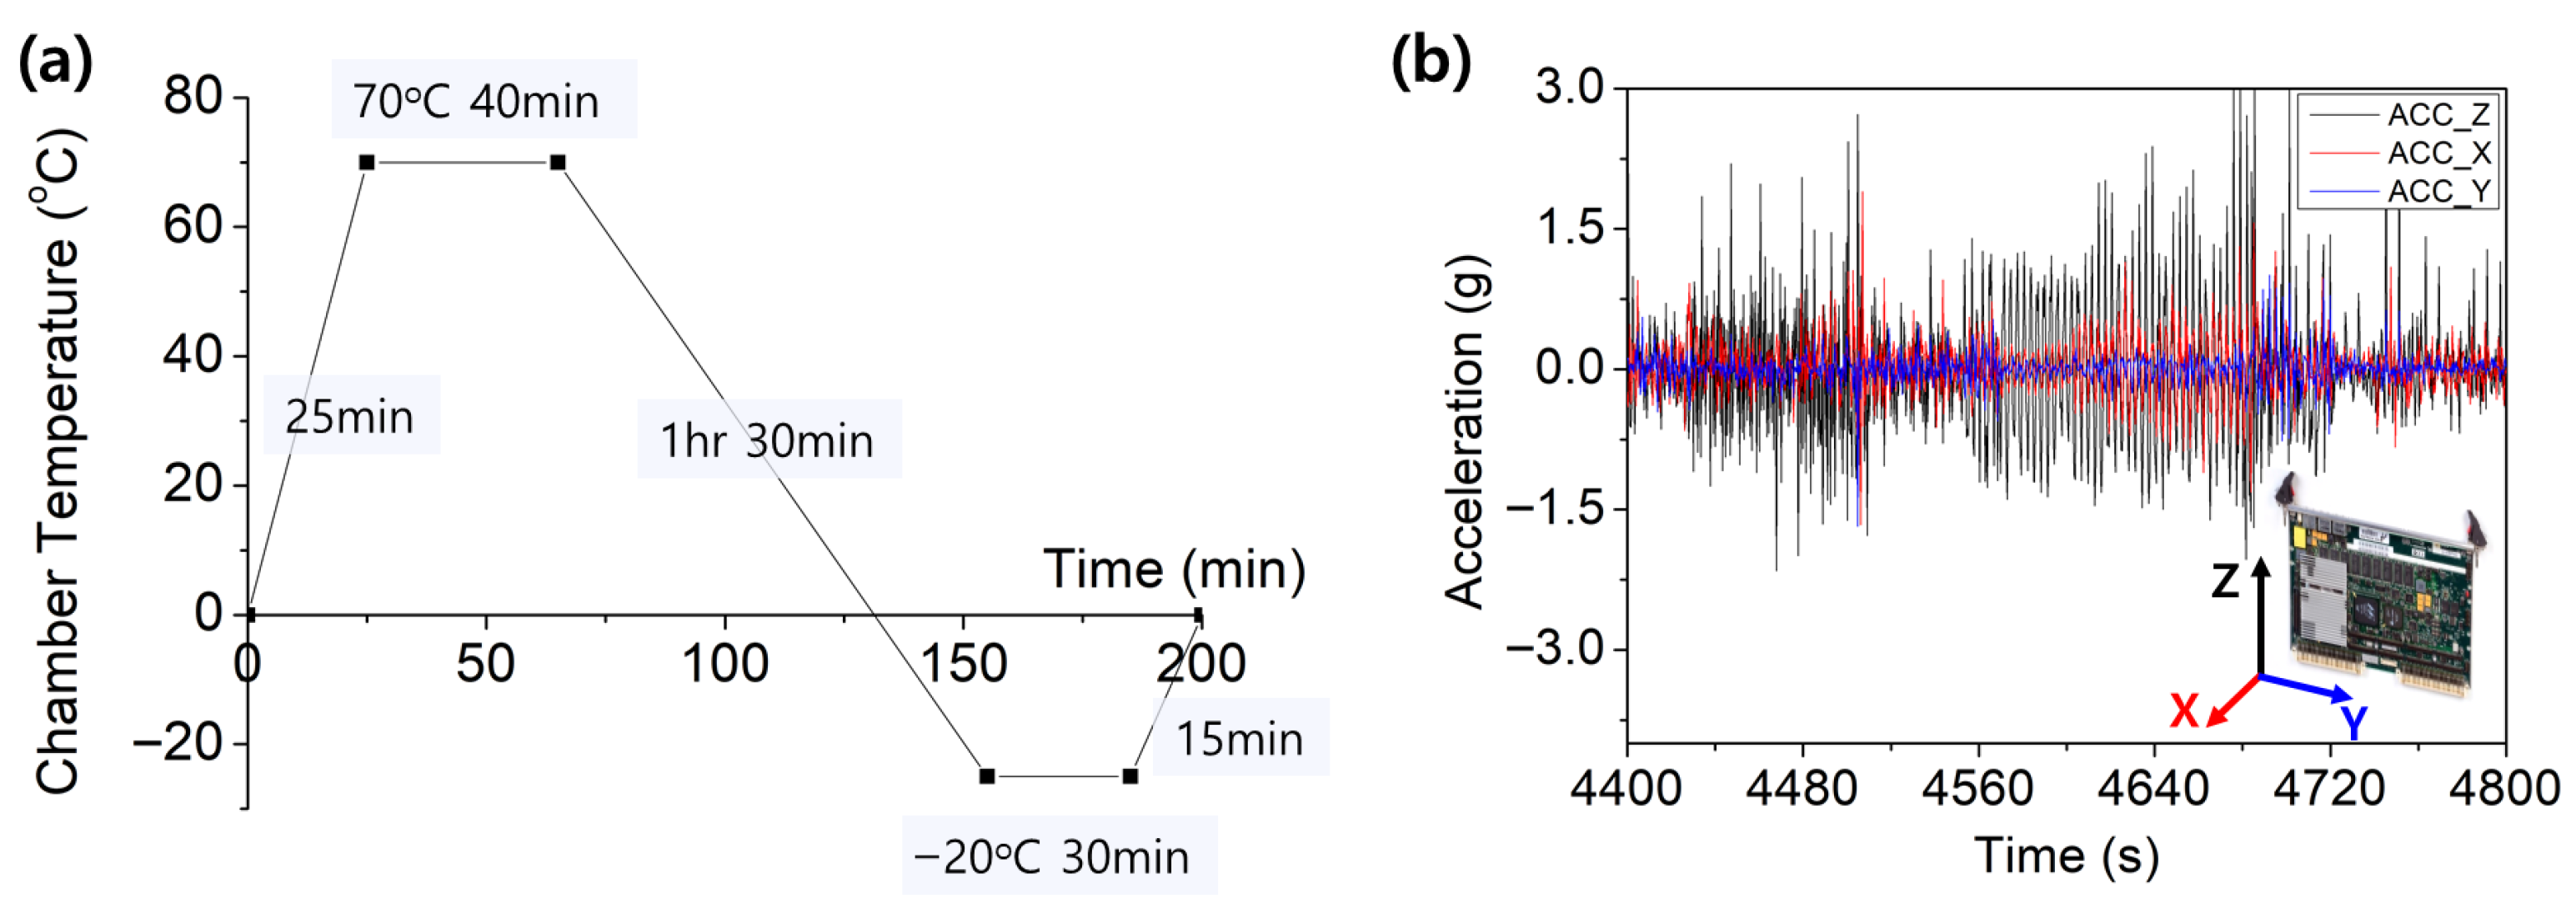
  • Acceleration: A 0.707 g average RMS sinusoidal vibration was applied sequentially to the Z axis with controlled amplitude, without synthesizing frequency components. The actual acceleration measured on the SBC using an external accelerometer is shown in Figure 2b.
  • Duration: The test continued until failure occurred.
In general, MIL-STD vibration tests prescribe complex profiles with multiple frequency bands and acceleration levels to evaluate structural endurance across a wide spectrum of vibration modes. The primary goal of such tests is to quantify durability and service life under representative environments. In contrast, the objective of this study was to accelerate failure rather than fully characterize vibration endurance. Accordingly, low-frequency ranges below 1 Hz were excluded, and the upper frequency bound was limited to 20 Hz due to the rated capability of the available shaker (Tira S 51110-AC, 100 N peak force). Beyond 20 Hz, sufficient acceleration amplitudes could not be achieved, so the effective range of 5–20 Hz was selected to maximize stress within equipment limits.
The MVME6100 board was installed on its backplane, and both were mounted to a custom jig fixed on the shaker platform. Because the SBC is socket-mounted onto the backplane rather than rigidly fastened, micro-motions and looseness were present at the connector interface. Although the shaker excited motion primarily in the Z direction, measurable responses also appeared in the X and Y directions, as shown in Figure 2. These secondary responses reflect the inherent compliance of the socket and mounting assembly. Despite these small oscillatory motions, the board never dislodged from the socket during the ∼1-year test, and all cabling remained secured to guarantee uninterrupted measurement.
Power was supplied through wired connections to the backplane. Thermocouples were firmly attached using adhesive cement to withstand vibration without detachment, and communication cables were mechanically secured to prevent loosening. This ensured that measurement continuity was maintained throughout the test, even under progressive vibration stress.
These conditions were designed to accelerate failure modes including solder fatigue, connector loosening, and microfractures in electronic assemblies. The resulting electrical instabilities, such as communication faults, were monitored during testing.

2.4. Experimental Setup and Data Acquisition

The MVME6100 SBC was mounted inside the environmental chamber and vibration apparatus, with multiple sensors installed for comprehensive monitoring (Figure 1c):
  • Thermocouples: Attached to the CPU heatsink and the memory chips to measure localized temperature rise.
  • Electrical monitoring: Output voltage measured using precision DAQ channels.
  • Performance monitoring: CPU usage and memory usage measured by bash code on Linux.
Figure 1 illustrates the overall experimental setup and data acquisition scheme. A DAQ system (Keithley DAQ6510 with 7700 multiplexer, Keithley Instruments, Cleveland, OH, USA) recorded all parameters at 1 s intervals, synchronized across channels to ensure temporal alignment. Data were transmitted to a central computer for storage and preprocessing.

2.5. Data Labeling Criteria

For model training and evaluation, the acquired signals were categorized into three classes:
  • Normal: Periods during which the SBC operated without any observable malfunction. In this state, power remained stable, communication signals were consistently received, and CPU/memory temperatures followed ambient chamber variations without irregularities.
  • Abnormal (Precursor): Intervals preceding failure where noticeable deviations appeared in the signals, such as divergence between CPU and memory temperature trends, increasing communication noise, or irregular fluctuations. These periods were identified as precursor states that reflect incipient degradation. Ambient compensation used T CPU ( t ) = T CPU ( t ) T amb ( t ) and T MEM ( t ) = T MEM ( t ) T amb ( t ) at identical timestamps t; divergence was evaluated on { T CPU , T MEM } .
  • Failure: Defined as the point at which the SBC ceased to function normally, including cases where the board could not be powered on or when system-level communication stopped due to kernel panic, shutdown, or other fatal errors.
This labeling strategy enabled the neural networks to distinguish between stable operation, precursor anomalies, and final failure states, thereby reflecting realistic CBM+ diagnostic scenarios.

2.6. Artificial Neural Network Modeling Approaches

2.6.1. Challenges with Limited Failure Data

One of the central difficulties in applying CBM+ is the scarcity of labeled failure data. To overcome this limitation, several approaches have been proposed in the literature, including the following:
  • Data augmentation techniques, which synthetically expand available datasets by injecting noise, scaling, or simulating degradation trends [30].
  • One-class neural networks, which learn only from normal operation data and detect deviations as anomalies. These include Autoencoders, which reconstruct inputs from a compressed representation, with reconstruction error serving as an anomaly score [31,32].
One-class neural networks have the advantage of requiring only normal data for training. However, they also present limitations: fault data may sometimes be reconstructed without significant error, and fault samples are only used during testing rather than directly influencing the training process. To address these limitations, this study adopted a hybrid approach by constructing an Autoencoder in parallel with an LSTM model. While the Autoencoder was trained exclusively on normal data to detect deviations as anomalies, the LSTM was trained using both normal and fault data, enabling it to directly classify fault states and improve judgment on degradation progression.

2.6.2. Autoencoder Approach

The Autoencoder model was trained solely on normal operating data, enabling it to capture the intrinsic patterns of healthy system behavior. When exposed to anomalous or faulty states, the model is expected to fail in accurately reconstructing signals, resulting in a high reconstruction error. This makes Autoencoders particularly suitable in scenarios where failure data are scarce. However, a clear distinction between normal and faulty signals is essential for reliable detection [22,23].
In this study, each dataset was initially aggregated over a 1 min interval, and 60 consecutive samples were combined to construct time-series inputs.
To further investigate the effect of input window length, an alternative configuration was also tested: 30 min intervals were used, and 48 consecutive samples were combined to represent an entire day of operation.
For both cases, an LSTM-based Autoencoder architecture was adopted, with results compared to evaluate the sensitivity of anomaly detection to different temporal aggregation strategies.
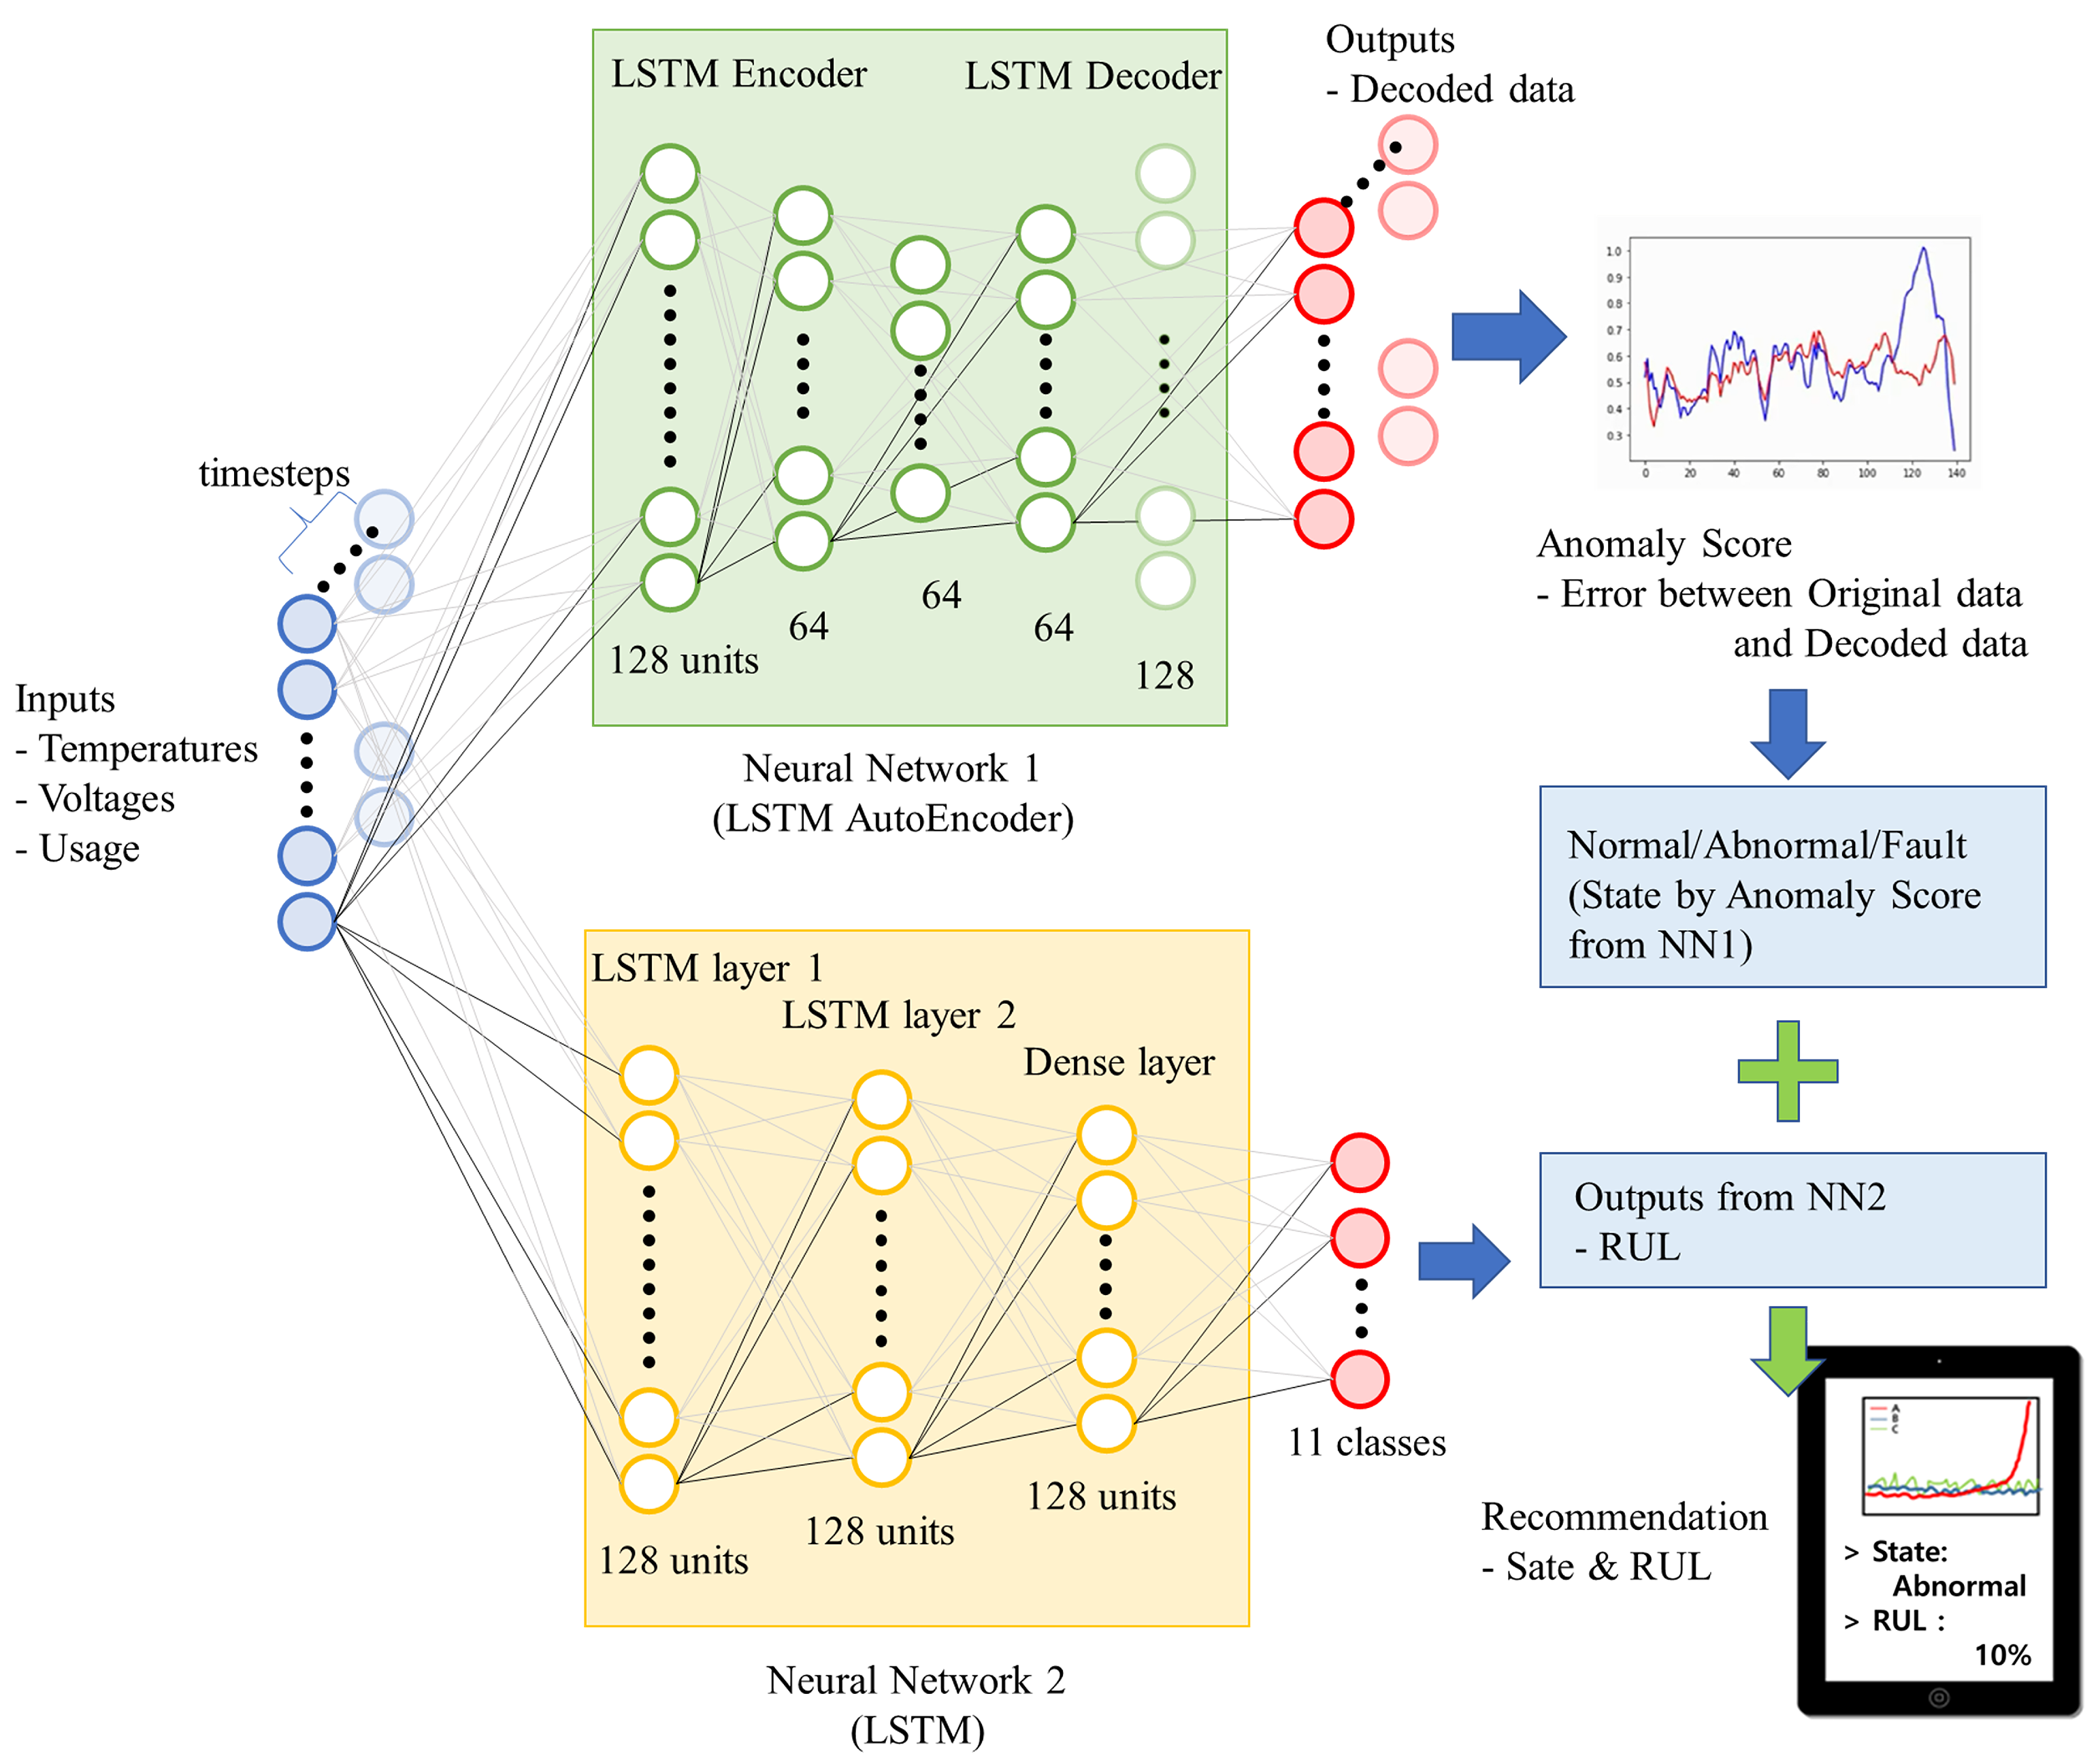
The architecture of the LSTM–Autoencoder is illustrated in the upper part of Figure 3. The encoder consisted of two stacked LSTM layers with 128 and 64 units, respectively, followed by a fully connected dense layer of size 64 as the bottleneck representation. The decoder mirrored this structure with two LSTM layers of 64 and 128 units. Finally, a TimeDistributed dense layer was applied to ensure the reconstructed output matched the dimensionality of the input sequence. All dense layers used a linear activation function, while the LSTM layers used tanh activations to accelerate training. To prevent overfitting, a 10% dropout layer was inserted between layers. The network was trained using the Adam optimizer, with mean squared error (MSE) as the loss function to measure reconstruction fidelity.
An anomaly score was calculated as the reconstruction error between the input sequence and the output of the decoder. The anomaly threshold was selected by inspecting the empirical distributions of reconstruction errors on (i) segments containing confirmed failures and (ii) segments labeled as incipient anomalies; because the threshold shifts with training epochs, we report the selection protocol rather than a fixed value. Signals with reconstruction errors above this threshold were classified as anomalous or faulty, whereas those below the threshold were considered normal.

2.6.3. LSTM Approach

The Long Short-Term Memory (LSTM) model was employed as a sequence-based neural network to capture temporal dependencies among electrical, thermal, and performance parameters. Unlike the Autoencoder, the LSTM was trained using both normal and faulty datasets obtained through accelerated testing. This allowed the model to learn degradation trajectories and predict fault onset with higher accuracy when exposed to known fault types. Nevertheless, a limitation of the LSTM approach is its uncertain generalization ability when encountering unseen or novel failure modes.
The architecture of the LSTM is illustrated in the lower part of Figure 3. In terms of input configuration, the LSTM used sequences aggregated over a 1 min interval, with 60 consecutive samples forming each input window. The architecture consisted of two stacked LSTM layers, each with 128 units and tanh activation functions to capture nonlinear temporal relationships. The encoded features were then passed through a dense layer with 128 units and a ReLU activation, followed by a final dense layer with 11 units using a softmax activation to perform multi-class classification. The 11 output classes represented the 10 lifecycle intervals (0–10%, 10–20%, …, 90–100%) and a failure class.
The model was trained using the Adam optimizer, with sparse categorical cross-entropy as the loss function, which is well-suited for multi-class softmax classification. This configuration enabled the LSTM not only to identify the current system health state but also to provide continuous estimates of degradation progression with respect to the operational lifecycle.

2.6.4. Complementary Framework

By employing both Autoencoder and LSTM approaches, this study emphasizes their complementary roles in extending CBM+ to SBC applications:
  • Autoencoder: Provides reliable anomaly detection when only normal operation data are available, making it suitable for data-scarce conditions.
  • LSTM: Captures temporal dependencies and directly models degradation trajectories when both normal and fault data are accessible.
Rather than serving as alternatives, the two models complement each other. The Autoencoder contributes sensitivity to anomalies under limited data availability, while the LSTM enhances interpretability and predictive accuracy in the presence of fault labels. Integrating the outputs from both models enables a more comprehensive and robust diagnostic framework, leveraging the strengths of each approach to improve prognostics and health management (PHM) for SBCs.

3. Results

3.1. DAQ Signal Analysis

3.1.1. Overall Experimental Progress

A total of four temperature–humidity accelerated tests and two vibration tests were conducted. Among these, the following occurred.
  • One temperature–humidity sample failed after 181 days.
  • One vibration sample failed after 134 days.
  • The remaining four samples are still under test:
    Three temperature–humidity samples have been running for up to 16 months.
    One vibration sample has been running for 5 months.

3.1.2. Normal-State Behavior

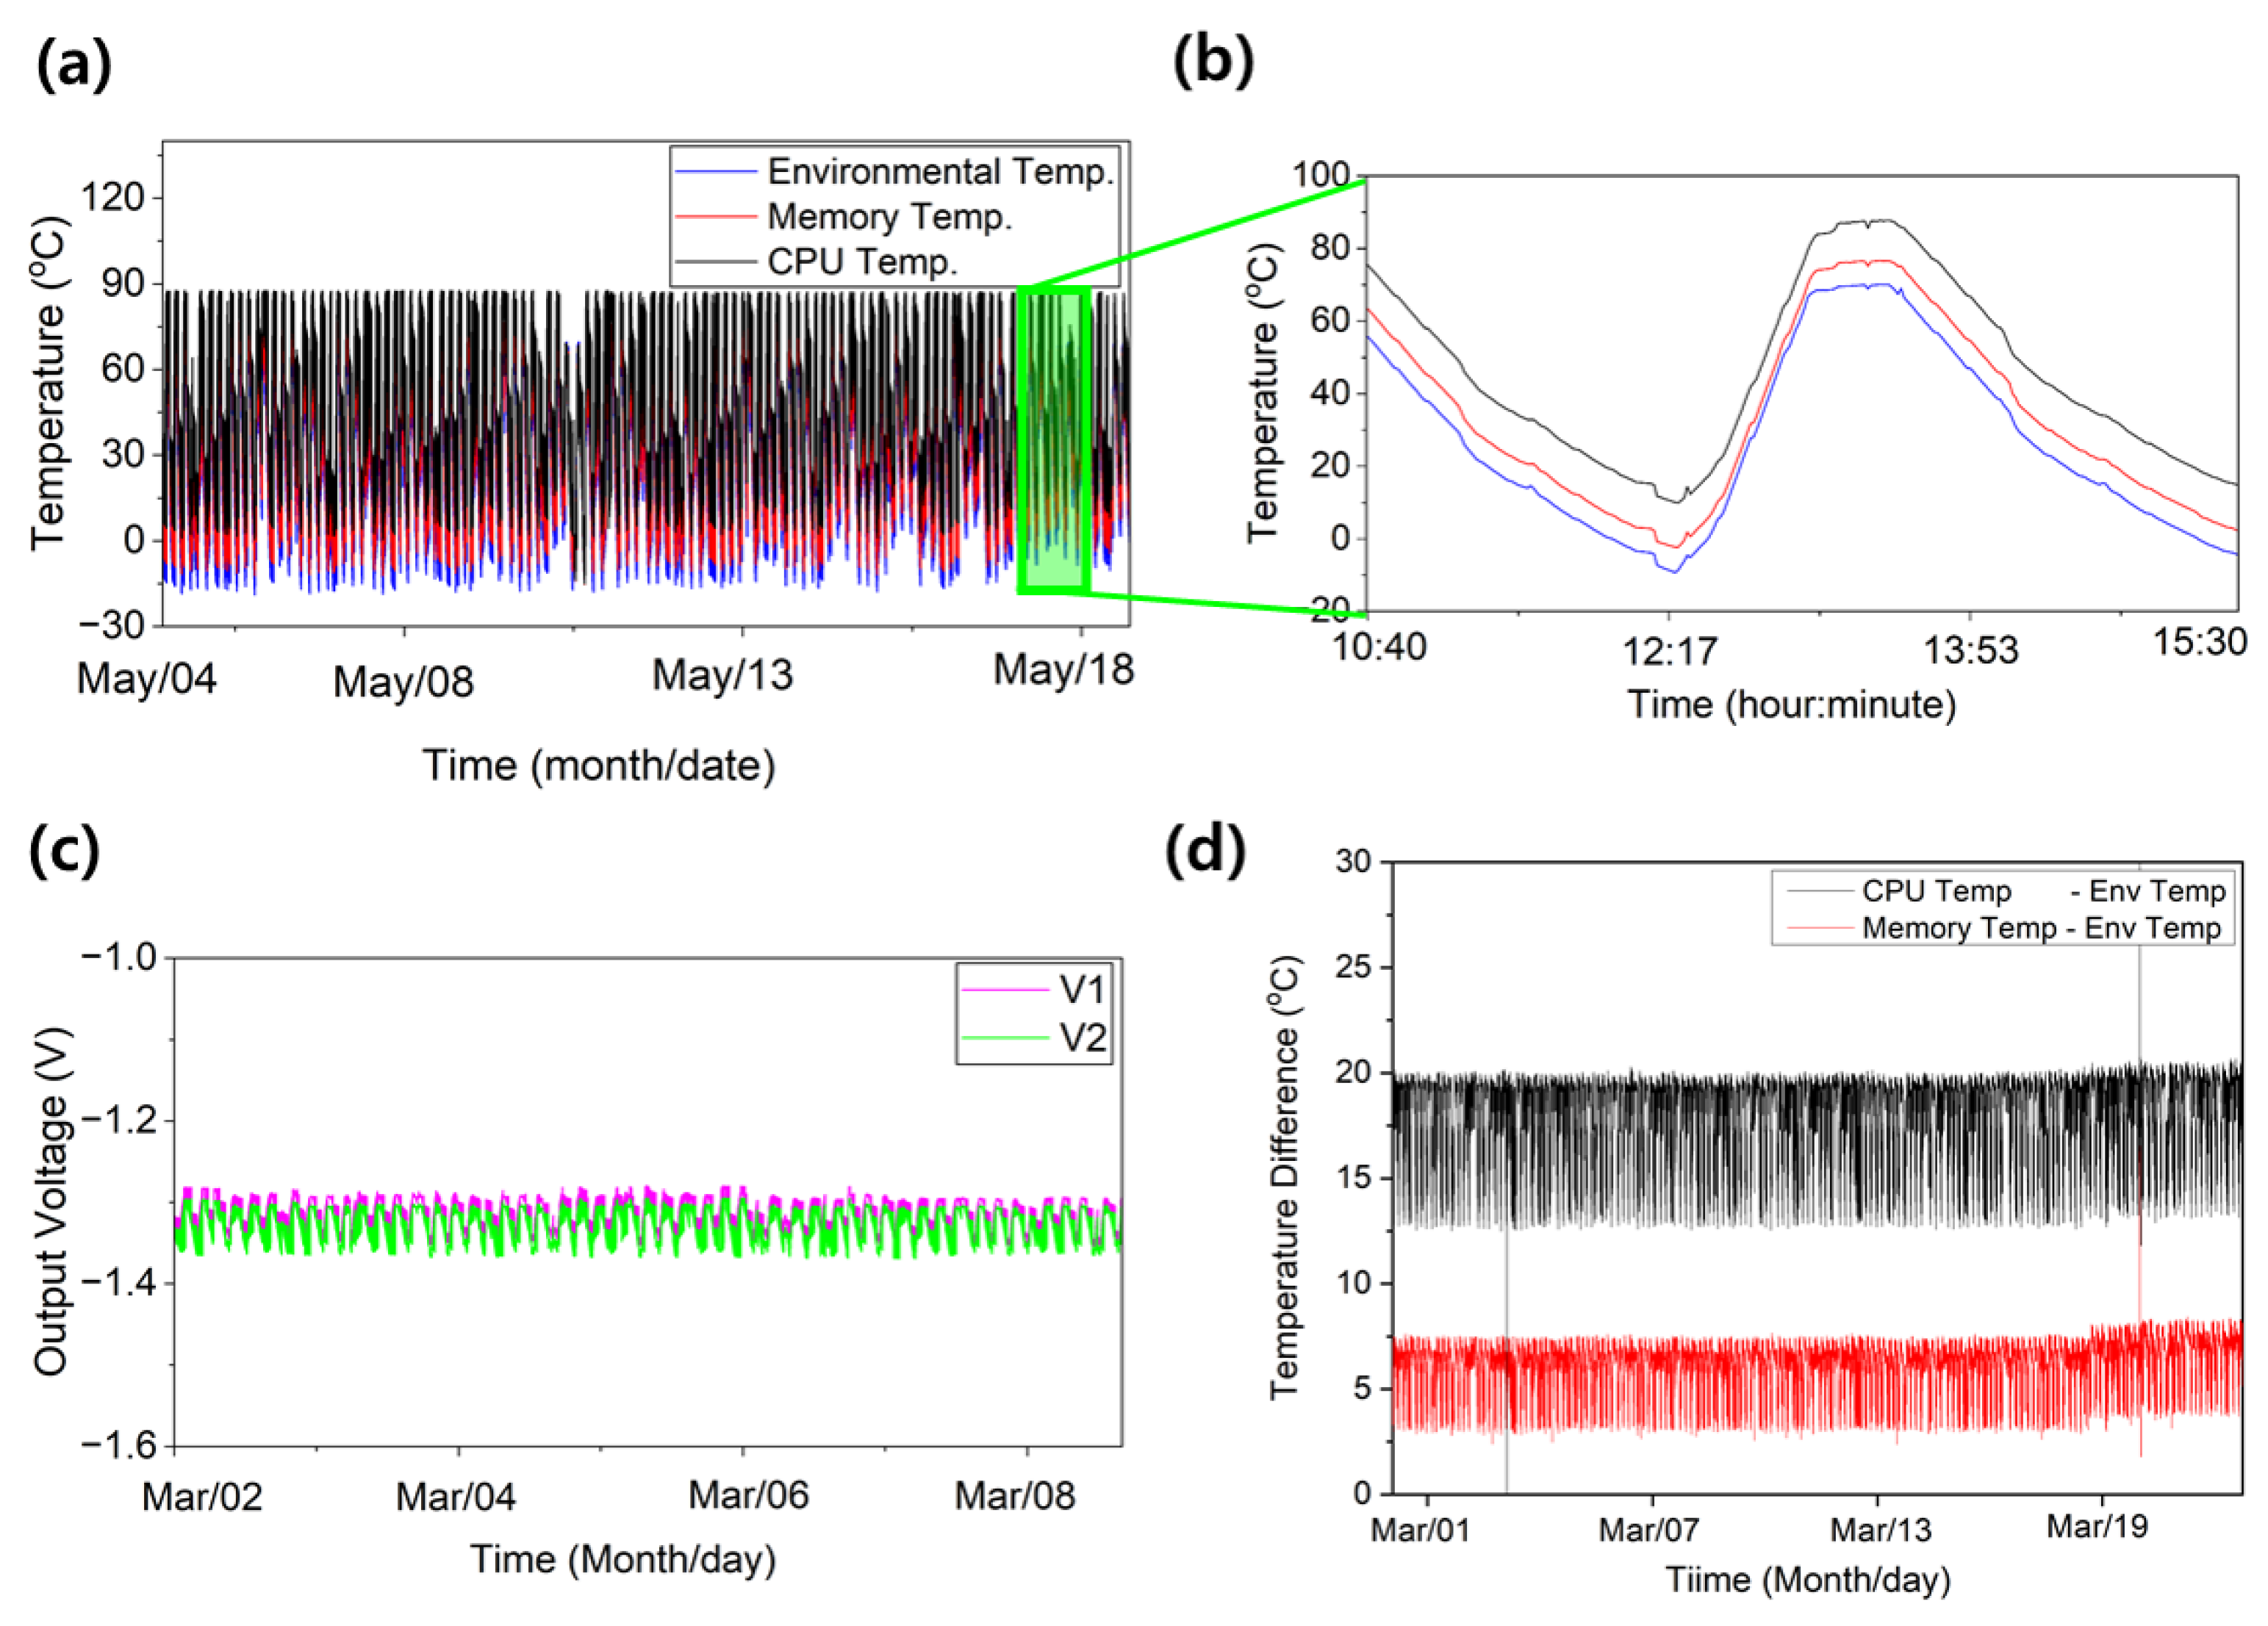
In the normal operating condition, the measured DAQ signals demonstrated stable behavior over extended periods (Figure 4a,b). Both CPU and memory temperatures exhibited a characteristic pattern: After power-on, their temperatures rose due to system operation and eventually reached a saturation level. Beyond this point, their variations followed the trend of ambient or chamber temperature, either increasing or decreasing in correlation with the external environment.
Similarly, the supply voltage showed minor fluctuations that also corresponded to chamber temperature changes (Figure 4c).
In addition, Figure 4d shows the CPU and memory temperatures after subtracting the ambient temperature. Even after compensating for the external influence, both CPU and memory temperatures exhibited highly correlated rising and falling trends.
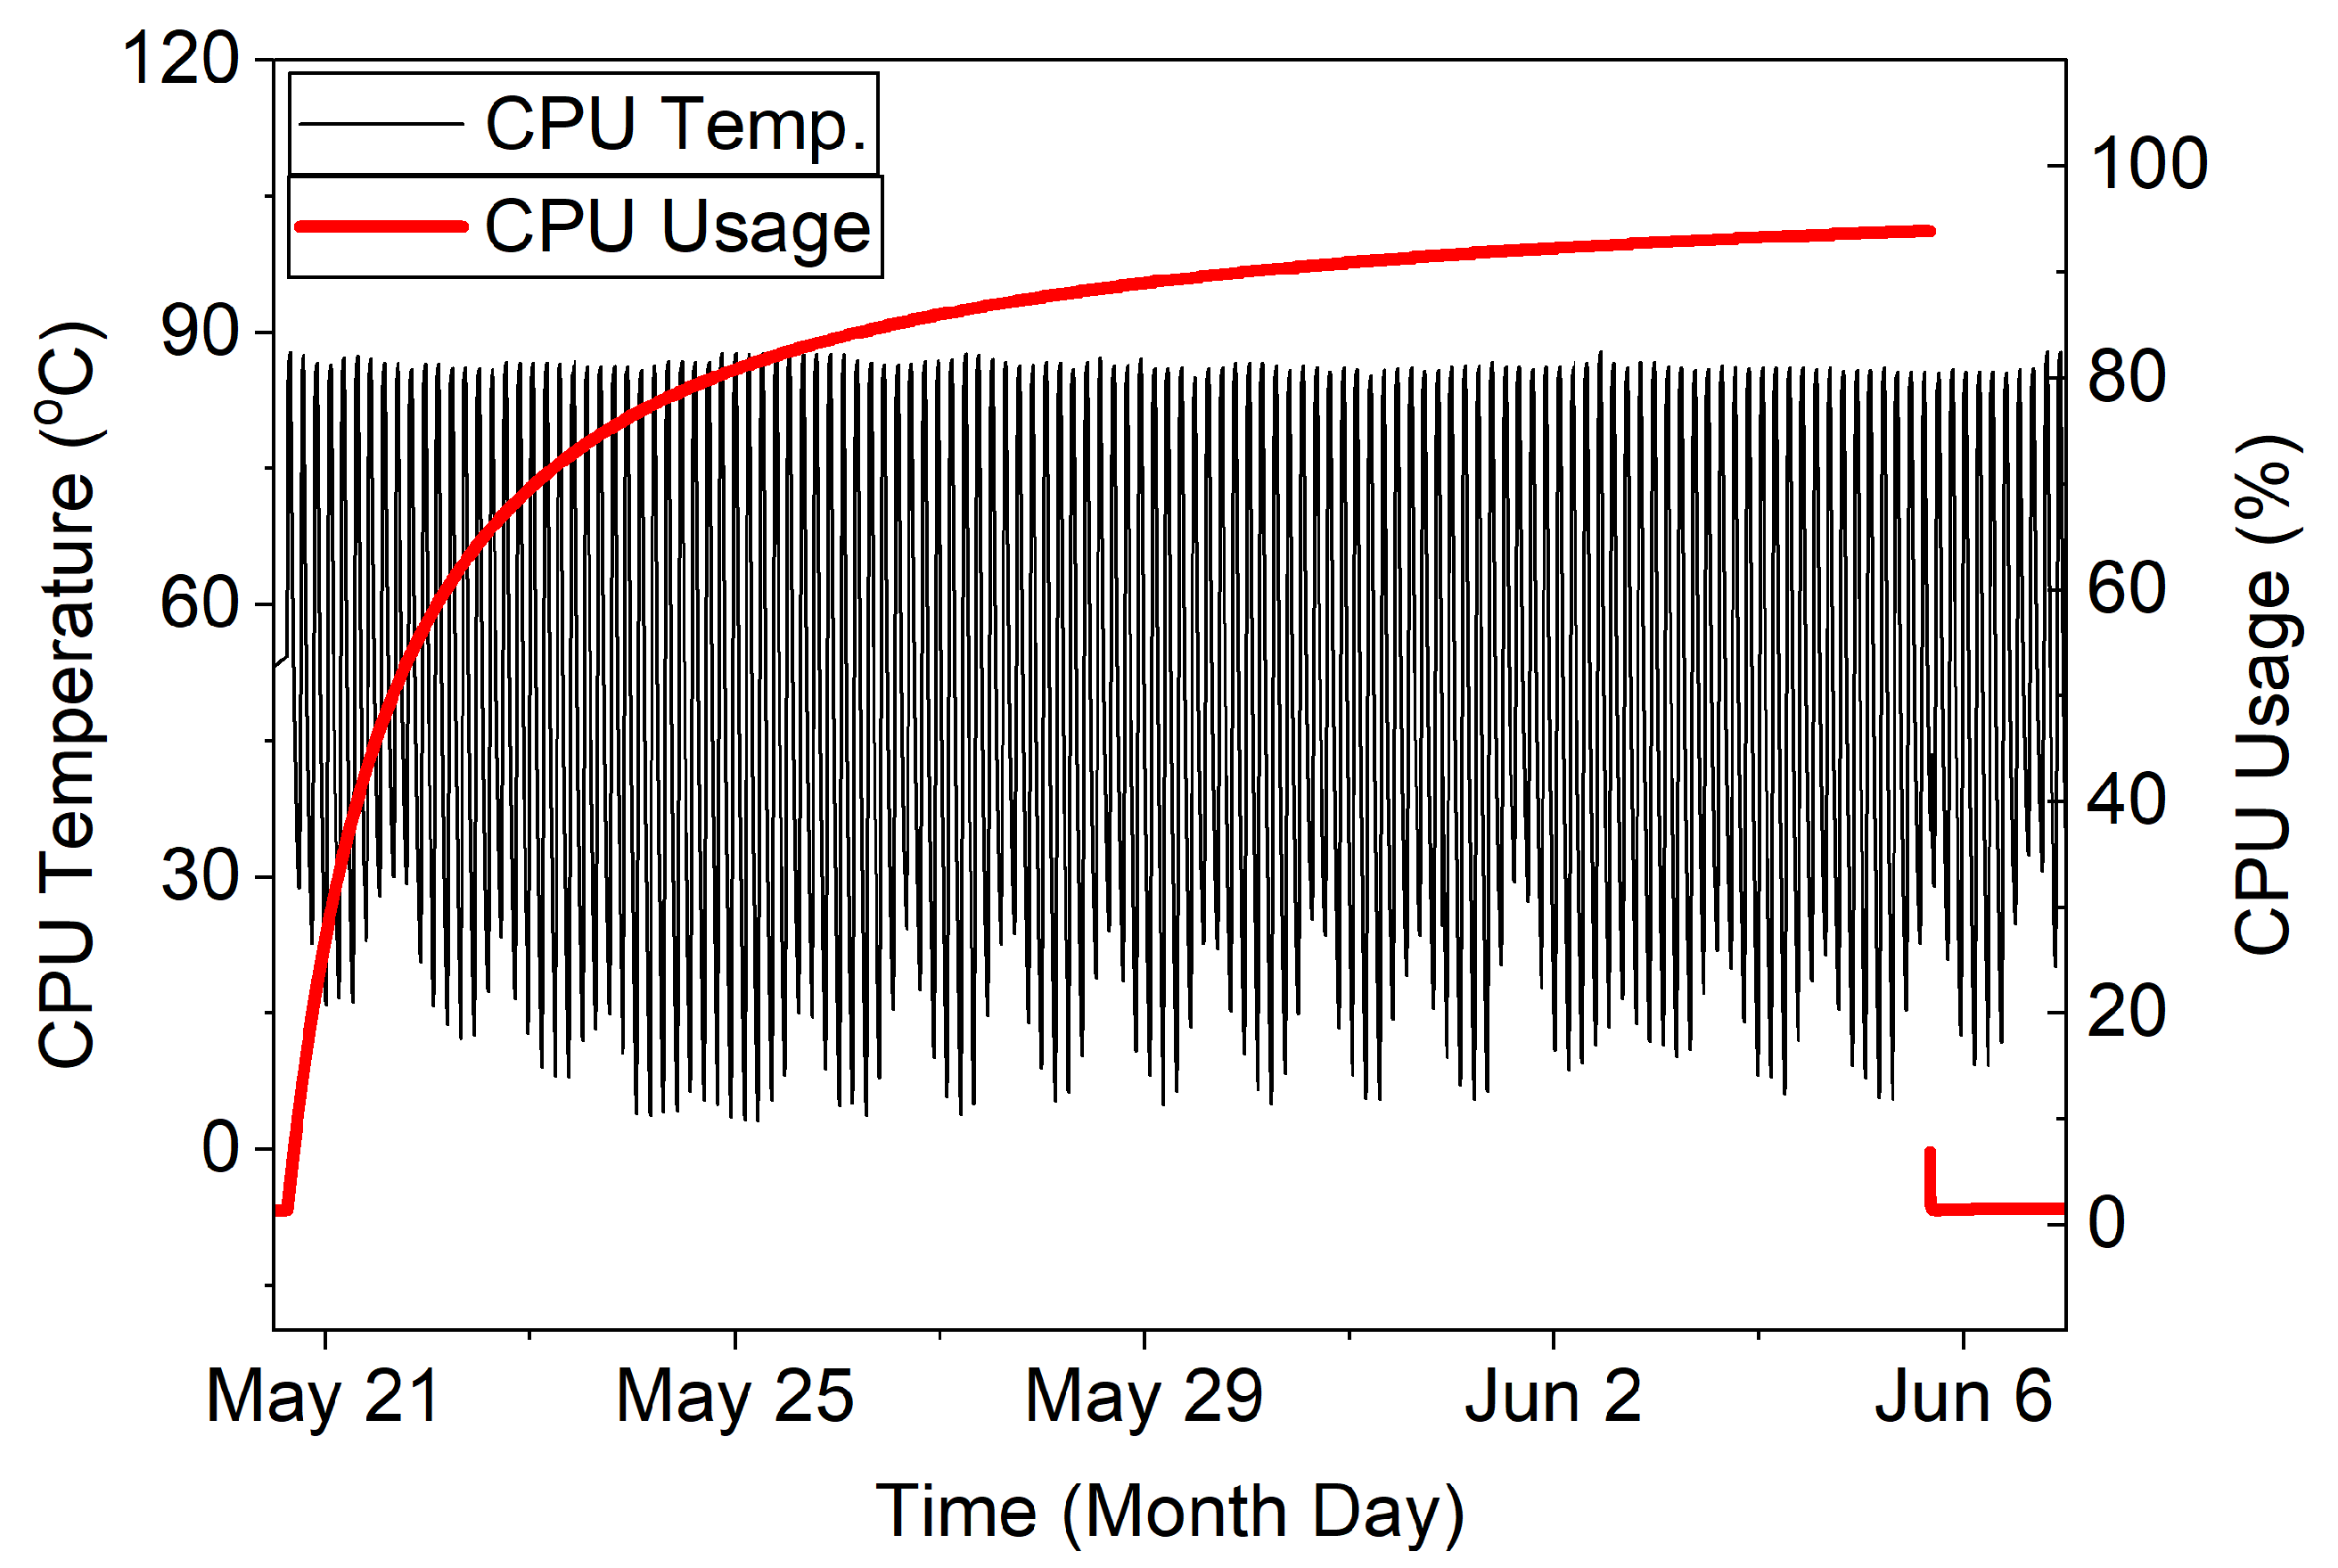
As shown in Figure 5, the analysis of CPU utilization and CPU temperature indicates that increased workload did not significantly affect the CPU thermal response due to forced convection by the 120 mm fan.

3.1.3. Precursor Trends Before Failures

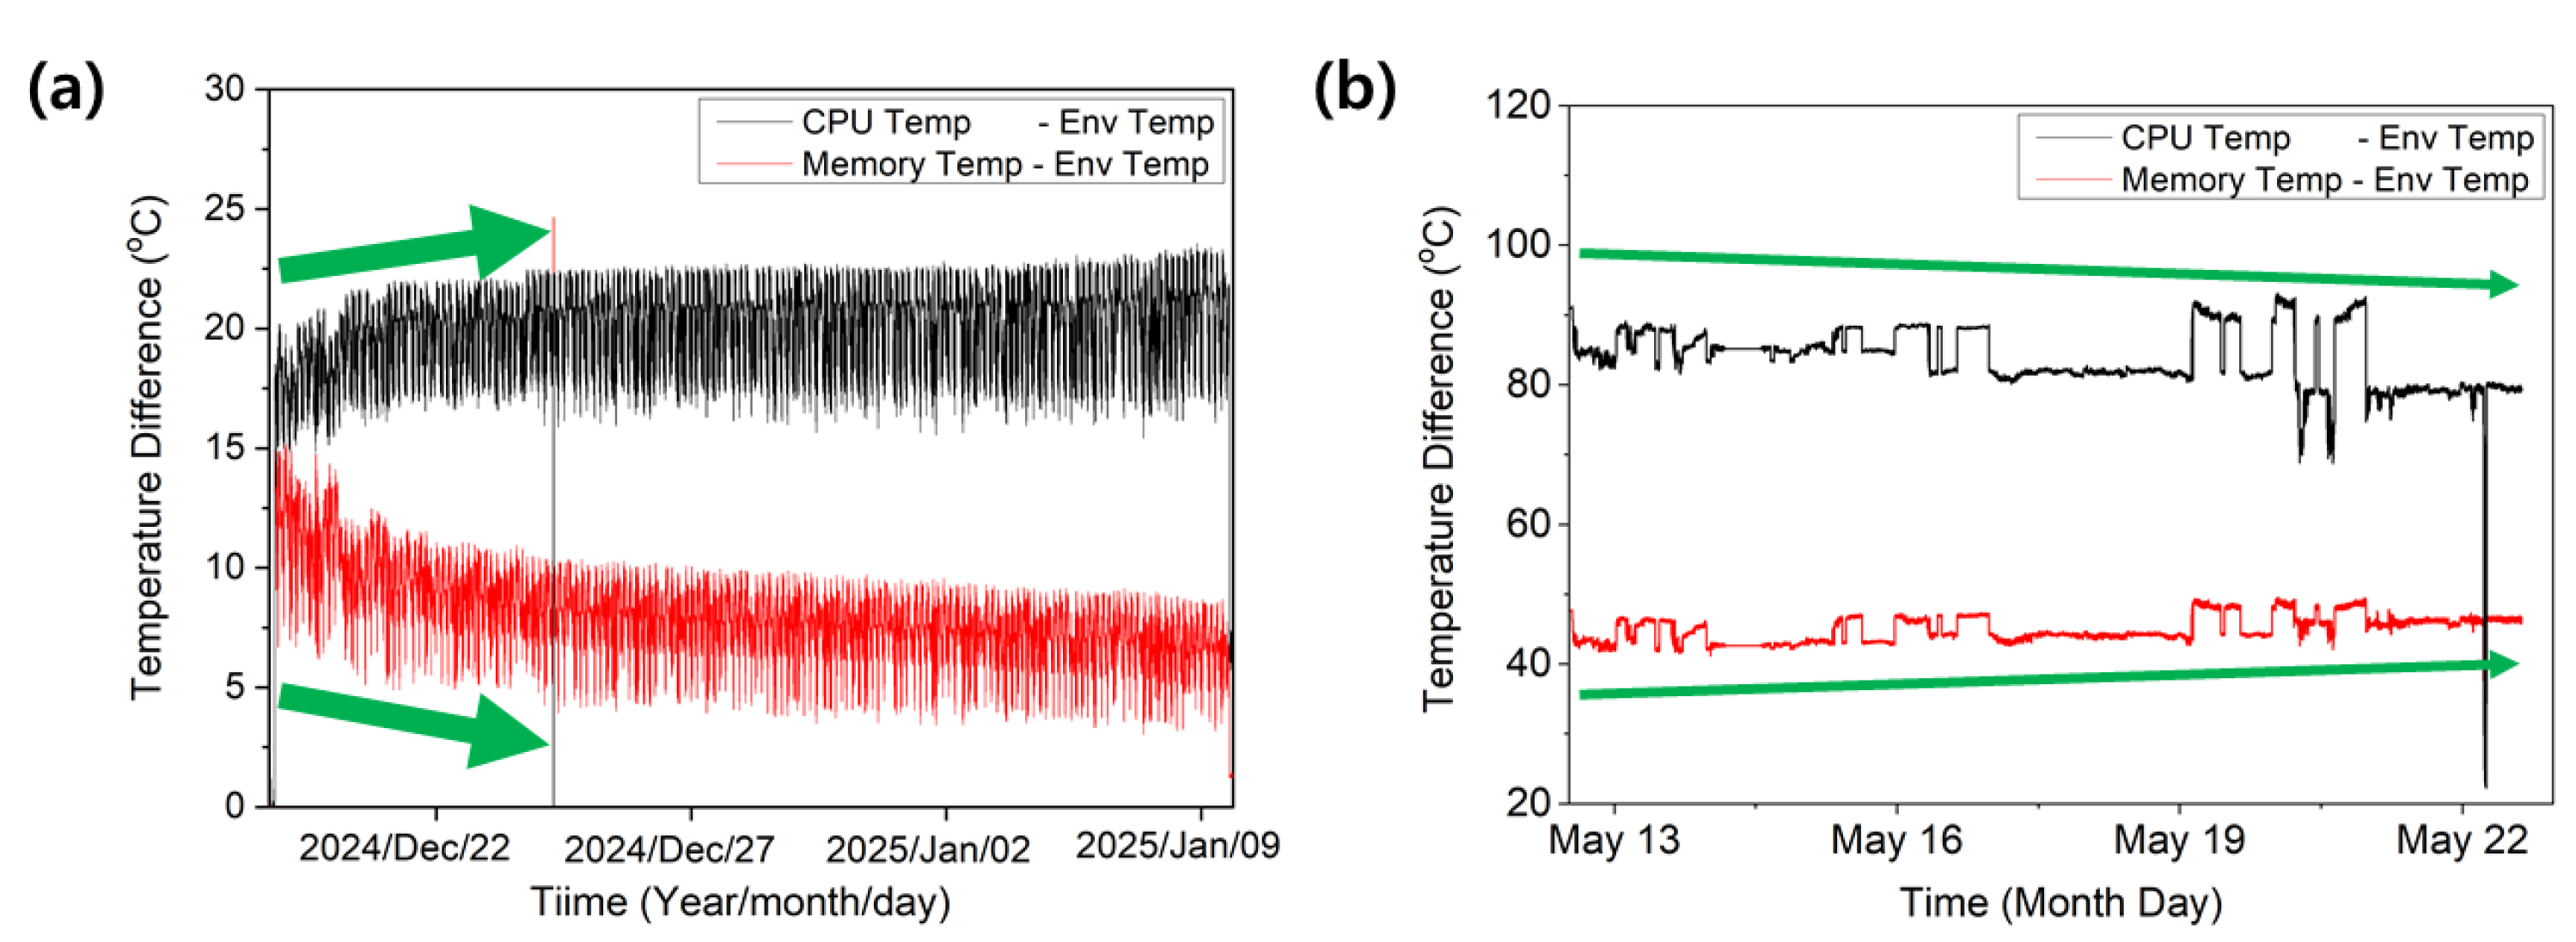
For the samples that eventually failed, distinct precursor trends were identified in both the temperature–humidity (Figure 6a) and vibration tests (Figure 6b).
In the temperature–humidity test, the CPU and memory temperatures typically moved in parallel with ambient temperature during normal operation. However, approximately 10 days before failure, their trends began to diverge even after ambient compensation. This abnormal divergence coincided with the appearance of increased communication noise, suggesting early-stage instability.
In the vibration test, CPU utilization gradually increased abnormally, leading to kernel-panic-like shutdowns.
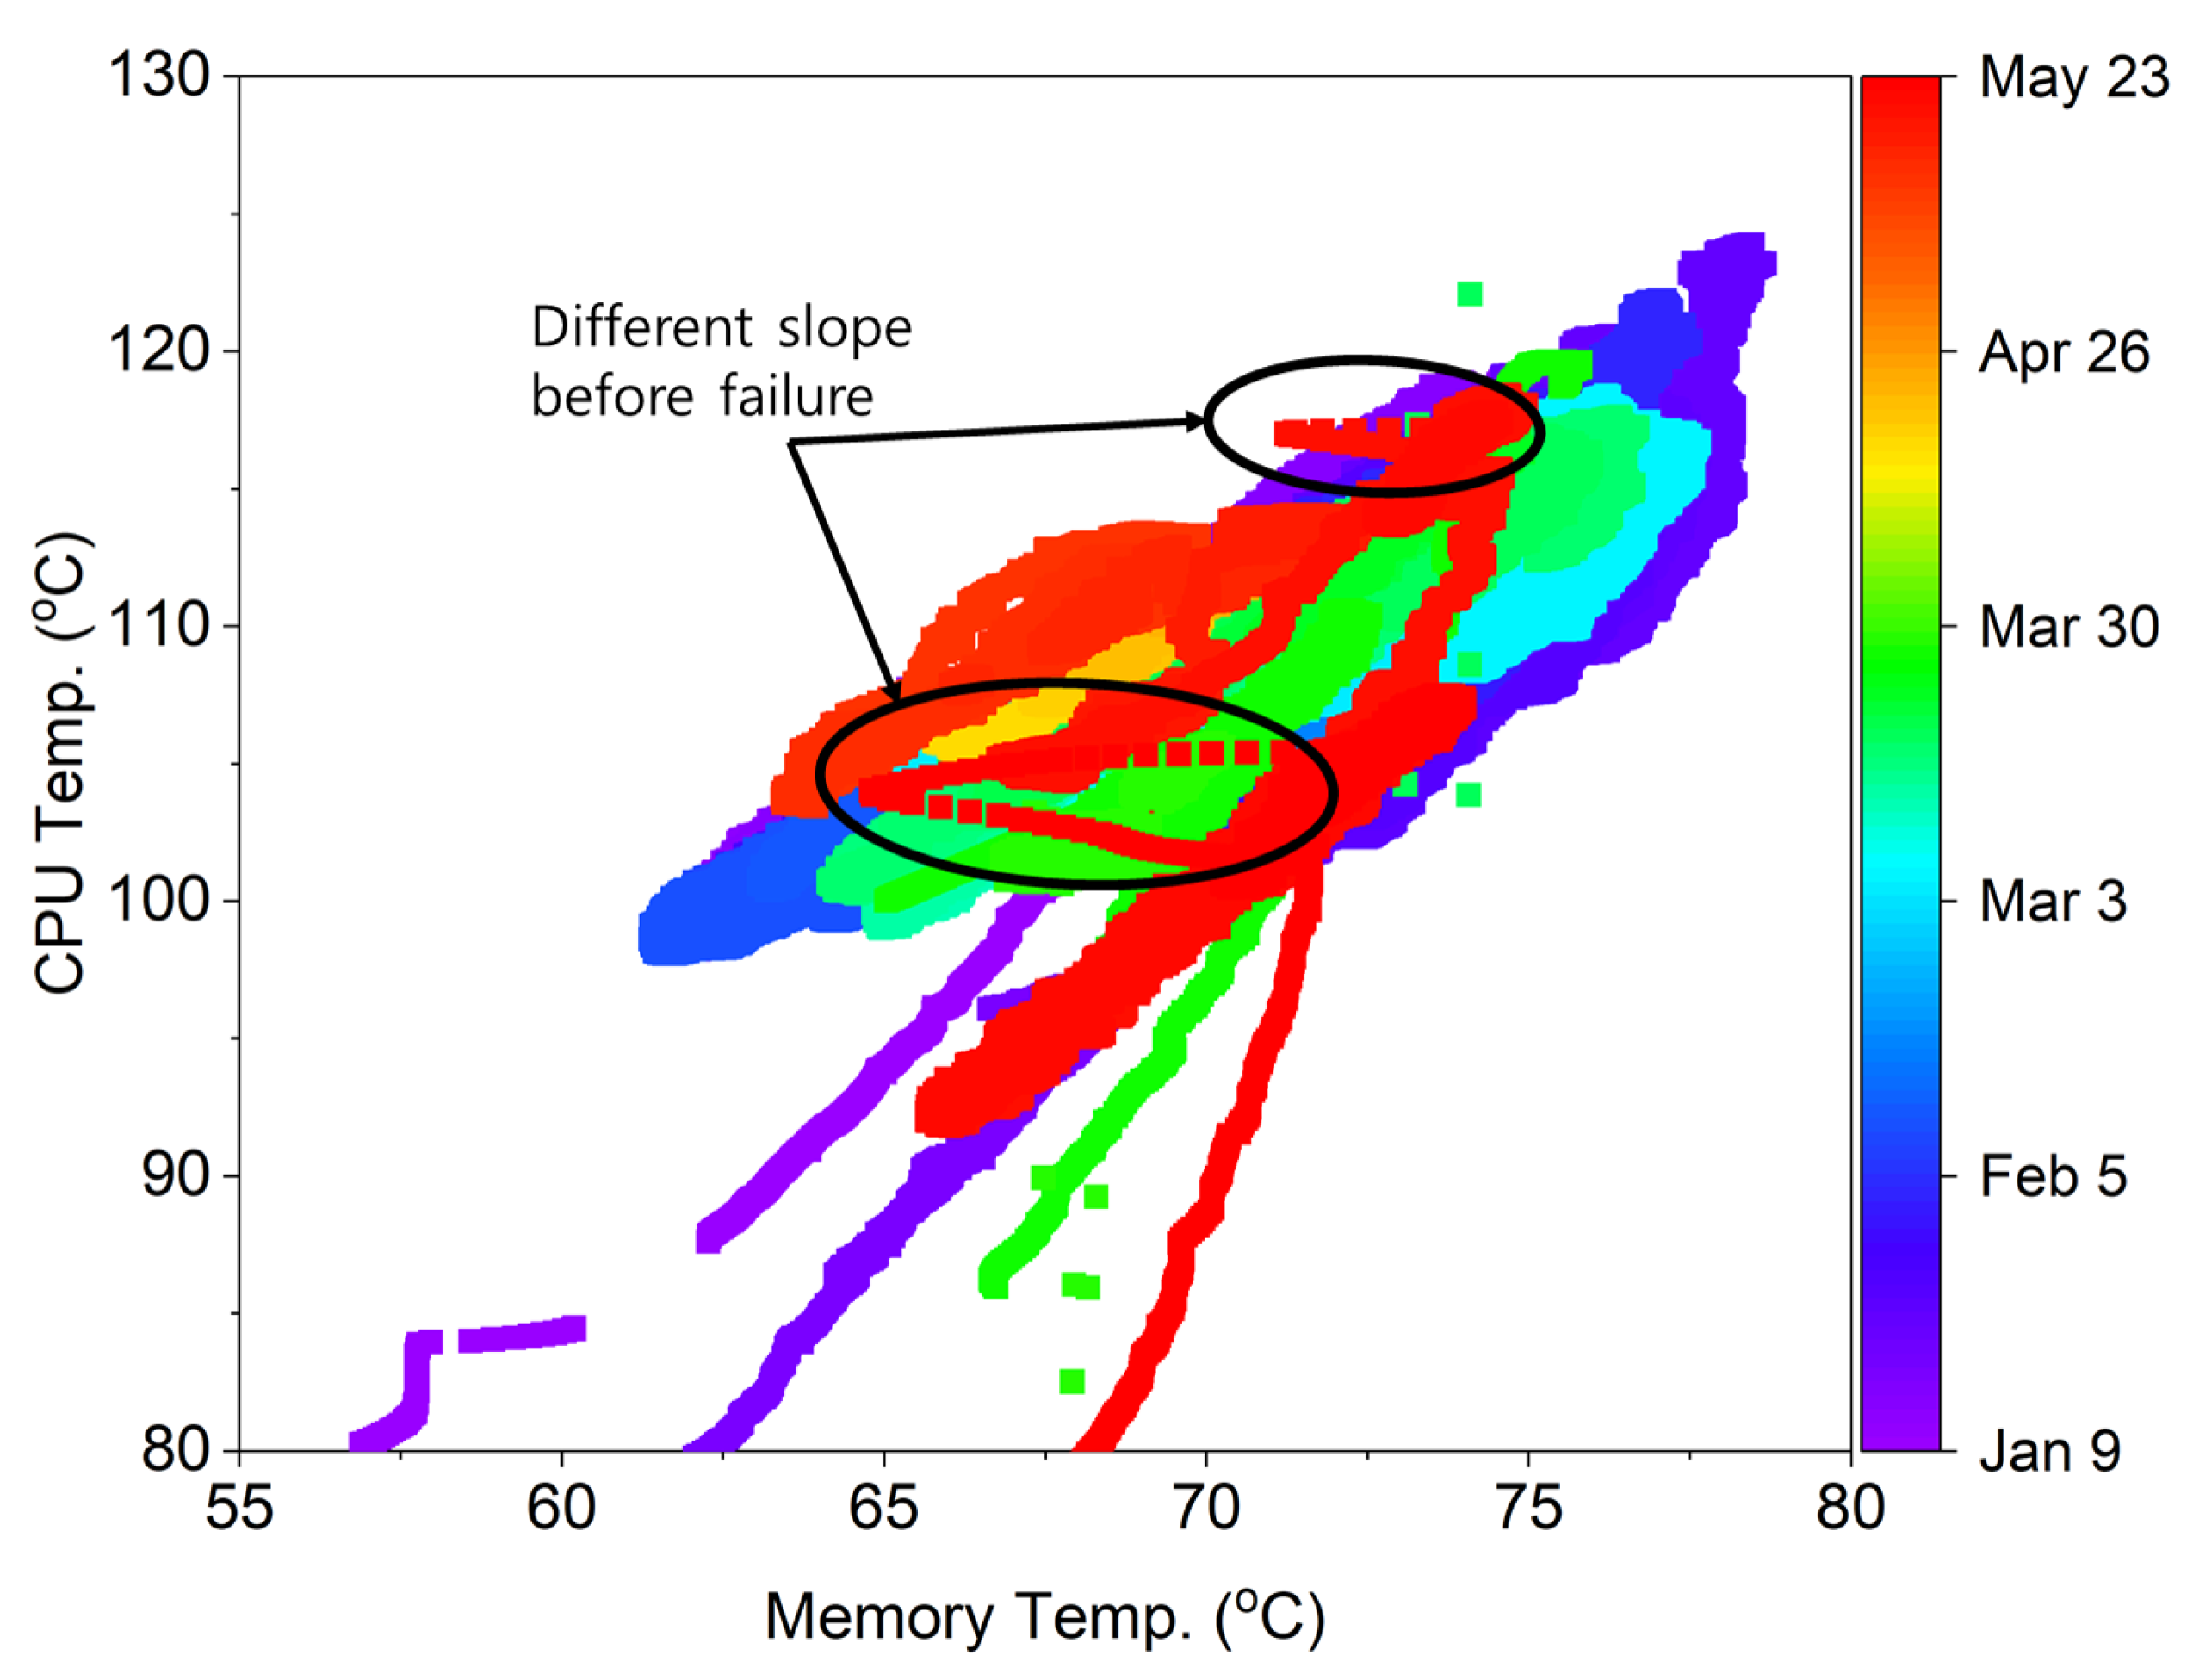
Figure 7 shows that under normal conditions, CPU vs. memory temperatures follow a positive linear relation, whereas the slope deviates as failure approaches.

3.2. Autoencoder Results

We evaluated two input horizons for the LSTM-AE:
  • One-hour window: 1 min sampling × 60 samples.
  • One-day window: 30 min sampling × 48 samples.
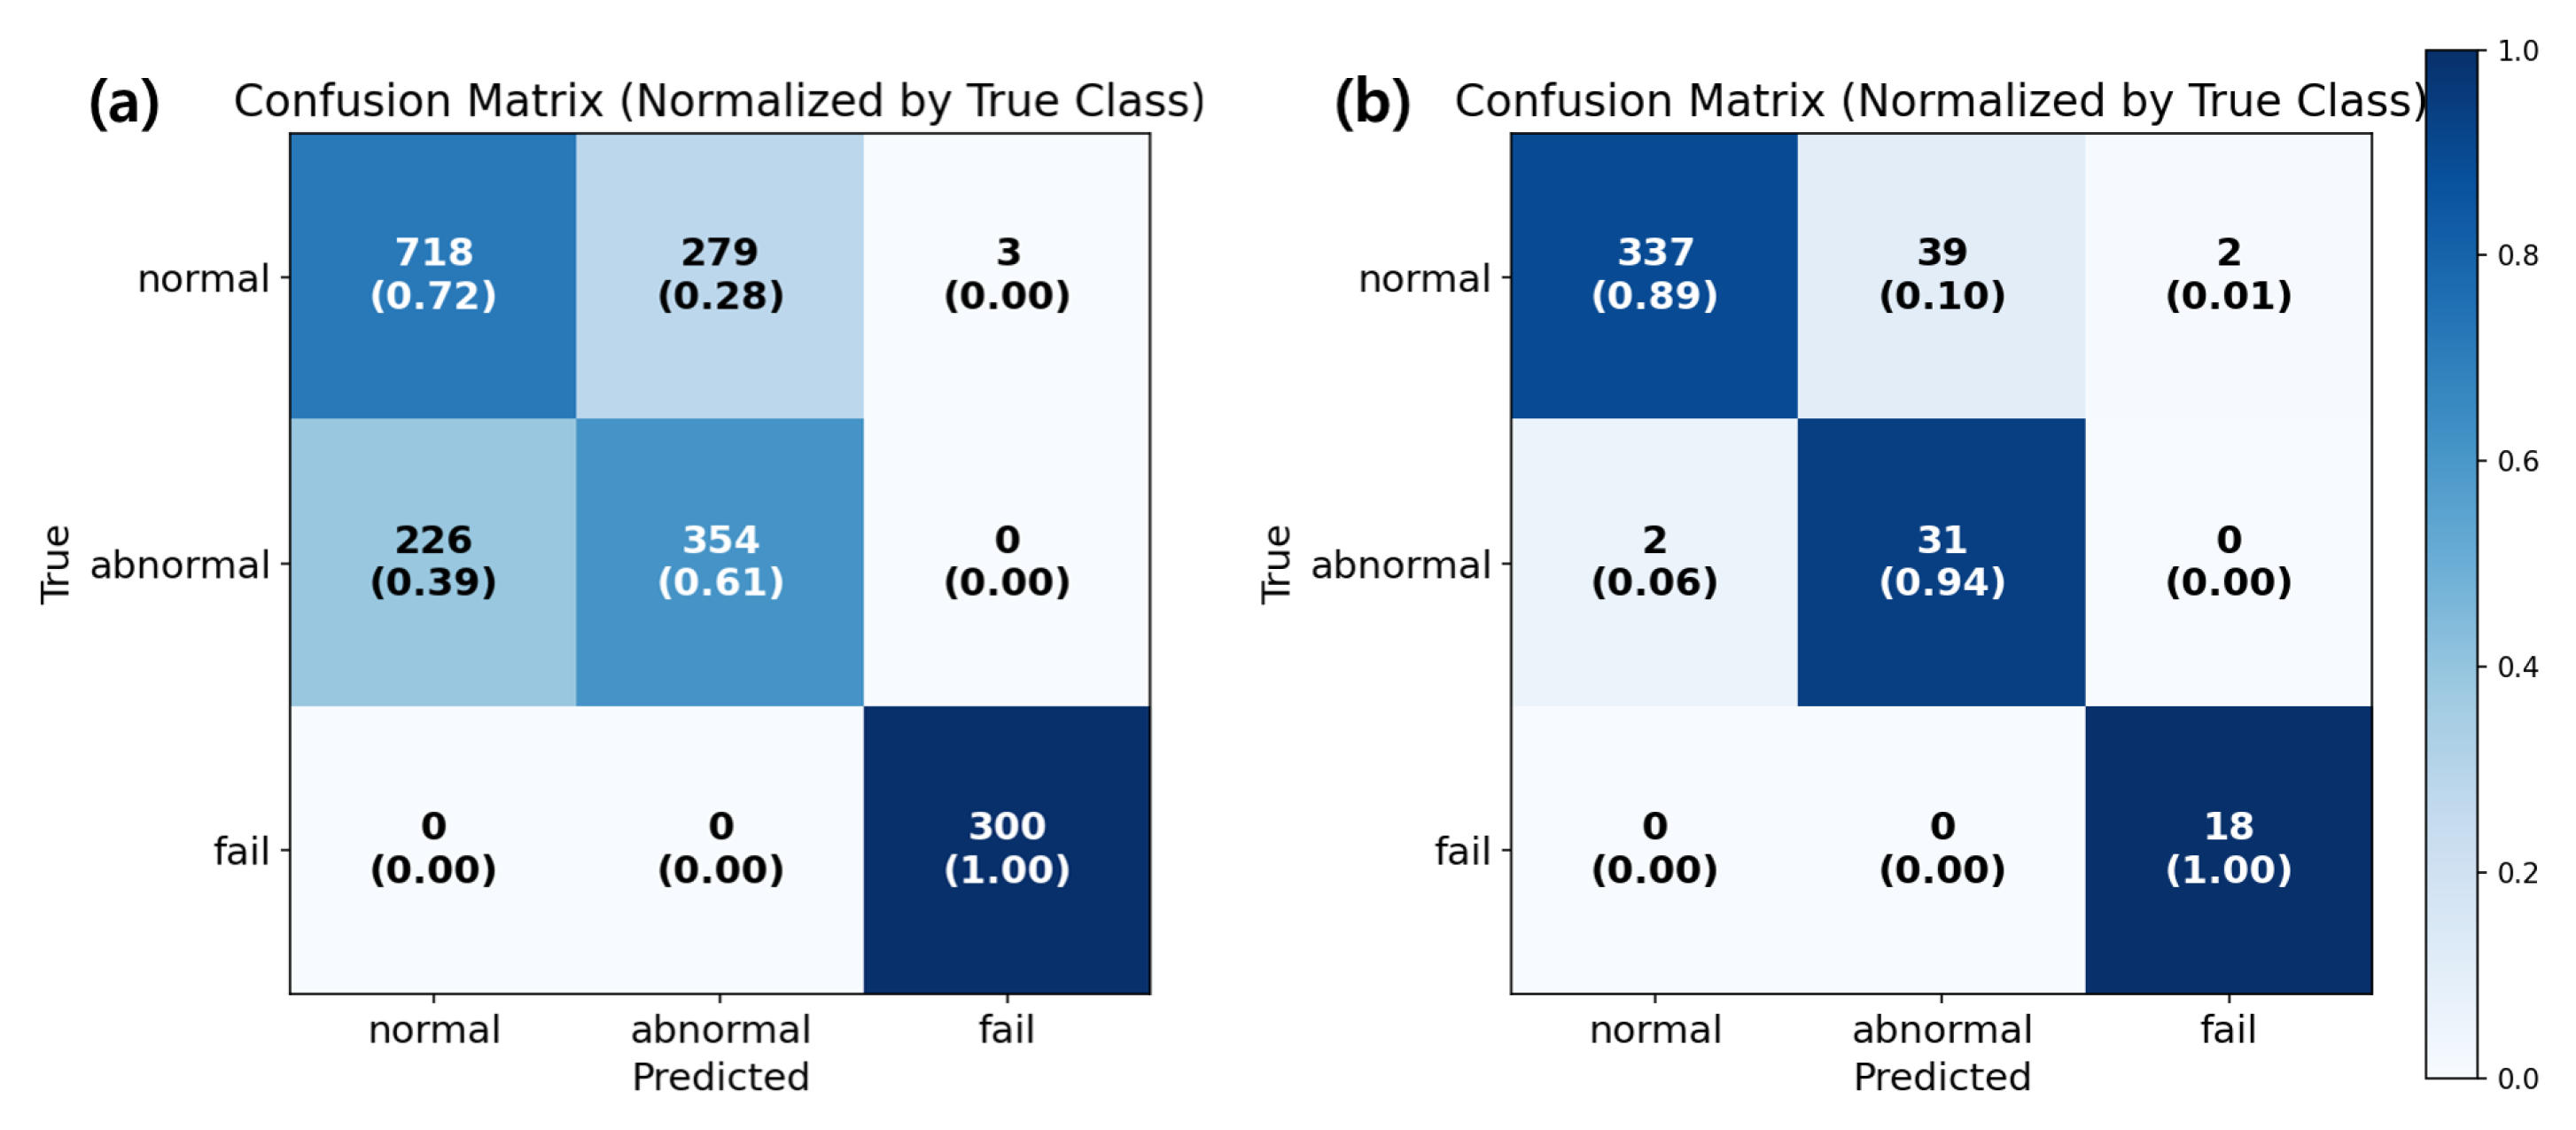
For the 1 h input, overall accuracy was 72.9% (Normal (P = 0.76, R = 0.72, F1 = 0.74), Abnormal (P = 0.56, R = 0.61, F1 = 0.58), and Fail (P = 0.99, R = 1.00, F1 = 0.99)). For the 1-day input, accuracy improved to 90.0% (Normal (P = 0.99, R = 0.89, F1 = 0.89), Abnormal (P = 0.44, R = 0.94), and Fail (P = 0.90, R = 1.00, F1 = 0.95)). The low abnormal precision mainly reflects class imbalance (normal ≫ abnormal); a balanced 1:1 test set would likely yield higher precision. The corresponding confusion matrix results are shown in Figure 8.

3.3. LSTM Results

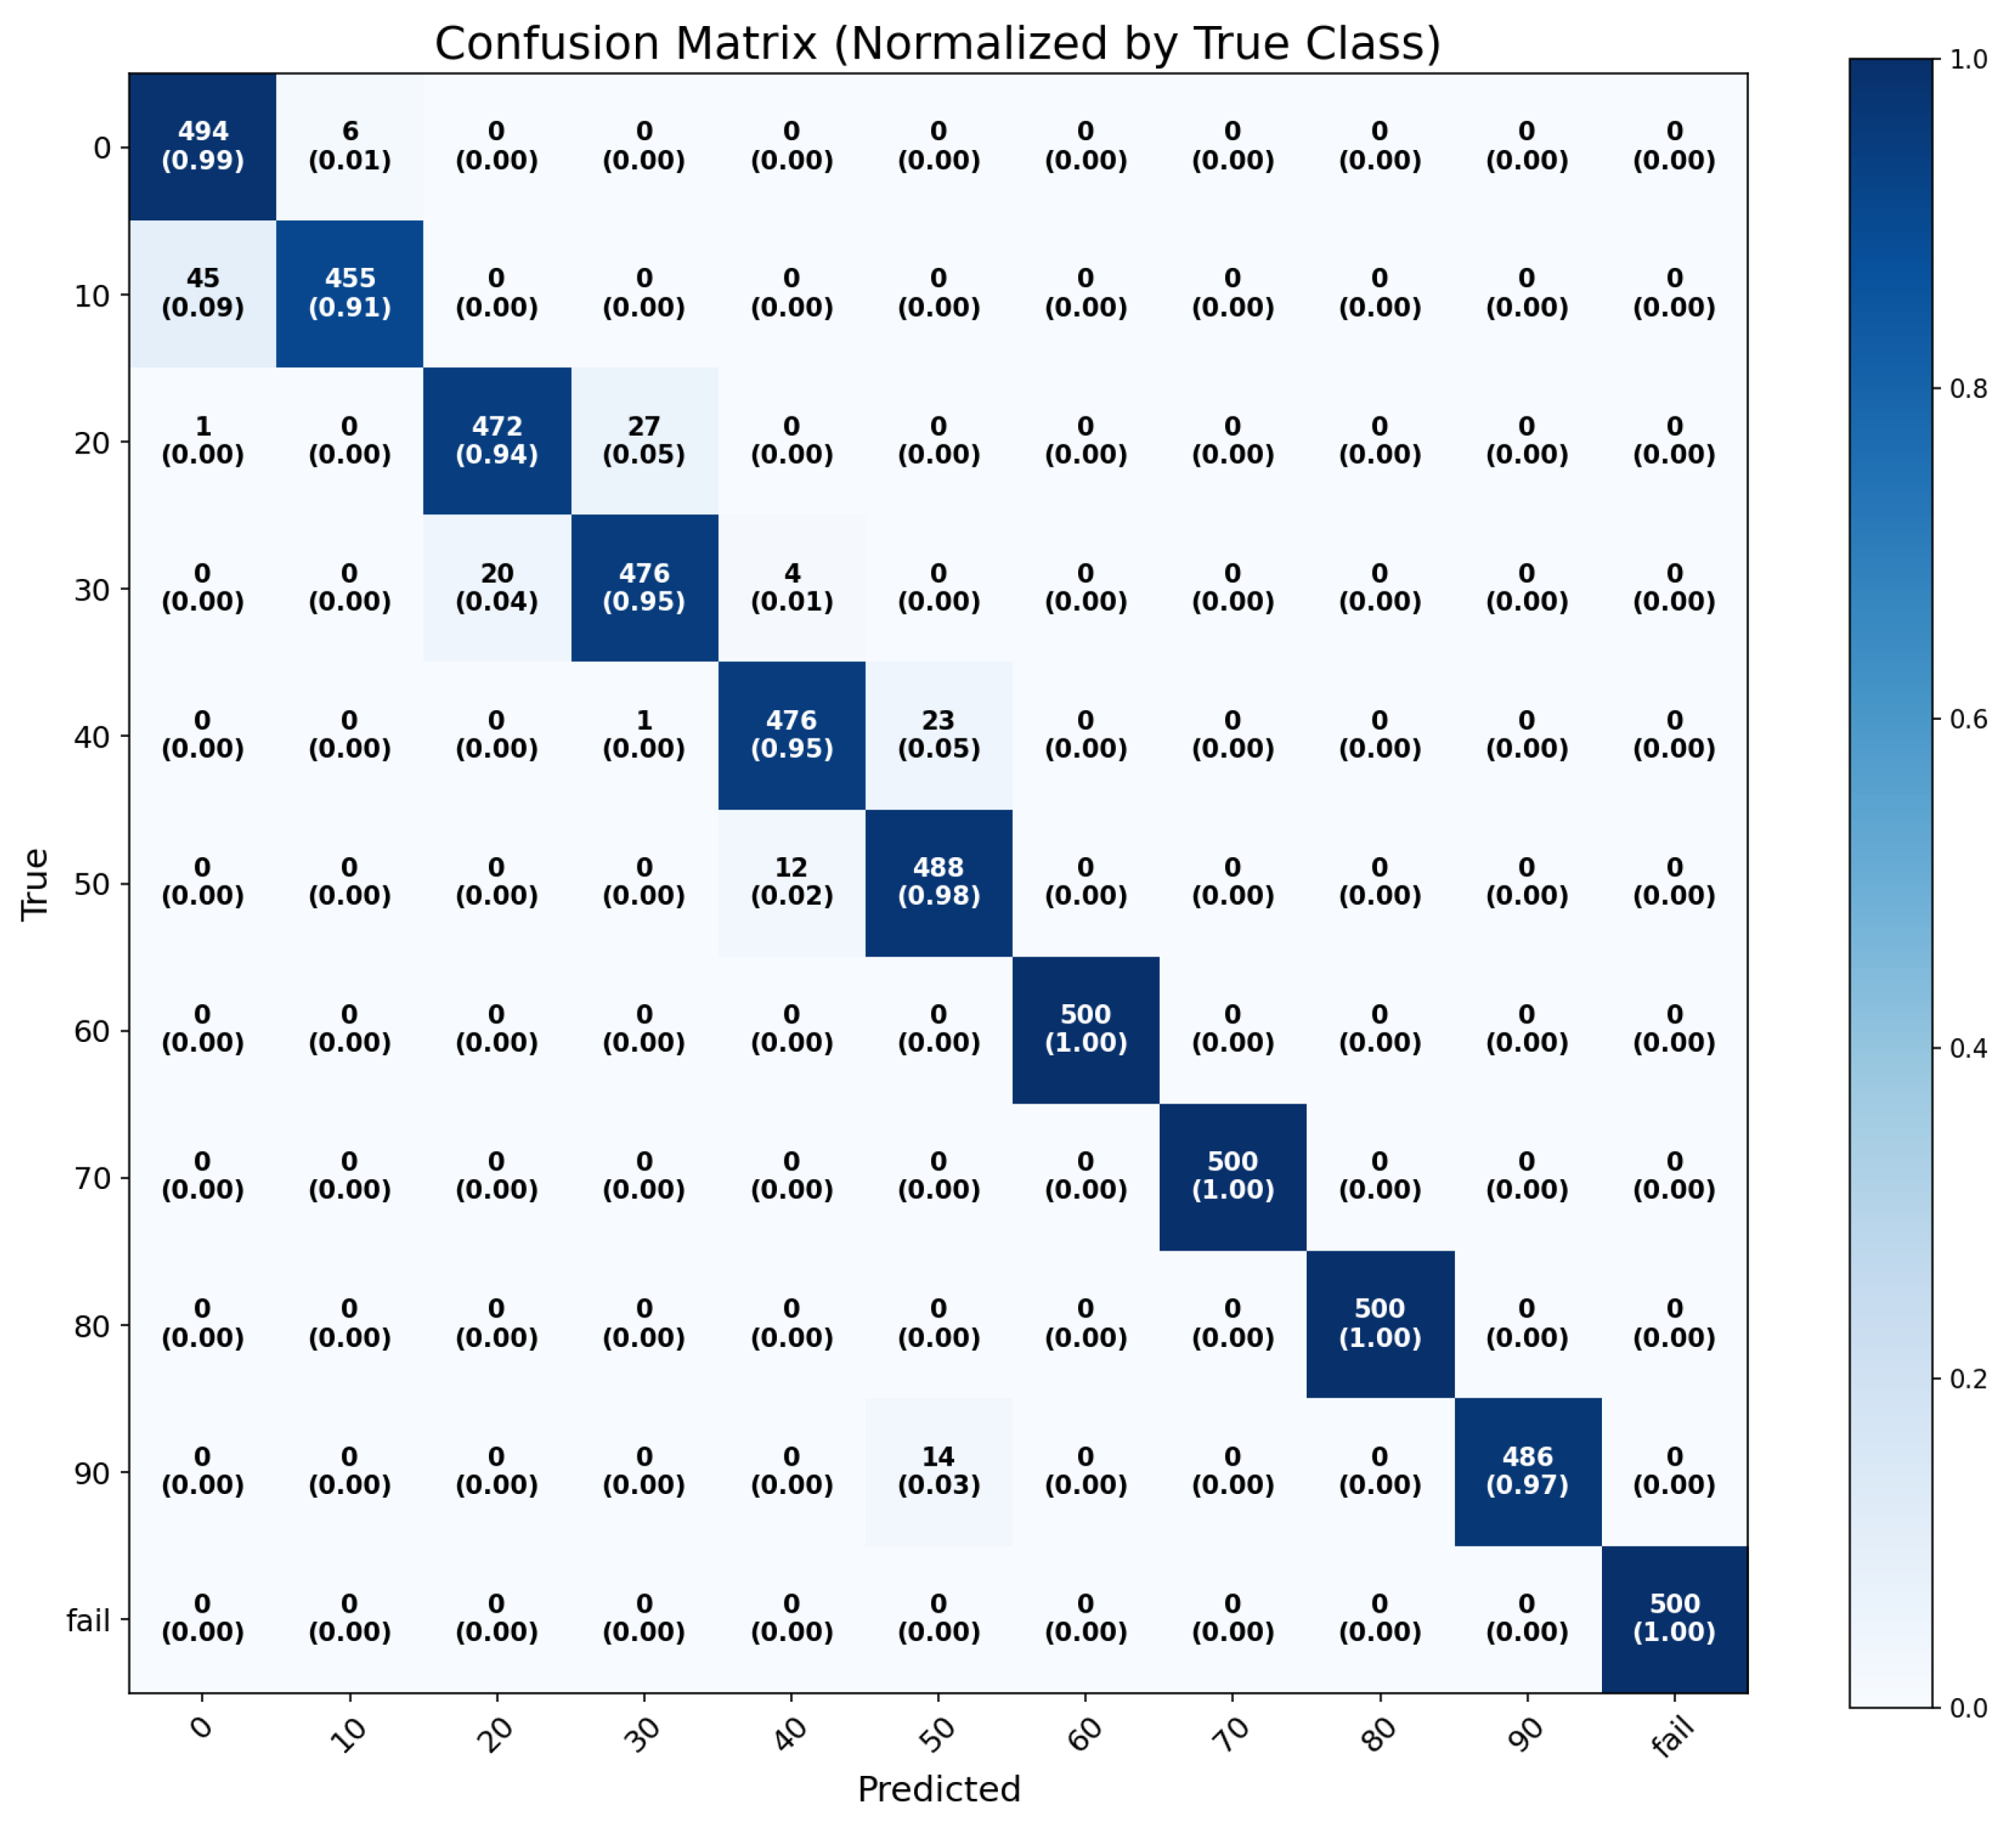
Lifecycle labeling divided operation into 10 intervals plus a Fail class. The confusion matrix is shown in Figure 9. Overall accuracy was 97.2% (precision 0.97, recall 0.97, and F1 0.97).
Although monotonic degradation trends were not always evident in simple plots, the consistently high classification accuracy indicates that the network learned latent progression patterns that are not trivially observable by eye. The Fail state exhibited distinct characteristics, enabling clear separation. As a supervised model, generalization to unseen fault modes may be limited.

3.4. Comparison of LSTM-AE and LSTM Approaches

The LSTM-AE requires only normal data and benefits from longer horizons (1-day > 1 h). The supervised LSTM achieved 97.2% accuracy with lifecycle labels but depends on representative fault data. A hybrid CBM+ deployment is recommended, as summarized in Table 1.

4. Discussion and Conclusions

4.1. Discussion

This study demonstrated CBM+ for SBCs via ALT and neural models.
  • Normal-state stability: Signals track ambient; raw trends make visual prognosis difficult.
  • Precursors: After ambient compensation, CPU–memory temperatures diverged ∼10 days before failure; under acceleration, this implies an even earlier lead time under field conditions, enabling proactive maintenance.
  • Model performance: LSTM-AE improves with longer horizons; LSTM attains 97.2% with lifecycle labels but may not generalize to novel faults.
  • Comparative implications: Hybrid use (Autoencoder for anomaly sensitivity under scarce labels; LSTM for trajectory staging with labels).
  • CBM+ translation: In practice, Autoencoder-based anomaly scores can trigger early-warning alerts; LSTM-based lifecycle estimates can drive maintenance scheduling (e.g., inspection windows, spares staging) and mission derating policies. Combining both yields graded responses: warn → inspect → replace.
Despite these promising results, several limitations should be acknowledged. First, only two boards experienced complete failure during the accelerated tests, which restricts the statistical generalization of the findings. As the MVME6100 is a commercially expensive and defense-certified unit, large-scale procurement was not feasible. Nevertheless, its operational relevance justifies the choice for this feasibility study. Second, hyperparameter tuning and architectural optimization were not extensively performed, and further refinement could potentially improve model accuracy and robustness. Third, detailed post-failure diagnostics were not feasible because failed boards could no longer be powered on. Future work will incorporate oscilloscope-based signal capture and clock-level timing analysis to better explain the observed thermal divergence phenomenon.
From a methodological perspective, traditional reliability analysis primarily focuses on lifetime distributions and failure rates, providing limited insight into real-time degradation dynamics. In contrast, the deep learning-based framework proposed in this study leverages in situ signal trends—such as temperature divergence and utilization anomalies—measured through non-intrusive, low-cost sensors. This approach enables proactive monitoring of system health without the need for expensive or intrusive instrumentation typically required in component-level reliability testing.

4.2. Conclusions

This study extended CBM+ to the MVME6100 SBC using ALT with continuous sensing. Although normal-state signals appeared stable, ambient-compensated temperature trends diverged days before failure, providing actionable lead time. Autoencoder achieved robust anomaly detection with long horizons; LSTM achieved 97.2% lifecycle classification with labels. A hybrid AE–LSTM workflow is recommended for field CBM+: Autoencoder for early anomaly screening; LSTM for trajectory-aware maintenance decisions. Future work will expand datasets, tune models, incorporate error logs/frequency domain, and perform detailed failure forensics to improve generalization and interpretability.

Author Contributions

Conceptualization, Y.K., Y.P. and D.-W.J.; data curation, G.-H.M. and Y.K.; methodology, Y.P. and D.-W.J.; resources, Y.K. and Y.P.; software, G.-H.M.; supervision, D.-W.J.; validation, D.-W.J.; visualization, D.-W.J.; writing—original draft, G.-H.M.; writing—review and editing, D.-W.J. All authors have read and agreed to the published version of the manuscript.

Funding

This work was supported by the Korea Research Institute for Defense Technology Planning and Advancement (KRIT)—grant funded by the Defense Acquisition Program Administration (DAPA) (KRIT-CT-22-081, Weapon System CBM+ Research Center).

Institutional Review Board Statement

Not applicable.

Informed Consent Statement

Not applicable.

Data Availability Statement

The data presented in this study are available on request from the corresponding author.

Acknowledgments

The authors would like to thank NamWook Kang of Hanwha Systems for his assistance with data curation.

Conflicts of Interest

The authors declare no conflicts of interest.

References

  1. ISO 13372:2012; Condition Monitoring and Diagnostics of Machine —Vocabulary. ISO: Geneva, Switzerland, 2012.
  2. Shin, J.H.; Jun, H.B. On Condition Based Maintenance Policy. J. Comput. Des. Eng. 2015, 2, 119–127. [Google Scholar] [CrossRef]
  3. Nowlan, F.S.; Heap, H.F. Reliability-Centered Maintenance; United States Department of Defense: Arlington, VA, USA, 1978. [Google Scholar]
  4. Prajapati, A.; Bechtel, J.; Ganesan, S. Condition Based Maintenance: A Survey. J. Qual. Maint. Eng. 2012, 18, 384–400. [Google Scholar] [CrossRef]
  5. U.S. Department of Defense. Condition Based Maintenance Plus (CBM+) Guidebook; U.S. Department of Defense: Washington, DC, USA, 2008.
  6. Byington, C.S.; Roemer, M.J.; Galie, T. Prognostic Enhancements to Diagnostic Systems for Improved Condition-Based Maintenance. In Proceedings of the IEEE Aerospace Conference, Big Sky, MT, USA, 9–16 March 2002; pp. 2951–2957. [Google Scholar] [CrossRef]
  7. Crooks, K.; Plawecki, N. Novel Approach to CBM+ Implementation on Aviation Systems. In Proceedings of the 2021 Annual Reliability and Maintainability Symposium (RAMS), Orlando, FL, USA, 24–27 May 2021; pp. 1–6. [Google Scholar] [CrossRef]
  8. Fox, H.; Pillai, A.C.; Friedrich, D.; Collu, M.; Dawood, T.; Johanning, L. A Review of Predictive and Prescriptive Offshore Wind Farm Operation and Maintenance. Energies 2022, 15, 504. [Google Scholar] [CrossRef]
  9. Chitteth Ramachandran, R.; Desmond, C.; Judge, F.; Serraris, J.J.; Murphy, J. Floating wind turbines: Marine operations challenges and opportunities. Wind. Energy Sci. 2022, 7, 903–924. [Google Scholar] [CrossRef]
  10. Fernandes, J.; Reis, J.; Melão, N.; Teixeira, L.; Amorim, M. The role of Industry 4.0 and BPMN in the arise of condition-based and predictive maintenance: A case study in the automotive industry. Appl. Sci. 2021, 11, 3438. [Google Scholar] [CrossRef]
  11. Jang, D.W.; Kang, J.S.; Lim, J.Y. A feasible strain-history extraction method using machine learning for the durability evaluation of automotive parts. J. Mech. Sci. Technol. 2021, 35, 5117–5125. [Google Scholar] [CrossRef]
  12. Molęda, M.; Małysiak-Mrozek, B.; Ding, W.; Sunderam, V.; Mrozek, D. From Corrective to Predictive Maintenance—A Review of Maintenance Approaches for the Power Industry. Sensors 2023, 23, 5970. [Google Scholar] [CrossRef]
  13. Hector, I.; Panjanathan, R. Predictive maintenance in Industry 4.0: A survey of planning models and machine learning techniques. PeerJ Comput. Sci. 2024, 10, e2016. [Google Scholar] [CrossRef]
  14. Vichare, N.; Pecht, M. Prognostics and health management of electronics. IEEE Trans. Components Packag. Technol. 2006, 29, 222–229. [Google Scholar] [CrossRef]
  15. Butler, K.M.; Carulli, J.M.; Saxena, J. Modeling Test Escape Rate as a Function of Multiple Coverages. In Proceedings of the 2008 IEEE International Test Conference, Santa Clara, CA, USA, 28–30 October 2008; pp. 1–9. [Google Scholar] [CrossRef]
  16. Shin, I.; Koo, K.; Kwon, D. Development of a Non-Invasive On-Chip Interconnect Health Sensing Method Based on Bit Error Rates. Sensors 2018, 18, 3234. [Google Scholar] [CrossRef]
  17. Depiver, J.A.; Mallik, S.; Harmanto, D. Solder joint failures under thermo-mechanical loading conditions—A review. Adv. Mater. Process. Technol. 2021, 7, 1–26. [Google Scholar] [CrossRef]
  18. Li, L.; Du, X.; Chen, J.; Wu, Y. Thermal fatigue failure of micro-solder joints in electronic packaging devices: A review. Materials 2024, 17, 2365. [Google Scholar] [CrossRef]
  19. Gabbay, F.; Mendelson, A. Asymmetric aging effect on modern microprocessors. Microelectron. Reliab. 2021, 119, 114090. [Google Scholar] [CrossRef]
  20. Escobar, L.A.; Meeker, W.Q. A review of accelerated test models. Stat. Sci. 2006, 21, 552–577. [Google Scholar] [CrossRef]
  21. Indmeskine, F.E.; Othman, M.; Gziri, A. Review on accelerated life testing plan to develop reliability model. Qual. Reliab. Eng. Int. 2023, 39, 4303–4327. [Google Scholar] [CrossRef]
  22. Lee, S.; Kareem, A.B.; Hur, J.W. A Comparative Study of Deep-Learning Autoencoders (DLAEs) for Vibration Anomaly Detection in Manufacturing Equipment. Electronics 2024, 13, 1700. [Google Scholar] [CrossRef]
  23. Del Buono, F.; Calabrese, F.; Baraldi, A.; Paganelli, M.; Guerra, F. Novelty Detection with Autoencoders for System Health Monitoring in Industrial Environments. Appl. Sci. 2022, 12, 4931. [Google Scholar] [CrossRef]
  24. Ahn, S.; Yoo, J.; Lee, K.W.; Youn, B.D.; Ahn, S.H. Frequency-focused sound data generator for fault diagnosis in industrial robots. J. Comput. Des. Eng. 2024, 11, 234–248. [Google Scholar] [CrossRef]
  25. Gómez, A.; Cuiñas, D.; Catalá, P.; Xin, L.; Li, W.; Conway, S.; Lack, D. Use of Single Board Computers as Smart Sensors in the Manufacturing Industry. Procedia Eng. 2015, 132, 153–159. [Google Scholar] [CrossRef]
  26. Matthews, S.J. Harnessing single board computers for military data analytics. In Military Applications of Data Analytics; Auerbach Publications: Boca Raton, FL, USA, 2018; pp. 63–77. [Google Scholar]
  27. MIL-STD-883; Test Methods for Microelectronics—Temperature Cycling/Environmental Tests. U.S. Department of Defense: Arlington, VA, USA, 2004.
  28. IEC 60068-2-30:2025; Environmental Testing—Part 2–30: Tests — Test Db: Damp Heat, Cyclic (12 h + 12 h Cycle). International Electrotechnical Commission: Geneva, Switzerland, 2025.
  29. MIL-STD-810; Method 514: Vibration. Sinusoidal and Transport/General Vibration Procedures. U.S. Department of Defense: Arlington, VA, USA, 2019.
  30. Tian, J.; Jiang, Y.; Zhang, J.; Luo, H.; Yin, S. A novel data augmentation approach to fault diagnosis with class-imbalance problem. Reliab. Eng. Syst. Saf. 2024, 243, 109832. [Google Scholar] [CrossRef]
  31. Binbusayyis, A.; Vaiyapuri, T. Unsupervised deep learning approach for network intrusion detection combining convolutional autoencoder and one-class SVM. Appl. Intell. 2021, 51, 7094–7108. [Google Scholar] [CrossRef]
  32. Xu, H.; Wang, Y.; Jian, S.; Liao, Q.; Wang, Y.; Pang, G. Calibrated one-class classification for unsupervised time series anomaly detection. IEEE Trans. Knowl. Data Eng. 2024, 36, 5723–5736. [Google Scholar] [CrossRef]
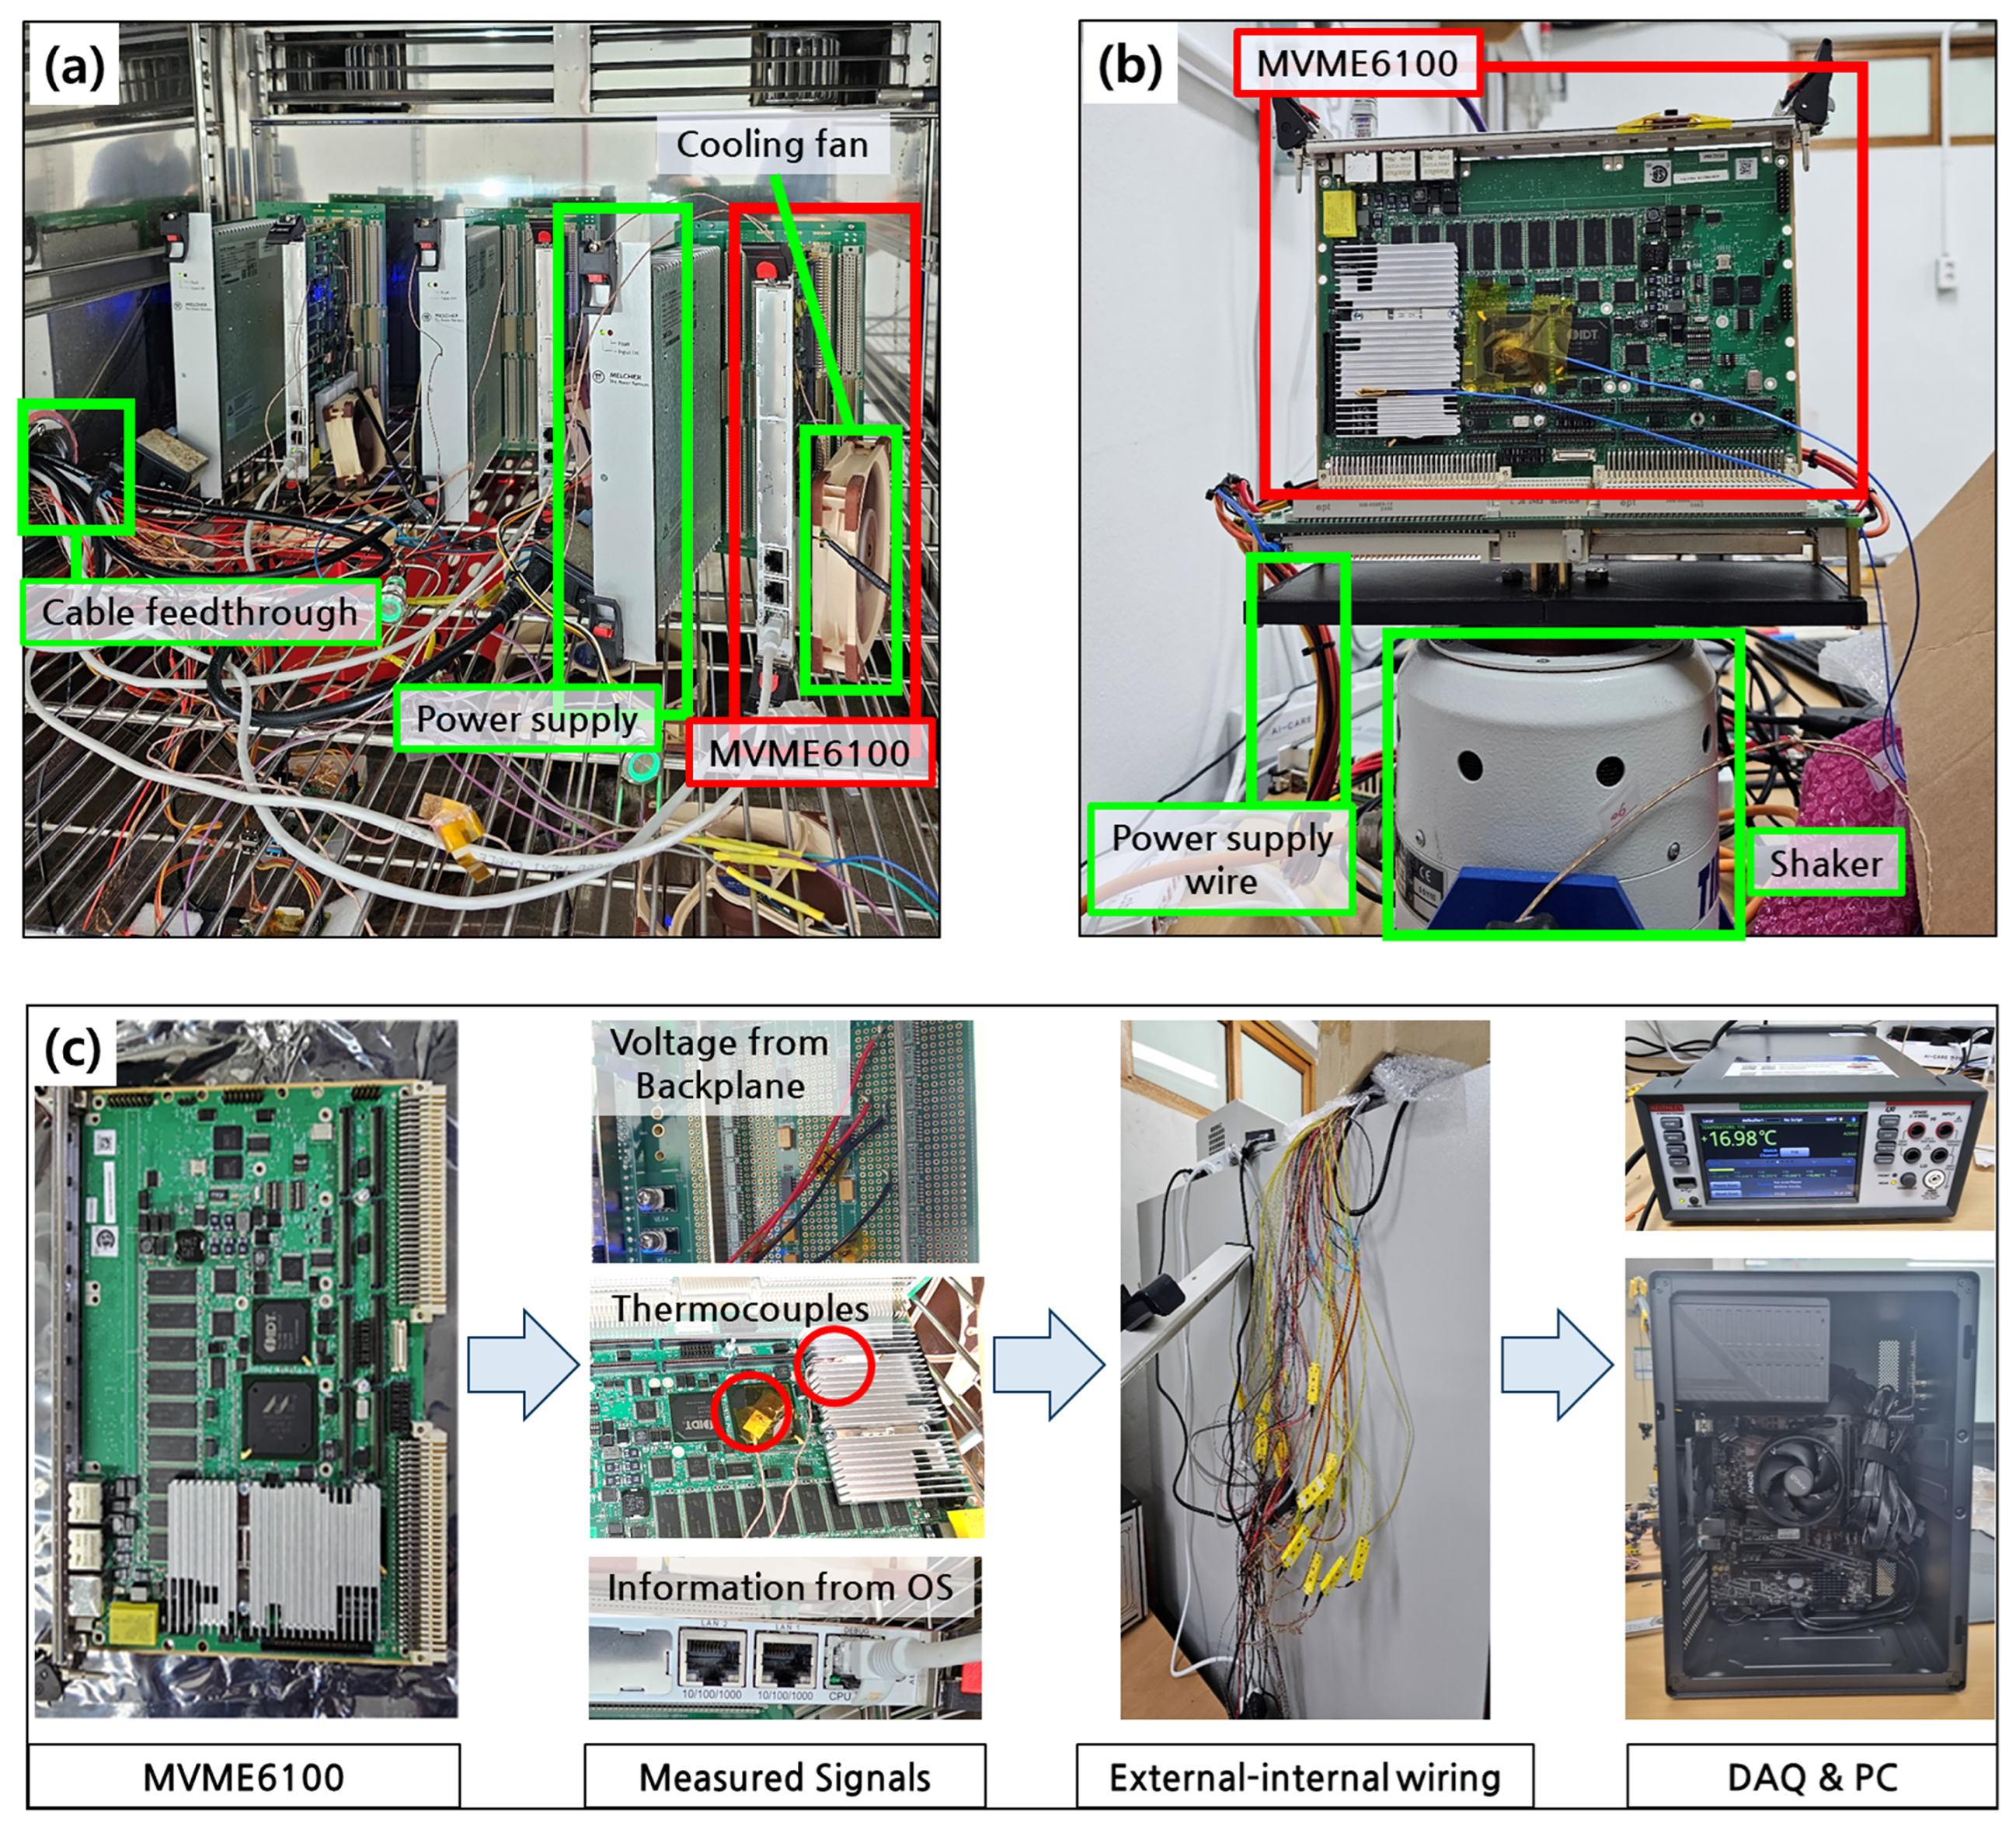
Figure 1. Experimental setup for accelerated testing of MVME6100 single-board computers: (a) temperature–humidity chamber test configuration with power supplies, cooling fans, and cable feedthrough connections; (b) vibration test configuration using a shaker platform with power supply wiring; and (c) data acquisition flow showing measurement points (backplane voltage, thermocouples, and OS-level information), external feedthrough wiring, and recording system. The red circles indicate the locations of thermocouples.
Applsci 15 11203 g001
Figure 2. (a) Thermal cycling profile under thermal accelerated test and (b) acceleration response in X, Y, and Z axes under vibration test.
Applsci 15 11203 g002
Figure 3. Architecture of the proposed dual neural network model for CBM+. LSTM Autoencoder (NN1) for anomaly detection and LSTM network (NN2) for RUL estimation. Blue dots indicate the input data, green color represent the LSTM Autoencoder structure, yellow color represent the LSTM network for RUL prediction, and red dots indicate the outputs.
Applsci 15 11203 g003
Figure 4. Normal-state behavior of the MVME6100 under temperature–humidity accelerated tests: (a) long-term trend of environmental, CPU, and memory temperatures; (b) zoomed-in view of one thermal cycle; (c) output voltage signals (V1 and V2) with fluctuations; and (d) temperature differences between CPU/memory and environment, demonstrating consistent parallel behavior during stable operation.
Applsci 15 11203 g004
Figure 5. CPU usage (%, red, right axis) and CPU temperature (°C, black, left axis) during accelerated testing.
Applsci 15 11203 g005
Figure 6. Example precursor signal behavior before failures: divergence of CPU and memory temperature trends in (a) temperature–humidity test and (b) vibration test.
Applsci 15 11203 g006
Figure 7. Scatter plot of ambient-compensated CPU vs. memory temperatures. Normal operation shows a strong positive correlation; pre-failure shows a different slope.
Applsci 15 11203 g007
Figure 8. Confusion matrix of LSTM-AE using (a) 1 h and (b) 1 day horizons.
Applsci 15 11203 g008
Figure 9. Confusion matrix for lifecycle labeling with Fail class (overall accuracy = 0.9722).
Applsci 15 11203 g009
Table 1. Performance comparison of LSTM-AE and LSTM models.
ModelAccuracy (%)Robustness to Novel Faults
LSTM-AE (1 h window)72.9Limited discrimination, sensitive to short horizons
LSTM-AE (1-day window)90.0Higher robustness; potential to capture unseen faults
Supervised LSTM97.2High accuracy on trained fault modes; poor generalization to novel faults
Disclaimer/Publisher’s Note: The statements, opinions and data contained in all publications are solely those of the individual author(s) and contributor(s) and not of MDPI and/or the editor(s). MDPI and/or the editor(s) disclaim responsibility for any injury to people or property resulting from any ideas, methods, instructions or products referred to in the content.