Article

Real-Time Deep-Learning-Based Recognition of Helmet-Wearing Personnel on Construction Sites from a Distance

1
Research and Development Department, Sefine Shipyard, 77700 Yalova, Türkiye
2
Computer Engineering Department, Kocaeli University, 41001 Kocaeli, Türkiye
3
Digital Forensics Department, The Council of Forensic Medicine (ATK), 34186 Istanbul, Türkiye
*
Author to whom correspondence should be addressed.
Appl. Sci. 2025, 15(20), 11188; https://doi.org/10.3390/app152011188
Submission received: 10 September 2025 / Revised: 30 September 2025 / Accepted: 2 October 2025 / Published: 18 October 2025
(This article belongs to the Section Computing and Artificial Intelligence)

Abstract

On construction sites, it is crucial and and in most cases mandatory to wear safety equipment such as helmets, safety shoes, vests, and belts. The most important of these is the helmet, as it protects against head injuries and can also serve as a marker for detecting and tracking workers, since a helmet is typically visible to cameras on construction sites. Checking helmet usage, however, is a labor-intensive and time-consuming process. A lot of work has been conducted on detecting and tracking people. Some studies have involved hardware-based systems that require batteries and are often perceived as intrusive by workers, while others have focused on vision-based methods. The aim of this work is not only to detect workers and helmets, but also to identify workers through labeled helmets using symbol detection methods. Person and helmet detection tasks were handled by training existing datasets and gained accurate results. For symbol detection, 14 different shapes were selected and put on helmets in a triple format side by side. A total of 11,243 images have been annotated. YOLOv5 and YOLOv8 were used to train the dataset and obtain models. The results show that both methods achieved high precision and recall. However, YOLOv5 slightly outperformed YOLOv8 in real-time identification tests, correctly detecting the helmet symbols. A testing dataset containing different distances was generated in order to measure accuracy by distance. According to the results, accurate identification was achieved at distances of up to 10 meters. Also, a location-based symbol-ordering algorithm is proposed. Since symbol detection does not follow any order and works with confidence values in the inference mode, a left to right approach is followed.

1. Introduction

Wearing a helmet is one of the most vital safety requirements on construction sites, such as in ship-building and general construction, where mortal or permanent injuries occur more frequently than in other industries. For this reason, labor safety personnel meticulously monitor helmet-usage violations in front of a screen or on the ground with the human eye. Recently, many works have been studied on image-based helmet detection systems using artificial intelligence in order to detect such violations. This part of the problem appears to be solved, however, the challenge of recognizing the identities of helmet-wearing workers has not yet been addressed.
For safety reasons, it is very important to manage construction sites, especially those covering large areas and involving industrial companies, by controlling unauthorized access to different parts of the site and ensuring the whereabouts of personnel are known in case of an accident. Employee loafing is also a separate problem that requires monitoring. For instance, Sefine Shipyard has around 8000 workers and over 200 acres of construction area to be controlled. At this scale, worker safety and personnel tracking without disturbing them are two main concerns that can be handled autonomously through cameras already installed on site.
Between 2003 and 2010, 25% of all construction fatalities in the United States occurred due to traumatic brain injury [1]. According to the U.S. Occupational Safety and Health Administration, the most frequently violated regulations in 2017–2018 involved not using personal protective equipment [2]. It was found that 67.95% of workplace accidents that occurred in China between 2015 and 2018 were due to a helmet not being worn [3]. According to another statistic, in 47.3% of accidents at work sites, the victim was either not wearing the equipment at all or not using it properly [4]. Also, studies show that properly using helmets can reduce severe brain injury by up to 95% [5].

1.1. Hardware-Based Helmet Detection and Worker Identification

In order to mandate the use of helmets, many different solutions have been studied. First of all, some solutions involve installing sensors on the helmet and receiving signals from them. However, these are perceived as intrusive by many workers, as well as physically uncomfortable [6].
In [7], general personal protective equipment is monitored at the front gate of construction sites using passive RFID tags. However, reading errors occur when workers pass rapidly through the gate or do not stop.
In [8], a Zigbee transmitter and an RFID are attached to a micro-controller-based device on a helmet that sends a signal indicating if the helmet is properly worn or not. This approach is considered as intrusive by workers, and the RFID tag reader range is quite short. Also, battery life is another important issue to take into account in this approach.

1.2. Visual-Based Helmet Detection

In [6], three artificial intelligence models are proposed to detect hard-hats and vests using three different deep learning approaches with images collected online. In the first approach, the algorithm detects workers, hard-hats and vests, and then a machine learning model is used to verify whether each detected worker is wearing a hard-hat or vest. In the second method, detection and verification are simultaneously applied using a single convolutional neural network (CNN). Lastly, workers are searched on an input image and cropped from the image individually. Afterwards, a CNN-based classifier is used to detect hard-hat or vest existence from the cropped images. The second approach has the best performance, with a 72.3% mean average precision (mAP), and works with 11 frames per second on a standard computer, making it fast enough to run as a real-time application.
In [9], different versions of You Only Look Once (YOLO) architecture are used to detect helmets. The YOLOv5x architecture outperforms YOLOv3, YOLOv4 architectures, with 92.44% mAP for smaller objects and low-light images. However, helmet-like circular objects and obstacles in front of helmets are issues that must be handled.
In [10], 3261 images are collected and trained by a CNN-based SSD-MobileNet algorithm. According to the results, the generated model is able to detect helmet violations, as it focuses mainly on real-time detection and speed. However, problems occur with the model if helmets are far from the camera or background complexity is high.
In [11], vests and four different-colored helmets are detected using different YOLO architectures including YOLOv3, YOLOv4 and YOLOv5. A dataset is generated consisting of 1330 images with varying backgrounds, gestures, angles and distances. While the YOLOv5s model has the fastest speed, with 52 fps, the YOLOv5x model has the best mAP, with 86.55%. However, wrong helmet color predictions occurred as well, as green T-shirts were identified as vests. Also, small-instance detection from a relatively long distance is another problem, especially for large objects that are visible in close range.

1.3. Face-Based Identification

In order to match violations to the correct people, facial recognition methods have been tried. Since 1964, many studies have been conducted to recognize faces [12]. The deepface method with a social network has a recognition performance of human faces of 97%. It uses a nine-layer deep neural network to derive face representation from a dataset of 4 million facial images belonging to 4000 people [13]. Using 200 million facial images, FaceNet trains with deep neural networks by utilizing a triplet loss function at the last layer, consisting of two matching facial patches, a non-matching facial patch, and the loss for face verification [14]. For face recognition, a supervision signal named center loss is introduced in [15], learning for a center for deep face features for each class, as well as decreasing the distances between the features and matching class centers. As a result, the discriminative power of face features is enhanced and the variation problem in the intra-class feature is decreased. This study is the first attempt to use a loss function to ease convolutional neural network supervising. In [16], a center-invariant loss function is introduced. This function aligns the center of each individual to the deep learning facial features in order to generalize representations for all people. Therefore, highly imbalanced training data can be used to separate feature spaces for all classes. In [17], a novel feature transfer learning approach is proposed for under-represented classes. The study emphasizes that generic face recognition methods include classifier bias because of the imbalanced distribution of training data. The proposed method enhances the feature space of the under-represented classes without losing identities.
For long-range facial recognition, there are several constraints affecting performance, such as camera quality, lighting, and face pose. To cope with such problems, facial restoration models have been proposed using low-quality and high-quality face image pairs generated by augmentation methods [18]. In [19], images taken up to 4.2 m away are used for deployment on resource-restricted applications such as embedded devices or mobile phones. A knowledge distillation method has led to an effective and efficient face recognition model.
There are also other constraints of identification by face recognition that should be thoroughly considered. The face recognition algorithms do not work properly when people change their make-up or wear items such as glasses, or if they have beards or moustaches [12,20].

1.4. QR-Based Identification

In order to recognize people, another method might be to use QR (quick response) codes, which have become an increasingly popular and widely adopted technology in recent years, with numerous applications across various industries, from retail and logistics to healthcare and entertainment. Putting QR codes on helmets or vests and reading them could be a possible solution. QR codes have evolved from the traditional one-dimensional bar-codes, which were primarily used for product tracking and inventory management, to a more versatile and information-rich two-dimensional code that can store and convey a wide range of data. The QR code reading distance is studied in [21]. It is shown that a QR code with a size of 10 cm × 10 cm can be read up to 300 cm away. In the study, the maximum scanning distance changes linearly with respect to QR code size. If the angle of the image containing the QR code is below 45 degrees, then QR code scanning is not practically usable.

1.5. Traffic Signs and Symbol Detection

In this study, an identification method of traffic sign recognition is used by placing symbols on helmets in a combination. There have been many studies about traffic sign recognition using traditional machine learning techniques and deep learning approaches, especially for autonomous driving.
To detect and recognize traffic signs in India, convolutional neural networks and a Viola–Jones structure were used together, even when non-standard signs were present [22]. Thirty classes from a road sign dataset were used for training and testing. Instead of using Viola–Jones or CNN independently, the proposed combined method, with better accuracy, was introduced because it has the capacity to detect multiple signs in the same frame.
In [23], a dataset composed of high definition (HD) images containing 200 different traffic signs was trained with YOLOv3, YOLOv4 and TinyYOLO deep learning approaches, and a region-of-interest based approach is introduced. It is shown that the YOLO architecture allows for real-time and large-scale traffic sign detection and recognition, and the region-based approach can improve performance for full HD images.
In [24], YOLOv5 and a modified CNN model are used to identify traffic signs on a German traffic dataset. It is observed that YOLOv5 makes more miss-classifications because of resolution and blurring, while the modified CNN does not classify such images at all, and does not make mistakes. The model has 95.8% accuracy, while YOLOv5 has only 84.8% accuracy, but is faster.
In [25], a refined version of Mask R-CNN is introduced, improving architecture and data augmentation and refining parametric values, while a customized dataset is generated for training and validation. It is observed that false-negative (FN) and false-positive (FP) rates are decreased, meaning that the possibility of missing a sign is lower, as well as the possibility of detecting a non-visible sign. The 3% error rate is due to traffic sign similarities, occlusions and wide angles.
In [26], 12 challenging conditions are studied in the context of traffic sign recognition using two top CNN-based algorithms selected from the VIP CUP traffic sign detection contest. The algorithms, including UNet, ResNet, VGG and GoogLENet architectures, use separate CNNs for localization and recognition processes. While codec error and exposure degradation are the worst conditions, the shadow condition gives better results. Different weather conditions such as snow, haze and rain have a 48% performance drop. It is shown that the conditions are related to distinct spectral patterns and they can determine detection performance under challenging conditions.
In [27], attempts are made to identify various shapes that are processed into 9 × 9 matrices. The images of these shapes, placed in a square box, are first converted to grayscale and then reduced to binary values with a certain threshold. Finally, features are extracted and matched.
Also, in the process of this study [28], it is shown that some symbols can be used to identify people from a distance using only synthetic data generated in the Blender animation and drawing program. Unlike the dataset, which is artificial, high precision and recall values are obtained.
As the papers suggest, symbols similar to traffic signs can be effectively detected at a distance through popular deep learning approaches as long as camera resolution, lighting and angles allow.

1.6. Human Detection and Tracking

The research in this paper suggests human, helmet and symbol detections, respectively, in order to ease the person identification process. Also, for intelligent surveillance systems, human detection is crucial.
The Histogram of Oriented Gradient (HOG) was the first human detection study [29]. In the study, the Sobel operator extracts the gradient in the image, and then histograms are determined. The method gives accurate results but it cannot be used for different human poses and requires a long processing time.
In [30], CNN and a feature-based layered classifier are combined to improve the real-time detection of people. The proposed method makes a 80% reduction in the number of objects CNN needs to process. Since CNN is computationally expensive and very slow, the layered classifier as a pre-filter increases speed by 15 times in trade for a 4% reduction in recall rate.
In [31], since objects that are far from the camera are not easily detected by deep learning methods, a method involving dynamically adjusting a threshold based on image geometry was proposed. This approach increases the F-score by an 11% compared with YOLO alone.
In a closely related study by [32], the YOLOv5s object detection model was integrated with the StrongSORT tracking algorithm for the real-time monitoring of helmet usage using multi-object tracking. According to comparative experiments, the YOLOv5s model is the most suitable option in terms of speed and detection precision. Also, StrongSORT has a faster processing speed than DeepSORT, and the target ID will not be lost or switched due to problems such as long-term occlusion and large changes in motion scale, amongst other reasons.
In [33], to recognize multiple construction activities, a method combining object detection and person re-identification is used. Two YOLOv5 models are trained using custom datasets: one for detecting construction activities (727 images, 10 categories), and another for estimating workers’ postures and orientations (2546 images, 16 categories). The models give high accuracy, with mAP scores of 0.961 and 0.898, respectively. Also, a re-identification model is used, involving color, clothing, silhouette, pose, and other visual cues. The model is trained on 5455 images, reaching perfect performance.
To sum up, there are persistent challenges in existing approaches: QR code–based systems suffer from sensitivity to angle and distance; facial recognition-based methods are hindered by variations in distance and changes in appearance; and hardware-based sensor solutions are often found intrusive by workers and limited by their dependence on batteries. These limitations point to the suitability of remote, passive sensing as a more practical alternative. Taking advantage of the mandatory use of helmets on construction sites, we propose placing sufficiently large symbols on helmets and exploiting the existing site cameras to enable reliable worker recognition and tracking. This approach not only solves the shortcomings of previous methods but also offers a scalable, non-intrusive, and cost-effective solution for enhancing safety monitoring in construction environments.
As the recent given solutions mostly use deep learning approaches, we adopted these methods to detect symbols. After successfully detecting symbols and matching the detected symbols to our database to identify a worker, a sequential video processing can be applied, as in [32], where the tracking stage processes frame sequences to maintain consistent worker identifications over time.
In this study, the main contributions are as follows:
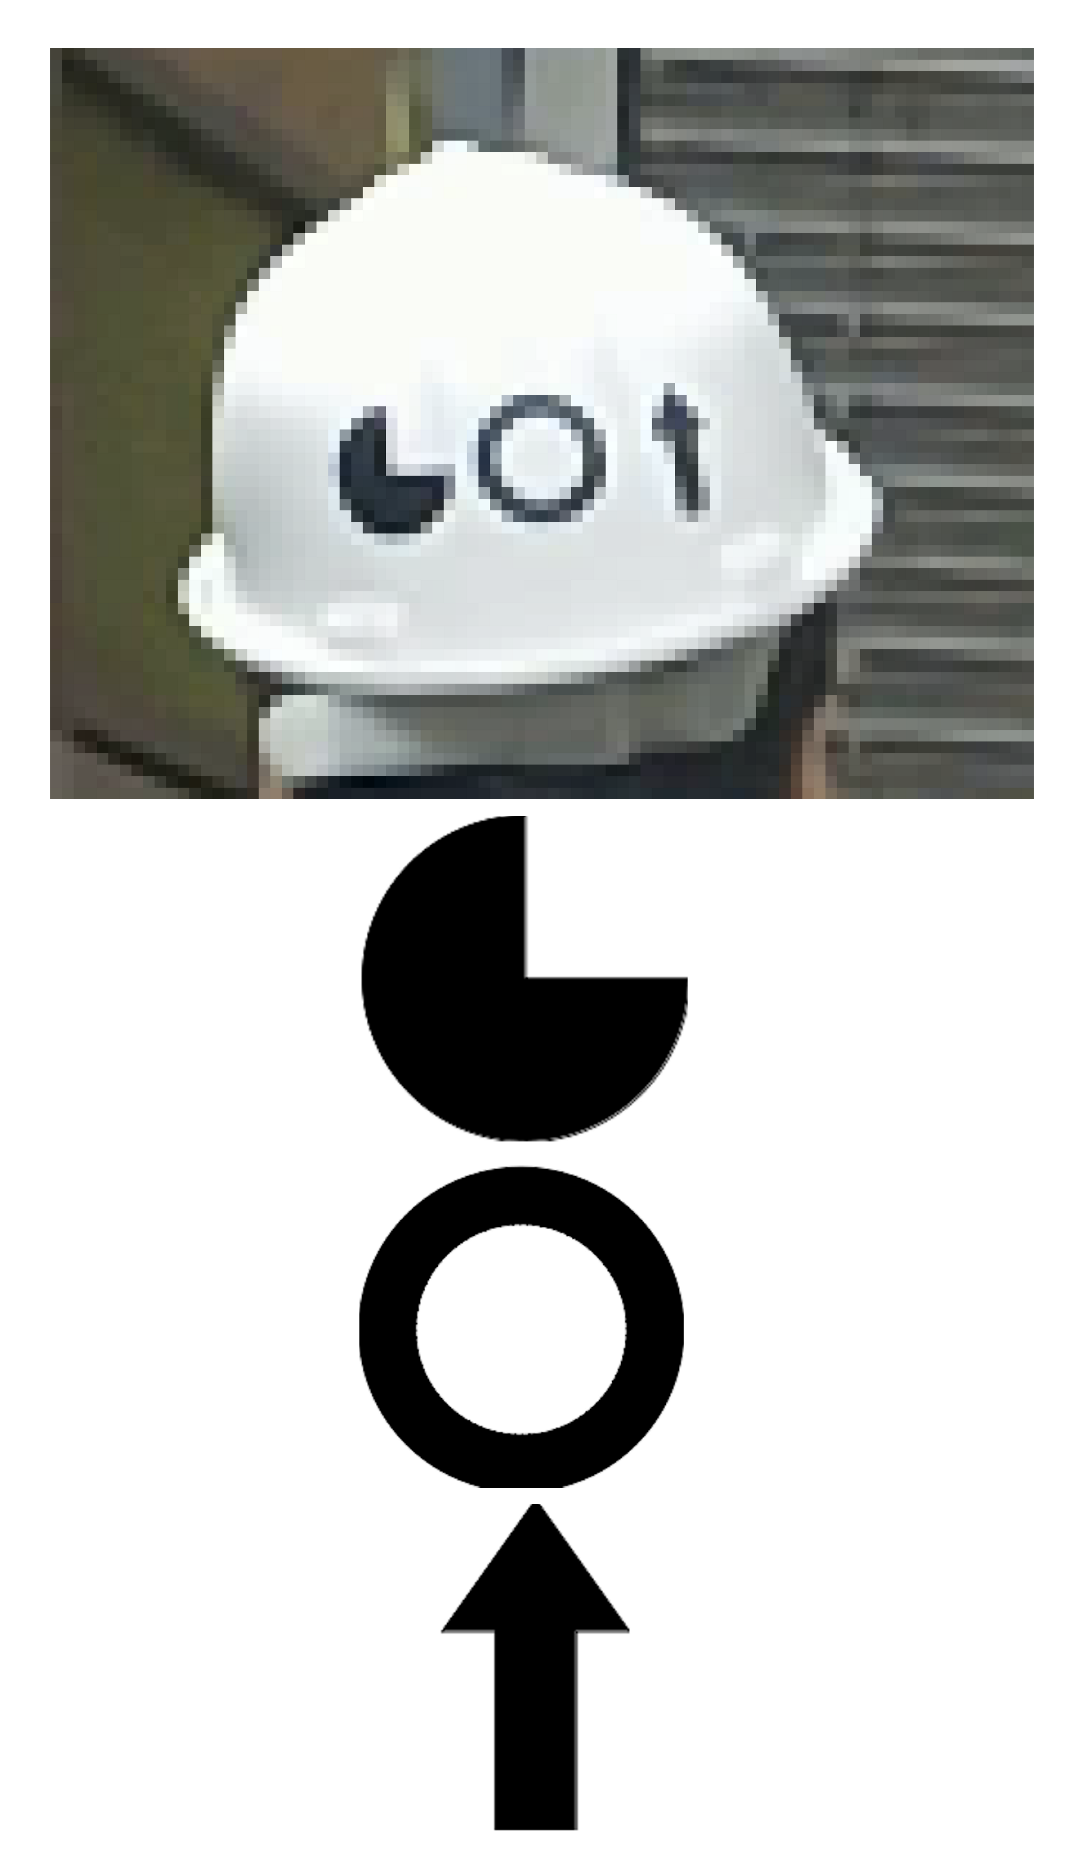
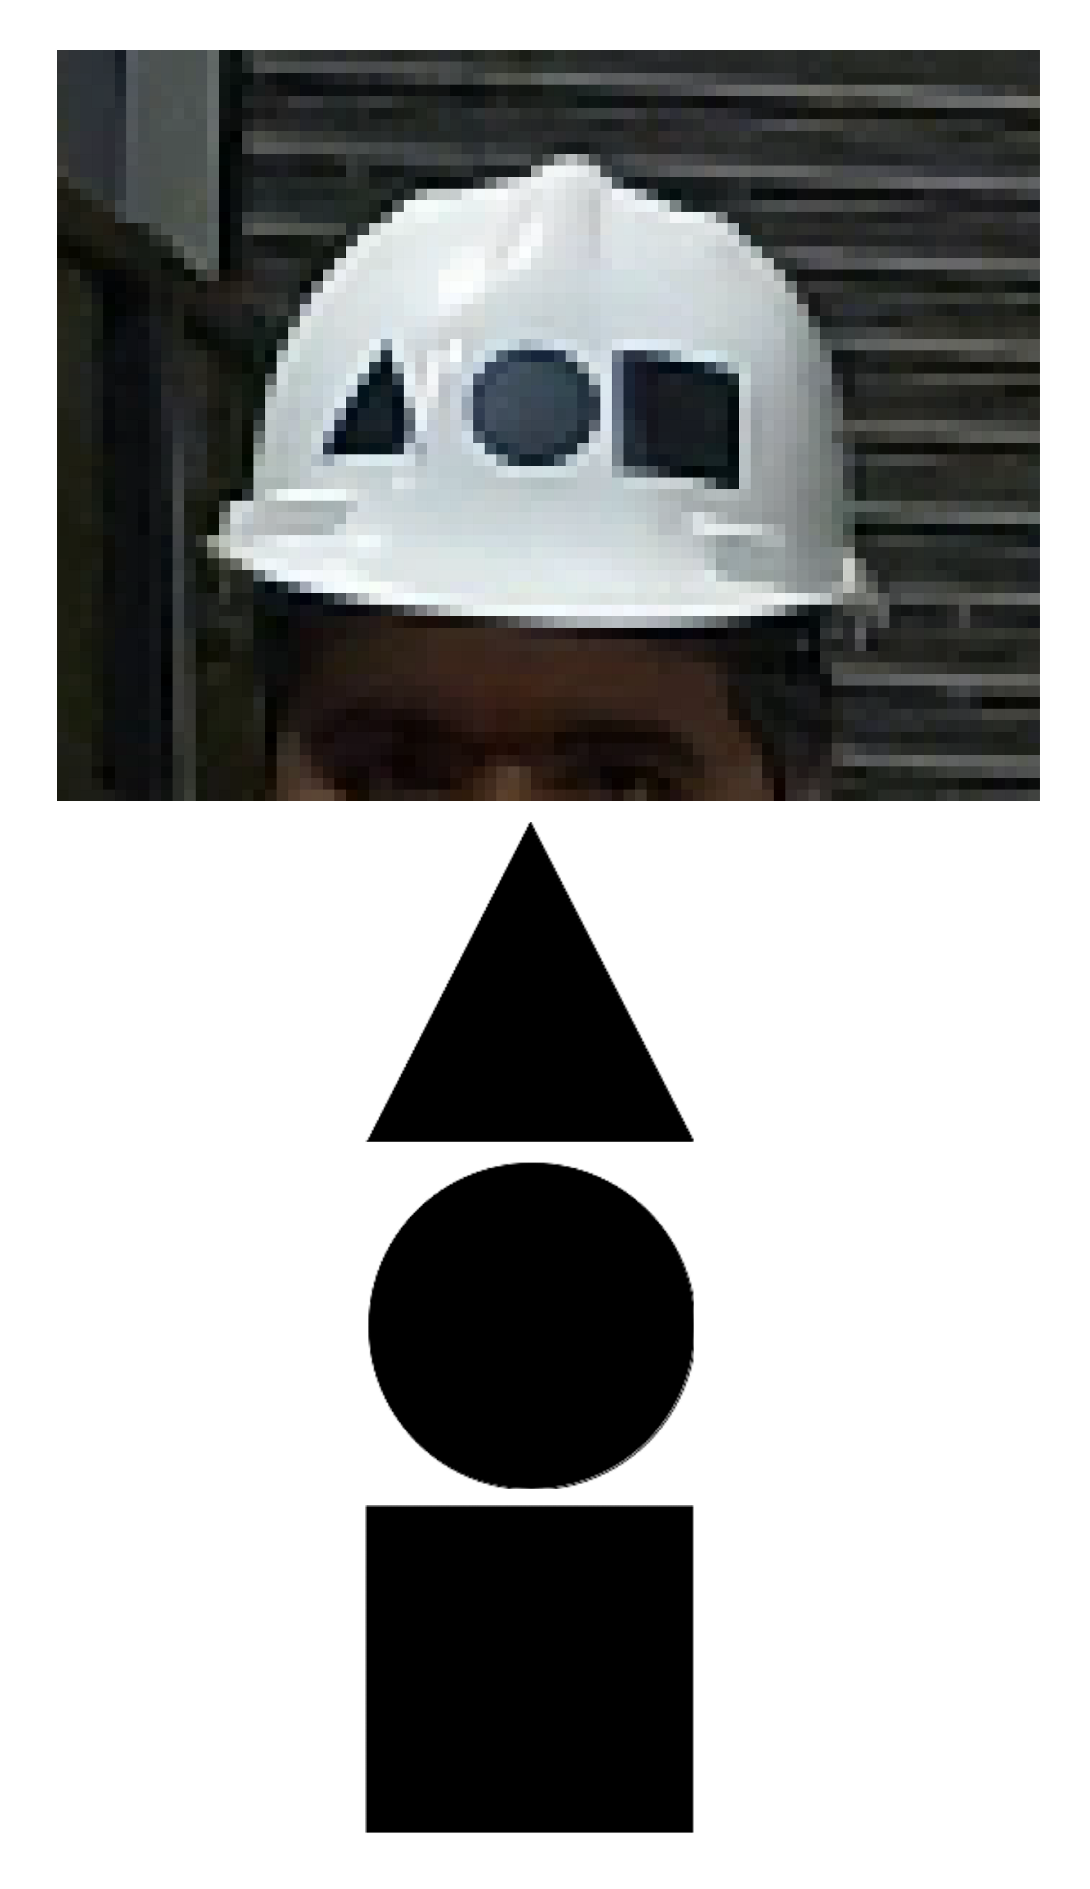
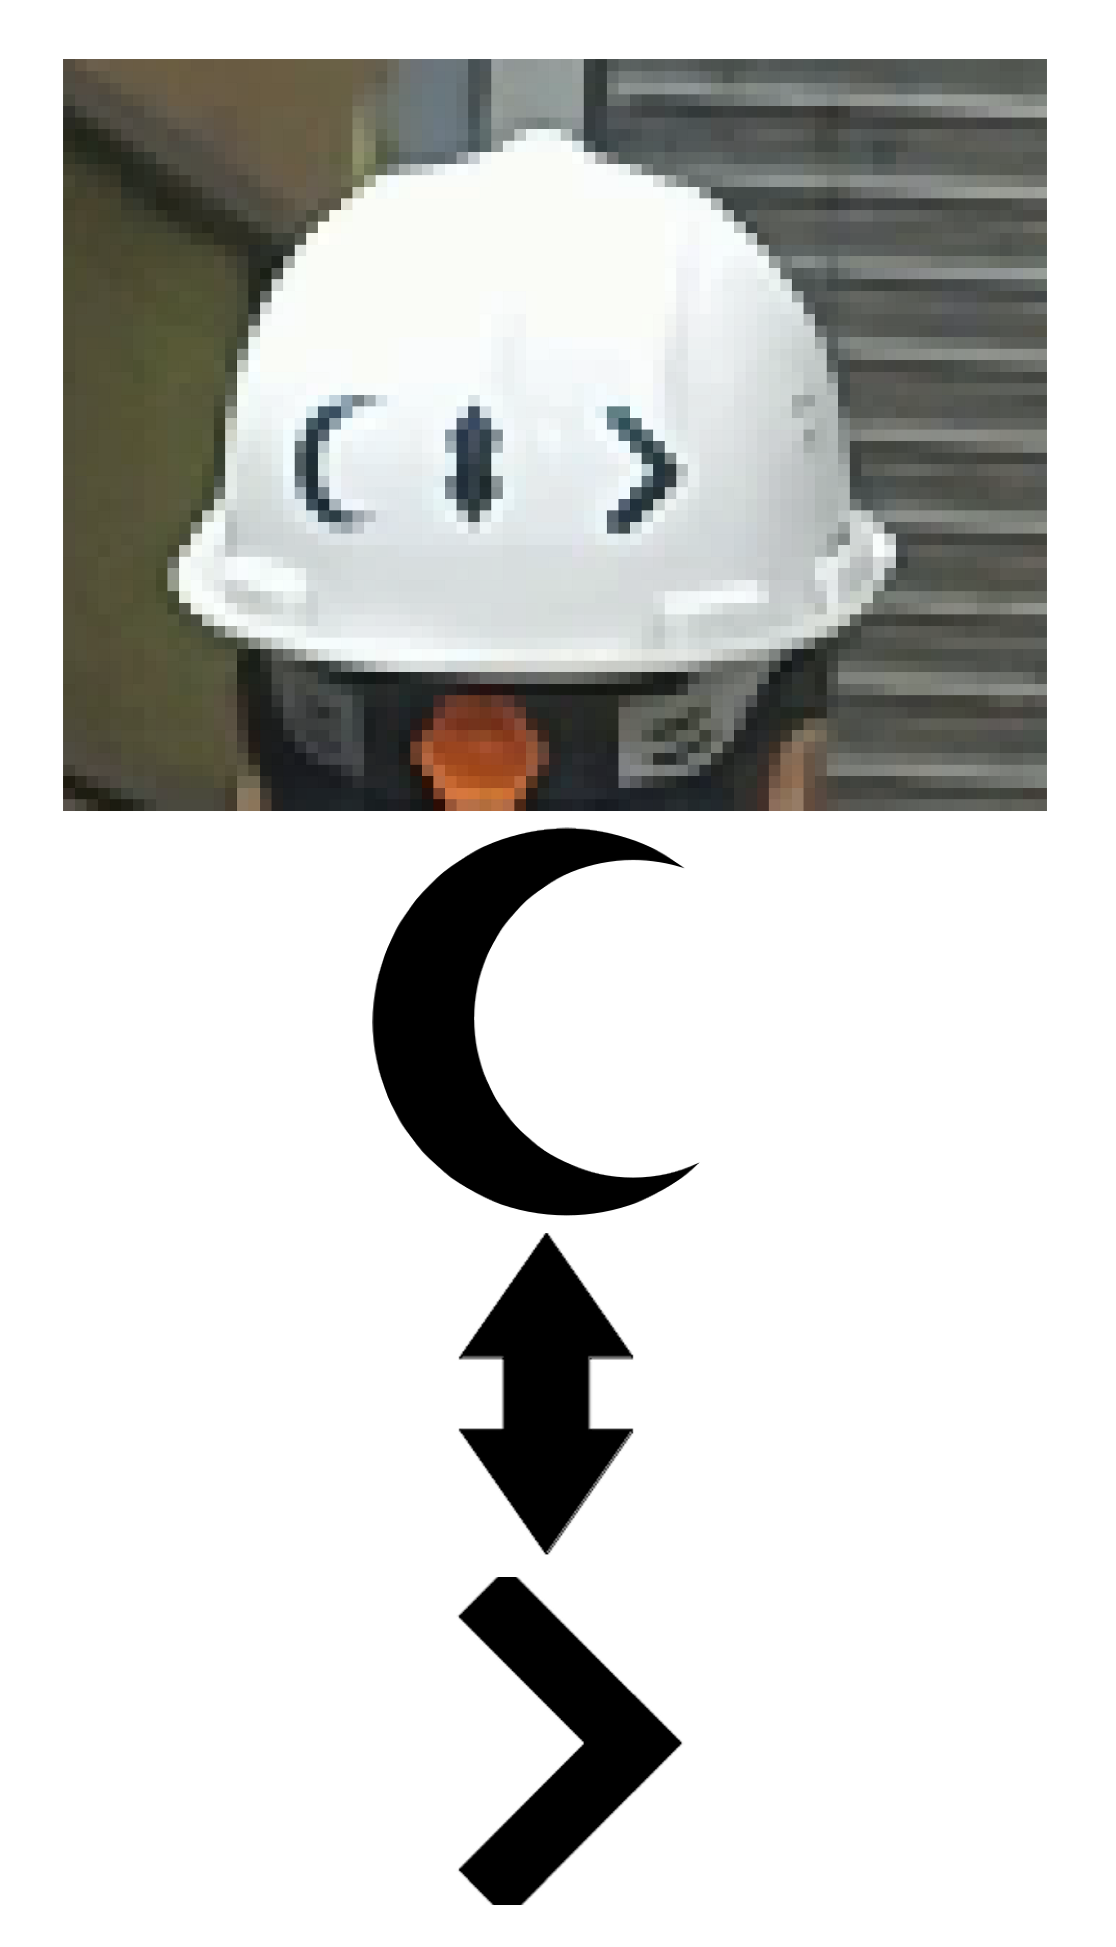
  • In the first place, publicly available datasets are trained from personnel and helmets and mini boxes from images are generated in order to look for symbols that constitute the identity of a worker.
  • For symbol recognition, 14 distinguishable different symbols are generated and put on helmets in different combinations. For that purpose, 11,243 images are taken from a construction site and annotated.
  • Then, personnel, helmet and symbol datasets are trained with two methods of YOLOv5 and YOLOv8 with different hyperparameters in order to compare results.
  • A location-based symbol ordering algorithm is proposed. Since symbol detections do not follow any order and they work using confidence values in the inference mode, a left to right approach is followed.
  • A testing dataset containing different distances is generated in order to measure accuracy by distance. According to the results, up to 10 m accuracy was obtained for recognizing three symbols per helmet.
  • There is not a feasible solution for worker safety and tracking systems at construction sites except some hardware-based means that involve battery and management issues. This study primarily suggests passive symbol detection without any installation on workers using already placed cameras.
The following sections are organized as describing datasets, introducing convolutional neural networks and YOLO, determining symbols, explaining the proposed method, and showing the results of training and testing.

2. Material and Methods

2.1. Datasets

To achieve worker identification, any person is searched for, first in images coming from surveillance cameras. For each detected person, a local search is performed to look for a helmet in the rectangle area of a detected person. If a helmet is found in the rectangle of a person, and then a second local search is conducted to find the pre-trained symbols. In order to achieve such a goal, three datasets are needed to train the deep learning algorithms. They are the personnel, helmet, and symbol datasets described in the upcoming sections.

2.1.1. Personnel Dataset

A recent dataset was utilized for detecting people, consisting of 5483 images sourced online. This dataset includes a single class labeled ‘Persona’ and features diverse real-life backgrounds [34] as seen in Figure 1a. It should be noted that a dataset with construction site backgrounds can be automatically obtained using the model trained with the referenced dataset.

2.1.2. Helmet Dataset

A global dataset [35] containing 7035 images is used and trained with deep learning algorithms. Although the dataset includes three classes (i.e., person, head, and helmet), only the helmet class is taken into account for detection purposes. This dataset is chosen because it includes construction site backgrounds and is well-suited to a shipyard environment as seen in Figure 1b.

2.1.3. Symbol Dataset

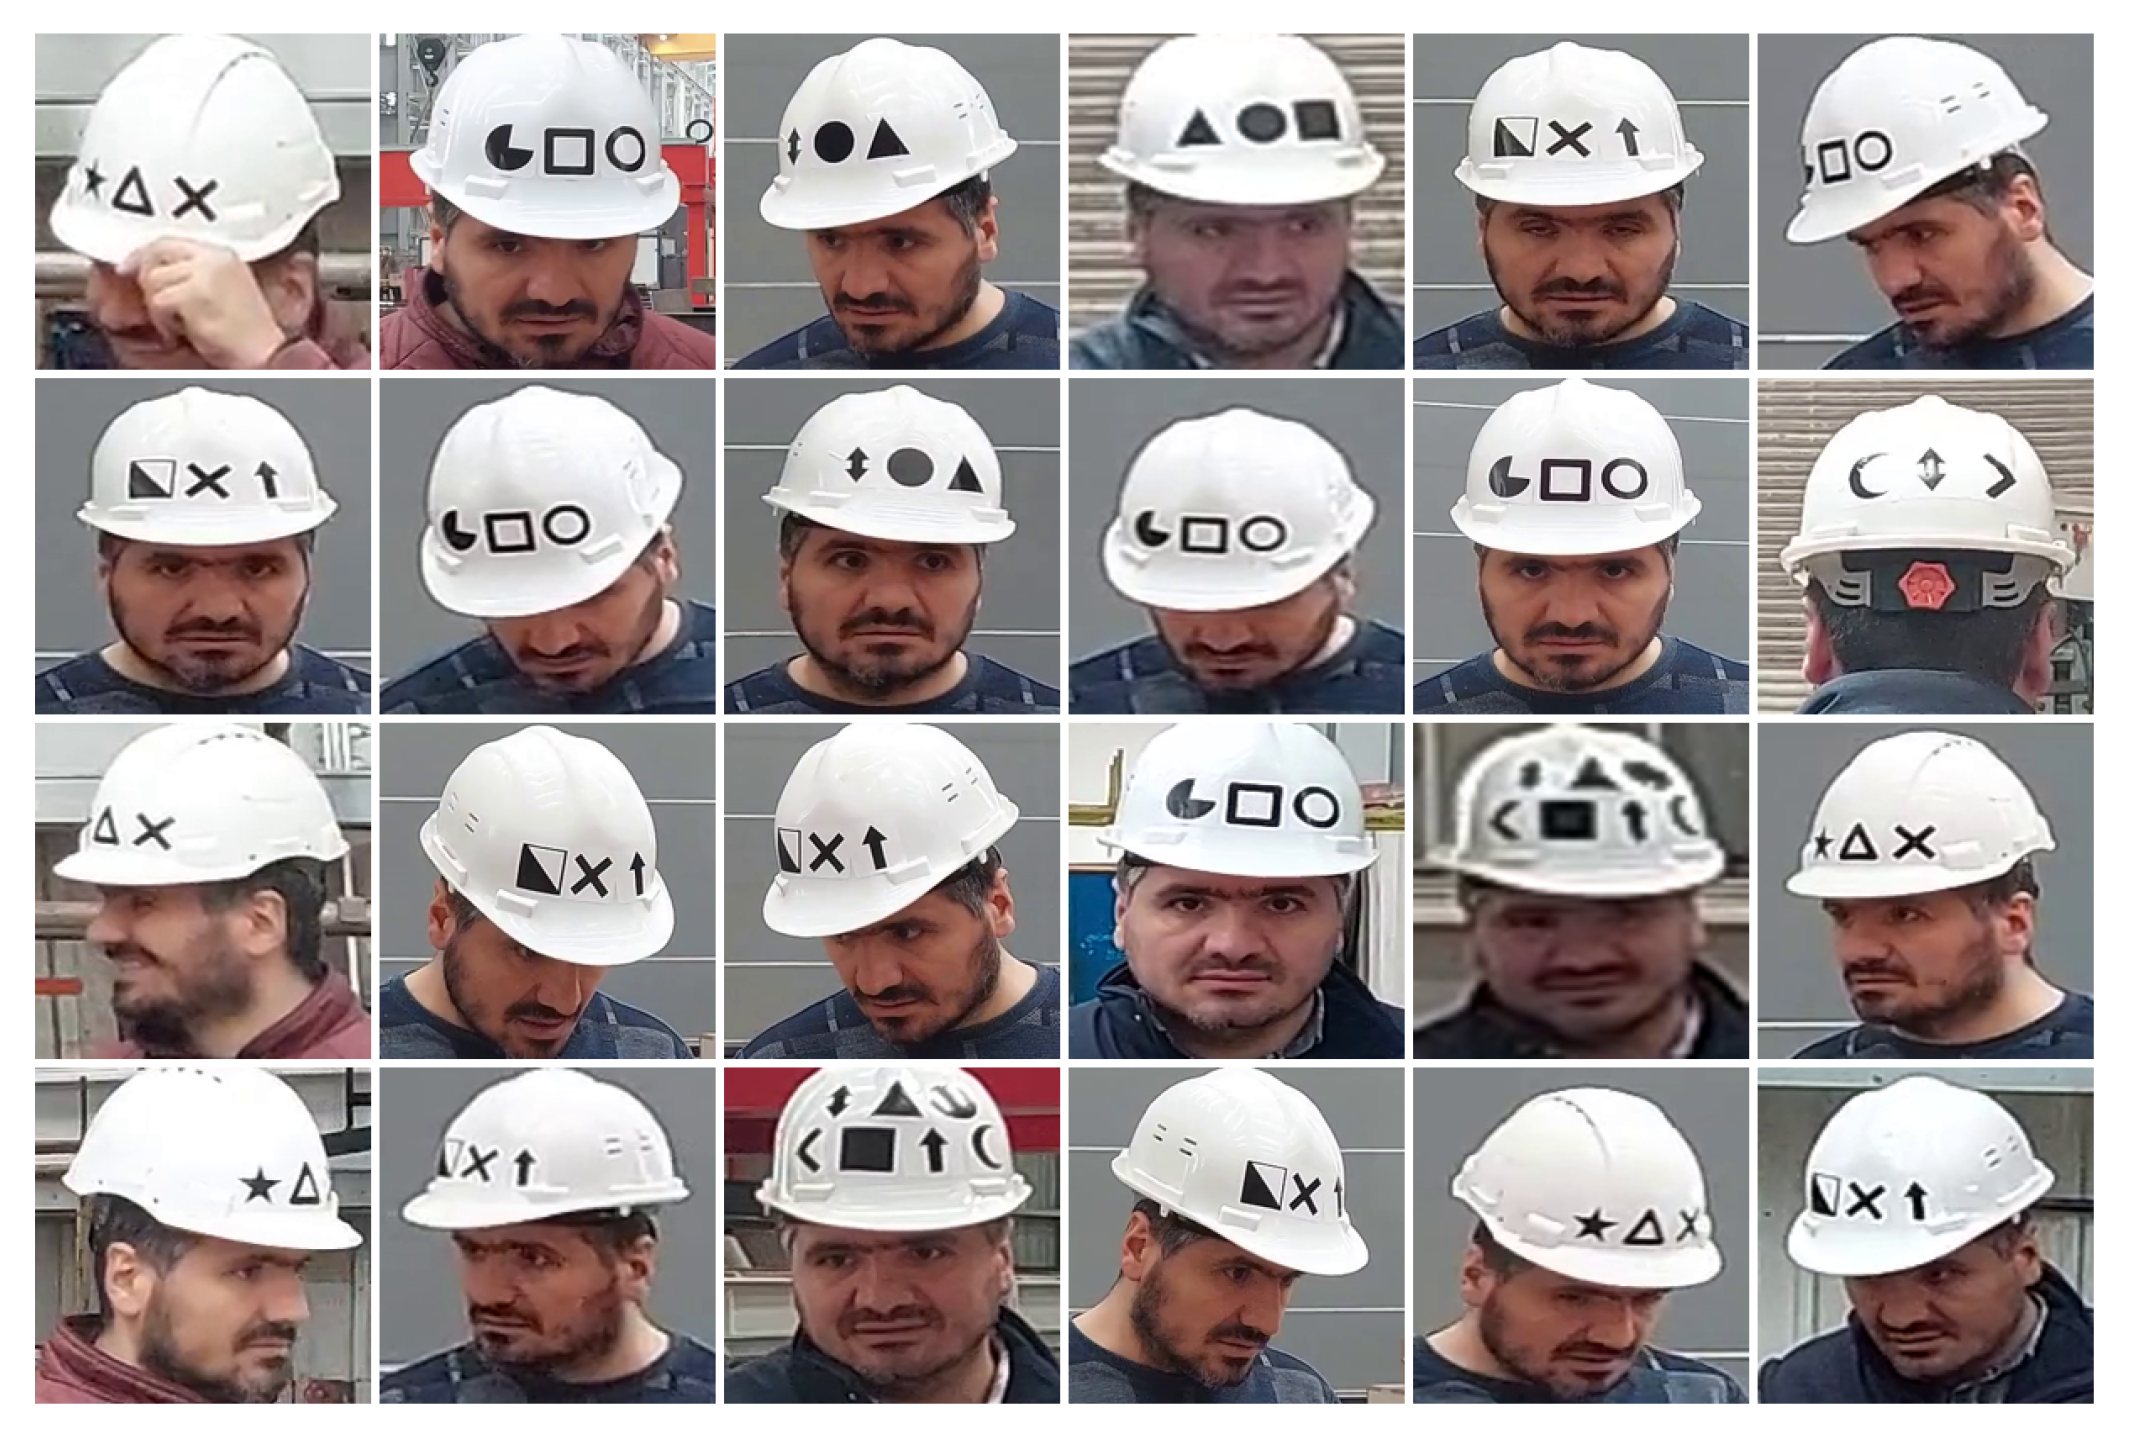
Using the 14 proposed symbols mentioned below, a novel dataset is generated taking images from a construction site. It contains 11,243 labeled images, containing at least two symbols visible on helmets, as seen in Figure 2. The dataset is divided into 30% validation and 70% training.
All of the images are taken in the daytime. Most of them are from a hangar in Sefine shipyard, and some are completely outdoors. The shooting angles are taken from the front of the helmet, as the symbols are positioned on the front.
At the beginning of data collection, these symbols were placed on a helmet-like shape in Blender 3.0 animation and drawing software and an artificial dataset of symbols from different angles and scales was generated as mentioned in [28]. After training on the artificial dataset with deep learning methods, real-time data collection was conducted.
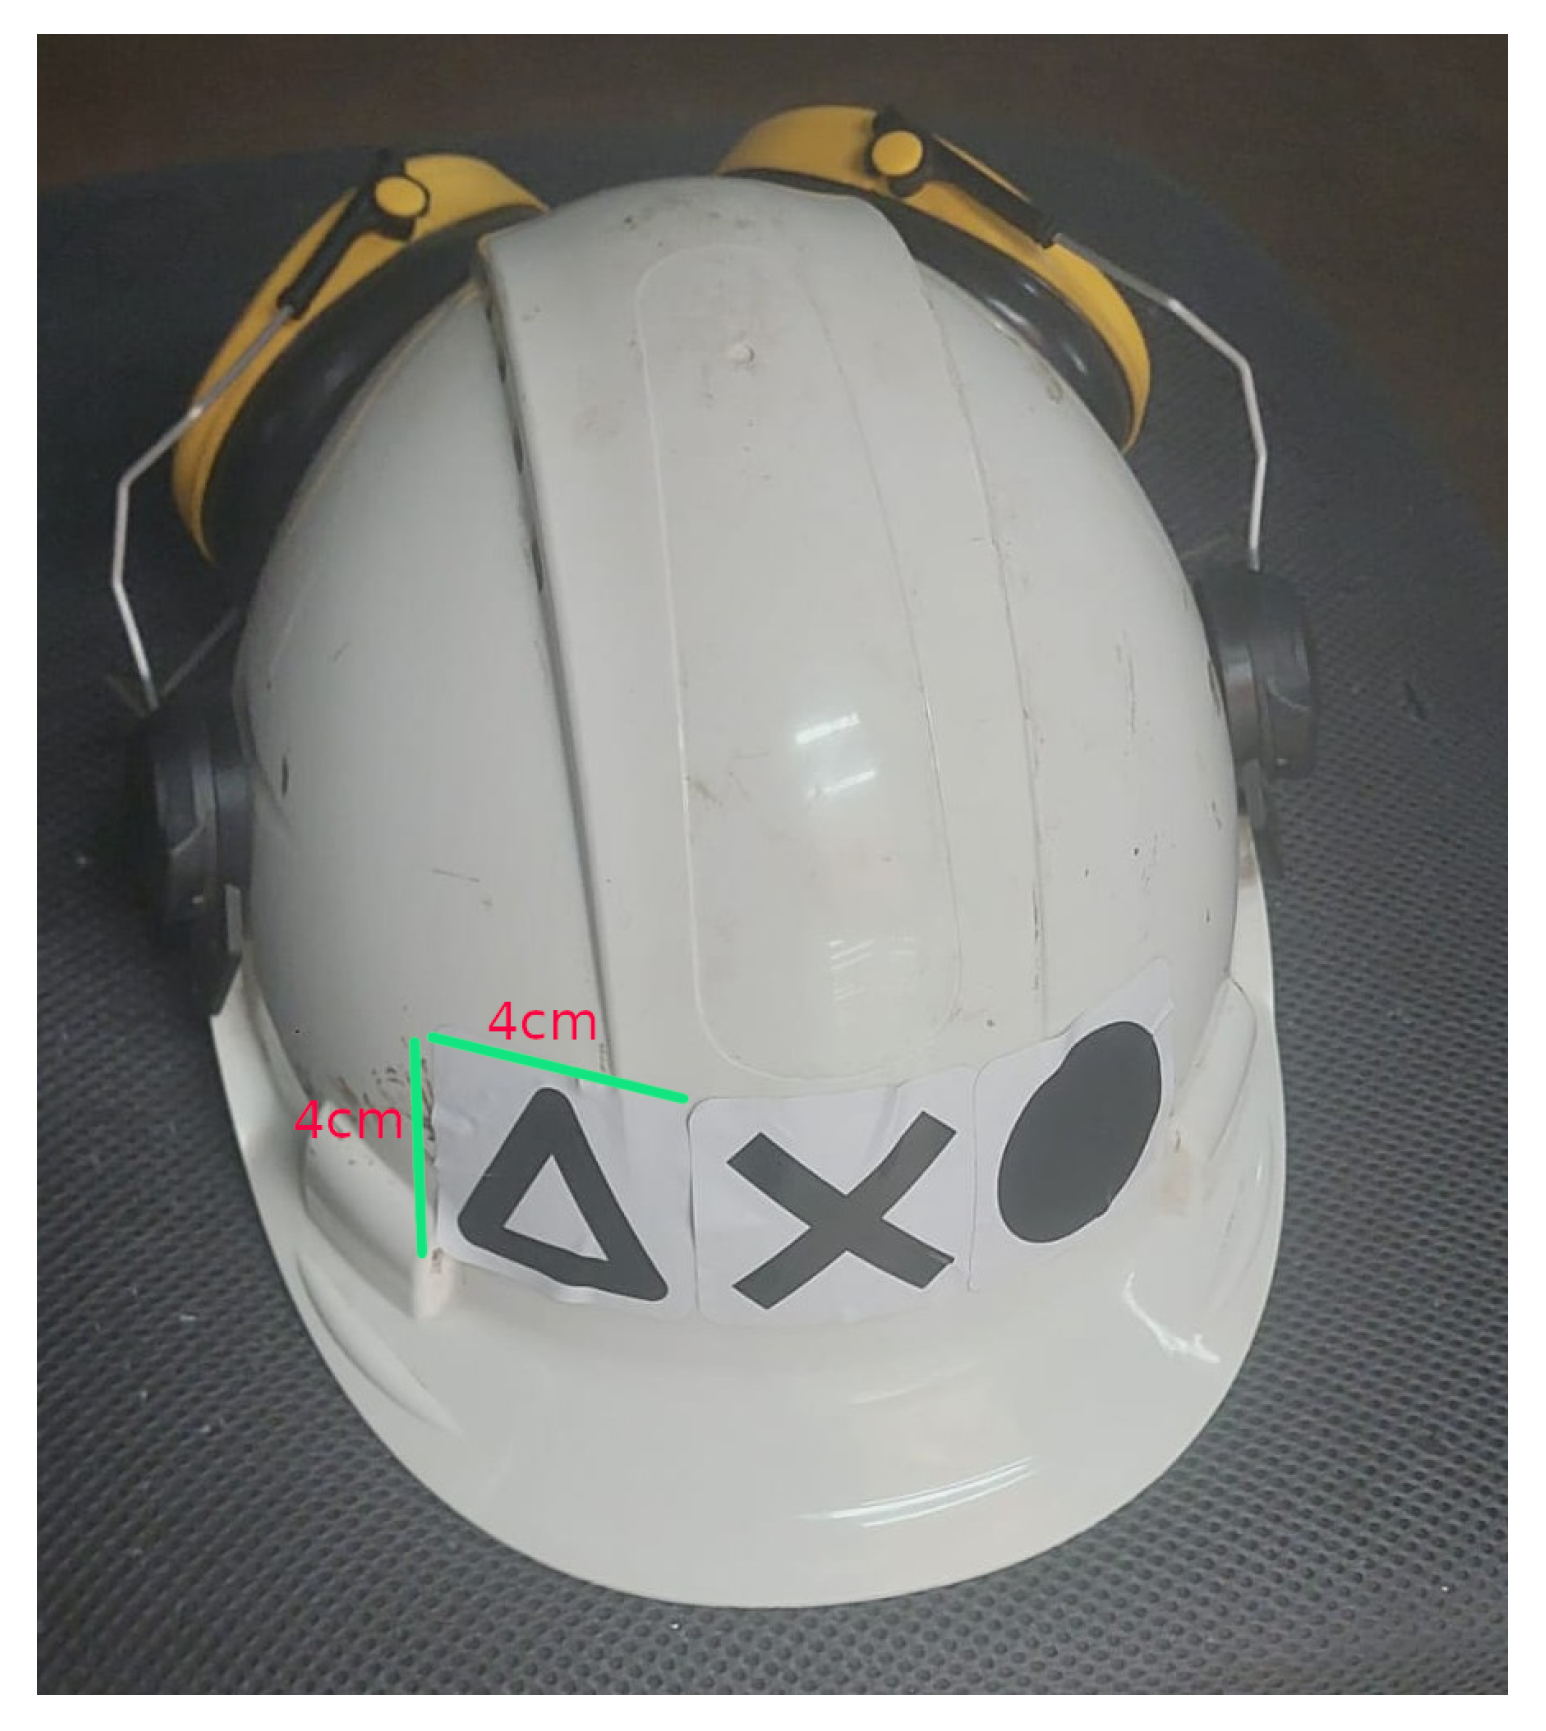
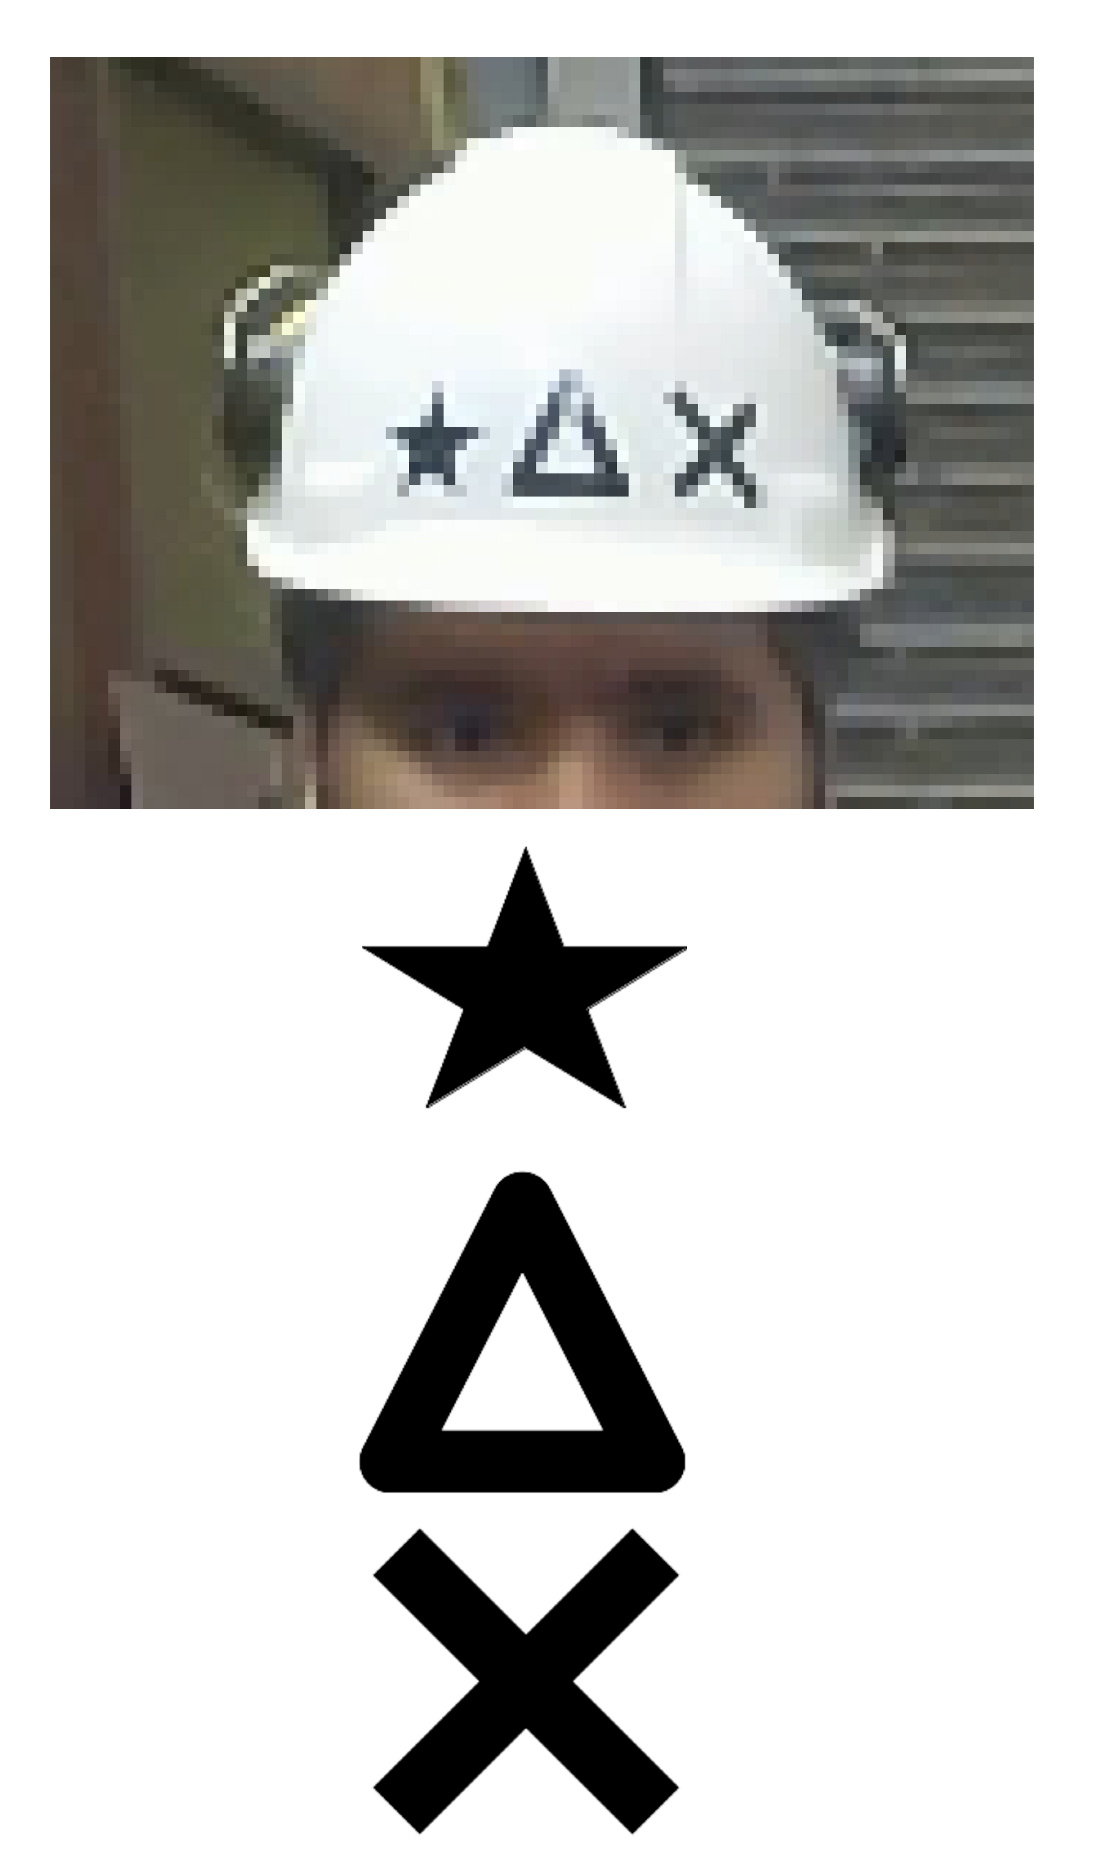
The symbols were printed as adhesive labels in a print shop and placed on the helmets in various combinations, as seen in Figure 3. Three symbols were designed to be arranged in a single row. The symbols were affixed in such a way that they appeared upright when viewed from the front.
The sticky labels of the symbols placed on helmets were 4 cm × 4 cm (height × width) and could be enlarged or reduced as desired. Obviously, increasing size will have a positive effect on distance accuracy.
All of the training symbol dataset was collected using a phone camera which has specifications of 64 megapixel resolution, f/1.8 aperture, 26 mm wide lens, 1/1.7′′ sensor size, and 0.8 µm pixel size.
Furthermore, the work in this study intends to identify people from a distance. To evaluate distance accuracy, five different helmets are used with different symbol combinations. Each helmet represents a specific person and has three symbols in different combinations. For each helmet, 11 videos with different distances are produced with the range from 5 m to 15 m at 1 m intervals.

2.2. Deep Learning

In the last decade, deep learning methods have emerged as a powerful tool in machine learning, especially in the fields of computer vision and object recognition. As the most established deep learning technique, convolutional neural networks (CNNs) apply many convolutional layers to extract relevant features from images using the spatial structure of images. A CNN composed of many neural nodes working together based on linear regression was used, followed by some activation functions [36,37]. It is worth briefly mentioning CNNs here.

2.2.1. Convolutional Neural Networks

While the CNN is briefly visualized in Figure 4, an input image composed of pixels is taken to extract its characteristics, like edges, textures, or patterns, in the convolutional layer to consruct a set of filters called kernels. The kernels slide over the input image, performing element-wise multiplication and summation to produce a feature map. Each filter captures specific features, such as horizontal or vertical edges, depending on its weights. The convolutional layer reduces the input dimensions while preserving spatial relationships, making it effective for visual tasks like image recognition. In this layer, it is expected that the feature map will be made bigger and the most effective object-description filters will be discovered by using weight sharing, striding, and padding [37].
In the pooling layer, the dimensionality of the feature maps is reduced without losing the most important information about the input picture. A filter such as maximum, minimum, or average is applied to the input image by sliding it accross the data to reduce the complexity of the upper or previous layers. This reduction in dimensionality not only decreases the number of parameters and computational load in subsequent layers, but also helps control overfitting by providing a more abstracted form of the representation [37]. Additionally, pooling layers contribute to the model’s robustness against small translations or distortions in the input data, as the exact position of features becomes less critical [39].
After pooling reduces the spatial dimensions of the feature map and preserves only significant information, the activation function applies an element-wise transformation to the output. By applying an activation function, the network keeps possession of critical non-linear patterns before passing the transformed features into the next layers. The most frequently used activation functions are Rectified Linear Unit, sigmoid, and hyperbolic tangent functions.
The fully connected layer connects every neuron into every neuron in the previous layer. It is the final stage in CNNs. Each neuron in this dense layer computes a weighted sum of all its inputs from the previous layer and adds a bias term. Using dropout or weight decaying techniques, it reduces the over-fitting problem.
The final classification is achieved in the output layer. Some loss functions are used to calculate the predicted error of the training data. The loss functions vary across different problems. According to the error, the disparity between the actual and predicted outputs is shown.
Also, back-propagation is a CNN training procedure calculating an error value using the output value of the previous layer. According to the error value, weights are repeatedly calculated [37].
There are many architectures of CNN which have a number of improvements on CNNs. VGG-16, Resnet, and Inception are commonly used for classification tasks, while R-CNN, Fast R-CNN, Faster R-CNN, YOLO, SSD, EfficientNet, and RetinaNet are well-known CNN-based detection architectures. In classifications, exactly one label is assigned to the whole image, in contrast with detections, where bounding boxes are drawn around objects within images [40]. In fact, the object detection problem includes a classification task after identifying a bounding box in order to label it. Within this scope, there are two types of object detection algorithms: one-stage and two-stage.
The two-stage object detectors first propose regions called Regions of Interest (ROI) and then classify the objects inside those regions by selecting the most possible ROIs and discarding less possible ones [41]. RCNN, Fast R-CNN, and Faster R-CNN are well-known two-stage CNN architectures. On the other hand, one-stage detectors such as SSD and YOLO predict bounding boxes and labels in one process. Therefore, they are quicker then two-stage algorithms [37]. In the next section, YOLO is introduced in order to explain the proposed person identification solution.

2.2.2. YOLO: You Only Look Once

One such application of CNN is the YOLO object detection framework, which has gained significant attention for its remarkable balance of speed and accuracy. YOLO can identify and locate multiple objects within an image simultaneously, making it a valuable tool for a wide range of applications, from autonomous vehicles to video surveillance applications [36]. There have been many versions of YOLO from its first appearance in 2015 to today. In YOLOv1, YOLOv2, and YOLOv3, anchor boxes and multiscale detection are developed in order to improve object detection with different shapes and scales. To improve accuracy and robustness, YOLOv4 and YOLOv5 apply further optimization in feature extraction and data enhancement. YOLOv6 and YOLOv7 propose new loss functions and label allocation methods to achieve even greater detection accuracy. YOLOv8 has a balance between speed and accuracy, with its anchor-free architecture and head design [42]. Although YOLOv9 requires a longer training time than YOLOv8, it increases accuracy by introducing programmable gradient information, a generalized efficient layer aggregation network, and reversible functions. One of the key improvements in YOLOv10 is the introduction of the C3k2 block, an innovative feature that greatly improves feature aggregation while reducing computational overhead. YOLOv11 introduce C2PSA blocks, which greatly improve spatial awareness by allowing the model to better concentrate on essential regions within an image [43].
In this study, YOLOv5 and YOLOv8 are used to recognize a worker by identifying relevant symbols. YOLOv8 has a feature called feature pyramid network (FPN), which improves its ability to obtain objects across varying sizes and spatial resolutions [44], and it is also known for its speed and can be used for real-time applications [45]. This property can be advantageous for detecting the symbols on helmets from different angles and distances.
The backbone of YOLOv8 is mostly the same as for YOLOv5, with the C3 module replaced with the C2f module, which is based on the CSP (Cross-Stage Partial) concept. Inspired by the ELAN (Efficient Layer Aggregation Networks) approach in YOLOv7, the C2f module combines the C3 and ELAN methods to improve gradient flow while maintaining a lightweight design. At the end of the backbone, the popular SPPF (Spatial Pyramid Pooling Fast) module is still used, consisting of three 5 × 5 Maxpool layers applied sequentially and concatenated, ensuring accuracy across different object scales while keeping the model efficient.
The neck section of YOLOv8 uses the PAN-FPN feature fusion method to enhance feature integration across different scales. It includes two upsampling layers, multiple C2f modules, and a decoupled head structure to combine confidence and regression boxes, resulting in improved accuracy. The CBS is composed of convolution, batch normalization, and SiLu (Sigmoid Linear Unit) activation function [46,47].

2.3. Proposed Method

2.3.1. Symbols

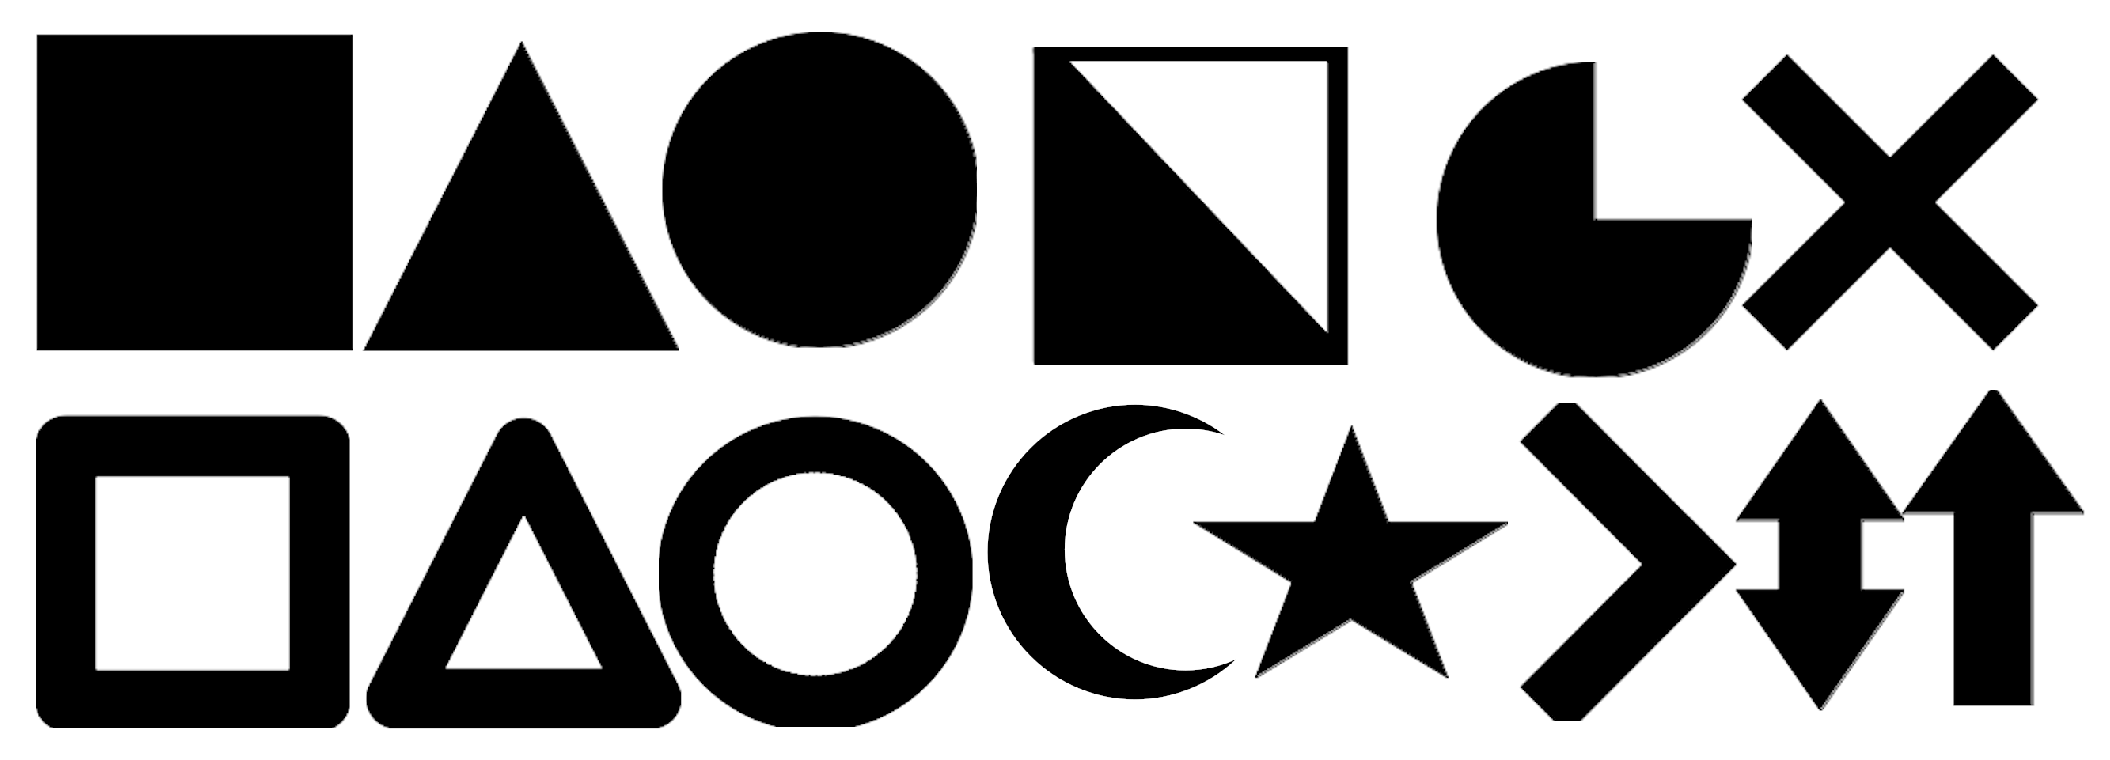
Instead of using numbers or letters, it was decided to use some symbols that are distinguishable by both the human eye and computer vision algorithms. For that purpose, 14 different symbols were generated, as seen in Figure 5.
The main considerations in choosing the symbols can be summarized as:
  • Having a generic shape like triangle, square, star, circle, etc.
  • Being distinguisable from an acceptable distance by the human eye, and therefore by computer.
  • Should not be confused each other.
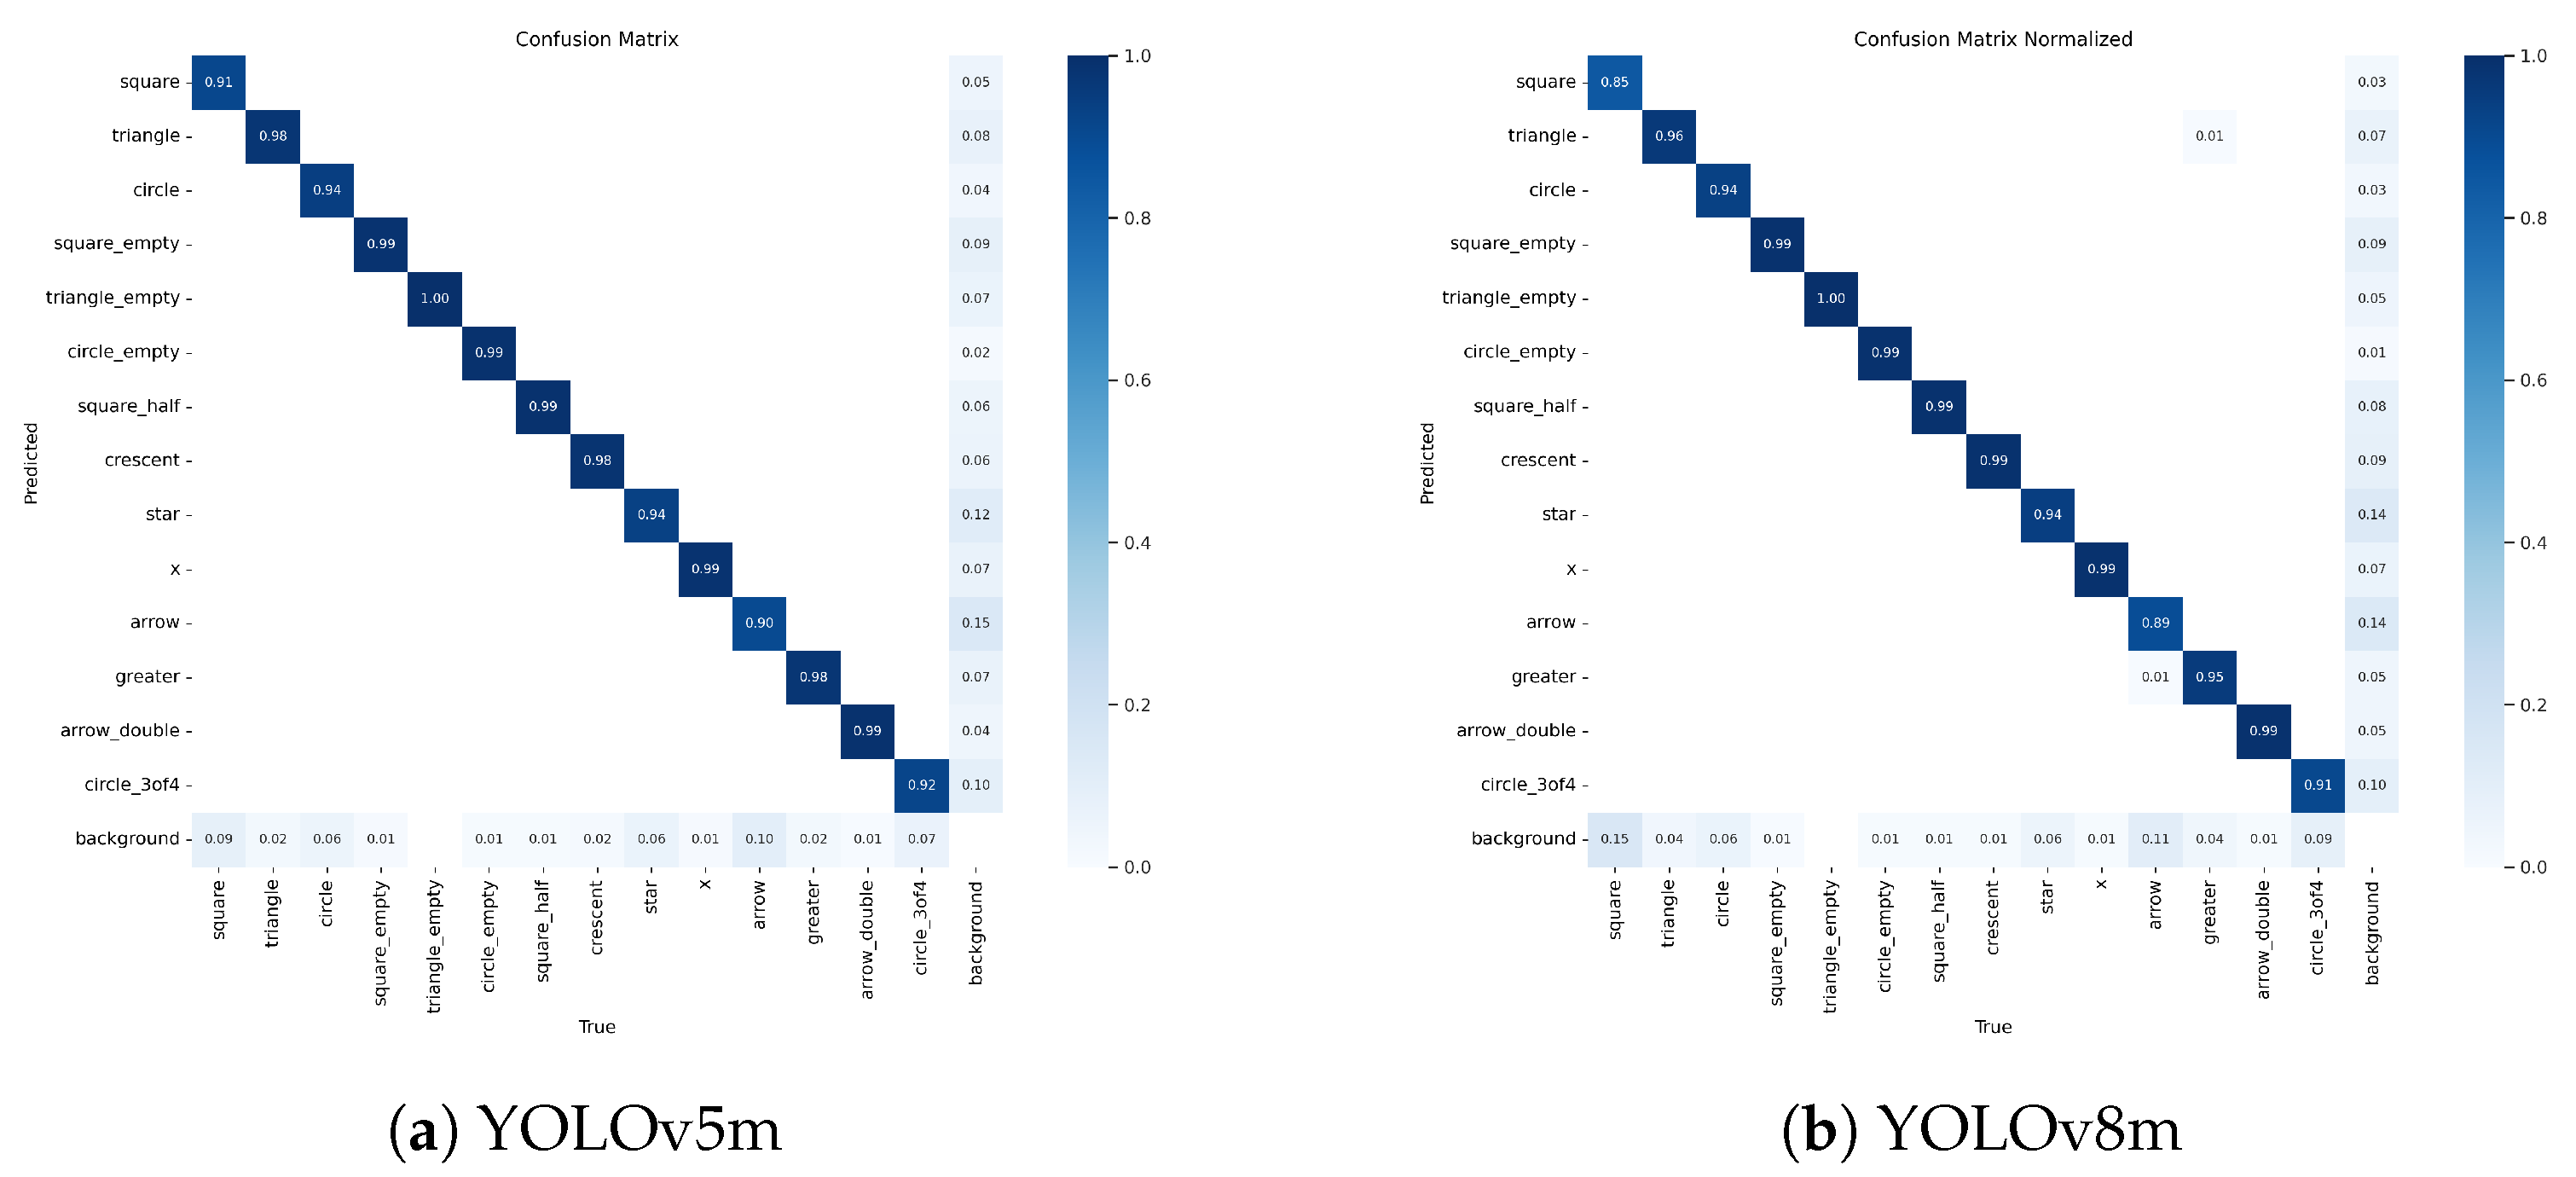
Since there was a multiplictaion sign, a plus sign was not added to the set, and because there was an upward arrow, a downward arrow was not permitted. According to the results and tests in the confusion matrices in Figure 6a,b, there were no false detections between the classes.
The number of symbols can be increased or decreased as required. In our case, there were 14 different symbols, which means there were 2744 possible combinations ( 14 3 = 2744 ) , including repetitions of symbols on a helmet—e.g., using the same symbol more than once. Additionally, the order of the symbols is important for identification, which increases the total number of possible combinations.

2.3.2. Deep Learning-Based Symbol Detection Method

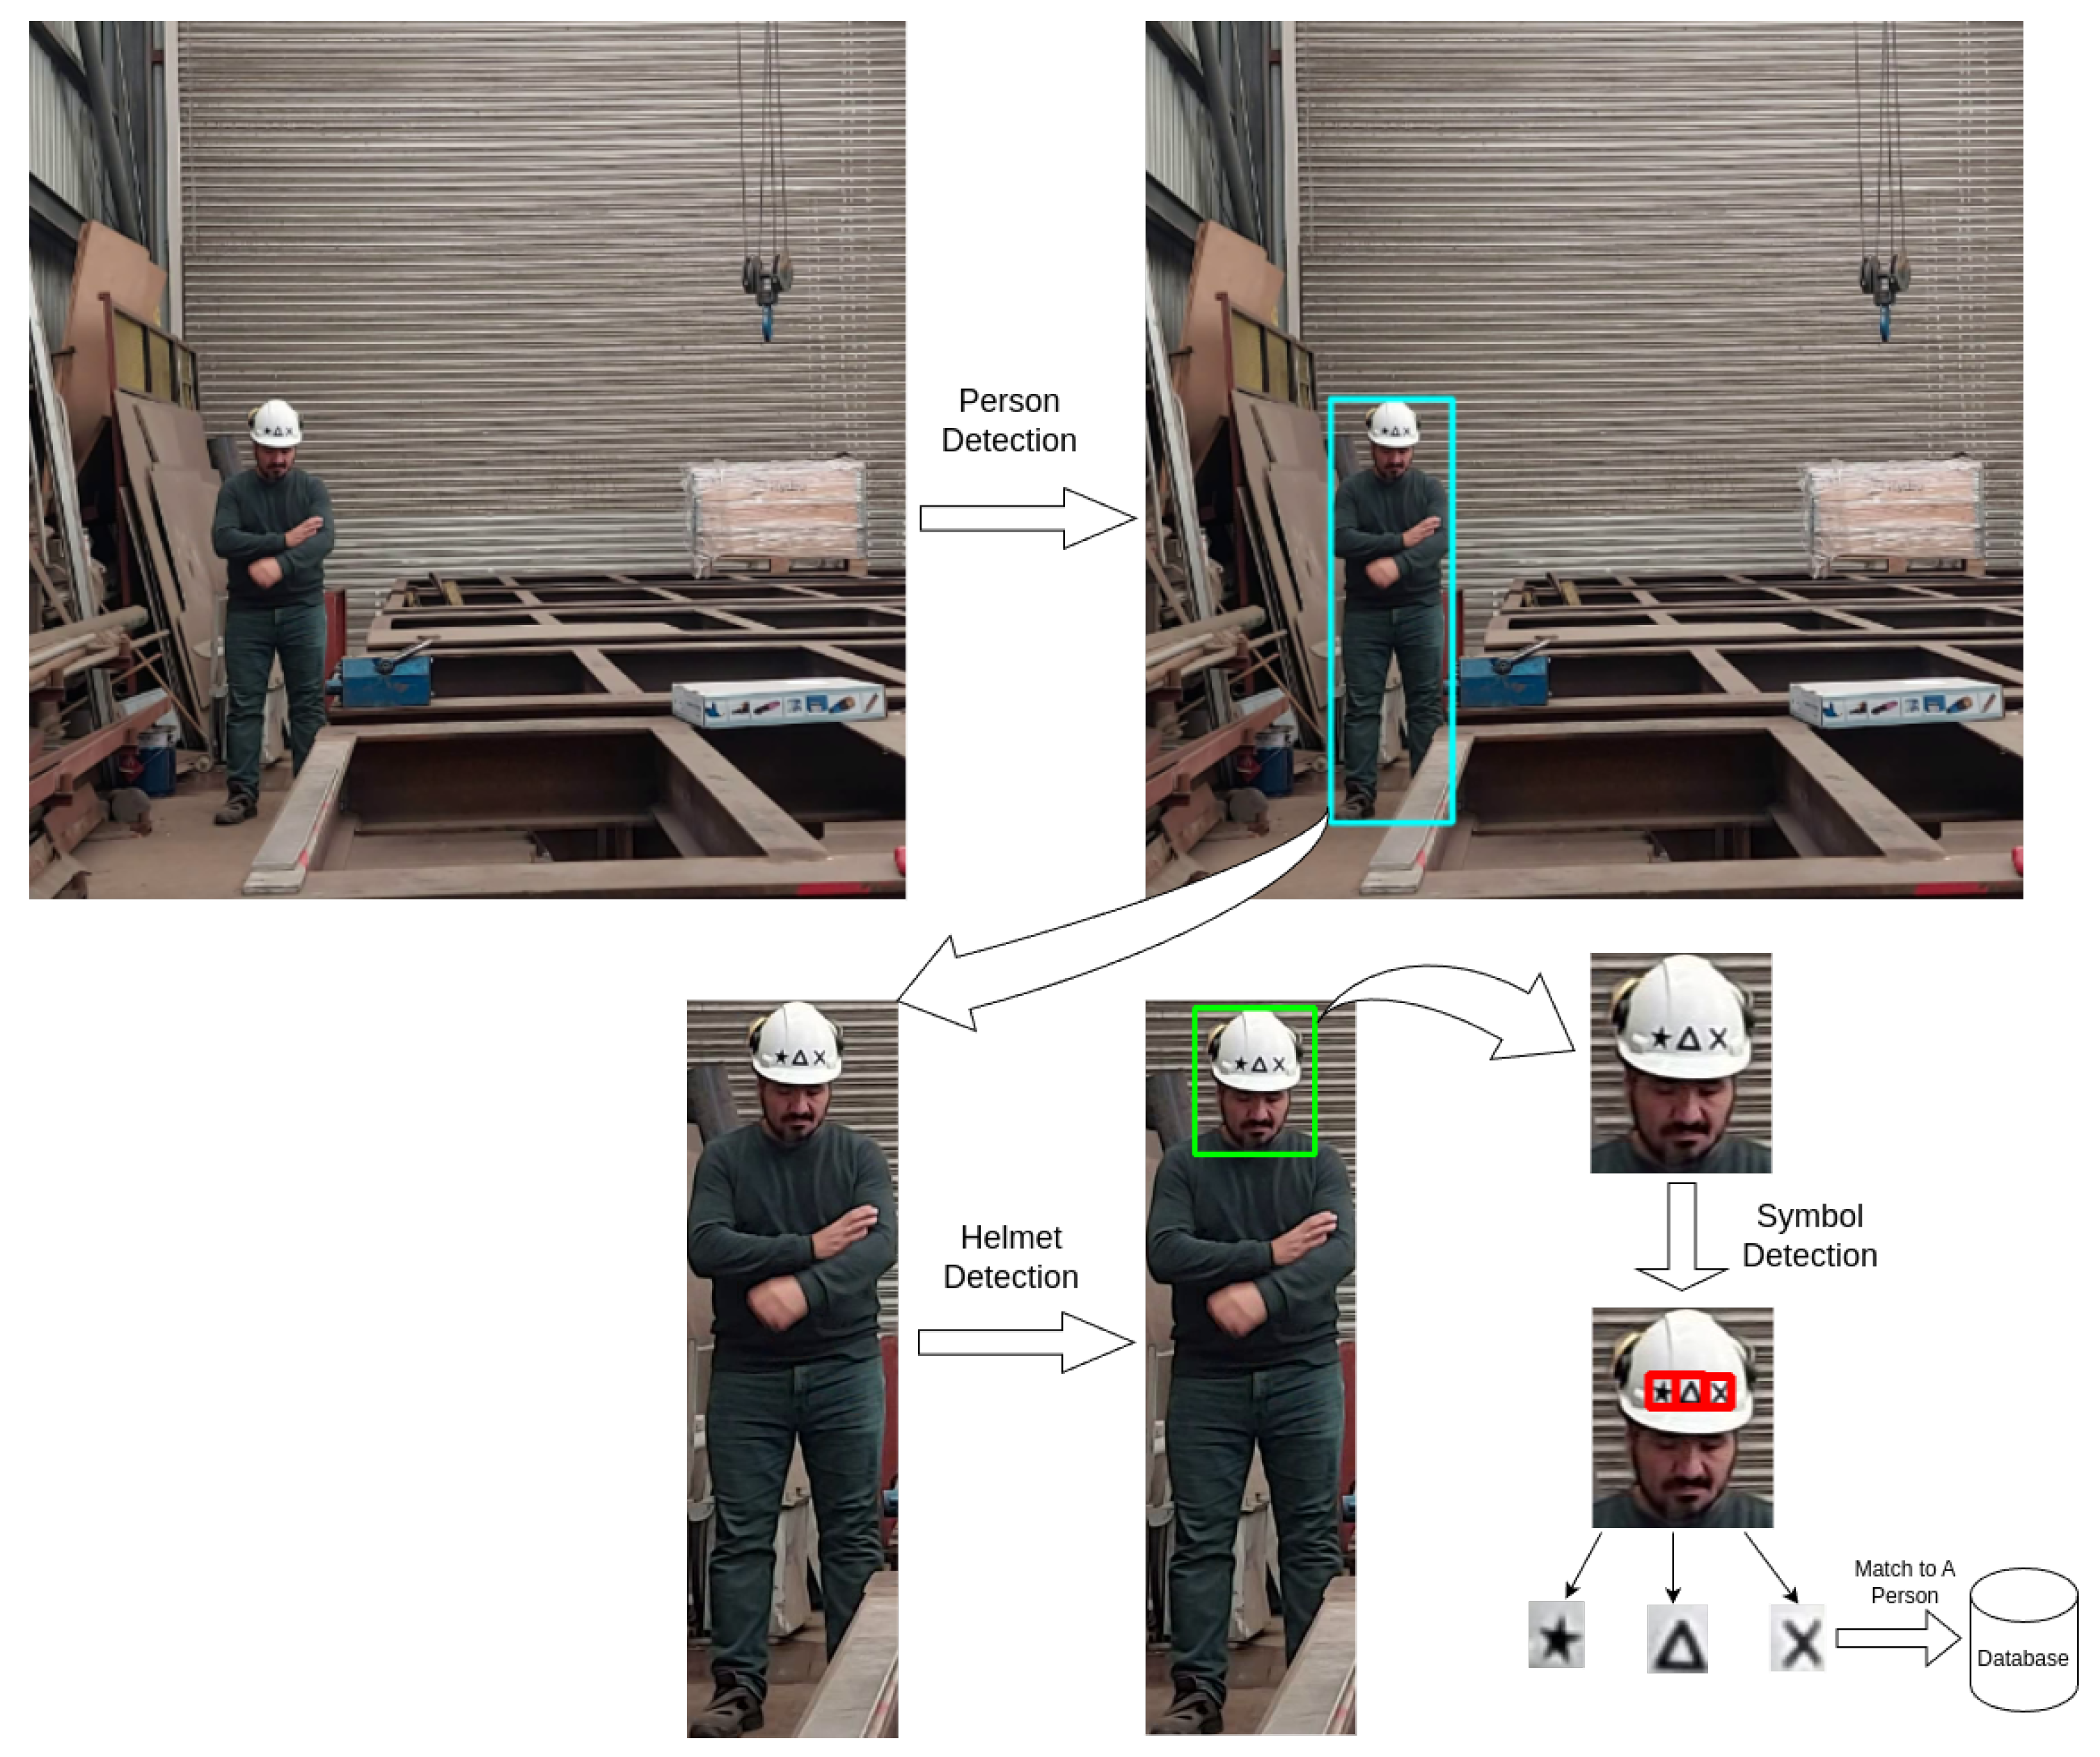
In our study, the proposed method basically uses deep learning approaches for three consecutive detections—personnel, helmet, and symbol. The process is shown in Figure 7 and the workflow is in Figure 8.
For each detection task, transfer learning is applied using different versions of YOLO. The YOLOv5l model is employed for person detection, while YOLOv5m model is used for helmet detection. Finally, YOLOv5m and YOLOv8m are utilized for transfer learning to detect symbols in order to identify individuals from the predefined database.
The transfer learning approach uses pretrained weights and changes the weights according to the training process of a specific object detection task. It reduces the training time as well as being useful for training a model [48] when data is limited.

2.3.3. Symbol Ordering and Matching to Database

Since YOLO sorts detected bounding boxes by confidence scores, an additional ordering algorithm based on location was used to correctly match symbols with people in the database, assuming that the heads of workers are positioned vertically rather than horizontally.
Detected bounding boxes of all symbols are taken into account one by one with respect to their upper-left corners, as illustrated in Figure 9 by the green points. These points are then processed in Algorithm 1, starting from the leftmost position and continuing toward the right.
Algorithm 1 Ordering Points by Most-Left Rule Recursively.
Require: 
A list of points P, where each point p = ( x , y ) represents the left-top coordinate of a box in an image.
Ensure: 
A list of points P sorted sorted from left to right.
  1:
function Ordering(P)
  2:
    if | P | 1 then
  3:
        return P
  4:
    end if
  5:
    Select pivot p 0 = P [ 0 ]
  6:
    Initialize Left [ ]
  7:
    Initialize Right [ ]
  8:
    for each point p P [ 1 : ]  do
  9:
        if  p . x < p 0 . x  then
10:
           Add p to Left
11:
        else
12:
           Add p to Right
13:
        end if
14:
    end for
15:
     LeftSorted Ordering ( Left )
16:
     RightSorted Ordering ( Right )
17:
    return  LeftSorted [ p 0 ] RightSorted
18:
end function
To deep dive into the quicksort variant algorithm, the following steps are performed:
  • Get the list of points named P representing the top-left corner of bounding boxes.
  • Get the first point in the list P 0 as a pivot.
  • Divide points as Left and Right depending on x-coordinate, small ones on the Left and others on the Right.
  • Then, recursively, Left and Right lists are processed.
  • Combine results as in the following order: Left list, pivot point, Right list.
  • Return ordered list.
As long as bounding boxes are detected, this algorithm is robust for helmet rotations of up to ±90 degrees, based on experiences conducted through this research.
When three symbols are detected, a database search is performed to match the symbols with individuals, resulting in person identification.

3. Results

To train datasets and generate the models mentioned, self-owned Zotac RTX 3090 Trinity GDDR6X 24 GB Graphics Card was used.
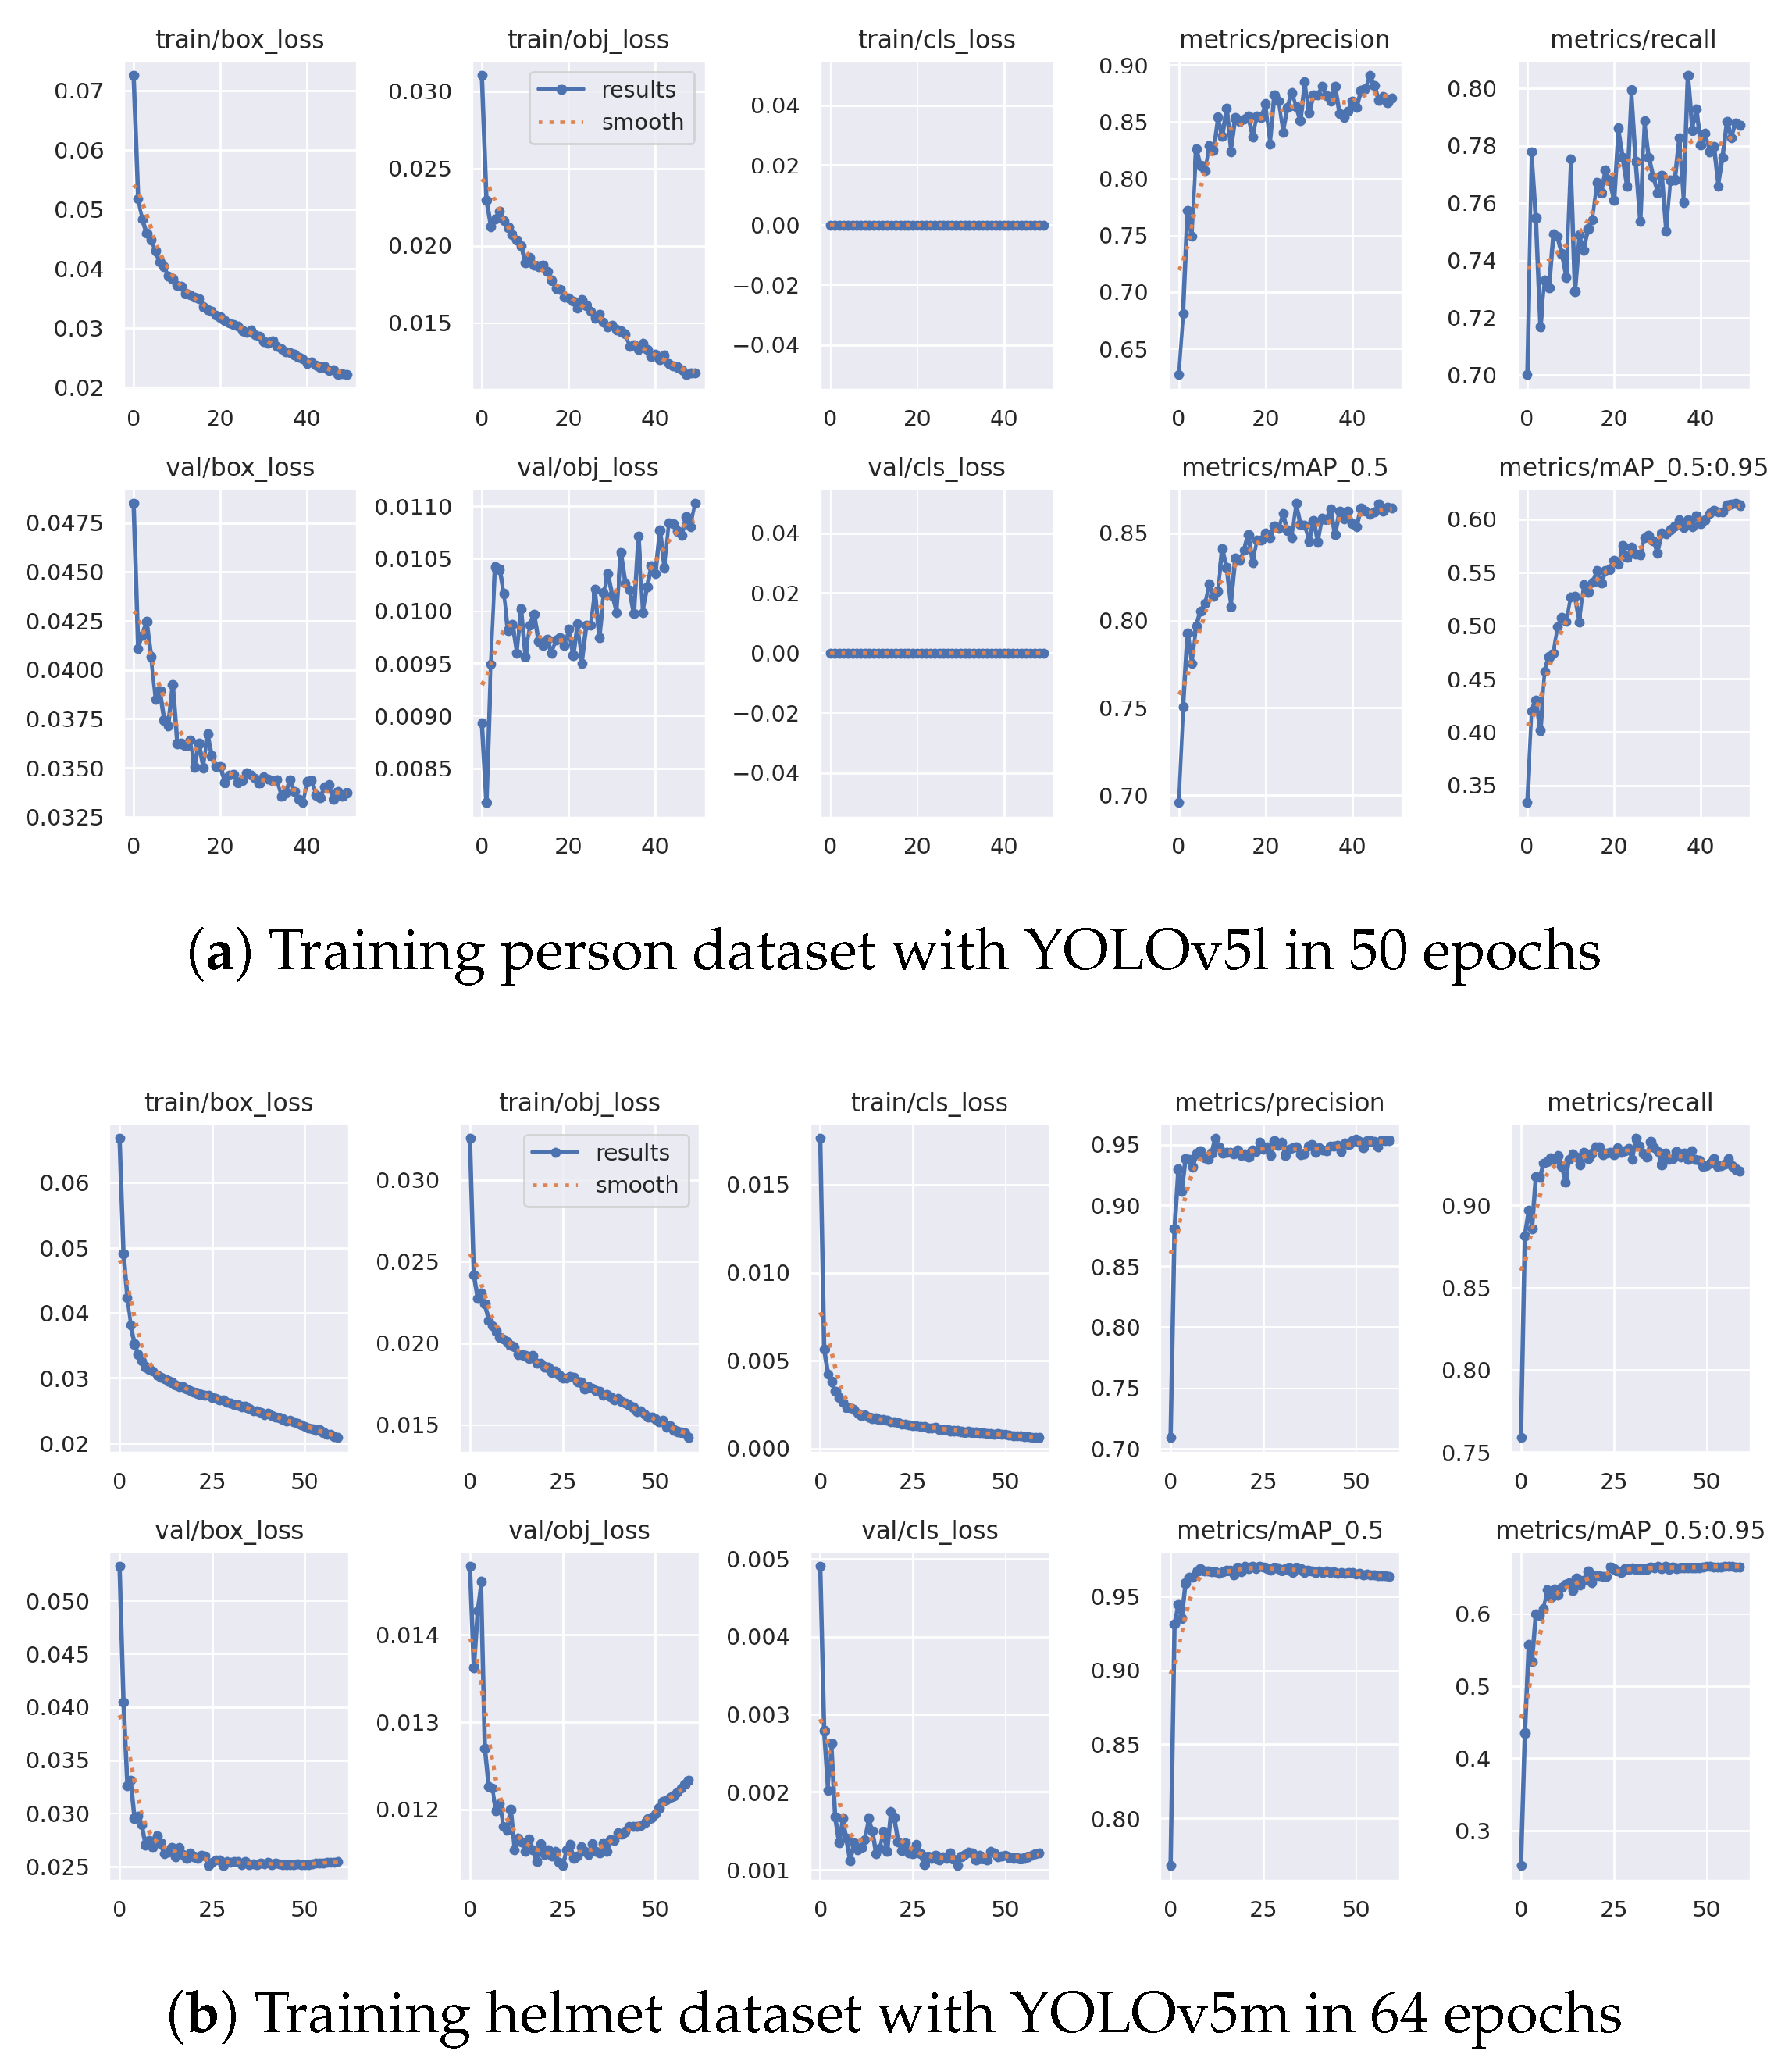
Since the objective of this study is to develop a tool for identifying individuals through symbols, only the training and test results related to symbol detection are meticulously investigated. The person and helmet dataset training results are presented in Figure 10.

3.1. Symbol Training Results

As described above, YOLOv5m and YOLOv8m pretrained models were used for symbol recognition. The models both have a 0.01 learning rate, 100 epochs, and 640 image size. Using these hyperparameters, the validation metrics—mean average precision (mAP), average precision (AP), precision (P), and recall (R)—are taken into consideration. TP, FP, and FN mean True Positive, False Positive, and False Negative, respectively, and the metrics are calculated as follows [47]:
Precision = T P T P + F P , Recall = T P T P + F N
AP = 0 1 p ( r ) d r , mAP = 1 k i = 1 k A P i

3.1.1. YOLOv8m Training Results

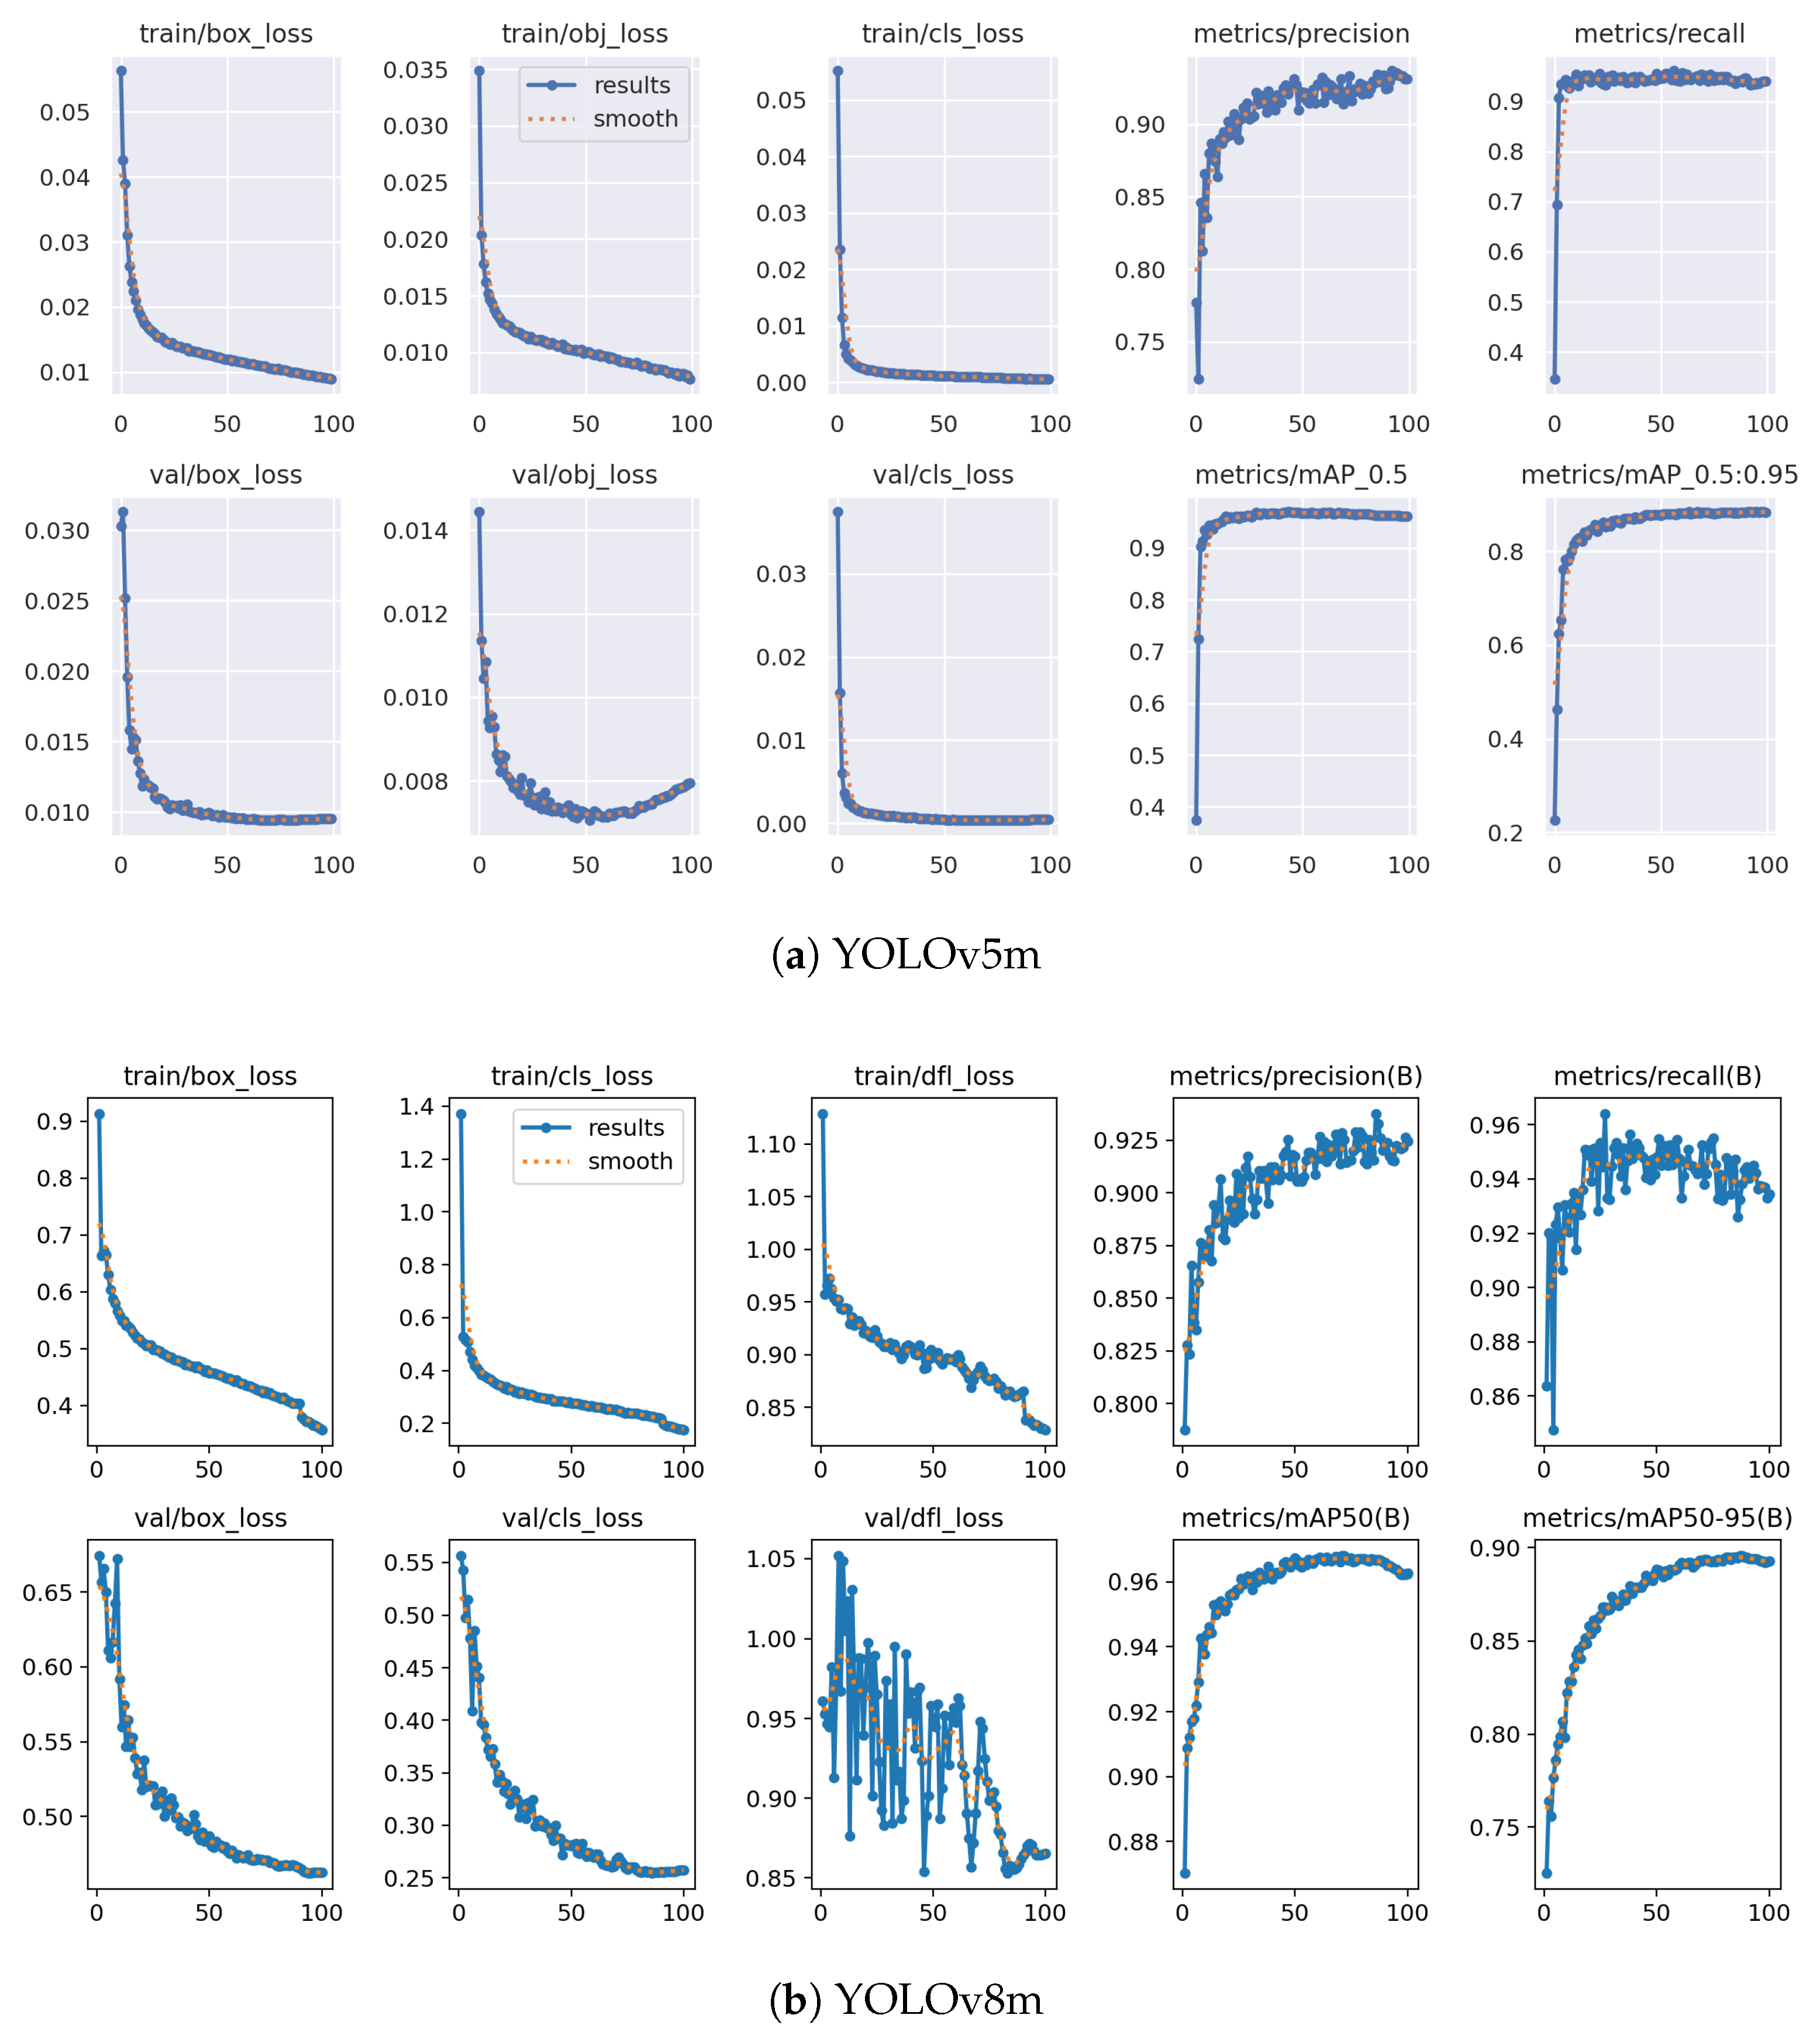
Training with the YOLOv8m model, as shown in Figure 11b, the box regression loss decreases steadily throughout the training process, indicating that the model improves its bounding box predictions over time. The classification loss also decreases steadily, with the smooth curve showing consistent improvement. This indicates that the model is getting better at correctly classifying objects within bounding boxes. The Distribution Focal Loss (DFL) also decreases steadily, suggesting that the model is refining the quality of its bounding box predictions. These results indicate that the model is training effectively without overfitting.
The validation box loss drops in parallel with the training box loss, with some fluctuations, though the overall decreasing trend gives a positive sign. The validation classification loss also decreases steadily, with occasional fluctuations suggesting that the model generalizes well to the validation data and does not involve overfitting to the training set. Similarly, the validation DFL loss decreases with minor oscillations, but converges toward the end. Here, these oscillations may indicate variations in the validation set, but overall, the model demonstrates progressive improvement in its predictions.
The precision metric increases steadily and stabilizes at a high value near 0.92, indicating that the model has a low false positive rate. In other words, it rarely predicts objects incorrectly. The recall metric also increases throughout training and stabilizes around 0.96, suggesting that the model detects the most objects in the images with a low false negative rate. The mAP@50 metric improves steadily and converges near 0.96, showing that the model performs very well in detecting objects at high Intersect of Union (IoU) thresholds. The IoU is a key indicator of strong overall performance. Also, the mAP@50-95 improves steadily and stabilizes around 0.90. This metric evaluates the performance of the model over multiple IoU thresholds, and a value of 0.90 indicates robust performance across all thresholds.
All metrics and losses show consistent convergence, indicating that the training process is stable and effective. The high precision, recall, and mAP values indicate that the model has learned to detect and classify objects accurately. There is no significant gap between training and validation losses, suggesting that the model has not overfitted to the training data. Although some oscillations are observed in the validation losses, they are not substantial enough to indicate instability or poor generalization.

3.1.2. YOLOv5m Training Results

Similarly, for training results with YOLOv5m, as seen in Figure 11a, the loss metrics of box, object, and class show a consistent downward trend in both training and validation, indicating effective learning. Precision and recall stabilize at high values, demonstrating that the model accurately detects objects without missing many true positives. The mAP@50 and mAP@50-95 values confirm excellent overall performance, with high accuracy and robustness across IoU thresholds.
The confusion matrices, as seen in Figure 6a,b, are primarily dominated by high values along the diagonal, indicating that most predictions align with the true labels. However, slight classification errors are observed between greater–triangle and arrow–greater symbols in training with YOLOv8m. Also, the symbols square, circle, star, arrow, and circle-3of4 have miss-classification with background images in both YOLOv5m and YOLOv8m training. Miss-classifications in the background class suggest a potential area for improvement, such as by increasing the number of training samples or refining features.
The class-wise metrics for the two methods indicate high training performances, as seen in Table 1. According to the results, the followings can be said:
  • YOLOv5m produces better precision and recall metrics by a tiny margin, as seen in the average values.
  • As precision measures the correctness of positive predictions, the best precision performance for both methods is gained by X, circle_empty, triangle_empty, square_half, and arrow_double in a row. In contrast, the symbols circle_3of4, arrow, and square have the lowest precision values.
  • As recall measures the ability of the model to avoid missing positive instances, triangle_empty was not missed in any case, followed by the symbols circle_empty, x, square_empty, and square_half. Only the square symbol had a recall value lower than 90%.

3.2. Distance Test Results for Symbol Detection

Lastly, the primary objective of identifying individuals at varying distances is evaluated using labeled data. For this purpose, a dataset covering distances from 5 m to 15 m at 1 m intervals is employed, and the results in Table 2 are reached. This dataset consists of multiple video files, each with associated labels and known distance information.
The accuracy metric is the number of frames in which all three helmet symbols are correctly identified. For instance, at a distance of 14 m, an individual with triangle, circle, and square symbols is identified in 13 frames by YOLOv5 and 2 frames by YOLOv8, out of a total of 450 frames. Also, the corresponding average confidence values of correctly identified symbols are taken into account to assess the reliability of the detections.
According to the results seen in Table 2, almost all of the frames in the videos that have one person and one helmet are successfully detected in terms of their person and helmets, with an exceptionally high accuracy rate.
However, it should first be noted that the performance decreases as the distance increases for both methods. Symbol detection rates are almost perfect at short distances but decrease significantly beyond 10 m. While YOLOv8 generally identifies fewer frames than YOLOv5 at longer distances, both models fail to detect most symbols beyond 13 m.
YOLOv5 consistently achieves higher confidence averages than YOLOv8 across distances, though confidence scores drop as distance increase. This means improving the model by focusing on resolution and scale in order to obtain higher confidences.
It is worth noting that certain shapes achieve better detection results than others. The table reports only three symbol combinations tested against the target symbols. This does not imply that the other symbols are entirely undetected. However, since the combinations were selected randomly and detections beyond these three combinations were excluded, each symbol requires individual analysis for a more comprehensive evaluation.
The average processing times per image are 11.11 ms for YOLOv5m and 13.88 ms for YOLOv8m as seen in Table 3. Therefore, YOLOv5m reaches a higher speed and can be considered the preferred model for real-time applications.

4. Conclusions and Future Work

In this study, a symbol-based person identification method is proposed using deep learning methods, specifically different versions of YOLO. Using existing datasets, person and helmet detection tasks were handled using a YOLOv5 transfer learning approach and achieved great results, as seen in the distance results. In the proposed method, a person is first detected in an image, then a helmet is localized within the person’s frame, and finally symbols are identified within the helmet frame. For symbol detection, a dataset of 11,243 images was collected from a construction site and annotated. Using YOLOv5m and YOLOv8m transfer learning approaches, the dataset was trained in 100 epochs with 640 image widths.
In addition, another dataset containing video files of people wearing helmets with different symbol combinations was created to perform distance tests by taking video images from different distances.
As high precision, recall, and mean average precision metrics were obtained during training, the distance test results strongly demonstrate that person identification up to 10 m is viable across all symbol combinations.
The main contributions of the study are as follows:
  • A huge symbol training dataset is generated.
  • A testing dataset containing different distances is generated in order to measure accuracy by distance. According to the results, up to 10 m accuracy is obtained.
  • A location-based symbol ordering algorithm is proposed. Since symbol detections do not follow any order and they work through confidence values in the inference mode, a left to right approach is followed.
  • There is not a a feasible solution for worker safety and tracking systems at construction sites, except some hardware-based means that involve battery and management issues. This study suggests a passive symbol detection method without any installation on workers using already-placed cameras.
Apart from these, there are many areas of study for further work:
  • Other deep learning approaches can be used to train and test the images, though YOLO is known for its real-time performances at speed.
  • In this study, only white helmets are studied. Although other colors are detected in the detection experiments, they are not tested at all.
  • The person and helmet datasets taken from online repositories can be extended, although they are trained and tested with high accuracy results.
  • Also, the symbol dataset must be extended with very exceptional light and angle conditions in order to increase accuracy for far distances. This will definitely have a positive affect on the confidence values of detections.
  • Since not every frame is available for three symbol detections, a sequential people tracking system can be run simultaneously with the proposed method. Once a person is identified, all corresponding previously detected helmets can be retroactively associated with that person.
  • Since the target number of workers to be identified determines the number of symbols, symbol selection and generation processes can be studied independently.
  • Finally, the identification process must be tested in a crowd environment where more than two people wear helmets.

Author Contributions

F.A. is responsible for conceptualization, methodology, data collection, annotation, training, validation, software, visualization results, and writing the paper. Y.B. is responsible for project administration, conceptualization, methodology, validation, writing, and reviewing the paper. All authors have read and agreed to the published version of the manuscript.

Funding

This research received no external funding.

Informed Consent Statement

The study includes pictures where people are visible. However, only one of the authors is visible in the pictures. Informed consent was obtained from all subjects involved in the study.

Data Availability Statement

The data supporting the findings of this study are available at Roboflow and can be accessed at https://app.roboflow.com/fatihaslan82/symbols-on-helmet/1 (accessed on 10 January 2025).

Acknowledgments

We would like to express our sincere gratitude to Sefine Shipyard for their support and especially to Mete Özcan for his valuable efforts.

Conflicts of Interest

Author Fatih Aslan was employed by the company Sefine Shipyard. The remaining authors declare that the research was conducted in the absence of any commercial or financial relationships that could be construed as a potential conflict of interest.

References

  1. NIOSH Science Blog. Traumatic Brain Injuries in Construction. 2024. Available online: https://blogs.cdc.gov/niosh-science-blog/2016/03/21/constructiontbi (accessed on 13 August 2024).
  2. Occupational Safety and Health Administration. Top 10 Most Frequently Cited Standards. 2024. Available online: https://www.osha.gov/top10citedstandards (accessed on 13 August 2024).
  3. Chang, X.; Liu, X.M. Fault Tree Analysis of Unreasonably Wearing Helmets for Builders. J. Jilin Jianzhu Univ. 2018, 35, 67–71. [Google Scholar]
  4. Rubaiyat, A.H.M.; Toma, T.T.; Kalantari-Khandani, M.; Rahman, S.A.; Chen, L.; Ye, Y.; Pan, C.S. Automatic Detection of Helmet Uses for Construction Safety. In Proceedings of the 2016 IEEE/WIC/ACM International Conference on Web Intelligence Workshops (WIW), Omaha, NE, USA, 13–16 October 2016; pp. 135–142. [Google Scholar]
  5. Zhang, H.; Yan, X.; Li, H.; Jin, R.; Fu, H. Real-Time Alarming, Monitoring, and Locating for Non-Hard-Hat Use in Construction. J. Constr. Eng. Manag. 2019, 145, 04019006. [Google Scholar] [CrossRef]
  6. Nath, N.D.; Behzadan, A.H.; Paal, S.G. Deep Learning for Site Safety: Real-Time Detection of Personal Protective Equipment. Autom. Constr. 2020, 112, 103085. [Google Scholar] [CrossRef]
  7. Kelm, A.; Laußat, L.; Meins-Becker, A.; Platz, D.; Khazaee, M.J.; Costin, A.M.; Helmus, M.; Teizer, J. Mobile Passive Radio Frequency Identification (RFID) Portal for Automated and Rapid Control of Personal Protective Equipment (PPE) on Construction Sites. Autom. Constr. 2013, 36, 38–52. [Google Scholar] [CrossRef]
  8. Barro-Torres, S.; Fernández-Caramés, T.M.; Pérez-Iglesias, H.J.; Escudero, C.J. Real-Time Personal Protective Equipment Monitoring System. Comput. Commun. 2012, 36, 42–50. [Google Scholar] [CrossRef]
  9. Hayat, A.; Morgado-Dias, F. Deep Learning-Based Automatic Safety Helmet Detection System for Construction Safety. Appl. Sci. 2022, 12, 8268. [Google Scholar] [CrossRef]
  10. Li, Y.; Wei, H.; Han, Z.; Huang, J.; Wang, W. Deep Learning-Based Safety Helmet Detection in Engineering Management Based on Convolutional Neural Networks. Adv. Civ. Eng. 2020, 2020, 9703560. [Google Scholar] [CrossRef]
  11. Wang, Z.; Wu, Y.; Yang, L.; Thirunavukarasu, A.; Evison, C.; Zhao, Y. Fast Personal Protective Equipment Detection for Real Construction Sites Using Deep Learning Approaches. Sensors 2021, 21, 3478. [Google Scholar] [CrossRef] [PubMed]
  12. Adjabi, I.; Ouahabi, A.; Benzaoui, A.; Taleb-Ahmed, A. Past, Present, and Future of Face Recognition: A Review. Electronics 2020, 9, 1188. [Google Scholar] [CrossRef]
  13. Taigman, Y.; Yang, M.; Ranzato, M.; Wolf, L. DeepFace: Closing the Gap to Human-Level Performance in Face Verification. In Proceedings of the IEEE Conference on Computer Vision and Pattern Recognition, Columbus, OH, USA, 23–28 June 2014; pp. 1701–1708. [Google Scholar]
  14. Schroff, F.; Kalenichenko, D.; Philbin, J. FaceNet: A Unified Embedding for Face Recognition and Clustering. In Proceedings of the IEEE Conference on Computer Vision and Pattern Recognition, Boston, MA, USA, 7–12 June 2015; pp. 815–823. [Google Scholar]
  15. Wen, Y.; Zhang, K.; Li, Z.; Qiao, Y. A Discriminative Feature Learning Approach for Deep Face Recognition. In Proceedings of the ECCV 2016: 14th European Conference on Computer Vision, Amsterdam, The Netherlands, 11–14 October 2016; Springer: Amsterdam, The Netherlands, 2016; pp. 499–515. [Google Scholar]
  16. Wu, Y.; Liu, H.; Li, J.; Fu, Y. Deep Face Recognition with Center Invariant Loss. In Proceedings of the Thematic Workshops of ACM Multimedia, Mountain View, CA, USA, 23–27 October 2017; pp. 408–414. [Google Scholar]
  17. Yin, X.; Yu, X.; Sohn, K.; Liu, X.; Chandraker, M. Feature Transfer Learning for Face Recognition with Under-Represented Data. In Proceedings of the IEEE/CVF Conference on Computer Vision and Pattern Recognition, Long Beach, CA, USA, 15–20 June 2019; pp. 5704–5713. [Google Scholar]
  18. Philippe, V.; Bourlai, T. Exploring Image Augmentation Methods for Long-Distance Face Recognition Using Deep Learning. In Proceedings of the SoutheastCon 2024, Atlanta, GA, USA, 15–24 March 2024; pp. 1144–1150. [Google Scholar]
  19. Ge, S.; Zhao, S.; Li, C.; Li, J. Low-Resolution Face Recognition in the Wild via Selective Knowledge Distillation. IEEE Trans. Image Process. 2018, 28, 2051–2062. [Google Scholar] [CrossRef] [PubMed]
  20. Kortli, Y.; Jridi, M.; Al Falou, A.; Atri, M. Face Recognition Systems: A Survey. Sensors 2020, 20, 342. [Google Scholar] [CrossRef] [PubMed]
  21. Andreev, P.; Aprahamian, B.; Marinov, M. QR Code’s Maximum Scanning Distance Investigation. In Proceedings of the 2019 16th Conference on Electrical Machines, Drives and Power Systems (ELMA), Varna, Bulgaria, 6–8 June 2019; pp. 1–4. [Google Scholar]
  22. Jose, A.; Thodupunoori, H.; Nair, B.B. A Novel Traffic Sign Recognition System Combining Viola–Jones Framework and Deep Learning. In Proceedings of the Soft Computing and Signal Processing: Proceedings of ICSCSP 2018, Chennai, India, 3–5 April 2018; Springer: Berlin/Heidelberg, Germany, 2019; pp. 507–517. [Google Scholar]
  23. Avramović, A.; Sluga, D.; Tabernik, D.; Skočaj, D.; Stojnić, V.; Ilc, N. Neural-Network-Based Traffic Sign Detection and Recognition in High-Definition Images Using Region Focusing and Parallelization. IEEE Access 2020, 8, 189855–189868. [Google Scholar] [CrossRef]
  24. Dharnesh, K.; Prramoth, M.M.; Saravanan, A.S.; Sivabalan, M.A.; Sivraj, P. Performance Comparison of Road Traffic Sign Recognition System Based on CNN and YOLO v5. In Proceedings of the 2023 Innovations in Power and Advanced Computing Technologies (i-PACT), Kuala Lumpur, Malaysia, 8–10 December 2023; pp. 1–6. [Google Scholar]
  25. Megalingam, R.K.; Thanigundala, K.; Musani, S.R.; Nidamanuru, H.; Gadde, L. Indian Traffic Sign Detection and Recognition Using Deep Learning. Int. J. Transp. Sci. Technol. 2023, 12, 683–699. [Google Scholar] [CrossRef]
  26. Temel, D.; Chen, M.; AlRegib, G. Traffic Sign Detection under Challenging Conditions: A Deeper Look into Performance Variations and Spectral Characteristics. IEEE Trans. Intell. Transp. Syst. 2019, 21, 3663–3673. [Google Scholar] [CrossRef]
  27. Cao, N. Research and Development of Icon Recognition System Based on Machine Vision. In Proceedings of the IOP Conference Series: Materials Science and Engineering, Xi’an, China, 25–27 October 2020; Volume 740, p. 012183. [Google Scholar]
  28. Aslan, F.; Becerikli, Y. Symbol Detection with Deep Learning. Int. J. Adv. Nat. Sci. Eng. Res. 2023, 7, 239–243. [Google Scholar] [CrossRef]
  29. Dalal, N.; Triggs, B. Histograms of Oriented Gradients for Human Detection. In Proceedings of the 2005 IEEE Computer Society Conference on Computer Vision and Pattern Recognition (CVPR’05), San Diego, CA, USA, 20–26 June 2005; Volume 1, pp. 886–893. [Google Scholar]
  30. Martinson, E.; Yalla, V. Real-Time Human Detection for Robots Using CNN with a Feature-Based Layered Pre-Filter. In Proceedings of the 2016 25th IEEE International Symposium on Robot and Human Interactive Communication (RO-MAN), New York, NY, USA, 26–31 August 2016; pp. 1120–1125. [Google Scholar]
  31. Wibowo, M.E.; Ashari, A.; Putra, M.P.K. Improvement of Deep Learning-Based Human Detection Using Dynamic Thresholding for Intelligent Surveillance System. Int. J. Adv. Comput. Sci. Appl. 2021, 12, 472–477. [Google Scholar] [CrossRef]
  32. Li, F.; Chen, Y.; Hu, M.; Luo, M.; Wang, G. Helmet-Wearing Tracking Detection Based on StrongSORT. Sensors 2023, 23, 1682. [Google Scholar] [CrossRef]
  33. Li, J.; Zhao, X.; Kong, L.; Zhang, L.; Zou, Z. Construction Activity Recognition Method Based on Object Detection, Attention Orientation Estimation, and Person Re-Identification. Buildings 2024, 14, 1644. [Google Scholar] [CrossRef]
  34. Titulacin. Person Detection Computer Vision Project. 2023. Available online: https://universe.roboflow.com/titulacin/person-detection-9a6mk/dataset/16 (accessed on 1 May 2023).
  35. Northeastern University, China. Hard Hat Workers Dataset. 2022. Available online: https://universe.roboflow.com/joseph-nelson/hard-hat-workers/dataset/14 (accessed on 1 September 2022).
  36. Dong, S.; Wang, P.; Abbas, K. A Survey on Deep Learning and Its Applications. Comput. Sci. Rev. 2021, 40, 100379. [Google Scholar] [CrossRef]
  37. Taye, M.M. Theoretical Understanding of Convolutional Neural Network: Concepts, Architectures, Applications, Future Directions. Computation 2023, 11, 52. [Google Scholar] [CrossRef]
  38. Rhee, E.J. A Deep Learning Approach for Classification of Cloud Image Patches on Small Datasets. J. Inf. Commun. Converg. Eng. 2018, 16, 173. [Google Scholar]
  39. Zeiler, M.D.; Fergus, R. Visualizing and Understanding Convolutional Networks. In Proceedings of the European Conference on Computer Vision, Zurich, Switzerland, 6–12 September 2014; Volume 1311. [Google Scholar]
  40. Xiao, Y.; Tian, Z.; Yu, J.; Zhang, Y.; Liu, S.; Du, S.; Lan, X. A Review of Object Detection Based on Deep Learning. Multimed. Tools Appl. 2020, 79, 23729–23791. [Google Scholar] [CrossRef]
  41. Shen, J.; Shafiq, M.O. Deep Learning Convolutional Neural Networks with Dropout—A Parallel Approach. In Proceedings of the 2018 17th IEEE International Conference on Machine Learning and Applications (ICMLA), Orlando, FL, USA, 17–20 December 2018; pp. 572–577. [Google Scholar]
  42. Li, L.; Liu, X.; Chen, X.; Yin, F.; Chen, B.; Wang, Y.; Meng, F. SDMSEAF-YOLOv8: A Framework to Significantly Improve the Detection Performance of Unmanned Aerial Vehicle Images. Geocarto Int. 2024, 39, 2339294. [Google Scholar] [CrossRef]
  43. Ali, M.L.; Zhang, Z. The YOLO Framework: A Comprehensive Review of Evolution, Applications, and Benchmarks in Object Detection. Computers 2024, 13, 336. [Google Scholar] [CrossRef]
  44. Terven, J.; Córdova-Esparza, D.M.; Romero-González, J.A. A Comprehensive Review of YOLO Architectures in Computer Vision: From YOLOv1 to YOLOv8 and YOLO-NAS. Mach. Learn. Knowl. Extr. 2023, 5, 1680–1716. [Google Scholar] [CrossRef]
  45. Talaat, F.M.; ZainEldin, H. An Improved Fire Detection Approach Based on YOLO-v8 for Smart Cities. Neural Comput. Appl. 2023, 35, 20939–20954. [Google Scholar] [CrossRef]
  46. Wang, H.; Liu, C.; Cai, Y.; Chen, L.; Li, Y. YOLOv8-QSD: An Improved Small Object Detection Algorithm for Autonomous Vehicles Based on YOLOv8. IEEE Trans. Instrum. Meas. 2024, 73, 2513916. [Google Scholar] [CrossRef]
  47. Lou, H.; Duan, X.; Guo, J.; Liu, H.; Gu, J.; Bi, L.; Chen, H. DC-YOLOv8: Small-Size Object Detection Algorithm Based on Camera Sensor. Electronics 2023, 12, 2323. [Google Scholar] [CrossRef]
  48. Terzi, D.S.; Azginoglu, N. In-Domain Transfer Learning Strategy for Tumor Detection on Brain MRI. Diagnostics 2023, 13, 2110. [Google Scholar] [CrossRef]
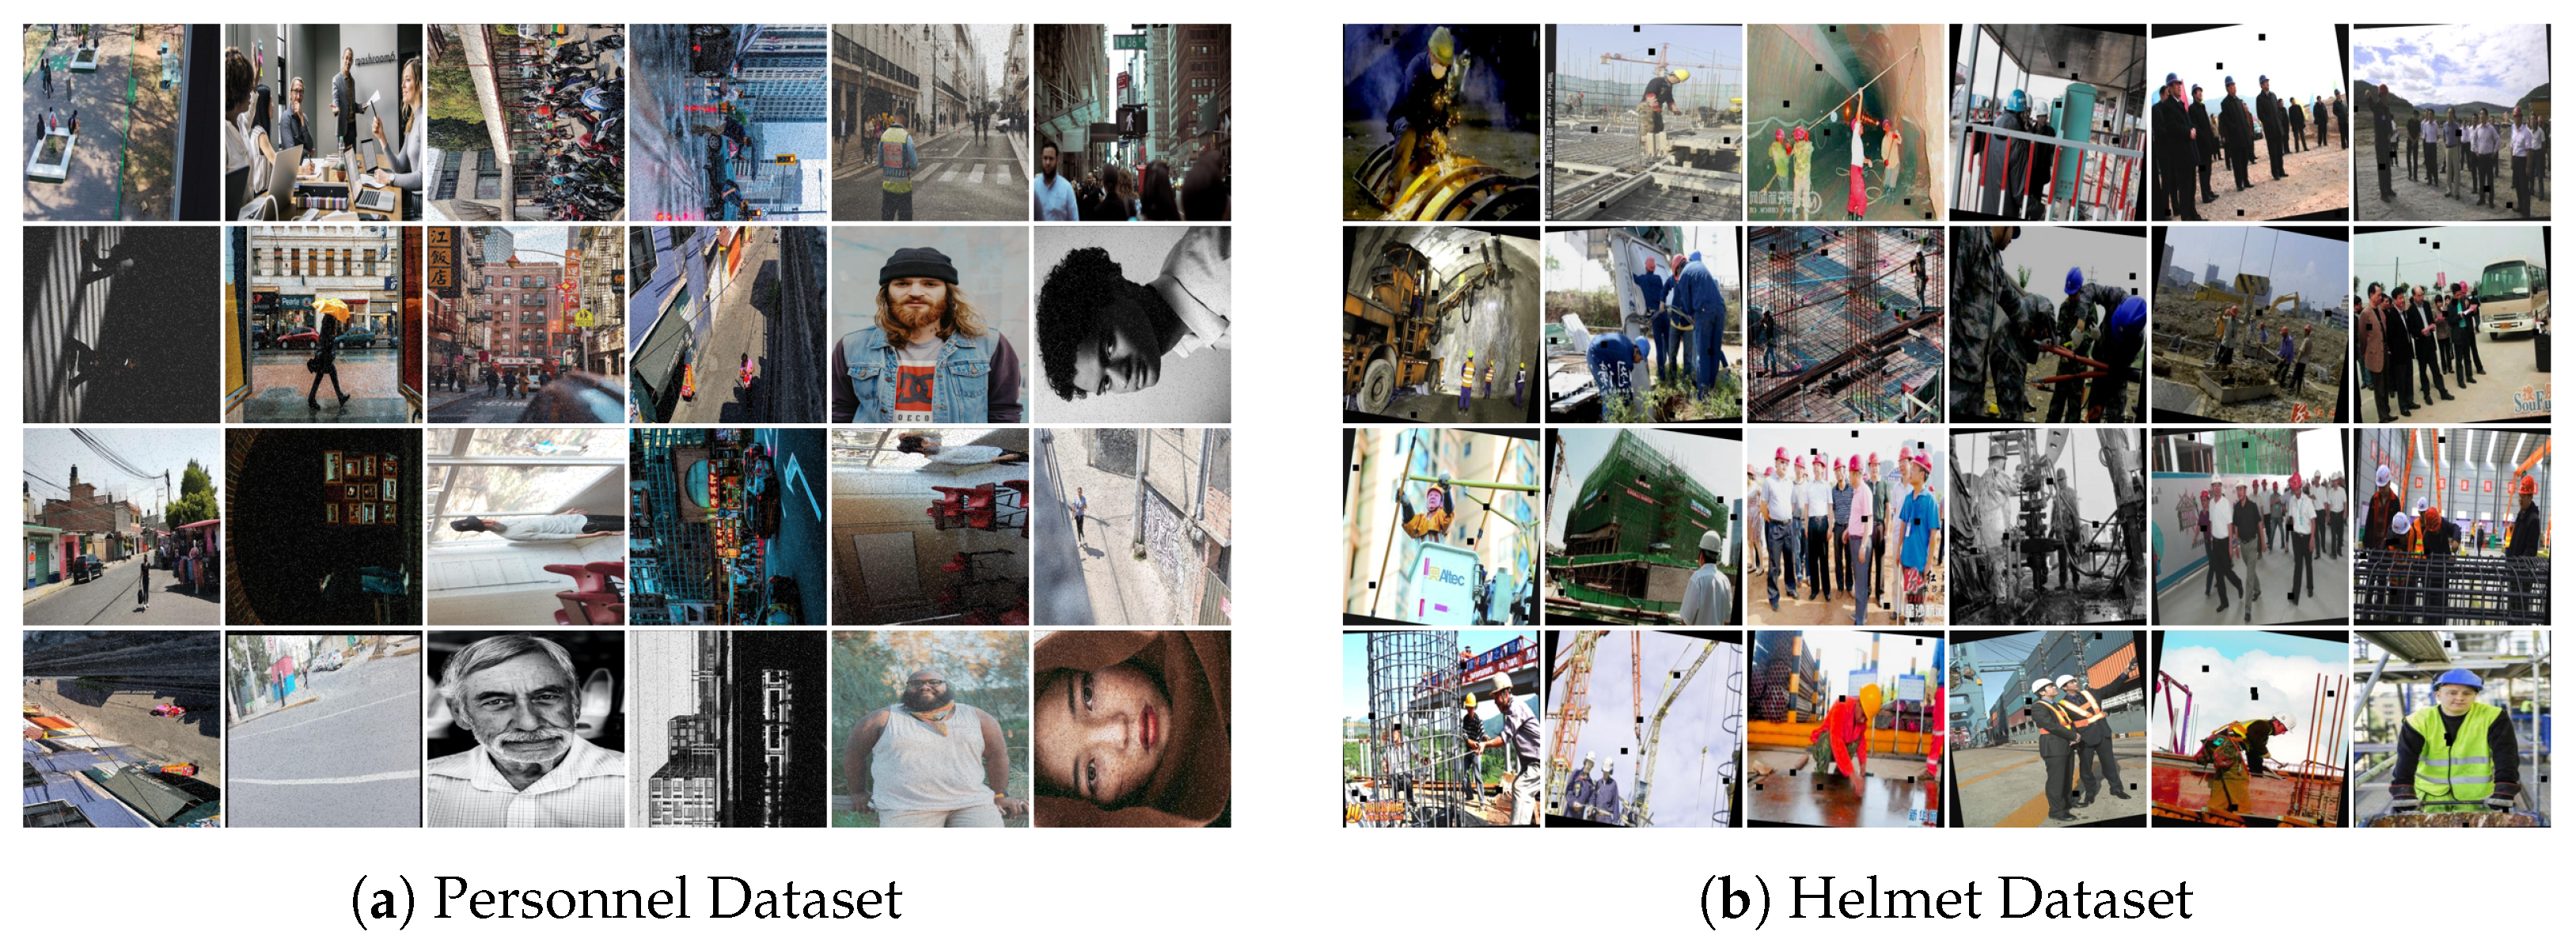
Figure 1. Existing Personnel and Helmet Datasets.
Applsci 15 11188 g001
Figure 2. Generated symbol dataset.
Applsci 15 11188 g002
Figure 3. Placing 4 cm × 4 cm symbols on a helmet.
Applsci 15 11188 g003
Figure 4. Block diagram of a CNN [38].
Applsci 15 11188 g004
Figure 5. Symbols used.
Applsci 15 11188 g005
Figure 6. Confusion matrices in the training symbol dataset.
Applsci 15 11188 g006
Figure 7. Proposed method in action.
Applsci 15 11188 g007
Figure 8. Proposed method workflow.
Applsci 15 11188 g008
Figure 9. Symbol ordering via upper-left corners of detected symbols.
Applsci 15 11188 g009
Figure 10. Person and helmet detection training results.
Applsci 15 11188 g010
Figure 11. Symbol Training Evaluation Results.
Applsci 15 11188 g011
Table 1. Class-wise evaluation metrics with YOLOv5m/YOLOv8m.
ClassInstancesPRmAP@50mAP@50-95
(v5/v8) (v5/v8) (v5/v8) (v5/v8)
all72120.924/0.9230.951/0.9430.968/0.9670.884/0.898
square780.809/0.8640.872/0.8140.923/0.9080.901/0.892
triangle3360.902/0.9070.970/0.9550.967/0.9570.879/0.884
circle1540.917/0.9170.931/0.8960.970/0.9710.912/0.924
square_empty4120.912/0.9150.983/0.9850.982/0.9820.913/0.924
triangle_empty11030.979/0.9831.000/1.0000.991/0.9910.904/0.919
circle_empty4380.984/0.9850.989/0.9910.992/0.9910.920/0.938
square_half5810.961/0.9440.978/0.9810.990/0.9890.926/0.939
crescent4740.952/0.9240.970/0.9780.989/0.9870.894/0.909
star5150.920/0.9000.916/0.9090.953/0.9630.837/0.859
x17830.985/0.9850.985/0.9870.993/0.9940.906/0.921
arrow3980.876/0.8550.877/0.8620.929/0.9260.797/0.814
greater3700.938/0.9380.957/0.9490.983/0.9820.883/0.897
arrow_double3420.946/0.9390.977/0.9860.983/0.9820.886/0.904
circle_3of42280.849/0.8610.917/0.9080.899/0.9140.818/0.844
Average5150.924/0.9230.952/0.9430.967/0.9670.884/0.898
Table 2. Distance tests For different symbol combinations.
SymbolsDistance (m)# Frames# Frames A Person Detected Correctly# Frames A Helmet Detected Correctly# Frames YOLOv5 Identified Correctly# Frames YOLOv8 Identified CorrectlyConfidence Average (YOLOv5)Confidence Average (YOLOv8)
Applsci 15 11188 i00153003003002281930.780.75
65105105104723500.870.79
73603603603383260.870.82
83903903903893610.910.85
93903903903292350.840.81
104204204203612690.850.79
114204204202771490.820.75
12420420420222720.80.69
1345045045086650.690.7
14420420420122670.740.69
1548048048023150.620.65
Applsci 15 11188 i0025510510510263100.690.72
64644644641400.580
752252252265130.680.57
84934934930000
9464464464100.530
1043543543502500.59
115225225220000
125515515510000
134934934930000
144934934930000
155225085050000
Applsci 15 11188 i00354644644642031130.730.64
65515515512512670.760.67
75515515511701780.720.62
8493493493126500.730.63
94934934935210.720.49
10551551551700.670
1149349349301600.57
12522522522600.620
135225225220100.48
145225195190000
155705535530200.54
Applsci 15 11188 i004551051051052540.760.79
648048048042270.710.74
74804804800400.72
84804804800000
94504504500000
104504504500000
114804804800000
124504504500000
134804804800000
144504504501320.560.41
1554052652615820.520.48
Applsci 15 11188 i00555105105105084950.930.9
63903903903903890.930.9
74204204204134170.890.85
84504504504144360.830.77
94804804804464130.810.73
104804804804514170.810.69
115105105104033420.770.67
12450450450295680.690.54
135105105102781820.690.56
14450450450720.50.5
15450450450400.530
# Denotes “number of”.
Table 3. Average processing times for an image.
ModelAverage Time (ms)
YOLOv5m11.11
YOLOv8m13.88
Disclaimer/Publisher’s Note: The statements, opinions and data contained in all publications are solely those of the individual author(s) and contributor(s) and not of MDPI and/or the editor(s). MDPI and/or the editor(s) disclaim responsibility for any injury to people or property resulting from any ideas, methods, instructions or products referred to in the content.