Abstract
In open-pit bench blasting design, conventional hole placement methods are limited by their inability to handle irregular blast area boundaries effectively. To address this, an adaptive hole placement algorithm based on Voronoi diagrams is proposed. This algorithm uses Voronoi diagram principles to divide the blast area according to its boundary conditions. Using Lloyd’s algorithm achieves a uniform distribution of blast hole points within the blast zone, enabling the p3rediction of hole coordinates. The algorithm has been developed into a bench blasting design programme using MATLAB R2021a. The programme calculates the required number of blast holes based on coverage area per blast hole charge and blast area. It then completes the entire bench blasting design by incorporating parameters such as the blast area boundary. In practice, this method enables more scientific blast design, demonstrating excellent algorithm stability and computational efficiency. It is particularly adaptable when handling irregular blast area boundaries.
1. Introduction
In the contemporary era, characterised by the advancement of science and technology, engineering blasting is undergoing a transformation towards intelligent and precision-oriented methodologies. In light of the intricacies inherent in rock formations and the delineation of blast zones, there is an increasing emphasis on prioritising safety and timeliness in blasting operations. In order to achieve optimal blasting results, it is essential to select appropriate blasting parameters and strategically arrange borehole locations within the blasting area. Consequently, the integration of intelligent applications within the domain of blasting design is of paramount importance [1,2].
The conventional approach to designing the layout of blasting holes is to create it manually. This method is not only time-consuming and labour-intensive, but it also presents significant challenges in terms of adding, deleting, querying, or modifying holes. The layout patterns that are typically observed are limited to single-row holes, rectangular holes, and staggered holes, resulting in a relatively monotonous approach. This situation has prompted an increasing number of scholars to explore intelligent algorithms for hole layout design, with the aim of replacing manual labour with rapid and accurate hole design [3,4,5]. The implementation of machine learning in the field of blasting engineering has resulted in the establishment of a comprehensive technical closed loop that encompasses data collection, model construction, and decision optimisation. It is customary to designate parameters such as hole spacing and unit charge consumption as the learning targets. The experimental data is summarised from existing blasting cases, followed by the construction of corresponding machine learning models. Finally, based on the requirements for blasting design, recommended values for blasting parameters are output, thereby achieving optimisation of blasting design [6,7]. For instance, Ma et al. [8]. proposed an optimisation model combining Support Vector Regression with a genetic algorithm. This model has been developed to minimise average linear overbreak and maximise fragment diameter. It employs a multi-attribute decision-making approach based on ideal solution similarity prioritisation to determine optimal blasting design parameters. Saaty [9] employed the Analytic Hierarchy Process (AHP) to calculate borehole network parameters, thereby enabling intelligent design of blast hole layouts based on these parameters. Monjezi [10] utilised neural networks to investigate the impact of blasting methods on blast effectiveness. The approach was developed to collect blasting parameters that influence outcomes as training samples. This approach optimised borehole network parameters to adapt hole layouts for varying rock properties, achieving multiple layout configurations within a single blast area. The phenomenon of blasting vibration, a pivotal indicator in the assessment of blasting efficacy, is ordinarily designated as an optimisation objective. The construction of artificial neural network (ANN) models is undertaken for the purpose of predicting peak particle velocity (PPV). Relevant blasting design data is utilised as input parameters, with PPV itself being the output parameter. This approach involves the calculation of the blasting design parameters under the condition of minimum PPV [11,12,13]. The application of machine learning in blasting design is accelerating the industry’s intelligent transformation. Its core value is manifested in three ways: Firstly, it dynamically optimises parameters such as explosive charge quantity and hole spacing through algorithmic integration. Secondly, it establishes a safety early-warning system that classifies rockburst risks and predicts vibration intensity based on microseismic energy and blast centre distance. Thirdly, it advances unmanned operations by combining IoT and GPS technologies to achieve full automation across the entire process—from charging and packing to detonation. Although current technologies face challenges such as insufficient model interpretability, integrating reinforcement learning with multimodal perception technologies will further enhance the precision of blasting operations.
Numerical simulation of blasting, a core technology in modern blasting engineering, recreates the blasting process through computer modelling to provide theoretical support for parameter optimisation [14]. The construction of numerical models is predicated on the morphology of the blasting area and the mechanical properties of rock masses. These models are then employed to simulate physical processes such as the propagation of blast stress waves and rock fragmentation. This has the effect of reducing experimental costs to a considerable degree. Optimal blasting design schemes are selected on the basis of simulation results. The primary methods employed in this study encompass discrete element, finite element, and coupled simulation software [15,16]. Some scholars have combined intelligent algorithms with numerical simulations to study the optimal blasting design parameters in blasting operations [17,18]. However, numerical simulation can only account for a portion of the factors influencing actual blasting operations, while more complex factors remain unrepresented. Consequently, blasting tests continue to represent a fundamental research methodology. It is possible to derive locally applicable blasting design parameters through regression analysis of extensive blasting test data [19,20]. It is evident that certain methodologies are employed in order to optimise the design of blasts through theoretical derivation. Hyun [21] conducted an analysis of the three-dimensional spatial distribution of rock in the mining area, with a view to deriving blast parameters that influence blast pile distribution. Through theoretical analysis of how blast parameters affect outcomes, he proposed an optimised blast design methodology and completed the design of the blast network. In this study, Onder [22] evaluated the positions of blast holes based on the vibration effects from blasting. Building on this, he refined the placement of blast holes and proposed enhancing the performance of blasting by modifying the spatial distribution, number, and charge quantities of blast holes.
In summary, the majority of scholars currently seek to optimise blasting designs through the refinement of hole network parameters, the evaluation of blasting effectiveness, and the development of design software, with limited research being conducted on the optimisation of hole placement methods. The advent of artificial intelligence algorithms has precipitated a paradigm shift in the domain of blasting design. Concomitant with the trend towards intelligent and unmanned engineering blasting, intelligent blasting technology is set to assume a pivotal role.
The present study addresses the shortcomings of traditional hole placement methods and makes the following major contributions to the scientific field:
- Further Advancements in Scientific Blasting Design: The proposal is of an adaptive hole placement method, the basis of which is the boundary shape of the blasting area. This approach is predicated on the recognition that the irregular shapes of blasting zones in actual engineering projects are to be expected. The integration of parameters such as explosive consumption per unit area and blast zone area facilitates the calculation of hole coordinates, thereby ensuring a more uniform distribution of explosive energy throughout the entire blast zone.
- The efficiency of blasting design has been enhanced. The programme design of the study facilitates rapid automated computer calculations and visualises the hole layout process within the blast area, thereby rendering blasting design more intuitive.
- The calculation of both the integrated hole positioning and the charge quantity is imperative. The quantity of charge required for each hole can be calculated based on parameters such as the blast coverage area and drilling depth.
2. Materials and Methods
2.1. Subsection
It is to be posited herewith that a set of borehole points, designated S = (s1, s2,…, s_n), is to be distributed throughout the entire blasting area. The positioning of these boreholes adheres to the equilateral triangle principle, ensuring uniform spacing. It is imperative to note that each borehole possesses a distinct blast coverage area. In the event that two boreholes contain equivalent quantities of explosives, the blast coverage areas of said boreholes are also identical. In accordance with the principles of rock blasting theory, the stress waves generated by each borehole explosion propagate outward in concentric circles. The objective of borehole placement is to maximise the coverage of the entire blast area by the combined effects of all boreholes while minimising overlap between adjacent boreholes’ blast zones, thereby ensuring optimal utilisation of explosive energy. Consequently, the borehole layout problem can be transformed into a graph filling problem in computer graphics. The energy distribution characteristics of the borehole arrangement are taken into consideration, as are Voronoi diagrams for regional partitioning. The result of this process is that each borehole is assigned a region that approximates its energy distribution.
A Voronoi diagram is a method for the division of a plane by the insertion of a set of points [23,24]. The fundamental principle of this method involves the enumeration of the inserted points, the establishment of connections between adjacent points while ensuring the avoidance of intersecting lines, and the triangulation of the space. For each connecting line, a perpendicular bisector is drawn, and adjacent perpendicular bisectors intersect at a single point. These points function as nodes for newly generated polygons, while the perpendicular bisectors form the edges of the polygons containing the connection line vertices, thereby ultimately partitioning the plane into polygonal regions. It is evident that any point q within a polygon is proximate to the boreholes, and the distance from a point on the perpendicular bisector to the two adjacent boreholes is equal. This relationship can be expressed mathematically as follows:
where q is the position of the point inside the polygon, si is the position of the i-th borehole point, and d (q, si) is the distance between point q and si.
The primary advantage of the Voronoi diagram is its spatially equidistributed nature, which is manifested in the following aspects:
- It is evident that each Voronoi diagram contains a single discrete point. The quantity of polygons can be ascertained through the determination of the number of discrete points within the area, thereby establishing a one-to-one correspondence between them. The allocation of a unique identifier to each discrete point enables the rapid identification of its corresponding polygon location, thereby facilitating the querying of borehole positions and the determination of borehole coverage areas.
- It can be demonstrated that each point in the Voronoi diagram is closest to the discrete points it encompasses. The points on the polygon’s edges are equidistant from their two nearest discrete points. The utilisation of the polygon’s coverage area as the blast coverage area for each borehole ensures the maximum achievable coverage range.
- The distribution characteristics of points, such as whether two discrete points are adjacent or whether their distribution is uniform, can be determined based on the polygon’s distribution pattern. This process facilitates the confirmation of the relative positions of blast holes. It is evident that by modifying the polygon’s distribution state, the distribution of discrete points within it can be indirectly modified. This, in turn, facilitates the determination of blast hole detonation sequences.
- It is evident that each Voronoi diagram assigns an edge to adjacent discrete points, with the number of polygon edges corresponding to the number of surrounding discrete points. From the perspective of blast hole arrangement, the detonation of each blast hole assigns a free surface to adjacent blast holes, thereby predicting the dispersion direction following the subsequent detonation of a blast hole.
As demonstrated in Figure 1, the preliminary arrangement of drill holes establishes a triangular configuration. The process of connecting adjacent holes in pairs, whilst utilising each side of the triangle as a perpendicular bisector, results in the intersection of all perpendicular bisectors at new nodes. These nodes thus serve as the vertices of the Voronoi diagram. In the case of boundary points, the intersection of the boundary line and the perpendicular bisector is taken as the vertex of the polygon. In the event of points exhibiting uniform distribution, the application of Voronoi diagram partitioning gives rise to the formation of polygons that are characterised by shapes that are highly similar and areas that are almost identical. The positions of the blast holes exhibit a high degree of alignment with the shape centres of the Voronoi diagram. In an object of uniform density, the centre of mass coincides with the shape centre. The treatment of the blast hole arrangement as a uniformly distributed planar geometry enables the substitution of the geometric centre of mass coordinates for the shape centre coordinates.
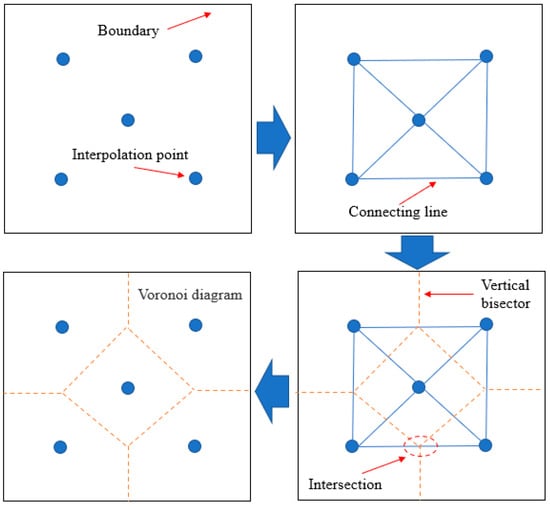
Figure 1.
Voronoi diagram generation process.
2.2. Algorithm Design
The fundamental concept of the algorithm involves the insertion of blast hole points within the designated area based on boundary conditions, the number of blast holes, and the blast coverage area. In accordance with the Voronoi diagram partitioning principle, the Voronoi region of each blast hole point approximates its effective coverage area until the entire layout area is filled. The calculation of the centroid of each Voronoi diagram enables the subsequent relocation of each blast hole point to the position of its corresponding Voronoi diagram’s centroid. It is evident that, due to the inherent characteristics of Voronoi diagrams, the centroid position is subject to variation in accordance with the configuration of the polygon. The process of iterative updates and recalculations of the polygon centroids serves to ensure the uniformity of all Voronoi diagrams. It is evident that each blast hole is characterised by an equidistant boundary with its adjacent holes. Upon the detonation of a single blast hole, the boundary in question becomes the free surface for the adjacent holes.
Lloyd’s algorithm is a clustering algorithm that is frequently employed to address data classification and reconstruction problems [25]. The fundamental principle of this approach entails the establishment of k cluster centres, the calculation of the distances from other points to these cluster centres, and the subsequent assignment of all points to the nearest cluster centre based on their data distortion. This process is undertaken to minimise the sum of squared distances from the cluster points to the assigned points.
The calculation process is outlined as follows:
First, the construction of a dataset should be initiated with an initial number of cluster points k = 1 and an initial dataset distortion D(0) = 0.
where yi is the i-th data point, and M is the total number of points in the dataset.
Calculate the boundary conditions to determine the dividing line for clustering points within the dataset.
where bj is the boundary point.
Calculate the distortion of the data.
where fX(x) is the probability density function.
Set the data distortion threshold ε. When the difference between two distortion values falls below the specified threshold, iteration stops; if it exceeds the threshold, iteration continues.
Set k = k + 1, add one cluster point, and recalculate the dataset. Repeat the calculation until all data distortion meets the requirements or the maximum iteration count is reached, then stop.
where yj is the position after iteration.
Utilising the Voronoi diagram’s centroid positions as cluster centres, the Lloyd algorithm governs the initial discrete points (i.e., borehole coordinates) to move towards the centroid positions based on the nearest-neighbour principle. During this process, changes in the initial node positions cause deformation of the Voronoi diagrams partitioned around them, leading to shifts in each Voronoi diagram’s centroid position. Consequently, during the execution of the Lloyd algorithm, it is necessary to recalculate and re-evaluate the cluster centre positions. It is evident that, given all point sets undergo position optimisation using identical criteria and parameter weights, the overall optimisation process progresses rapidly with minimal disruption. As the number of iterations increases, it has been demonstrated that all point sets converge towards a uniform distribution, and the areas of their corresponding Voronoi diagrams become more evenly distributed. In conclusion, it can be demonstrated that all borehole points ultimately move to or very close to the centroid positions. In accordance with the fundamental principle of the Voronoi diagram, all points within its designated domain are closest to the centre point. Consequently, this point can be utilised as the coordinate location for the drill hole, and its coverage area can be regarded as the effective range of the drill hole. The movement process can be described as follows, the algorithm flowchart is shown in Figure 2.
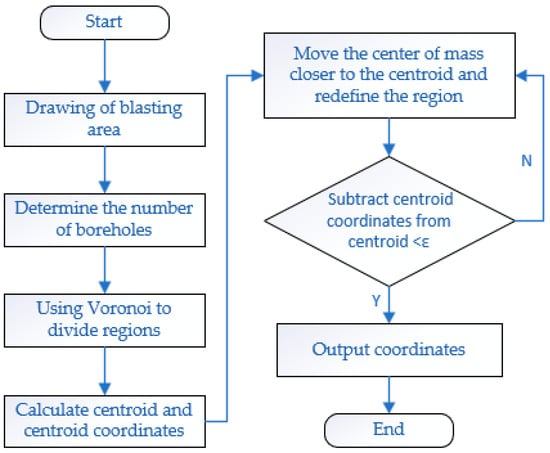
Figure 2.
Algorithm flowchart.
- The initial step involves determining the number of blast hole points and performing preliminary Voronoi diagram partitioning based on their positions.
- The calculation of the centroid positions of the Voronoi diagram is required, along with the implementation of Lloyd’s algorithm to direct the movement of blast hole points towards these centroids. This process will result in the deformation of each polygon.
- The third step in the process is to recalculate the centroids of the deformed polygons, re-evaluate the target positions of the point set, and then execute the movement.
- The positional movement must be completed in order to generate the hole distribution map.
2.3. Borehole Coordinate Calculation
The acquisition of hole position coordinate data is predicated on a fundamental deployment algorithm based on the Voronoi diagram, specifically the centroid deployment algorithm. The centroid algorithm is a geometric method based on planar convex polygons. The centroid, otherwise known as the geometric centre, of a polygon is defined as the arithmetic mean position of all points within the shape. It can be demonstrated that a line through the centroid bisects the polygon into two equal areas [26]. The method for calculating the coordinates of the centroid of a planar convex polygon is shown in Formula (7).
where (x, y) are the vertex coordinates of a planar convex polygon, and (Cx, Cy) are the coordinates of its centroid.
In Formula (7), A is defined by Formula (8):
The first step in this process is to determine the actual coordinate positions of the target area, based on the satellite positioning principle for blast hole layout in actual engineering projects. In order to facilitate the calculation process, it is necessary to convert the coordinate positions. This involves the transformation of the actual geographic coordinates into relative coordinates. This objective is realised through the subtraction of each coordinate point from its respective minimum coordinate value. This ensures that each coordinate value remains positive while preserving the relative positions of all blast holes. Subsequent to calculation, each coordinate is converted back to its actual positioning coordinate. This method yields relative coordinate values because, during the process of boundary treatment for blasting, each coordinate is subtracted from its actual minimum value in order to represent the relative position of each node. This process serves to reduce the volume of data. Consequently, coordinate conversion is imperative for effective implementation.
2.4. Calculation of Number of Gun Holes
The goal of blasting design is to fully utilise explosive energy for rock fragmentation, achieving optimal borehole effects with minimal energy consumption. According to rock fragmentation theory, when rock properties and other conditions are uniform and evenly distributed, the resulting energy distribution can be approximated as a circular pattern. All boreholes collectively accomplish fragmentation across the entire blast zone. Therefore, each borehole possesses a reasonable blast coverage area, calculated using the method shown in Formula (9).
where S is the blast coverage area in m2; a is the hole spacing, m; b is the row spacing, m.
The number of blast holes can be determined based on the ratio of the blast zone area to the blast coverage area.
where nc is the number of blast holes; Sz is the area of the blast zone, in m2.
The area of the blast zone can be regarded as the area of an irregular polygonal region. Based on the boundary coordinates of the blast zone, the area can be calculated using the simplex integration method. This involves dividing the entire blast zone shape into several triangles, integrating each triangle to determine its area, and finally summing all triangle areas in an ordered manner.
2.5. Calculation of Charge Quantity
Liu [27] proposed using the area of Voronoi diagrams to calculate charge quantities. In this approach, each Voronoi diagram encompasses one blast hole. It is assumed that the rock and soil medium within each diagram represents the failure area when the associated blast hole is destroyed. Therefore, the charge quantity for each blast hole can be calculated using the volumetric principle. The charge quantity for each borehole is calculated based on its blast coverage area. This involves determining the coordinates of all the vertices within the polygon containing each borehole statistically, numbering them in a clockwise direction and calculating the area of each Voronoi diagram using the method for calculating the area of a convex polygon described above. The total coverage area is then computed using a summation formula and compared with the blast area to verify the accuracy of the results. The charge quantity formula is shown in Equation (11).
where Si is the area of the polygon containing the i-th borehole; Qi is the charge quantity for the i-th borehole; H is the borehole depth; q is the unit consumption of explosives.
3. Punching Hole Algorithm Simulation
3.1. Rectangular Boundary
The design requires arranging the blasting area as a rectangle measuring 30 m in length and 15 m in width. The boundary coordinates are [0, 0; 0, 15; 30, 15; 30, 0]. The hole spacing and row spacing are 5 m and 3 m, respectively. Based on the aforementioned method for calculating the number of blast holes, the area of the hole layout region is determined to be 450 m2. Each blast hole covers an area of 15 m2. Calculations indicate that 30 blast holes need to be arranged.
Based on the hole layout algorithm principle, the blast boundary coordinates are sorted clockwise. The blast area boundary is delineated according to the coordinate data, and 30 points are randomly distributed within the boundary area as the initial distribution of blast holes.
As shown in Figure 3, the initial two discrete points are randomly distributed within the designated blasting area.
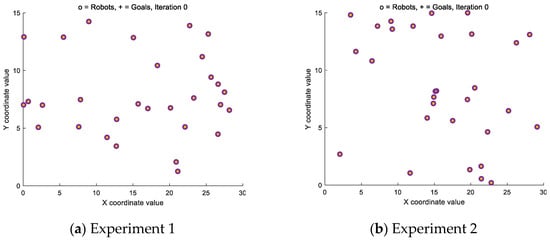
Figure 3.
Distribution of initial discrete point.
Based on the Voronoi formation principle, perform a Voronoi triangulation with the initial points as target points to identify all qualifying Voronoi edges and their corresponding vertices. Number each triangle formed by these Voronoi edges. Count the triangle numbers connected to each blast hole point, sort them clockwise, and group these triangles. Calculate the centre of the circumcircle for all triangles within each group. connect these centres in a clockwise direction. For boundary handling, intersect the boundary using the perpendicular bisector of the nearest Voronoi edge. This ultimately forms the Voronoi diagram, and the coordinates of the initial Voronoi diagram’s centroid are calculated, the division results are shown in Figure 4.

Figure 4.
Voronoi diagram region division.
In each depicted Voronoi diagram, the initial point is denoted by ‘o’ and the centroid position by ‘+’. To make the boundaries and coverage areas of each polygon more distinguishable, they are filled with different colours.
Lloyd’s algorithm is used to move the positions of the drill holes within each diagram until they overlap with the corresponding centroid positions, the calculation process and results are shown in Figure 5.
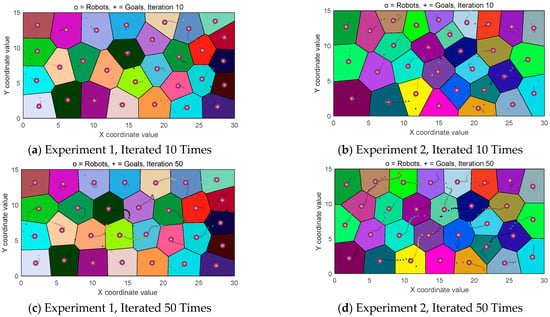
Figure 5.
Algorithm hole layout process.
Based on the properties of Voronoi diagrams, shifting the cannon hole positions within each polygon alters its shape, thereby affecting the location of the centroid of each Voronoi diagram. As shown in the figure comparing the two simulation results, the shapes of all Voronoi diagrams exhibit increasingly similar trends as the iteration count increases, with the most pronounced change occurring at the 10th iteration. By the 50th iteration, the shape variations in the Voronoi regions are minimal. Comparing the two experiments reveals that, as the iteration count increases, the two hole distribution results become increasingly similar. This demonstrates that using the Lloyd algorithm to modify the blast hole coordinates can produce more uniform Voronoi diagrams.
3.2. Irregular Boundary
In order to evaluate the adaptability of the algorithm for hole placement in irregular polygonal areas, the blasting zone is defined as a polygonal region composed of the following coordinate points, measured in metres: [0, 0; 0, 12; 5, 15; 12, 10; 18, 10; 25, 15; 30, 8; 18, 0; 10, 0; 6, 5]. The hole and row spacings are 4 m and 2.5 m, respectively. Based on the aforementioned method of calculating the number of blast holes, the area of the polygon is 287 m2, with each blast hole covering an area of 10 m2. Preliminary calculations indicate that 29 blast holes are required.
Following the hole layout algorithm principle, first sort the blast boundary coordinates clockwise. Plot the blast area boundary based on the coordinate data. Within this boundary, randomly distribute 29 points to mark the initial drill hole locations.
As shown in Figure 6, the initial distribution of discrete points in both experiments is random.
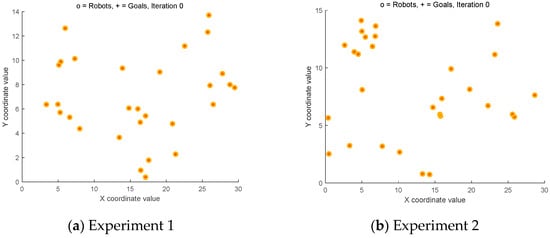
Figure 6.
Discrete points.
The principle of Voronoi diagram generation has been explained previously and will not be repeated here, the division results are shown in Figure 7.

Figure 7.
Voronoi diagram region division.
In each Voronoi diagram depicted, points are denoted by “o” and centroid positions by “+”. To better distinguish each polygon’s boundary and coverage area, they are filled with distinct colours.
Utilise Lloyd’s algorithm to move each borehole position within a Voronoi diagram until it overlaps with the corresponding centroid position in that diagram.
As shown in Figure 8, this algorithm demonstrates excellent adaptability to irregularly shaped blast zones. When the iteration count reaches 50, it effectively fills the entire blast zone.
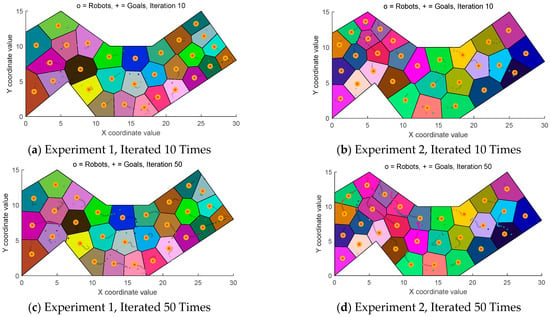
Figure 8.
Algorithm hole layout process.
3.3. Analysis of Simulation Results
3.3.1. Coefficient of Variation
Based on the properties of Voronoi diagrams, when the positions of the discrete points they contain change, the shape and area of the polygons correspondingly alter. Jalilibal et al. [28] proposed using the coefficient of variation in area to describe the degree of area change, thereby reflecting the distribution of discrete points within the hole layout region. This coefficient of variation, also known as the CV value, is typically expressed as the ratio of the standard deviation to the mean. The calculation formula is as follows:
where Si is the area of the i-th blast hole, S is the mean area of all blast holes, n is the number of blast holes, and R is the standard deviation of the polygon area.
Duyckaerts [29] proposed a method using the CV value to characterise point set distribution, classifying distribution patterns into three types: uniform, random, and clustered. A smaller CV value indicates more uniform distribution, while a larger CV value suggests clustered distribution. Recommended CV value ranges for these three distribution types are provided in Table 1.

Table 1.
Distribution types corresponding to CV values.
The area of each Voronoi diagram is computed using the convex polygon area calculation method described above. This involves calculating the coordinates of all vertices within each polygon corresponding to a blast hole, sorting them in a clockwise direction and assigning sequential numbers. After summing the areas of all the polygons, the total coverage area is derived using a summation formula. This value is then compared with the total area of the blast zone to validate the accuracy of the results. The calculation formula is shown in Formula (13).
where Si is the area of the i-th blast hole, and (xn, yn) are the coordinate values of the n-th vertex in the Voronoi diagram.
To evaluate the effectiveness of borehole layout using the hole placement algorithm, the areas of both rectangular regions and irregular Voronoi diagrams were collected. Samples were taken from polygons corresponding to iteration counts of 1, 5, 10, 15, and 20. Using these sample data, the area changes for each polygon under different iteration counts were calculated.
Figure 9a shows how the CV value varies for the rectangular blast area with different iteration counts. Under identical experimental conditions, five experimental results were statistically analysed. It can be seen that, at the initial distribution state (i.e., an iteration count of 1), the coefficient of variation consistently exceeds 58%, with some results exceeding 64%. This indicates significant area variation. The corresponding blast hole point distribution was predominantly random and clustered. As illustrated in Figure 4, the blast hole point distribution was scattered, with some point sets exhibiting clustering phenomena. When the iteration count reached five, the CV value ranged from 27% to 38.9%, primarily exhibiting random and uniform distributions. The area differences between polygons decreased significantly compared to the single iteration, with no clustering phenomena remaining. This suggests that, following iteration, blast hole locations tend towards uniform distribution. When the iteration count reaches 10, the CV values range from 16% to 23.5%. At this stage, the area differences are relatively small and the borehole distribution has become uniform. Compared to the five-iteration case, the CV values have decreased significantly. When the iteration count reaches 15, the CV values primarily range between 12.6% and 17%, which is a slight decrease compared to 10 iterations. At this point, the area differences between polygons are even smaller and the blast hole point distribution becomes more uniform. After 20 iterations, the CV values are predominantly within the 15% range, showing a slight decrease compared to 15 iterations and indicating a higher degree of uniformity.
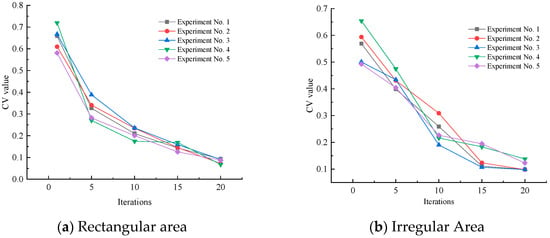
Figure 9.
CV curve.
Figure 9b shows how the CV value varies with increasing iteration count during irregular area hole placement. Five trials were conducted under identical experimental conditions. When the iteration count is 1 (i.e., the initial distribution state), it is evident that the CV values range from 48.5% to 59.3%, corresponding to a predominantly random distribution of blast hole points. As illustrated in Figure 7, the blast hole point distribution appears scattered and irregular. After five iterations, the CV values range from 39.8% to 47.4%. While the blast holes still exhibit random distribution, they demonstrate significantly reduced clustering compared to the initial iteration. Clustering phenomena no longer occur, indicating that, after iteration, the blast hole locations exhibit a trend towards uniform distribution. When the iteration count reaches 10, the CV values range from 19% to 30.9%. At this point, the area differences are relatively small and the blast hole distribution has become uniform. Compared to the fifth iteration, the CV values have decreased significantly. When the iteration count reached 15, the CV values primarily ranged between 10.7% and 19.5%, showing a slight decrease compared to 10 iterations. At this point, the polygon area variations were smaller, and the borehole point distribution became more uniform. At 20 iterations, the CV values primarily fall within 13.7%, showing a slight decrease compared to 15 iterations and indicating higher uniformity. Overall, as the algorithm undergoes continuous updates and iterations, the area variability of the Voronoi diagram progressively diminishes, and the distribution of discrete points becomes increasingly uniform. The most pronounced changes occur during the early stages of iteration, with the rate of change gradually decreasing thereafter. However, the degree of uniformity continues to improve, indicating that the algorithm effectively optimises the uniform distribution of the Voronoi polygons.
To investigate the adaptability of the algorithm, 10 sampling points were placed within the same area. To mini mise the impact of random factors, the iteration count was set to 200. After each experiment, the area of the polygon was calculated and the coefficient of variation in area was computed.
Figure 10 shows the experimental results within the rectangular region as a black line. As can be seen, with the exception of the ninth experiment, where the coefficient of variation (CV) value reached 8.36%, all other results fell between 5.5% and 7%. The mean CV value across ten experiments was 6.44%, with a variance of 5.57 × 10⁻⁵. The red line shows the CV curve for the irregular region. All the experimental results fall within the range of 6% to 10%. The mean CV value across the ten experiments is 8.19%, with a variance of 9.57 × 10⁻⁵. Compared to the rectangular region, the irregular region exhibits greater deviation in the hole distribution results. Overall, the variation in both sets of results is relatively small, indicating the stability of the hole distribution algorithm.
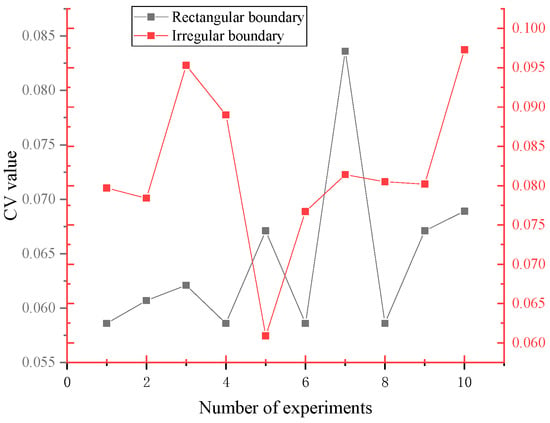
Figure 10.
CV value under the same number of iterations.
3.3.2. Energy Distribution
According to rock blasting fragmentation theory, the effective range of explosives detonating within a borehole can be approximated as a circular area. The effective radius is calculated by converting the coverage area of each borehole’s polygon into a circular coverage area. The coverage range is then plotted using each borehole as the centre, as shown in Figure 11.
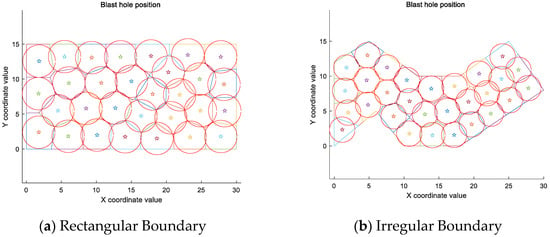
Figure 11.
Coverage of equal area circle.
As can be seen in Figure 11, the hole distribution generated by this algorithm resembles a triangular arrangement of holes. Within the rectangular area, the circles essentially cover the entire placement region. Each blast hole exhibits minimal overlap in its effective range, resulting in a high degree of uniformity in energy distribution. In irregular regions, the distribution is primarily influenced by boundary conditions. While circle coverage at the edges is poorer than in the rectangular area, coverage within the interior regions is comparable. Both arrangements enable blast energy from the holes to significantly cover the entire area.
To better visualise the distribution between the blast holes and reduce visual interference from overlapping areas, the average distance from the boundary blast holes to the boundary was calculated. The statistical results for the boundary points in the rectangular and irregular areas were 1.88 and 1.62, respectively. Circles were then drawn with these values as radii for analysis, and the results are shown in Figure 12.
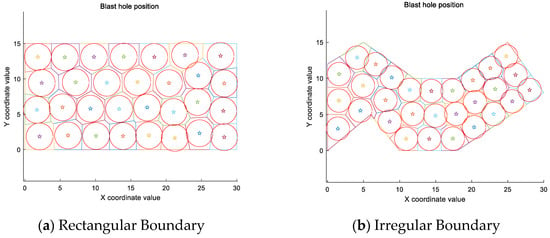
Figure 12.
Coverage of equally spaced circles.
As illustrated in Figure 12, the inner circles within both drilling zones are similar to the inscribed circles of Voronoi diagrams. In the rectangular zone, the inner circles are largely mutually tangent, with minimal overlap between adjacent blast holes. This achieves a uniform distribution across the entire area. The inner circle distribution in the irregular zone is less optimal than in the rectangular zone. Due to the boundary conditions of the blasting area, some adjacent blast holes along the boundaries are spaced further apart, although the interior remains uniformly distributed overall.
3.3.3. Computational Complexity
Figure 13 shows the flame plot of the computational time complexity for the simulation experiment of irregular blast zone boundaries, with the iteration count set to 200. The total computation time for this experiment was 19.380 s. Maximum possible array: 5361 MB (5.621 × 109 bytes), Memory used by MATLAB: 3008 MB (3.155 × 109 bytes), Physical memory (RAM): 16,304 MB (1.710 × 1010 bytes).

Figure 13.
Calculate time complexity.
4. Engineering Application Examples
4.1. Data Collection
This application selected a bench at a specific mine as the target. A 3D laser scanner (Maptek I-Site 8820 model) was used to acquire point cloud data of the bench [30]. Traditionally, the blast zone is selected by marking points directly via RTK (real-time kinematic). This method is subject to human error, resulting in random point selection. Additionally, for safety reasons, hazardous boundaries are often estimated. Conversely, this method is time-consuming and labour-intensive, as it requires surveyors to traverse the entire blast area to obtain detailed coordinate points, resulting in low efficiency.
Three-dimensional point cloud data of the blast area was acquired using 3D laser scanning technology. This data was then imported into Maptek I-Site Studio 5.1 software. Analysis of the data generated a 3D point cloud model, as shown in Figure 14a. Boundary points were selected directly on the point cloud model through manual interaction, as depicted in Figure 14b. This process yielded the coordinate data of the blast area boundary, which is listed in Table 2. This method provides a safe and efficient means of acquiring data with excellent operational feasibility.

Figure 14.
Three-dimensional laser scanning data acquisition.

Table 2.
Three-dimensional laser scanner data.
4.2. Coordinate Transformation
The coordinate point data obtained from the 3D laser scanner will undergo preprocessing. This involves selecting the smallest values from Table 2: the X-coordinate is 698,262.378 and the minimum Y-coordinate is 5,570,406.292. All the values in Table 2 are then subtracted from these minimum values to convert them into the relative coordinates required by the algorithm. Based on these values, the blasting boundary is delineated, yielding the corresponding relative coordinates of the boundary, as shown in Table 3.

Table 3.
Coordinate point conversion.
The blasting hole layout boundary was mapped based on the boundary points derived from the conversion, using the hole layout algorithm (see Figure 15). The area of the blasting zone was found to be 2803.3 m2. According to empirical formulas, the coverage area per blast hole is 30 m2. Consequently, the number of blast holes required for this area was determined to be 93.
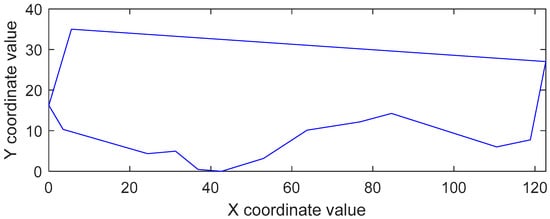
Figure 15.
Drawing of blasting boundary.
4.3. Algorithmical Hole Placement Results
The blast hole pattern for the aforementioned blast area was designed using the hole layout algorithm. The parameters were input into the algorithm, with the iteration count set to 200. Figure 16 shows the final hole layout.
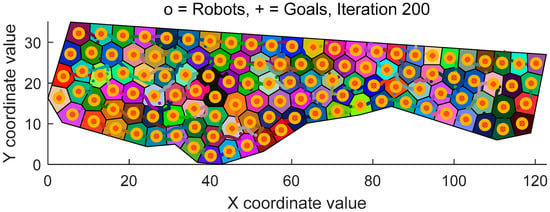
Figure 16.
Hole layout results.
The coordinates of each blast hole and the blast coverage area were calculated using the hole layout algorithm. The relative coordinate positions of each blast hole were determined, with partial results shown in Table 4.

Table 4.
Hole layout coordinates and area.
Convert the generated coordinates into geodetic coordinates. Then, calculate the corresponding charge quantity for each borehole using formula (10). The selected design results are shown in Table 5.

Table 5.
Hole location design.
5. Discussion
Traditional hole layouts primarily comprise single-row and multi-row configurations. The latter are further subdivided into rectangular and triangular patterns. All three methods are based on hole and row spacing. In terms of effectiveness, single-row and rectangular layouts offer greater uniformity, making them ideal for blast zones with regular boundaries. Triangular layouts achieve a more even internal distribution but often require additional holes along the perimeter. Triangular hole patterns utilise energy more efficiently from an energy distribution perspective, facilitating effective control of blast block size. However, rectangular patterns necessitate precise control of charge quantities, requiring adjustments during construction based on actual requirements. Traditional hole layouts for irregular bench boundaries often require manual adjustments. This approach involves significant labour—adjusting the first row necessitates sequential adjustments to subsequent rows—and is prone to subjective influences, resulting in hole placements that lack rational justification.
The Voronoi method, which is currently favoured by scholars, typically involves conducting a traditional blast hole design first, and then using Voronoi’s region partitioning capability to divide the entire blast area into smaller sections. The quantity of explosives required is then calculated based on the area of the Voronoi cell containing each blast hole. However, irregular boundaries are still handled during the blast hole design phase. This study takes the opposite approach, first partitioning the area based on the blast zone boundary and then adjusting the positions of the boreholes to achieve a uniform distribution across the entire blast area. This method more effectively addresses issues relating to irregular boundaries in blast design by dynamically adjusting the locations of holes according to blast parameters such as boundary shape and charge quantity, thereby eliminating the disadvantages of manual subjective adjustments. Furthermore, the algorithm demonstrates excellent stability, producing minimal experimental error in each run. Under identical conditions of area shape and blast hole count, ten trials with two hundred iterations each were conducted. The results showed that, within rectangular areas, the mean CV value was 6.44%, with a variance of 5.57 × 10⁻⁵; in irregular areas, the mean CV value was 8.19%, with a variance of 5.57 × 10⁻⁵. This demonstrates the high stability of the hole layout algorithm. Moreover, the drilling effect progressively improves with increasing iterations. Comparative experiments between regular rectangular and irregular blast zones revealed that the CV values in both areas decreased significantly with each additional iteration, ultimately falling below 10% to achieve high uniformity. Future research could build on this foundation by considering drilling principles for different rock types and incorporating blast effect prediction to refine blast design.
This approach also has certain limitations. Firstly, the method is based on traditional blasting design concepts and does not adequately consider variations in actual rock properties or local adjustments to explosive consumption rates. Secondly, converting the blasting plan design into a geometric problem makes inadequate use of geological data and results in an incomplete description of the blasting area. Thirdly, the treatment of blast zone boundaries results in poor energy distribution along irregular edges. This problem cannot be avoided using traditional manual methods and can only be mitigated based on actual requirements. Future research could address these issues by taking the heterogeneous nature of rock masses into full consideration, thereby resolving boundary issues more effectively and overcoming these limitations.
6. Conclusions
Grounded in rock fragmentation theory and bench blasting excavation principles, this study summarises the principles of rational hole placement design. These principles ensure a uniform distribution of explosive energy across the entire blast zone, reducing blasting costs and enhancing blasting quality while facilitating construction. The study proposes an intelligent hole placement method based on blast zone boundary conditions. Key research findings include the following:
- The Lloyd algorithm was adapted to optimise Voronoi diagram distribution patterns, and the necessary software was developed. Simulation validation demonstrated the stability of the algorithm, minimal experimental error and progressively improved hole placement quality with increasing iterations.
- This method effectively addresses irregular boundary issues in blast zones when applied to blast design, making the design process more scientific while improving efficiency. The method meets the requirements of bench blasting design and has been validated in engineering practice.
- This method can be integrated with advanced technologies, such as UAV photogrammetry and intelligent robots, to create a unified, intelligent approach for rapidly acquiring data, designing blasts precisely, and accurately detecting borehole locations. It is highly applicable in scenarios such as highway, mining and tunnel blasting.
Author Contributions
Conceptualization, M.H. and X.Z.; Methodology, M.H. and X.Z.; Validation, W.G.; Formal analysis, M.H. and X.L.; Investigation, M.H., X.L. and W.G.; Resources, X.Z.; Data curation, X.Z.; Writing—original draft, M.H., X.L. and W.G.; Writing—review and editing, M.H. and X.Z.; Visualisation, X.L. and W.G.; Supervision, M.H. and X.Z. All authors have read and agreed to the published version of the manuscript.
Funding
This work is supported by the Beijing Postdoctoral Research Foundation (2022-ZZ-100), the Chaoyang District Postdoctoral Work Foundation, and the Foundation of Hubei Key Laboratory of Blasting Engineering.
Institutional Review Board Statement
Not applicable.
Informed Consent Statement
Not applicable.
Data Availability Statement
The original contributions presented in this study are included in the article. Further inquiries can be directed to the corresponding author.
Conflicts of Interest
Author Xiaoshuai Li was employed by the company Beijing Beikuang Yibo Technology Co., Ltd., Mining and Metallurgy Technology Group Co., Ltd. The remaining authors declare that the research was conducted in the absence of any commercial or financial relationships that could be construed as a potential conflict of interest.
References
- Zhou, J.; Zhang, Y.; Qiu, Y. State-of-the-art review of machine learning and optimization algorithms applications in environmental effects of blasting. Artif. Intell. Rev. 2024, 57, 5. [Google Scholar] [CrossRef]
- Abd Elwahab, A.; Topal, E.; Jang, H.D. Review of machine learning application in mine blasting. Arab. J. Geosci. 2023, 16, 133. [Google Scholar] [CrossRef]
- Aydin, A. Fuzzy set approaches to classification of rock masses. Eng. Geol. 2004, 74, 227–245. [Google Scholar] [CrossRef]
- Zhou, J.; Li, X.-b. Integrating unascertained measurement and information entropy theory to assess blastability of rock mass. J. Cent. South Univ. 2012, 19, 1953–1960. [Google Scholar] [CrossRef]
- Ma, X.; Wang, Y.; Lin, T.; Yang, L. Intelligent decision system for vertical shaft blasting scheme based on knowledge base and its application. IEEE Access 2021, 9, 163831–163842. [Google Scholar] [CrossRef]
- Bai, R.; Zhang, P.; Zhang, Z.; Sun, X.; Fei, H.; Bao, S.; Hu, G.; Li, W. Optimization of blasting parameters and prediction of vibration effects in open pit mines based on deep neural networks. Alex. Eng. J. 2023, 70, 261–271. [Google Scholar] [CrossRef]
- Kim, Y.; Lee, J.-K.; Lee, S.S. A fundamental study on the automation of tunnel blasting design using a machine learning model. J. Korean Tunn. Undergr. Space Assoc. 2022, 24, 431–449. [Google Scholar] [CrossRef]
- Ma, Z.; Gu, J.; Zhao, Q.; Yang, M.; Qian, C.; He, M.; Hei, X. Intelligent Optimization of Blasting Parameters in Railroad Tunnels Based on Blasting Quality Control. J. Constr. Eng. Manag. 2025, 151, 04025094. [Google Scholar] [CrossRef]
- Saaty, T.L. Decision making with the analytic hierarchy process. Int. J. Serv. Sci. 2008, 1, 83–98. [Google Scholar] [CrossRef]
- Monjezi, M.; Dehghani, H. Evaluation of effect of blasting pattern parameters on back break using neural networks. Int. J. Rock Mech. Min. Sci. 2008, 45, 1446–1453. [Google Scholar] [CrossRef]
- Rezaeineshat, A.; Monjezi, M.; Mehrdanesh, A.; Khandelwal, M. Optimization of blasting design in open pit limestone mines with the aim of reducing ground vibration using robust techniques. Geomech. Geophys. Geo-Energy Geo-Resour. 2020, 6, 40. [Google Scholar] [CrossRef]
- Zhou, J.; Koopialipoor, M.; Murlidhar, B.R.; Fatemi, S.A.; Tahir, M.; Jahed Armaghani, D.; Li, C. Use of intelligent methods to design effective pattern parameters of mine blasting to minimize flyrock distance. Nat. Resour. Res. 2020, 29, 625–639. [Google Scholar] [CrossRef]
- Paurush, P.; Rai, P.; Sharma, S.K. Selection of blasting design parameters affecting peak particle velocity—A case study. Min. Metall. Explor. 2021, 38, 1435–1447. [Google Scholar] [CrossRef]
- Miao, S.; Konicek, P.; Pan, P.-Z.; Mitri, H. Numerical modelling of destress blasting–a state-of-the-art review. J. Sustain. Min. 2022, 21, 278–297. [Google Scholar] [CrossRef]
- Afrasiabian, B.; Ahangari, K.; Noorzad, A. Study on the effects of blast damage factor and blast design parameters on the ground vibration using 3D discrete element method. Innov. Infrastruct. Solut. 2020, 5, 37. [Google Scholar] [CrossRef]
- Vishwakarma, A.K.; Dey, K.; Himanshu, V.K.; Singh, R.K.; Roy, M.P. Optimization of blast design parameter for ring blasting in underground hard rock mine using numerical simulation. Min. Metall. Explor. 2024, 41, 139–148. [Google Scholar] [CrossRef]
- Gaoyu, M.; Bo, W.; Chuan, H.; Junlou, W.; Chengyou, Z.; Zihan, Z.; Guowen, X. Intelligent Design for Mechanized Drilling and Blasting Tunnels Based on Massive Numerical Simulations and Machine Learning Algorithms. J. Basic Sci. Eng. 2024, 31, 1601–1616. (In Chinese) [Google Scholar]
- Zhao, D.; Shen, Z.; Li, M.; Liu, B.; Chen, Y.; Xie, L. Study on parameter optimization of deep hole cumulative blasting in low permeability coal seams. Sci. Rep. 2022, 12, 5126. [Google Scholar] [CrossRef]
- Zhang, X.-l.; Yi, H.-b.; Ma, H.-h.; Shen, Z.-w. Blast parameter optimization study based on a blast crater experiment. Shock Vib. 2018, 2018, 8031735. [Google Scholar] [CrossRef]
- Kan, J.; Dou, L.; Li, X.; Cao, J.; Bai, J.; Chai, Y. Study on influencing factors and prediction of peak particle velocity induced by roof pre-split blasting in underground. Undergr. Space 2022, 7, 1068–1085. [Google Scholar] [CrossRef]
- Shim, H.-J.; Ryu, D.-W.; Chung, S.-K.; Synn, J.-H.; Song, J.-J. Optimized blasting design for large-scale quarrying based on a 3-D spatial distribution of rock factor. Int. J. Rock Mech. Min. Sci. 2009, 46, 326–332. [Google Scholar] [CrossRef]
- Uysal, O.; Erarslan, K.; Cebi, M.A.; Akcakoca, H. Effect of barrier holes on blast induced vibration. Int. J. Rock Mech. Min. Sci. 2008, 45, 712–719. [Google Scholar] [CrossRef]
- Zhao, H.; Guo, Y.; Liu, Y.; Jin, J. Multirobot unknown environment exploration and obstacle avoidance based on a Voronoi diagram and reinforcement learning. Expert Syst. Appl. 2025, 264, 125900. [Google Scholar] [CrossRef]
- Maruani, N.; Klokov, R.; Ovsjanikov, M.; Alliez, P.; Desbrun, M. Voromesh: Learning watertight surface meshes with voronoi diagrams. In Proceedings of the IEEE/CVF International Conference on Computer Vision, Paris, France, 2–6 October 2023; pp. 14565–14574. [Google Scholar] [CrossRef]
- Nie, F.; Li, Z.; Wang, R.; Li, X. An effective and efficient algorithm for K-means clustering with new formulation. IEEE Trans. Knowl. Data Eng. 2022, 35, 3433–3443. [Google Scholar] [CrossRef]
- De Goes, F.; Desbrun, M. Stochastic computation of barycentric coordinates. ACM Trans. Graph. 2024, 43, 13. [Google Scholar] [CrossRef]
- Liu, J.; Sun, P.; Liu, F.; Zhao, M. Design and optimization for bench blast based on Voronoi diagram. Int. J. Rock Mech. Min. Sci. 2014, 66, 30–40. [Google Scholar] [CrossRef]
- Jalilibal, Z.; Amiri, A.; Castagliola, P.; Khoo, M.B. Monitoring the coefficient of variation: A literature review. Comput. Ind. Eng. 2021, 161, 107600. [Google Scholar] [CrossRef]
- Duyckaerts, C.; Godefroy, G. Voronoi tessellation to study the numerical density and the spatial distribution of neurones. J. Chem. Neuroanat. 2000, 20, 83–92. [Google Scholar] [CrossRef]
- Wu, C.; Yuan, Y.; Tang, Y.; Tian, B. Application of terrestrial laser scanning (TLS) in the architecture, engineering and construction (AEC) industry. Sensors 2021, 22, 265. [Google Scholar] [CrossRef] [PubMed]
Disclaimer/Publisher’s Note: The statements, opinions and data contained in all publications are solely those of the individual author(s) and contributor(s) and not of MDPI and/or the editor(s). MDPI and/or the editor(s) disclaim responsibility for any injury to people or property resulting from any ideas, methods, instructions or products referred to in the content. |
© 2025 by the authors. Licensee MDPI, Basel, Switzerland. This article is an open access article distributed under the terms and conditions of the Creative Commons Attribution (CC BY) license (https://creativecommons.org/licenses/by/4.0/).