Article

Power Smoothing in a Wave Energy Conversion Using Energy Storage Systems: Benefits of Forecasting-Enhanced Filtering for Reduction in Energy Storage Requirements

1
Centro de Investigaciones Energéticas, Medioambientales y Tecnológicas (CIEMAT), Avda. Complutense, 40, 28040 Madrid, Spain
2
Electric Engineering Department, Universidad de Las Palmas de Gran Canaria (ULPGC), C/ Juan de Quesada 30, 35001 Las Palmas de Gran Canaria, Spain
*
Author to whom correspondence should be addressed.
Appl. Sci. 2025, 15(20), 11106; https://doi.org/10.3390/app152011106
Submission received: 29 August 2025 / Revised: 2 October 2025 / Accepted: 6 October 2025 / Published: 16 October 2025

Abstract

Featured Application

This work focuses on the integration of wave energy converters (WECs) with energy storage systems (ESS) for grid-connected renewable energy applications. By leveraging ESS, the approach reduces the impact of power fluctuations inherent to ocean waves, enhancing the reliability of energy delivery. The proposed forecasting-enhanced filtering strategies can be applied to WEC farms with ESS and allow for optimized (reduced) ESS sizing while maintaining equivalent levels of power smoothing. It is worth mentioning that this approach is inherently scalable and its effectiveness is not limited by the size of the farm. In fact, as the number of WEC units increases, the natural cancellation of power fluctuations between units can further reduce storage requirements, even without enhanced forecasting strategies, making the method applicable to larger-scale deployments.

Abstract

This paper presents a power smoothing strategy for wave energy converters (WECs) by means of energy storage systems (ESS) with integrated forecasting filtering algorithms applied to their control. The oscillatory nature of wave energy leads to high variability in power output, posing significant challenges for grid integration. A case study in Tenerife, Spain, was modeled in MATLAB-Simulink (release r2020b) to evaluate the impact of prediction-enhanced smoothing filters on ESS sizing. Various forecasting algorithms were assessed, including Bayesian Neural Networks, ARMA models, and persistence models. The simulation results demonstrate that the use of forecasting algorithms substantially reduces energy storage requirements while maintaining grid stability. Specifically, the application of Bayesian Neural Networks reduced the required ESS energy by up to 36.52% compared to traditional filters. In a perfect prediction scenario, reductions of up to 53.91% were achieved. These results highlight the importance of combining appropriate filtering strategies with advanced forecasting techniques to improve the technical and economic viability of wave energy projects. The paper concludes with a parametric analysis of moving average filter windows and prediction horizons, identifying the optimal combinations for different sea conditions. In summary, this study provides practical information into reducing the storage capacity required for power smoothing in wave energy systems, thereby contributing to the mitigation of grid integration challenges that may arise with the large-scale deployment of marine renewable energy

1. Introduction

The global potential of wave energy remains highly significant and largely untapped, with an estimated 2.1 TWh available in open waters [1]. This is one of the main reasons for the growing interest in the field, both at academic and industrial levels. In fact, wave energy represents a key component in strategies for the energy transition and sustainable development, as highlighted in the EU Blue Economy Report 2025 [2]. Several studies have examined the influence of technical, economic, and political aspects [3,4] in enabling wave energy to become a feasible option within the global energy generation mix in the near future. Such interest has led to substantial funding efforts; for instance, European R&D programs in ocean energy were estimated to have reached €0.85 billion by 2018 [5]. By 2050, ocean energy is projected to contribute up to 100 GW of installed capacity, equivalent to approximately 10% of the European electricity consumption in 2019 [6]. Beyond electricity, it is also worth mentioning that the combination of water resources and wave energy is a practical reality. The proximity between these resources has prompted studies on seawater desalination processes powered directly by wave energy, demonstrating the potential for integrating marine renewable energy into water management applications [7,8,9]. These potentials is particularly relevant within the European decarbonization framework, as achieving the 2050 climate targets will require zero-emission electricity generation.
To reach this objective, demand management, energy storage, and the deployment of all flexible renewable energy sources—among them ocean energy—will be necessary [10]. In this context, the Strategic Research and Innovation Agenda (SRIA) on ocean energy [11] has identified several priority topics and associated actions, such as “Demonstrate delivery of grid-compliant power including short-term energy storage solutions to smooth power output when needed.” This priority is directly linked to the grid integration challenges arising from the fluctuating power output of Wave Energy Converters (WECs). Due to the oscillatory nature of ocean waves, the power generated typically exhibits high peak-to-average ratios, with oscillation periods on the order of several seconds, and may include zero crossings during each cycle [12,13,14]. Although a proper spatial distribution of WECs in a wave farm can reduce power oscillations, this measure alone is insufficient to fully overcome grid integration issues [15,16,17]. Such issues stem from the fact that oscillations in power generation lead to transient imbalances between supply and demand in the electrical grid, which then trigger corrective mechanisms [18,19,20]. On the one hand, these oscillations cause deviations in grid frequency due to the instantaneous mismatch between generated and consumed power. These deviations must remain within the limits defined by each grid code. Moreover, for a given power imbalance, frequency oscillations tend to be more severe in weaker electrical grids with lower system inertia [21]. Island systems appear to be particularly suitable for wave energy deployment, given their proximity to the resource and the typically higher electricity prices compared to continental systems [22]. However, these island grids are often electrically weak due to their smaller scale, which exacerbates the impact of power oscillations [23]. On the other hand, the activation of frequency regulation mechanisms enhances conventional generators (e.g., thermal or hydroelectric plants) to operate more frequently, increasing mechanical fatigue and component wear [19,24]. In such contexts, rapid-response energy storage solutions can play a crucial role by absorbing short-term imbalances, thereby supporting grid stability and reducing mechanical stress on conventional generators. Therefore, to address these issues, the integration of energy storage systems—either standalone or hybrid configurations—into wave energy generation systems has been proposed [25]. Beyond the technical role of the energy storage systems, these systems are increasingly recognized as key enablers of the global energy transition, with non-negligible implications for sustainability and environmental performance. The deployment of these technologies must therefore be assessed not only in terms of operational efficiency, but also with respect to their lifecycle impacts, including resource extraction, manufacturing, and recycling [26,27].
These storage systems can mitigate grid integration challenges by implementing power smoothing strategies, typically based on filtering algorithms [28,29]. Preliminary studies have shown that using forecasting filtering algorithms can reduce the required storage capacity, and that fast-response storage technologies such as supercapacitors [30,31] or flywheels (possibly complemented by battery systems to handle intra-day variations in hybrid storage systems) are particularly well-suited for this purpose [32]. Additionally, fast-response storage can alleviate battery aging and reduce the wear of conventional power plants involved in frequency regulation [33]. While several studies have addressed the development of forecasting algorithms for conventional renewables [34,35], similar efforts exist for wave energy systems as well. However, in this domain, forecasting strategies typically aim at enhancing energy-extraction control algorithms by forecasting force-related variables [36,37,38] over short time horizons (few seconds). Some studies have addressed wave resource forecasting using Long Short-Term Memory (LSTM) neural networks combined with modal decomposition techniques [39], have focused on predicting power output through adjusted power matrices and Bi-directional LSTM (BiLSTM) architectures combined with Convolutional Neural Networks (CNNs) [40] or focused on predicting sea conditions in order to plan actions on offshore systems [41].
The algorithm proposed in this work, however, is based on Bayesian Neural Networks and focuses on forecasting the power output, with time horizons ranging from a few seconds up to the typical wave period (8–14 s). Regarding the application of forecasting algorithms in renewable energies such as solar and wind, although primarily aimed at improving grid integration, the focus is typically on longer time horizons, centered on resource forecasting for participation in electricity markets, plant planning, and operation, where “short-term” horizons are generally defined as periods below 4 h [42,43]. On the other hand, while there are also applications of long-term resource forecasting in wave energy [44], the main focus has been on maximizing the energy extracted from waves, given the non-causal nature of these systems, which operate over very short horizons of only a few seconds (i.e., below 4 s) [45,46,47]. Additionally, some studies have explored power smoothing in wave energy systems; however, these are mainly preliminary works addressing different storage technologies and proof-of-concept analyses of the capability of ESS to smooth power output, considering batteries [48], supercapacitors [31], or hybrid systems combining both [49]. It is worth noting that a few studies [50] have applied forecasting algorithms to wave energy power smoothing, although in those cases the objective was mainly to limit the generated power to reduce oscillations while controlling the ESS state of charge. In contrast, the present work specifically develops a forecasting-based algorithm for power smoothing and investigates the ability of forecasting strategies to reduce ESS sizing requirements within this control framework, thereby justifying the integration of forecasting and demonstrating its practical design advantages.
The methodology builds on previous work conducted to (1) design a suitable WEC for a specific location (northern coast of Tenerife, Canary Islands, Spain) [51]; (2) optimize the spatial layout of WECs within a wave farm to minimize power oscillations [52]; and (3) evaluate the grid impact of the wave farm’s integration, including an assessment of the maximum admissible power oscillations for the electrical system [23]. Based on these foundations and using the same case study, a power prediction algorithm is developed and integrated into a power smoothing strategy. A comparative analysis is carried out involving simpler computational approaches—such as persistence and ARMA models—in order to justify the use of neural networks. Finally, results are presented comparing scenarios with and without forecasting algorithms, showing the corresponding power and energy requirements for the storage systems as well as the achieved power smoothing performance.

2. Methodology

The mathematical model used to analyze the case study has been developed using MATLAB-Simulink software (release r2020b). The model consists of the following components:
  • A WEC model (prime mover + PTO), which allows for the evaluation of the electrical power output profile of a single WEC under a given sea state. This model accounts for the relative position of the WEC with respect to other devices and for the directional characteristics of the incident waves. This enables the aggregation of individual power profiles to determine the total output of a wave energy farm (see Section 2.1).
  • An energy storage system model, coupled with a power smoothing control algorithm. In this case study, the storage system is modeled as an “agnostic” energy storage unit, and a moving average filter is used as the smoothing algorithm (see Section 2.2).
  • A forecasting algorithm, which complements the power smoothing control algorithm of the storage system by enabling the estimation of the real-time moving average filter (MAF) using past power output samples and predicted values as future samples (see Section 2.3).

2.1. Description of the WEC and Wave Farm Model

This work is framed within a case study focused on the integration of a wave energy farm (WF) into the electrical grid of an island power system. The wave energy installation is assumed to be located on the northern coast of Tenerife and is electrically connected to the island’s grid. Several projects have been developed in this region [53,54,55] due to its significant wave energy potential [56], estimated within the range of 20–70 kW/m. The main characteristics of the WF are summarized as follows:
  • Ocean wave data are obtained as described in Section 2.1.1, considering the WF location at latitude 28.4° N and longitude 17° W.
  • The primary WEC device is a point absorber with a peak power output of 160 kW. The Power Take-Off (PTO) system consists of a direct-drive linear electric generator rated at 160 kW.
  • The WF is composed of 15 groups of WEC units arranged in 9 rows following a triangular layout.
The complete mathematical model of the wave farm (denoted as WFM) is parameterized according to the characteristics of the WEC device (Section 2.1.2) and the spatial layout of the WF (Section 2.1.3). The model outputs the electric power profile based on the ocean resource conditions provided as input (Section 2.1.1).

2.1.1. Wave Resource Conditions

As previously mentioned, this case study is based on Tenerife Island, one of the seven main islands of the Canary Islands (Spain). The metocean data used are derived from the numerical dataset corresponding to the so-called SIMAR points [57]—specifically point 1012013 (see location in Figure 1a and wave contingency diagram in Figure 1b).
The relevant information available includes the significant wave height (Hs [14]), the peak period of the wave energy spectrum (Tp [14]), and the main wave propagation direction (αW). Figure 1b presents the annual occurrence of various sea states, characterized by their peak period (Tp) and significant wave height (Hs). The four sea states selected—based on Tp and Hs—in Table 1, correspond to those most significant in terms of occurrence, wave energy, and suitability with the WEC device (which is detailed in the following subsection), providing a representative basis for the analysis of wave energy potential and storage requirements. Based on several years of data, 16 representative sea states for the present analysis are selected, and a synthetic wave elevation profile is generated across the spatial domain of the WEC farm. This profile accounts for Hs, Tp, and αW, as well as the frequency spectrum and directional spreading of the wave energy [14]. The 16 selected cases correspond to the permutations of two values for Hs, two for Tp, and four for αW, as summarized in Table 1. Additionally, to provide context and facilitate interpretation, Table 1 presents the wave energy per unit wave front (Pj [14]).

2.1.2. WEC Model

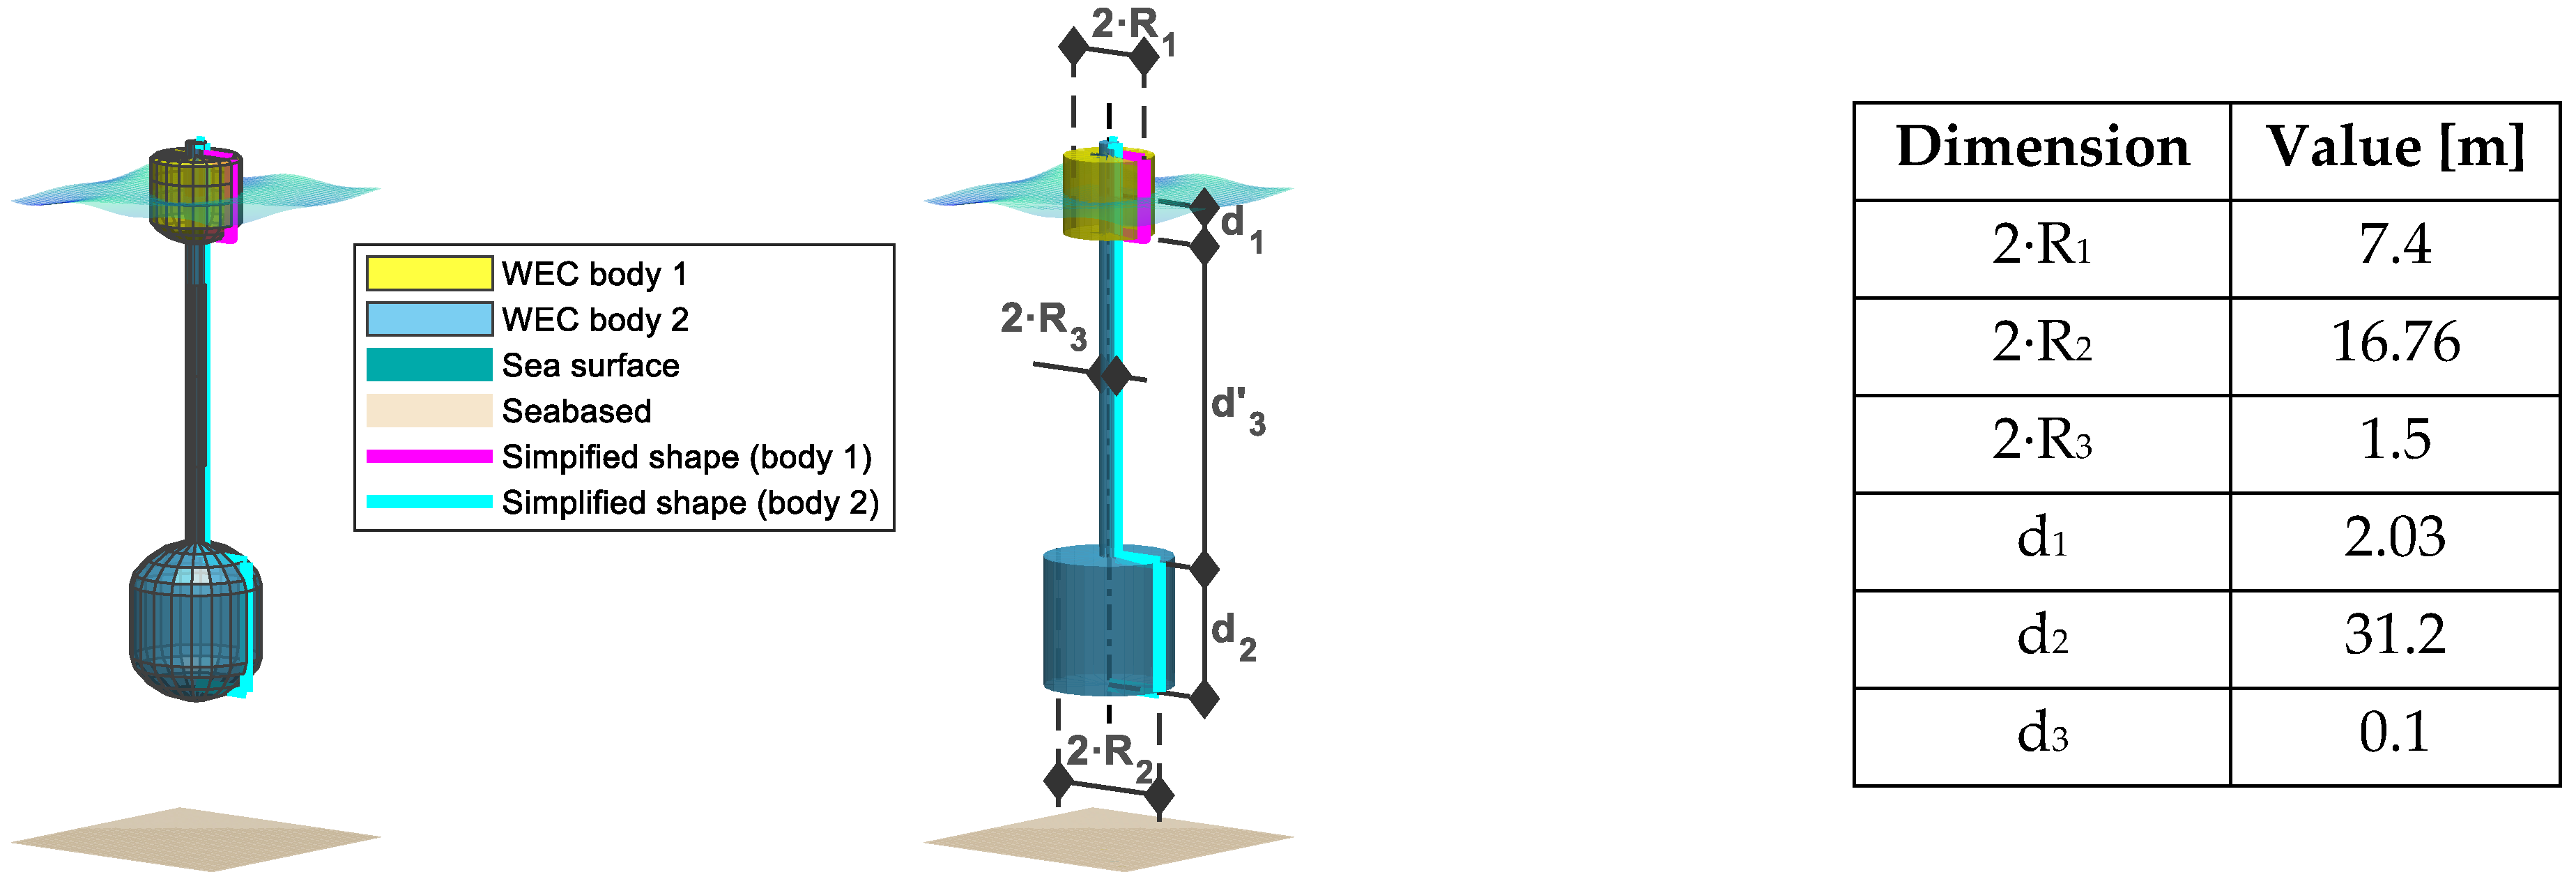
The WEC model corresponds to a two-body point absorber whose dimensions result from an optimization procedure aimed at maximizing the extracted energy for the selected location, following the methodology described in [51]. The dimensions of the device are shown in Figure 2. In [51], a differential evolution optimization algorithm was employed to determine the dimensions that maximize the energy captured by the WEC’s prime mover (i.e., the components interacting directly with the waves, in this case, the two bodies of the point absorber). The optimization considered the site-specific wave conditions and the design constraints of the power take-off system—PTO—(i.e., the device converting mechanical energy from the prime mover into electrical energy, here a linear generator), including limits on speed, stroke, force, and nominal power. This process resulted in a WEC configuration with a peak power of 160 kW, corresponding to the rated power of the selected PTO.
The dynamic model is parameterized using the hydrodynamic coefficients associated with these dimensions, obtained through the NEMOH software (v3.0.0) [58]. The simulation is performed in MATLAB-Simulink (release r2020b) using the WECSIM library (v7.0.0) [59], which is based on a state-space realization of the hydrodynamic parameters in the frequency domain, as described in [60], and the implementation of a dynamic model similar to that in [61,62].
The model includes a loss model for the linear generator [63], and the energy extraction control algorithm is implemented in the time domain using a Gain Scheduling approach [64]. This approach involves determining, through simulations, the optimal damping factor that the linear generator must apply to maximize energy extraction under different sea states. A lookup table is then used in the time-domain simulation to apply the appropriate damping factor based on the current sea state.

2.1.3. Wave Farm Model

The wave farm model builds upon the results from the WEC model described in Section 2.1.2. A spacing between WEC units is assumed to be sufficient to neglect hydrodynamic interaction among them, while considering the position of each device and the spatial variability of the wave resource.
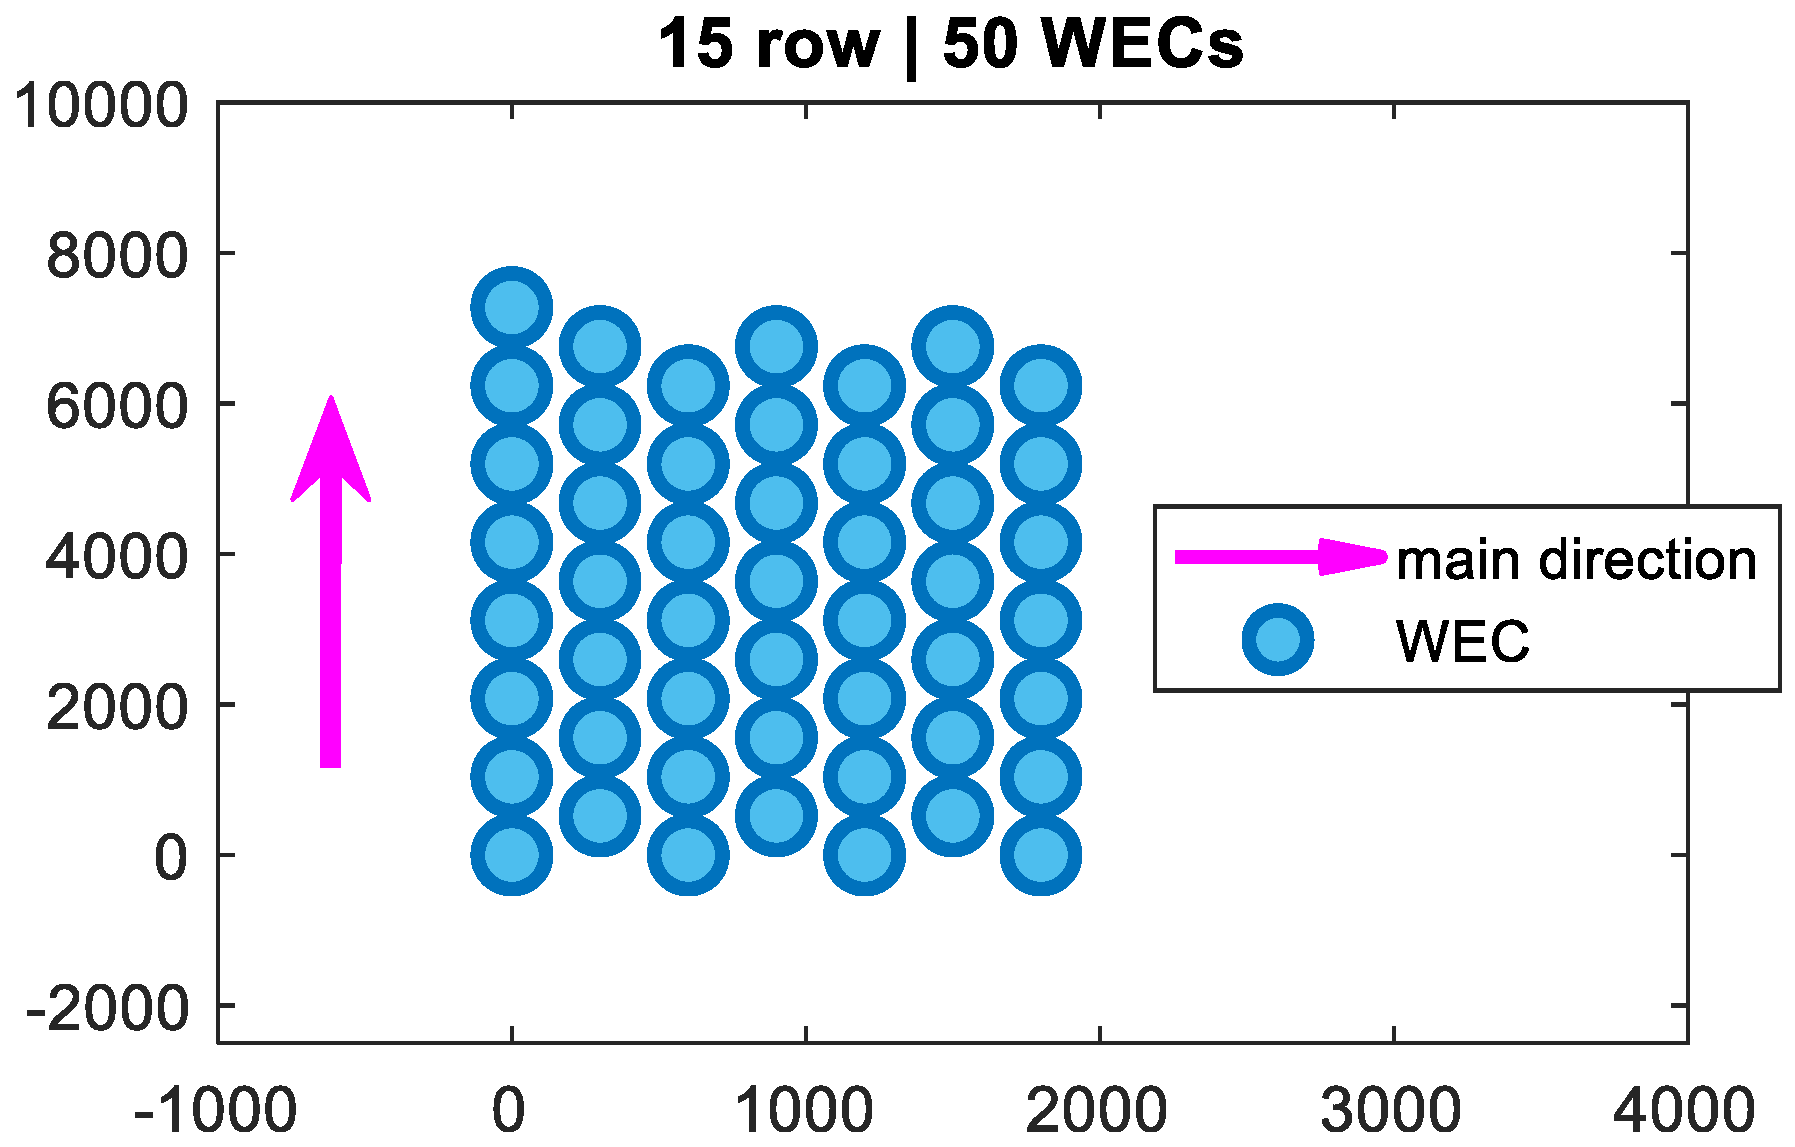
The layout of each device has been defined to minimize the power oscillations of the total farm output, resulting in a farm composed of 50 units arranged in a triangular (staggered) pattern according to the results presented in [52] (see Figure 3).

2.2. Description of the Energy Storage System Model

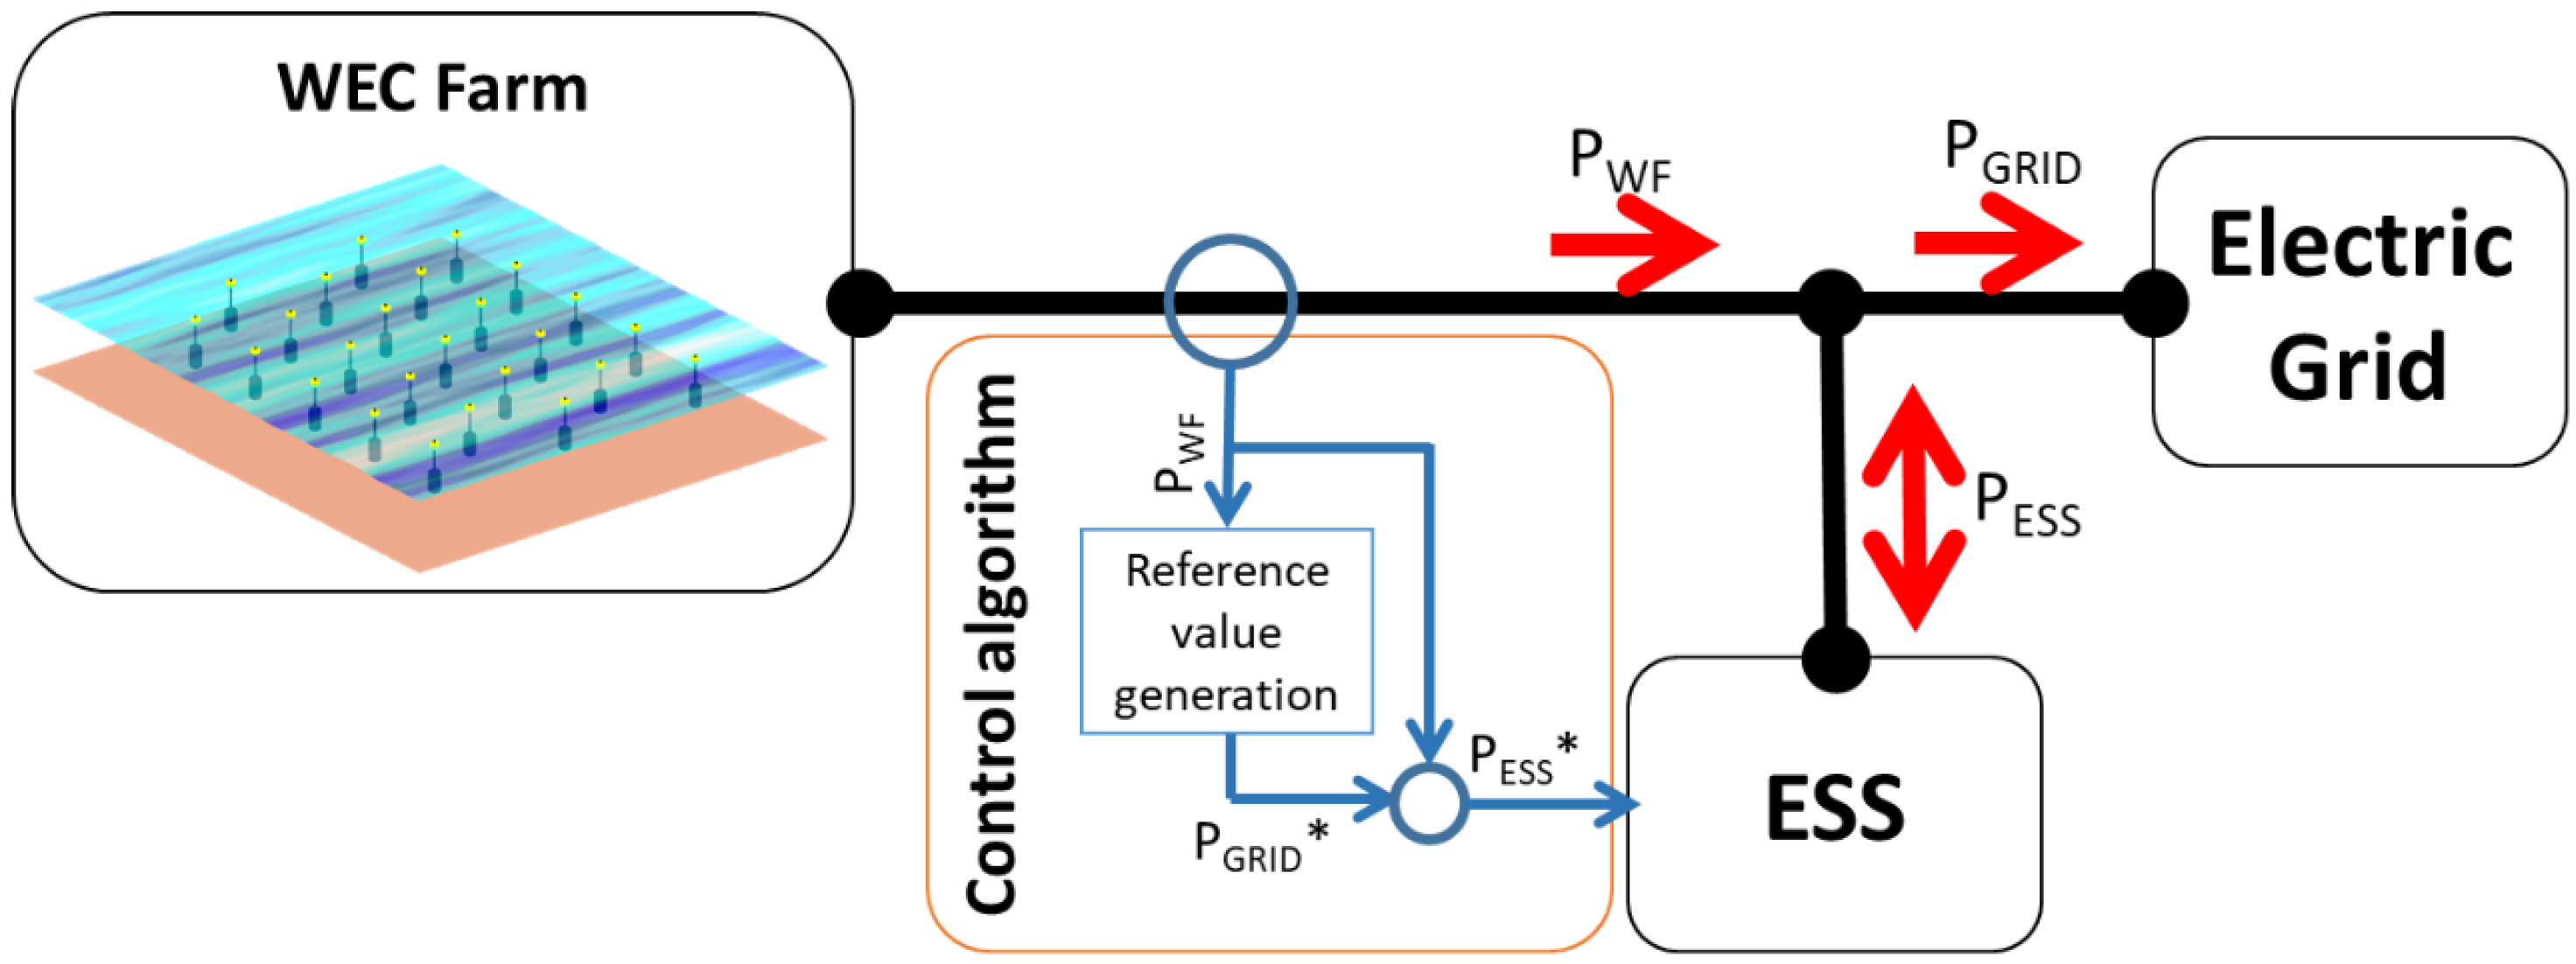
The wave farm (WF) is assumed to include an energy storage system (ESS) designed to smooth the oscillating power output generated by the WF. Both the connection layout and control scheme of the ESS are shown in Figure 4.
The ESS is connected at the point of common coupling (PCC) of the WF and it is assumed to be installed onshore to reduce maintenance requirements. The ESS control reference is generated according to the scheme presented in Figure 4. In this scheme, the target power to be injected into the grid ( P G R I D * ) is obtained by filtering the power generated by the WF ( P W F ), while the ESS target power ( P E S S * ) is defined as the difference between the generated power and the filtered power to be injected into the grid, as expressed in Equation (1). The moving average filter (MAF) operates within a fixed time window of a number of samples of N s _ M A F , incorporating both measured (real) samples (number of real samples: N s _ M A F N s _ P R E D ) and predicted samples (number of predicted samples: n P R E D ) provided by different forecasting algorithms (described in Section 2.3), as formulated in Equation (2). MAF evaluates the average value of a certain variable in a N s _ M A F number of samples.
P E S S = P G R I D P W F
P E S S = P E S S * = P G R I D * P W F = M A F P W F P W F ;   P G R I D * t 0 = M A F P W F = p a s t   s a m p l e s + p r e d i c t e d   s a m p l e s t o t a l   n o .   s a m p l e s = i = 0 i = N s _ M A F N s _ P R E D P W F t o i · t + i = 1 i = N s _ P R E D P W F t o + i · t N s _ M A F
where PESS is the power exchanged by the storage system, PGRID* is the smoothed power delivered to the grid, PWF is the instantaneous wave farm power, Ns_MAF is the total number of samples in the moving average filter window, and Ns_PRED is the number of forecasted samples included in the filter (i.e., the number of real or non-predicted samples is Ns_MAFNs_PRED). In addition, MAF(x) denotes the application of the moving average filter to the variable x, x(ti) represents the value of the variable x at time instant ti (e.g., PWF(t0 + i⋅Δt) corresponds to the value of the wave farm power at t0 + i⋅Δt), Δt is the sampling time, t0 is the evaluation instant, and i is the sample index
In order to define window sizes, the variables nMAF and NPred are introduced too, which correspond to window sizes expressed in seconds for the filter and prediction, respectively, i.e., nMAF = Ns_MAF*Δt and nPred = Ns_Pred*Δt.
The target grid-injected power is filtered using a moving average filter (MAF) with a window size (nMAF) of 30 s and a sampling period ( t ) of 0.1 s (i.e., a nMAF of 30 s correspond, in number of samples, with a Ns_MAF of 300 samples), in accordance with the parameters defined in the previous study presented in [23]. In that study, the impact of injecting oscillating power into the island grid was analyzed, a MAF-based solution was proposed, and its performance was evaluated using the aforementioned parameters.
From the ESS power demand profiles ( P E S S ), the required power and energy capacities of the ESS ( P r a t e d and E r a t e d , respectively) can be calculated for each specific case, according to Equations (3) and (4), evaluated in each simulation period.
P r a t e d = max abs P E S S t ;     t   o f   a   c o m p l e t e   s i m u l a t i o n
E E S S t = 0 t P E S S t   d t ;   E r a t e d = max E E S S t min E E S S t ;     t   o f   a   c o m p l e t e   s i m u l a t i o n
In this study, the ESS is considered fully agnostic, with sufficient capacity such that its state of charge (SoC) does not affect its behavior. The calculations of Prated and Erated based on Equations (3) and (4) were performed assuming an ideal, technology-agnostic energy storage system (ESS) in order to compare the different filtering and forecasting strategies. This approach isolates the effects of short-horizon forecasts on the required storage capacity for a given level of power smoothing. However, it should be noted that differences may arise when applying the methodology to real-world systems or more detailed ESS models, but these are not expected to alter the main qualitative conclusions of the manuscript.
The analysis of storage technologies and SoC control algorithms is beyond the scope of this work, which is instead focused on implementing a forecasting algorithm aimed at reducing the capacity requirements of the ESS.

2.3. Forecasting Algorithms

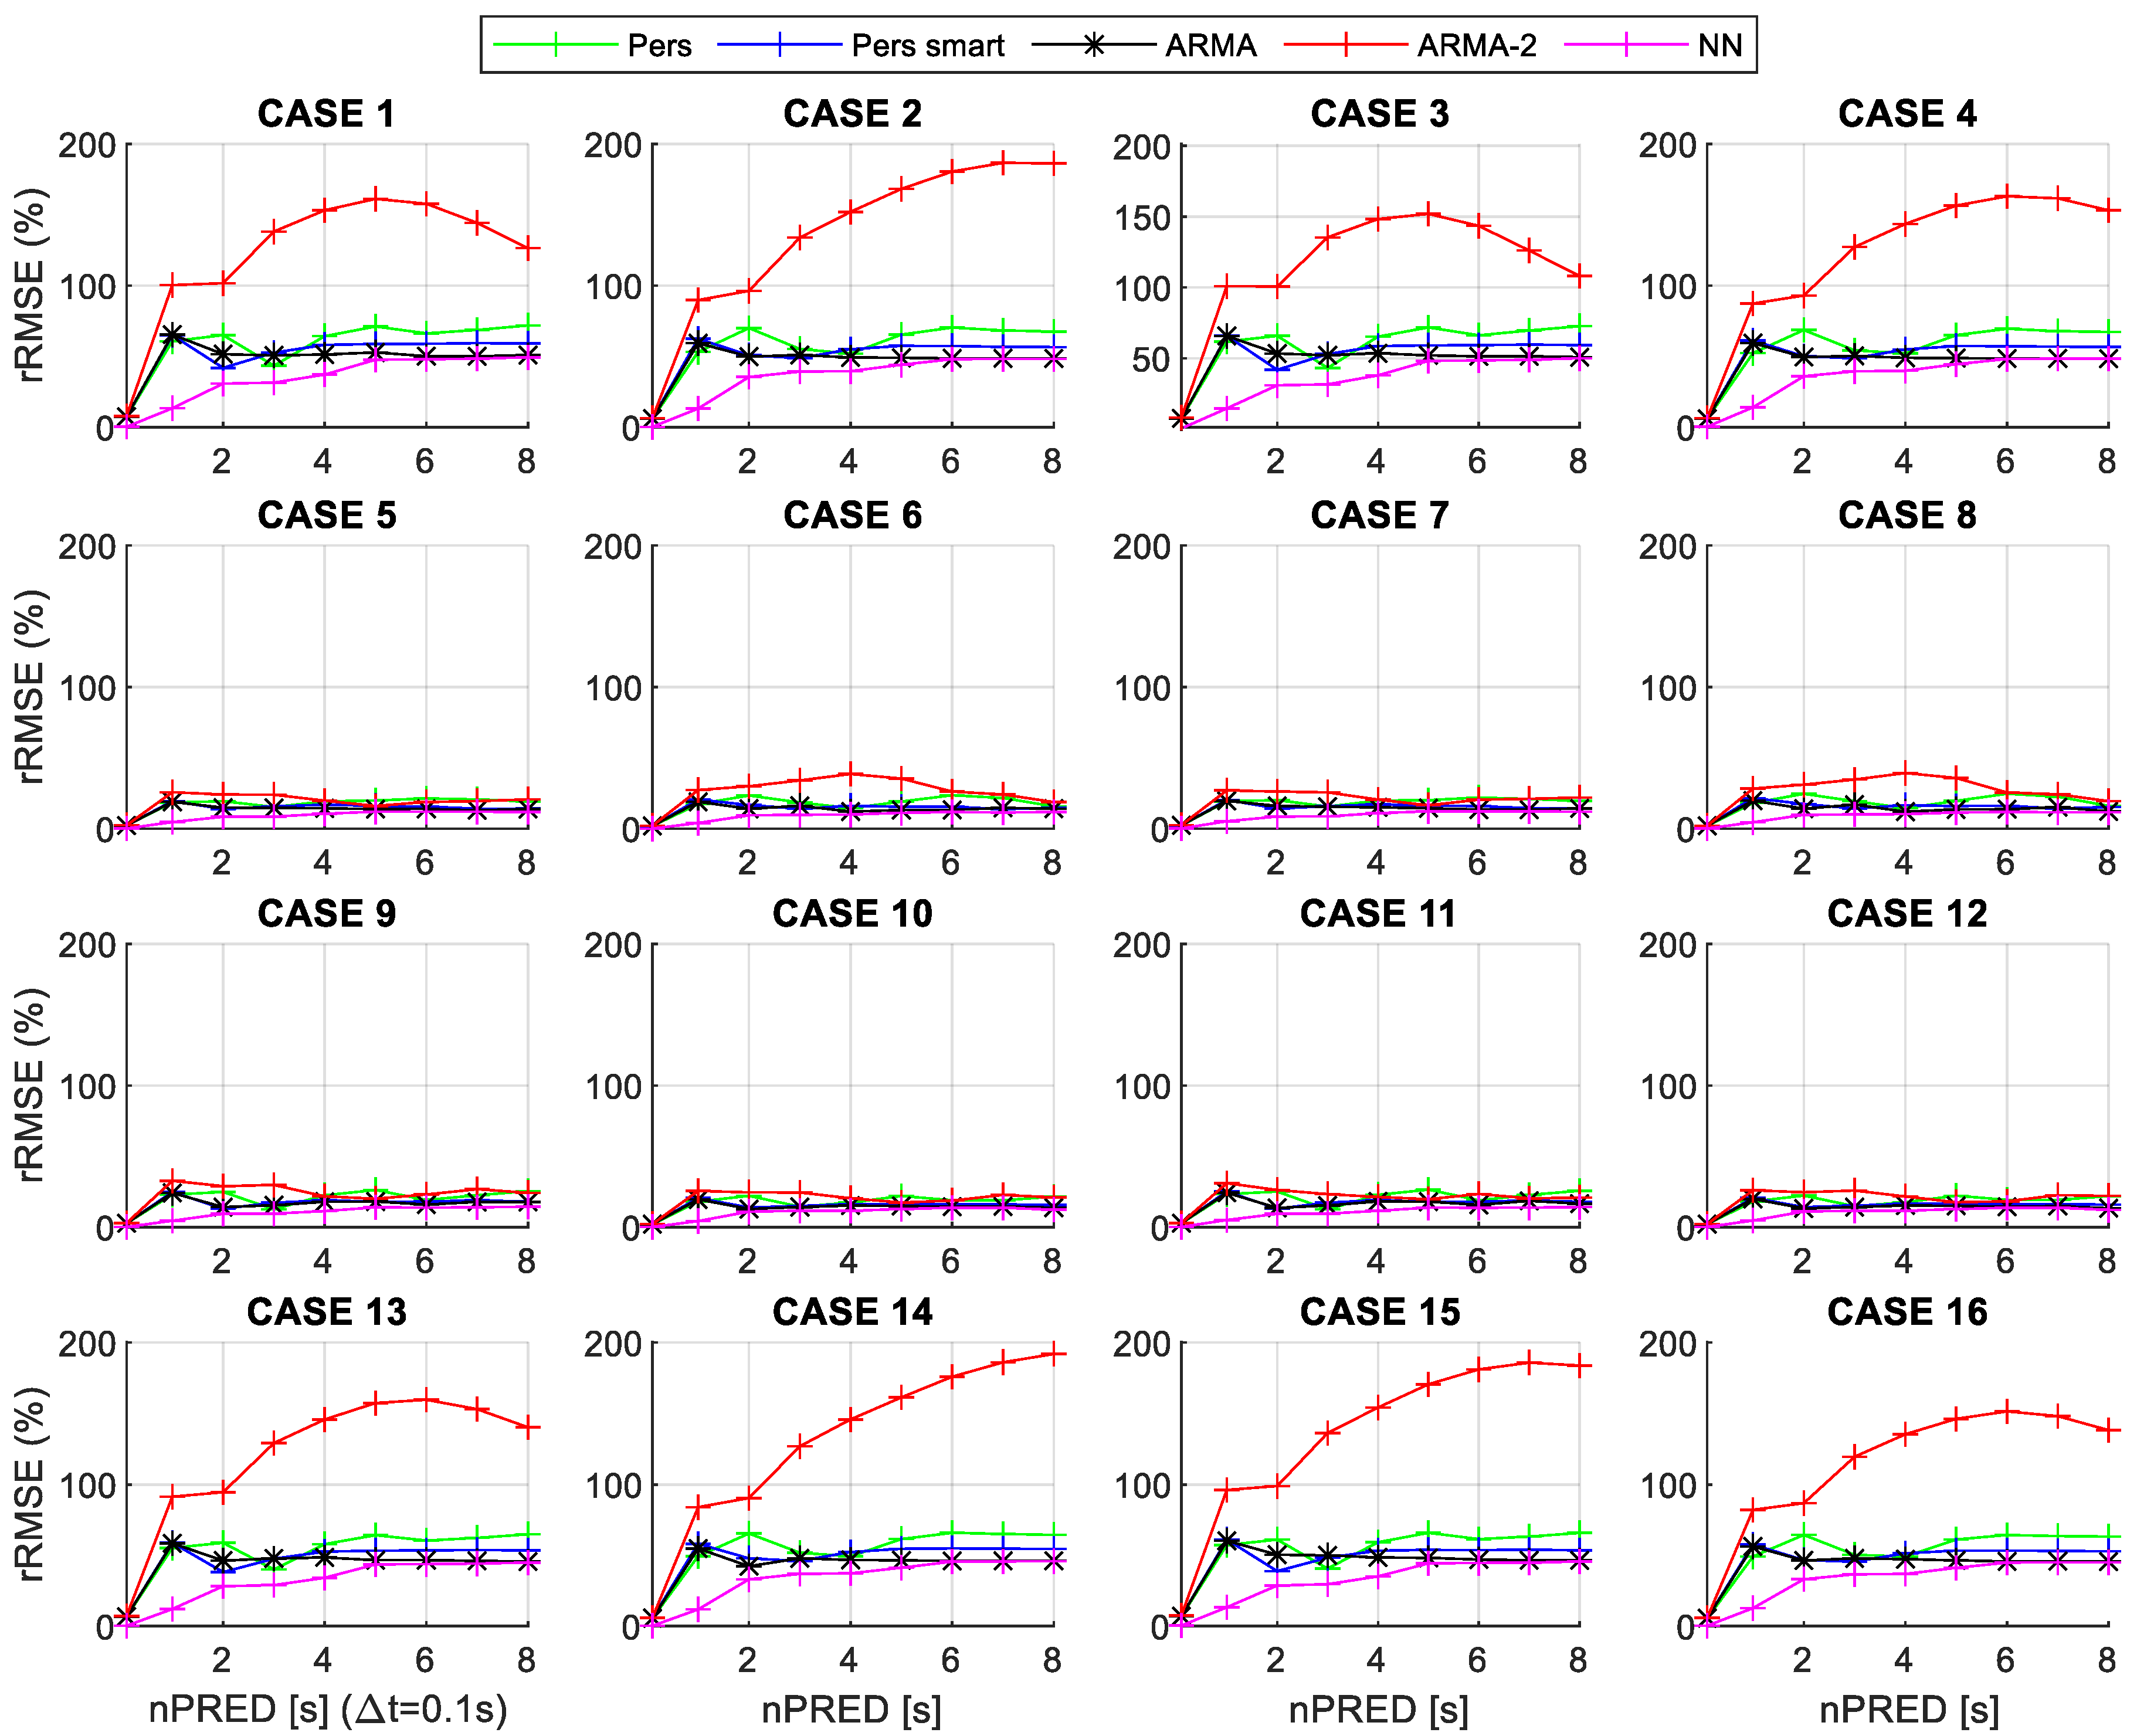
This section will describe the forecasting models used in this article to evaluate the predicted samples of the power generated by the WF ( P W F ), highlighting their application in system energy management. Storage models will draw on these predictions to enhance energy management. A range of statistical forecasting models will be used to identify the most appropriate model for each case study. The development of any sophisticated methodology is useless if certain naïve or reference models demonstrate superior performance to that proposed. The objective is to compare two naïve models with increasingly complex prediction models. Therefore, in this study, it is proposed to work with two ARMA-based models and one NN-based model. The more complex models should offer, a priori, better accuracy (as Figure 8 shown in Section 4.2). The general forecasting function that will be used to relate the input variables to the expected results is as shown in Equation (5).
y ^ t + h = F y t ,   ,   y t i
where y ^ t + h is the P W F   calculated for time horizon h, in our case h = 0.1, 1, …, 8 s, y ( t i ) is P W F from dataset of each case of study for ‘i’ past values.

2.3.1. Naïve Models

In this study, two elementary models were examined for their forecasting capabilities across a range of time horizons. It was observed that both models utilised past values data, employing normalized data series for analysis. The first is the simple persistence (Pers) model [65] defined by Equation (6).
y ^ t + h = F y t ,   ,   y t i
This model is based on the assumption that the forecasted data for each time horizon ‘h’ is solely dependent on the previous value, implying that conditions remain unchanged between time ‘t’ and time ‘t + h’. The next approach, known as the Smart-Persistence (Pers Smart) model, offers a simple enhancement to the persistence model. It predicts wave performance for each time horizon ‘h’ by averaging the ‘h’ preceding values [66] The Smart-Persistence model is mathematically defined in Equation (7).
y ^ t + h = m e a n ( y t , , y ( t h ) )

2.3.2. Linear Models

For time series estimation, statistical linear models have been extensively developed. This study follows the approach outlined in [67,68] for climatic variables, utilizing a methodology based on linear regression models. Linear models operate using a combination of past values and errors. The autoregressive moving average (ARMA) time series model is based on two fundamental components: the autoregressive (AR) model and the moving average (MA) model. These models represent a linear combination of a specific number of past series values and errors, as defined by Equation (8).
y ( t + h ) ^ = i = 0 p 1 Φ i + 1 y ( t 1 ) + j = 0 q 1 Θ j + 1 ϵ t j
The forecasted variable for horizon ‘h’ is represented by y ^ t + h . The values of y ( t i ) correspond to past data points from the time series, selected to establish a linear relationship with the forecasted value, while ϵ t represents the error term. The set of autoregressive parameters, { Φ i } i = 1,2 , , p , is derived from the sample data during training for the AR regression using past values. Meanwhile, the parameters { Θ i } i = 1,2 , , q correspond to the series of errors ϵ t in the MA regression. The parameter ‘p’ defines the order of the AR model, indicating the number of past values used for solar radiation forecasting. Similarly, ‘q’ represents the order of the MA model. Both model parameters are determined through least squares regression, which compares past data used as input with the future data to be predicted.
One of the most critical decisions during the training process is determining the model’s complexity. For an ARMA model, the optimal values of p and q must be established during the training process, with the model being represented as ARMApq. In this case, the optimal order p is obtained by calculating the Partial Autocorrelation Function (PACF) and the Bayesian Information Criterion (BIC). Similarly, the optimal order q for the MA model is determined by calculating the Autocorrelation Function (ACF) and defining the number of error terms used in the prediction. In many cases, ARMA models with low-order parameters have been shown to produce very good results [69]. For example, in this study, an ARMA with optimal p and q values are considered (ARMApq), and also considers an ARMA model with p = 1 and q = 2 (ARMA12) for sake of comparison.

2.3.3. Artificial Neural Networks

Artificial neural networks (NN) [70] consist of interconnected units called neurons that receive inputs either from other neurons or directly from an external data source. These networks are designed to learn the relationship between input data and corresponding outputs. Each connection between neurons has an associated weight, which is adjusted during the training process. The optimal weights are determined by optimising a cost function.
The NN structure used in this article consists of an input layer, at least one hidden layer and an output layer, with no feedback or lateral connections between them. The hidden layer consists of several non-linear neurons. Each neuron processes input variables, weighted accordingly, and sums them to produce an output. This sum is then passed through a non-linear activation function or transfer function to control the output amplitude. The activation function used is the hyperbolic tangent function, Equation (9), while the output layer uses a linear activation function.
f x = t a n h ( x ) = e x e x e x + e x
The relation between input variables and forecasted data is established by Equation (10). The weights of the network are initially set by random initialization and then optimized during the training phase. This optimization is achieved by minimizing an error function (cost function) using the back-propagation algorithm. The most used error function is the mean squared error, which measures the difference between the network’s output y ^ t + h and the desired target output, Equation (11).
y ^ t + h = α 0 + j = 1 h α j · f β 0 , j + i = 1 p β i , j ·   y ( t i )
E w = 1 2 i = 1 N y ^ t + h y i 2
The accuracy of artificial neural networks (NN) in approximating continuous functions is influenced by the structure of the network. If the network fits the noise in the function, it may perform well during training but poorly on new data, a problem known as overfitting. To avoid this, regularization techniques are used to control model complexity [70,71,72]. In this study, Bayesian regularization was used to control the complexity of the model. The Bayesian approach involves a probability density function over the weight space, where the optimal neural network parameters correspond to the maximum of this density. This framework introduces two new hyperparameters, α and β, which regulate the complexity of the model. Consequently, the cost function is defined as in Equation (12).
S w = β 2 i = 1 N y ^ t + h t i 2 + α 2 i = 1 m w i 2
To determine the optimal values of the hyperparameters α and β, as well as the optimal weight vector wMP, an iterative procedure is required [72,73]. Initially, the hyperparameters are obtained through the numerical implementation of the Bayesian framework using the computed values from the first iteration. These values are then used to compute the first group of optimal weights using the standard training algorithm, specifically the scaled conjugate gradient method, which minimizes S(w).
The Bayesian framework offers several approaches to assess model complexity. One of these techniques, known as Automatic Relevance Determination (ARD), allocates a distinct regularization coefficient to each input, facilitating the identification of the most significant inputs during training. Furthermore, it calculates the model’s probability (model evidence), which serves as a criterion for model selection [73,74]. In this study, we trained various NN with different numbers of hidden units, and the network with the highest model evidence was chosen as the best-performing one.

3. Case Study

As previously commented, power oscillation injected in the grid would have a direct impact in electric grid due to power oscillations cause frequency oscillations and the electric frequency cannot have variations beyond a narrow margin (a few hundreds of millihertz). And among other options of reducing the power oscillation in WEC farms [75], electric energy storage (ESS) is one of the better options.
To better contextualize the scope of the work, a representative case study has been selected and introduced at this section based on a previous studies [23,51,52], describing the new analysis to be carried out over it. The Tenerife Island grid was chosen due to its weak grid characteristics, which makes it particularly sensitive to power oscillations from renewable generation. In this context, the study illustrates the motivation for smoothing wave power generation and remarks on the role of ESS-based smoothing strategies. Specifically, the case study focuses on two main aspects: (1) power smoothing capacity in order to reduce the electric frequency oscillations in weak grids, (2) and rated power and energy requirements of the ESS depending on the adopted control algorithm. This provides a practical framework for comparing filtering and forecasting strategies and defines the parametric analysis whose results are shown in Section 4.

3.1. Application Example: Forecasting in Moving Average Filtering

By way of example, some results derived from the study case presented in [23] are shown in Figure 5. This study case framed on Tenerife Island (SPAIN) is considering the connection of a wave power generation farm of 120 MW (the modal value of the minimum power generation in Tenerife Island is 452.5 MW, which implies a maximum penetration of 25%). Figure 5a shows an example of the oscillatory electric power generated with a WEC farm in a particular sea state; and Figure 5b shows the electric frequency oscillations produced as a consequence.
As previously commented in Section 2.2, the power oscillations can be smoothed by means of ESS installed in the Point of Common Coupling (PCC). The power smoothing grade should reduce/avoid the number of events where the frequency oscillations are out of bounds (±150 mHz according to Spanish grid code [76]). The ESS smooths the power generation oscillations, so that the power injected into the network is a certain reference value (see Figure 4). The reference value is defined in order to reduce the frequency oscillations, and it can be calculated in different ways, resulting in different control algorithms. In this example, two control algorithms are proposed:
  • Moving average filter.
  • Moving average filter considering future (predicted/forecasted) values. In this example (Section 3.1), it is considered perfect prediction.
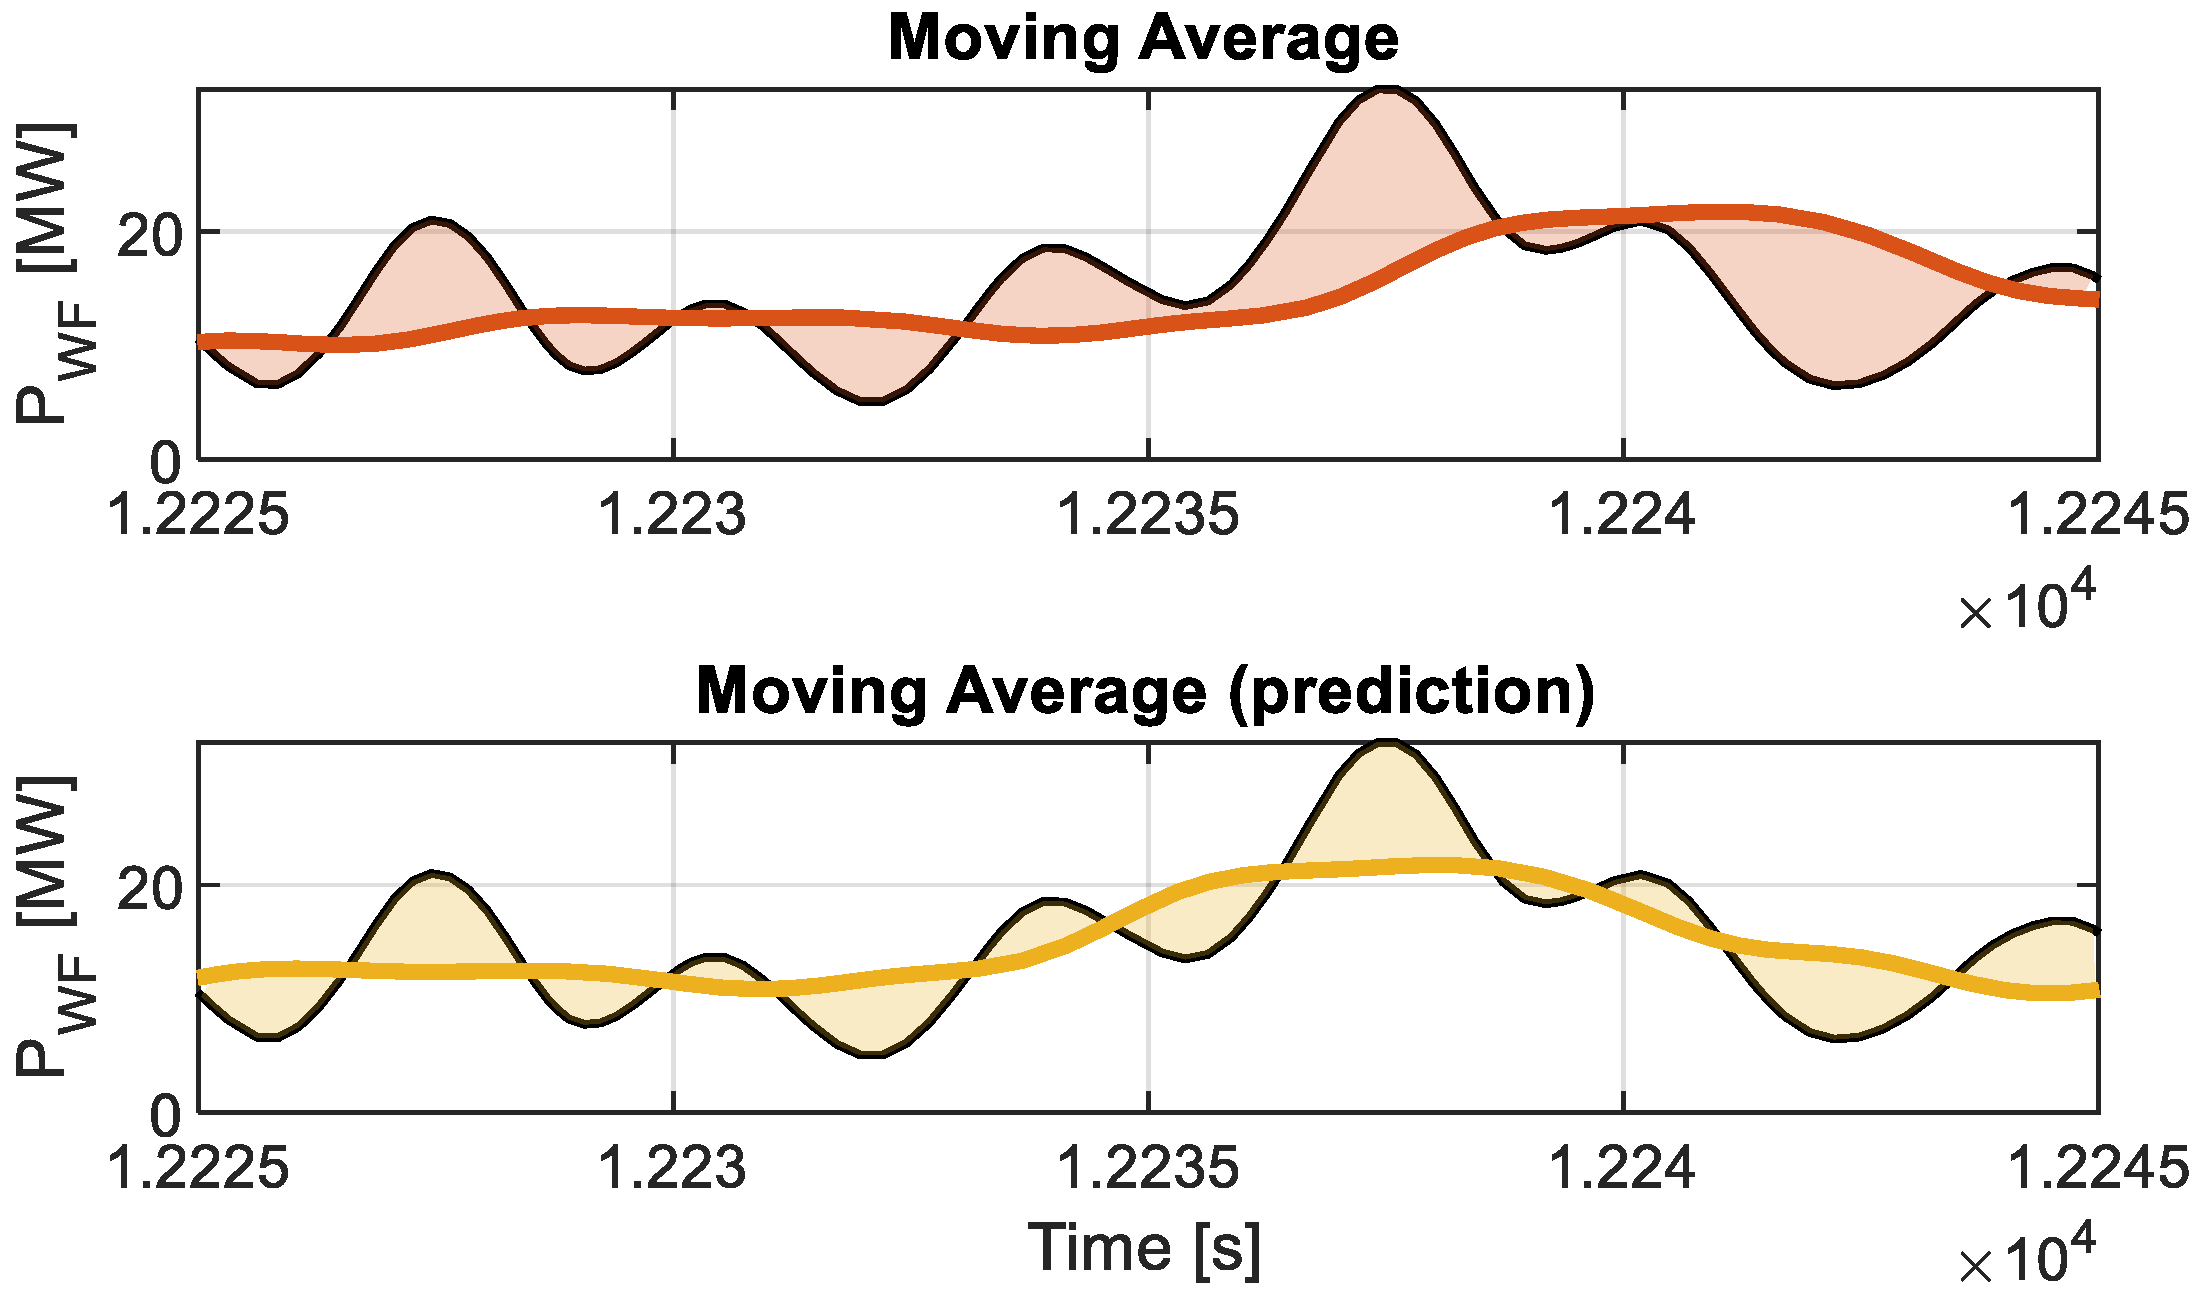
Figure 6 shows a comparison of the two ways to calculate reference values compared to the original wave power generation level. The area between these two curves (marked with a coloured area) represents the energy storage capacity required to transform the original generated power into the smoothed one proposed by the control algorithm. The figure clearly shows that the control algorithm selected has a great impact in the energy storage requirements due to the delay introduced by the MAF—of 30 s of window size and without prediction (nMAF = 30; nPred = 0)—increase the area between these two curves.
Table 2 shows the results of the two control algorithm options in this example, including the ESS energy and power requirements evaluated by means of Equations (3) and (4), the number of over-frequency and under-frequency events, and the variance of the wave power generations and the electric frequency time profiles evaluated by means of Equation (5).
In Table 2, the frequency evaluation is derived from the case study presented in [23]. In this study, the considered frequency limits are ±150 mHz around the nominal 50 Hz for alert events, and ±250 mHz for emergency events [76]. The frequency evaluation was performed using a dynamic single-bus inertial model of the Tenerife island grid (Spain), which accounts for both the generation profiles and the system dynamics, including frequency restoration mechanisms, as described in the referenced study [23].
The table shows that the control algorithms that use predicted values require ESS with less energy and power rated values. However, the smoothing levels are similar for the version with and without prediction. For example, the control algorithm that uses moving average filter needs 250% more of ESS rated energy than a control algorithm using prediction to achieve the same levels of power smoothing.
In summary, the electric frequency oscillations caused by the oscillating wave power generations can be smoothed by energy storage systems till the required level by the electric grid. However, the smoothing control algorithm of the ESS has a great impact on the utilization of its rated characteristics; the same smoothing effect requires different levels of rated ESS power and energy, depending on the control algorithm.
It should be noted that in this example, no forecasting algorithm is used, and the prediction is considered perfect by using a future measured value of the complete profile. The results with the different proposed forecasting algorithms (Section 2.3) are shown in the next Section 4.2, with more modest reductions in ESS capacity requirements.

3.2. Description of the Case Study

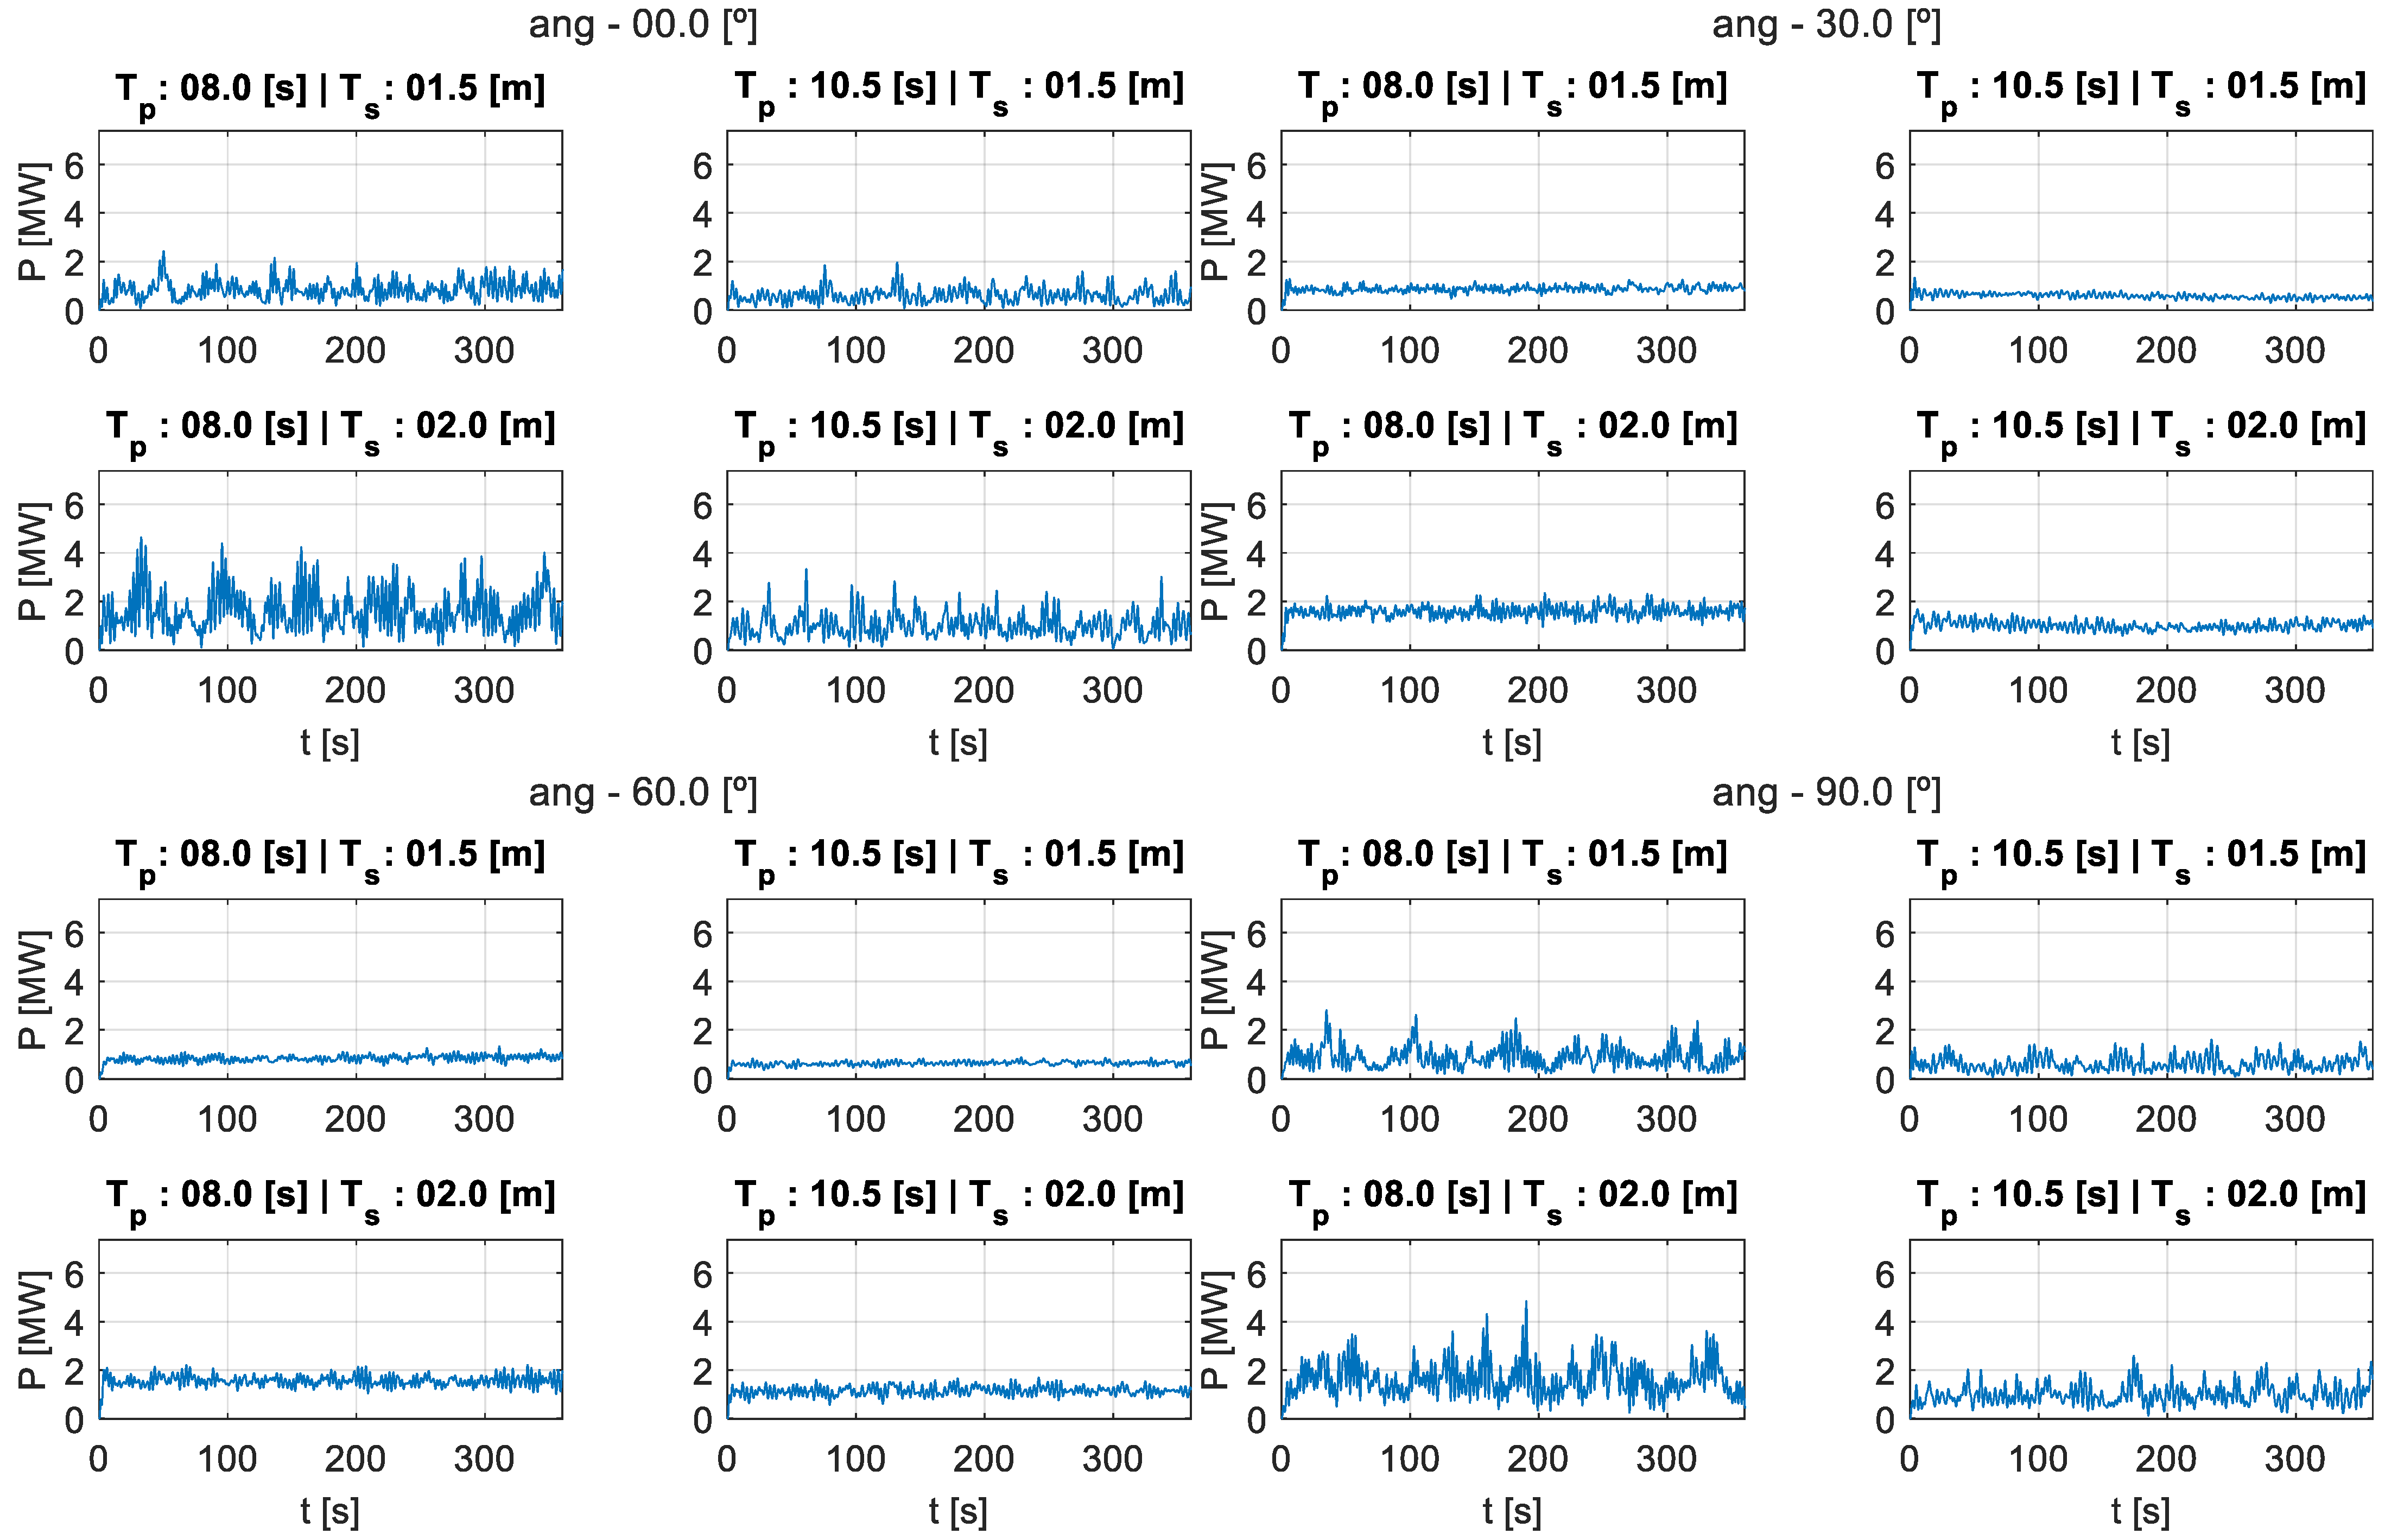
Section 4 presents the results for 16 representative sea states selected for the location introduced in Section 2.1.1 (see Table 1). The corresponding one-hour power generation profiles are displayed in Figure 7.
The analysis compares results obtained using the forecasting algorithms described in Section 2.3 and listed in Table 3. Forecasted values are used in MAF to define the ESS power command of the power smoothing control. As in [23], the main objective is to minimize the impact of the WF on the grid by reducing power oscillations. A key performance metric is the variance of the power delivered to the grid, P G R I D , by the combined ESS + WF system. This variance is calculated using Equation (13) and the standard deviation is calculated according Equation (14).
σ 2 P = 1 N i = 1 N P E S S t i m e a n ( P E S S t ) ;   t   o f   a   c o m p l e t e   s i m u l a t i o n
σ P = σ 2 P ;
In addition, the study also evaluates the ESS energy and power requirements based on Equations (3) and (4).
A comparison is carried out between the proposed Bayesian neural network-based forecasting method and classical approaches (see Section 2.3), which are summarized in Table 3. For benchmarking purposes, two additional scenarios, one assuming perfect prediction (Perf) as a limit case and another with no prediction (noPred) as base case, are included. This serves to establish an upper performance bound for the forecasting-based control strategies.
The control strategies are parametrized using two values: the moving average window size—expressed in number of samples (Ns_MAF) or in seconds (nMAF)—and the forecast window size (Ns_Pred expressed in number of predicted samples, or nPred expressed in seconds), as defined in Equation (2). For clarity, all parameter values are expressed both in number of samples and in equivalent seconds, considering the sampling time Δt = 0, which remains constant throughout this work. For instance, a total moving average window of Ns_MAF = 300 corresponds to nMAF = 30 s, and a forecasting horizon of Ns_PRED = 80 corresponds to nPRED = 8 s. This notation has been applied consistently throughout the manuscript, including the captions of figures and tables. The combinations analysed are derived from the following vectors:
  • Total window size: Ns_MAF: [0, 10, 20, …, 320] samples; nMAF: [0, 1, 2, …, 32] seconds;
  • Forecast window size: Ns_Pred: [0, 10, …, 80] samples; nPred: [0, 1, …, 8] seconds.
The configuration includes, on one hand, a no-storage scenario (nMAF = 0) as a baseline for evaluating the effectiveness of ESS integration. On the other hand, all scenarios with nPred = 0 represent filtering strategies without forecasting and serve to establish a lower bound for forecasting improvement.
Based on the example shown in Section 3.1, the expected results (detailed in Section 4) can be summarized as follows:
  • The reduction in power variance is primarily driven by the total filtering window size nMAF, with limited influence from the forecasting window.
  • The decrease in ESS capacity requirements, particularly energy, is strongly influenced by the forecast window size nPred.

4. Results

4.1. Training of Neural Networks and Tuning of Forecasting Models

In this article, we have used historical data from the power series to train the forecasting models, both linear and neural networks. One of the most important steps to achieve good forecasting and avoid overfitting is to study the complexity of the models. In this case, the steps described in [77] ere followed. The data set is divided into a training set and a test set. The training set is used to train the forecasting model, and the test set allows us to study the accuracy of the model when presented different data from the training data, thus avoiding overfitting.
In the case of the linear models (Section 2.3.2), the complexity of the model consists of the number of inputs for the AR model ‘p’ and the number of error terms for the MA model ‘q’. The partial autocorrelation function sample (PACF), the autocorrelation function sample (ACF) and the Bayesian information criterion (BIC) are used to study the complexity of the model.
PACF establishes a correlation between two values of a series with a time difference between them, so it is used to find the relevant past values. The maximum order value of p is set within the 95% range of the PACF sample. Similarly, an ACF sample is used to set the maximum order of q in the MA model. Once the maximum order of p and q has been determined, training is performed with all possible combinations of p and q from 1 to the maximum. Finally, the complexity of the model is decided among all these simulations by calculating the BIC and the model error %rRMSE (Root Mean Square Error) with the test data set. For each case study and each prediction horizon, the optimal p and q were calculated according to this procedure. The prediction error with a simple ARMA(2,1) model was also calculated for comparison.
In the case of neural networks, the complexity of the model is studied by choosing the number of inputs (past data of the series) and the number of hidden units. The Bayesian framework allows us to study the number of inputs with the ARD technique and the number of hidden units with the log of the evidence [73,74]. Both techniques control the overfitting of the model. ARD assigns a different hyperparameter to each set of weights associated with an input. At the end of training, weights whose hyperparameter has a high value are close to zero and the input is considered irrelevant to the model. After training with different numbers of inputs and hidden units, these techniques made it possible to choose the number of model parameters. The past values used in the prediction are those corresponding to all the steps within the previous one second (steps of 0.1 s) and the values of the previous 9 s (steps of 1 s).
Figure 8 shows the errors of the different forecasting models. The figure shows a comparison of the accuracy of all models for each case study and for all forecasting time horizons. As expected, it can be seen that the prediction error increases as the time horizon increases. In general, in all cases and for all prediction horizons, the neural networks proposed in this study provide more suitable forecasting and present the lower errors. The linear models do not provide a very significant improvement over the use of a naive model.

4.2. Results of Applying the Forecast-Enhanced Filtering Strategy to the Case Study

Following the training (in the case of the Bayesian network -NN-) or parameter fitting (for the ARMA-based models), a set of valid forecasting systems was obtained for analysing all the scenarios described in Section 3. In total, the evaluation covers 16 representative sea states, 6 forecasting algorithms (including perfect forecasting), 31 total MAF window sizes (including the case without MAF), and 9 forecasting window lengths (including the case without forecasted values), resulting in a total of 26,784 configurations.
The evaluation is based on three key performance metrics— P r a t e d , E r a t e d , and the standard deviation of the grid-injected power, σ P —along with their respective normalized ratios compared to the no-forecasting case:
  • Required rated power for the ESS ( P r a t e d )—Equation (3).
  • Required rated energy for the ESS ( E r a t e d )—Equation (4).
  • Standard deviation of grid-injected power after filtering via MAF and ESS ( σ P )—Equation (14).
  • Ratio of P r a t e d compared to the no-forecasting case.
  • Ratio of E r a t e d compared to the no-forecasting case.
  • Ratio of σ P compared to the no-forecasting case.
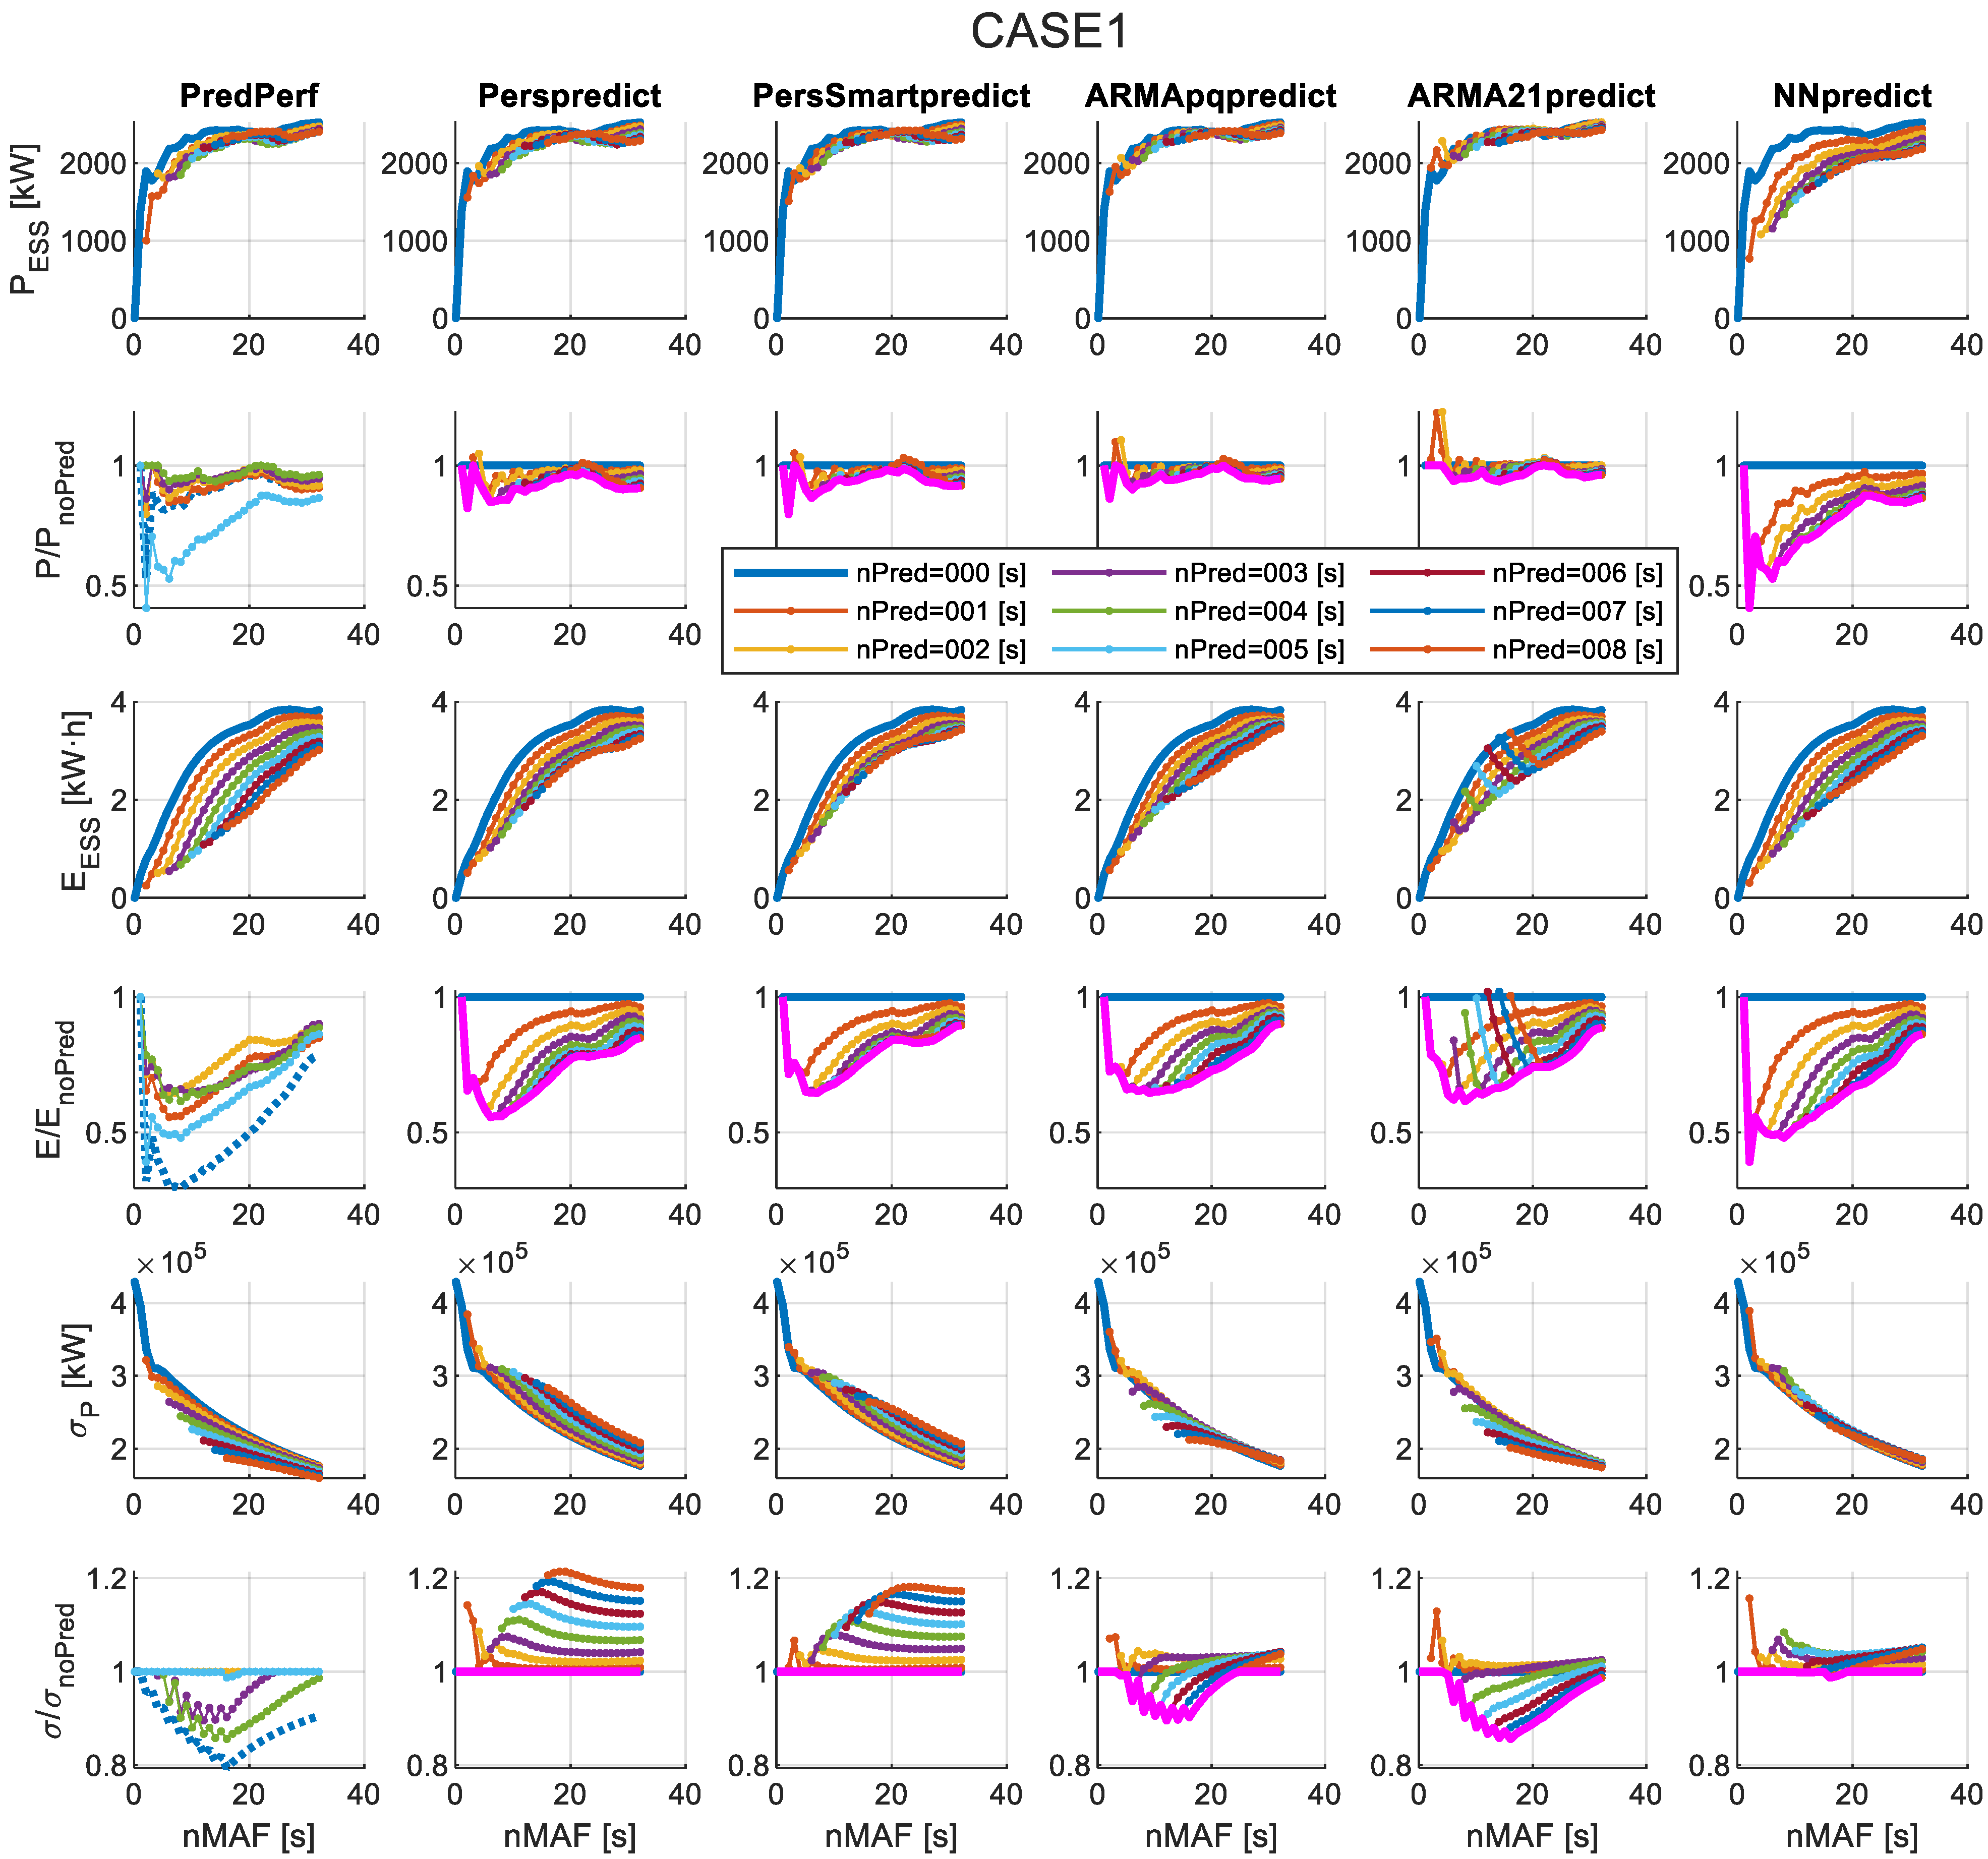
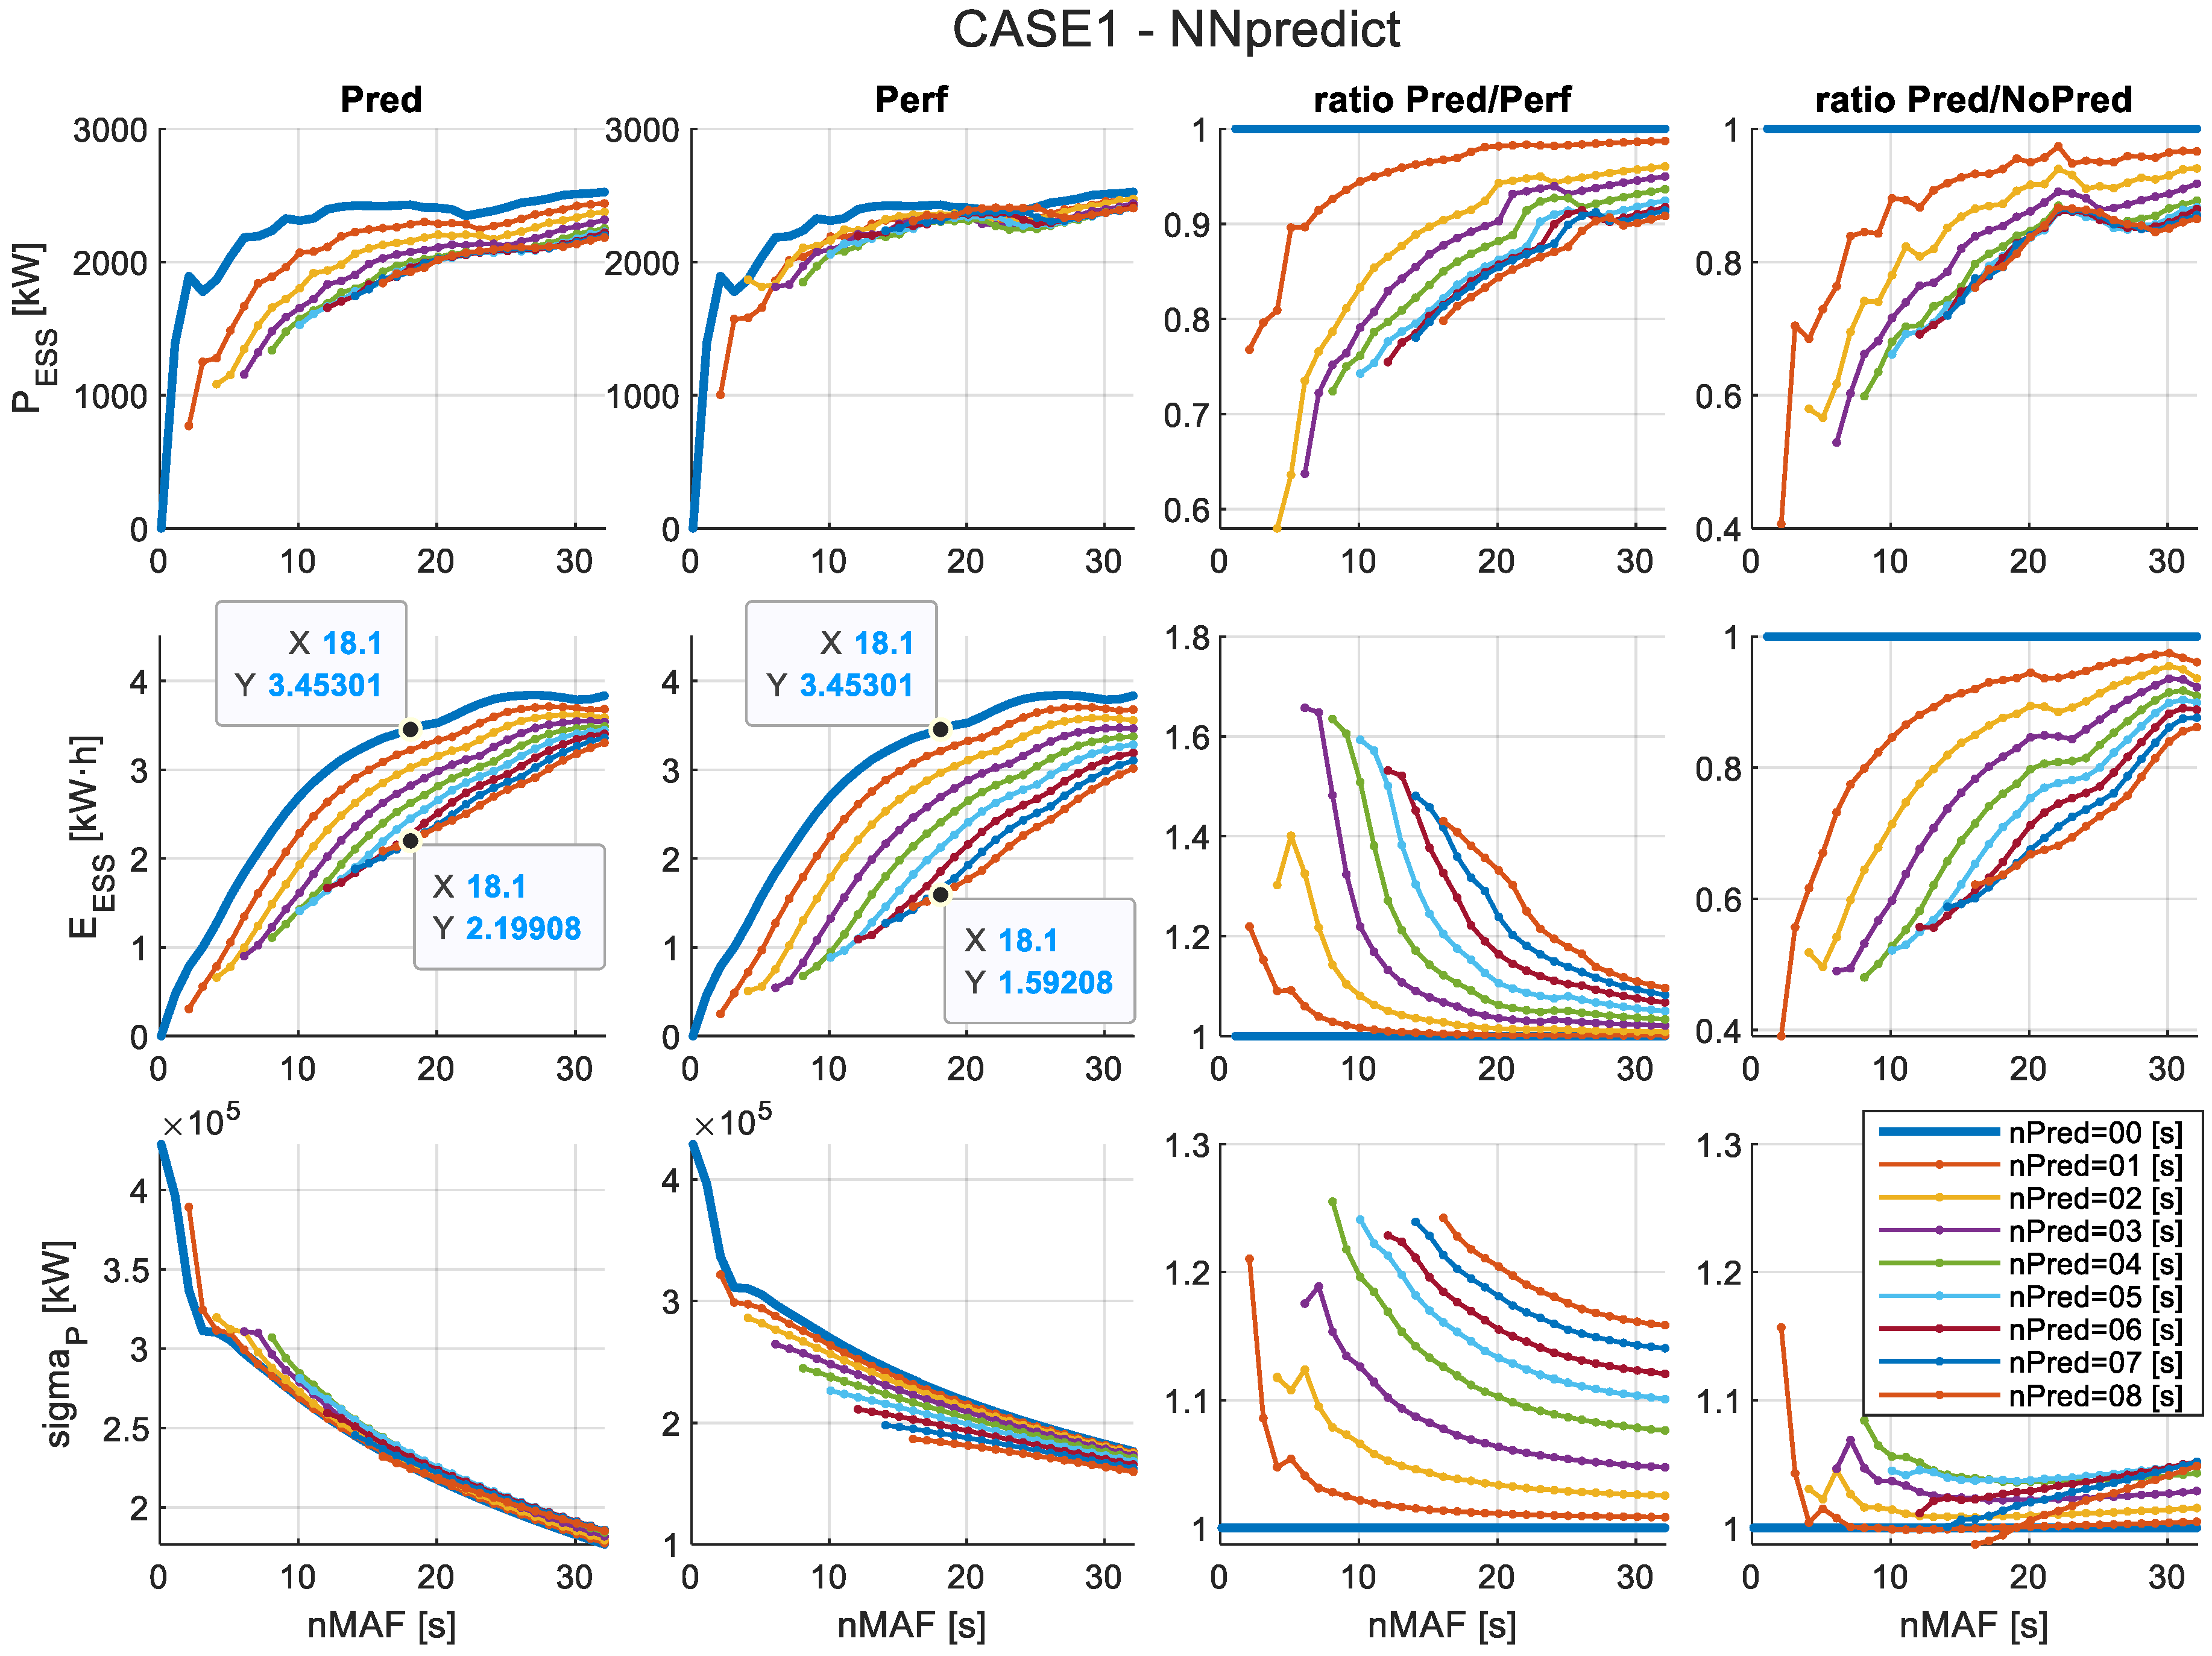
To illustrate the methodology, results for Case 1 are presented in detail in Figure 9, showing the six performance metrics across the five forecasting algorithms and the perfect forecasting scenario (PredPerf). Each set of plots presents the metrics versus the MAF window size (nMAF), grouped by forecasting window length (nPRED). Additionally, the optimal (nMAF, nPRED) pair that minimizes energy storage requirements is highlighted. Figures for all 16 sea states are provided in Appendix A.
These plots show that, regardless of the forecasting algorithm, incorporating forecasted values consistently reduces energy storage requirements compared to no forecasting (see the E/Enopred plots, always below 1). The rated power requirement P r a t e d remains similar to the no-forecasting case (see P/Pnopred), except for the NN model, where deviations are observed. Regarding σ P , the standard deviation tends to remain close to, or slightly above, the values of the no-forecasting case for ARMA and NN algorithms (see σ/σnopred, with values close to or below 1, except for low nMAF values). This behaviour suggests that MAF design can be oriented toward σ P limitation, largely independent of forecasting window and algorithm, which can then be optimized for energy savings.
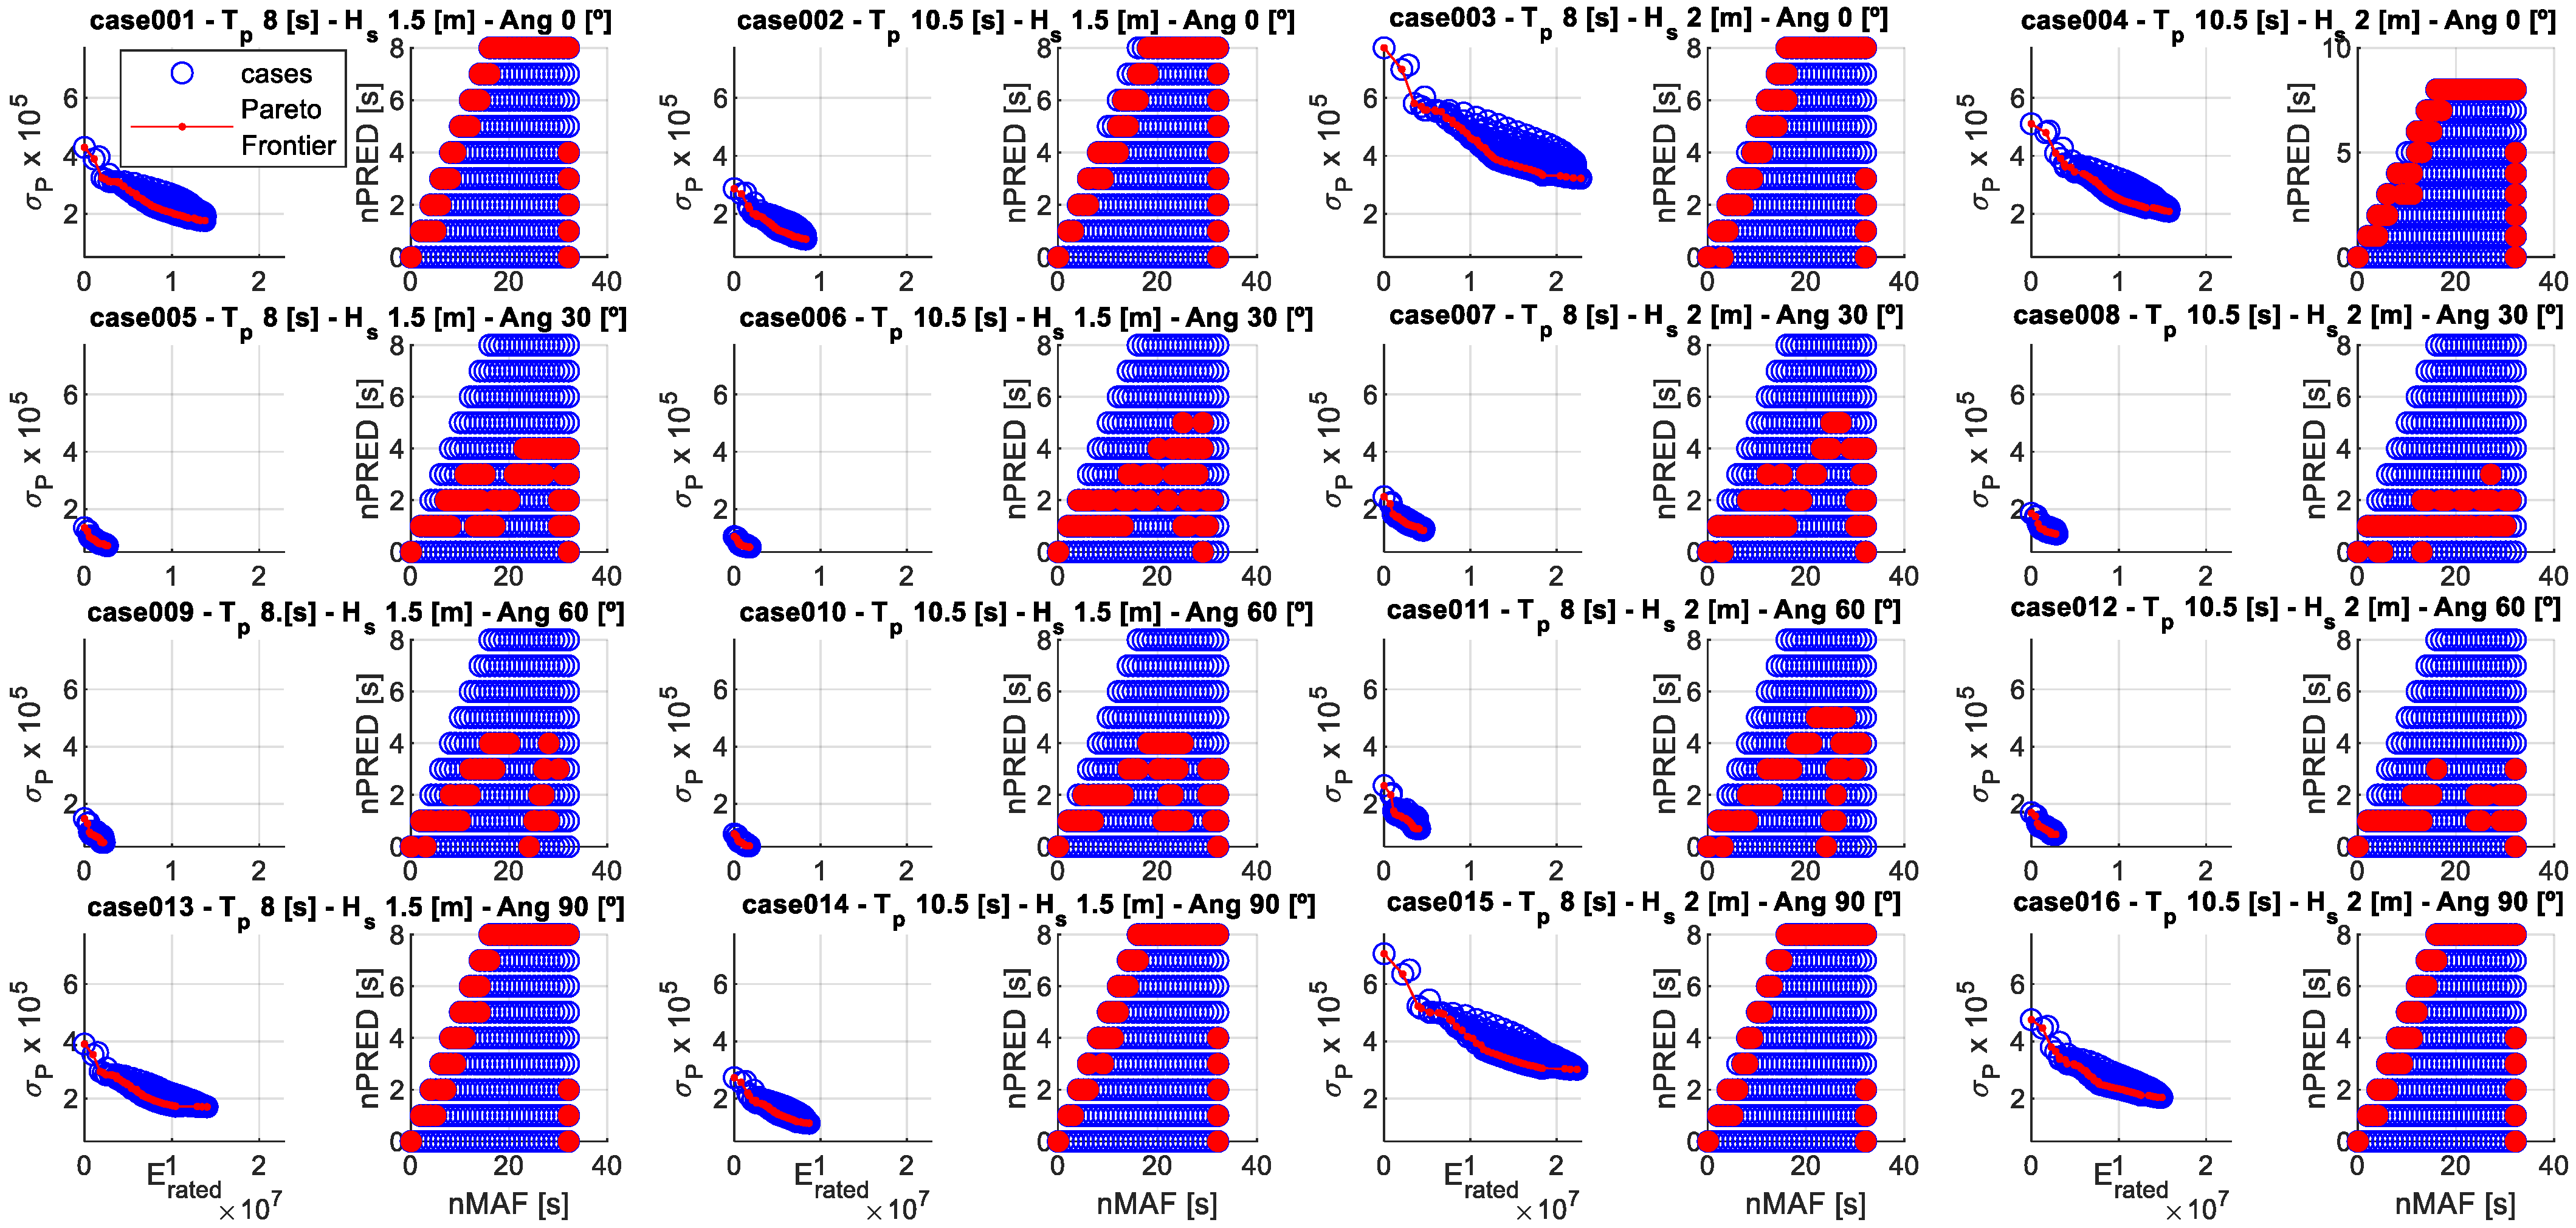
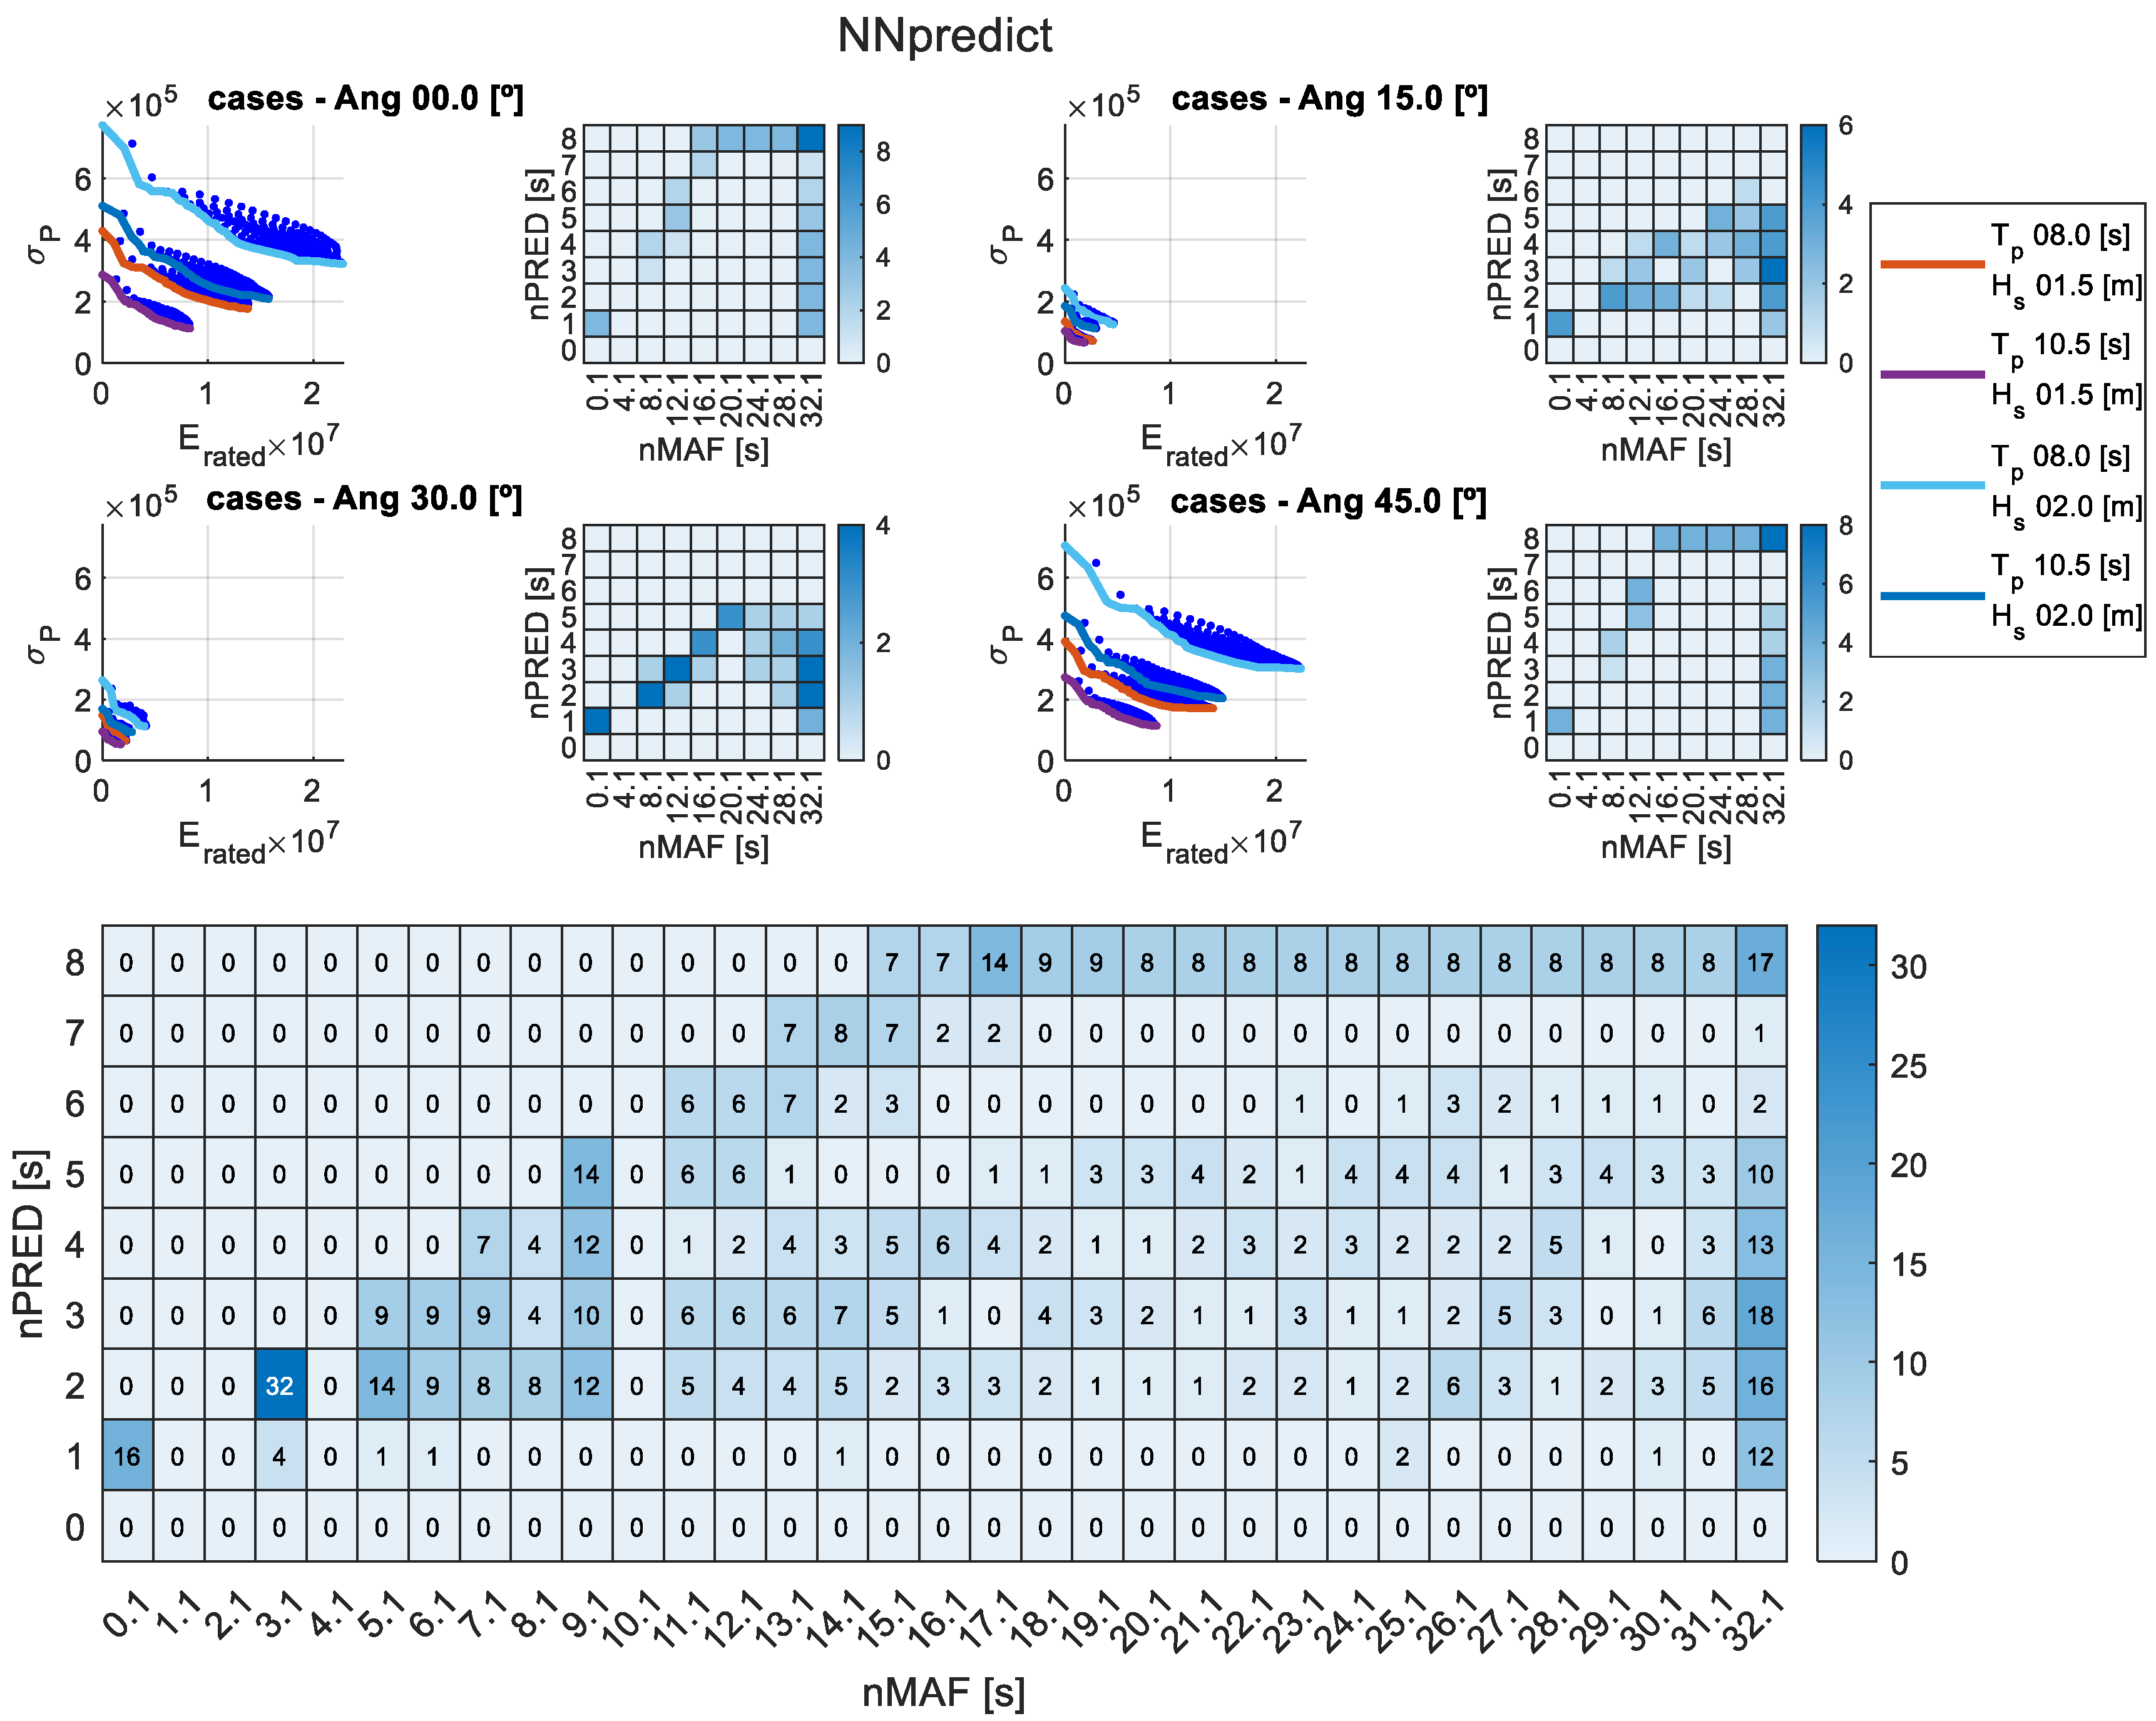
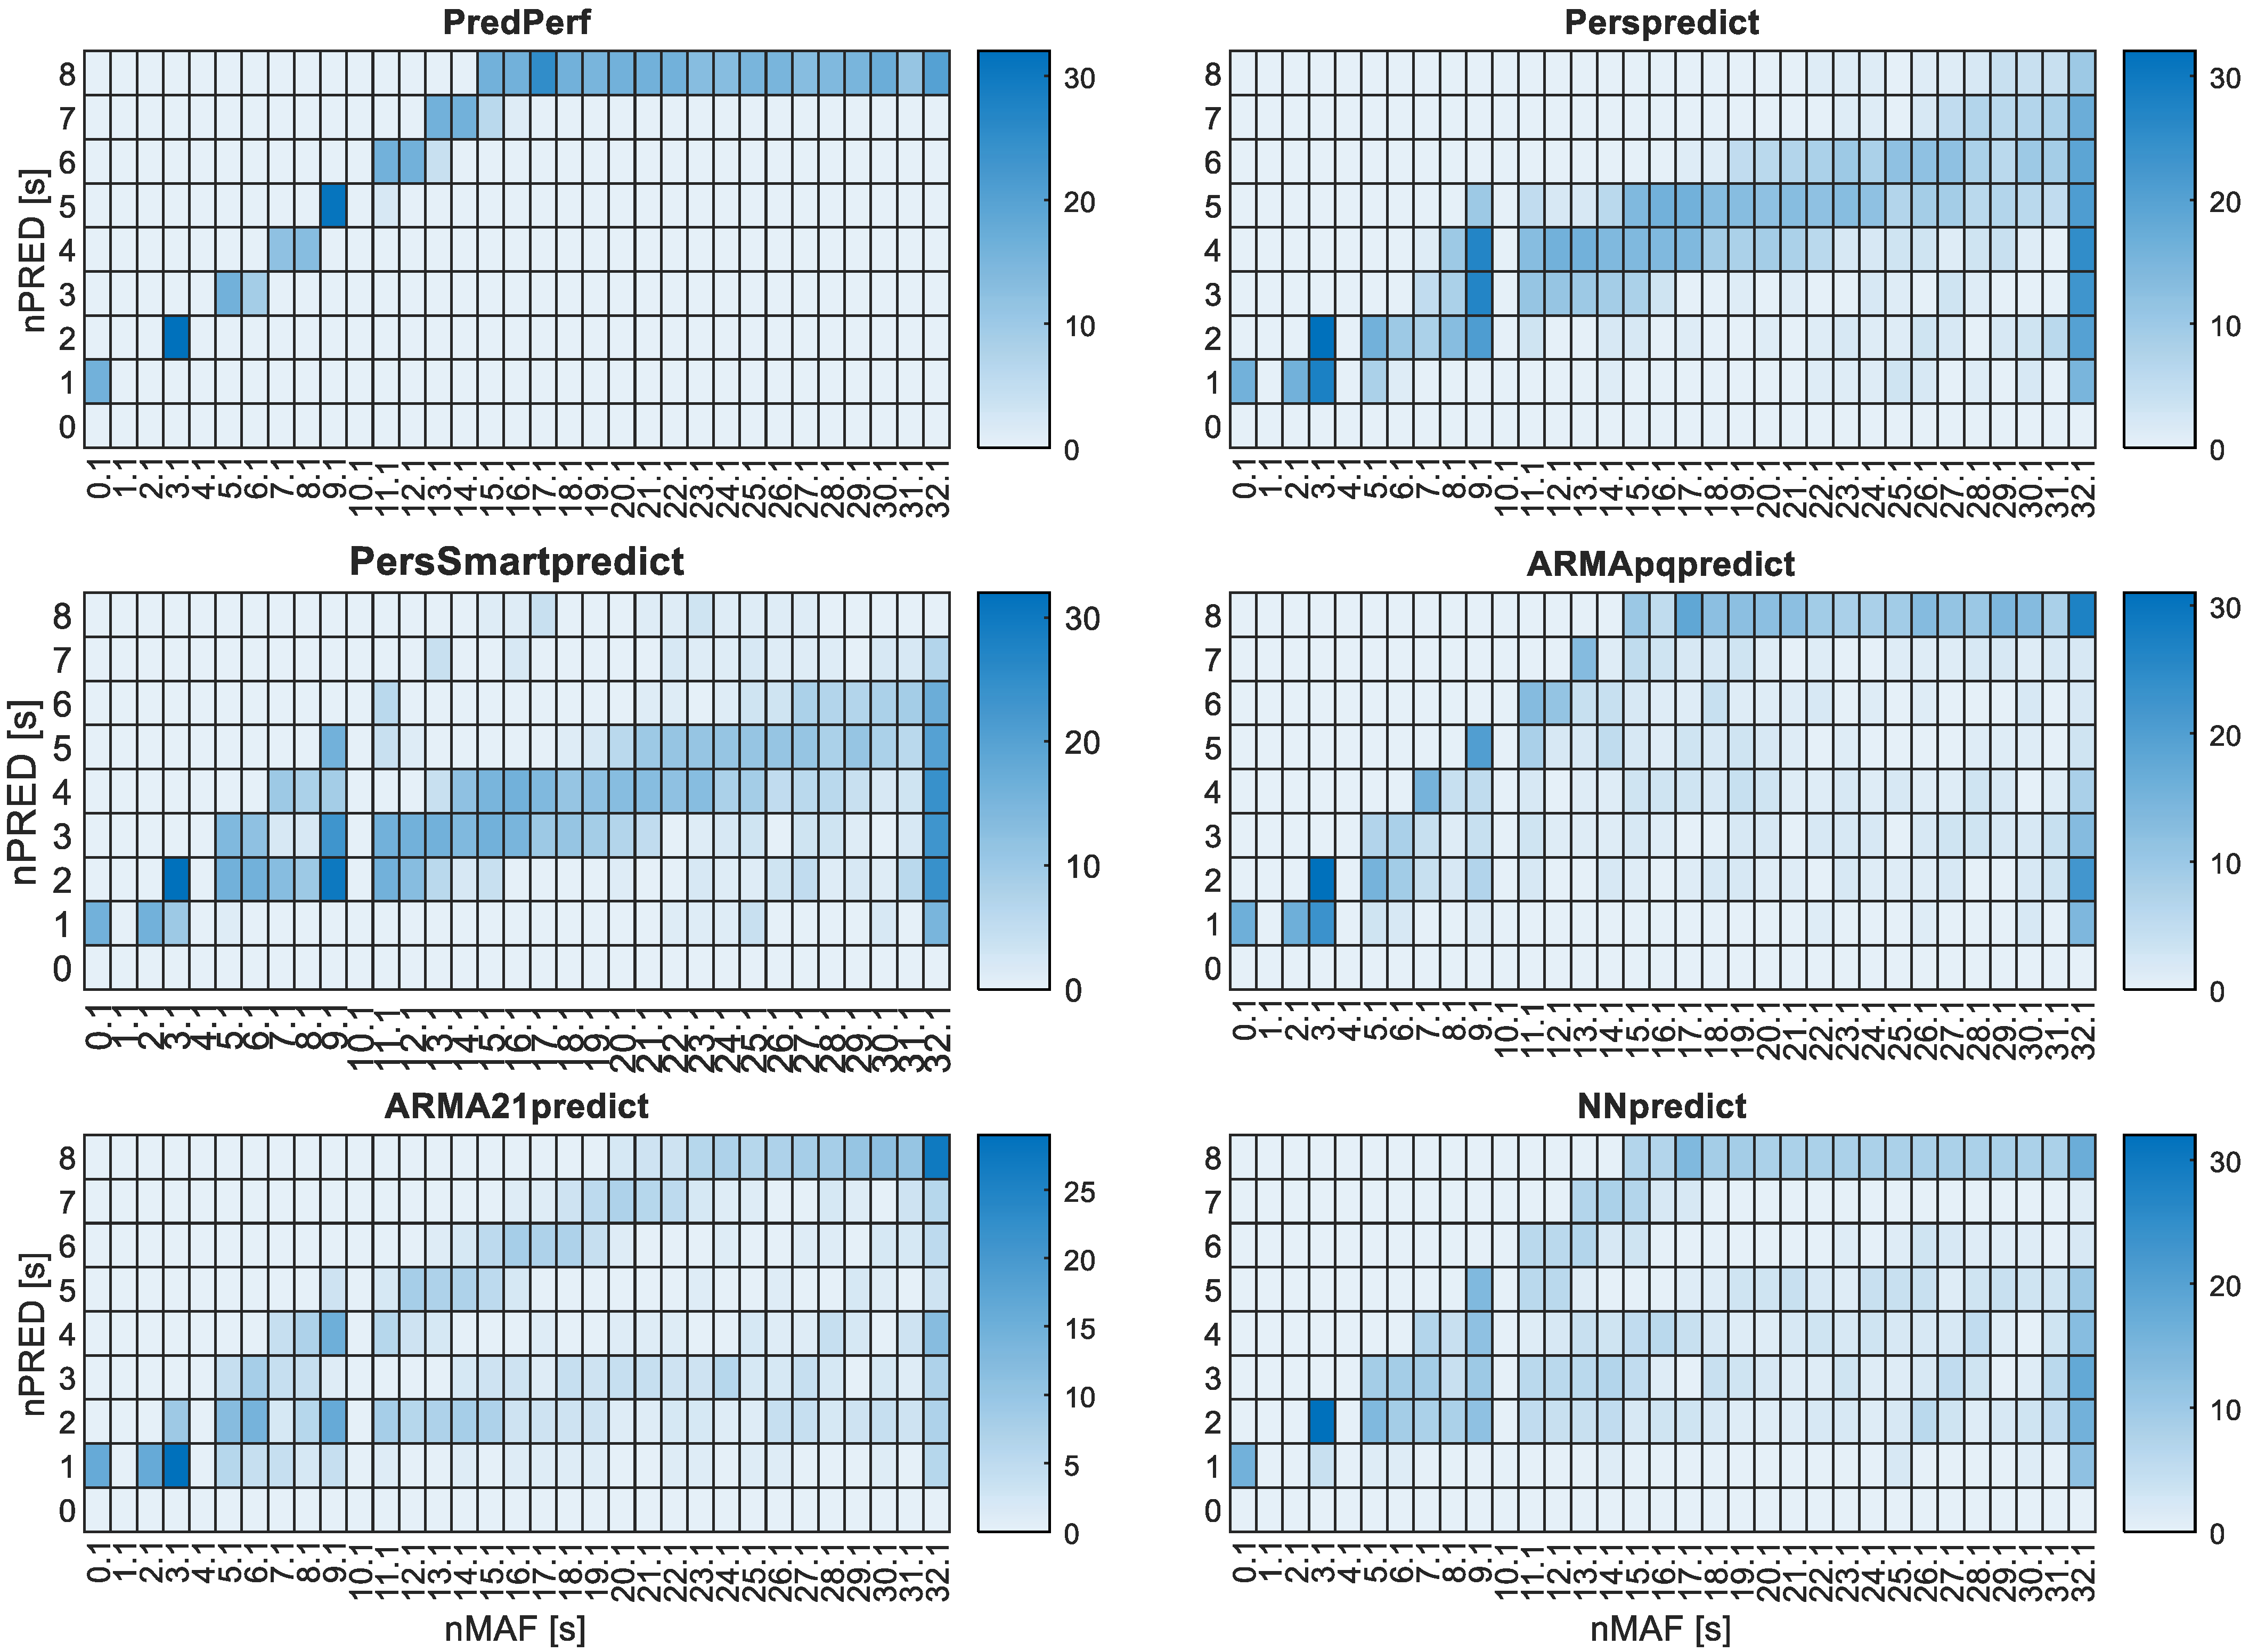
Figure 10 shows an aggregated analysis across the 16 sea states, focusing on the proposed Bayesian network forecasting model (NN). Each subplot displays the Pareto front (in red) for σ P versus E r a t e d , along with the optimal (nMAF, nPRED) combinations. In Figure 11, results are grouped by wave incidence angle (in sets of four cases), and the number of times each (nMAF, nPRED) pair appears in the Pareto fronts is counted. The bottom plot of Figure 11 summarizes the most frequently optimal parameter combinations. Figure 12 extends this analysis by presenting the same summary for all six forecasting algorithms, including perfect forecasting.
From Figure 10, we observe that larger forecasting windows (nPRED) yield better results for sea states 1–4 and 13–16, which are characterized by higher σ P . For the remaining cases (5–12), which benefit from spatial smoothing due to WEC positioning (see Figure 7), prediction remains beneficial, though maximum nPRED values are not necessarily optimal. When considering all 16 sea states (Figure 11), maximum values for both nMAF and nPRED tend to appear frequently in the Pareto-optimal combinations. Figure 12 confirms that forecast-enhanced filtering outperforms filtering without forecasting across all algorithms—forecasted values consistently contribute to reductions in both σ P and E r a t e d . In the perfect forecasting scenario, the maximum nPRED value is always selected.
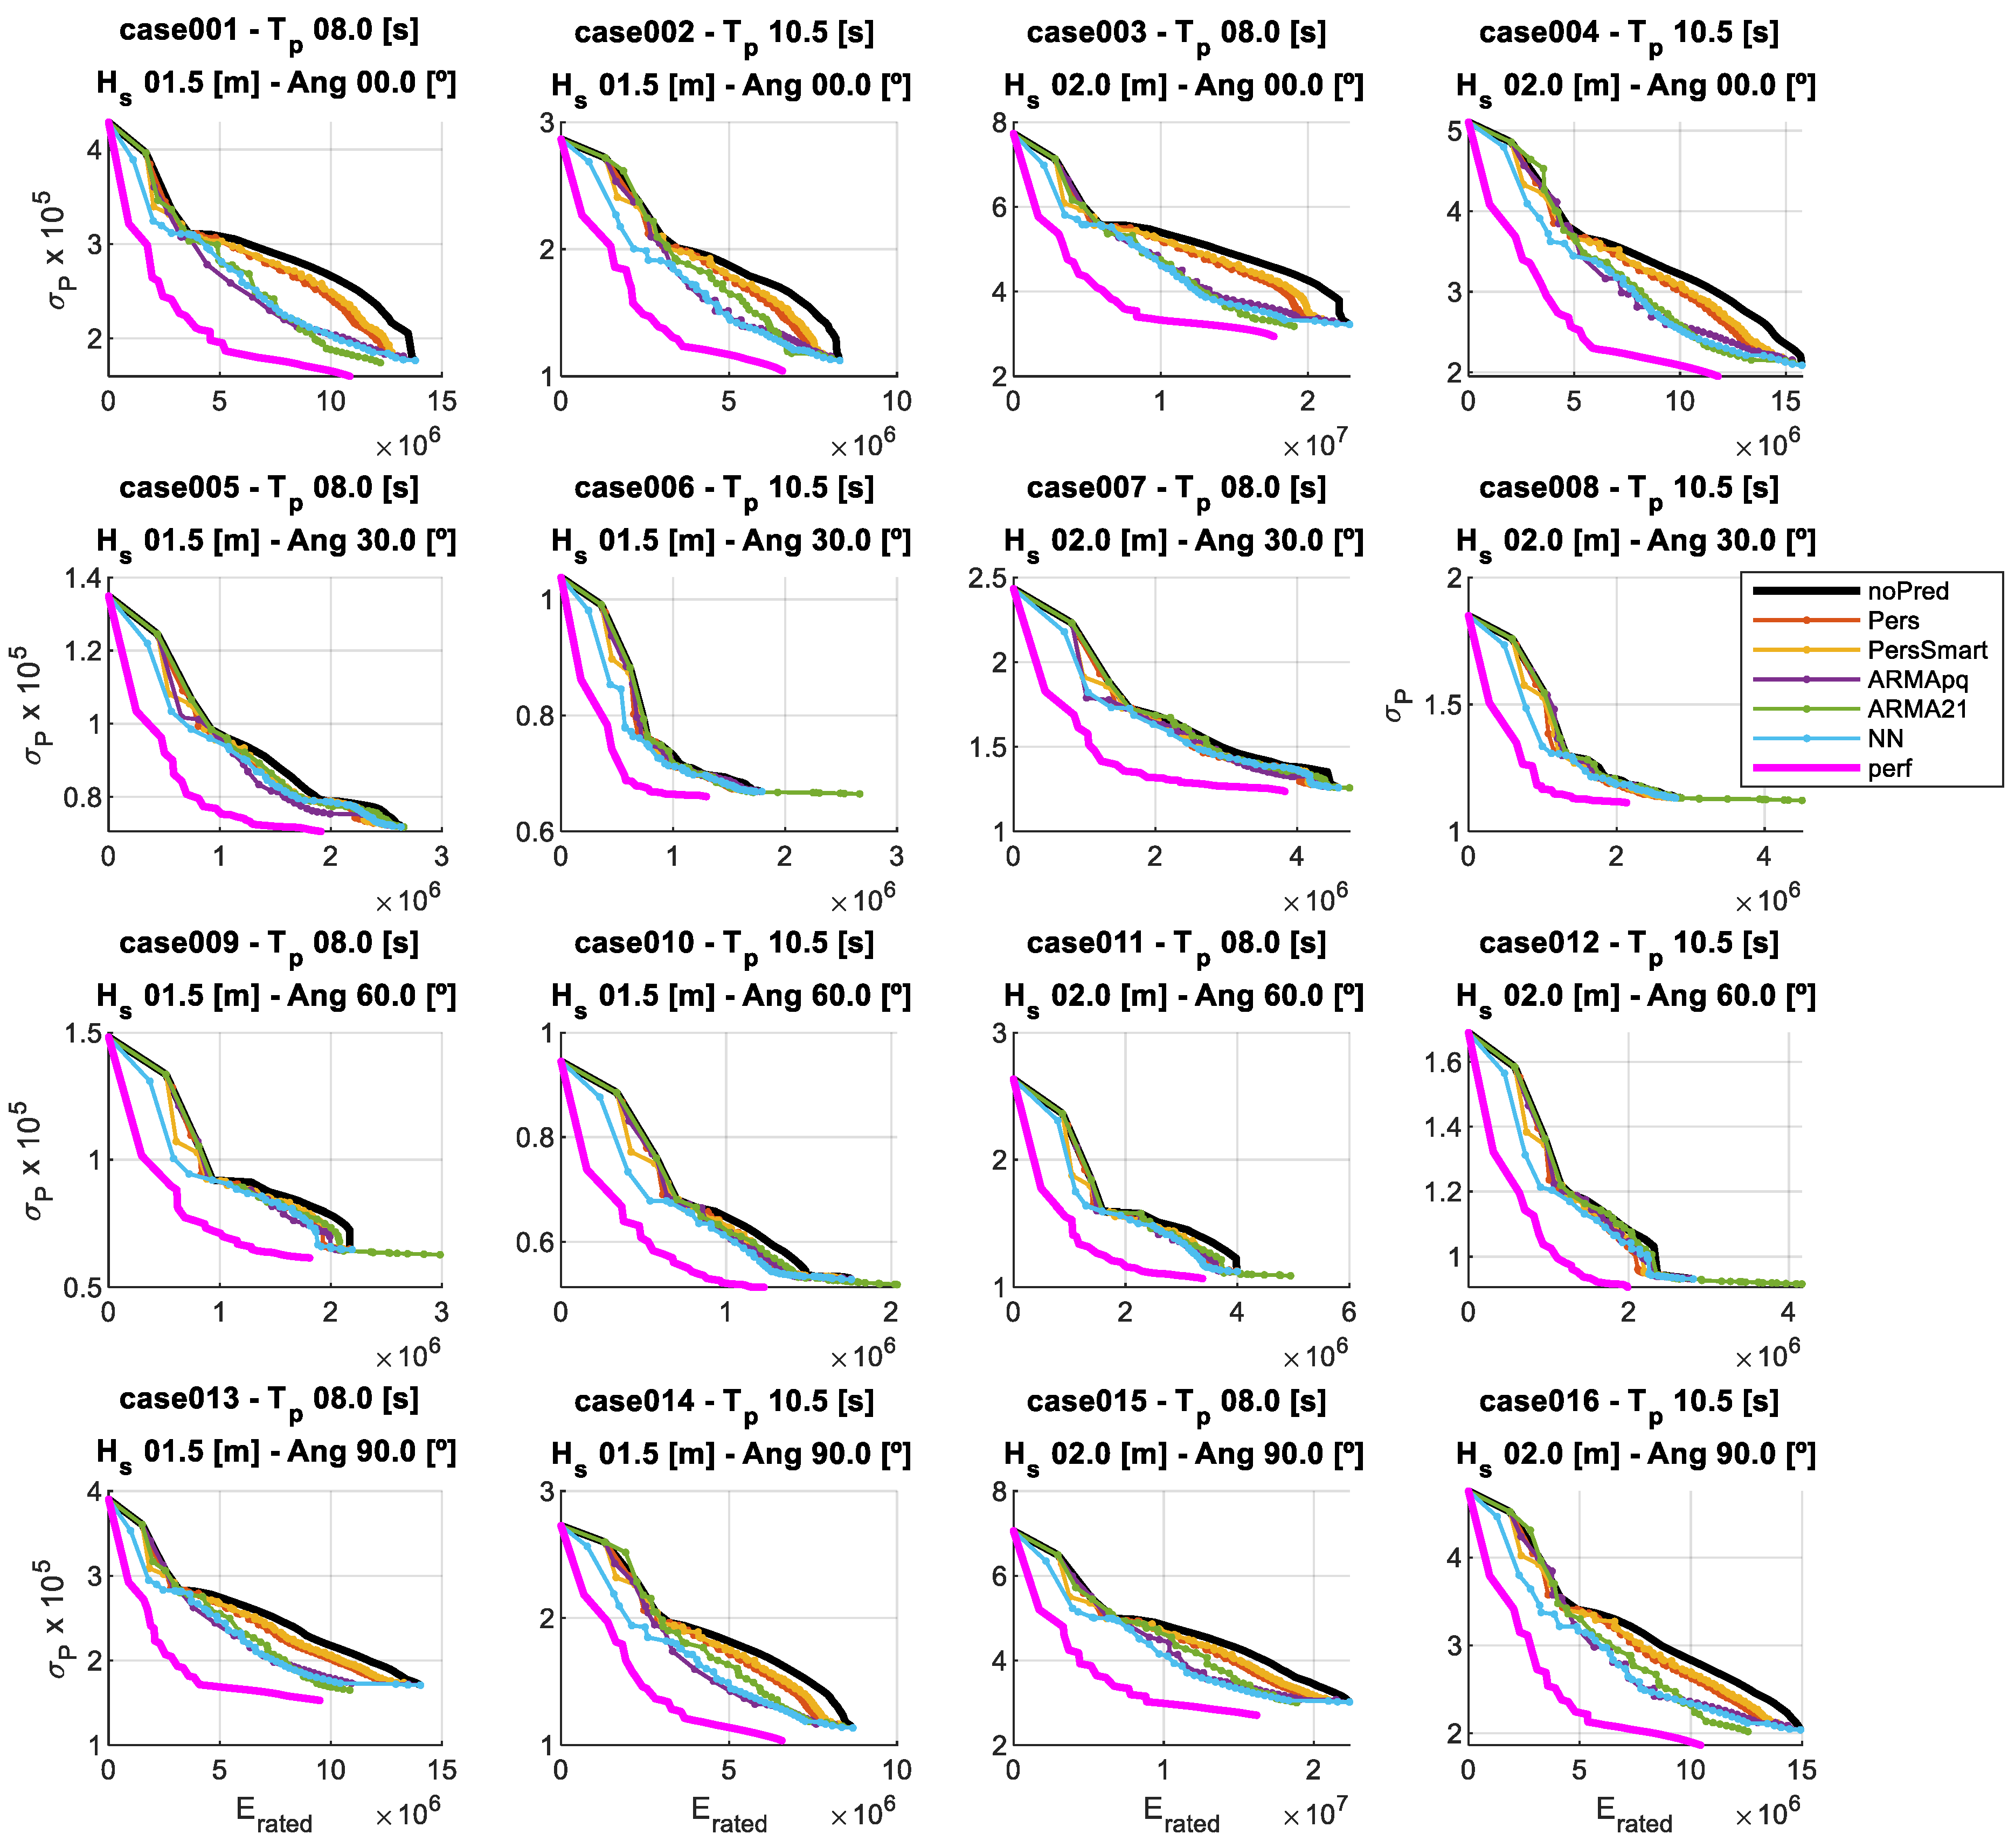
Figure 13 compares Pareto fronts across the six forecasting algorithms, again highlighting improvements relative to filtering without forecasting. In Figure 13, we observe consistent performance gains from all forecasting algorithms over the no-forecasting baseline (black line). Improvements are especially pronounced for sea states with high σ P (cases 1–4 and 13–16). NN often outperforms simpler models, although ARMApq may yield better results in high- E r a t e d scenarios where filtering smoothness takes precedence over fidelity. Perfect forecasting results are also shown (in magenta), representing the theoretical upper bound for performance improvement.
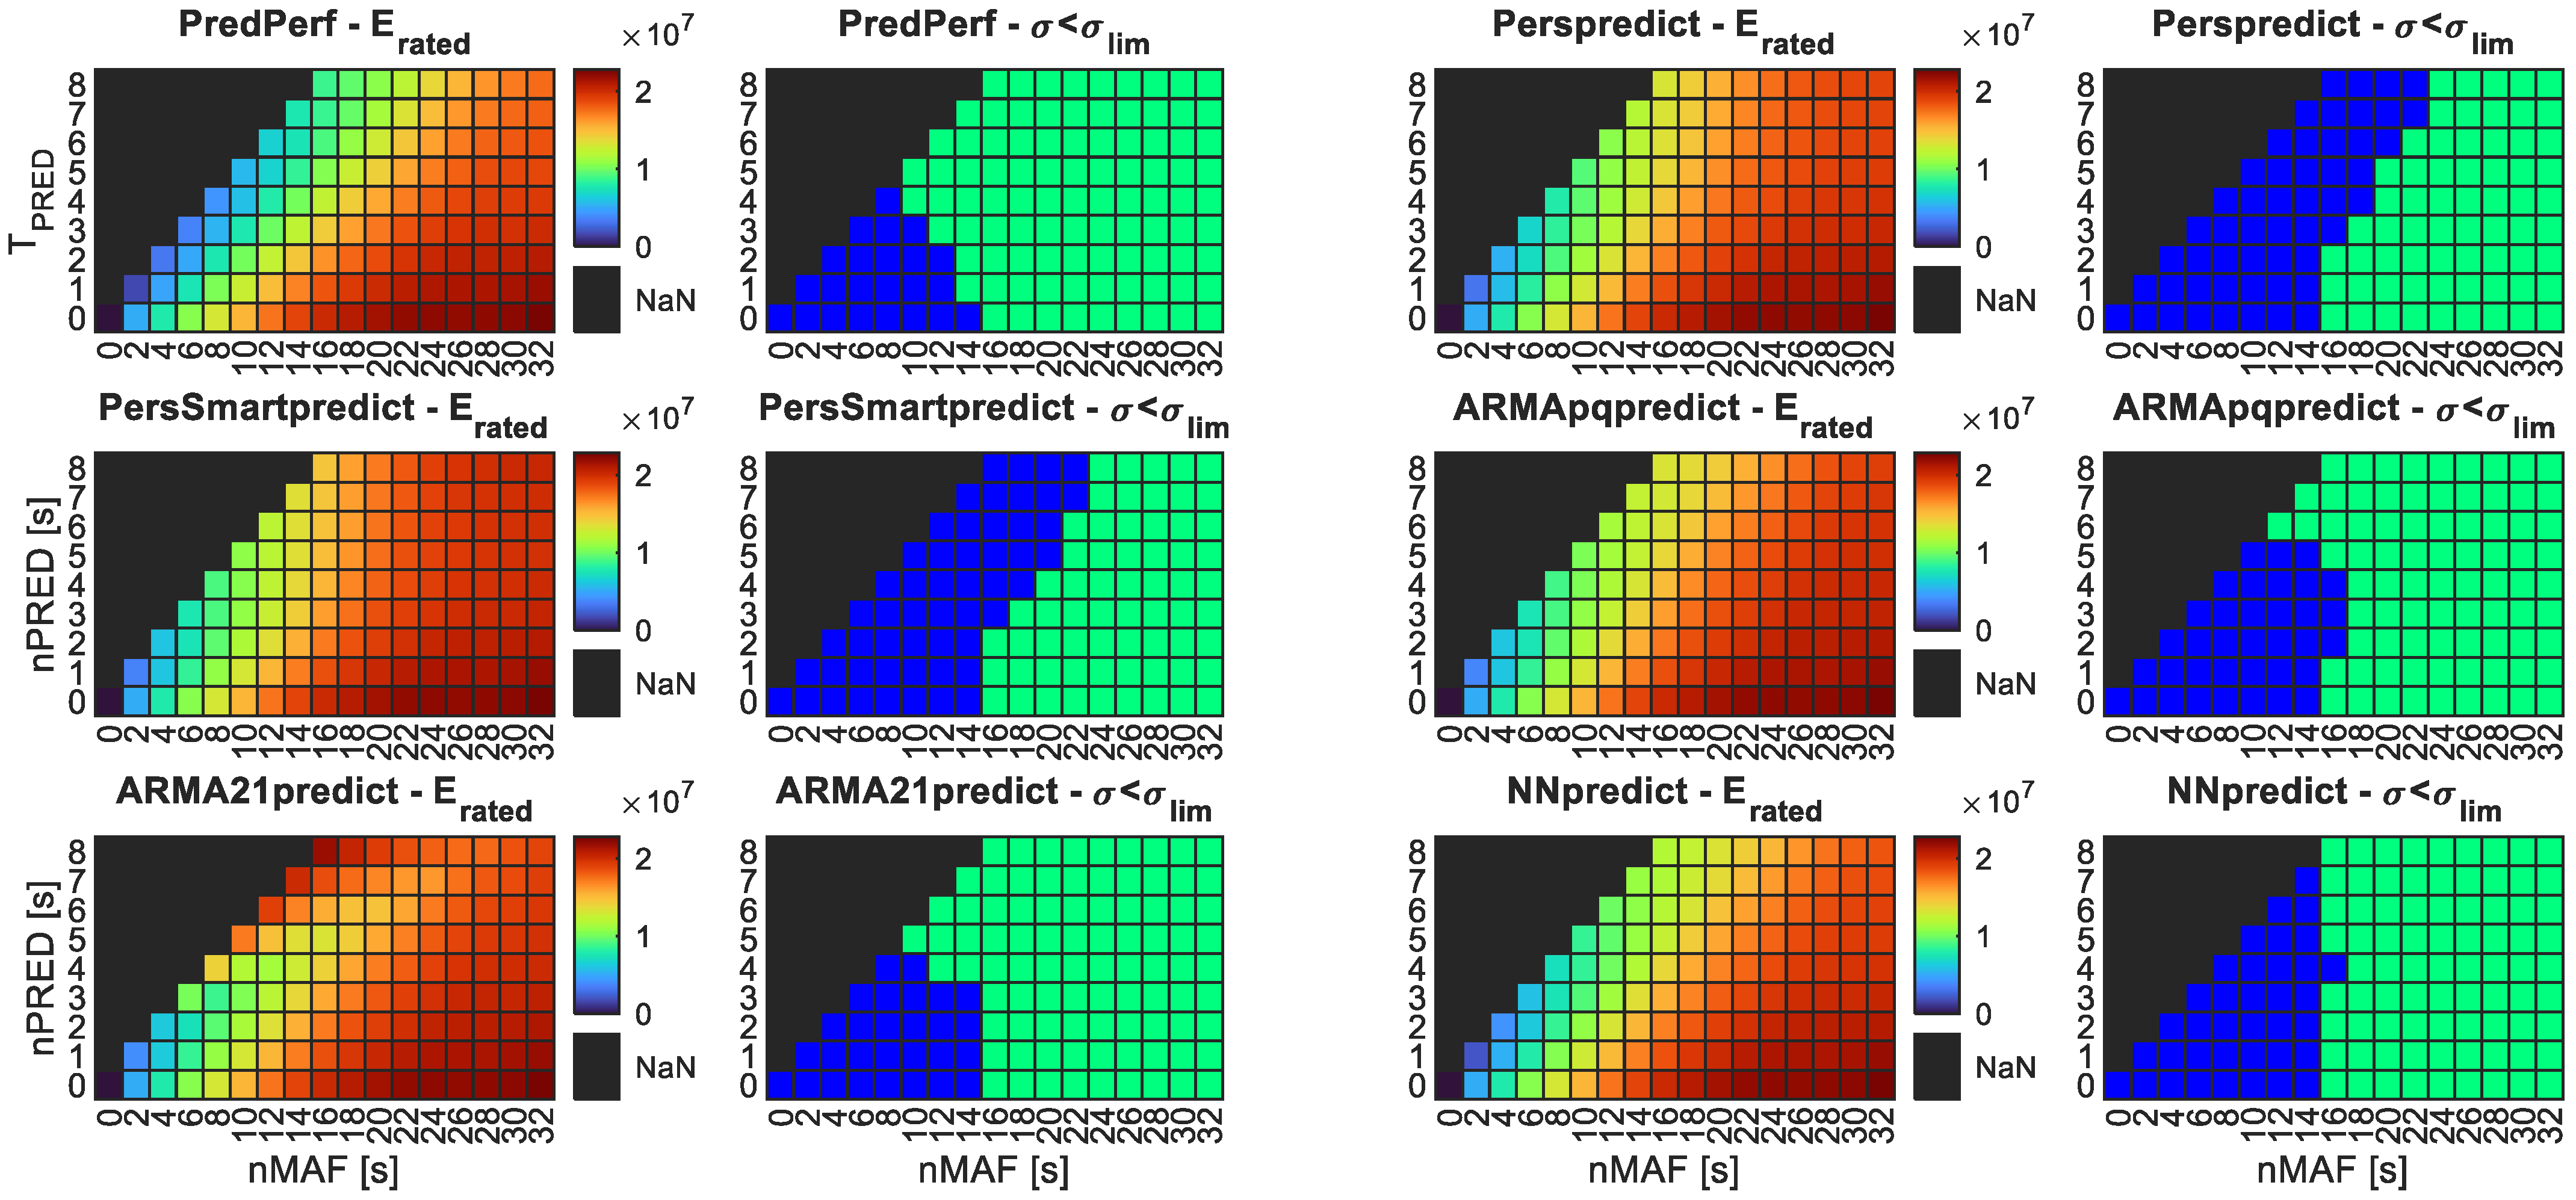
Although the primary objective of this work is to demonstrate the advantages of incorporating forecasting algorithms into the smoothing of power output generated by a wave farm (WF), and to present the implementation and results of applying real forecasting algorithms in moving average filters, rather than to provide a detailed sizing methodology for prediction and filtering systems, it is still possible to report the performance of the objective variable E r a t e d with respect to the parametrization values of the forecasting and filtering algorithms (i.e., optimal combinations of nMAF and nPRED). Furthermore, one may assess which of these combinations meet the minimum requirements in terms of reducing the standard deviation of power ( σ P ), with the aim of selecting the design parameters for a specific filter configuration.
Based on the reference study in [23], a σ P threshold of 5.12 × 10⁶ W was established to ensure grid frequency stability when integrating the studied WF (see Section 2.1) into the isolated electrical system of Tenerife. This threshold is used to identify configurations nMAF-nPRED capable of limiting grid disturbances.
Results are shown in Figure 14. Heatmap graphs of E r a t e d and σ P as functions of (nMAF, nPRED) for all forecasting algorithms, including the perfect forecasting scenario. They indicate that higher nPRED values systematically reduce E r a t e d , regardless of forecasting algorithm. For NN, optimal performance is achieved with nPRED = 8 s and nMAF = 16 s, yielding acceptable energy requirements while satisfying the σ P constraint. This configuration also outperforms all other algorithms except perfect forecasting.
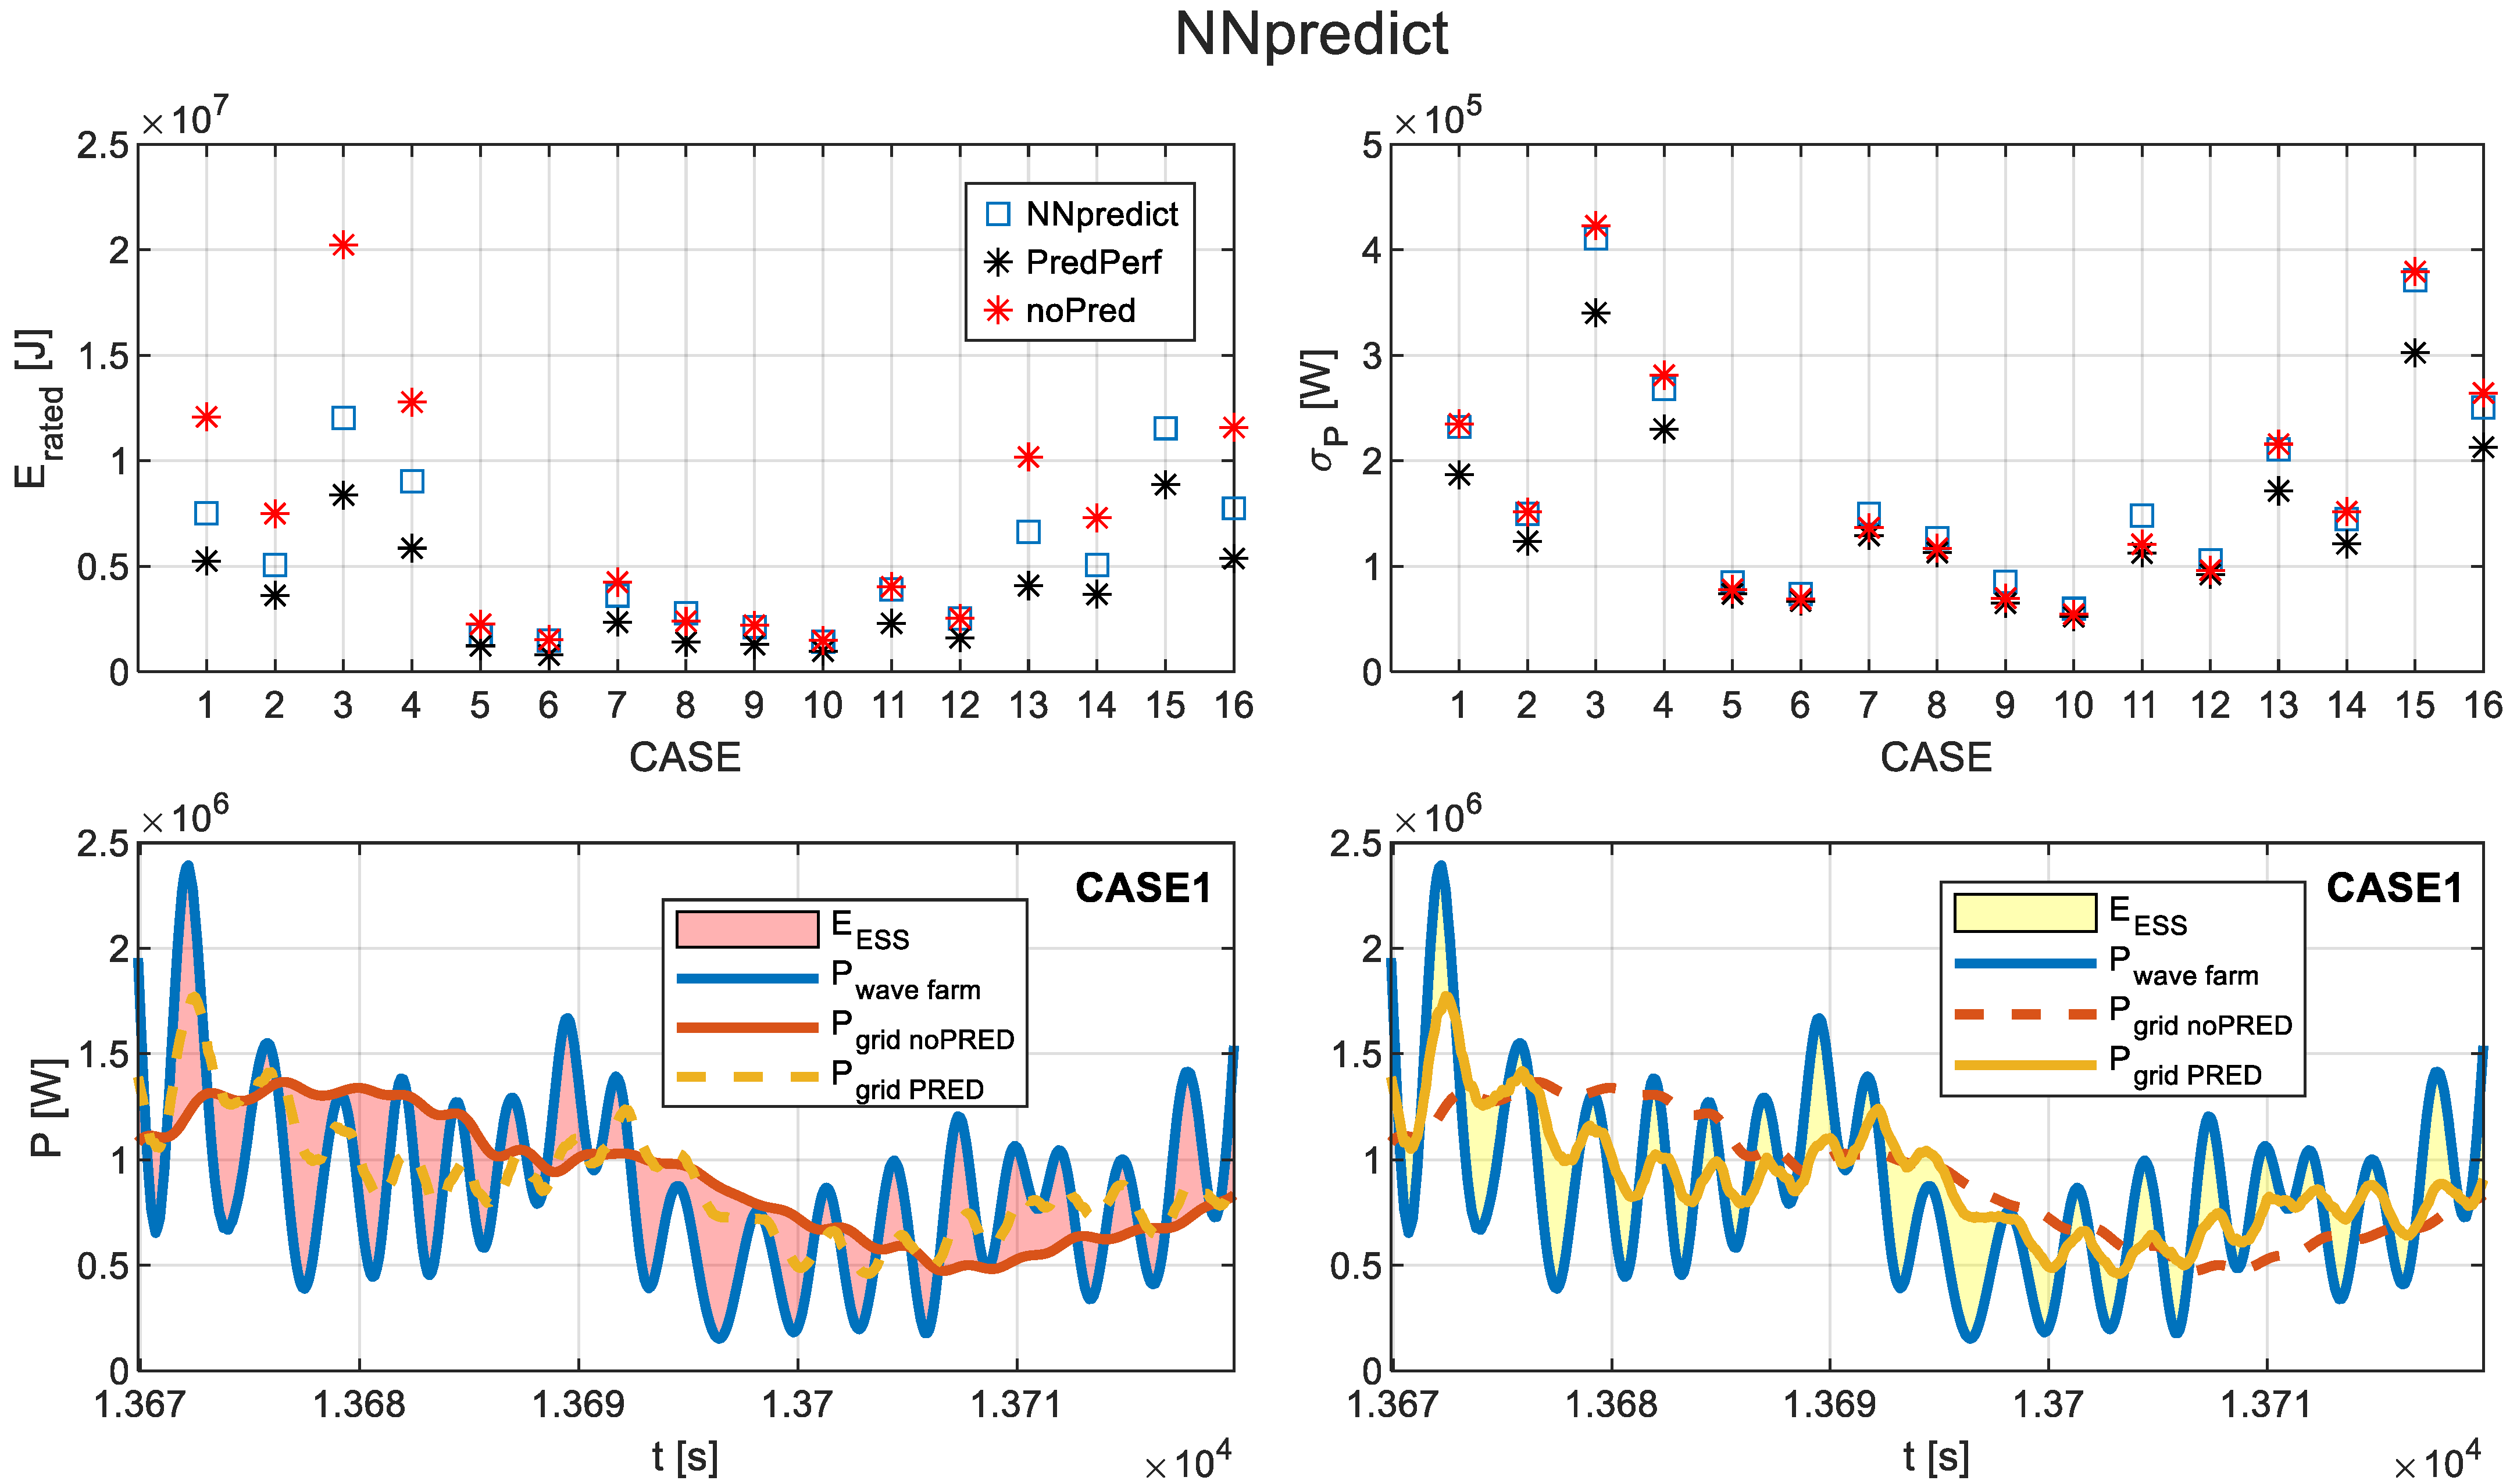
Focusing on the results obtained for the NN algorithm (see Figure 15 for details of sea state CASE 1) it can be observed that, in general, improvements are achieved in reducing the energy storage system requirements ( E r a t e d ) and even the power capacity ( P r a t e d ), albeit at the expense of a slight degradation in the standard deviation of the injected power ( σ P ), which worsens by less than 7% compared to the cases without forecasting.
If we select the filter values of 8 s for nPRED and 16 s for nMAF, the results for σp and E r a t e d can be shown for each of the 16 cases (compared against perfect forecasting and the no-forecasting scenario), as well as a time-domain example of the filtering using the chosen filter with NN and without forecasting (see Figure 16).
In Figure 16, it can be observed that E r a t e d achieves better values compared to the no-forecasting case, while the improvement in σ P is less pronounced. Regarding the time-domain profiles shown, the results are very similar to those already presented in the example of Figure 6; the reduction in the phase lag between the generated power ( P W F ) and the filtered power ( P G R I D ) obtained by using forecasting algorithms leads to a smaller area enclosed between the P W F and P G R I D profiles when forecasting is applied.
In summary, it can be observed that the power used and the smoothing capacity achieved are not strongly influenced by forecasting (the size of the prediction window nPRED), but there is an improvement in the required energy ( E r a t e d ). Moreover, in the case of using NN, it can be seen that the best combination of total window size and predicted window size is 16 and 8 s, respectively.
With this combination, we obtain results demonstrating that including forecasting leads to an improvement in the required storage size (compared to the case with the same total window size but without forecasting), reducing the storage requirements to achieve the same smoothing results of power oscillations (reaching reductions of up to 36.52%). Additionally, the results with NN outperform those obtained with simplified forecasting algorithms such as Pers.
On the other hand, it is also demonstrated that within the forecasting algorithms’ capabilities, there is room for improvement, since results achieved with perfect forecasting could further reduce storage requirements (achieving reductions of up to 53.91%).
Finally, it is worth mentioning the limitations of the study. One of the main limitations is that the assessment of the power and energy requirements were carried out assuming an ideal, technology-agnostic energy storage system (ESS), as described in Section 2. While this assumption allows for a clear comparison of filtering and short-horizon forecasting strategies, it does not capture several engineering constraints that would be present in real-world deployments. In practice, the dynamic behavior of the state of charge (SoC), ramp-rate limits, round-trip efficiency, charge/discharge asymmetry, and potential ageing of storage devices could influence both the sizing requirements and the achievable smoothing performance. These factors would generally tend to reduce the numerical gains reported here and/or could lead to modifications in the control algorithms to take them into account. Nevertheless, even when considering these limitations, the main qualitative conclusion remains valid: short-horizon forecasts consistently reduce the energy required to achieve a given level of power smoothing. By presenting the results under an idealized ESS framework, the study provides a general benchmark that can be adapted to specific storage technologies in future applications. Other limitations to consider are that it focuses on the power smoothing capacity of the ESS rather than on the effects of power oscillations on the electrical grid; that the prediction algorithms are executed in simulation, with their real-time execution to be purchased in the future; and that the high-frequency effects introduced by power electronics have not been considered. All these limitations open the door to further development in future work.

5. Conclusions

The use of energy storage systems (ESS) in wave energy generation is key to reducing power oscillations and improving the stability of the electric grid. In particular, in low-inertia electric systems, such as islanded grids, the introduction of power smoothing mechanisms is essential to avoid frequency oscillations. The combination of moving average filtering techniques with advanced forecasting algorithms, based on Bayesian Neural Networks, allows for significant optimization of energy storage requirements, reducing the need for power and energy without compromising the grid stability.
The results obtained in the case study have shown that using prediction in ESS control algorithms reduces the energy storage system required by 36.52% compared to a configuration without prediction. In the case of a perfect prediction scenario, the maximum reduction achieved is 53.9%. This improvement is very relevant because it has led to lower storage implementation costs, making wave energy projects more economically viable.
Another key aspect identified in this paper is the importance of selecting properly the parameters of the moving average filter and the prediction window. It has been demonstrated that using a prediction window of 8 s and a total filter window of 16 s optimizes the balance between reducing power oscillations and minimizing the ESS energy requirements. This result highlights the need to adjust these parameters according to the specific characteristics of the wave conditions and the electrical grid where the solution is implemented.
Furthermore, the comparison between different forecasting algorithms has confirmed that Bayesian Neural Networks present a better performance than simpler methods, such as persistence models and ARMA. However, the results indicate that there is still room for improvement in the predictive capacity of these algorithms since their optimal performance remains below the perfect prediction scenarios. This suggests that future research should focus on improving the accuracy of forecasting models, exploring hybrid approaches that combine different machine learning techniques to achieve more precise power generation estimations.
Therefore, smoothing the oscillating power generated by wave energy farms (given the oscillating nature of the energy source: waves) reduces the impact of these types of systems on the electric grid. This ultimately improves grid stability and can increase the penetration limits of this renewable energy in electric grids. Furthermore, given the need for these storage systems for large-scale deployment of wave energy, optimizing the sizing of storage systems using control algorithms can be very useful. It should be noted that this approach is inherently scalable and is not limited by the size of the farm. As the number of WEC units increases, the natural cancellation of power oscillations between units can further reduce storage requirements, even without improved forecasting strategies, making the method applicable to larger-scale deployments.
The implementation of these strategies represents an important step towards greater and more efficient grid integration of renewable energies, contributing to the energy transition and the achievement of decarbonization goals.

Author Contributions

Conceptualization, M.B., M.L. and L.M.; methodology, M.B., G.N. and L.M.; software, M.B., G.N. and L.M.; validation, MB., I.V. and J.N.; formal analysis, M.B. and M.L.; investigation, M.B. and J.N.; resources, I.V. and M.L.; data curation, M.B., I.V., J.N. and G.N.; writing—original draft preparation, M.B., I.V. and L.M.; writing—review and editing, M.B., I.V., L.M. and M.L.; visualization, M.B. and G.N.; supervision, M.B. and M.L.; project administration, J.N. and M.B.; funding acquisition, M.L., G.N., J.N. and M.B. All authors have read and agreed to the published version of the manuscript.

Funding

This research, developed under the Projects STORIES (ID: 101036910), has received funding from European Union’s Horizon 2020 research and innovation program under H2020-EU.1.4—EXCELLENT SCIENCE—Research Infrastructures (LC-GD-9-1-2020) and Project HYBRIDHYDRO (TED2021-132794A-C22), which has received funding from MCIN/AEI/10.13039/501100011033 and from the European Union “Next Generation EU”/PRTR.

Data Availability Statement

The data presented in this study are available on request from the corresponding author.

Conflicts of Interest

The authors declare no conflicts of interest.

Appendix A

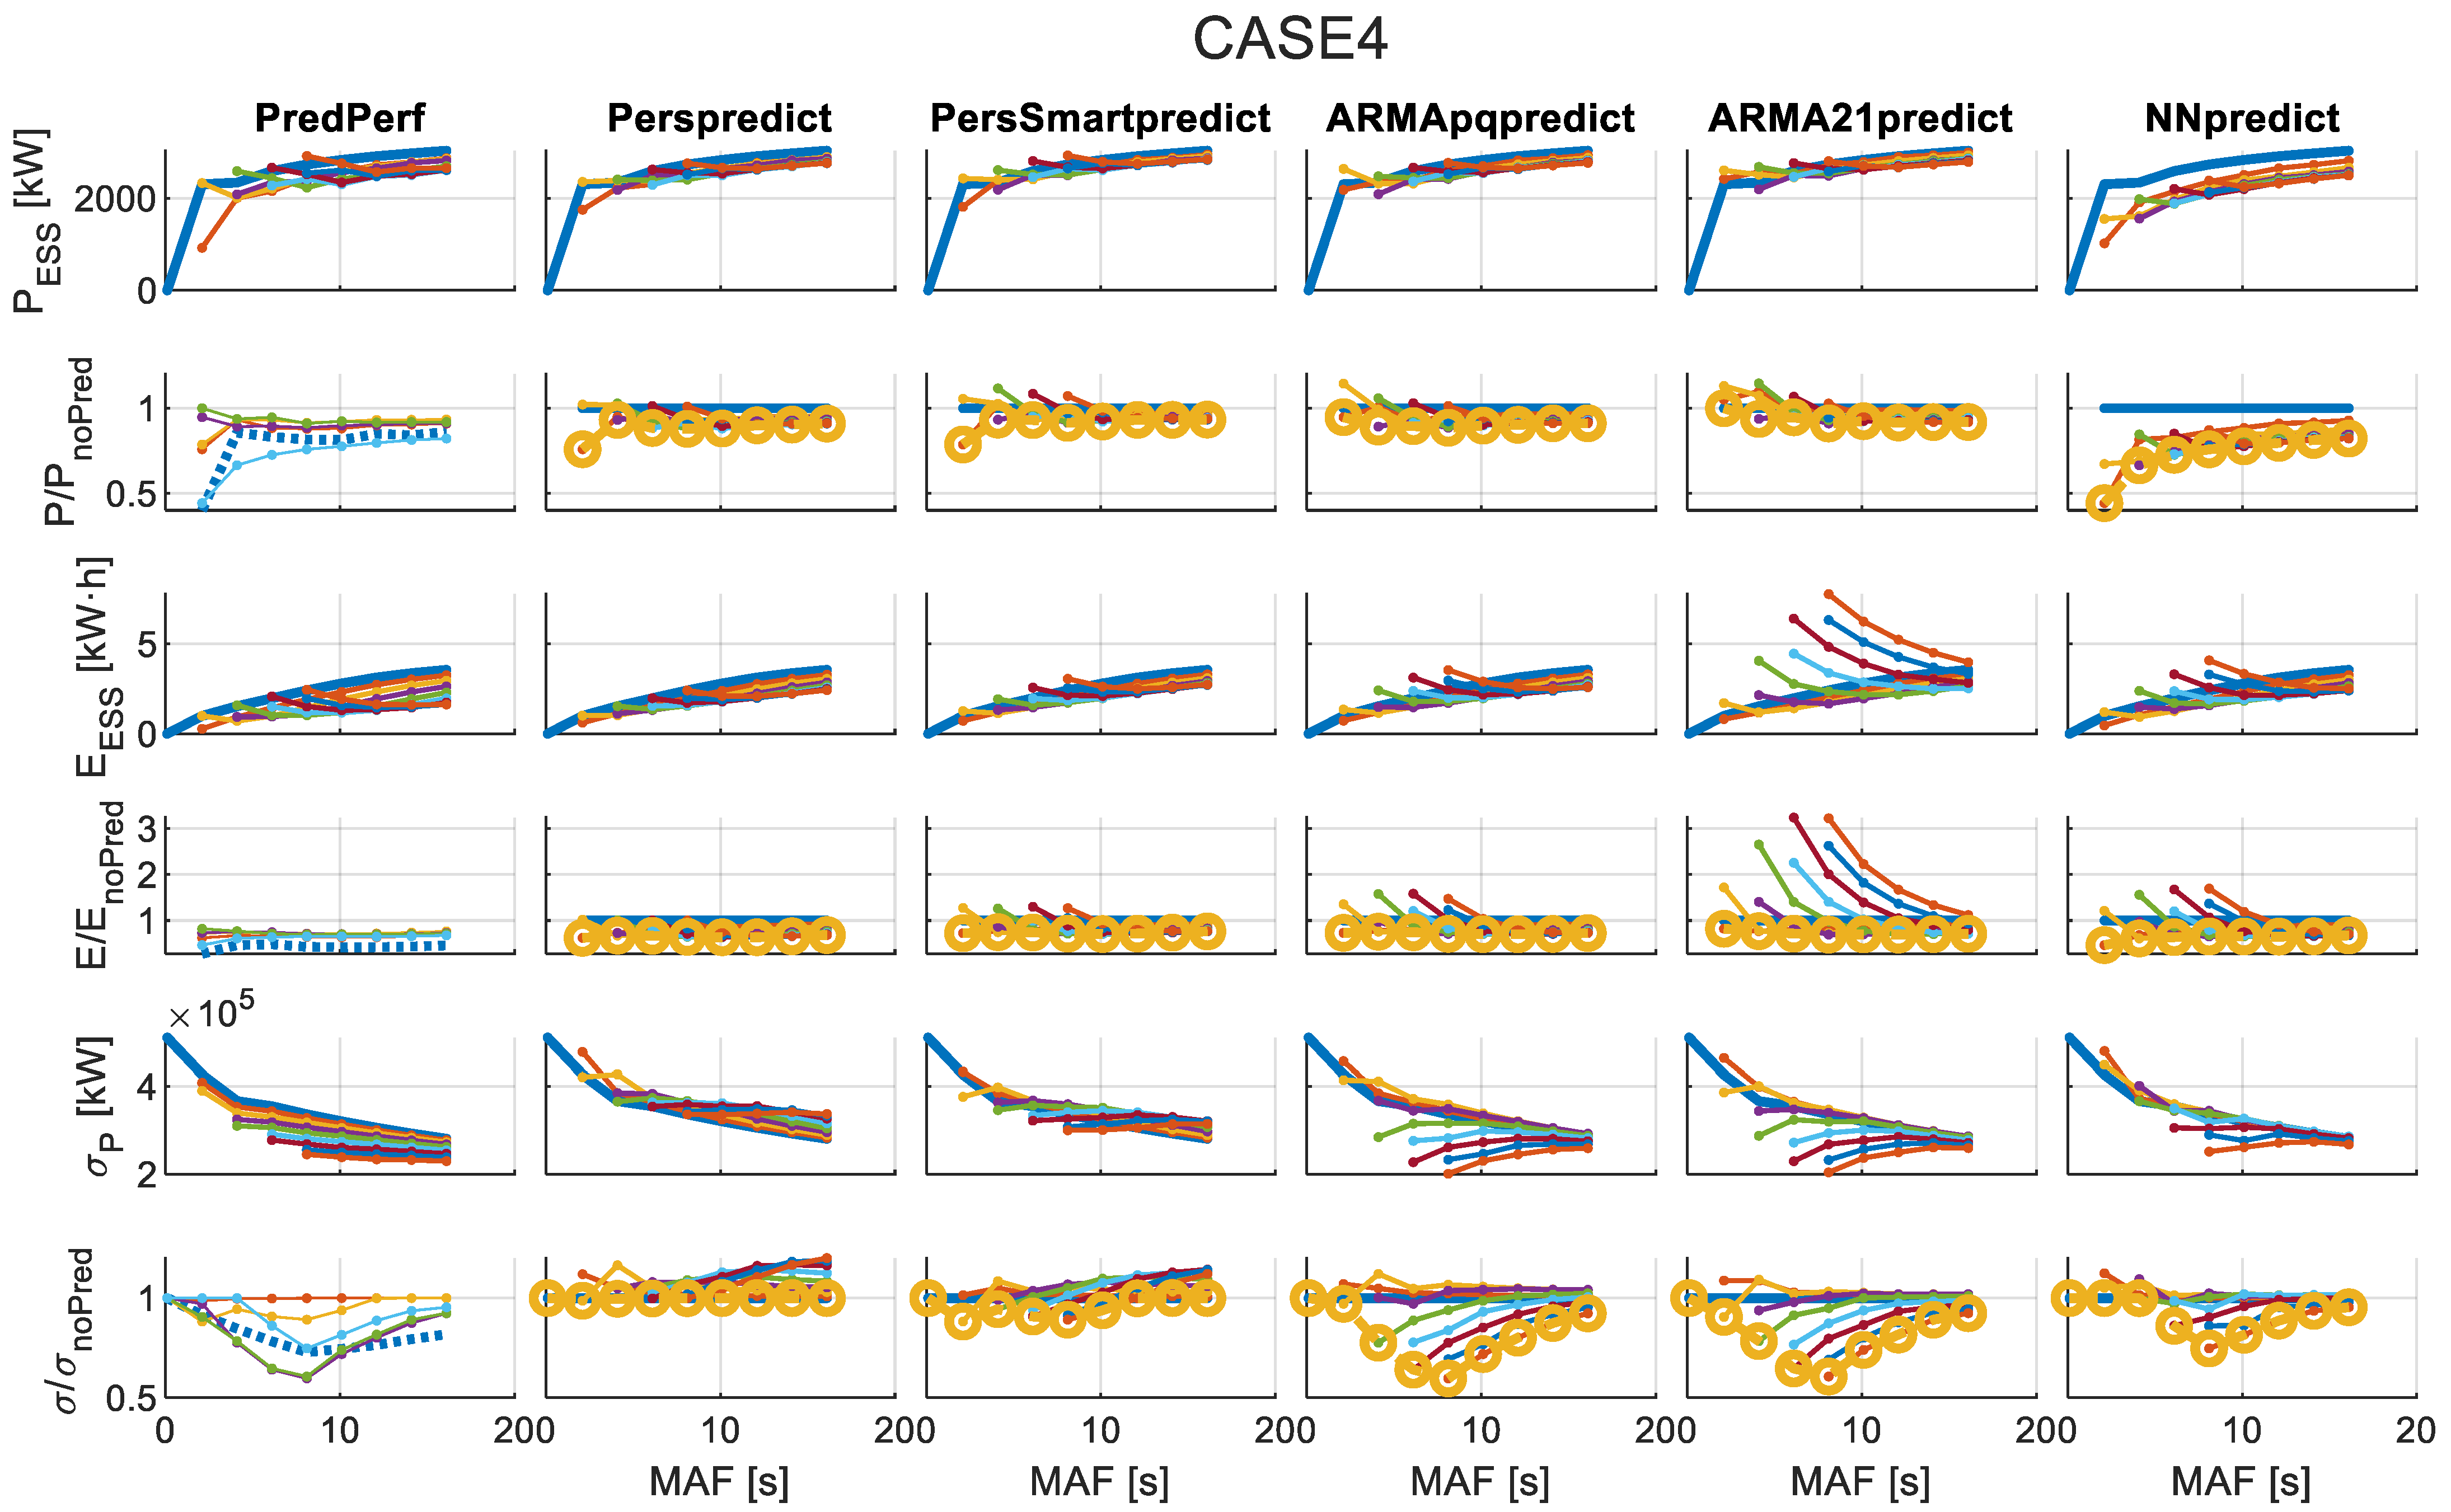
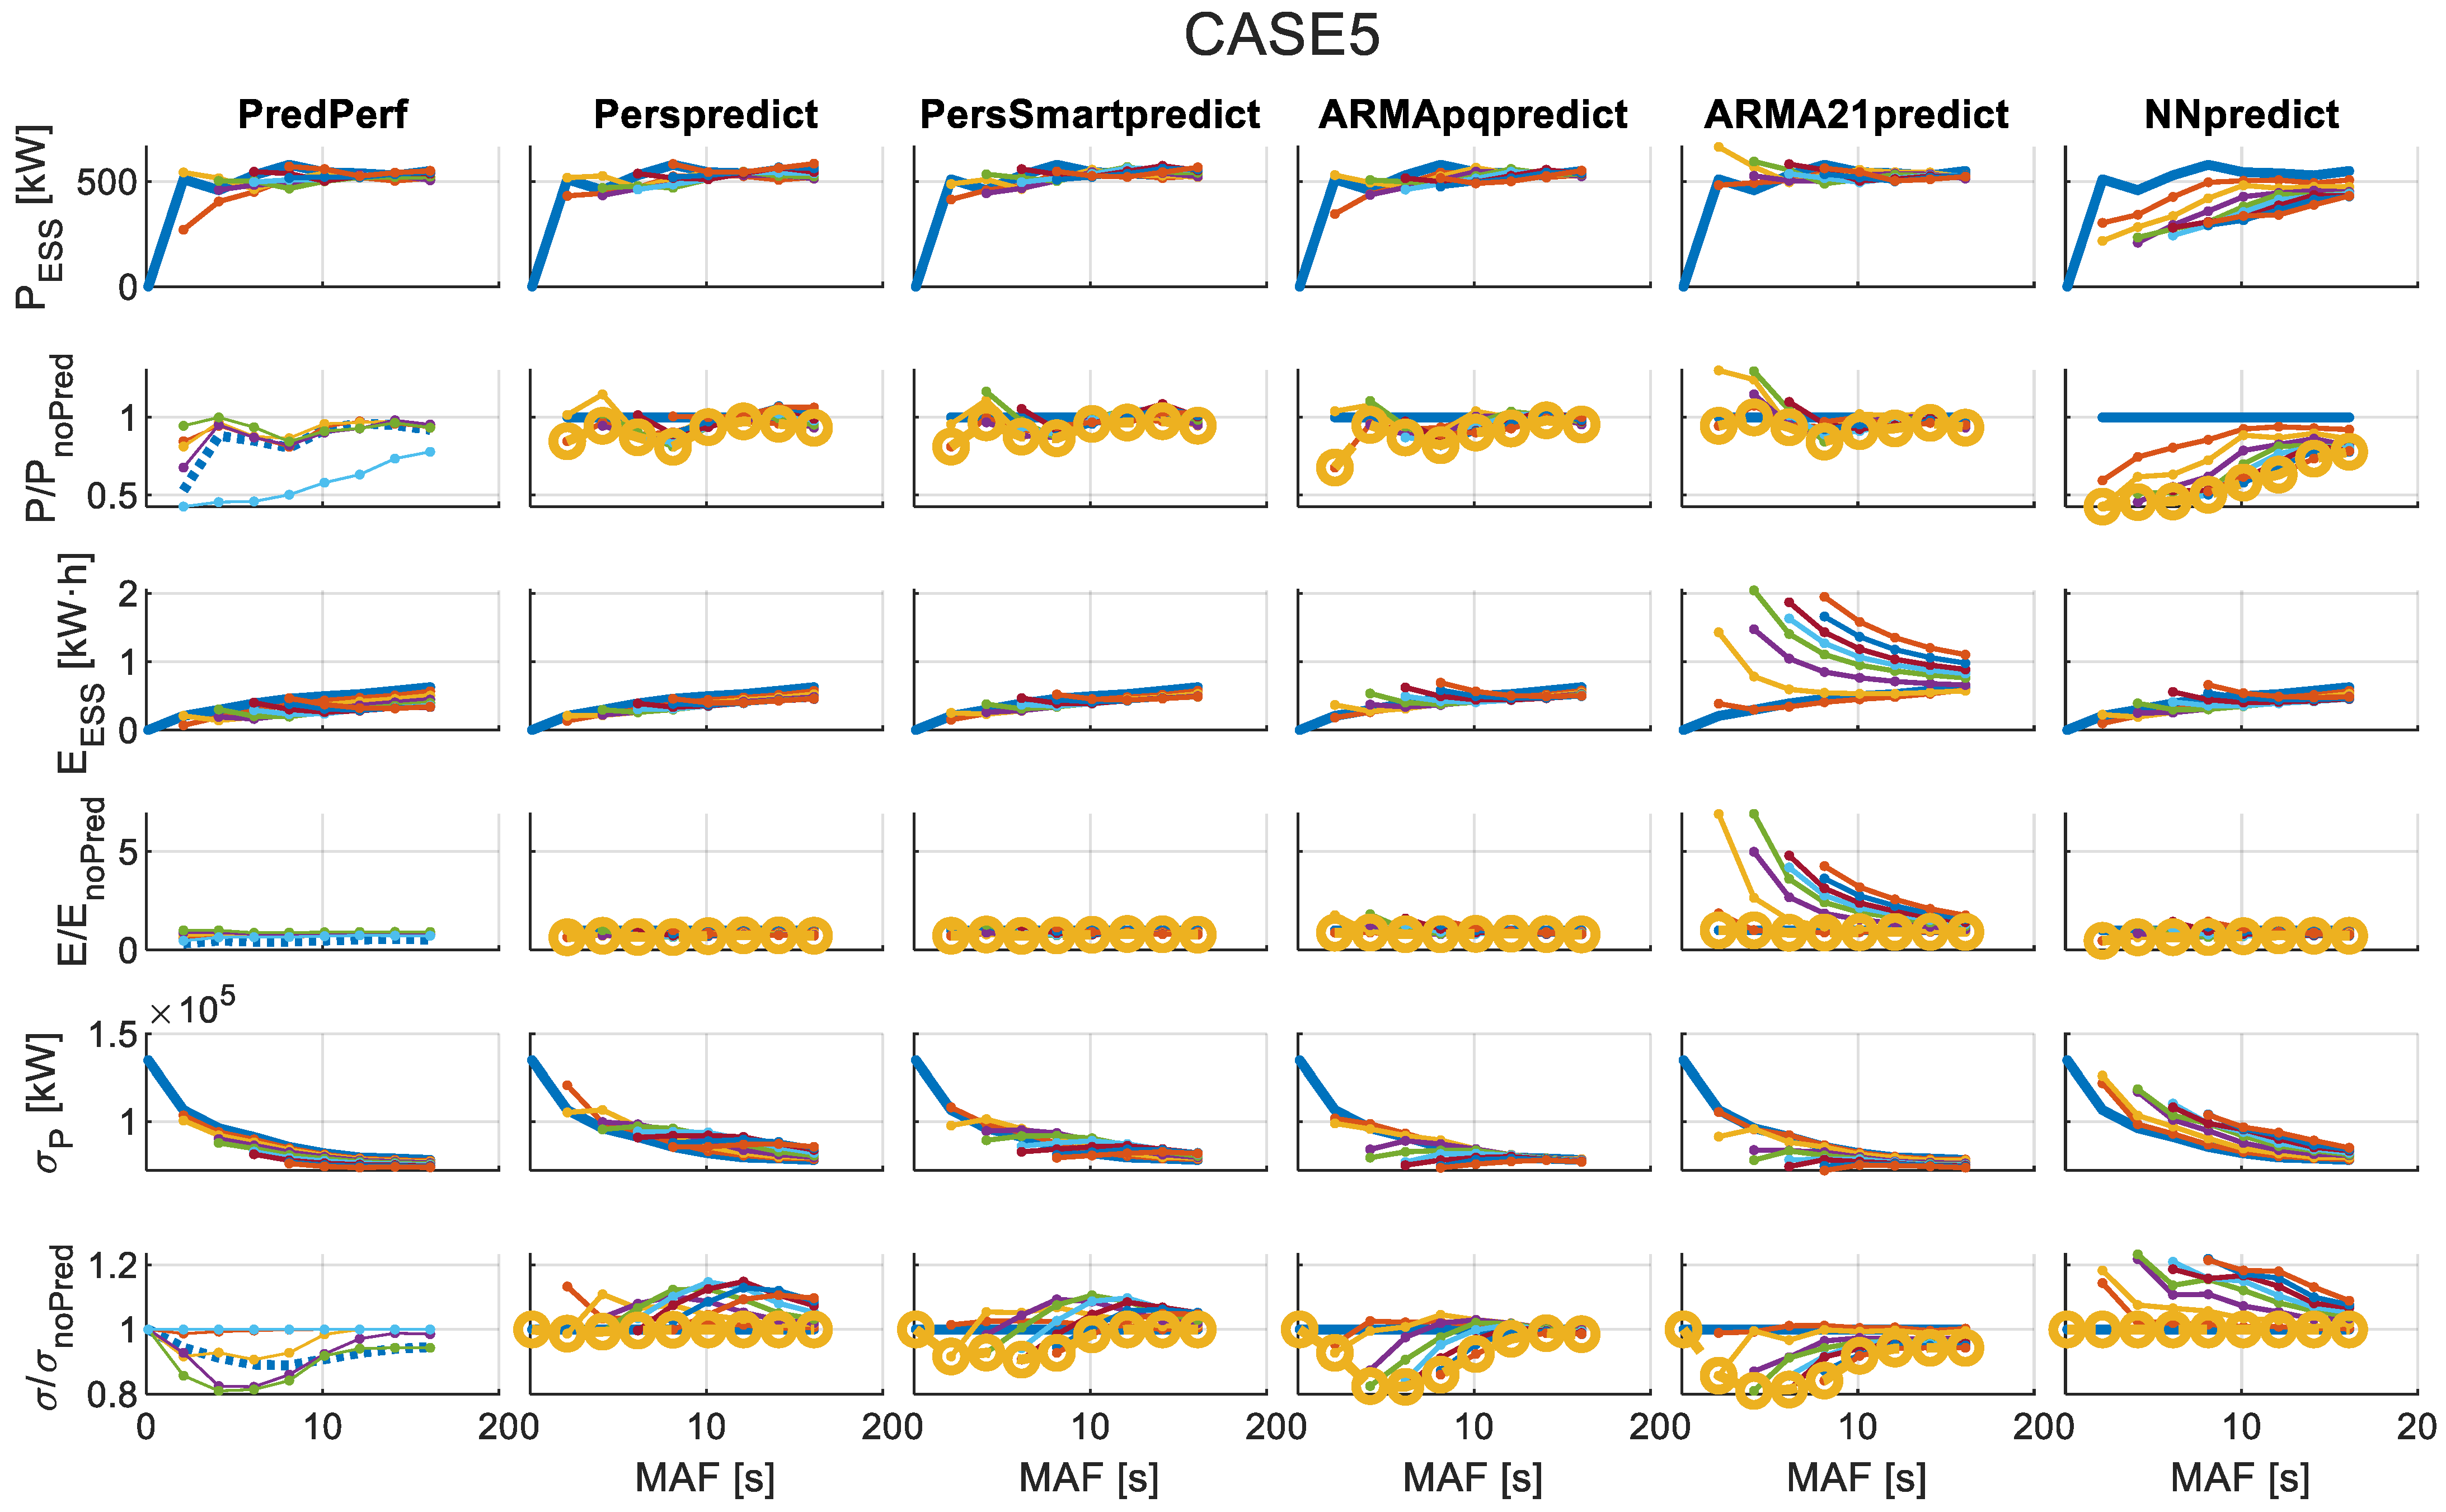
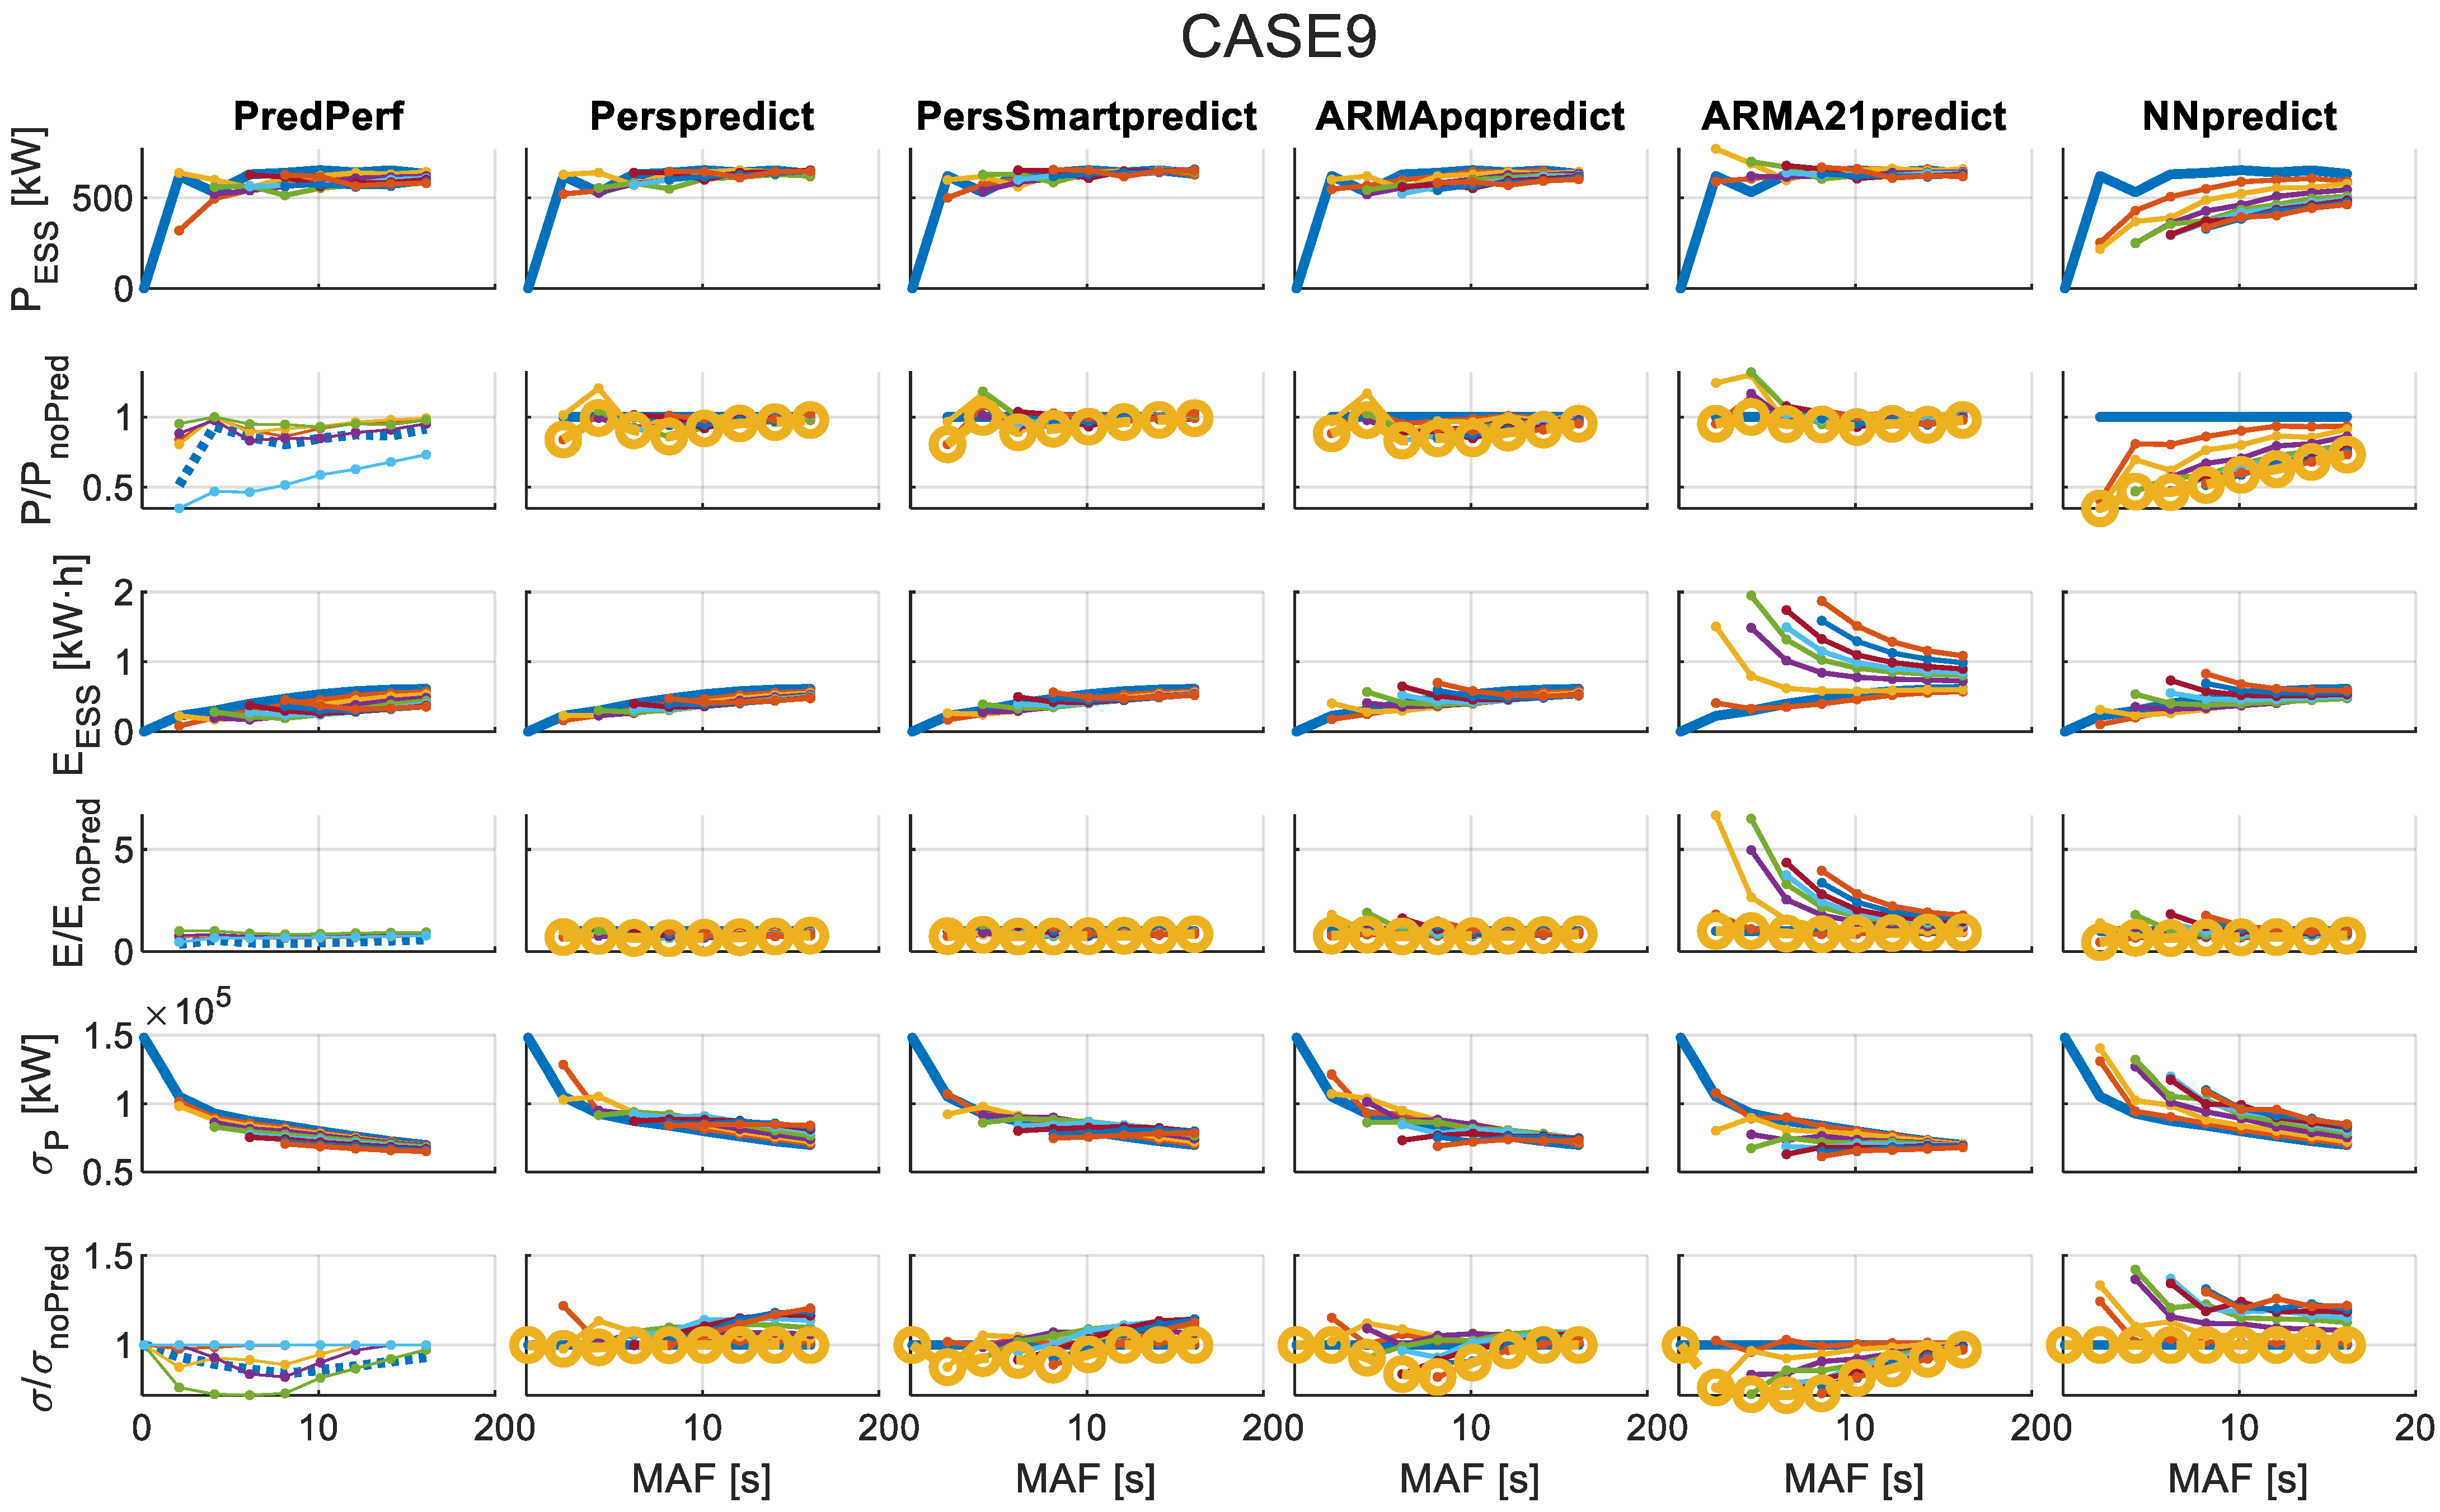
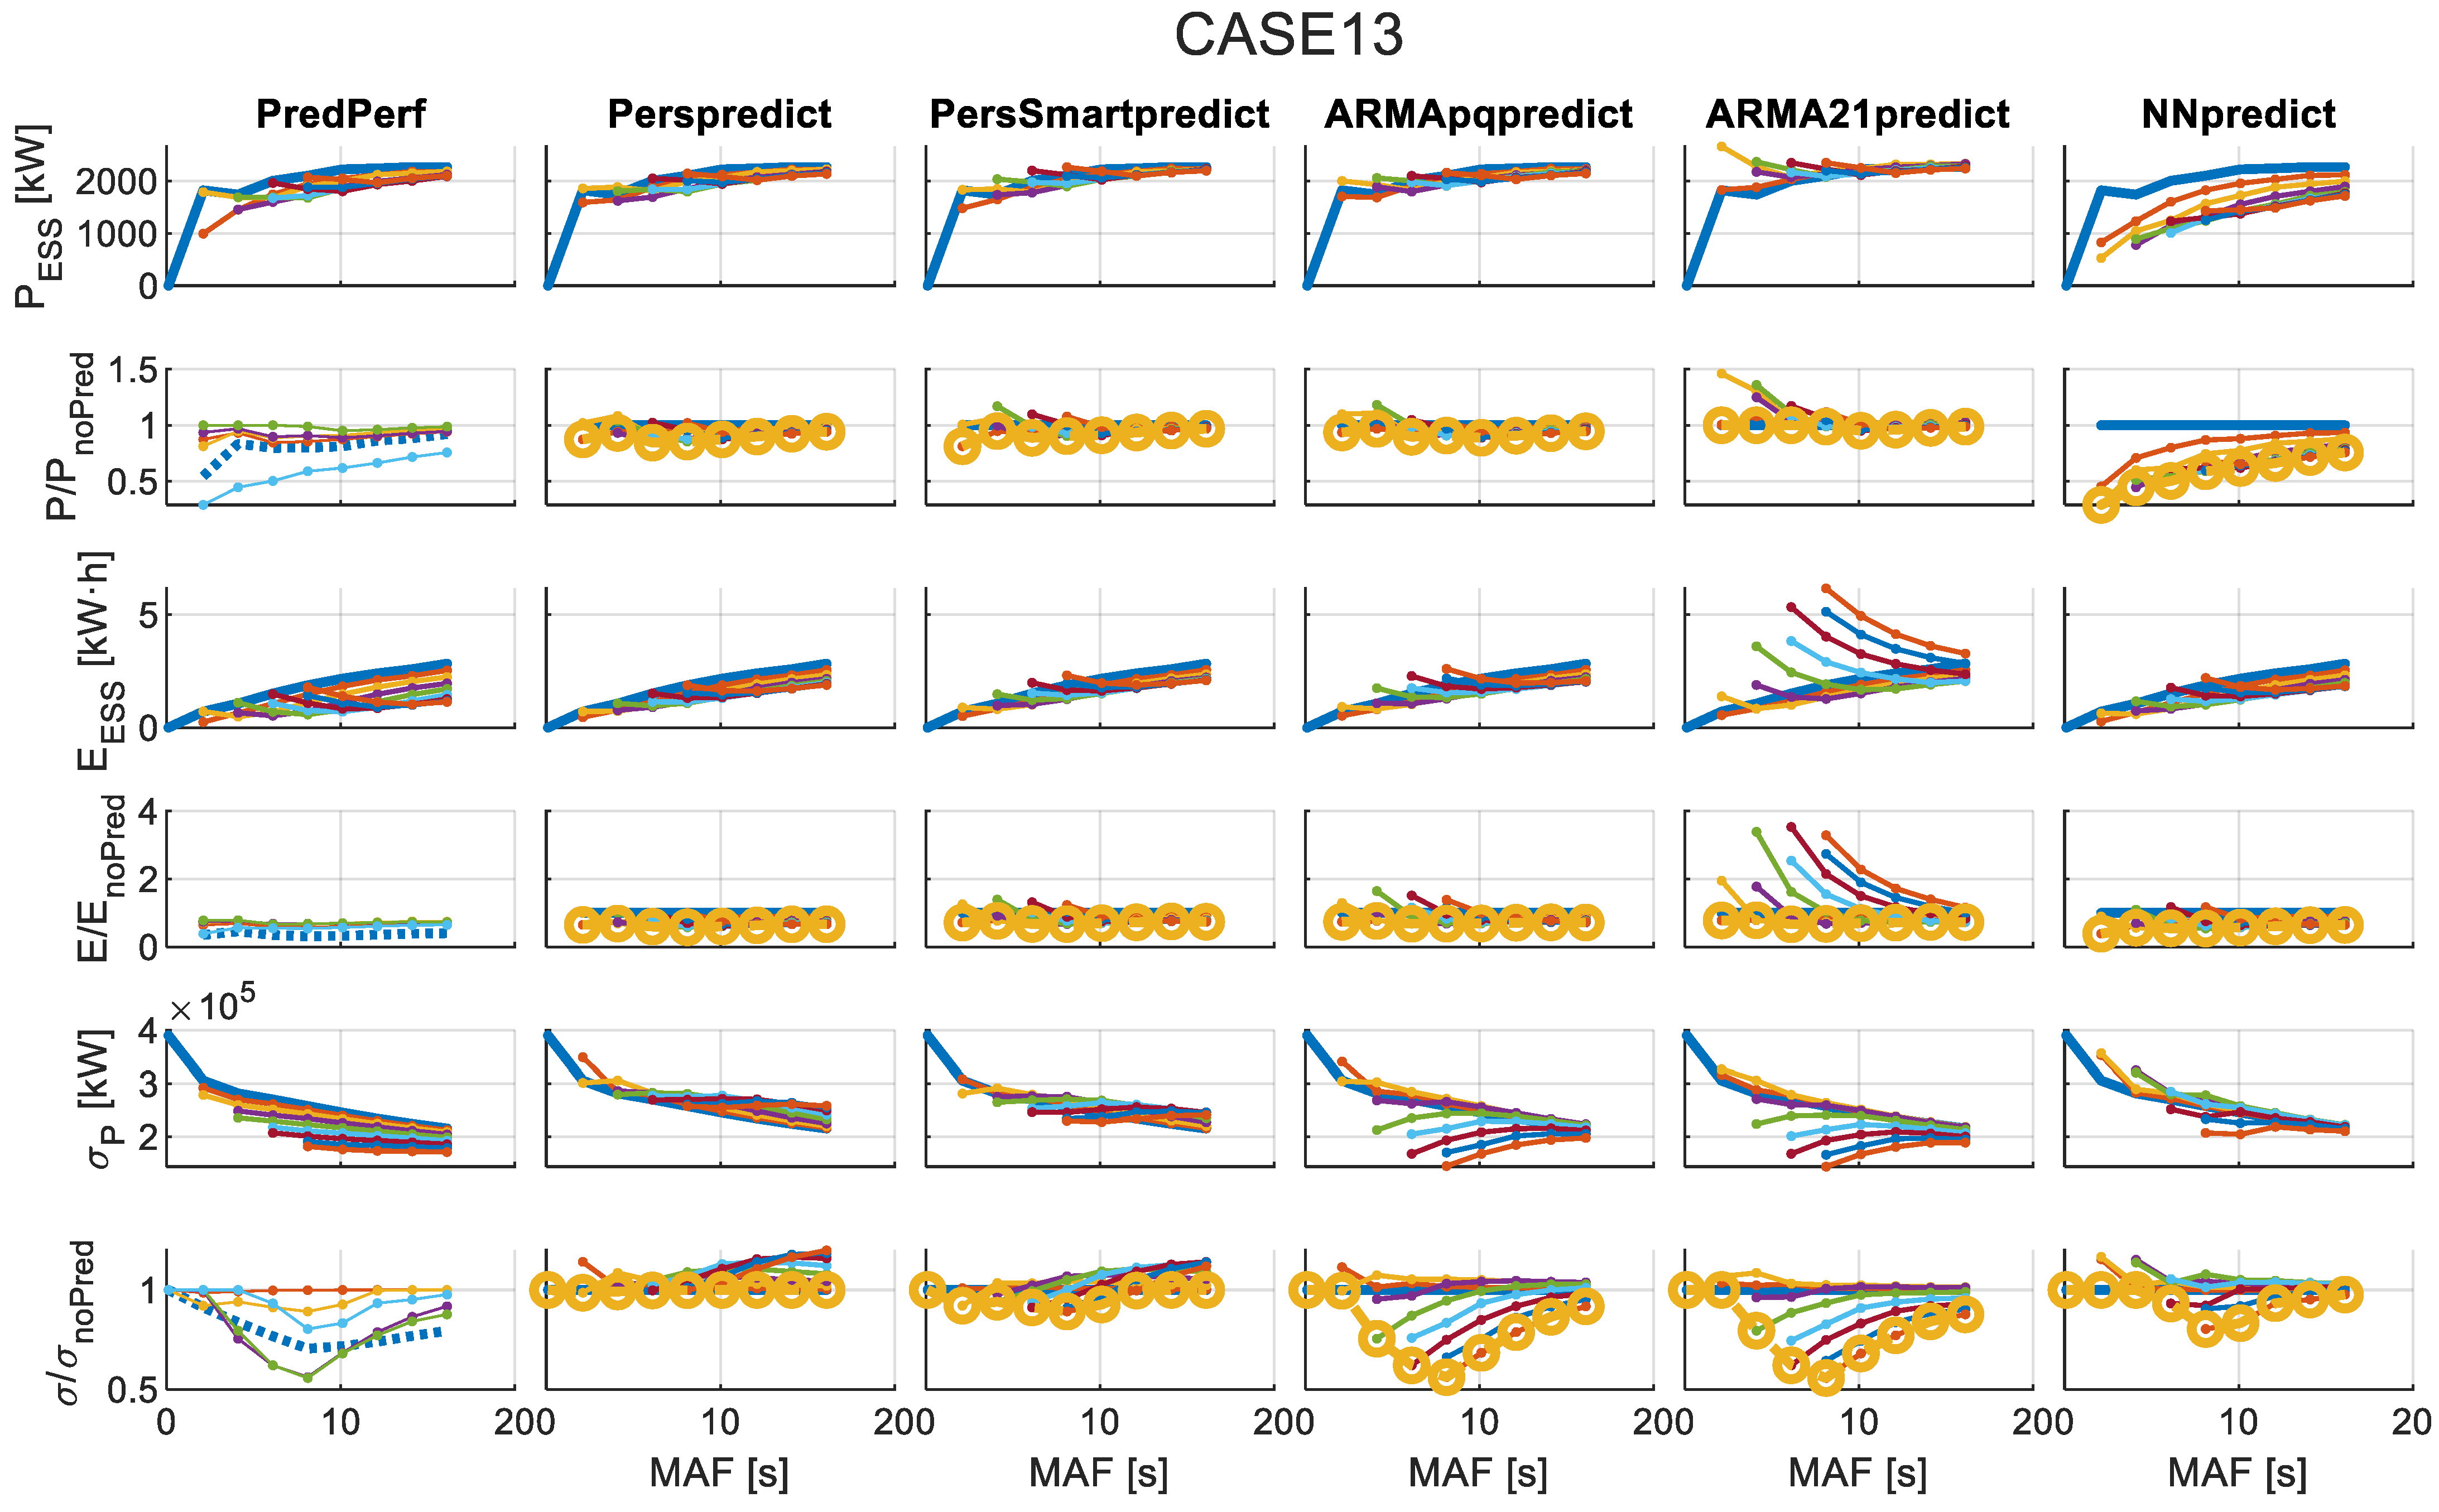
Results for the 16 representative wave cases (see Table 1), 6 forecasting algorithms (including perfect forecasting), 31 total window sizes of the MAF filter (including the case without MAF), and 9 window sizes with predicted values (including the case without predicted values), resulting in a total of 26,784 cases to analyze.
The variables used for the analysis are as follows:
  • Required power in the ESS ( P r a t e d )—Equation (3).
  • Required energy in the ESS ( E r a t e d )—Equation (4).
  • Standard deviation of the power injected into the electrical grid after filtering through MAF and ESS (σp)—Equation (14).
  • Ratio of required power in the ESS relative to the case without forecasting.
  • Ratio of required energy in the ESS is relative to the case without forecasting.
  • Ratio of the standard deviation of injected power relative to the case without forecasting.
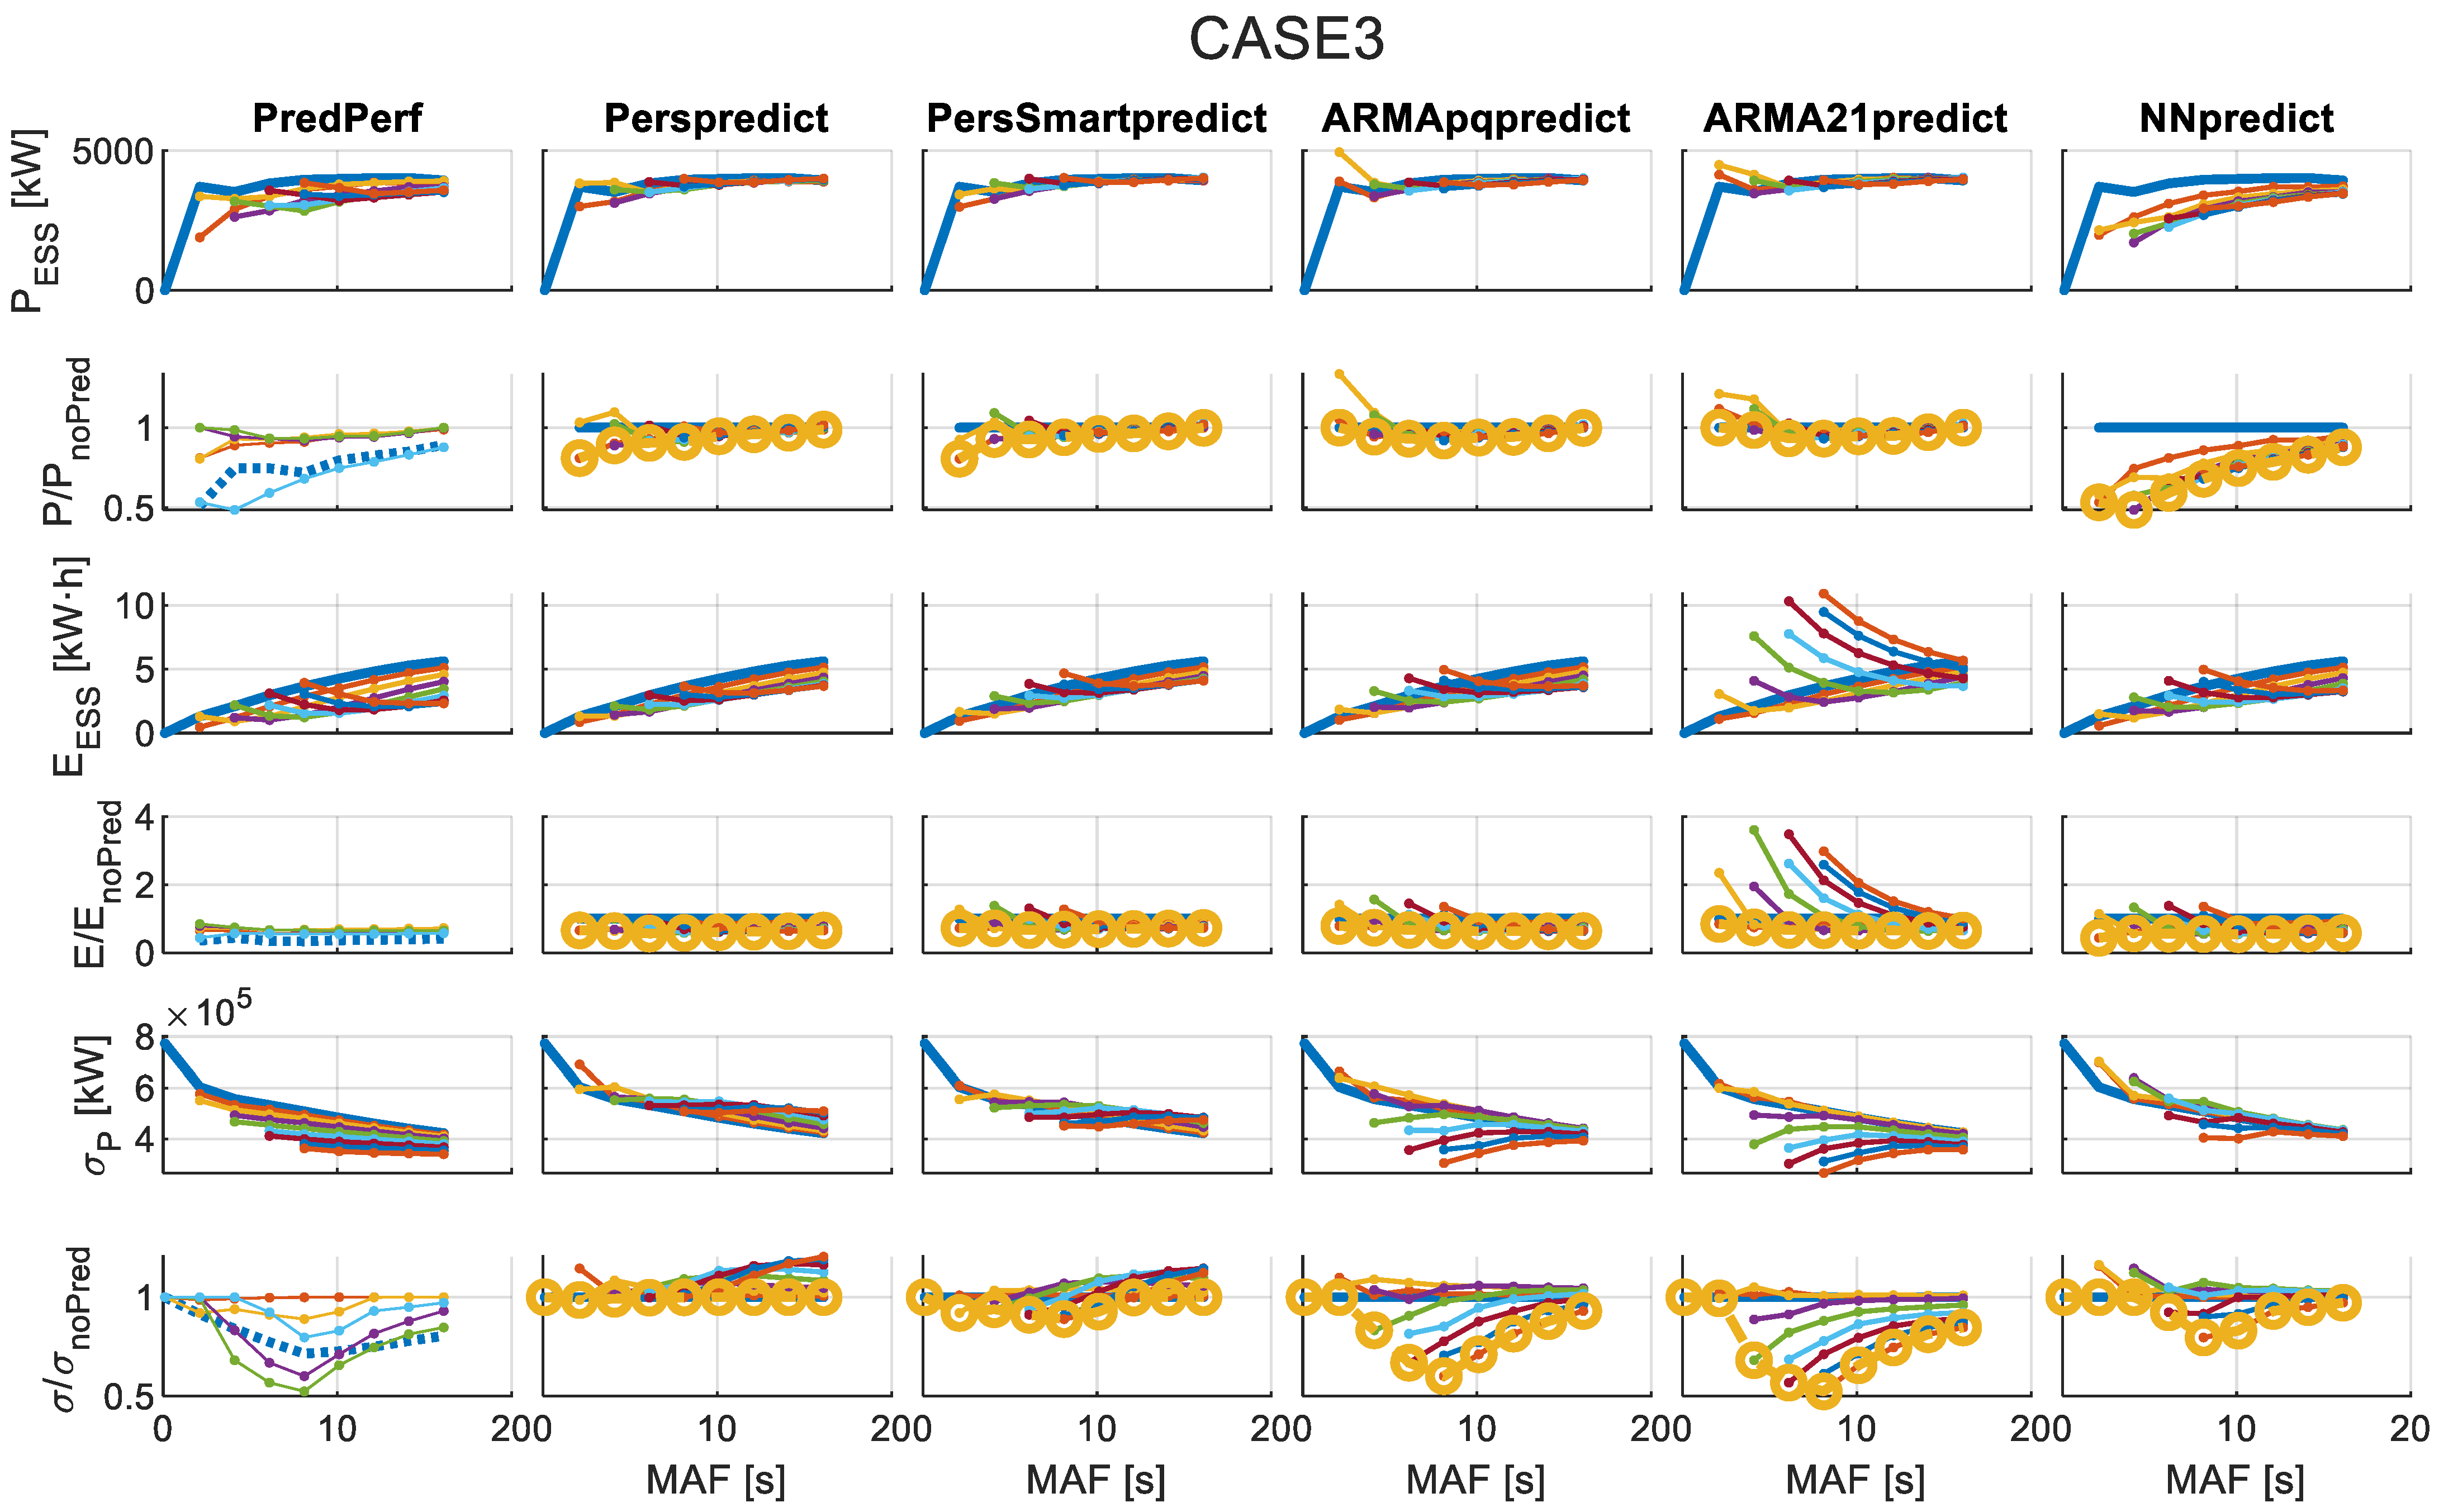
The results of each of the 16 cases are presented in a set of different graphs. Each set of graphs shows each of the 6 variables to be analyzed. These figures also display the best combination between predicted values and window size, aiming to minimize the amount of storage.
Figure A1. Results for CASE 1 with different MAFs and forecast algorithms.
Applsci 15 11106 g0a1
Figure A2. Results for CASE 2 with different MAFs and forecast algorithms.
Applsci 15 11106 g0a2
Figure A3. Results for CASE 3 with different MAFs and forecast algorithms.
Applsci 15 11106 g0a3
Figure A4. Results for CASE 4 with different MAFs and forecast algorithms.
Applsci 15 11106 g0a4
Figure A5. Results for CASE 5 with different MAFs and forecast algorithms.
Applsci 15 11106 g0a5
Figure A6. Results for CASE 6 with different MAFs and forecast algorithms.
Applsci 15 11106 g0a6
Figure A7. Results for CASE 7 with different MAFs and forecast algorithms.
Applsci 15 11106 g0a7
Figure A8. Results for CASE 8 with different MAFs and forecast algorithms.
Applsci 15 11106 g0a8
Figure A9. Results for CASE 9 with different MAFs and forecast algorithms.
Applsci 15 11106 g0a9
Figure A10. Results for CASE 10 with different MAFs and forecast algorithms.
Applsci 15 11106 g0a10
Figure A11. Results for CASE 11 with different MAFs and forecast algorithms.
Applsci 15 11106 g0a11
Figure A12. Results for CASE 12 with different MAFs and forecast algorithms.
Applsci 15 11106 g0a12
Figure A13. Results for CASE 13 with different MAFs and forecast algorithms.
Applsci 15 11106 g0a13
Figure A14. Results for CASE 14 with different MAFs and forecast algorithms.
Applsci 15 11106 g0a14
Figure A15. Results for CASE 15 with different MAFs and forecast algorithms.
Applsci 15 11106 g0a15
Figure A16. Results for CASE 16 with different MAFs and forecast algorithms.
Applsci 15 11106 g0a16

References

  1. Gunn, K.; Stock-Williams, C. Quantifying the Global Wave Power Resource. Renew. Energy 2012, 44, 296–304. [Google Scholar] [CrossRef]
  2. Europea, C.; de Asuntos Marítimos y Pesca, D.G.; Borriello, A.; Calvo Santos, A.; Feyen, L.; Ghiani, M.; Guillén, J.; McGovern, L.; Petrucco, G.; Pistocchi, A.; et al. The EU Blue Economy Report 2025; Oficina de Publicaciones de la Unión Europea: Luxembourg, 2025. [Google Scholar]
  3. Apolonia, M.; Fofack-Garcia, R.; Noble, D.R.; Hodges, J.; da Fonseca, F.X. Legal and Political Barriers and Enablers to the Deployment of Marine Renewable Energy. Energies 2021, 14, 4896. [Google Scholar] [CrossRef]
  4. Astariz, S.; Iglesias, G. The Economics of Wave Energy: A Review. Renew. Sustain. Energy Rev. 2015, 45, 397–408. [Google Scholar] [CrossRef]
  5. Magagna, D. Ocean Energy Technology Development Report; European Commission JRC: Brussels, Belgium, 2019. [Google Scholar]
  6. Magagna, D. Ocean Energy Technology Market Report; European Commission JRC: Brussels, Belgium, 2019. [Google Scholar]
  7. Mi, J.; Wu, X.; Capper, J.; Li, X.; Shalaby, A.; Wang, R.; Lin, S.; Hajj, M.; Zuo, L. Experimental Investigation of a Reverse Osmosis Desalination System Directly Powered by Wave Energy. Appl. Energy 2023, 343, 121194. [Google Scholar] [CrossRef]
  8. Chakravarthi, T.V.S.K.; Chaudhuri, A.; Samad, A. Wave Powered Desalination Systems—Recent Developments. In Proceedings of the IEEE 2024 International Conference on Sustainable Energy: Energy Transition and Net-Zero Climate Future (ICUE), Pattaya City, Thailand, 21–23 October 2024; pp. 1–7. [Google Scholar]
  9. Hasan, I.; Karayaka, H.B.; Kandil, T.; Yu, Y.-H. Analysis of Ocean Wave Energy-Driven Desalination Methods for Sustainable Water Production. In Proceedings of the 2025 IEEE Green Technologies Conference (GreenTech), Wichita, KS, USA, 26–28 March 2025; pp. 26–30. [Google Scholar]
  10. Ocean Energy TWG. SET-Plan Ocean Energy Implementation Plan; European Commission: Brussels, Belgium, 2018. [Google Scholar]
  11. Ruiz-Minguela, P.; Berque, J.; Villate, J.L.; Pirttimaa, L.; Gruet, R.; Noble, D.; Jeffrey, H. Strategic Research and Innovation Agenda for Ocean Energy; ETIP Ocean: Brussels, Belgium, 2024. [Google Scholar]
  12. Tedeschi, E.; Molinas, M. Wave-to-Wave Buoys Control for Improved Power Extraction under Electro-Mechanical Constraints. In Proceedings of the 2010 IEEE International Conference on Sustainable Energy Technologies (ICSET), Kandy, Sri Lanka, 6–9 December 2010; pp. 1–6. [Google Scholar]
  13. Salter, S.H.; Taylor, J.R.M.; Caldwell, N.J. Power Conversion Mechanisms for Wave Energy. Proc. Inst. Mech. Eng. Part M J. Eng. Marit. Environ. 2002, 216, 1–27. [Google Scholar] [CrossRef]
  14. Falnes, J. Ocean Waves and Oscillating Systems, Linear Interactions Including Wave-Energy Extraction; Cambridge University Press: Cambridge, UK, 2002; ISBN 9780511754630. [Google Scholar]
  15. Blanco, M.; Navarro, G.; Najera, J.; Lafoz, M.; Sarasua, J.I.; García, H.; Martínez-Lucas, G.; Pérez-Díaz, J.I.; Villalba, I. Wave Farms Integration in a 100% Renewable Isolated Small Power System—Frequency Stability and Grid Compliance Analysis. In Proceedings of the 15th European Wave and Tidal Energy Conference, Bilbao, Spain, 3–7 September 2023; Volume 15. [Google Scholar] [CrossRef]
  16. Göteman, M.; Engström, J.; Eriksson, M.; Isberg, J. Optimizing Wave Energy Parks with over 1000 Interacting Point-Absorbers Using an Approximate Analytical Method. Int. J. Mar. Energy 2015, 10, 113–126. [Google Scholar] [CrossRef]
  17. Blavette, A.; O’Sullivan, D.L.; Lewis, A.W.; Egan, M.G. Impact of a Wave Farm on Its Local Grid: Voltage Limits, Flicker Level and Power Fluctuations. In Proceedings of the 2012 OCEANS—Yeosu, Yeosu, Republic of Korea, 21–24 May 2012; pp. 1–9. [Google Scholar]
  18. ENTSO-E. Continental Europe Operation Handbook; ENTSO-E: Brussels, Belgium, 2009. [Google Scholar]
  19. ENTSO-E. Network Code on Load-Frequency Control and Reserves; ENTSO-E: Brussels, Belgium, 2013; Volume 6. [Google Scholar]
  20. Robles, E.; Haro-Larrode, M.; Santos-Mugica, M.; Etxegarai, A.; Tedeschi, E. Comparative Analysis of European Grid Codes Relevant to Offshore Renewable Energy Installations. Renew. Sustain. Energy Rev. 2019, 102, 171–185. [Google Scholar] [CrossRef]
  21. Grainger, J.J.; Stevenson, W.D. Power System Analysis; McGraw-Hill: New York, NY, USA, 1994; ISBN 0070612935. [Google Scholar]
  22. LiVecchi, A.; Copping, A.; Jenne, D.; Gorton, A.; Preus, R.; Gill, G.; Robichaud, R.; Green, R.; Geerlofs, S.; Gore, S.; et al. Exploring Opportunities for Marine Renewable Energy in Maritime Markets; U.S. Department of Energy (DOE): Washington, DC, USA, 2019. [Google Scholar]
  23. Villalba, I.; Blanco, M.; Pérez-Díaz, J.I.; Fernández, D.; Díaz, F.; Lafoz, M. Wave Farms Grid Code Compliance in Isolated Small Power Systems. IET Renew. Power Gener. 2019, 13, 171–179. [Google Scholar] [CrossRef]
  24. Sarasua, J.I.; Martínez-Lucas, G.; García-Pereira, H.; Navarro-Soriano, G.; Molina-García, Á.; Fernández-Guillamón, A. Hybrid Frequency Control Strategies Based on Hydro-power, Wind, and Energy Storage Systems: Application to 100% Renewable Scenarios. IET Renew. Power Gener. 2022, 16, 1107–1120. [Google Scholar] [CrossRef]
  25. Pelosi, D.; Gallorini, F.; Alessandri, G.; Barelli, L. A Hybrid Energy Storage System Integrated with a Wave Energy Converter: Data-Driven Stochastic Power Management for Output Power Smoothing. Energies 2024, 17, 1167. [Google Scholar] [CrossRef]
  26. Bielewski, M.; Pfrang, A.; Bobba, S.; Kronberga, A.; Georgakaki, A.; Letout, S.; Kuokkanen, A.; Mountraki, A.; Ela, I.; Shtjefni, D.; et al. Clean Energy Technology Observatory: Batteries for Energy Storage in the European Union—2022 Status Report on Technology Development, Trends, Value Chains and Markets; Publications Office of the European Union: Brussels, Belgium, 2022. [Google Scholar]
  27. European Commision Com(2020) 798/3 Final—Regulation of the European Parliament and of the Council Concerning Batteries and Waste Batteries, Repealing Directive 2006/66/EC and Amending Regulation (EU) No 2019/1020. 2020. Available online: https://eur-lex.europa.eu/legal-content/EN/TXT/?uri=CELEX%3A52020PC0798 (accessed on 1 September 2025).
  28. Lafoz, M.; Blanco, M.; Beloqui, L.; Navarro, G.; Moreno-Torres, P. Dimensioning Methodology for Energy Storage Devices and Wave Energy Converters Supplying Isolated Loads. IET Renew. Power Gener. 2016, 10, 1468–1476. [Google Scholar] [CrossRef]
  29. Moreno-Torres Concha, P.; Lafoz Pastor, M.; Navarro Soriano, G.; Blanco Aguado, M.; García-Tabarés Rodríguez, L. System for the Conditioning of the Electrical Power Generated in a Wave Generation System. Spanish Patent ES2547029A1, 8 July 2015. [Google Scholar]
  30. Murray, D.B.; Hayes, J.G.; O’Sullivan, D.L.; Egan, M.G. Supercapacitor Testing for Power Smoothing in a Variable Speed Offshore Wave Energy Converter. IEEE J. Ocean. Eng. 2012, 37, 301–308. [Google Scholar] [CrossRef]
  31. Elamin, A.Y.; Wahyudie, A. Optimal Control of a Supercapacitor Energy Storage System for Smoothing Wave Output Power. In Proceedings of the IEEE 2022 International Conference on Electrical and Computing Technologies and Applications (ICECTA), Ras al-Khaimah, United Arab Emirates, 23–25 November 2022; pp. 186–189. [Google Scholar]
  32. Torres, J.; Blanco, M.; Lafoz, M.; Navarro, G.; Nájera, J.; Santos-Herran, M. Dimensioning Methodology of Energy Storage Systems for Power Smoothing in a Wave Energy Conversion Plant Considering Efficiency Maps and Filtering Control Techniques. Energies 2020, 13, 3380. [Google Scholar] [CrossRef]
  33. Basheer, Y.; Pérez-Díaz, J.I.; Blanco, M.; Fraile-Ardanuy, J.; Nájera, J.; Navarro, G.; Sarasúa, J.I. Active Power Control of a Hybrid Power Plant Comprising Hydropower, Battery and Supercapacitor to Provide Frequency Control. In Proceedings of the 9th Hybrid Power Plants & Systems Workshop, Åland Islands, Finland, 3–4 June 2025. [Google Scholar]
  34. Szostek, K.; Mazur, D.; Drałus, G.; Kusznier, J. Analysis of the Effectiveness of ARIMA, SARIMA, and SVR Models in Time Series Forecasting: A Case Study of Wind Farm Energy Production. Energies 2024, 17, 4803. [Google Scholar] [CrossRef]
  35. Bahri, M.; Vahidnia, S.; Ghignone, L.; Mohtashamkhani, M. Wind Speed Prediction Using a SEEMD-LSTM Model. In Proceedings of the IEEE 2023 International Conference on Engineering and Emerging Technologies (ICEET), Istanbul, Turkiye, 27–28 October 2023; pp. 1–6. [Google Scholar]
  36. Fusco, F.; Ringwood, J.V. A Study of the Prediction Requirements in Real-Time Control of Wave Energy Converters. Sustain. Energy IEEE Trans. 2012, 3, 176–184. [Google Scholar] [CrossRef]
  37. Kaiser, M.S.; Iida, T.; Taniguchi, T.; Katayama, T.; Yoshimura, R.; Irifune, K. Optimal Prediction Horizon Length in Model Predictive Control to Maximise Energy Absorption by a Point Absorber Wave Energy Converter. Ocean Eng. 2025, 329, 121130. [Google Scholar] [CrossRef]
  38. Li, D.; Wang, T.; Tao, J.; Sharma, S.; Borthwick, A.G.L.; Dong, X.; Shi, H. Model Predictive Control of a Single-Buoy Wave Energy Converter with Coupled Constraints and Model Adaptation. Ocean Eng. 2025, 315, 119887. [Google Scholar] [CrossRef]
  39. Wang, J.; Zhang, D.; Huang, Q.; Cui, Z. Multiple-Step Accurate Prediction of Wave Energy: A Hybrid Model Based on Quadratic Decomposition, SSA and LSTM. Int. J. Green Energy 2025, 22, 100–123. [Google Scholar] [CrossRef]
  40. Zhang, Y.; Liu, S.; Shen, Q.; Zhang, L.; Li, Y.; Hou, Z.; Chen, R. Short-Term Prediction Model of Wave Energy Converter Generation Power Based on CNN-BiLSTM-DELA Integration. Electronics 2024, 13, 4163. [Google Scholar] [CrossRef]
  41. Elkhrachy, I.; Alhamami, A.; Alyami, S.H.; Alviz-Meza, A. Novel Ocean Wave Height and Energy Spectrum Forecasting Approaches: An Application of Semi-Analytical and Machine Learning Models. Water 2023, 15, 3254. [Google Scholar] [CrossRef]
  42. Teixeira, R.; Cerveira, A.; Pires, E.J.S.; Baptista, J. Advancing Renewable Energy Forecasting: A Comprehensive Review of Renewable Energy Forecasting Methods. Energies 2024, 17, 3480. [Google Scholar] [CrossRef]
  43. Sengupta, M.; Habte, A.; Wilbert, S.; Gueymard, C.; Remund, J.; Lorenz, E.; van Sark, W.; Jensen, A.R. Best Practices Handbook for the Collection and Use of Solar Resource Data for Solar Energy Applications, 4th ed.; NREL: Golden, CO, USA, 2024. [Google Scholar]
  44. Raj, N.; Prakash, R. Assessment and Prediction of Significant Wave Height Using Hybrid CNN-BiLSTM Deep Learning Model for Sustainable Wave Energy in Australia. Sustain. Horiz. 2024, 11, 100098. [Google Scholar] [CrossRef]
  45. Demonte Gonzalez, T.; Anderlini, E.; Yassin, H.; Parker, G. Nonlinear Model Predictive Control of Heaving Wave Energy Converter with Nonlinear Froude–Krylov Forces. Energies 2024, 17, 5112. [Google Scholar] [CrossRef]
  46. Elamin, A.Y.; Wahyudie, A.; Hashfi, T.B.; Shareef, H.; Errouissi, R.; Laghari, M.S.; Mubin, M.B.; Mekhilef, S. Real-Time Model Predictive Control Framework for a Point Absorber Wave Energy Converter with Excitation Force Estimation and Prediction. IEEE Access 2024, 12, 4078–4098. [Google Scholar] [CrossRef]
  47. Zhang, M.; Yu, S.-R.; Zhao, G.-W.; Dai, S.-S.; He, F.; Yuan, Z.-M. Model Predictive Control of Wave Energy Converters. Ocean Eng. 2024, 301, 117430. [Google Scholar] [CrossRef]
  48. Guo, R.; Wu, Y.; Ma, X.; Aggidis, G.; Zhao, N. Grid Integration of a Novel Linear-Generator-Based Wave Power Conversion System. In Proceedings of the 2024 International Conference on Smart Energy Systems and Technologies (SEST), Torino, Italy, 10–12 September 2024; pp. 1–6. [Google Scholar]
  49. Pelosi, D.; Trombetti, L.; Piccio, A.; Ottaviano, P.A.; Gallorini, F.; Barelli, L. Seawater Batteries as Sustainable Energy Storage Systems for the Future Renewables-Based Grids. In Proceedings of the 2024 IEEE International Humanitarian Technologies Conference (IHTC), Bari, Italy, 25–27 November 2024; pp. 1–6. [Google Scholar]
  50. Zhu, X.; Huang, X.; Xiao, X. A Model Predictive Control Strategy for Smoothing Power Fluctuations of Wave Energy Converter Arrays Using Supercapacitors. In Proceedings of the IEEE 2024 UKACC 14th International Conference on Control (CONTROL), Southampton, UK, 10–12 April 2024; pp. 19–24. [Google Scholar]
  51. Blanco, M.; Santos-Herran, M.; Navarro, G.; Torres, J.; Najera, J.; Villaba, I.; Lafoz, M.; Ramírez, D. Meta-heuristic Optimisation Approach for Wave Energy Converter Design by Means of a Stochastic Hydrodynamic Model. IET Renew. Power Gener. 2021, 15, 548–561. [Google Scholar] [CrossRef]
  52. Blanco, M.; Navarro, G.; Lafoz, M.; Pérez, J.I. Study of the Impact of Wave Energy Generation in the Frequency of an Island Electric Grid. In Proceedings of the 12th European Wave and Tidal Energy Conference, Cork, Ireland, 27 August–2 September 2017; Volume 12, pp. 1–8. [Google Scholar]
  53. Harris, M. Officials Sign Agreement for Canary Islands Wave Power Development. Available online: http://www.hydroworld.com/articles/2014/02/officials-sign-agreement-for-canary-islands-wave-power-development.html (accessed on 1 September 2025).
  54. Veigas, M.; Iglesias, G. A Hybrid Wave-Wind Offshore Farm for an Island. Int. J. Green Energy 2015, 12, 570–576. [Google Scholar] [CrossRef]
  55. Veigas, M.; Iglesias, G. Potentials of a Hybrid Offshore Farm for the Island of Fuerteventura. Energy Convers. Manag. 2014, 86, 300–308. [Google Scholar] [CrossRef]
  56. Veigas, M.; Iglesias, G. Wave and Offshore Wind Potential for the Island of Tenerife. Energy Convers. Manag. 2013, 76, 738–745. [Google Scholar] [CrossRef]
  57. Prediccion de Oleaje, Nivel Del Mar; Boyas y Mareografos—Puertos Del Estado. Available online: http://www.puertos.es/es-es/oceanografia/Paginas/portus.aspx (accessed on 26 December 2017).
  58. École Centrale de Nantes; Kurnia, R.; Guillaume, D. NEMOH—Homepage. Available online: https://lheea.ec-nantes.fr/valorisation/logiciels-et-brevets/nemoh-presentation (accessed on 30 August 2024).
  59. WEC-Sim (Wave Energy Converter SIMulator) [Computer Software]. Available online: https://github.com/WEC-Sim/WEC-Sim (accessed on 1 August 2025).
  60. Eidsmoen, H. Hydrodynamic Parameters for a Two-Body Axisymmetric System. Appl. Ocean Res. 1995, 17, 103–115. [Google Scholar] [CrossRef]
  61. Yu, Z.; Falnes, J. State-Space Modelling of a Vertical Cylinder in Heave. Appl. Ocean Res. 1995, 17, 265–275. [Google Scholar] [CrossRef]
  62. Yu, Z.; Falnes, J. State-Space Modelling of Dynamic Systems in Ocean Engineering. J. Hydrodyn. 1998, 10, 1–17. [Google Scholar]
  63. Blanco, M.; Santos-Herran, M.; Navarro, G.; Torres, J.J.; Najera, J.; García-Tabarés, L. Simplified Model of a Novel Direct-Drive PTO Based on an Azimuthal Linear Switched Reluctance Generator. In Proceedings of the 14th European Wave and Tidal Energy Conference (EWTEC), Plymouth, UK, 5–9 September 2021. [Google Scholar]
  64. Hals, J.; Falnes, J.; Moan, T. A Comparison of Selected Strategies for Adaptive Control of Wave Energy Converters. J. Offshore Mech. Arct. Eng. 2011, 133, 31101. [Google Scholar] [CrossRef]
  65. Lorenz, E.; Heinemann, D. Prediction of Solar Irradiance and Photovoltaic Power. In Comprehensive Renewable Energy; Elsevier: Amsterdam, The Netherlands, 2012; pp. 239–292. [Google Scholar]
  66. Hoff, T.E.; Perez, R. Modeling PV Fleet Output Variability. Sol. Energy 2012, 86, 2177–2189. [Google Scholar] [CrossRef]
  67. Boland, J. Time Series Modelling of Solar Radiation. In Modeling Solar Radiation at the Earth’s Surface; Springer: Berlin/Heidelberg, Germany, 2008; pp. 283–312. [Google Scholar]
  68. Boland, J. Time-Series Analysis of Climatic Variables. Sol. Energy 1995, 55, 377–388. [Google Scholar] [CrossRef]
  69. Box, G. Box and Jenkins: Time Series Analysis, Forecasting and Control. In A Very British Affair; Palgrave Macmillan: London, UK, 2013; pp. 161–215. [Google Scholar]
  70. Bishop, C.M. Neural Networks for Pattern Recognition; Oxford University Press: Oxford, UK, 1995; ISBN 9780198538493. [Google Scholar]
  71. MacKay, D.J.C. A Practical Bayesian Framework for Backpropagation Networks. Neural Comput. 1992, 4, 448–472. [Google Scholar] [CrossRef]
  72. Lauret, P.; Fock, E.; Randrianarivony, R.N.; Manicom-Ramsamy, J.-F. Bayesian Neural Network Approach to Short Time Load Forecasting. Energy Convers. Manag. 2008, 49, 1156–1166. [Google Scholar] [CrossRef]
  73. MacKay, D.J.C. Information Theory, Inference and Learning Algorithms; Cambridge University Press: Cambridge, UK, 2003; ISBN 9780521642989. [Google Scholar]
  74. Penny, W.D.; Roberts, S.J. Bayesian Neural Networks for Classification: How Useful Is the Evidence Framework? Neural Netw. 1999, 12, 877–892. [Google Scholar] [CrossRef] [PubMed]
  75. Lafoz, M.; Blanco, M.; Ramirez, D. Grid Connection for Wave Power Farms. In Proceedings of the IEEE 2011-14th European Conference on Power Electronics and Applications (EPE 2011), Birmingham, UK, 30 August–1 September 2011; pp. 1–10. [Google Scholar]
  76. Red Eléctrica de España, P.O. SENP 1: Funcionamiento de Los Sistemas Eléctricos Insulares y Extrapeninsulares 2019. Available online: https://www.ree.es/sites/default/files/2023-11/BOE-A-2019-18275_ministerio_para_la_transicion_ecologica.pdf (accessed on 1 September 2025).
  77. Mazorra-Aguiar, L.; Díaz, F. Solar Radiation Forecasting with Statistical Models. In Wind Field and Solar Radiation Characterization and Forecasting; Springer: Cham, Switzerland, 2018; pp. 171–200. [Google Scholar]
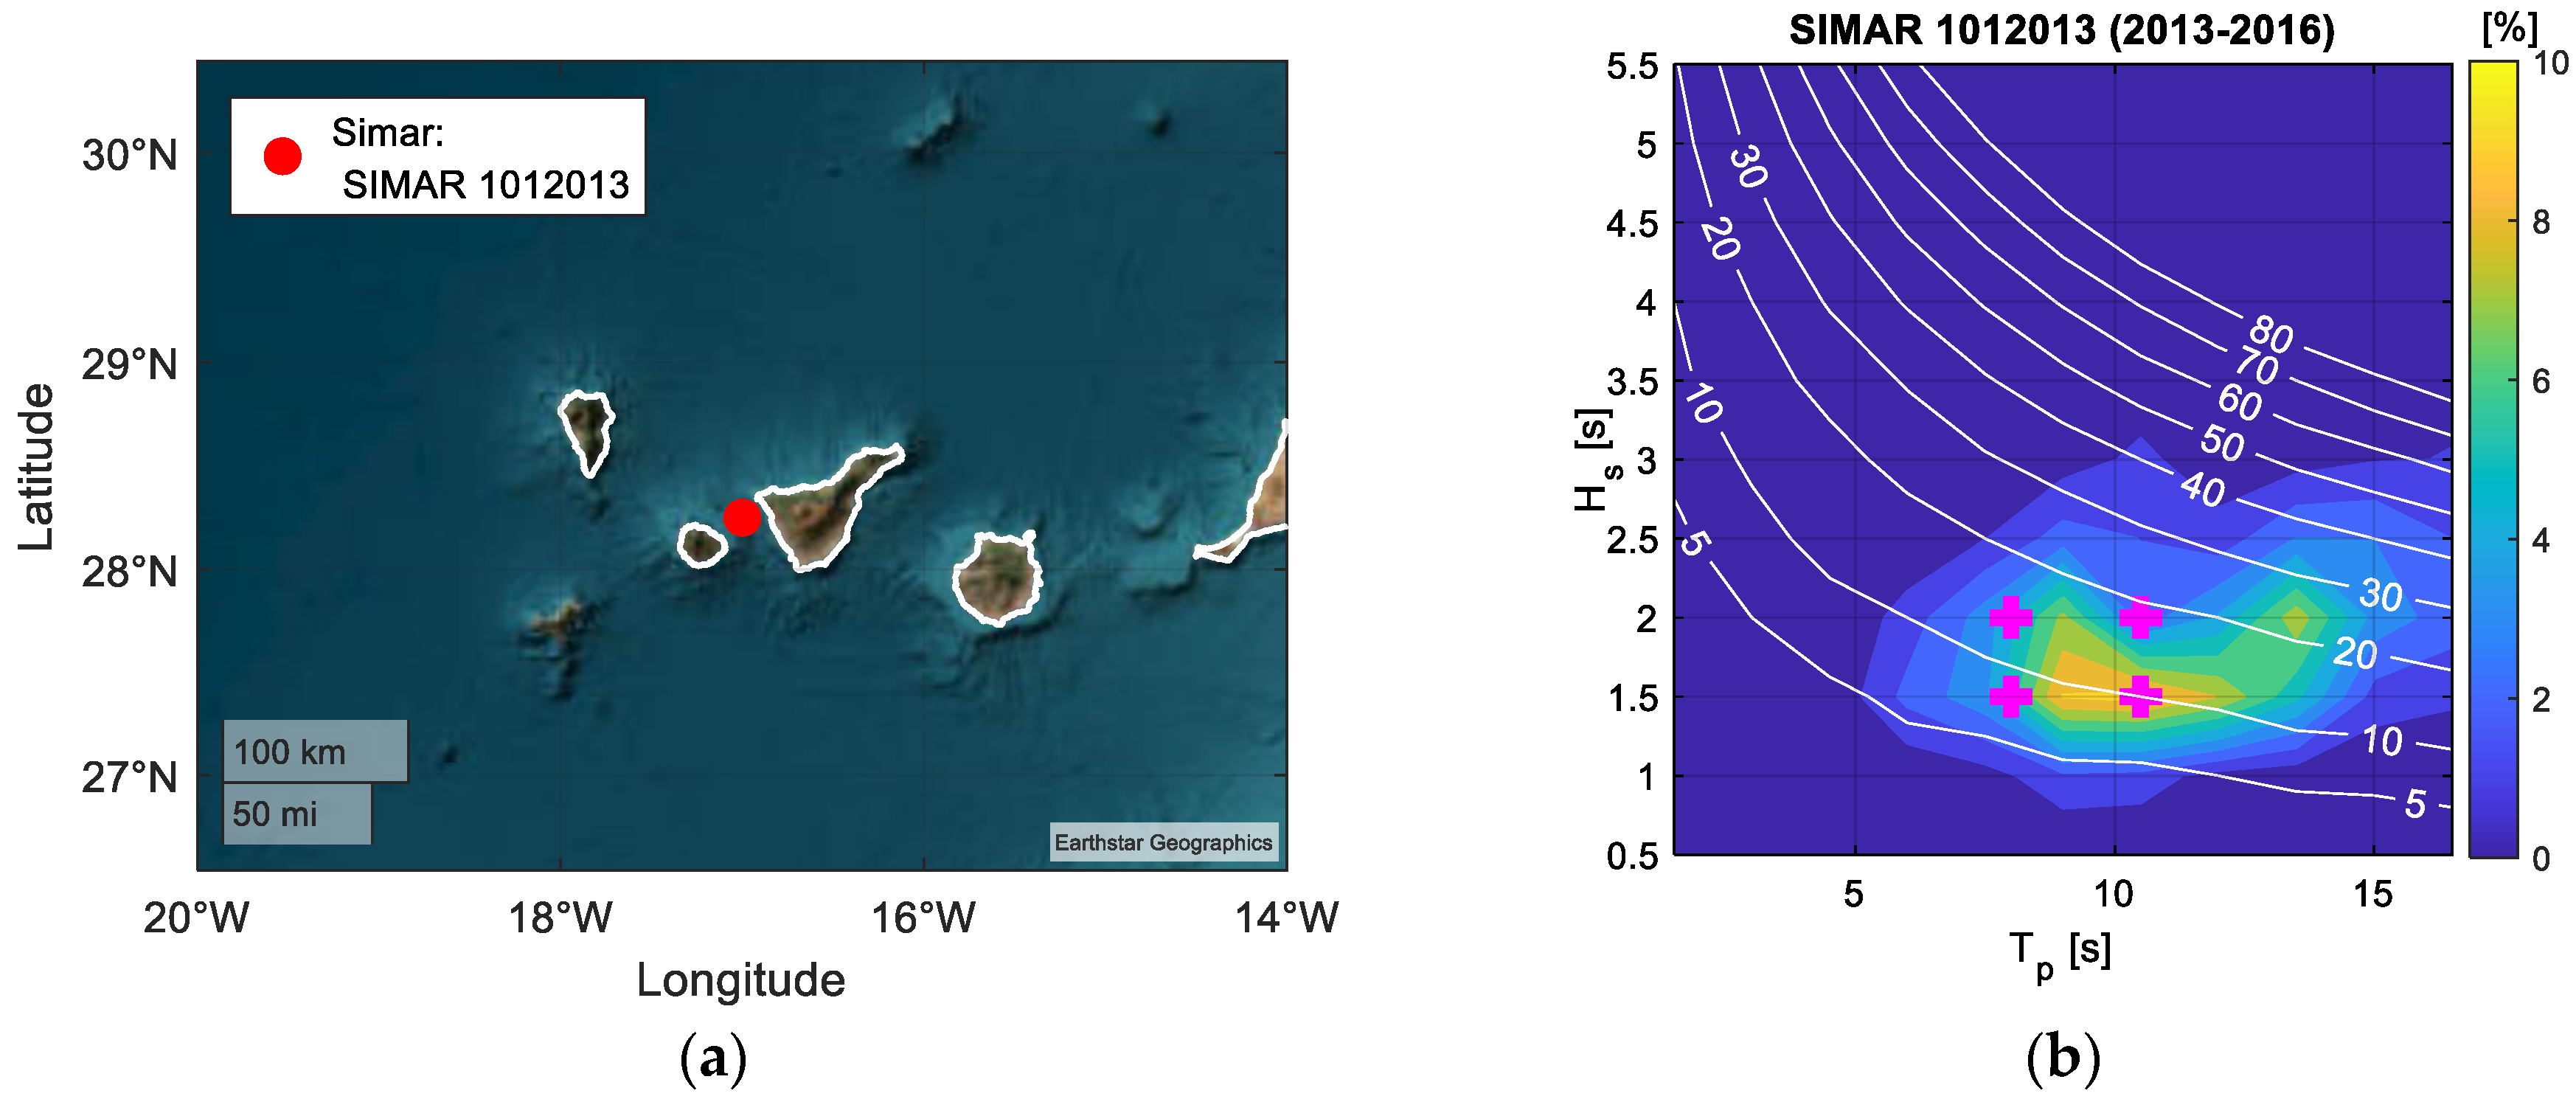
Figure 1. (a) Location of the WF (source: http://www.puertos.es/es-es/oceanografia/Paginas/portus.aspx—accessed in 1 September 2025); (b) wave contingency diagram showing the annual occurrence of various sea states, characterized by peak period (Tp) and significant wave height (Hs). The four sea states selected and detailed in Table 1 are highlighted with magenta cross markers, and the corresponding wave power per unit of wave front (Pj [14]) is indicated by contour lines in white.
Applsci 15 11106 g001
Figure 2. Diagram of the modeled point absorber.
Applsci 15 11106 g002
Figure 3. Spatial layout scheme of the WEC devices.
Applsci 15 11106 g003
Figure 4. Connection and control scheme of the energy storage system (ESS).
Applsci 15 11106 g004
Figure 5. (a) electric frequency oscillations in the electric grid. These results correspond with an example of the complete study case presented in [23]—the frequency limits of ±150 mHz and ±205 mHz are highlighted in light blue and dark blue, respectively. (b) Electric power generated by the WEC farm.
Applsci 15 11106 g005
Figure 6. Example of the EES reference values calculated with the four described control algorithms.
Applsci 15 11106 g006
Figure 7. Hourly power generation profiles for the 16 sea state scenarios considered for the wave farm (WF) power generation.
Applsci 15 11106 g007
Figure 8. Forecasting model results for different time horizons (nPred in seconds with a sample time Δt = 0.1 s) in all study cases (rRMSE).
Applsci 15 11106 g008
Figure 9. Results for Case 1 across different MAF sizes and forecasting algorithms.
Applsci 15 11106 g009
Figure 10. Summary of results for the 16 sea states using the NN model. Pareto fronts and optimal (nMAF, nPRED) combinations are highlighted.
Applsci 15 11106 g010
Figure 11. Grouped analysis of Pareto-optimal parameter combinations (nMAF, nPRED) across the 16 sea states using NN.
Applsci 15 11106 g011
Figure 12. Pareto-optimal parameter combinations (nMAF, nPRED) across all forecasting algorithms and the perfect forecasting case.
Applsci 15 11106 g012
Figure 13. Pareto fronts of σ P and E r a t e d for all forecasting algorithms across the 16 sea states.
Applsci 15 11106 g013
Figure 14. Heatmap graphs of E r a t e d and σ P as functions of (nMAF, nPRED) for all forecasting algorithms, including the perfect forecasting scenario.
Applsci 15 11106 g014
Figure 15. Summary of σ P and E r a t e d results for different (nMAF, nPRED) values using the NN forecasting model.
Applsci 15 11106 g015
Figure 16. Summary of results obtained for σ P and E r a t e d for the filter configuration combination of nMAF and nPRED at 16 and 8 s, respectively, and for the NN forecasting algorithm.
Applsci 15 11106 g016
Table 1. Wave conditions considered in this study.
No. CaseHs [m]Tp [s]αW [°]Pj [kW/m]
CASE 11.50008.000007.63
CASE 21.500010.5000010.02
CASE 32.00008.0000013.57
CASE 42.000010.5000017.81
CASE 51.50008.0000157.63
CASE 61.500010.50001510.02
CASE 72.00008.00001513.57
CASE 82.000010.50001517.81
CASE 91.50008.0000307.63
CASE 101.500010.50003010.02
CASE 112.00008.00003013.57
CASE 122.000010.50003017.81
CASE 131.50008.0000457.63
CASE 141.500010.50004510.02
CASE 152.00008.00004513.57
CASE 162.000010.50004517.81
Table 2. Summary of the comparison between the four control algorithm options.
Control Algorithmσ (PWEC)σ (fgrid)No. Alert Events
[Δ(fgrid) >
150 mHz]
No. Emerg. Events
[Δ(fgrid) >
250 mHz]
ESS Rated Power [KW]
(PESS)
ESS Rated Energy [kW·h]
(EESS)
base case (no ESS)4854.6880.050113401400
MAF3117.8360.031707026472.257
MAF with Pred.3116.8570.03169702239.800.900
Table 3. Forecasting algorithms considered in the study.
TypeAcronymPrediction Values AcronymDescription/Complete Name
Base CasenoPrednoPredNo forecasting algorithm in MAF (extra case)
Naïve models
(Section 2.3.1)
PersPresPredictSimple persistence
PersSmartPersSmartPredictSmart persistence
Linear models
(Section 2.3.2)
ARMApqARMAPQpredictARMA with optimal p and q values
ARMA12ARMA12predictSimple ARMA modelo (p = 1; q = 2)
Artificial Neural Networks
(Section 2.3.3)
NNNNpredictArtifical Neural Network (Bayesian Framework)
Limit CasePredPerfPredPerfPrefect prediction values in MAF (extra case)
Disclaimer/Publisher’s Note: The statements, opinions and data contained in all publications are solely those of the individual author(s) and contributor(s) and not of MDPI and/or the editor(s). MDPI and/or the editor(s) disclaim responsibility for any injury to people or property resulting from any ideas, methods, instructions or products referred to in the content.