Abstract
Rockburst disasters in deep underground engineering present significant safety hazards due to complex geological conditions and high in situ stresses. To address the limitations of traditional microseismic (MS) monitoring methods—namely, vulnerability to noise interference, low recognition accuracy, and limited computational efficiency—this study proposes an intelligent real-time monitoring and early warning framework that integrates deep learning, MS monitoring, and Internet of Things (IoT) technologies. The methodology includes db4 wavelet-based signal denoising for preprocessing, an improved Gaussian Mixture Model for automated waveform recognition, a U-Net-based neural network for P-wave arrival picking, and a particle swarm optimization algorithm with Lagrange multipliers for event localization. Furthermore, a cloud-based platform is developed to support automated data processing, three-dimensional visualization, real-time warning dissemination, and multi-user access. Field application in a deep-buried railway tunnel in Southwest China demonstrates the system’s effectiveness, achieving an early warning accuracy of 87.56% during 767 days of continuous monitoring. Comparative verification further indicates that the fine-tuned neural network outperforms manual approaches in waveform picking and event identification. Overall, the proposed system provides a robust, scalable, and intelligent solution for rockburst hazard mitigation in deep underground construction.
1. Introduction
With the continuous growth in global demand for mineral resources and the rapid expansion of underground space utilization, deep engineering has become a crucial development direction in modern mining, transportation, water conservancy, and other fields. However, under the so-called “three highs and one disturbance” environment—characterized by high in situ stress, high geothermal temperature, high hydraulic pressure, and intense engineering disturbances—deep rock masses are highly susceptible to rockburst disasters, posing severe threats to both project safety and human life [1]. Rockbursts are stress-induced geohazards that occur during underground excavation under high-stress conditions and are typically triggered by engineering activities. Their occurrence is often sudden and violent, significantly threatening the safe and efficient progress of underground construction projects. Therefore, research on rockburst prediction and early-warning methods is of great significance for ensuring the safety and reliability of deep underground engineering operations.
Microseismic (MS) monitoring technology, which captures the elastic wave signals generated by rock mass ruptures, can reflect the internal damage evolution of rock masses in real time and has become a core method for rockburst early warning [2]. P-waves, the fastest seismic waves, induce particle motion parallel to their propagation, whereas slower S-waves displace particles perpendicularly; such kinematic contrasts are fundamental to hypocenter localization and rupture mechanism characterization. Specifically, P-waves (primary or compressional waves) travel through both solids and fluids by alternately compressing and dilating the medium along the direction of propagation, while S-waves (secondary or shear waves) can only travel through solids and move the medium in a direction perpendicular to propagation. The velocity difference between P- and S-waves provides essential constraints for estimating source distance, determining stress states, and evaluating rock mass stability during excavation. During microfracturing, the rock mass releases energy in the form of P-waves and S-waves. When sensors at specific locations detect these waves, the source location, energy release, and rupture mechanism can be inferred by analyzing the waveform characteristics. In recent years, extensive research on rockburst early warning based on MS monitoring has been conducted both domestically and internationally. For example, Ma et al. [3] employed a mobile MS monitoring system to analyze the spatiotemporal distribution and clustering of MS events during a mega-rockburst in a hydropower station flood-relief tunnel, revealing clear precursors to the event. Zhang et al. [4] summarized the evolutionary characteristics of MS activity during rockburst formation and reviewed key MS indicators used in rockburst assessment. He [5] proposed an index, ISD, that integrates the effects of static and dynamic stress perturbations to provide a simple and effective method for rockburst risk evaluation. Zhao et al. [6] designed a new sensor installation scheme and, with their proprietary MS monitoring system, successfully realized the prediction and early warning of rockburst hazards. Ma et al. [7] revealed the spatiotemporal evolution patterns of MS events and rockbursts by comparing actual field observations with MS monitoring data, and proposed four criteria for rockburst determination, providing a solid foundation for rockburst prediction and MS early-warning applications.
In recent years, the advancement of deep learning has introduced new opportunities for intelligent rockburst early warning. While research on rockburst prediction based on MS monitoring technology continues to advance, many scholars have begun integrating artificial intelligence (AI) and deep learning with MS monitoring, opening a new direction for rockburst prediction and early-warning methods. For instance, Tang et al. [8] proposed a machine learning model that leverages a fast approximate convolution (FAC) to efficiently extract features from raw MS event data with a small model size. Di [9] developed a comprehensive rockburst early-warning approach that fuses microseismic, acoustic emission, and electromagnetic radiation (MS-AE-EMR) signals using deep learning algorithms. Ma [10] established an intelligent rockburst location prediction model combining a one-dimensional convolutional neural network (1D-CNN) and a fully connected neural network (FCNN), and verified its predictive performance. Song et al. [11] employed an unsupervised learning method based on Long Short-Term Memory (LSTM) and autoencoders to identify precursor and predictive signals of rockburst events, and evaluated the robustness and generalizability of the model using engineering data from active mining sites. Furthermore, Zhang et al. [12] proposed a dynamic rockburst early-warning model based on a Recurrent Neural Network (RNN) to address the limitation that most intelligent warning models require manual intervention to maintain accuracy. Zhang et al. [13] analyzed key MS indicators that characterize the development process of rockbursts using large datasets obtained from deep underground construction. By combining a dynamic moving-window method with an improved convolutional neural network, they achieved predictive modeling of the evolution of multiple MS parameters and their combinations, providing a data-driven approach for dynamic rockburst prediction.
Despite significant progress in MS monitoring techniques based on deep learning, several limitations remain. (1) Deep learning models require large amounts of data for training. MS monitoring generates highly complex, sequential waveform data, and extracting meaningful features typically demands large-scale datasets. The training process is time-consuming and often fails to meet the demands of real-time analysis. (2) As the volume of MS data increases, monitoring systems face dual challenges in terms of storage capacity and computational resources. Deep learning models rely on extensive historical data for training and parameter optimization, which may incur high costs in data storage and hardware infrastructure.
To address these challenges, this study integrates deep learning, MS monitoring, and Internet of Things (IoT) technologies to develop a comprehensive framework encompassing noise reduction, classification, arrival time picking, localization, and hazard prediction and warning. Based on a railway tunnel rockburst monitoring project in Southwest China, a 24 h automated and intelligent real-time rockburst monitoring and early warning system is established. The system incorporates multiple functions, including tunnel MS signal acquisition, information processing, 3D visualization, warning dissemination, and data sharing, providing robust technical support for rockburst hazard mitigation in complex geological environments.
2. MS Signal Processing and Rockburst Early Warning Methods
2.1. MS Waveform Preprocessing
In tunnel construction, the complex geological environment makes accurate extraction of valid information from microseismic fracture signals challenging. To mitigate the influence of background noise and enhance signal quality for subsequent tasks (e.g., waveform recognition and arrival-time picking), denoising of the raw microfracture signals recorded by sensors is required. After reviewing several commonly used wavelets (such as db2 and sym4), this study selected the db4 wavelet as the preprocessing tool. The choice was guided by previous research showing that db4 provides an effective balance between time–frequency resolution, denoising capability, and waveform fidelity. Wang et al. [14] demonstrated that the Daubechies family—particularly db4—closely matches the morphology of seismic and microseismic waveforms, making it suitable for feature-preserving denoising and signal decomposition tasks. Likewise, Kumar and Sivakumar [15] reported that db4 offers favorable smoothness and reconstruction characteristics when used for seismic-signal thresholding, yielding improved denoising accuracy under low signal-to-noise conditions. These findings consistently support the selection of db4 as an appropriate mother wavelet for microseismic signal preprocessing in this study. After comparing several commonly used wavelets (db2, sym4), the db4 wavelet was selected as the preprocessing tool. The results indicate that db4 achieves the best balance among time–frequency resolution, denoising performance, and signal fidelity. This finding is consistent with previous studies, which have demonstrated the effectiveness of db4 in seismic signal processing under low signal-to-noise conditions. Compared with conventional thresholding or STA/LTA-based approaches, the proposed method preserves weak signals while suppressing noise, thereby improving recognition accuracy in low-SNR environments. Figure 1 compares the raw and preprocessed waveforms of microseismic fractures and artificial blasts. As shown, the preprocessing method reduces high-frequency noise signals such as burrs and has a good noise reduction effect, which is conductive to subsequent time–frequency analysis.
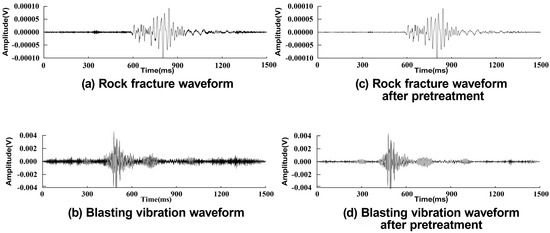
Figure 1.
MS original signal and processed signal.
2.2. MS Signal Identification
In microseismic signal datasets, events such as blasting, noise, and Tunnel Seismic Prediction (TSP) signals account for a considerable proportion and are often difficult to distinguish from genuine MS events. Currently, automatic identification of MS signals remains unsatisfactory, while manual interpretation by experienced technicians is prone to subjective bias, limiting the advancement of intelligent MS monitoring systems. To address this issue, this study proposes a MS waveform recognition model based on an improved Gaussian Mixture Model (GMM). The model extracts multidimensional features—such as time–frequency, energy, and fractal characteristics—using the S-transform [16], and applies Local Linear Embedding (LLE) [17] for feature dimensionality reduction, thereby enhancing classification accuracy and enabling more robust automatic signal identification [18].
The MS signal recognition model proposed in this study, based on an improved Gaussian Mixture Model (GMM), consists of the following five steps, as shown in Figure 2:
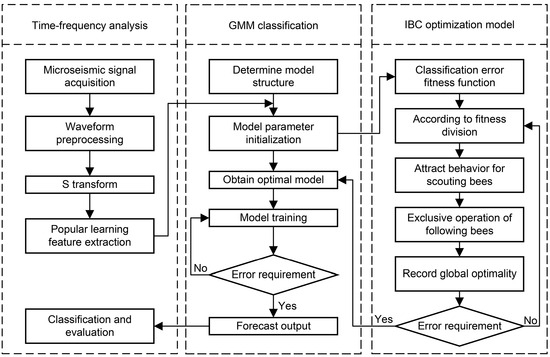
Figure 2.
MS signal recognition process based on IBC-GMM.
- Microseismic signal acquisitionMicroseismic signals from rock fractures and blasting vibrations are collected using the Engineering Seismology Group (ESG) MS monitoring system.
- 2.
- PreprocessingThe signals affected by construction interference are denoised using the db4 wavelet (refer to Section 2.1).
- 3.
- S-transform time–frequency analysisThe preprocessed signals undergo S-transform to extract time–frequency features. The S-transform is expressed as follows:where is the result of the S-transform of the time-domain signal ; is the original signal; is the time; is the frequency parameter in Hz; is the parameter controlling the position of the Gaussian window along the time axis; and is the scale parameter. The Gaussian window function is given by:
- 4.
- Manifold learning feature extractionLocal Linear Embedding (LLE) is used for dimensionality reduction in the time–frequency features, constructing a feature space that serves as the feature vector for the improved GMM.
- 5.
- Gaussian mixture model signal recognitionThe Gaussian Mixture Model (GMM), optimized using a bee colony algorithm with bacterial chemotaxis [19] (IBC-GMM), is developed. The feature vectors are input, and the classification error rate is used as the fitness function. The improved bee colony algorithm optimizes the GMM parameters to achieve MS signal classification.
The improved bee colony algorithm (IBC) incorporates bacterial chemotaxis attraction and repulsion operations during the search behavior of the bees, increasing the diversity of the population and enhancing local optimization capabilities.
where represents the individual of the population with size , and, indicates the generation; is a specific component of the D-dimensional solution vector; refers to a specific bee in the population of size , where and both and are randomly generated; is the individual global best position; is the global best position of the population; is the maximum number of iterations; and are the maximum and minimum values of the inertia weight, respectively; is the dynamic attraction constant, and is the dynamic repulsion constant.
2.3. MS Waveform Pick-Up
In recent years, the rapid development of deep learning technology has led to the widespread application of convolutional neural networks (CNNs) in the field of seismic phase picking. However, current deep learning-based methods for picking MS signals still face challenges in detecting events with extremely low signal-to-noise ratios and complex waveforms. Considering the characteristics of MS first-arrival waves and the successful application of U-shaped convolutional neural networks (U-Net) [20] in image semantic segmentation and edge detection, this study applies U-Net to the first-arrival picking problem and proposes an improved U-Net model. The schematic diagram of the improved network is shown in Figure 3.
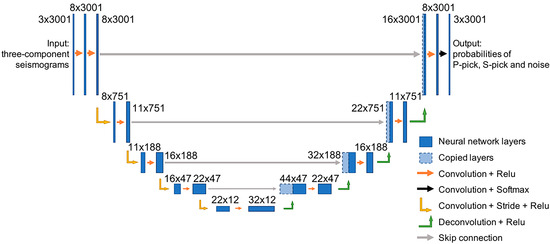
Figure 3.
Overall architecture of the improved U-Net.
The P-wave arrival pickup process based on the improved U-Net model developed in this paper is shown in Figure 4.
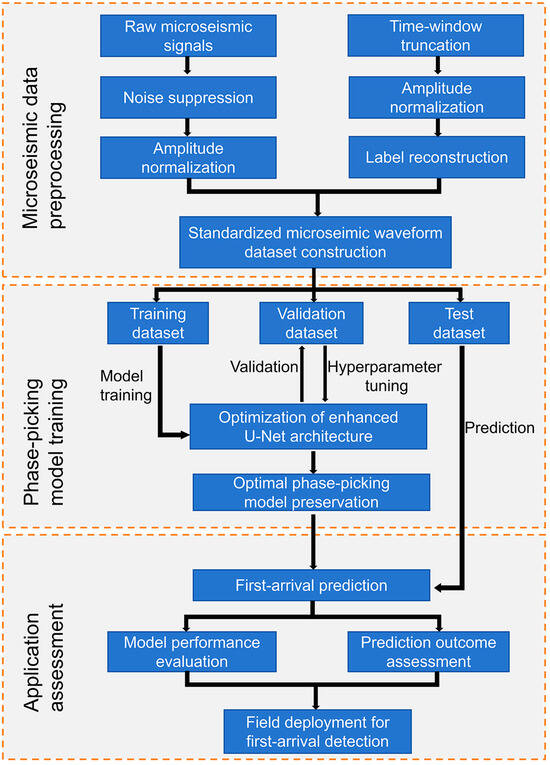
Figure 4.
Flowchart of P-wave arrival picking based on the improved U-Net model.
- Microseismic data preprocessingRaw MS signals are collected and subjected to denoising through trend removal and bandpass filtering, eliminating anomalous factors. A suitable event window is selected, and the effective signal duration is extracted, followed by normalization and label reconstruction. Finally, a standardized MS waveform dataset is constructed.
- 2.
- Arrival time pickup model trainingThe dataset samples are randomly split into training, validation, and test sets with a ratio of 8:1:1. After training the network, the model outputs a probability sequence of the same length as the input data. The probability value at each time step represents the likelihood of that time step being the P-wave arrival time, and the P-wave arrival time is determined by selecting the global extremum points of the probability sequence.
- 3.
- Practical application evaluationThe data from the test set is input into the trained arrival time picking model for testing. The results obtained represent the P-wave arrival time picking for the MS waveform. Finally, the deep learning recognition application is performed on real-site waveform data input, followed by an accuracy evaluation and analysis of the classification results.
2.4. MS Localization Method
Source localization is one of the most fundamental and crucial tasks in MS monitoring. Currently, most localization algorithms used in MS monitoring devices are based on simplified elastic wave propagation models, which can result in localization errors due to ambiguous signal arrival time picking and insufficient spatial constraint handling. To address these issues, this study proposes a particle swarm optimization (PSO) [21] algorithm incorporating the Lagrange Multiplier Method (LMM), as shown in Figure 5.
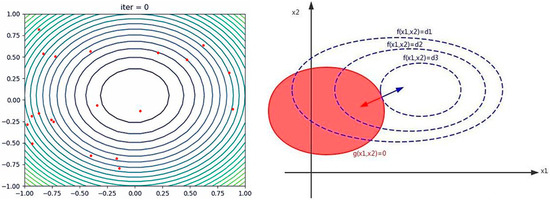
Figure 5.
Diagram of PSO algorithm introducing LMM.
This algorithm transforms near-field constraints into penalty factors through the LMM and integrates them into the PSO objective function, achieving a dynamic balance between global search and constraint optimization. It effectively prevents overfitting during the search for the global optimal solution, which could otherwise lead to local optimal solutions. This approach significantly improves the localization accuracy of MS events and enhances the fault tolerance of arrival time extraction. The specific workflow is shown in Figure 6.
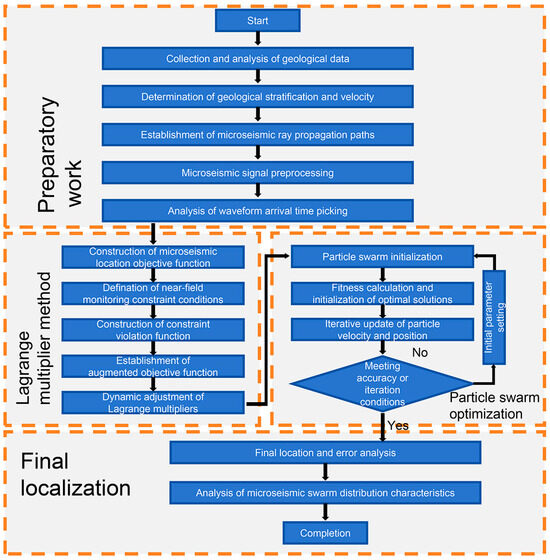
Figure 6.
Flowchart of LMM localization method with PSO.
- Preliminary preparationBased on geological survey analysis, the on-site geological structure (such as cavities, faults, etc.) is examined, and a velocity model and ray paths are established and validated. Noise reduction is applied to the monitoring signals, outliers are removed, spectral analysis is conducted, and the P-wave arrival times are picked.
- 2.
- Embedding engineering constraintsThe Lagrange Multiplier Method (LMM) is used to transform near-field constraints (defined as the spherical domain of key areas) into constraint violation functions, with out-of-bound values increasing linearly with the distance from the boundary. This is combined with travel-time residuals to construct an augmented objective function. The multipliers are dynamically adjusted to balance the global search and convergence.
- 3.
- Global optimizationThe Particle Swarm Optimization (PSO) algorithm is employed to minimize the augmented objective function. The parameters are iteratively optimized until the localization accuracy requirements are met (otherwise, the parameters are adjusted and optimization continues).
- 4.
- Localization and analysisThe final localization results are obtained, and error analysis is performed. The MS event localization results are analyzed in conjunction with the construction conditions, and on-site guidance recommendations are provided.
3. MS Monitoring Early Warning Cloud Platform
With the development of cloud computing and cloud storage, traditional IT operations have shifted from conventional servers and databases to cloud computing platforms. Based on the aforementioned monitoring results, such as MS waveform intelligent recognition, arrival time picking, source localization and interpretation, and rockburst disaster early warning, a MS monitoring big data early warning cloud platform is developed based on the B/S architecture. This platform aims to achieve unified data management, centralized software maintenance, deep data mining, and collaborative warning and data sharing, as shown in Figure 7.
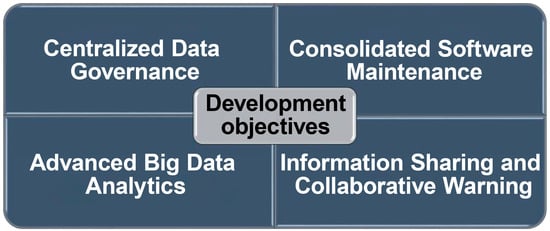
Figure 7.
MS monitoring big data early warning cloud platform design objectives.
3.1. Basic Framework of the Platform
As shown in Figure 8, the MS monitoring system architecture is based on the full-process logic of “data acquisition-transmission-processing-application,” consisting of four core layers: the data perception layer, data platform layer, data network layer, and data application layer.
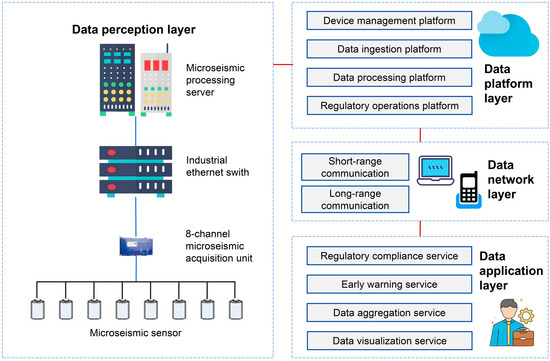
Figure 8.
Basic architecture of MS monitoring big data cloud platform.
The data perception layer serves as the interactive interface between the system and the monitoring scene, focusing on the collection, conversion, and preprocessing of raw MS signals. A front-end sensing network is built through specialized hardware components to ensure stable, low-latency data upload from the field, providing high-quality and foundational data for the upper platforms.
The data platform layer, as the core computational hub of the system, relies on cloud computing technology to implement data standardization management, deep analysis, and business process control. It is composed of four functional platforms that form a collaborative system. The device management platform builds a full lifecycle management system for the sensing layer hardware, enabling real-time monitoring of device status, remote parameter configuration, and fault early warning. The data collection platform is responsible for uploading the data processed by MS analysis to the server in a standardized format, ensuring efficient data transmission and storage, thus providing a foundation for subsequent data processing. The data processing platform is the key platform for processing the uploaded data, and its specific data processing architecture is shown in Figure 9. It ensures accurate and timely data processing, providing a user-friendly interface for display. The regulatory operation platform focuses on business process and compliance management, offering a visual operation interface, supporting user-defined monitoring rules, task scheduling, and operation log retention. It aligns with industry regulatory standards, automatically generating warning reports, and realizes the digitization of business processes and automation of regulatory compliance.
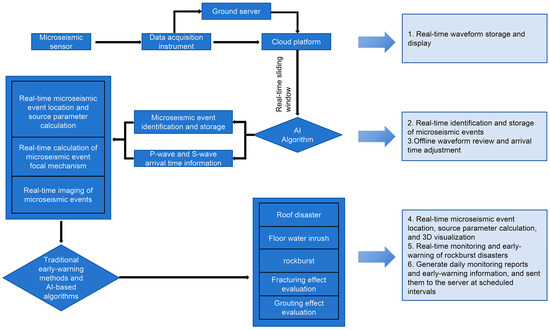
Figure 9.
MS cloud service platform data processing architecture.
The data network layer serves as the data transmission link for the system, covering both short-range and long-range, wired and wireless multi-technology paths, ensuring stable data flow across different layers. Short-range communication is adapted to meet the local data interaction needs at the site, ensuring local closed-loop and stable data transmission. Long-range communication enables cross-regional data transmission, relying on 4G/5G networks to ensure the reliability and real-time data transmission between the “site and the cloud.”
The data application layer focuses on the value output of MS monitoring data for safety management decision-making. It consists of four main applications: regulatory services, early warning services, data aggregation services, and data visualization services. Through specialized service modules, it directly supports risk prevention and control and compliance management in the tunnel and engineering sectors. Regulatory services automatically generate standardized compliance reports based on industry regulations and interface with regulatory authority data platforms for real-time data reporting. Early warning services, based on the data processing platform, establish a hierarchical warning mechanism, providing precise responses for disaster prevention and control through multi-dimensional indicators such as source energy thresholds and event clustering features. Data aggregation services integrate raw data from the sensing layer, analytical results from the platform layer, and historical databases, creating a data warehouse that facilitates engineers in fully utilizing MS data. Data visualization services display post-processing results, early warning information, and preventive measures, allowing users to intuitively understand the underground MS activity and take corresponding actions.
3.2. Basic Functions of the Cloud Platform
The current MS monitoring big data cloud platform has implemented several functions, including multi-user control, 3D visualization, MS event operation, real-time waveform viewing, monitoring reports, source event result charts and analysis, and short message service (SMS)-based early warning. Other early warning features are currently under development. The specific functions are described as follows.
- Three-dimensional visualizationAs shown in Figure 10, the cloud platform allows for time-range queries, displaying the locations of MS events within the selected time range in three-dimensional space, with each event represented as a sphere. The radius and color of the sphere can be customized to represent different attribute values of the event, such as seismic moment, moment magnitude, and other parameters. The display page provides tools for view switching, distance measurement, and area selection for download. It also shows the locations of project tunnels, faults, sensors, and face positions, and can display microseismic, blasting, and unknown events based on their type.

Figure 10.
Three-dimensional visualization page of the MS cloud platform.
- 2.
- MS event operationAs shown in Figure 11, the cloud platform allows time-range queries to display information on MS events within the selected period. MS events can be configured and exported through the data table. The platform also enables users to view waveforms or modify parameters for specific MS events.

Figure 11.
MS event operation on the cloud platform.
- 3.
- Real-time waveform viewingAs shown in Figure 12, the MS cloud platform provides real-time waveform viewing services, allowing users to inspect the waveforms received by each sensor. This enables intelligent real-time identification of MS events, arrival time picking, event localization, and source parameter calculation.

Figure 12.
Real-time waveform viewing on MS cloud platform.
- 4.
- Monitoring reportAs shown in Figure 13, the MS cloud platform can display customized daily report charts according to user requirements.

Figure 13.
Monitoring report of the MS cloud platform. (Note: The meaning of the two paragraphs of Chinese in the figure is as follows: The lithology exposed at the small-mileage face of Line 4 Left Tunnel is Yanshanian granite. It is grayish-white, with a medium-thick bed structure, medium-fine grained texture, dense structure, relatively developed joints, and a massive structure. The rock mass is relatively intact and weakly weathered. From 08:00:00 on 23 June 2025 to 08:00:00 on 24 June 2025, a total of 213 effective microseismic events were collected. The energy distribution ranged from 105.60 J to 59,477.44 J, with a cumulative energy of 1,022,720.39 J. Among the collected events, 55 had relatively large energy, indicating strong microseismic activity).
- 5.
- Graphical analysis of seismic source resultsAs shown in Figure 14, the cloud platform performs frequency and energy activity analyses on MS data, such as MS event statistics. It displays distribution maps of MS events over the past 24 h and the past 7 days, as well as an evolution pattern chart of MS events within the 7-day period.
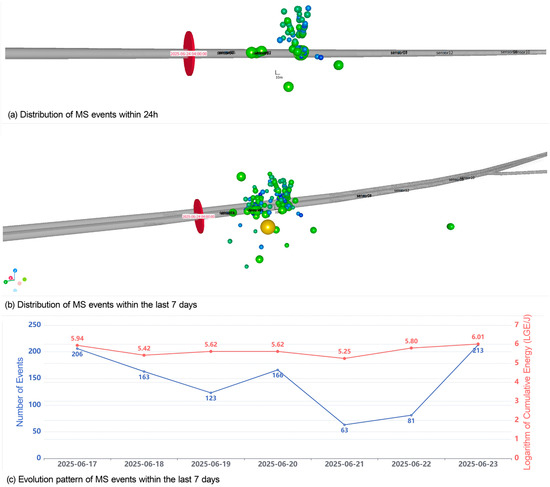 Figure 14. Graphical analysis of MS results on the cloud platform.
3.3. Advantages Analysis of the Cloud Platform
The platform is designed on a cloud computing architecture, supporting real-time synchronized cloud storage, high-speed access, and full-time domain data backup and recovery for MS data, which significantly enhances the effectiveness of engineering management. Based on robust hardware infrastructure, the intelligent real-time processing and analysis software integrates AI and edge–cloud collaborative computing to establish a comprehensive system for MS data processing, analysis, and early warning.
- No need for local software deploymentThe platform adopts a Browser/Server (B/S) architecture, which eliminates the need for complex client-side software installations. Users can access the platform via a web browser to view and analyze real-time MS monitoring data. Additionally, a mobile application has been developed to extend the range of application scenarios. This architecture supports real-time access to monitoring data and early warning information, greatly improving the flexibility and timeliness of monitoring operations.
- 2.
- AI-Driven automated processingTraditional manual identification of MS events and P-wave arrival time picking are often inefficient, labor-intensive, and prone to subjective errors. The platform employs AI algorithms for automated and accurate processing, significantly reducing data processing costs. These algorithms possess self-learning capabilities, allowing them to continuously improve recognition accuracy as more data are accumulated, thereby enhancing the reliability and validity of monitoring outcomes.
- 3.
- Real-time analysis and early warning capabilityThe platform establishes a fully automated processing pipeline from data acquisition to early warning output, minimizing the need for manual intervention. Leveraging high-performance algorithmic models, it achieves millisecond-level analysis of massive datasets, overcoming the efficiency bottlenecks associated with manual processing. This mechanism substantially reduces response latency in analysis, ensuring prompt early warnings of MS events and providing a critical time window for risk mitigation and emergency decision-making.
- 4.
- Standardized data analysis frameworkA unified data processing architecture is established to support parallel access to MS monitoring data from multiple tunnels. Real-time data and analysis results are presented through a standardized visual interface, with all charts and parameters following standardized formats. This enables comparative analysis of MS activity across tunnels, providing standardized decision support for tunnel group safety management.
- 5.
- Hardware decoupling and cloud analysisThe hardware–software decoupling architecture eliminates the need for hardware upgrades. Users can connect existing monitoring data to the platform and utilize cloud resources for efficient real-time processing, reducing equipment costs while improving data flexibility and timeliness.
4. Engineering Application and Algorithm Accuracy Verification
4.1. Project Overview
The deep-buried tunnel examined in this paper is located in southwestern China and is currently under construction as a railroad tunnel [22]. The tunnel’s structure primarily consists of slate from the Middle Carboniferous to Lower Permian Laigu Formation, along with metamorphic sandstone, quartzite, marble, and dolomite. Intercalated within the Lower Carboniferous Nuocuo Formation slate are layers if metamorphic sandstone and marble. Additionally, some rock lithology includes Yanshanian intrusive granite, while the tectonic features are predominantly composed of crushed rock, fault breccia, and fault gouge. The maximum tested horizontal principal stresses range from 6.82 to 43.08 MPa at depths of 112–1248 m, with an average in situ stress direction of N68°E.
The total length of the tunnel is 24,445 m, with a maximum burial depth of 1999 m and a minimum depth of 196 m. The tunnel features a single-sided slope, with a gradient of 3–30‰. It consists of two parallel tunnels of identical cross-sectional dimensions, measuring 9.15 m by 10.21 m, constructed using the drilling and blasting method. As shown in Figure 15, the parallel tunnels are divided into the left tunnel and the right tunnel. The left tunnel is located on the side near 4# inclined shaft, while the right-line tunnel is on the side farther away. Additionally, the tunnel connecting 4# inclined shaft and linking both the left and right tunnels is 7# transverse channel. Based on the direction of the mileage, it is divided into large and small mileage directions: the left side corresponds to the large mileage direction, and the right side corresponds to the small mileage direction. Therefore, the main tunnel is divided into four sections: left-large, left-small, right-large, and right-small.
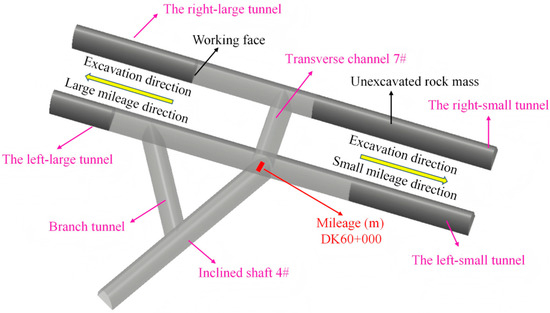
Figure 15.
The tunnel excavation diagram.
4.2. Rockburst Monitoring and Early Warning Situation
As of 23 April 2025, a total of 7 working faces have been monitored, with 5 monitoring sections remaining, including the left-large, left-small, right-large, and right-small. and the large-mileage smoke exhaust channel. From 18 March 2023, to 23 April 2025, a total of 767 days of monitoring were accumulated, covering a tunnel length of 5485.5 m. During this period, 2420 daily monitoring reports and 96 weekly reports were issued. The team achieved 2119 accurate early warnings, with 16 warnings being under-predicted and 285 over-predicted, resulting in an early warning accuracy rate of 87.56%.
The tunnel experienced several intense rockbursts that caused mechanical damage and structural failures. Currently, based on MS monitoring and early warning conclusions, the level and range of rockbursts are predicted in advance, and appropriate countermeasures are implemented to effectively ensure site safety and maintain operational efficiency. Some notable cases of accurate early warnings for intense rockbursts in the tunnel are shown in Table 1.

Table 1.
Accurate early warning cases of strong rockburst (Partial).
To better introduce the rockburst intelligent monitoring and early warning system, as well as the cloud platform, this paper further illustrates the engineering application of the early warning cloud platform through the case of a delayed rockburst at the Left-Large tunnel face on 12 May 2024. During the drilling process at the Left-Large tunnel face at DK60 + 468.5 on 12 May 2024, a severe rockburst occurred. The area 30 m behind the tunnel face experienced floor damage, with cracks radially distributed in the direction of the tunnel. The initial arch support at the crown and sidewalls cracked, and the burst pit exhibited an approximate radial depth of 3 m. The surrounding rock that fell after the explosion was flaky and plate-like, as shown in Figure 16.
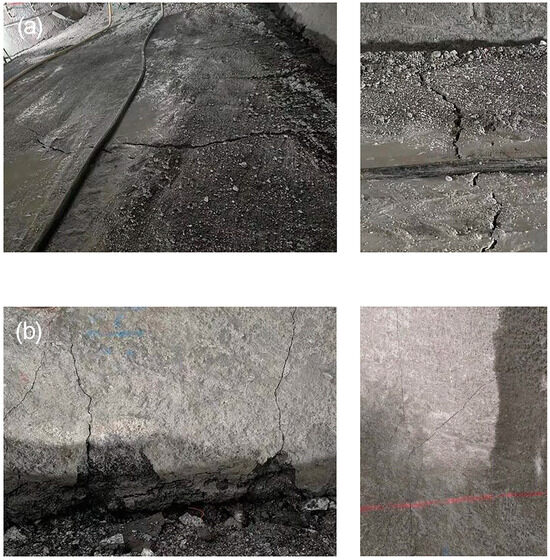
Figure 16.
Damage of the floor and sidewall in the rockburst on 12 May 2024. (a) Floor position, (b) Sidewall position.
7 days prior to the rockburst, there was a continuous increase in the energy of MS events, and the cloud platform issued an early warning for a severe rockburst. The energy of the events was approximately 900 kJ and 250 kJ, with large magnitudes, as shown in Figure 17a. Subsequently, the frequency of MS events near the tunnel face increased. Although the energy slightly decreased, the risk of a severe rockburst remained high. On the day of the severe rockburst, the cloud platform issued a real-time SMS warning 20 min prior to the main shock, based on multiple high-energy MS events. This is illustrated in Figure 17b.
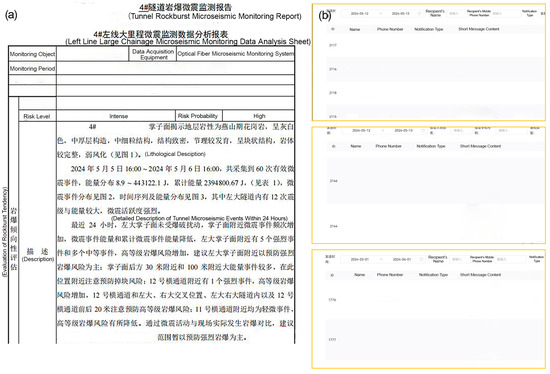
Figure 17.
Rockburst early warning daily report and SMS warning on 12 May 2024. (a) Early warning daily report, (b) SMS warning. (Note: The meaning of the three paragraphs of Chinese in the figure is as follows: (1) The lithology of the strata exposed at the heading face is Yanshanian granite, which is grayish-white, with a medium-thick bed structure, medium-fine grained texture, dense structure, relatively developed joints, and a massive structure. The rock mass is relatively intact and weakly weathered. (2) From 16:00 on 5 May 2024 to 16:00 on 6 May 2024, a total of 60 effective microseismic events were collected. The energy distribution ranged from 8.9 J to 443,122.1 J, with a cumulative energy of 2,394,800.67 J. Among them, 12 events in the Left Main Tunnel had relatively large magnitudes and energy, indicating strong microseismic activity. (3) In the past 24 h, the Left Main heading face was not disturbed by blasting. The frequency of microseismic events near the heading face increased, while the energy of individual microseismic events and the cumulative energy of microseismic events decreased. There were 5 strong events and multiple moderate events near the Left Main heading face, leading to an increased risk of high-grade rock bursts. It is recommended that the prevention of strong rock burst risks should be the priority near the Left Main heading face: there were many high-energy events near 30 m and 100 m behind the heading face, so attention should be paid to preventing spalling risks in these areas; there was 1 strong event near the No. 12 Cross Passage, resulting in an increased risk of high-grade rock bursts. Attention should be paid to preventing high-grade rock burst risks in the No. 12 Cross Passage, the intersection of the Left Main and Right Main Tunnels, the interior of the Left Main and Right Main Tunnels, and the 20-m range before and after the No. 12 Cross Passage; all events near the No. 11 Cross Passage were minor, and the risk of high-grade rock bursts has decreased).
4.3. Algorithm Accuracy Verification
4.3.1. Waveform Picking
This paper selects field data from 1 January 2023, to 6 April 2023, to analyze the accuracy and effectiveness of the algorithms used by the MS cloud service platform. The results are shown in Table 2. During this period, a total of 14,351 valid MS event waveforms were identified manually. The waveform time length selected for this study is 1 s. Model 1 refers to the initially adopted deep neural network model; Model 2 and Model 3 are deep neural network models fine-tuned based on Model 1.
Table 2.
Effective waveform pickup results of cloud platform algorithm.
Based on the deep neural network models obtained through fine-tuning, a comparison of the P-wave arrival time picked by the deep neural network model and the manually picked P-wave arrival time was conducted (Figure 18). The cumulative percentage of Model 3 with an absolute time difference of less than 15 ms exceeds 88.5%, indicating that the time deviation between the two is negligible.
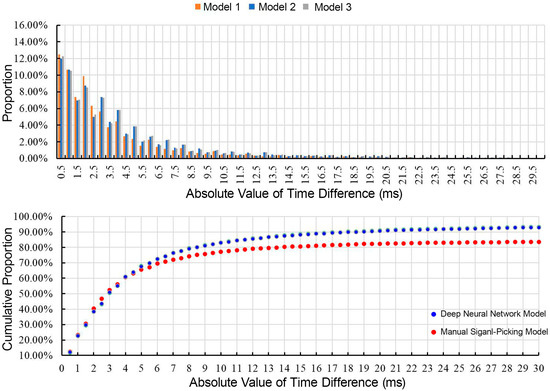
Figure 18.
Comparison of P-wave picking between deep neural network model and manual picking.
4.3.2. Waveform Recognition
This paper selects field event data from 26 November 2023, 00:00:00 to 30 November 2023, 23:59:59. A total of 228 MS events were manually identified, of which 209 events were automatically recognized by the cloud platform. The coverage rate of the MS cloud platform’s automatic recognition of MS events compared to manual recognition is 91.67%.
The MS event data recognized by the cloud platform from 00:00:00 to 23:59:59 on 26 November 2023, is shown in Figure 19. A total of 28 events were recognized by both manual identification and the cloud platform. The cloud platform recognized 40 events that were not identified manually, of which 38 events were confirmed as events. (The events marked in green were recognized by both manual identification and the cloud platform; the events marked in red were recognized by the cloud platform but not by manual identification).
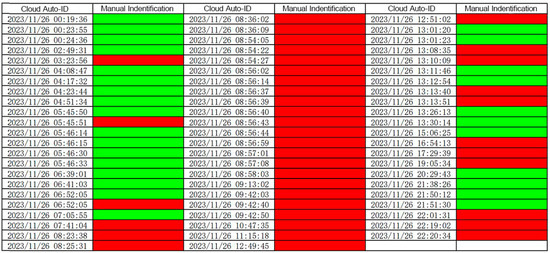
Figure 19.
Comparison of cloud platform’s automatic recognition and manual recognition of MS events (26 November).
From the perspective of effectively identifying MS events, the fine-tuned deep neural network model has surpassed manual recognition in terms of its capability.
5. Discussion
The field application demonstrates that the proposed intelligent microseismic (MS) monitoring and early warning system effectively addresses several limitations of conventional methods. The fine-tuned deep learning models significantly improved waveform recognition and P-wave arrival picking accuracy, with recognition rates reaching 91.67% and timing deviations within 15 ms. These results are comparable or superior to those reported in similar studies that applied deep learning to MS monitoring. For example, Tang et al. achieved an automatic rockburst warning accuracy of 85% using a feature-augmented point cloud model [8], while Song et al. reported reliable detection of precursor signals using LSTM autoencoders [11]. The higher accuracy achieved in this study may be attributed to the integration of wavelet-based preprocessing and U-Net-based phase picking, which effectively enhances feature extraction in low signal-to-noise environments.
Furthermore, the implementation of the cloud platform introduces an edge–cloud collaborative computing framework that differs from prior on-site MS monitoring systems [12,13]. Compared with local or standalone systems, the cloud-based approach supports multi-user access, centralized data management, and real-time synchronization, which collectively improve system scalability and reliability for long-term monitoring operations. This aligns with trends in intelligent mining and tunnel monitoring that emphasize distributed sensing, AI-driven analytics, and data interoperability [9,10].
From an engineering perspective, the system’s early-warning accuracy of 87.56% over 767 days demonstrates robust long-term stability under complex geological and environmental conditions. Particularly, the successful 20 min advance SMS warning preceding the 12 May 2024 rockburst event confirms the potential of the system for real-world hazard mitigation. However, several limitations remain. First, the deep learning models rely heavily on large, labeled datasets, which may limit applicability in new geological contexts. Second, the accuracy of event localization still depends on sensor geometry and the precision of velocity models. Third, stable network connectivity is essential for continuous data transmission between the site and cloud, which may pose challenges in remote mountainous regions.
Future work will focus on expanding the training dataset across different rock types and stress regimes, incorporating multi-source sensing (e.g., acoustic emission and electromagnetic radiation), and improving cross-site model generalization through transfer learning. Additionally, integrating real-time feedback loops between prediction models and field operations could further enhance adaptive warning capability. These developments will help establish a more universal and autonomous early-warning framework for deep-buried tunnels and underground engineering.
6. Conclusions
Through the research on the automatic integrated processing of tunnel MS information and the intelligent rockburst early warning system, the following conclusions have been drawn:
- Based on deep learning technology, an algorithm model has been developed, which includes four key technologies: signal recognition and classification, waveform picking, and MS localization. This model enables the automated and intelligent processing of massive data, advancing MS monitoring and real-time rockburst early warning.
- A cloud platform has been built on this foundation to enable real-time access to monitoring data and efficient collaboration, reducing user costs in hardware and operations.
- The developed intelligent rockburst monitoring and early warning system has been applied to a railway tunnel in Southwest China, successfully enabling automatic monitoring and data processing of MS activities. The system has successfully issued early warnings for abnormal MS activities and rockbursts on multiple occasions, demonstrating significant engineering practicality. It provides effective support for tunnel rockburst prediction and early warning, enhancing the safety and reliability of engineering projects.
Author Contributions
Methodology, T.M. and Y.D.; software, G.C.; validation, Y.D.; resources, T.M.; data curation, K.W.; writing—original draft preparation, Y.D.; writing—review and editing, W.D., H.W., C.T. and K.W.; visualization, G.C.; supervision, W.D., H.W. and C.T.; project administration, T.M.; funding acquisition, T.M. All authors have read and agreed to the published version of the manuscript.
Funding
This study was funded by the National Natural Science Foundation of China (Grant No. 42272314).
Institutional Review Board Statement
Not applicable.
Informed Consent Statement
Not applicable.
Data Availability Statement
Data will be made available on request.
Conflicts of Interest
The authors declare no conflict of interest.
References
- Ortlepp, W.; Stacey, T. Rockburst mechanisms in tunnels and shafts. Tunn. Undergr. Space Technol. 1994, 9, 59–65. [Google Scholar] [CrossRef]
- Li, P.; Chen, B.; Xiao, Y.; Feng, G.; Zhou, Y.; Zhao, J. Rockburst and microseismic activity in a lagging tunnel as the spacing between twin TBM excavated tunnels changes. Tunn. Undergr. Space Technol. 2023, 132, 104884. [Google Scholar] [CrossRef]
- Ma, T.; Liu, F.; Tang, C. Early warning for the rockburst in deep-buried tunnels using microseismic monitoring technique. Res. Explor. Lab. 2020, 39, 6–10. [Google Scholar]
- Zhang, S.; Tang, C.; Wang, Y.; Li, J.; Ma, T.; Wang, K. Review on early warning methods for rockbursts in tunnel engineering based on microseismic monitoring. Appl. Sci. 2021, 11, 10965. [Google Scholar] [CrossRef]
- He, J.; Dou, L.; Gong, S.; Li, J.; Ma, Z. Rock burst assessment and prediction by dynamic and static stress analysis based on micro-seismic monitoring. Int. J. Rock Mech. Min. Sci. 2017, 93, 46–53. [Google Scholar] [CrossRef]
- Zhao, J.; Huang, D.; Cai, Y.; Huang, D.; Zhou, X.; Wang, F.; Pan, Y. Rockburst prediction and early warning for a highway tunnel excavated by TBM based on microseismic monitoring. Front. Earth Sci. 2014, 12, 1391509. [Google Scholar] [CrossRef]
- Ma, T.; Tang, C.; Tang, S.; Kuang, L.; Yu, Q.; Kong, D.; Zhu, X. Rockburst mechanism and prediction based on microseismic monitoring. Int. J. Rock Mech. Min. Sci. 2018, 110, 177–188. [Google Scholar] [CrossRef]
- Tang, S.; Wang, J.; Tang, L.; Ding, S. Automatic early warning of rockbursts from microseismic events by learning the feature-augmented point cloud representation. Tunn. Undergr. Space Technol. 2024, 147, 105692. [Google Scholar] [CrossRef]
- Di, Y.; Wang, E.; Li, Z.; Liu, X.; Huang, T.; Yao, J. Comprehensive early warning method of microseismic, acoustic emission, and electromagnetic radiation signals of rock burst based on deep learning. Int. J. Rock Mech. Min. Sci. 2023, 170, 105519. [Google Scholar] [CrossRef]
- Ma, K.; Shen, Q.; Zhang, Z.; Wang, T. Development and Validation of Intelligent Models for Predicting Rockburst Location Based on Microseismic Monitoring and Machine Learning. Rock Mech. Rock Eng. 2025, 58, 5093–5113. [Google Scholar] [CrossRef]
- Song, Y.; Wang, E.; Yang, H.; Liu, C.; Di, Y.; Li, B.; Chen, D. Comprehensive early warning of rockburst hazards based on unsupervised learning. Phys. Fluids 2024, 36, 076628. [Google Scholar] [CrossRef]
- Zhang, S.; Mu, C.; Feng, X.; Ma, K.; Guo, X.; Zhang, X. Intelligent Dynamic Warning Method of Rockburst Risk and Level Based on Recurrent Neural Network. Rock Mech. Rock Eng. 2024, 57, 3509–3529. [Google Scholar] [CrossRef]
- Zhang, H.; Zeng, J.; Ma, J.; Fang, Y.; Ma, C.; Yao, Z.; Chen, Z. Time series prediction of microseismic multi-parameter related to rockburst based on deep learning. Rock Mech. Rock Eng. 2021, 54, 6299–6321. [Google Scholar] [CrossRef]
- Wang, Y.; Qiu, Q.; Lan, Z.; Chen, K.; Zhou, J.; Gao, P.; Zhang, W. Identifying microseismic events using a dual-channel CNN with wavelet packet decomposition. Comput. Geosci. 2022, 164, 105115. [Google Scholar] [CrossRef]
- Kumar, P.; Sivakumar, K. Seismic signal denoising using wavelet-thresholding based on Shannon and Tsallis entropy. Appl. Math. Model. 2013, 37, 3983–3998. [Google Scholar]
- Stockwell, R.; Mansinha, L.; Lowe, R. Localization of the complex spectrum: The S transform. IEEE Trans. Signal Process. 1996, 44, 998–1001. [Google Scholar] [CrossRef]
- Wang, J.; Wong, R.; Lee, T. Locally linear embedding with additive noise. Pattern Recognit. Lett. 2019, 123, 47–52. [Google Scholar] [CrossRef]
- Wang, K.; Tang, C.; Ma, K.; Wang, X.; Li, Q. An Automatic Recognition Method of Microseismic Signals Based on S Transformation and Improved Gaussian Mixture Model. Adv. Civ. Eng. 2020, 2020, 8825990. [Google Scholar] [CrossRef]
- Lu, Z.; Feng, T.; Li, X. Low-carbon emission/economic power dispatch using the multi-objective bacterial colony chemotaxis optimization algorithm considering carbon capture power plant. Int. J. Electr. Power Energy Syst. 2013, 53, 106–112. [Google Scholar] [CrossRef]
- Zunair, H.; Ben, H. Sharp U-net: Depthwise convolutional network for biomedical image segmentation. Comput. Biol. Med. 2021, 136, 104699. [Google Scholar] [CrossRef]
- Kennedy, J.; Eberhart, R. Particle swarm optimization. In Proceedings of the ICNN’95—International Conference on Neural Networks, Perth, WA, Australia, 27 November–1 December 1995. [Google Scholar]
- Duan, W.; Tang, C.; Ma, T.; Zhang, X.; Wang, M.; Yu, S.; Zhou, J.; Pang, Y.; Wang, K. Development and occurrence mechanism of extremely intense rockburst and structural stability analysis of deep-buried tunnel groups: A case study. Rock Mech. Rock Eng. 2025, 58, 4959–4981. [Google Scholar] [CrossRef]
Disclaimer/Publisher’s Note: The statements, opinions and data contained in all publications are solely those of the individual author(s) and contributor(s) and not of MDPI and/or the editor(s). MDPI and/or the editor(s) disclaim responsibility for any injury to people or property resulting from any ideas, methods, instructions or products referred to in the content. |
© 2025 by the authors. Licensee MDPI, Basel, Switzerland. This article is an open access article distributed under the terms and conditions of the Creative Commons Attribution (CC BY) license (https://creativecommons.org/licenses/by/4.0/).