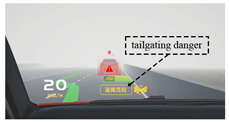
Abstract
Adverse road conditions, particularly foggy weather, significantly impair drivers’ abilities to gather information and make judgments in response to unexpected events. To investigate the impact of different Augmented Reality-Head-Up Display (AR-HUD) interfaces (words-only, symbols-only, and words + symbols) on driving behavior, this study simulated driving scenarios under varying visibility and risk levels in foggy conditions, measuring reaction time (RT), time-to-collision (TTC), the maximum lateral acceleration, the maximum longitudinal acceleration, and subjective data. The results indicated that risk levels significantly affected drivers’ RT, TTC, and maximum longitudinal and lateral accelerations. The three interfaces significantly differed in RT and TTC across different risk levels in heavy fog. In light fog, words-only and redundant interfaces significantly affected RT across different risk levels; words-only and symbols-only interfaces significantly affected TTC across different risk levels. In addition, participants responded faster when using text-related interfaces in the subject’s native language. After analyzing data on perceived usability across the three interfaces, the results indicated that under high-risk conditions, both in light fog and heavy fog, participants rated the redundant interface as having higher usability and preferred the redundant interfaces. Based on these findings, this paper proposes the following design strategies for AR-HUD visual interfaces: (1) Under low-risk foggy driving conditions, all three interface types are effective and applicable. (2) Under high-risk foggy driving conditions, redundant interface design is recommended. Although it may not significantly improve driving performance, this interface type was subjectively perceived as more useful and preferred by the subjects. The findings of this study provide support for design of AR-HUD interfaces, contributing to enhanced driving safety and human–machine interaction experience under complex meteorological conditions. This offers practical implications for the development and optimization of intelligent vehicle systems.
1. Introduction
Fog significantly impairs visibility and visual range, exerting considerable influence on drivers’ visual perception and emotional state. Such adverse conditions compromise the capacity to assimilate information and make rapid judgments regarding unforeseen incidents. Empirical data indicate that dense fog is particularly potent in precipitating severe outcomes, contributing to approximately 30% of traffic-related fatalities []. The progression of information technology and the advent of intelligent cockpit systems have equipped drivers with Advanced Driving Assistance Systems (ADAS), facilitating real-time, dynamic communication among vehicles and between vehicles and infrastructure. This technological integration is pivotal for bolstering vehicular safety. The Augmented Reality-Head-Up Display (AR-HUD) is an innovative convergence of augmented reality and traditional head-up displays among the various human–computer interaction (HCI) modalities in intelligent cockpits and ADAS. The AR-HUD enables drivers to access driving data without diverting their line of sight by superimposing critical driving information onto the windshield. This innovation mitigates the traffic risks associated with visual refocusing. It enhances situational awareness and reaction time in conditions of low visibility, such as fog [], thereby diminishing the likelihood of accidents []. In addition, it has been shown that in-vehicle AR-HUDs contribute to drivers’ visual safety driving behaviors and psychological driving safety [].
Nevertheless, the overlay of vehicle network data and virtual information into the AR-HUD interface has also been criticized. Studies have identified potential drawbacks, including information overload, which can diminish readability and comprehension, leading to confusion and decreased information processing efficiency []. Additionally, the constant flux of data streams may precipitate inattentional blindness among drivers []. Hwang [] advocate for a streamlined AR-HUD display in emergency contexts, positing that it should be succinct and not overly elaborate. This perspective, however, contrasts with the insights derived from the Communication-Human Information Processing model (C-HIP), which, informed by extensive empirical research, suggests that information redundancy can amplify the efficacy of alerts in emergency scenarios [,,]. Consequently, an area for exploration is the optimization of AR warning messages. The current challenge we face is how to effectively convey impending dangerous information within the limited projection range of the AR-HUD, ensuring that drivers can accurately receive and comprehend critical information under complex driving conditions. This enables them to respond promptly, thereby enhancing overall driving safety.
Information redundancy is a key design element in enhancing the perception of information accuracy []. Appropriate redundancy can present critical information through multiple channels, increasing its visibility and comprehensibility, thereby improving drivers’ perceptual abilities within the driving environment. In driving, redundancy is commonly manifested in two primary ways: ①. Multisensory Information Presentation. In emergencies, drivers may be under high stress, and their visual attention could be diverted. The information’s perceptibility is enhanced by conveying key information visually on the HUD and through auditory and haptic means. ②. Repetition and Emphasis of Information. During emergencies, the importance of certain key information becomes more pronounced. Presenting this critical information repeatedly, in different locations and manners, increases drivers’ attention and aids in shorter response time.
This study explores the second approach, which involves repeating content in various visual forms, such as text, symbols, or a combination of both []. Information redundancy is not an unfamiliar term in HCI. Extensive research has focused on redundancy, conducting experimental studies about symbol icons, textual icons, and hybrid icons that combine graphics with text. It has been suggested that text-based icons yield better results in reaction time and convey more precise information [], making them suitable for applications in logical reasoning, such as legal concepts. However, the high text redundancy contravenes the design principles of menu structures in human–machine interfaces, limiting their application. Graphic icons, due to their direct or indirect mapping relationships with their referents, are often considered the most effective means of information expression, allowing for recalling and accurate recognition [], and are commonly applied in interface design.
Despite much research on designing various interfaces, there remains a gap in exploring the design of augmented reality (AR) warning interfaces with information redundancy in different hazardous driving scenarios. Specifically, whether the design of redundant warnings in different hazardous scenarios is superior to words-only or symbols-only interfaces. To fill this gap, this study aims to explore the effects of different visual interfaces—words only, symbols only, and combined words–symbols—on drivers’ behavior, usability perceptions, and preferences under different driving scenarios with varying levels of risk and visibility.
The structure of this paper is organized as follows: first, the relevant literature is reviewed, and the research hypotheses are developed accordingly. Next, the experimental design is presented in detail, including participants, materials, and procedures. The subsequent section reports the experimental results, followed by a discussion of the limitations and directions for future research. Finally, the paper concludes with a summary of the main findings.
2. Literature Review and Hypotheses
2.1. The Design of AR-HUD Warnings
Safety warnings remind individuals to pay attention to the dangers in their environment. Well-designed warning information can help them respond quickly, reducing accidents. However, inappropriate or overlooked warnings can cause thousands of casualties yearly []. To improve the effectiveness of warnings, a significant amount of research has focused on technological aspects, such as position sensors (e.g., GPS, Global Positioning System), and motion sensors, to make the system more intelligent in perceiving the status of vehicles and the environment, thereby offering more timely and personalized prompt content. Despite these advancements, the impact has been less significant. It can be seen that technology itself is not the best way to solve problems, but a well-designed interface is key []. The design of effective warning messages is a critical factor in enhancing driving safety. Inappropriate integration of various Connected Vehicle (CV) warnings and advisories can distract or even disrupt the normal driving tasks of drivers []. These adverse effects are pronounced under high workload conditions or when driving in severe weather and poor road conditions [].
The in-vehicle AR-HUD safety prompts and warnings cover various categories, including vehicle status, driving assistance, navigation information [], and more. Current research on AR-HUD safety interfaces mainly focuses on designing and displaying graphical elements. To enhance visual information acquisition, Jing et al. [] evaluated two schemes for pedestrian warnings: arrows and virtual shadows. The results indicated that virtual shadow-based AR-HUD interfaces effectively reduced driver distraction. Kim et al. [] examined the effect of conformal graphics in safety warnings, finding that when vehicles and pedestrians approached, conformal AR graphics that shortened and enlarged guided the driver’s attention to real-world objects, enabling quicker reaction time from releasing the accelerator to applying the brakes. Alessandro et al. [] assessed the effectiveness of AR-HUD designs featuring flashing red arrows above pedestrians under different conditions. The findings revealed that when the AR warning was activated, drivers began to decelerate before reaching the crosswalk, suggesting that AR interfaces can positively impact road safety. You et al. [] designed an AR-HUD invisible hazard warning system based on a cooperative perception model and examined its effects on safe driving. The results showed no significant differences in usability between world-fixed and screen-fixed displays, both of which enhanced understanding and trust in current vehicle performance. Gabbard et al. [] studied the navigation design of conformal and fixed arrows through eye-tracking and driving simulation data. Although conformal designs attracted participants’ attention, they potentially impaired driving performance and negatively impacted drivers’ gaze and experience.
2.2. Risky Driving
Accurately identifying and evaluating risks and their levels in driving scenarios is the basis for ensuring safe driving and is also the core demand for the development of vehicle intelligence. However, researchers have not yet reached a unified consensus on the concept of risk []. In traffic psychology, risk is often defined as a behavioral predictor associated with an individual’s attitude toward risk, reflected as a behavioral condition related to the concept of danger with a high probability of occurrence. Risk may be viewed as the negative consequence of a particular behavior or considered as a risky behavior []. As risk management practices continue to evolve, different criteria and methods for categorizing risk levels have developed across industries and fields. Risky driving, on the other hand, is a hierarchical assessment of the likelihood and potential severity of an accident based on factors such as the driving environment, traffic conditions, and vehicle status. Overall, the definition and application of risk levels are intended to help organizations identify and manage potential risks more effectively and take appropriate measures to reduce their negative impact.
Risk assessment methods are mainly divided into two categories: qualitative and quantitative. In conventional driving behavior, some scholars characterize road risk as following risk, lane changing risk, and so on []. In terms of risky driving behaviors, researchers usually characterize them as risky behaviors with potential hazards from the perspective of distracted driving [,,], fatigue driving [,], aggressive driving [,], drunk driving [,], and drugged driving []. In terms of quantitative analysis, researchers and scholars usually use regression statistical methods based on accident data and theoretical derivation methods based on non-accident data to analyze traffic risk []. The regression statistical method based on accident data relies on a large amount of long-term accident data, as well as related information such as weather and traffic conditions []. Thus, this method is difficult in risk characterization and metrics. Many studies adopt theoretical derivation methods based on non-accident data, usually using microscopic traffic parameters as analytical tools. Such methods are broadly categorized into three types []: time-based risk indicators [,,], distance-based risk indicators [], and deceleration-based risk indicators [,]. Based on the above studies, some scholars have also quantified the risk by calculating the degree of intersection of two predicted trajectories in the same spatiotemporal slot.
Higher risk levels typically correspond to more challenging road environments, characterized by high traffic density, limited visibility conditions, weather-related impairments like fog and rain, and poor road surface conditions. These factors collectively escalate the likelihood of collisions and accidents. For example, the higher the speed of the vehicle traveling, the greater the requirements for the driver’s operational responsiveness, and the higher the resulting driving risk []. The risk levels are conventionally categorized into low, moderate, and high-risk [], providing a systematic framework to assess and address the potential hazards associated with varying driving scenarios.
2.3. Information Redundancy
Information reinforcement can enhance the effectiveness of warnings, especially in emergencies []. Redundancy in interface design is often recommended to help users with low prior knowledge intuitively interact with smart products, as it proves effective in facilitating information comprehension and reducing ambiguity in icon-only interfaces [,]. Wiedenback [] examined the performance of novice users’ learning systems through three interface designs: text only, icon only, and a combination of text and icons. The study indicated that text-only or redundant interfaces might be more suitable for beginners. However, participants generally expressed a dislike for text-only interfaces, leading to the suggestion that redundancy be used to minimize ambiguity and individual differences in comprehension. Francois et al. [] compared three speedometer display modes—digital, analog, and redundant—in a simulated truck-driving environment. The study revealed that digital speedometers performed best in absolute and relative reading tasks, with minimal visual distraction, while analog speedometers were more effective at detecting dynamic speed changes. Across all three reading tasks, the redundant speedometer outperformed single-mode displays. Reddy et al. [] conducted an empirical study showing that elderly participants completed tasks faster and more intuitively using word-based interfaces compared to redundant interfaces (word + symbol), while younger participants performed tasks more quickly on the redundant interface. Wang et al. [], used virtual reality to investigate the impact of three warning designs on evacuation efficiency: conventional non-verbal ISO warnings, ISO warnings with voice, and redundant warnings integrating visual, auditory, and tactile information. The study found that participants responded better to alarms with voice prompts and redundant information, although there was no significant difference in overall evacuation outcomes among the three designs. Stojmenova et al. [] experimentally demonstrated that increasing the amount of information and enhancing situational awareness enables drivers to comprehend their surroundings better, thereby improving driving safety and efficiency. However, in practical applications, drivers prefer interfaces that present less information. While some studies highlight the importance of redundancy, others point out its potential negative effects.
Based on the available literature, this study proposes the following hypotheses.
Hypothesis 1.
Risk levels significantly influence driving behavior. Specifically, high-risk levels will lead to shorter reaction time (RT), shorter time-to-collision (TTC), and greater maximum longitudinal and lateral accelerations compared to low-risk levels, indicating more aggressive and reactive driving behavior.
Hypothesis 2.
The type of fog (heavy or light) influences driving behavior. With the assistance of the AR-HUD, drivers can identify potential hazards in advance and make appropriate decisions. Therefore, we infer that the reaction time to information provided by the AR-HUD remains consistent under different fog conditions. However, there is a significant difference in TTC. Compared to light fog, drivers may perceive a higher risk of collision in heavy fog, leading to increased vigilance and effective adjustments in driving behavior to extend the time needed to avoid a collision.
Hypothesis 3.
Participants were able to make faster responses when using text-related interfaces. Redundant interfaces were perceived as more useful and favored over word- and symbol-based interfaces in high-risk scenarios.
3. Materials and Methods
3.1. Participants
A total of 30 licensed drivers with normal or corrected vision were recruited. The experimental data from 26 participants (15 males, and 11 females) were finally analyzed. The participants’ ages ranged from 21 to 28. They had an average of 2.5 years of driving experience. They all had experience with L1 or L2 autonomous vehicles and provided written acknowledgment of their participation in the study. Participants were required to abstain from consuming alcohol, coffee, or any other beverages that could affect driving behavior before the experiment. After the experiment, each participant received a cash reward.
3.2. Apparatus
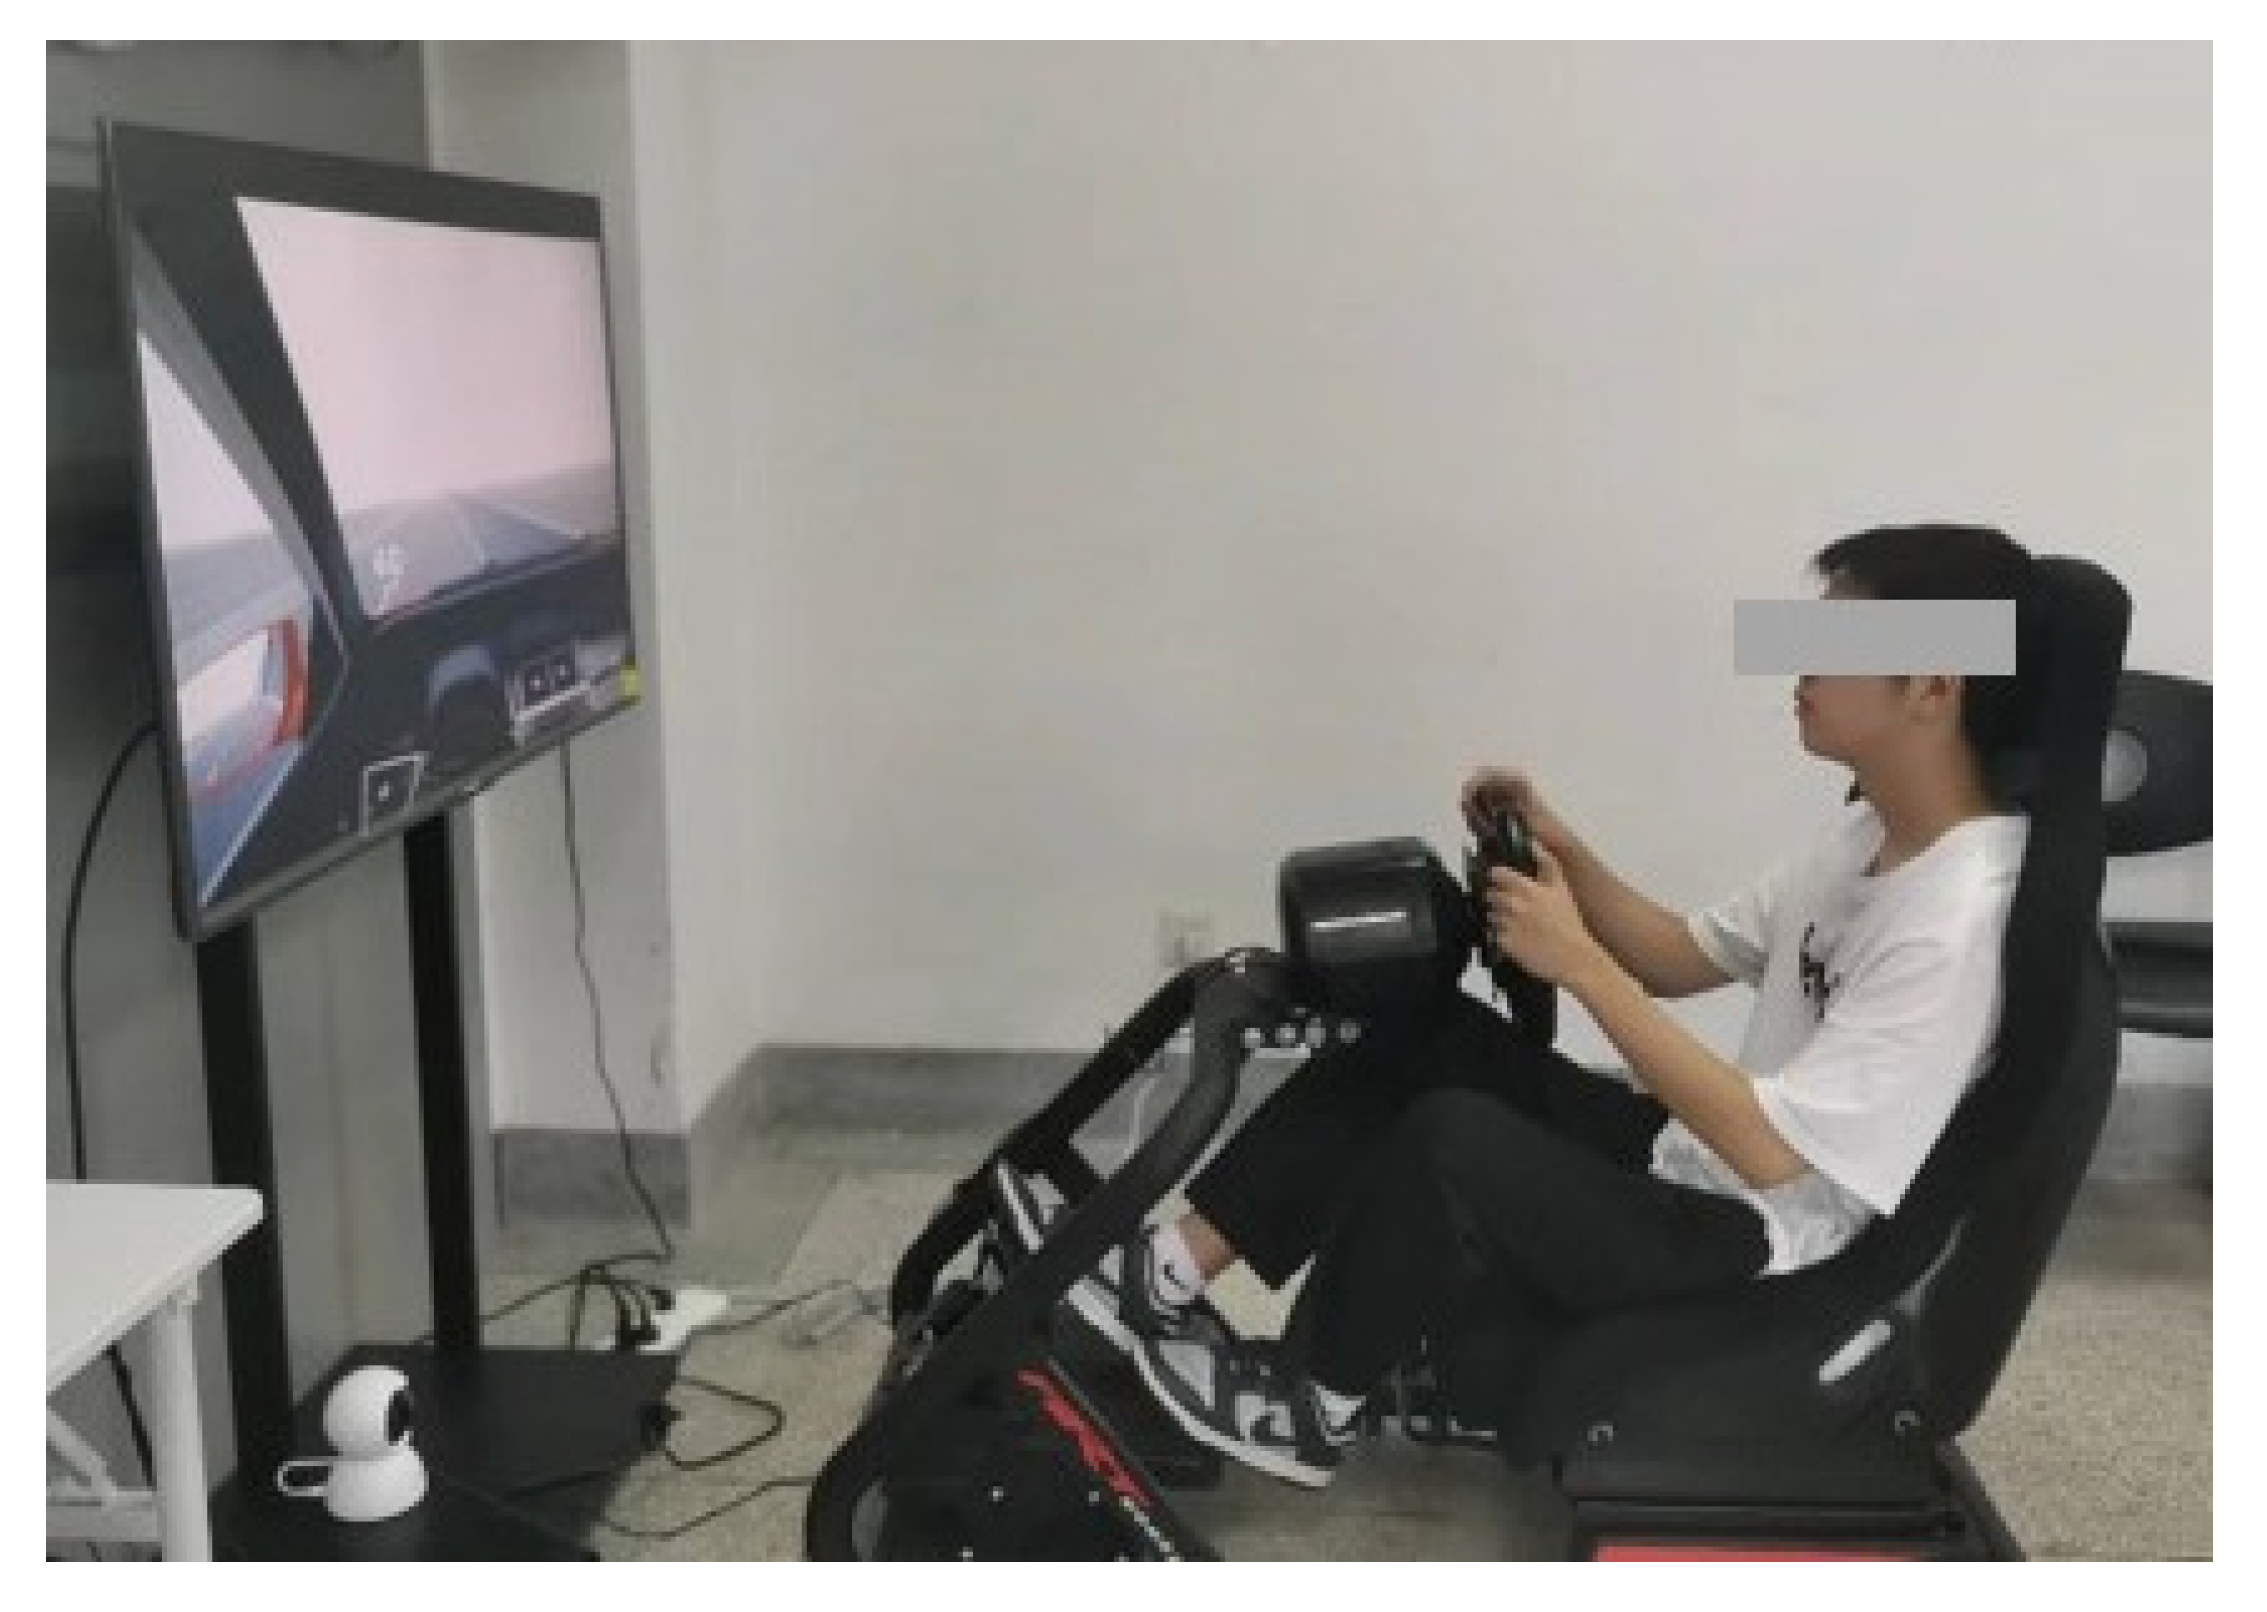
The experiment was programmed using the Unity 2021.3 (Unity Technologies, San Francisco, CA, USA) development engine, enabling the recording of relevant data and visualizing AR-HUD information directly on the front windshield. The Thrustmaster T248 (Guillemot Corporation, Carentoir, France) force feedback racing simulator was utilized for equipment, featuring a steering wheel, brake pedal, throttle pedal, and a reverse gear button to simulate realistic driving operations. To enhance the fidelity of the simulated driving environment, we used an HP desktop computer connected to a Xiaomi television, as shown in Figure 1. The screen size is 43 in. with an aspect ratio of 16:9 and a resolution set at 3840 px × 2160 px. During the experiment, the participant’s seat can be adjusted with a forward-backward travel range of 15 cm. The experiment was conducted indoors under normal lighting conditions, with a 40 W daylight lamp providing sufficient illumination.

Figure 1.
Driving simulator used in this experiment.
3.3. Experimental Variables and Procedure
Following the “Road Traffic Safety Law of the People’s Republic of China and its implementing regulations,” when driving in fog on highways with visibility of fewer than 200 m, the speed can’t exceed 60 km per hour, and a distance of more than 100 m should be maintained from the vehicle in front within the same lane. When visibility is reduced to less than 50 m, the speed must not exceed 20 km per hour. The simulated driving conditions in this study are set with the maximum driving speeds and visibility levels stipulated by these traffic regulations.
In this experiment, the independent variables are fog conditions (light fog vs. heavy fog), risk levels (low vs. high), and different interfaces (words only vs. symbols only vs. words + symbols). Four dependent variables were selected to be measured: reaction time (RT), time-to-collision (TTC), maximum longitudinal acceleration, and maximum lateral acceleration. Users’ opinions and preferences were also observed. Two questionnaires were used to gather data on participants’ perceptions of the AR-HUD’s usability and their preferences regarding the presented information. Usability perceptions were evaluated using the System Usability Scale (SUS) [], while preferences for information presentation were measured with the Personal Preferences Questionnaire (PPQ). Both questionnaires were based on a 5-point Likert scale, ranging from 1 (strongly disagree) to 5 (strongly agree); see Table 1.

Table 1.
Subjective questionnaire design.
A 2 × 2 × 3 scenario-based experiment examined the effects of different risk levels and the interactions among these variables.
3.3.1. Experiment Procedure
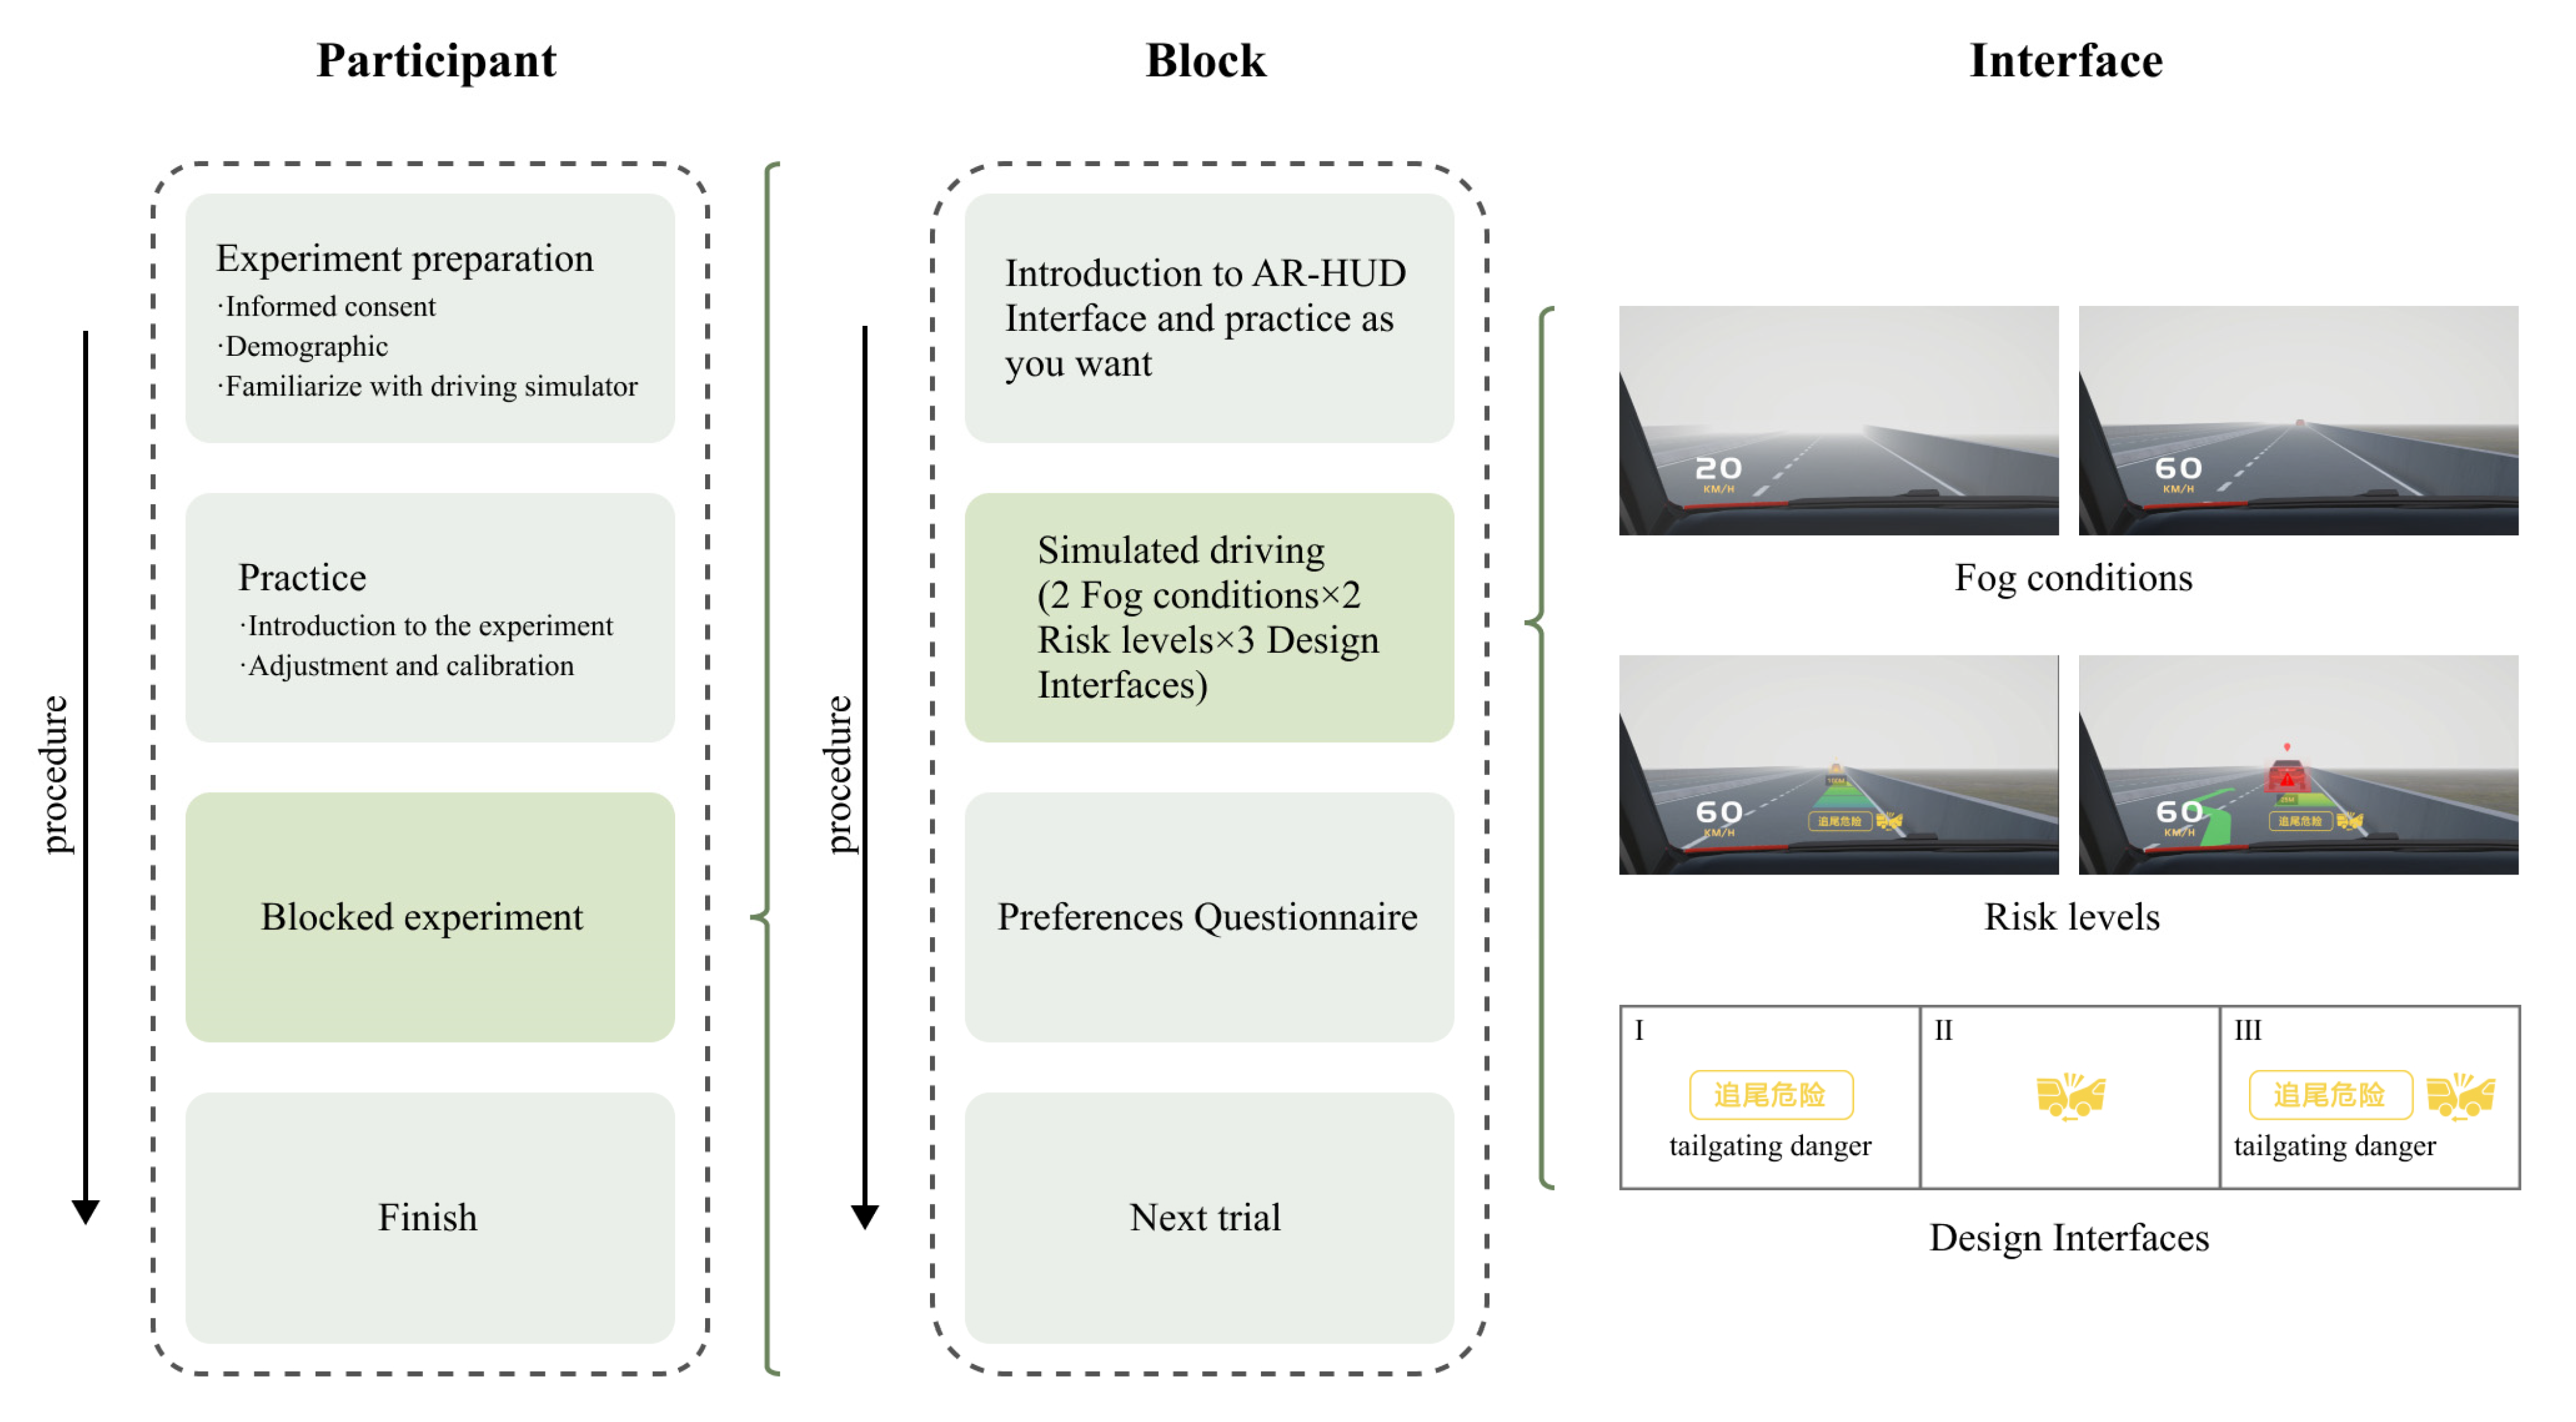
Before the formal experiment begins, participants are required to complete a practice session. This phase has no time limits or specific requirements, and its main purpose is to help participants adjust their seats for comfort and to become familiar with both the operation of the driving simulator and the symbols and text presented on the interface. During the pre-experiment stage, participants are asked to fill out basic information, including the experiment number, name, age, and gender. Afterward, they will read the experimental instructions to understand the tasks and procedures. Once the formal experiment begins, twelve scenarios will be randomly assigned to participants, and the entire experiment is expected to last around 30 to 45 min. After each driving task, participants are asked to complete a 5-point Likert scale questionnaire.
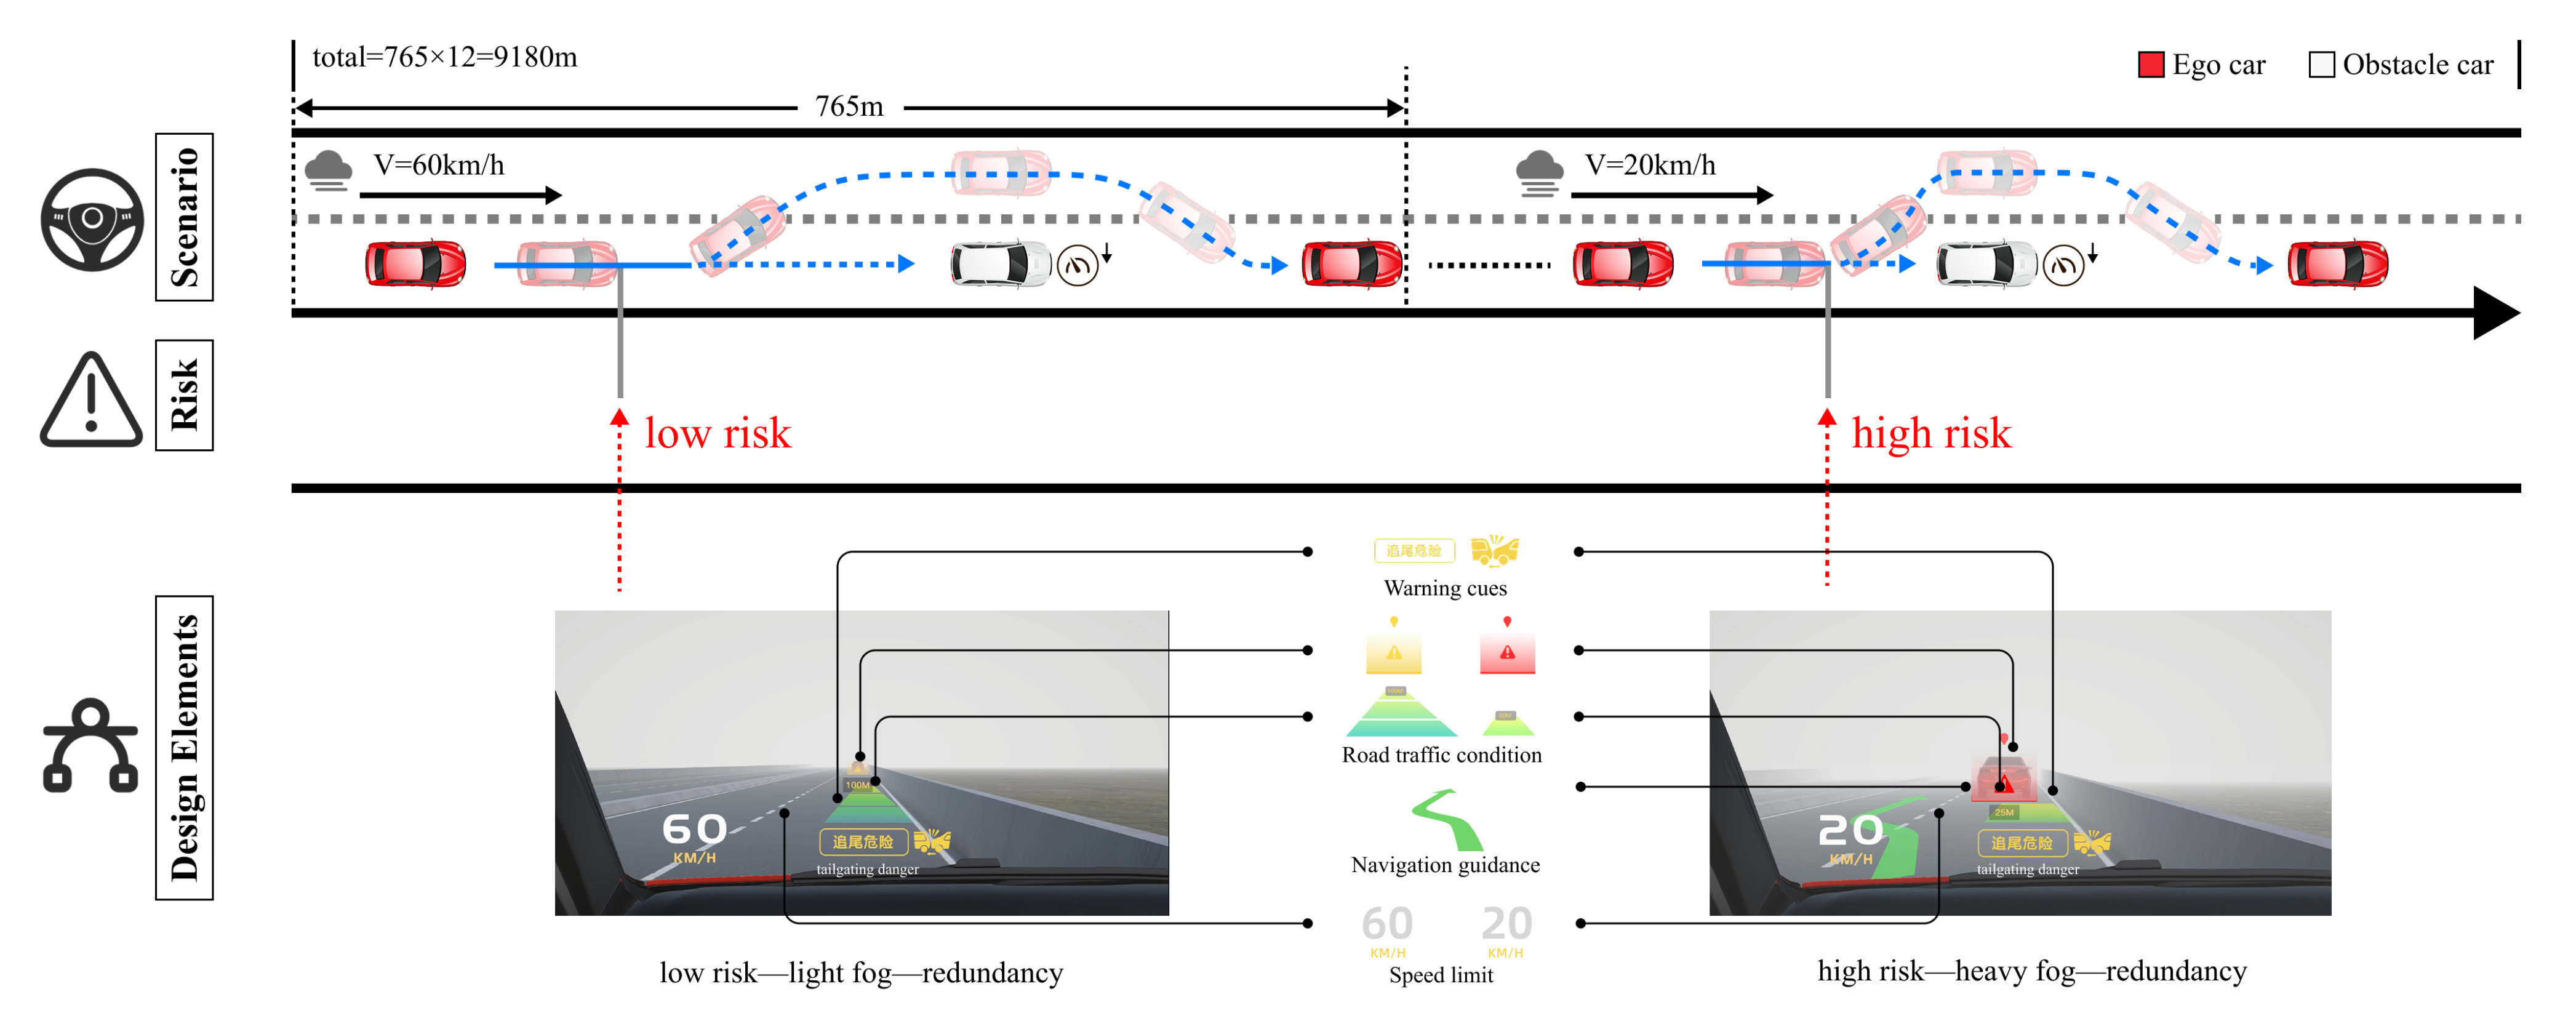
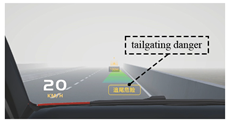
The formal experiment simulates a car-following task, as shown in Figure 2 and Figure 3. The scenario is set on a two-lane highway, where participants must drive in the outer lane (slow lane) while weather conditions transition from clear to foggy. In clear weather, the obstacle vehicle travels at 120 km/h ahead of the participant’s vehicle. According to traffic regulations, when visibility is reduced to 200 m (e.g., in light fog), the obstacle vehicle slows down to 60 km/h. When visibility drops to 50 m (e.g., in heavy fog), the obstacle vehicle slows to 20 km/h. As soon as the collision hazard is resolved, the ego vehicle will return to the original lane and continue the car-following task, repeating the process until the experiment is completed. The experimental procedure for an individual participant is illustrated in Figure 3.

Figure 2.
Experimental procedure.

Figure 3.
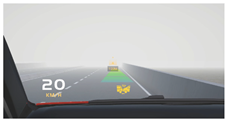
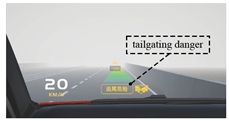
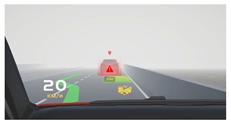
The driving scenario and AR-HUD’s interface design.
3.3.2. AR-HUD Interface Design
In previous studies [,,], different elements of AR-HUD information were designed, including warning cues, road traffic conditions, weather conditions, forward collision warnings, navigation guidance, and speed limits through text, color, and images. This study utilized Adobe Photoshop and Illustrator to design this information, while Unity was employed to dynamically project the interface onto the windshield and record all data.
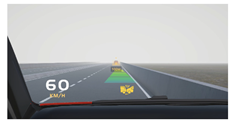
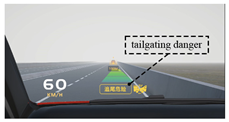
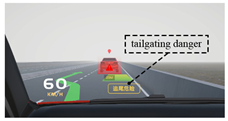
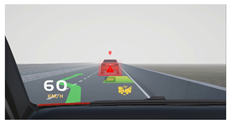
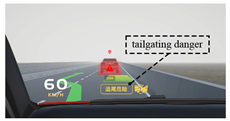
The AR-HUD’s interface was categorized into four conditions based on varying risk levels and weather conditions. Under low-risk conditions, the information on road traffic conditions and warning messages were displayed, while under high-risk conditions, warning messages were featured along with decision-supporting information. Table 2 illustrates the twelve types of interface designs corresponding to these conditions.
- Condition 1: Light fog with low risk

Table 2.
Interfaces of AR-HUD.
In Condition 1, the weather was light fog. The displayed speed limit was 60 km/h. The distance display area consisted of three wide segments, with the end of the segment labeled “200 m.” When the distance between the two vehicles was reduced to 100 m, the FCW appeared on the front windshield.
- Condition 2: Light fog with high risk
In Condition 2, the weather was characterized by light fog, and the speed was still 60 km/h. The interface displayed distance information, the speed limit, and more. The distance display area consisted of three wide segments, with the last segment labeled 200 m. Once the obstacle vehicle was within 200 m, the display showed the actual distance between the participant’s vehicle and the lead vehicle. When the distance between the two cars was reduced to 100 m, the FCW appeared on the front windshield. The obstacle vehicle was highlighted with a red shade and accompanied by navigation guidance information.
- Condition 3: Heavy fog with low risk
In Condition 3, the weather involved heavy fog and the speed was 20 km/h. The interface was similar to Condition 1. It’s worth noting that due to the dense fog the obstacle vehicle was not visible when it was beyond 200 m. Although the AR-HUD’s HMI provided warning information, the obstacle vehicle remained out of sight under this condition. Drivers rely solely on the information provided by the AR-HUD to anticipate the road conditions ahead.
- Condition 4: Heavy fog with high risk
In Condition 4, the weather was characterized by heavy fog and the speed was 20 km/h. The interface was similar to Condition 2, which provided distance information, warning alerts, speed information, and navigation route guidance.
4. Results
Data analyses were conducted using IBM SPSS Statistics version 25.0 (IBM Corporation, Armonk, NY, USA), with statistical significance defined at the threshold of p < 0.05. Graphical representations were generated using GraphPad Prism version 10.0 for Windows (GraphPad Software, Inc., La Jolla, CA, USA). A non-normal distribution was observed within certain participant groups, necessitating applying the Mann–Whitney U test and Kruskal-Smirnov (K-S) H test to assess the statistical differences. In this study, the mean and median values are frequently used for analysis, where M represents the mean value and Md represents the median value. The units for reaction time and time to the collision are seconds (s), while the acceleration is measured in meters per second squared (m/s2).
To streamline the presentation, this section focuses exclusively on the statistically significant findings (p < 0.05). The results are presented in Table 3, Table 4, Table 5, Table 6 and Table 7.
4.1. Driving Performance
4.1.1. Reaction Time
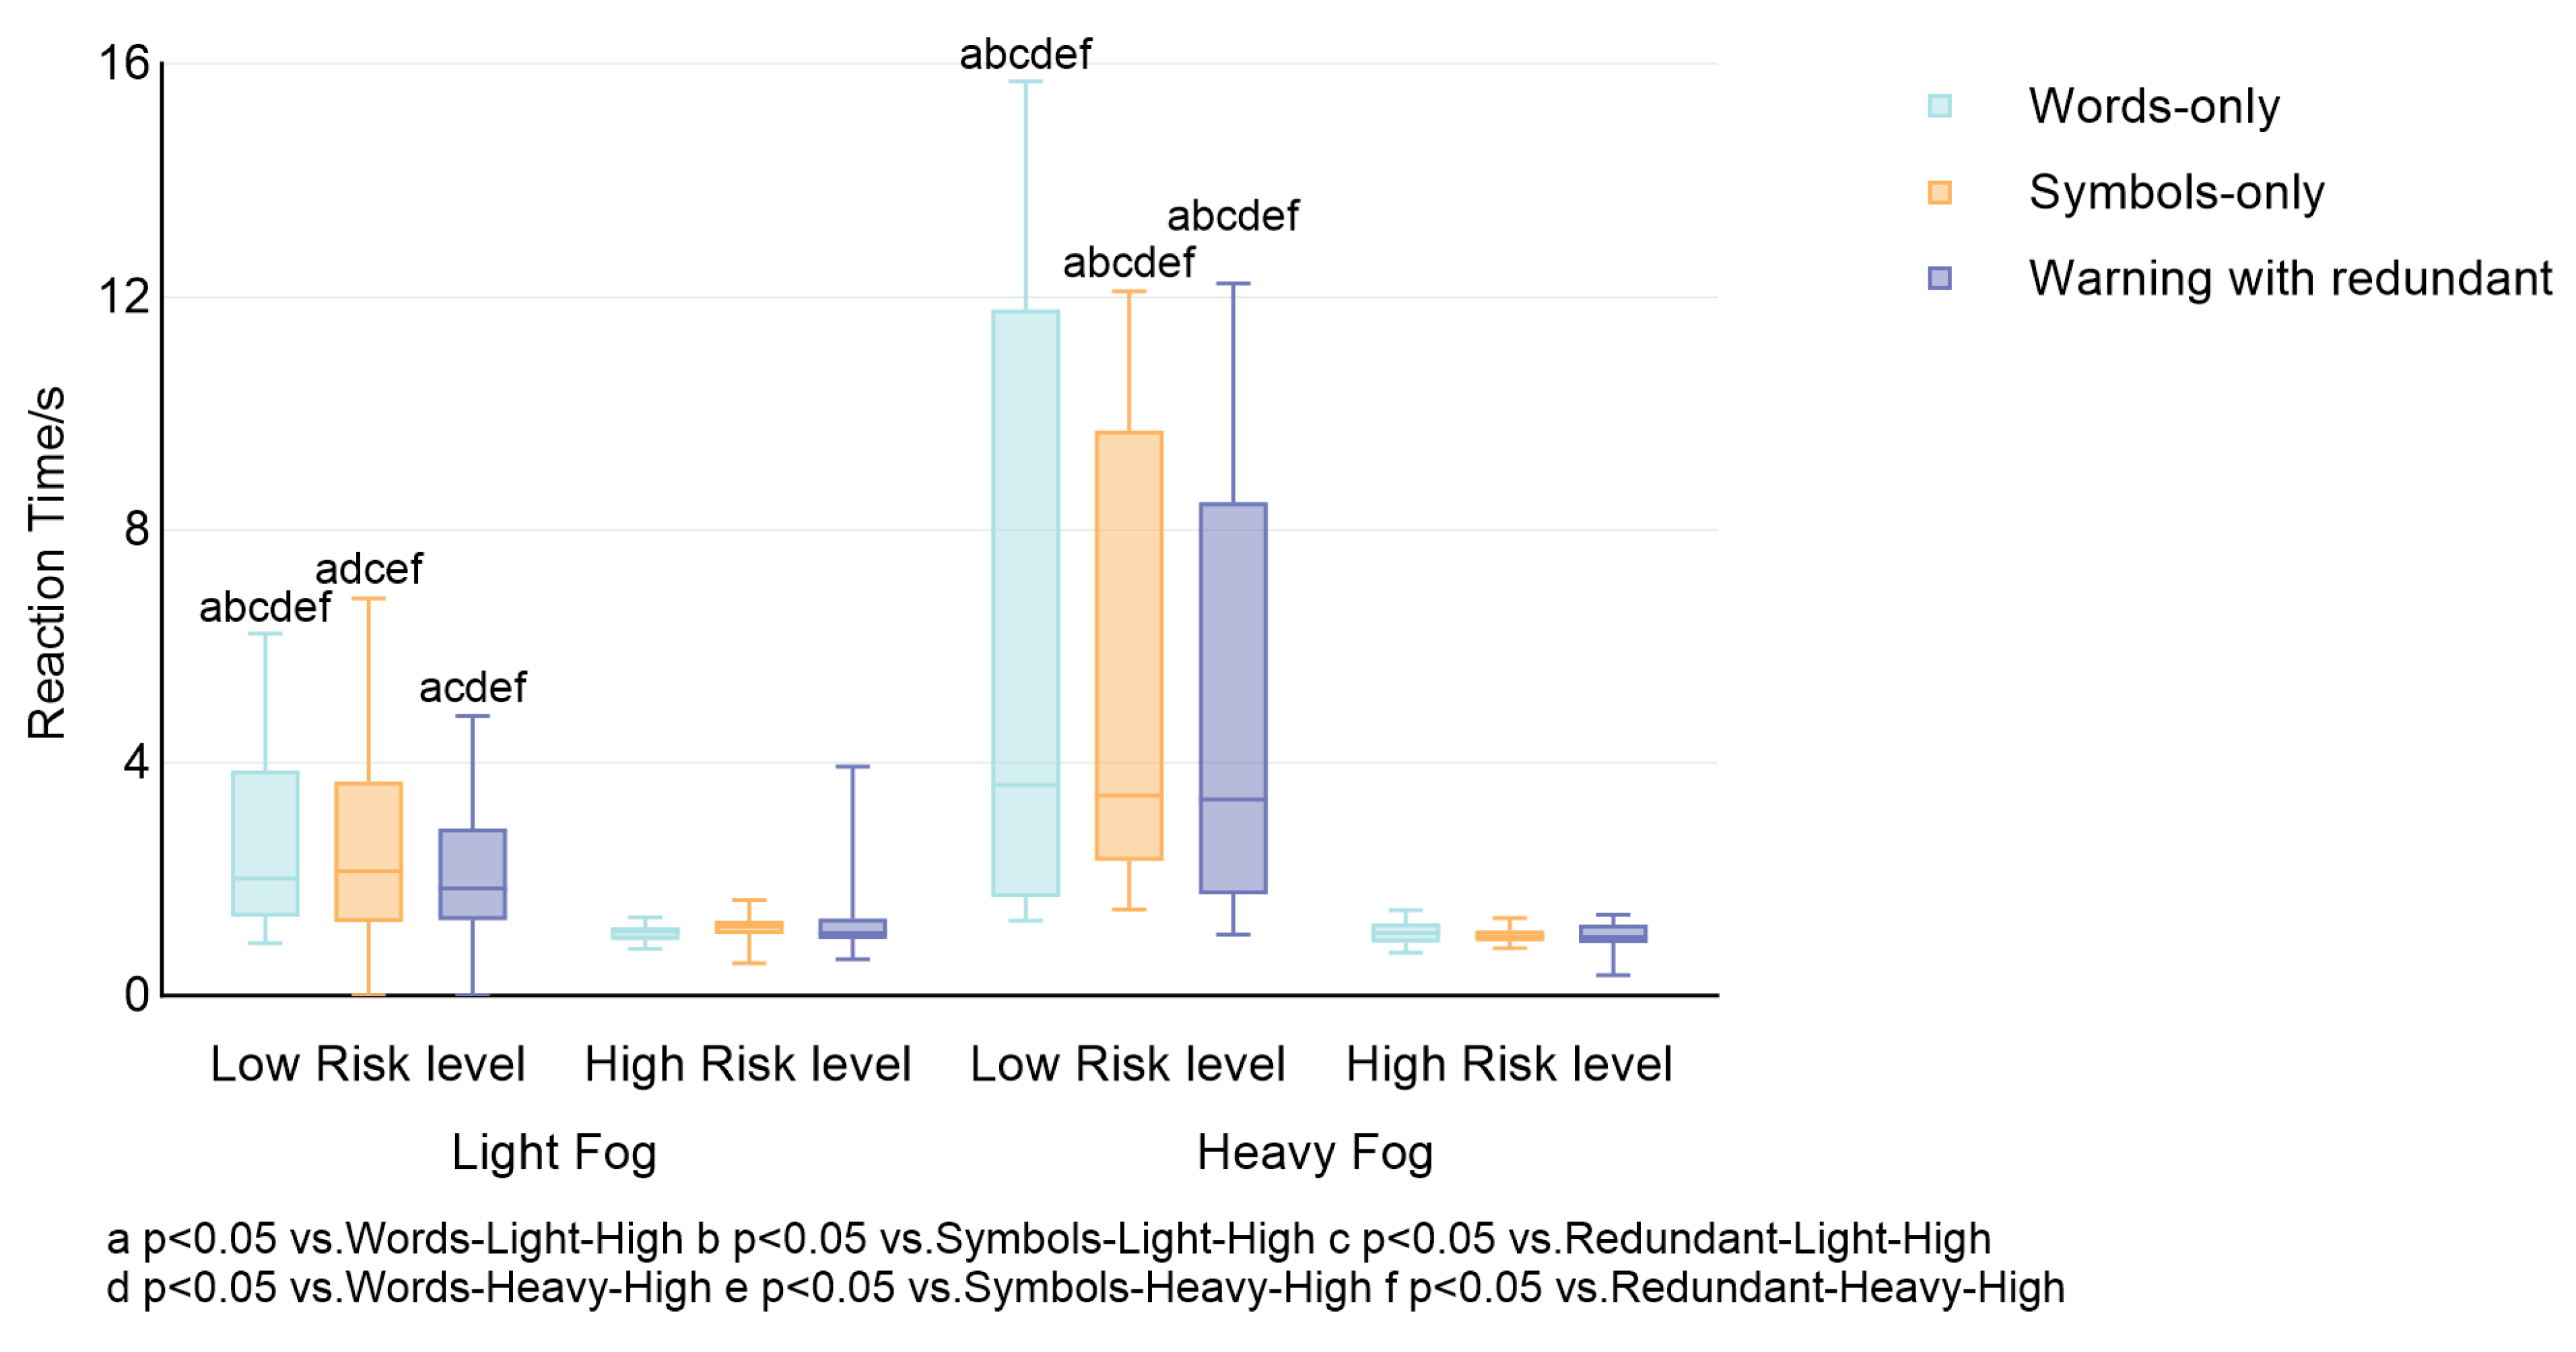
Table 3 illustrates the impact of different interfaces (words-only, symbols-only, redundant warnings) of the in-vehicle AR-HUD on the driver’s reaction time under varying fog conditions (light fog and heavy fog) and risk levels (low risk and high risk). The Mann–Whitney U test showed that drivers’ RT was significantly longer under low-risk conditions compared to high-risk conditions (Mdlow = 2.540, Mdhigh = 1.080, p < 0.05), and this difference was statistically significant. However, there was no significant difference between fog conditions, and the effect of design elements was not significant.
From the mean value of RT, compared to the heavy fog, participants responded faster to the information in the light fog scenario (Mlight = 1.779, Mheavy = 3.522). Participants responded fastest to icons-only (M = 2.525), followed by redundant (icons + words, M = 2.632), and slowest to words-only (M = 2.795). The K-S test was conducted. The results revealed that, under light fog conditions, there were significant differences between low-risk and high-risk scenarios for words-only (Mdlow = 2.020, Mdhigh = 1.110, H = 115.923, p < 0.05) and redundant interfaces (Mdlow = 1.910, Mdhigh = 1.075, H = 93.077, p < 0.05), while no significant difference was observed for symbols-only displays. Under heavy fog conditions, significant differences were found between low-risk and high-risk scenarios for the words-only interface (Mdlow = 3.615, Mdhigh = 1.075, H = 160.442, p < 0.05), symbol-only interface (Mdlow = 3.410, Mdhigh = 1.010, H = 173.096, p < 0.05), and redundant interface (Mdlow = 4.545, Mdhigh = 1.015, H = 170.308, p < 0.05), as shown in Figure 4.

Figure 4.
Percentage distribution of reaction time of subjects in the 12 conditions.
The results indicate that under heavy fog conditions, all three interfaces -words, symbols, and redundant- significantly influence RT across different risk levels. Under light fog conditions, word-based interfaces—words, words + symbols—significantly influence RT across different risk levels. In contrast, the symbols-only interface did not have a significant effect on RT under light fog conditions. Furthermore, regardless of whether the conditions are light fog or heavy, RT in low-risk scenarios is markedly longer than in high-risk scenarios. Based on the subsequent data on time-to-collision (TTC) and the following data on acceleration, Hypothesis 1 was supported. This suggests that responses and actions may be slower in low-risk situations and faster in high-risk situations.

Table 3.
K-S test of RT for three interfaces in different weather conditions and different risk levels.
Table 3.
K-S test of RT for three interfaces in different weather conditions and different risk levels.
Interfaces | Fog | Risk Levels | Median | Z | H | p |
---|---|---|---|---|---|---|
Words-only | Light | Low | 2.020 | 2.758 | 115.923 | 0.000 |
High | 1.110 | −4.086 | ||||
Heavy | Low | 3.615 | 5.555 | 160.442 | 0.000 | |
High | 1.075 | −3.917 | ||||
Symbols-only | Light | Low | 2.140 | 1.965 | 72.808 | 0.238 |
High | 1.190 | −2.333 | ||||
Heavy | Low | 3.410 | 5.261 | 173.096 | 0.000 | |
High | 1.010 | −4.958 | ||||
Words + Symbols | Light | Low | 1.910 | 2.019 | 93.077 | 0.013 |
High | 1.075 | −3.476 | ||||
Heavy | Low | 4.545 | 5.633 | 170.308 | 0.000 | |
High | 1.015 | −4.421 |
4.1.2. Time to Collision
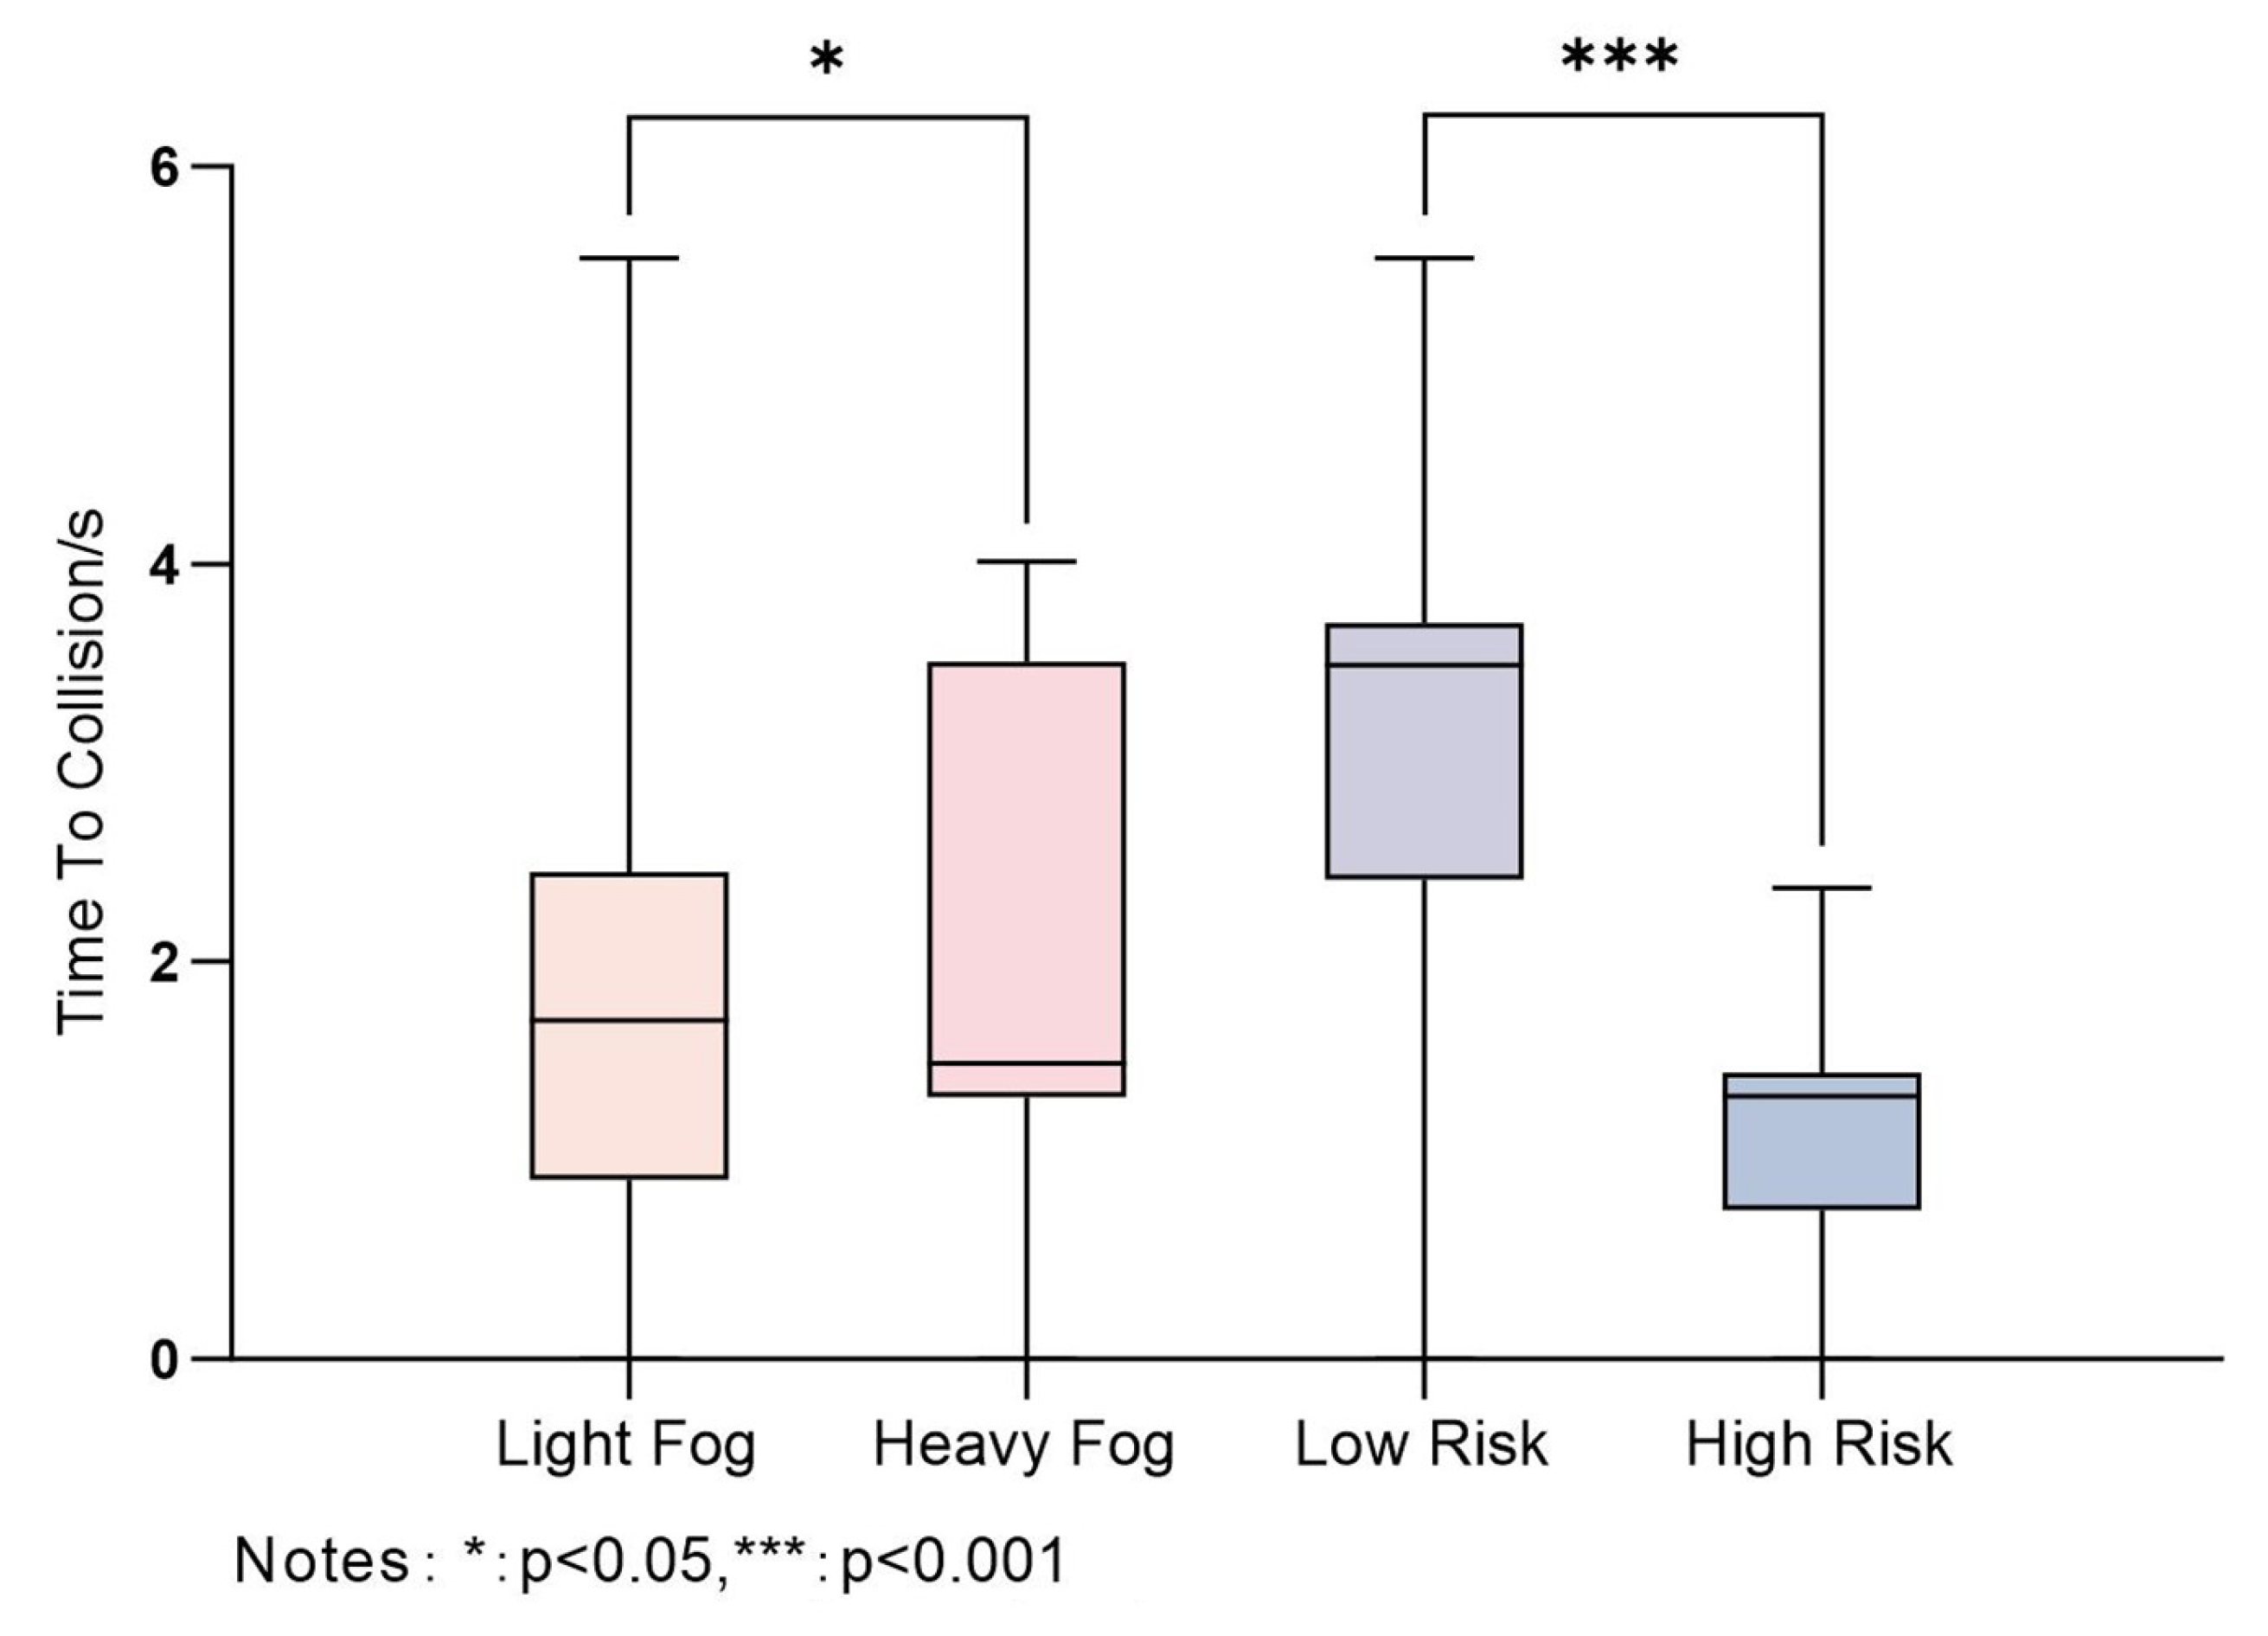
We used the Mann–Whitney U test to determine whether there is a difference between light and heavy fog conditions, and between low- and high-risk levels. The result showed a statistically significant difference between the two risk levels (Mdhigh = 1.325, Mdlow = 3.490, p < 0.001). Additionally, there was a difference between fog conditions (Mdlight = 1.705, Mdheavy = 1.490, p < 0.05), see Table 4 and Figure 5.

Table 4.
M–W test of Time to Collision in different weather conditions and different risk levels.
Table 4.
M–W test of Time to Collision in different weather conditions and different risk levels.
Independent | levels | Median | Z | p | η2 |
---|---|---|---|---|---|
Fog | Light | 1.705 (0.905, 2.447) | −2.074 | 0.038 | 0.017 |
Heavy | 1.490 (1.320, 3.510) | ||||
Risk levels | low | 3.490 (2.412, 3.702) | −12.167 | 0.000 | 0.506 |
high | 1.325 (0.752, 1.440) |

Figure 5.
Box plot of TTC.
In terms of the specific interfaces, the shortest TTC was observed with symbol-based (M = 2.048), followed by words + symbols (M = 2.088), and words-only (M = 2.091), though the differences were not statistically significant. The K-S test was conducted, see Table 5 and Figure 6. The results revealed that, under light fog conditions, there were significant differences between low-risk and high-risk scenarios for words only (Mdlow = 2.515, Mdhigh = 1.455, H = 96.192, p < 0.05) and symbols only (Mdlow = 2.440, Mdhigh = 0.981, H = 95.615, p < 0.05), while no significant difference was observed for redundant interfaces. Under heavy fog conditions, significant differences were found between low-risk and high-risk scenarios for words-based interfaces (Mdlow = 3.515, Mdhigh = 1.320, H = 149.558, p < 0.05), symbol-based interfaces (Mdlow = 3.510, Mdhigh = 1.335, H = 157.25, p < 0.05), and redundant interfaces (Mdlow = 3.510, Mdhigh = 1.265, H = 173.173, p < 0.05).

Figure 6.
Percentage distribution of TTC of subjects in the 12 conditions.
The results showed that under light fog conditions, words-only and symbols-only interfaces significantly impact TTC across different risk levels, while the redundant interfaces did not have a significant effect. Under heavy fog conditions, significant differences were found between low-risk and high-risk scenarios for three interfaces. Furthermore, there was a significant difference between fog conditions. In heavy fog, the TTC is longer, suggesting that drivers have more time to avoid a collision. Conversely, in light fog conditions, the risk of collision is higher despite relatively high visibility. Hypothesis 2 is supported, too.

Table 5.
K-S test of TTC for three interfaces in different weather conditions and different risk levels.
Table 5.
K-S test of TTC for three interfaces in different weather conditions and different risk levels.
Interfaces | Fog | Risk Levels | Median | Z | H | p |
---|---|---|---|---|---|---|
Words only | Light | Low | 2.515 | 3.044 | 96.192 | 0.008 |
High | 1.455 | −2.635 | ||||
Heavy | Low | 3.515 | 4.598 | 149.558 | 0.000 | |
High | 1.320 | −4.231 | ||||
Symbols only | Light | Low | 2.440 | 1.497 | 95.615 | 0.009 |
High | 0.981 | −4.147 | ||||
Heavy | Low | 3.510 | 5.621 | 157.25 | 0.000 | |
High | 1.335 | −3.663 | ||||
Words + Symbols | Light | Low | 2.445 | 1.423 | 73.788 | 0.210 |
High | 1.355 | −2.934 | ||||
Heavy | Low | 3.510 | 5.825 | 173.173 | 0.000 | |
High | 1.265 | −4.398 |
4.1.3. Maximum Lateral Acceleration
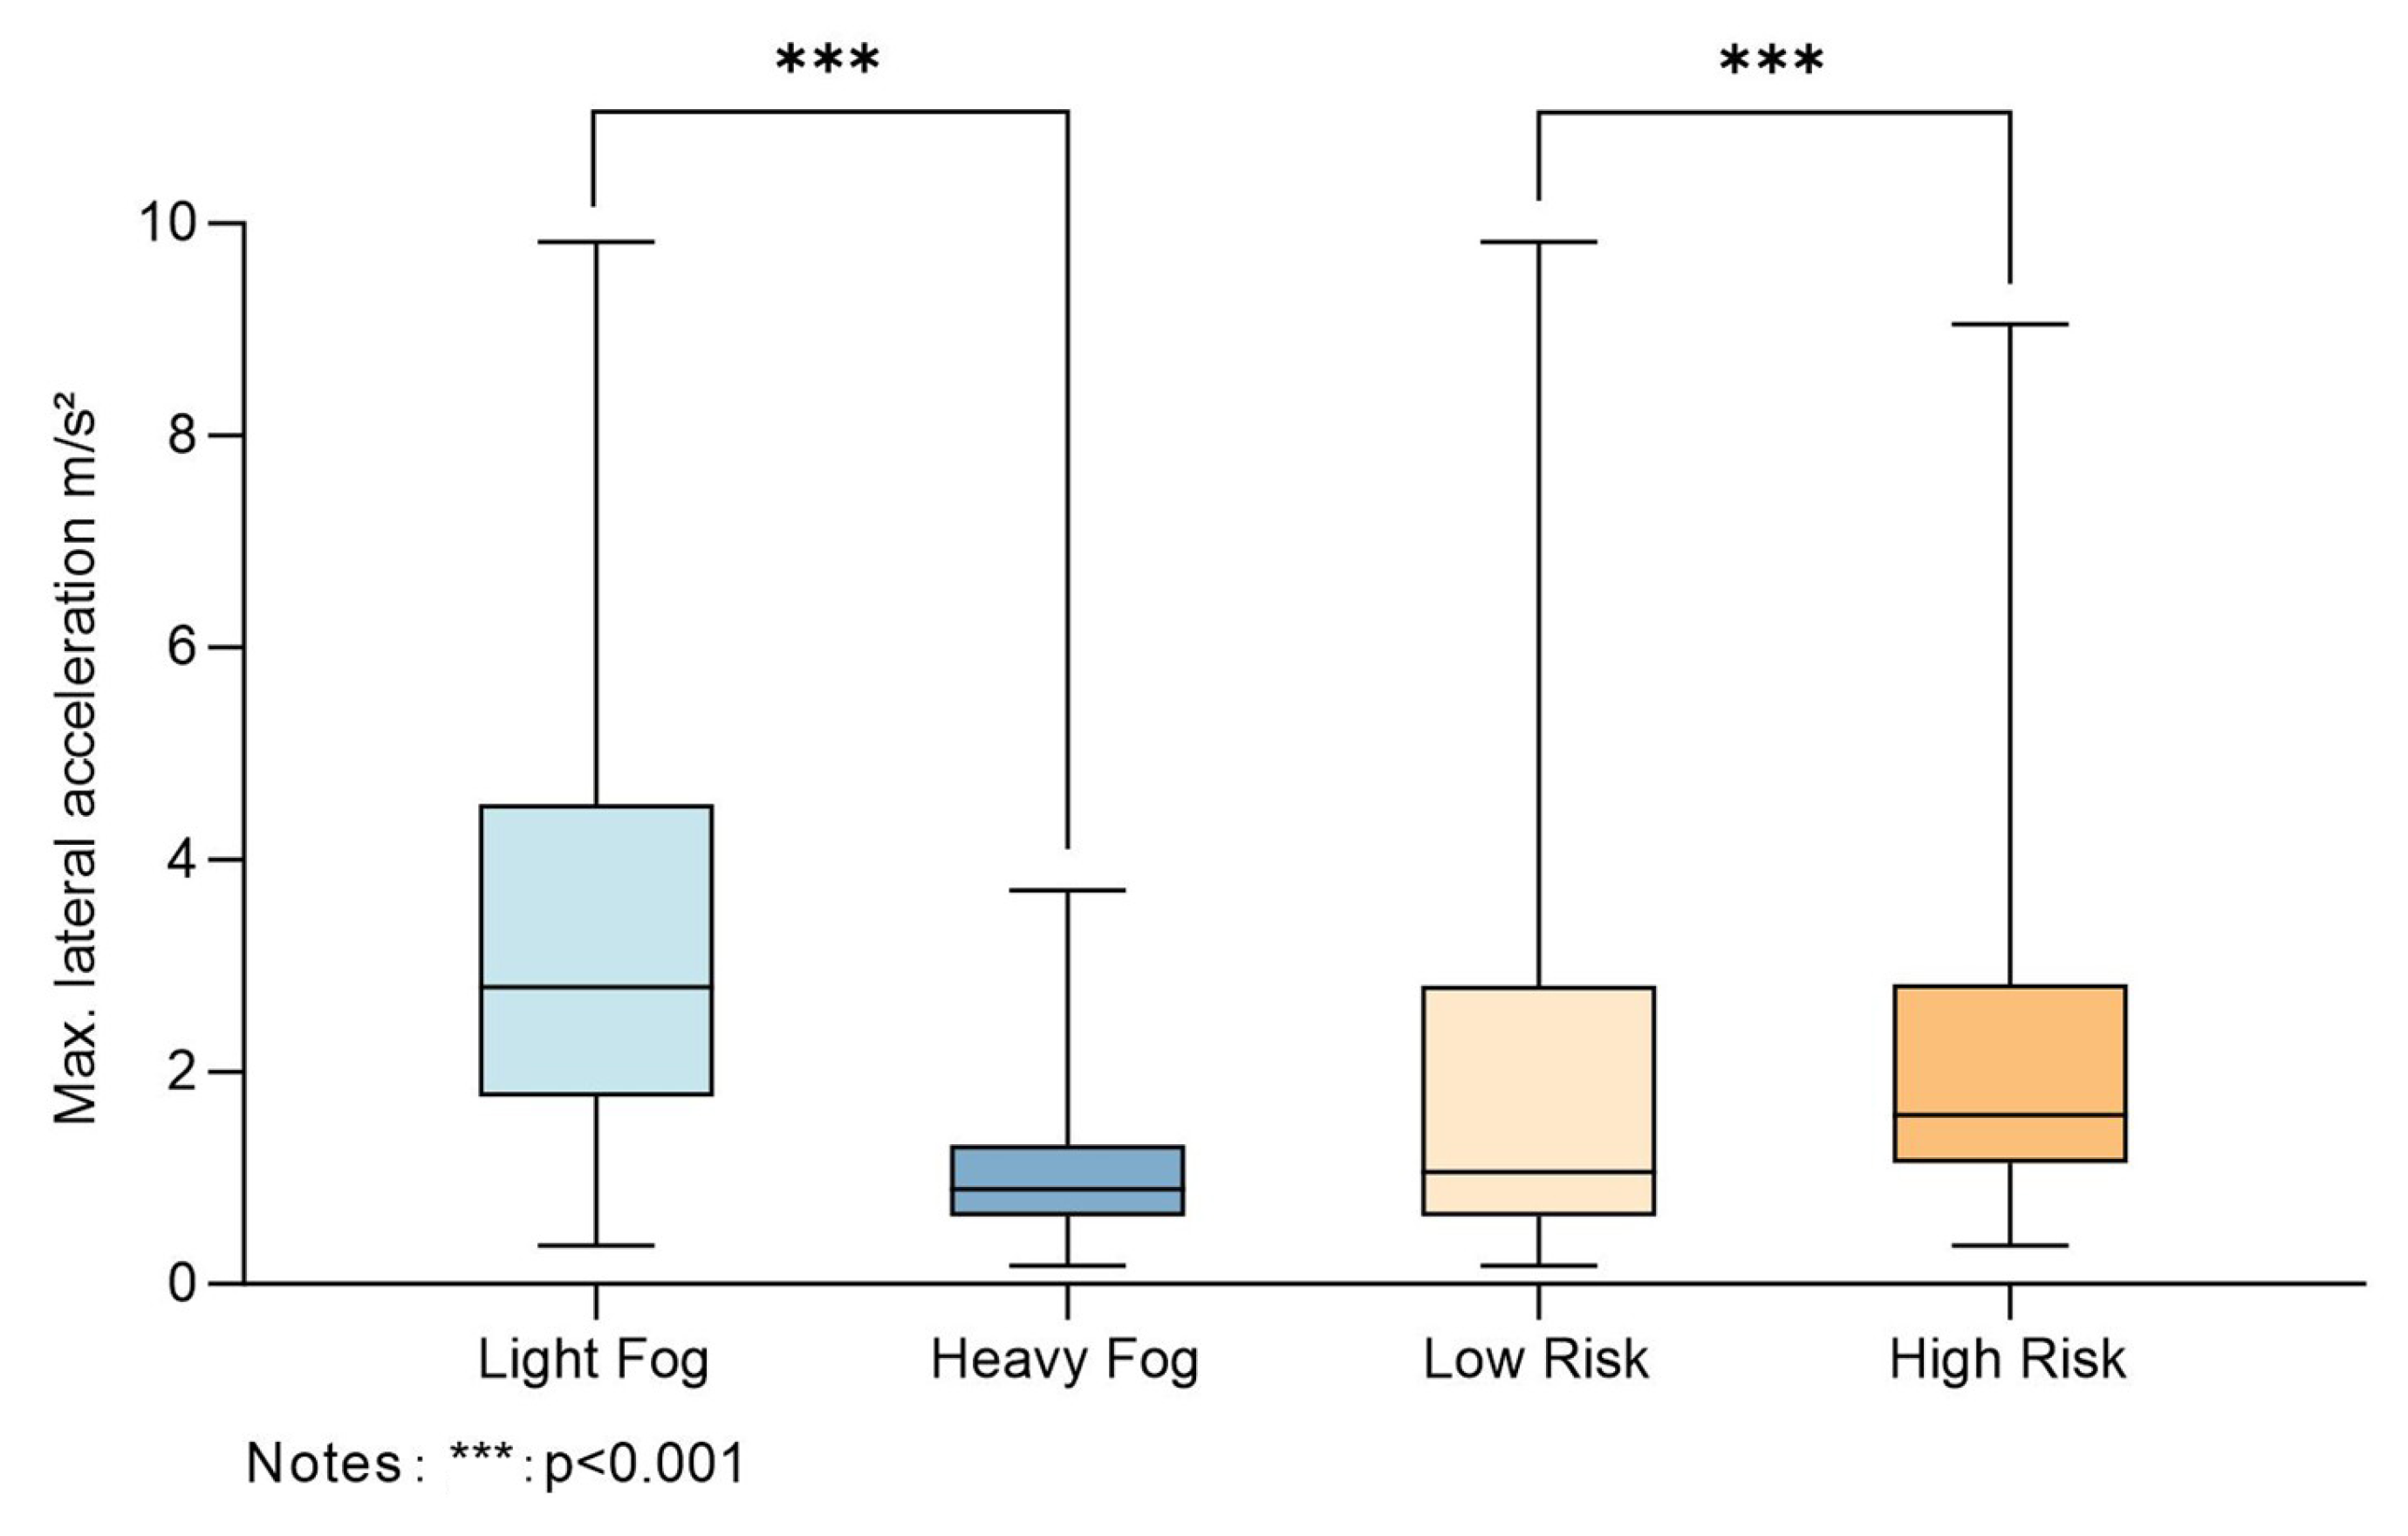
Figure 7 and Figure 8 illustrate the effects of various AR-HUD interfaces (words-only, symbols-only, redundant interfaces) on maximum lateral acceleration under different fog conditions (light fog and heavy fog) and risk levels (low risk and high risk). Compared to low-risk levels, the median value of maximum lateral acceleration was significantly greater under high-risk levels. The M-W test revealed a statistically significant difference between the two risk levels (Mdhigh = 1.59, Mdlow = 1.055, p < 0.001). Regardless of the risk levels, the maximum lateral acceleration is higher in light fog than in heavy fog, with a statistically significant difference (Mdlight = 2.800, Mdheavy = 0.890, p < 0.001), see Table 6. Among the three interfaces, the redundant interfaces result in the highest maximum lateral acceleration (M = 2.406), followed by symbols-only (M = 2.107), and words-only (M = 1.964), though the differences were not statistically significant.

Table 6.
M–W test of Maximum lateral acceleration in different weather conditions and different risk levels.
Table 6.
M–W test of Maximum lateral acceleration in different weather conditions and different risk levels.
Independent | Levels | Median | Z | p | η2 |
---|---|---|---|---|---|
Fog | Light | 2.800 (1.770, 4.517) | −12.589 | 0.000 | 0.363 |
Heavy | 0.890 (0.640, 1.307) | ||||
Risk levels | low | 1.055 (0.640, 2.810) | −4.226 | 0.000 | 0.014 |
high | 1.590 (1.142, 2.827) |

Figure 7.
Box plot of the Maximum lateral acceleration.

Figure 8.
Percentage distribution of maximum lateral acceleration of subjects in different weather conditions and different risk levels.
4.1.4. Maximum Longitudinal Acceleration
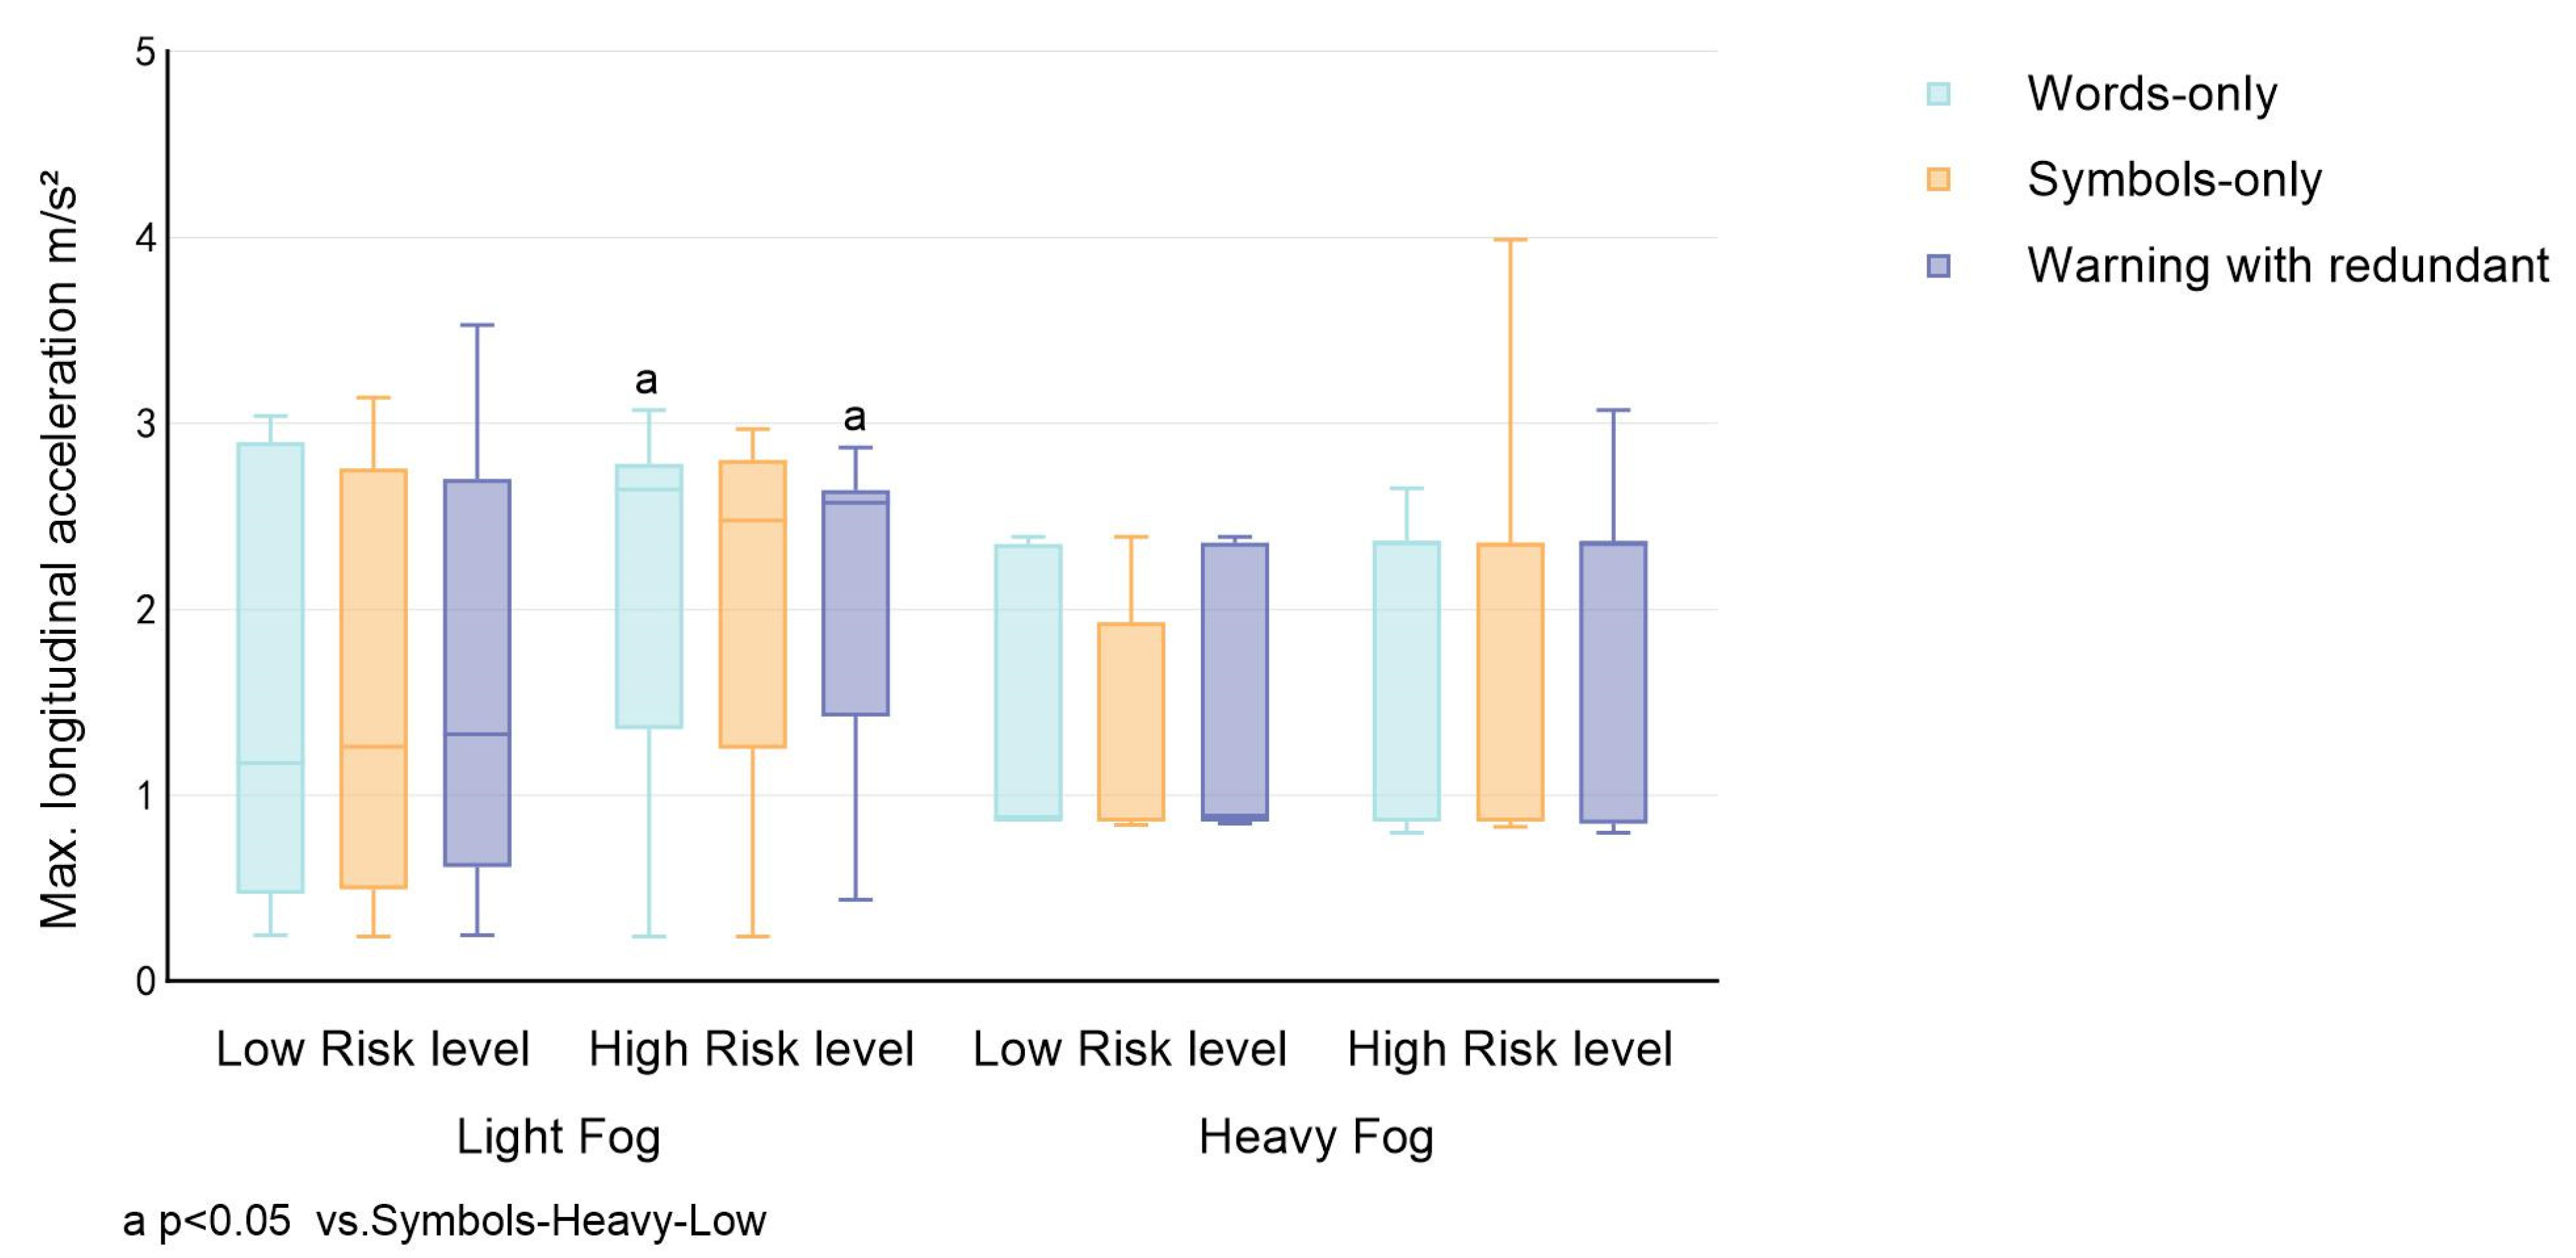
Figure 9 displayed the percentage distribution of maximum longitudinal acceleration of the AR-HUD interfaces (words-only, symbols-only, redundant interfaces) across various fog conditions and risk levels. The M-W test results indicated that the median value of maximum longitudinal acceleration recorded under high-risk levels is significantly greater than that under low-risk levels, with a statistically significant difference (Mdhigh = 2.36, Mdlow = 0.91, p < 0.05). In terms of the three interfaces, the combination of words and symbols (warning with redundant) resulted in the highest maximum acceleration (1.750), followed by words-only (1.712), with symbols-only yielding the lowest value (1.646), but the effect of different interfaces on maximum longitudinal acceleration did not reach a statistically significant difference.

Figure 9.
Percentage distribution of maximum longitudinal acceleration of subjects in different weather conditions and different risk levels.
4.2. User’s Preferences
4.2.1. Usability
The SUS scores showed that all twelve HUD interfaces were rated with a score above 68, which based on the SUS [], indicates above-average perceived usability. A three-way analysis of variance (ANOVA) was conducted with fog conditions, risk levels, and interfaces as independent variables, and SUS’s score as dependent variables. The results showed that the interface types had a main effect [F(1, 311) = 12.306, p < 0.001]. When compared, the analysis showed that the redundant interfaces result in the highest scores (M ± SD = 74.976 ± 6.246), followed by words-only (M ± SD = 72.332 ± 6.341), and symbols-only (M ± SD = 71.058 ± 5.483). The interaction between risk levels and interface types was also significant [F(2, 311) = 10.181, p < 0.001]. There was a statistically significant three-way interaction among fog conditions, risk levels, and interfaces [F(2, 311) = 3.248, p < 0.05]. The detailed results are shown in Table 7.

Table 7.
Effects on interface’s usability.
Table 7.
Effects on interface’s usability.
Sources of Variation | F Value | η2 |
---|---|---|
Risk Levels (RL) | 0.769 | 0.003 |
Fog Conditions (FC) | 3.427 | 0.011 |
Interfaces of AR-HUD (AR) | 12.306 *** | 0.076 |
RL × FC | 0.009 | 0.000 |
RL × AR | 10.181 *** | 0.064 |
FC × AR | 1.172 | 0.008 |
RL × FC × AR | 3.248 * | 0.021 |
Note. * p < 0.05; *** p < 0.001.
Simple effects test analyses found that under the light fog and low-risk conditions, there are significant differences between the icons-only interface and the words-only interface (Micon = 69.615, Mword = 73.629, p < 0.05). Additionally, the icons-only interface significantly differs from the redundant interface (Micon = 69.615, Mredundant = 72.692, p < 0.05). Under light fog and high-risk conditions, the redundant interface shows significant differences compared to both the icon-only interface (Mredundant = 75, Mwords = 71.538, p < 0.05) and the text-only interface (Mredundant = 75, Micons = 70.961, p < 0.05). These significant differences are also observed under heavy fog conditions. The usability results indicate that under high-risk conditions, whether in light fog or heavy fog, participants consistently perceived the redundant interface as having higher usability and demonstrated significant design robustness. This robustness not only improves the reliability of information transmission but also enhances drivers’ trust in the interface design.
4.2.2. Personal Preference
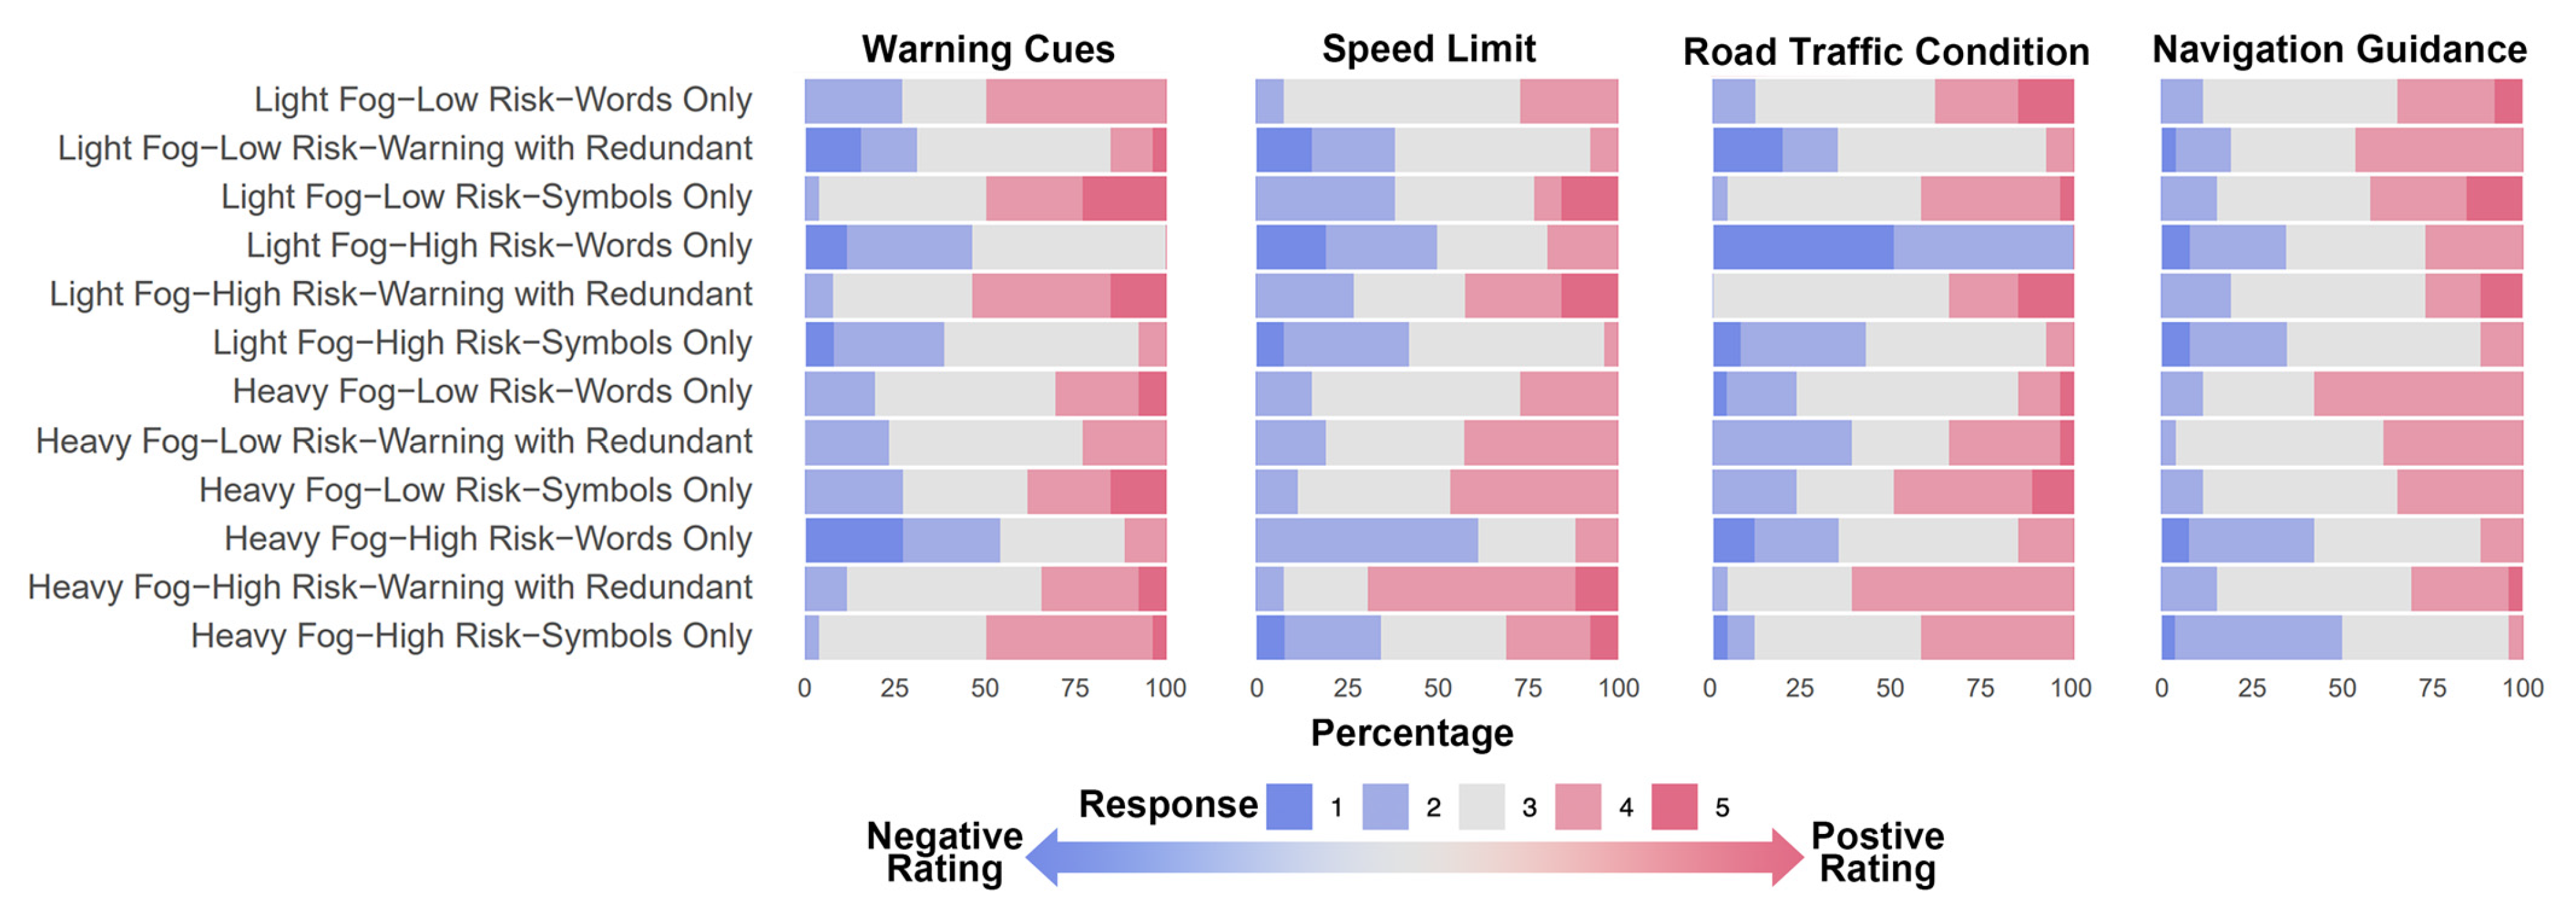
For a more comprehensive visual presentation, Figure 10 presents the scores obtained for the information that appeared in this study. Diverging stacked bar charts plot the results of PPQ. This type of chart is recommended for presenting Likert scale results by Richard and Robbins []. Among the warning message designs, subjects preferred the redundant design, especially in high-risk situations. In heavy fog and high-risk conditions, the percentage of the high-rating group was approximately 35%, while in the light fog and high-risk conditions, the percentage of the high-rating group was about 50%.

Figure 10.
PPQ scores for information that appeared in AR-HUD.
Subsequent ANOVA analysis of the three interfaces revealed that the redundant interface achieved the highest overall preference scores, with statistically significant differences compared to the other two interfaces.
5. Discussion
5.1. Summary of Main Findings
This study investigates the effects of different design elements (words only, symbols only, and prompt with redundant) in a vehicular AR-HUD system on drivers’ reaction time, time to collision, maximum longitudinal acceleration, and the maximum lateral acceleration under various foggy conditions (light fog and heavy fog) and risk levels (low and high). Additionally, we collected subjective data from participants through questionnaires, including their evaluations of interface usability and personal preferences.
Previous studies have demonstrated that under conditions of limited visibility, drivers’ RT for identifying road signs, other vehicles, and potential obstacles increases, thereby elevating the risk of collisions []. Data analysis showed that participants’ reaction time (RT) did not differ significantly between light fog and heavy fog conditions. In contrast, time to collision (TTC) demonstrated a significant difference, with TTC values being longer under heavy fog conditions compared to light fog. We inferred that, unlike results reported in previous studies, this discrepancy can be primarily attributed to the introduction of the AR-HUD system in our experiment. The AR-HUD allowed drivers to detect potential hazards earlier. These findings suggest that drivers’ reactions to information provided by the AR-HUD were consistent. Drivers may perceive a higher risk of collision under heavy fog conditions and, consequently, keep vigilance, adopting more cautious driving behaviors. These behaviors include increased focus on both the AR-HUD and road information to compensate for the reduced visual input, thus preventing collision risks through effective responses. Similar results were observed in analyses involving different risk levels. Reaction time in low-risk scenarios was generally longer compared to high-risk scenarios, potentially due to a lower perceived sense of urgency. Conversely, in high-risk scenarios, RT was significantly shorter, indicating that drivers are more inclined to take immediate action when perceiving higher risk to avoid potential collisions. These findings align with risk perception theory [,], which suggests that drivers instinctively enhance their alertness and reduce their reaction time when they perceive increased risk. This discovery emphasizes the need to account for behavioral variations across different risk scenarios when designing in-vehicle alert systems, particularly those that involve safety warnings.
Under heavy fog conditions, significant differences were observed in RT and TTC for the three interfaces across different risk levels. Notably, results under light fog conditions further highlighted that the variation in risk levels significantly impacted participants’ processing of text-based interfaces, such as words-only and words + symbols. Participants exhibited faster when responding to text-related interfaces. We infer that these types of information facilitated rapid response due to their inclusion of specific instructions and content in participants’ native language. In contrast, icons did not show significant differences in RT across risk levels, likely because the cognitive load imposed by icons remained consistent regardless of risk level. This finding aligns with existing research emphasizing symbolic information’s intuitive and concise nature. In light fog scenarios, there were significant differences in TTC when using word-only or symbol-only interfaces at different risk levels. However, the redundant interface combining text and symbols did not show substantial differences. This result suggests that redundant interfaces have higher stability. These findings are consistent with multichannel processing theory, which states that individuals can access and process information more efficiently when it is delivered through multiple perceptual channels (e.g., visual text and symbols). Even when the level of risk increases, such redundant interfaces, by providing dual cues, help to reduce cognitive load, increase comprehensibility, and improve the robustness and stability of the information provided.
Under high-risk conditions, both the maximum longitudinal and lateral accelerations were significantly larger than those observed in low-risk conditions. This suggested that when drivers perceive greater risk, they may adopt more assertive and decisive driving behaviors, such as sharper steering, acceleration, or deceleration, to reduce the potential for collisions. This finding aligns with our expectations that drivers in high-risk environments must respond quickly to potential emergencies, leading to increased longitudinal and lateral vehicle accelerations. Such reactions can be interpreted as instinctive actions by the driver to avoid collisions or mitigate the consequences of accidents through rapid vehicle control. This is consistent with existing research, which indicates that drivers exhibit more aggressive handling behaviors in high-risk situations. Moreover, the maximum lateral acceleration under light fog conditions was significantly larger than that under heavy fog, indicating that reduced visibility has a notable impact on driving behavior. In heavy fog, poor visibility may prompt drivers to slow down and minimize abrupt maneuvers, such as sharp turns, to ensure safety. In contrast, under light fog conditions, although visibility is somewhat reduced, drivers maintain a certain level of confidence and tend to respond more quickly, resulting in higher values of lateral accelerations.
Although the various interfaces did not exhibit statistically significant differences in their effects on reaction time, time to collision (TTC), maximum longitudinal acceleration, and maximum lateral acceleration, the warning interface with redundant information (text + symbols) showed significant differences in subjective ratings compared to the other two interfaces. Participants generally perceived the redundant interface as more usable and expressed a stronger preference for this design, particularly in high-risk scenarios.
5.2. Limitations and Future Research Directions
This study has several limitations that should be considered. Firstly, this study was conducted in a simulated driving environment, which may have low ecological validity. Thus, future studies in real driving environments will be necessary to investigate findings related to the effective design of AR-HUD in vehicles. Secondly, only two speeds (120 km/h & 60 km/h) were examined when studying the transfer of information about dangerous situations ahead. Given the diversity of speed limit standards worldwide, future research should incorporate a broader range of speed scenarios. Such expansion would enhance the generalizability of the findings and offer more practical guidance for traffic practices across different regions. Thirdly, although the icons and textual elements used in this study were adapted from established road standards and prior research, their applicability and effectiveness in the specific experimental context remain insufficiently validated. Future work will refine these visual elements and rigorously assess their efficacy in information conveyance. Besides, the participants were young people (21–28), who had high prior knowledge to drive them intuitively. This technology familiarity may not extend to other demographic groups, such as older adults. Meanwhile, in this study, risk levels were defined by simply using the positional relationship between the primary vehicle and surrounding vehicles as the basis for the risk indicator. However, these parameters are insufficient to fully capture drivers’ subjective risk perception. Last but not least, the levels of redundancy were not examined in this study. Strictly speaking, combining words and symbols only represents a basic level of redundant information. As proposed by Reddy et al. [,], and Ulahannan et al. [], adaptive interfaces may offer a more effective method for examining the impact of redundant information on driving behavior. In future research, we aim to explore and validate the potential effects of higher levels of redundant information on driving safety and efficiency.
6. Conclusions
This study explored driving scenarios with various visibility and risk levels under foggy conditions, aiming to evaluate the effects of different AR-HUD interfaces (words only, symbols only, words + symbols) on driver behavior and subjective perception, with the goal of improving driving safety. The results indicate that the risk level has a significant effect on drivers’ reaction time, TTC, and maximum longitudinal and lateral acceleration. Specifically, under low-risk conditions, drivers’ reaction time is generally longer than that in high-risk conditions, and TTC is longer than that in high-risk, with lower collision risks. Additionally, maximum longitudinal and lateral acceleration is significantly lower than in high-risk conditions, suggesting that drivers are more alert and responsive, adopting more proactive driving behaviors to avoid potential crash risks. In the light fog condition, participants responded more quickly to text-based interfaces; meanwhile, simple interfaces, such as text-only or symbol-only, were sufficient to help drivers effectively perceive potential risks. Although no significant differences were observed in driving behavior data across the three interface types, subjective feedback indicated that participants found redundant interfaces more usable and expressed a preference for them, particularly in high-risk conditions. The findings of this study provide support for design of AR-HUD interfaces, contributing to enhanced driving safety and human–machine interaction experience under complex meteorological conditions.
Author Contributions
J.L.: Investigation, Methodology, Software, Writing—review & editing, and Writing—original draft; K.C.: Conceptualization, Formal analysis, Investigation, Methodology, Software, Validation, Data curation, Writing—review & editing, and Writing—original draft; M.C.: Conceptualization, Formal analysis, Funding acquisition, Investigation, Methodology, and Supervision. All authors have read and agreed to the published version of the manuscript.
Funding
This work was supported by the general Project of Philosophy and Social Science Research in Colleges and Universities in Jiangsu Province (2023SJYB0212).
Institutional Review Board Statement
The study was conducted in accordance with the Declaration of Helsinki, and approved by the Ethics Review Committee of Nanjing Tech University (Approval Number: NTJTECH-1-5, approved on 11 July 2024).
Informed Consent Statement
Informed consent was obtained from all subjects involved in the study.
Data Availability Statement
The raw data supporting the conclusions of this article will be made available by the authors on request.
Acknowledgments
The authors would like to thank Hong Zhang and Yang Qin for their assistance with participant recruitment as well as data collection and processing.
Conflicts of Interest
The authors declare no conflicts of interest.
References
- Zhao, X.; Chen, Y.; Li, H.; Ma, J.; Li, J. A study of the compliance level of connected vehicle warning information in a fog warning system based on a driving simulation. Transp. Res. Part F Traffic Psychol. Behav. 2021, 76, 215–237. [Google Scholar] [CrossRef]
- You, F.; Zhang, J.; Zhang, J.; Shen, L.; Fang, W.; Cui, W.; Wang, J. A Novel Cooperation-Guided Warning of Invisible Danger from AR-HUD to Enhance Driver’s Perception. Int. J. Hum.-Comput. Interact. 2024, 40, 1873–1891. [Google Scholar] [CrossRef]
- George, P.; Thouvenin, I.; Fremont, V.; Cherfaoui, V. Daaria: Driver assistance by augmented reality for intelligent automobile. In Proceedings of the 2012 IEEE Intelligent Vehicles Symposium, Alcala de Henares, Spain, 3–7 June 2012; pp. 1043–1048. [Google Scholar] [CrossRef]
- Hwang, Y.; Park, B.-J.; Kim, K.-H. Effects of Augmented-Reality Head-up Display System Use on Risk Perception and Psychological Changes of Drivers. ETRI J. 2016, 38, 757–766. [Google Scholar] [CrossRef]
- Wolffsohn, J.S.; McBrien, N.A.; Edgar, G.K.; Stout, T. The influence of cognition and age on accommodation, detection rate and response times when using a car head-up display (HUD). Ophthalmic Physiol. Opt. 1998, 18, 243–253. [Google Scholar] [CrossRef] [PubMed]
- Wogalter, M.S.; Conzola, V.C. Using technology to facilitate the design and delivery of warnings. Int. J. Syst. Sci. 2002, 33, 461–466. [Google Scholar] [CrossRef]
- Wogalter, M.S.; Racicot, B.M.; Kalsher, M.J.; Simpson, S.N. Personalization of warning signs: The role of perceived relevance on behavioral compliance. Int. J. Ind. Ergon. 1994, 14, 233–242. [Google Scholar] [CrossRef]
- Wogalter, M.S.; Young, S.L. Behavioural compliance to voice and print warnings. Ergonomics 1991, 34, 79–89. [Google Scholar] [CrossRef]
- Wickens, C.D.; Prinett, J.G. Engineering Psychology, 3rd ed.; Prentice Hall: Upper Saddle River, NJ, USA, 2000; pp. 116–130. [Google Scholar]
- Reddy, G.R.; Blackler, A.; Popovic, V.; Thompson, M.H.; Mahar, D. The effects of redundancy in user-interface design on older users. Int. J. Hum.-Comput. Stud. 2020, 137, 102385. [Google Scholar] [CrossRef]
- Gabbard Joseph, L.; Smith, M.; Tanous, K.; Kim, H.; Jonas, B. AR DriveSim: An Immersive Driving Simulator for Augmented Reality Head-Up Display Research. Front. Robot. AI 2019, 6, 98. [Google Scholar] [CrossRef]
- Guo, H.; Zhao, F.; Wang, W.; Jiang, X. Analyzing Drivers’ Attitude towards HUD System Using a Stated Preference Survey. Adv. Mech. Eng. 2014, 6, 380647. [Google Scholar] [CrossRef]
- Kim, H.; Gabbard, J.L. Assessing Distraction Potential of Augmented Reality Head-Up Displays for Vehicle Drivers. Hum. Factors 2019, 64, 852–865. [Google Scholar] [CrossRef]
- Ahmed, M.M.; Yang, G.; Gaweesh, S. Assessment of Drivers’ Perceptions of Connected Vehicle-Human Machine Interface for Driving Under Adverse Weather Conditions: Preliminary Findings from Wyoming. Front. Psychol. 2020, 11, 1889. [Google Scholar] [CrossRef]
- Jing, C.; Shang, C.; Yu, D.; Chen, Y.; Zhi, J. The impact of different AR-HUD virtual warning interfaces on the takeover performance and visual characteristics of autonomous vehicles. Traffic Inj. Prev. 2022, 23, 277–282. [Google Scholar] [CrossRef] [PubMed]
- Calvi, A.; D’Amico, F.; Ferrante, C.; Ciampoli, L.B. Effectiveness of Augmented Reality Warnings on Driving Behavior Whilst Approaching Pedestrian Crossings: A Driving Simulator Study. Accid. Anal. Prev. 2020, 147, 105760. [Google Scholar] [CrossRef] [PubMed]
- Baran, P.; Zieliński, P.; Dziuda, Ł. Personality and temperament traits as predictors of conscious risky car driving. Saf. Sci. 2021, 142, 105361. [Google Scholar] [CrossRef]
- Zhu, J.; Ma, Y.; Lou, Y. Multi-vehicle interaction safety of connected automated vehicles in merging area: A real-time risk assessment approach. Accid. Anal. Prev. 2022, 166, 106546. [Google Scholar] [CrossRef]
- Karl, J.B.; Nyce, C.M.; Powell, L.; Zhuang, B. How risky is distracted driving? J. Risk Uncertain. 2023, 66, 279–312. [Google Scholar] [CrossRef]
- Rupp, M.A.; Gentzler, M.D.; Smither, J.A. Driving under the influence of distraction: Examining dissociations between risk perception and engagement in distracted driving. Accid. Anal. Prev. 2016, 97, 220–230. [Google Scholar] [CrossRef]
- Zhou, R.; Zhang, Y.; Shi, Y. Driver’s distracted behavior: The contribution of compensatory beliefs increases with higher perceived risk. Int. J. Ind. Ergon. 2020, 80, 103009. [Google Scholar] [CrossRef]
- Sun, Y.; Wang, R.; Zhang, H.; Ding, N.; Ferreira, S.; Shi, X. Driving fingerprinting enhances drowsy driving detection: Tailoring to individual driver characteristics. Accid. Anal. Prev. 2024, 208, 107812. [Google Scholar] [CrossRef]
- Ebel, B.E. Young drivers and the risk for drowsy driving. JAMA Pediatr. 2013, 167, 606–607. [Google Scholar] [CrossRef]
- Rejali, S.; Aghabayk, K.; Shiwakoti, N. A Clustering Approach to Identify High-Risk Taxi Drivers Based on Self-Reported Driving Behavior. J. Adv. Transp. 2022, 2022, 6511225. [Google Scholar] [CrossRef]
- Adavikottu, A.; Velaga, N. Analysis of speed reductions and crash risk of aggressive drivers during emergent pre-crash scenarios at unsignalized intersections. Accid. Anal. Prev. 2023, 187, 107088. [Google Scholar] [CrossRef] [PubMed]
- Bean, P.; Roska, C.; Harasymiw, J.; Pearson, J.; Kay, B.; Louks, H. Alcohol Biomarkers as Tools to Guide and Support Decisions About Intoxicated Driver Risk. Traffic Inj. Prev. 2009, 10, 519–527. [Google Scholar] [CrossRef] [PubMed]
- Peter, R.; Crutzen, R. Hazards Faced by Young Designated Drivers: In-Car Risks of Driving Drunken Passengers. Int. J. Environ. Res. Public Health 2009, 6, 1760–1777. [Google Scholar] [CrossRef]
- Mills, L.; Freeman, J.; Rowland, B. Australian daily cannabis users’ use of police avoidance strategies and compensatory behaviours to manage the risks of drug driving. Drug Alcohol Rev. 2023, 42, 1577–1586. [Google Scholar] [CrossRef]
- Cui, C.; An, B.; Li, L.; Qu, X.; Manda, H.; Ran, B. A freeway vehicle early warning method based on risk map: Enhancing traffic safety through global perspective characterization of driving risk. Accid. Anal. Prev. 2024, 203, 107611. [Google Scholar] [CrossRef]
- Ryan, C.; Murphy, F.; Mullins, M. Spatial risk modelling of behavioural hotspots: Risk-aware path planning for autonomous vehicles. Transp. Res. Part A Policy Pract. 2020, 134, 152–163. [Google Scholar] [CrossRef]
- Zhang, L.; Wang, S.; Chen, C.; Yang, M.; She, X. Modeling Lane-Change Risk in Urban Expressway Off-Ramp Area Based on Naturalistic Driving Data. J. Test. Eval. Multidiscip. Forum Appl. Sci. Eng. 2020, 48, 1975–1989. [Google Scholar] [CrossRef]
- Rahman, M.S.; Abdel-Aty, M. Longitudinal safety evaluation of connected vehicles’ platooning on expressways. Accid. Anal. Prev. 2018, 117, 381. [Google Scholar] [CrossRef]
- Zhao, P.; Lee, C. Assessing rear-end collision risk of cars and heavy vehicles on freeways using a surrogate safety measure. Accid. Anal. Prev. 2018, 113, 149–158. [Google Scholar] [CrossRef]
- Rubie, E.; Haworth, N.; Yamamoto, N. Passing distance, speed and perceived risks to the cyclist and driver in passing events. J. Saf. Res. 2023, 87, 86–95. [Google Scholar] [CrossRef]
- Lyu, N.; Cao, Y.; Wu, C.; Xu, J.; Xie, L. The effect of gender, occupation and experience on behavior while driving on a freeway deceleration lane based on field operational test data. Accid. Anal. Prev. 2018, 121, 82–93. [Google Scholar] [CrossRef] [PubMed]
- Cloutier, M.-S.; Lachapelle, U. The effect of speed reductions on collisions: A controlled before-and-after study in Quebec, Canada. J. Transp. Health 2021, 22, 101137. [Google Scholar] [CrossRef]
- Wang, Z.; Rebelo, F.; He, R.; Vilar, E.; Noriega, P.; Zeng, J. Using virtual reality to study the effect of information redundancy on evacuation effectiveness. Hum. Factors Ergon. Manuf. Serv. Ind. 2023, 33, 259–271. [Google Scholar] [CrossRef]
- Cooper, A.; Reimann, R.; Cronin, D.; Noessel, C. About Face: The Essentials of Interaction Design, 4th ed.; John Wiley & Sons: Indianapolis, IN, USA, 2014; pp. 45–80. [Google Scholar]
- Shneiderman, B. Designing the User Interface: Strategies for Effective Human-Compuer Interaction, 5th ed.; Addison-Wesley: Boston, MA, USA, 2009; Volume XVIII, p. 606. [Google Scholar]
- Wiedenbeck, S. The use of icons and labels in an end user application program: An empirical study of learning and retention. Behav. Inf. Technol. 1999, 18, 68–82. [Google Scholar] [CrossRef]
- François, M.; Crave, P.; Osiurak, F.; Fort, A.; Navarro, J. Digital, analogue, or redundant speedometers for truck driving: Impact on visual distraction, efficiency and usability. Appl. Ergon. 2017, 65, 12–22. [Google Scholar] [CrossRef]
- Stojmenova, P.; Tomažič, S.; Sodnik, J. Design of head-up display interfaces for automated vehicles. Int. J. Hum.-Comput. Stud. 2023, 177, 103060. [Google Scholar] [CrossRef]
- Bangor, A.; Kortum, P.T.; Miller, J.T. An Empirical Evaluation of the System Usability Scale. Int. J. Hum.-Comput. Interact. 2008, 24, 574–594. [Google Scholar] [CrossRef]
- Richard, M.H.; Naomi, B.R. Design of Diverging Stacked Bar Charts for Likert Scales and Other Applications. J. Stat. Softw. 2014, 57, 1–32. [Google Scholar] [CrossRef]
- He, S.; Du, Z.; Han, L.; Jiang, W.; Jiao, F.; Ma, A. Unraveling the impact of fog on driver behavior in highway tunnel entrances: A field experiment. Traffic Inj. Prev. 2024, 25, 680–687. [Google Scholar] [CrossRef]
- Ivers, R.; Senserrick, T.; Boufous, S.; Stevenson, M.; Chen, H.-Y.; Woodward, M.; Norton, R. Novice Drivers’ Risky Driving Behavior, Risk Perception, and Crash Risk: Findings from the DRIVE Study. Am. J. Public Health 2009, 99, 1638–1644. [Google Scholar] [CrossRef]
- Reddy, G.R.; Blackler, A.; Popovic, V. Intuitive Interaction: Adaptable Interface Framework for Intuitively Learnable Product Interfaces for People with Diverse Capabilities; CRC Press: Boca Raton, FL, USA, 2019; pp. 1–15. [Google Scholar]
- Ulahannan, A.; Thompson, S.; Jennings, P.; Birrell, S. Using Glance Behaviour to Inform the Design of Adaptive HMI for Partially Automated Vehicles. IEEE Trans. Intell. Transp. Syst. 2022, 23, 4877–4892. [Google Scholar] [CrossRef]
Disclaimer/Publisher’s Note: The statements, opinions and data contained in all publications are solely those of the individual author(s) and contributor(s) and not of MDPI and/or the editor(s). MDPI and/or the editor(s) disclaim responsibility for any injury to people or property resulting from any ideas, methods, instructions or products referred to in the content. |
© 2025 by the authors. Licensee MDPI, Basel, Switzerland. This article is an open access article distributed under the terms and conditions of the Creative Commons Attribution (CC BY) license (https://creativecommons.org/licenses/by/4.0/).