Article

Collaborative Multi-Agent Platform with LIDAR Recognition and Web Integration for STEM Education

by
David Cruz García
*,
Sergio García González
,
Arturo Álvarez Sanchez
,
Rubén Herrero Pérez
and
Gabriel Villarrubia González
*
Expert Systems and Applications Laboratory, Faculty of Science, University of Salamanca, 37008 Salamanca, Spain
*
Authors to whom correspondence should be addressed.
Appl. Sci. 2025, 15(20), 11053; https://doi.org/10.3390/app152011053
Submission received: 30 September 2025 / Revised: 13 October 2025 / Accepted: 14 October 2025 / Published: 15 October 2025
(This article belongs to the Section Computing and Artificial Intelligence)

Abstract

STEM (Science, Technology, Engineering, and Mathematics) education faces the challenge of incorporating advanced technologies that foster motivation, collaboration, and hands-on learning. This study proposes a portable system capable of transforming ordinary surfaces into interactive learning spaces through gamification and spatial perception. A prototype based on multi-agent architecture was developed on the PANGEA (Platform for automatic coNstruction of orGanizations of intElligent agents) platform, integrating LIDAR (Light Detection and Ranging) sensors for gesture detection, an ultra-short-throw projector for visual interaction and a web platform to manage educational content, organize activities and evaluate student performance. The data from the sensors is processed in real time using ROS (Robot Operating System), generating precise virtual interactions on the projected surface, while the web allows you to configure physical and pedagogical parameters. Preliminary tests show that the system accurately detects gestures, translates them into digital interactions, and maintains low latency in different classroom environments, demonstrating robustness, modularity, and portability. The results suggest that the combination of multi-agent architectures, LIDAR sensors, and gamified platforms offers an effective approach to promote active learning in STEM, facilitate the adoption of advanced technologies in diverse educational settings, and improve student engagement and experience.

1. Introduction

In recent decades, Science, Technology, Engineering and Mathematics (STEM) education has gained great interest as a strategy to prepare students for the challenges of the 21st century. Methodologies based on educational robotics, interactive platforms and collaborative learning have proven to be effective in increasing engagement, motivation and learning achievements in these areas. For example, recent studies show that educational robotics play a meaningful role in improving STEM education. However, research continues to explore the extent of their impact and the moderating conditions that affect learning outcomes [1].
At the same time, advanced perception technologies such as LIDAR (Light Detection and Ranging) emerge as powerful tools for capturing 3D environments, enabling new educational experiences based on real data, spatial visualization, and hands-on experimentation. LIDAR data have also been used in research for point cloud classification, topographic modeling, green zones monitoring, and other applications that require spatial accuracy [2,3].
Recent work has explored specific contexts that approach this educational integration. In rural schools, a STEM robotics initiative has demonstrated the potential to simultaneously enhance curriculum learning in mathematics and science across multiple grade levels, helping to reduce the digital divide [4]. Also, robotic platforms have been employed to support both STEM and physical education, revealing that robotics kits can improve attention and serve as effective educational support tools [5]. In elementary education, systematic reviews have analyzed intervention designs, tangible versus graphical interfaces, study durations, and targeted outcomes (knowledge, skills, attitudes). Although the findings are encouraging, limitations remain regarding sample size and study length [6].
In addition to the above, gamification has established itself as a promising educational strategy to increase motivation, participation, and academic performance in STEM environments. Recent studies have shown that incorporating game elements such as leaderboards, badges, and immediate feedback leads to significant improvements in university learning outcomes, particularly in subjects that emphasize abstraction and problem-solving [7]. In primary education spaces, adaptive gamification has proven effective in improving content comprehension and reducing anxiety toward more challenging subjects [8]. In addition, systematic reviews suggest that active learning methodologies combined with gamification help students become more engaged in the learning process, experience greater satisfaction, and retain concepts more effectively [9,10].
With this in mind, the proposed system has been implemented within an environment based on a multi-agent system (MAS) called PANGEA [11,12], a distributed architecture that allows learning to be organized into autonomous and intelligent modules that interact with each other to make collaborative decisions. In the proposal of this work, each component of the system (perception by LIDAR, data processing and classification, multi-agent coordination and web interaction) acts as an agent with specific capabilities, which not only improves the overall efficiency of the platform, but also facilitates scalability, maintenance and adaptation to different educational scenarios. This modular and distributed approach offers students the opportunity to experiment with advanced concepts of collaborative robotics, applied to real problems in the classroom or in remote environments.
The fundamental purpose of this project is to bring emerging technology closer to STEM education, promoting a culture of learning based on data, automation and collaboration. In addition, the proposal aligns with the Sustainable Development Goals (SDGs), in particular SDG 4 (Quality Education), SDG 9 (Industry, Innovation and Infrastructure) and SDG 11 (Sustainable Cities and Communities), by demonstrating that it is possible to develop affordable, reproducible and real-impact technological solutions in educational contexts. The initiative seeks to show that, even with limited resources, it is feasible to design educational tools that integrate sensors, distributed systems and platforms accessible through the web, promoting both pedagogical innovation and the technological training of new generations.
This paper presents several relevant contributions to the field of technological innovation applied to STEM education from a scientific and pedagogical perspective. A distributed architecture based on multi-agent systems is proposed for the collaborative management of an interactive learning environment, in which each module of the system (detection by infrared sensors, interaction processing, coordination between agents and web deployment) acts as an autonomous agent with specific capabilities. One of the most innovative contributions is the use of infrared sensors in an unconventional way: combined with a projector, they make it possible to transform any projection surface into an interactive touch screen. Through the precise detection of position and movement in the projected area, students can interact directly with digital content, turning ordinary environments into interactive learning spaces. This approach opens the door to more dynamic and collaborative teaching experiences by integrating advanced technologies with practical applications in the classroom. Likewise, the proposed multi-agent approach provides scalability, adaptability and the ability to extend the platform to new scenarios, from face-to-face education to remote environments connected through the web. Overall, the proposal reinforces the vision of more interactive, accessible and sustainable educational systems, where the convergence between spatial perception, tangible interaction and distributed collaboration configures a new paradigm for science and engineering education.
This article has been structured as follows: Section 1, Introduction, presents the general context of the integration of interactive technologies in STEM educational environments and the need to develop portable, accurate, and flexible systems that enhance the learning experience. Section 2, Background, reviews previous research and related projects, with particular emphasis on advanced physical interaction systems and educational platforms, and highlights the limitations of previous prototypes based on depth cameras. Section 3, Materials and Methods, describes in detail the proposed system based on a multi-agent architecture, including the hardware components (LIDAR sensors, NUC microcomputer, ultra-short throw projector) and internal software modules responsible for data acquisition, fusion and processing, as well as the web platform for the creation and management of educational activities using H5P and its integration with LMS. Section 4, Results, outlines the achievements made with the prototype, including accurate interaction detection, portability and robustness in the face of changing lighting, as well as a preliminary evaluation of the prototype with users. Section 5, Discussion, discusses improvements over previous prototypes, including simplified installation, greater content flexibility, and educational scalability, and points out possible future lines of research such as hardware optimization, adaptive gamification, and cross-school collaboration. Finally, Section 6, Conclusions, summarizes the main findings, reaffirms the usefulness of the system as a versatile and innovative educational tool, and highlights its potential impact on STEM teaching and student motivation.

2. Background

In recent years, there has been a growing interest in integrating advanced sensor technologies, robotics, and web-based platforms into STEM education in order to improve interactivity, collaboration, and real-world relevance. Key areas that inform our work include multi-agent systems with LIDAR for spatial recognition, sensor-driven “smart classroom” environments, and virtual/remote sensing platforms for teaching.
Collaborative mapping and reconnaissance using LIDAR-equipped mobile agent teams has become feasible thanks to improvements in sensor resolution, real-time data processing, and bandwidth-limited communication methods. For example, a recent study presents a distributed framework for reconstructing 3D scenes in large outdoor environments using mobile ground robots with limited communication range and bandwidth [13]. Similarly, the fusion of hyperspectral imagery and LiDAR data through multi-agent systems has been shown to enhance the accuracy of object and vegetation recognition in urban areas. In one study, spectral and height features were extracted and processed in parallel by object recognition agents, resulting in a significant improvement in accuracy compared to using either hyperspectral or LiDAR data alone [14]. In addition, Multi-Robot Collaborative Mapping with Integrated Point-Line Features for Visual SLAM features a mapping algorithm that fuses (visual) point and line features with scene recognition so that multiple robots can build accurate maps even in environments with weak textures or structures. Although this research focuses more on visual perception than on LiDAR-based recognition, the multi-robot collaboration and map fusion techniques provide valuable insights for the design of our platform [15].
The sensors have also been studied in depth in reconnaissance tasks in agricultural and natural environments. A recent review explores the capabilities of sensors for crop recognition (such as plant height, canopy surface, and spacing), as well as for identifying environmental features including field boundaries, ridges, and obstacles [16].
Beyond robotic mapping, education has also seen advances in the use of sensors and artificial intelligence to create “smart classroom” environments. Based on this, recent research provides a systematic review of how various types of sensors (environmental, biometric, and behavioral) are combined with artificial intelligence to monitor student engagement, classroom conditions, attendance, and personalized learning [17]. Another line of research focuses on virtual or remote sensing platforms used for education. For example, current works describe a virtual simulation teaching platform for UAV-based digital mapping in remote sensing education (VSETP-UAV), which integrates virtual data acquisition, online sharing, hands-on experiments, and real-time evaluation through a server-side system [18]. Recent advances have led to the development of platforms that integrate sensors, robotics, and web technologies to enhance STEM education. For example, RoboScape Online, a browser-based, networked robotics simulation platform that enables remote learners to collaborate and compete in real time [19], was introduced. This platform, while not explicitly using LIDAR, emphasizes the importance of accessible and collaborative robotics education. In addition, the PlatypOUs mobile robot platform incorporates advanced sensor data processing techniques to enhance the educational value of mobile robotics [20]. This approach aligns with the goals of integrating sensors for spatial recognition and web-based collaboration in educational settings. In addition, studies on robot connectivity and collaborative sensing in educational robotics emphasize the potential of multi-agent systems to foster student engagement and interest in modern robotics [21]. These studies underscore the growing trend of integrating advanced technologies into educational robotics, paving the way for platforms that combine LIDAR, robotics, and web interfaces to support STEM education.
Gamification in education and game-based learning are practical methods for teaching. Unlike game-based learning, gamification involves applying video game elements and mechanics, such as points, badges, and leaderboards, in non-game contexts like the classroom to motivate and engage students [22]. Game-based learning, however, uses a real game, either digital or analog, to teach skills and knowledge, creating a more immersive learning experience. The design of an effective educational game seeks to bring students to a state where their high concentration allows them to be fully immersed in the activity. To achieve this, the game design must integrate playful and pedagogical elements in a balanced way. In addition, the design of these games should take into account the player’s identity and level of interactivity, and the complexity should gradually increase to maintain motivation. In serious games, it is essential that the purpose, content, and narrative align closely with the learning objectives [23].
Game-based learning is a pedagogical method that is supported by theories such as constructivism and experiential learning, where students actively learn by solving problems in a simulated environment. A key principle in designing such games is to help players reach a state of “flow,” a deep focus that enables full immersion in the activity [24]. To do this, the game must provide continuous feedback, clear goals, and appropriately challenging tasks [25]. The design elements of an educational game are organized into three levels: the basic components, such as points and avatars; mechanics, which are the rules of interaction between the player and the game; and dynamics, which are the most conceptual aspects such as emotions and progression.
In addition, proposed frameworks emphasize that player identity, interactivity, and increasing complexity are crucial for maintaining motivation. At its core, the design of an educational game is a delicate balance between the fun of the game and a clear pedagogical purpose. In addition, recent works identify six essential factors for serious game design: the game’s purpose, the validity of its content, its mechanics, the fiction or narrative that surrounds it, the framework that adapts it to the intended audience, and its visual aesthetics [26]. In addition, the GREM model (Conceptual Model of Rules and Player Scenario) offers an approach based on situated learning theory, placing particular emphasis on the design of game scenarios as central elements [27]. This approach allows game components to be reused in the creation of new experiences.
Regarding the applicability of LiDAR in educational settings, students can apply and reinforce the knowledge acquired in school and through study materials. Knowledge is created through the transformation of experience, combining learning and practice [28]. Gamification as an educational method means adding game elements to the traditional instructional method. These elements are used to motivate students to engage with educational content [29,30]. Game-based learning differs from gamification because of the inclusion of a real game to teach knowledge and skills. In game-based learning, the game creates the learning experience. Game-based learning is an approach and method that engages students to learn by experience. This approach encourages students to learn through experience, allowing them to experiment with different decision-making strategies and procedures while pursuing game objectives [31]. At the same time, they learn to apply theoretical processes and knowledge in a simulated environment. Playing a game typically helps students retain information and understand the learning context through repetition, excitement, and immersion in the game scenario [32]. A LIDAR projector uses pulses of laser light to measure distances and create an accurate three-dimensional map of the environment. These devices offer a series of functionalities that can improve the learning process of students, such as motion detection or projection of interactive content. Gamification through LIDAR allows experiential learning, which transforms learning into more active teaching for greater student participation. The playful nature of interactive activities increases students’ motivation and determination to learn more about educational content.

3. Materials and Methods

The materials (hardware, software) and methods (architecture, algorithms, communication, and protocols) to enable system replication and extension are described in sufficient detail below.

3.1. Multiagent System Architecture

The architecture designed for this project was based on the use of the PANGEA platform, specifically designed for the construction of virtual organizations of agents. This approach allowed the system to be structured into different logical units, each with defined roles and responsibilities, which collaborate with each other in a coordinated manner. This ensures greater modularity, scalability and adaptability to changes in requirements or the application environment.
In the specialized literature, there are different development frameworks for multi-agent systems. Among them is JADE (Java Agent DEvelopment Framework), widely recognized for its robustness, which offers a lighter approach to managing distributed agents in Python v.3. However, in this project we have opted for PANGEA, as it incorporates differential features that are critical for the proposed platform: native support for virtual organizations and explicit role management, which facilitates integration with web services and external systems. Then, in Table 1 a comparison has been made between JADE, which is the most widely used MAS, and PANGEA so that readers can easily understand their main differences.
The choice of a multi-agent system (MAS) framework like PANGEA, over a simpler microservices architecture, is justified by the need for a layer of autonomous governance and intelligent coordination that a standard service-oriented architecture does not provide. While it is true that the functions of individual agents, such as user or game management, might resemble microservices, the fundamental advantage of our approach lies in the system’s ability to self-regulate. This is achieved through the Normative Agent, a meta-component that proactively imposes behavioral rules across the entire organization.
Furthermore, the system leverages the agent’s capacity for collaborative decision-making in key processes, rather than executing a simple sequence of calls. The translation of a physical touch on the surface into a digital click is a clear example. In this process, the Detection Agent does not merely pass data; it initiates a dialogue where multiple agents (Click Translation Agent, Rescaling Agent, and Parameter Config Agent) negotiate the final outcome based on the system’s current state and parameters. The result is a dynamic consensus, not a simple data transformation, which endows the system with greater flexibility and adaptability. Therefore, we chose a MAS not just to modularize the system, but to create an ecosystem where components intelligently collaborate and self-regulate to achieve a common goal.
Moreover, this MAS foundation is not only beneficial for the current implementation but is essential for the planned evolution of the platform. Future features, such as adaptive gamification and inter-school collaborative challenges, will rely heavily on complex agent interactions that a simpler architecture could not easily support. For example, in an adaptive system, the Evaluation Agent would need to autonomously negotiate with the Game Management Agent to dynamically alter game difficulty based on a student’s real-time performance.
In the context of the developed platform, these capabilities are especially relevant. The system was made up of a web application with frontend and backend, aimed at teachers and students, which allows you to upload educational games (connected to H5P), organize them into thematic sections (unit 1, unit 2, etc.), configure laser sensors and generate useful statistics for student evaluation. At the same time, the portable physical infrastructure, integrated into a briefcase, has two LIDAR sensors responsible for detecting clicks on the projection surface, so that the captured coordinates are automatically translated into interactions within the application.
In this scenario, precise coordination between all elements is essential: physical detection through LIDAR sensors, the translation of these actions into digital events and the management of data on the web platform. This is where PANGEA adds value, by enabling the system to be organised, from the logic of coordination between sensors and application, to the agents responsible for managing the system’s services, such as interaction with the web application, as well as processing the information generated by the LIDAR sensors, translating the detected coordinates into virtual clicks and coordinating the data from the educational games and evaluation statistics, thus ensuring consistent and scalable operation. This structured organization not only facilitates the maintenance of the system, but also makes it possible to incorporate new modules or services (whether physical or digital) without compromising the overall stability of the architecture.
As can be seen in Figure 1, the system architecture is designed under a multi-agent approach, in which different organizations and agents collaborate to offer a distributed, modular and scalable solution. The system is organized into three large blocks: PANGEA, web platform and Physical Interaction, each with a clear function within the general ecosystem.

3.1.1. PANGEA Organization

Its objective is to provide services, access to data, management of standards and general coordination between agents. It acts as the “administrative core” that supports the operation of the application and its interactions with the physical environment. The agents that make it up are:
  • Manager Agent: was designed to coordinate internal agents and oversee external interactions with other organizations.
  • Organization Agent: was designed to maintain the organizational structure and define the roles of the different agents.
  • Normative Agent: was designed to be in charge of the rules that other agents must comply with, ensuring consistency and compliance with policies.
  • Information Agent: was designed to manage the distribution and processing of information between agents and organizations.
  • Database Agent: was designed to be responsible for the connection with the database, guaranteeing access and persistence of information.
  • Service Agent: was designed to act as an interface between the PANGEA organization and external services (APIs), allowing integration with external applications.

3.1.2. Web Platform Organization

The organization of the web platform concentrates the business logic related to user management, games and evaluations. It is the layer that connects directly with the end user and translates PANGEA services into concrete functionalities. The agents that are part of this organization are:
  • User Management Agent: was designed to manage the user lifecycle (registration, authentication, permissions).
  • Section Management Agent: was designed to organize games into sections or groups according to users, making it easy to customize activities.
  • Game Management Agent: was designed to manage the creation, storage, and execution of interactive games.
  • Evaluation Agent: was designed to process data and generate evaluations about user interaction.
  • Notification Agent: was designed to send relevant messages, reminders, or alerts to users.
  • Configuration Agent: was designed to adjust general application parameters to suit different usage contexts, such as screen size and detection area.
Within the Web Platform there is the Game Creation sub-organization specialized in the creation of games and their integration with the web through the Game Management Agent. This organization is composed of the H5PIntegration Agent that allows the integration of H5P activities within the system, guaranteeing compatibility with interactive educational tools. This allows any teacher to generate their own activities or recycle many others created by other teachers, allowing cooperation between different schools and the generation of quality shared content.

3.1.3. Organization Physical Interaction

This organization is responsible for interaction with the physical world. Here, input/output devices (sensors and projectors) are managed, allowing users to interact naturally with the system. It is composed of two main agents:
  • Detection Agent: it is responsible for detecting variations in the physical environment from LIDAR sensors and translates them into events that can be processed by other agents (collisions of balls on the wall, pointers, etc.).
  • Display Agent: Manages visual output using a projector, displaying information or games to users.
In addition to these main agents, a sub-organization called Action Translation is also part of Physical Interaction. This sub-organization is responsible for transforming the physical actions of users into events that can be understood by the rest of the organizations and agents. It is composed of the following agents:
  • Click Translation Agent: Converts the physical actions detected by the Detection Agent into virtual clicks that act like a physical mouse on a computer.
  • Rescaling Agent: Scales interactions translated by the Click Translation Agent to match the size of the visualization based on the parameters you set.
  • Parameter Config Agent: configures the parameters for translating actions, in coordination with the calibration of the system, to obtain an optimal rescaling system that is adaptable to any display system.
  • Calibration Agent: adjusts and calibrates physical devices according to the established parameters and the size of the visualization, ensuring accuracy in detection and visual response.

3.2. Implementation of the Prototype

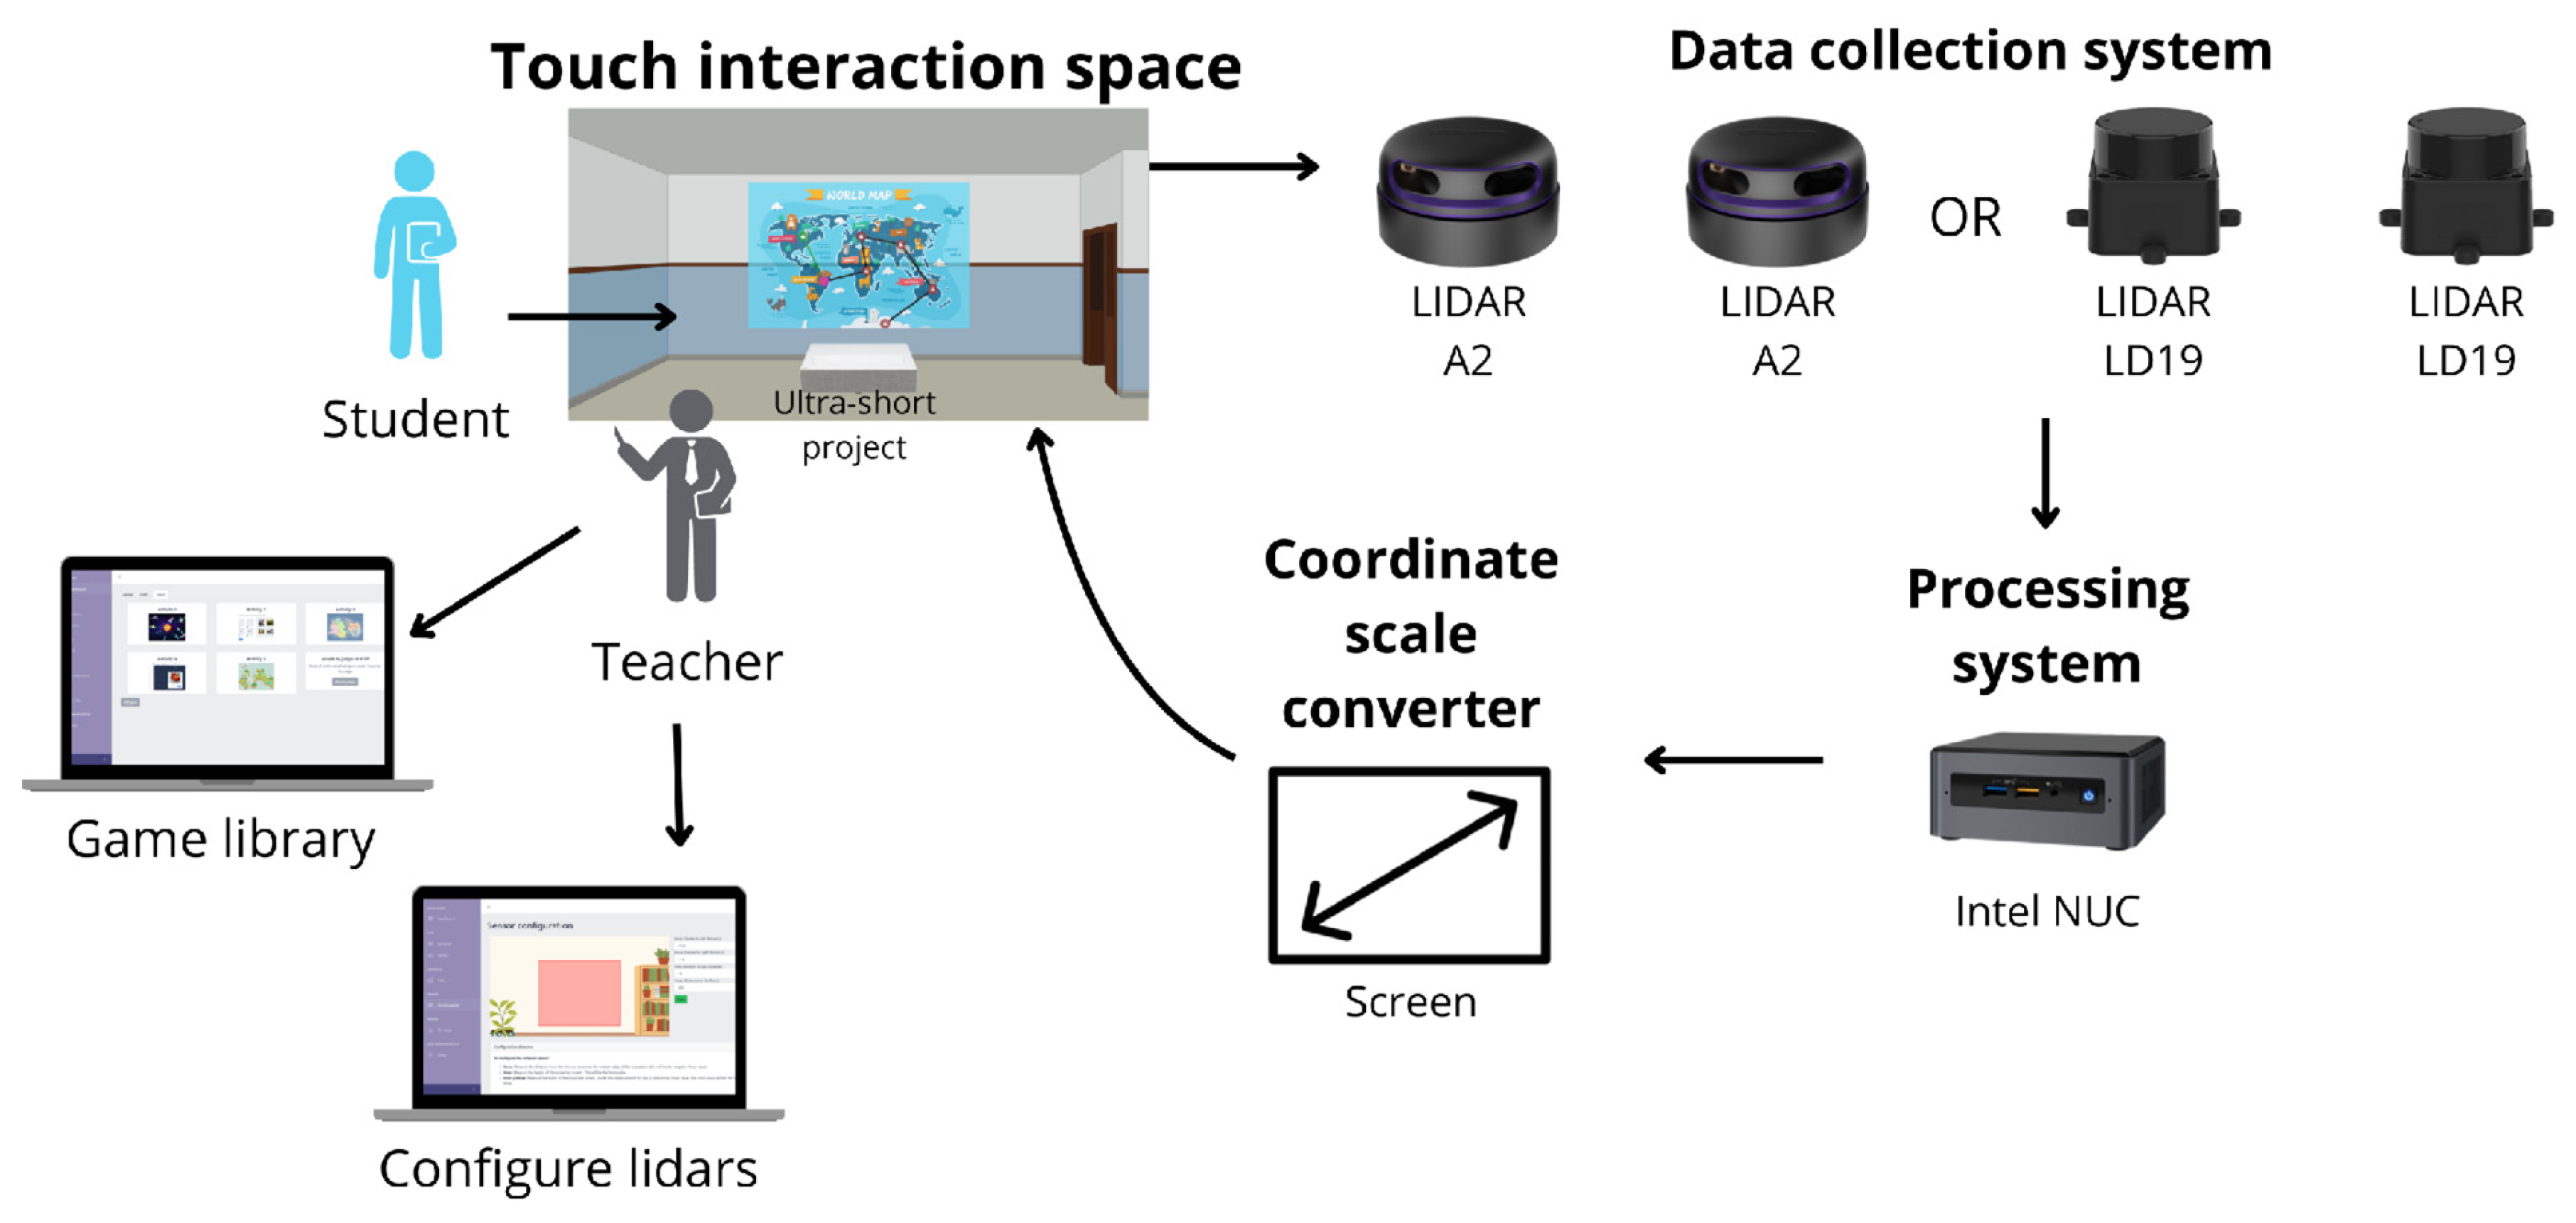
The physical implementation of the prototype was based on a compact assembly that integrates the sensors to capture information, the processing system and the interaction elements. The system was designed to be transportable and easy to use, using commercially available hardware and open-source software. Two 2D LiDAR sensors are deployed to monitor a pre-defined interaction zone, while a computer (Intel NUC) acts as the main processing unit. This equipment runs the ROS middleware, responsible for managing the acquisition and fusion of data from both sensors, as well as a lightweight backend service that transforms the detected positions into interactions on the projected surface. To provide a seamless user interface, the system is complemented by an ultra-short-throw projector, which projects the interactive surface onto a wall or whiteTable. In this way, the sensors make it possible to track objects such as hands, pointers or balls within the interaction space and directly map their positions in input events on the projected screen.

3.2.1. Physical Design and Arrangement of Components

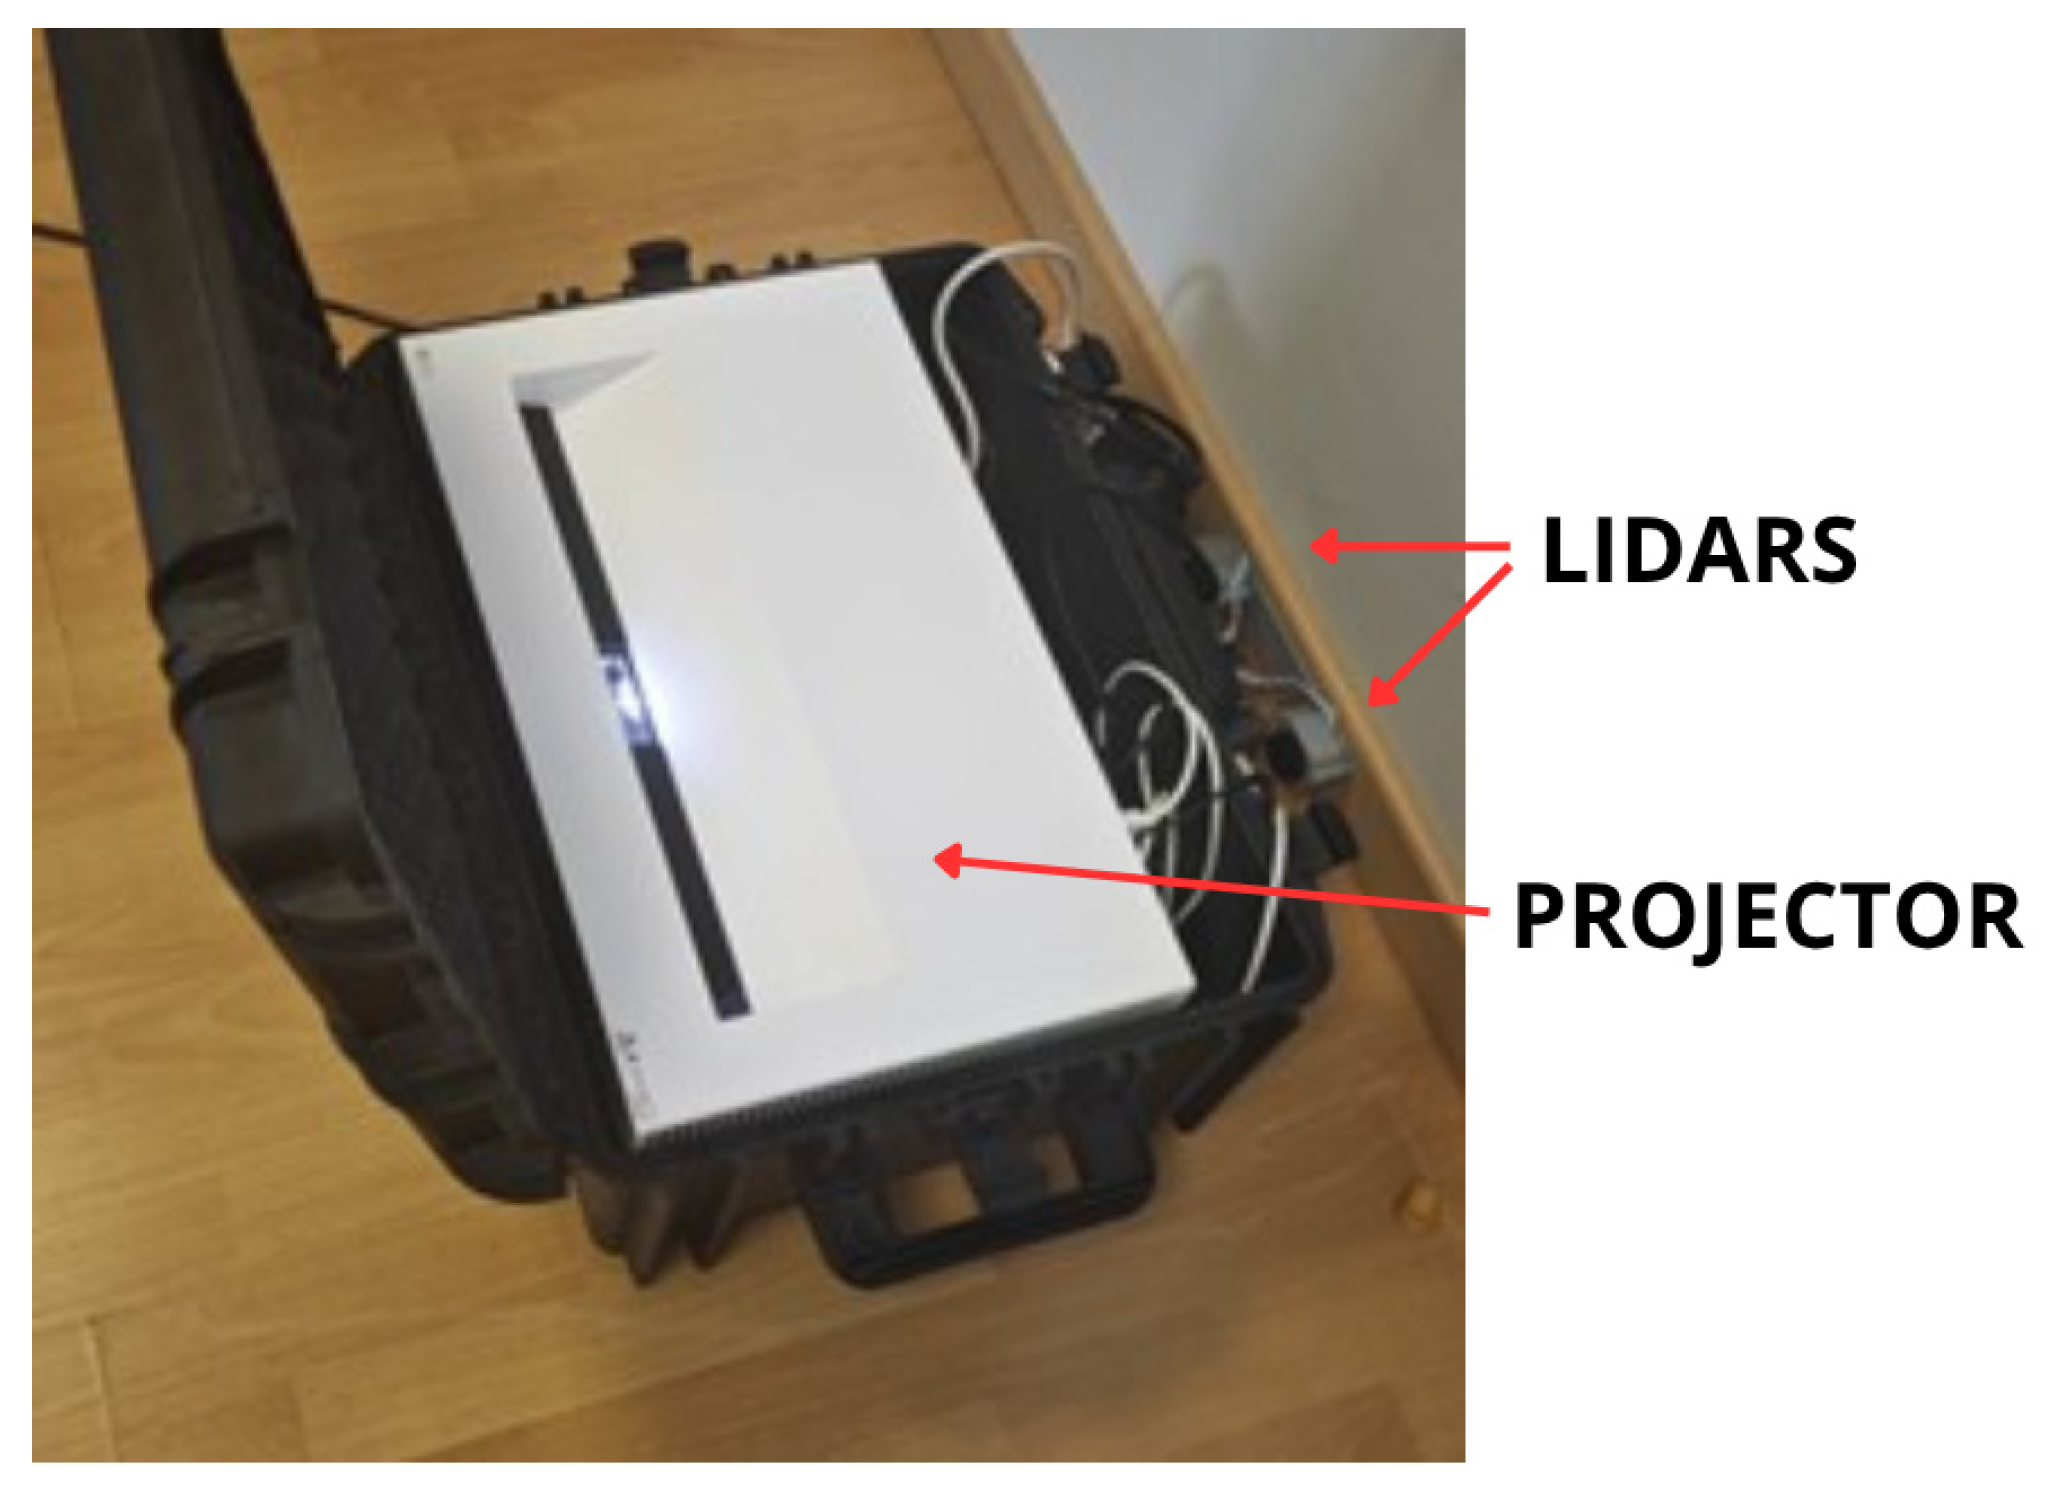
The physical design of the prototype (see Figure 2 and Figure 3), was based on the integration of components within a case. The ultra-short throw projector sits at the bottom of the case, oriented so that it can project the image directly onto the vertical surface in front of the system, whether it is a wall, whiteTable, or makeshift screen. This choice of projector is essential, as it allows large images to be generated at a very short distance, which maximises the use of space and avoids the interference of shadows produced by the user himself during the interaction.
The LIDAR sensors are located on the front of the case (or in the lower area of the wall), adopting an arrangement similar to that of a soundbar. This configuration ensures a wide and homogeneous detection field on the projected surface. Each LIDAR operates by emitting laser pulses that bounce off objects present in its field of view and thus building a point cloud that accurately describes relative distances. The use of two sensors in parallel allows the detection range to be extended and possible shadow areas or blind spots to be reduced, ensuring that any gesture made on the projected surface is reliably recorded.
The use of two horizontally aligned 2D LIDAR sensors was selected after preliminary tests comparing different configurations. Although a single 3D LIDAR or a ceiling-mounted time-of-flight (ToF) camera could theoretically provide full spatial coverage, these alternatives presented practical limitations for direct classroom interaction. The 3D LIDAR configuration introduced excessive vertical scanning, detecting users’ bodies and nearby objects beyond the projection plane, which complicated gesture discrimination and increased processing overhead. Similarly, a top-mounted ToF camera required fixed ceiling installation, reducing portability and limiting deployment in temporary or mobile setups.
In contrast, the dual 2D horizontal arrangement achieves a balanced trade-off between detection accuracy, portability, and cost. While this setup may still experience partial occlusions when one user blocks another from a sensor’s perspective, the use of two overlapping sensors mitigates most of these cases, maintaining stable detection across the interactive area. Future versions of the system may explore hybrid configurations that combine planar and volumetric sensing to further reduce occlusion effects.
The microcomputer is the processing core of the system. This device was selected for its balance of computing power, energy efficiency, and small footprint, making it an ideal choice for embedded systems that require intensive real-time data processing. It continuously receives the point clouds generated by the LIDARs, executes filtering algorithms to remove noise and artifacts, and calculates the exact coordinates of each detected interaction. These coordinates are then transformed into positions relative to the projection, so that the system can accurately reflect the user’s action on the projected surface.

3.2.2. Data Processing

A data processing flow was implemented that allowed information from the environment to be captured, interpreted in real time and translated into interaction events on the projected surface.
This process comprised several linked stages: the acquisition of point clouds by the sensors, their fusion within the ROS environment to obtain a unified representation of the space, the detection of disturbances that correspond to user interactions, and finally, the mapping of these detections to a coordinate system associated with the projected screen. allowing the generation of virtual clicks.
The following sections present the achievements obtained in each of these phases, showing how the proposed architecture manages to integrate hardware and software in a continuous flow of information that guarantees precision and immediacy in the interaction.

3.2.3. Information Processing Flow

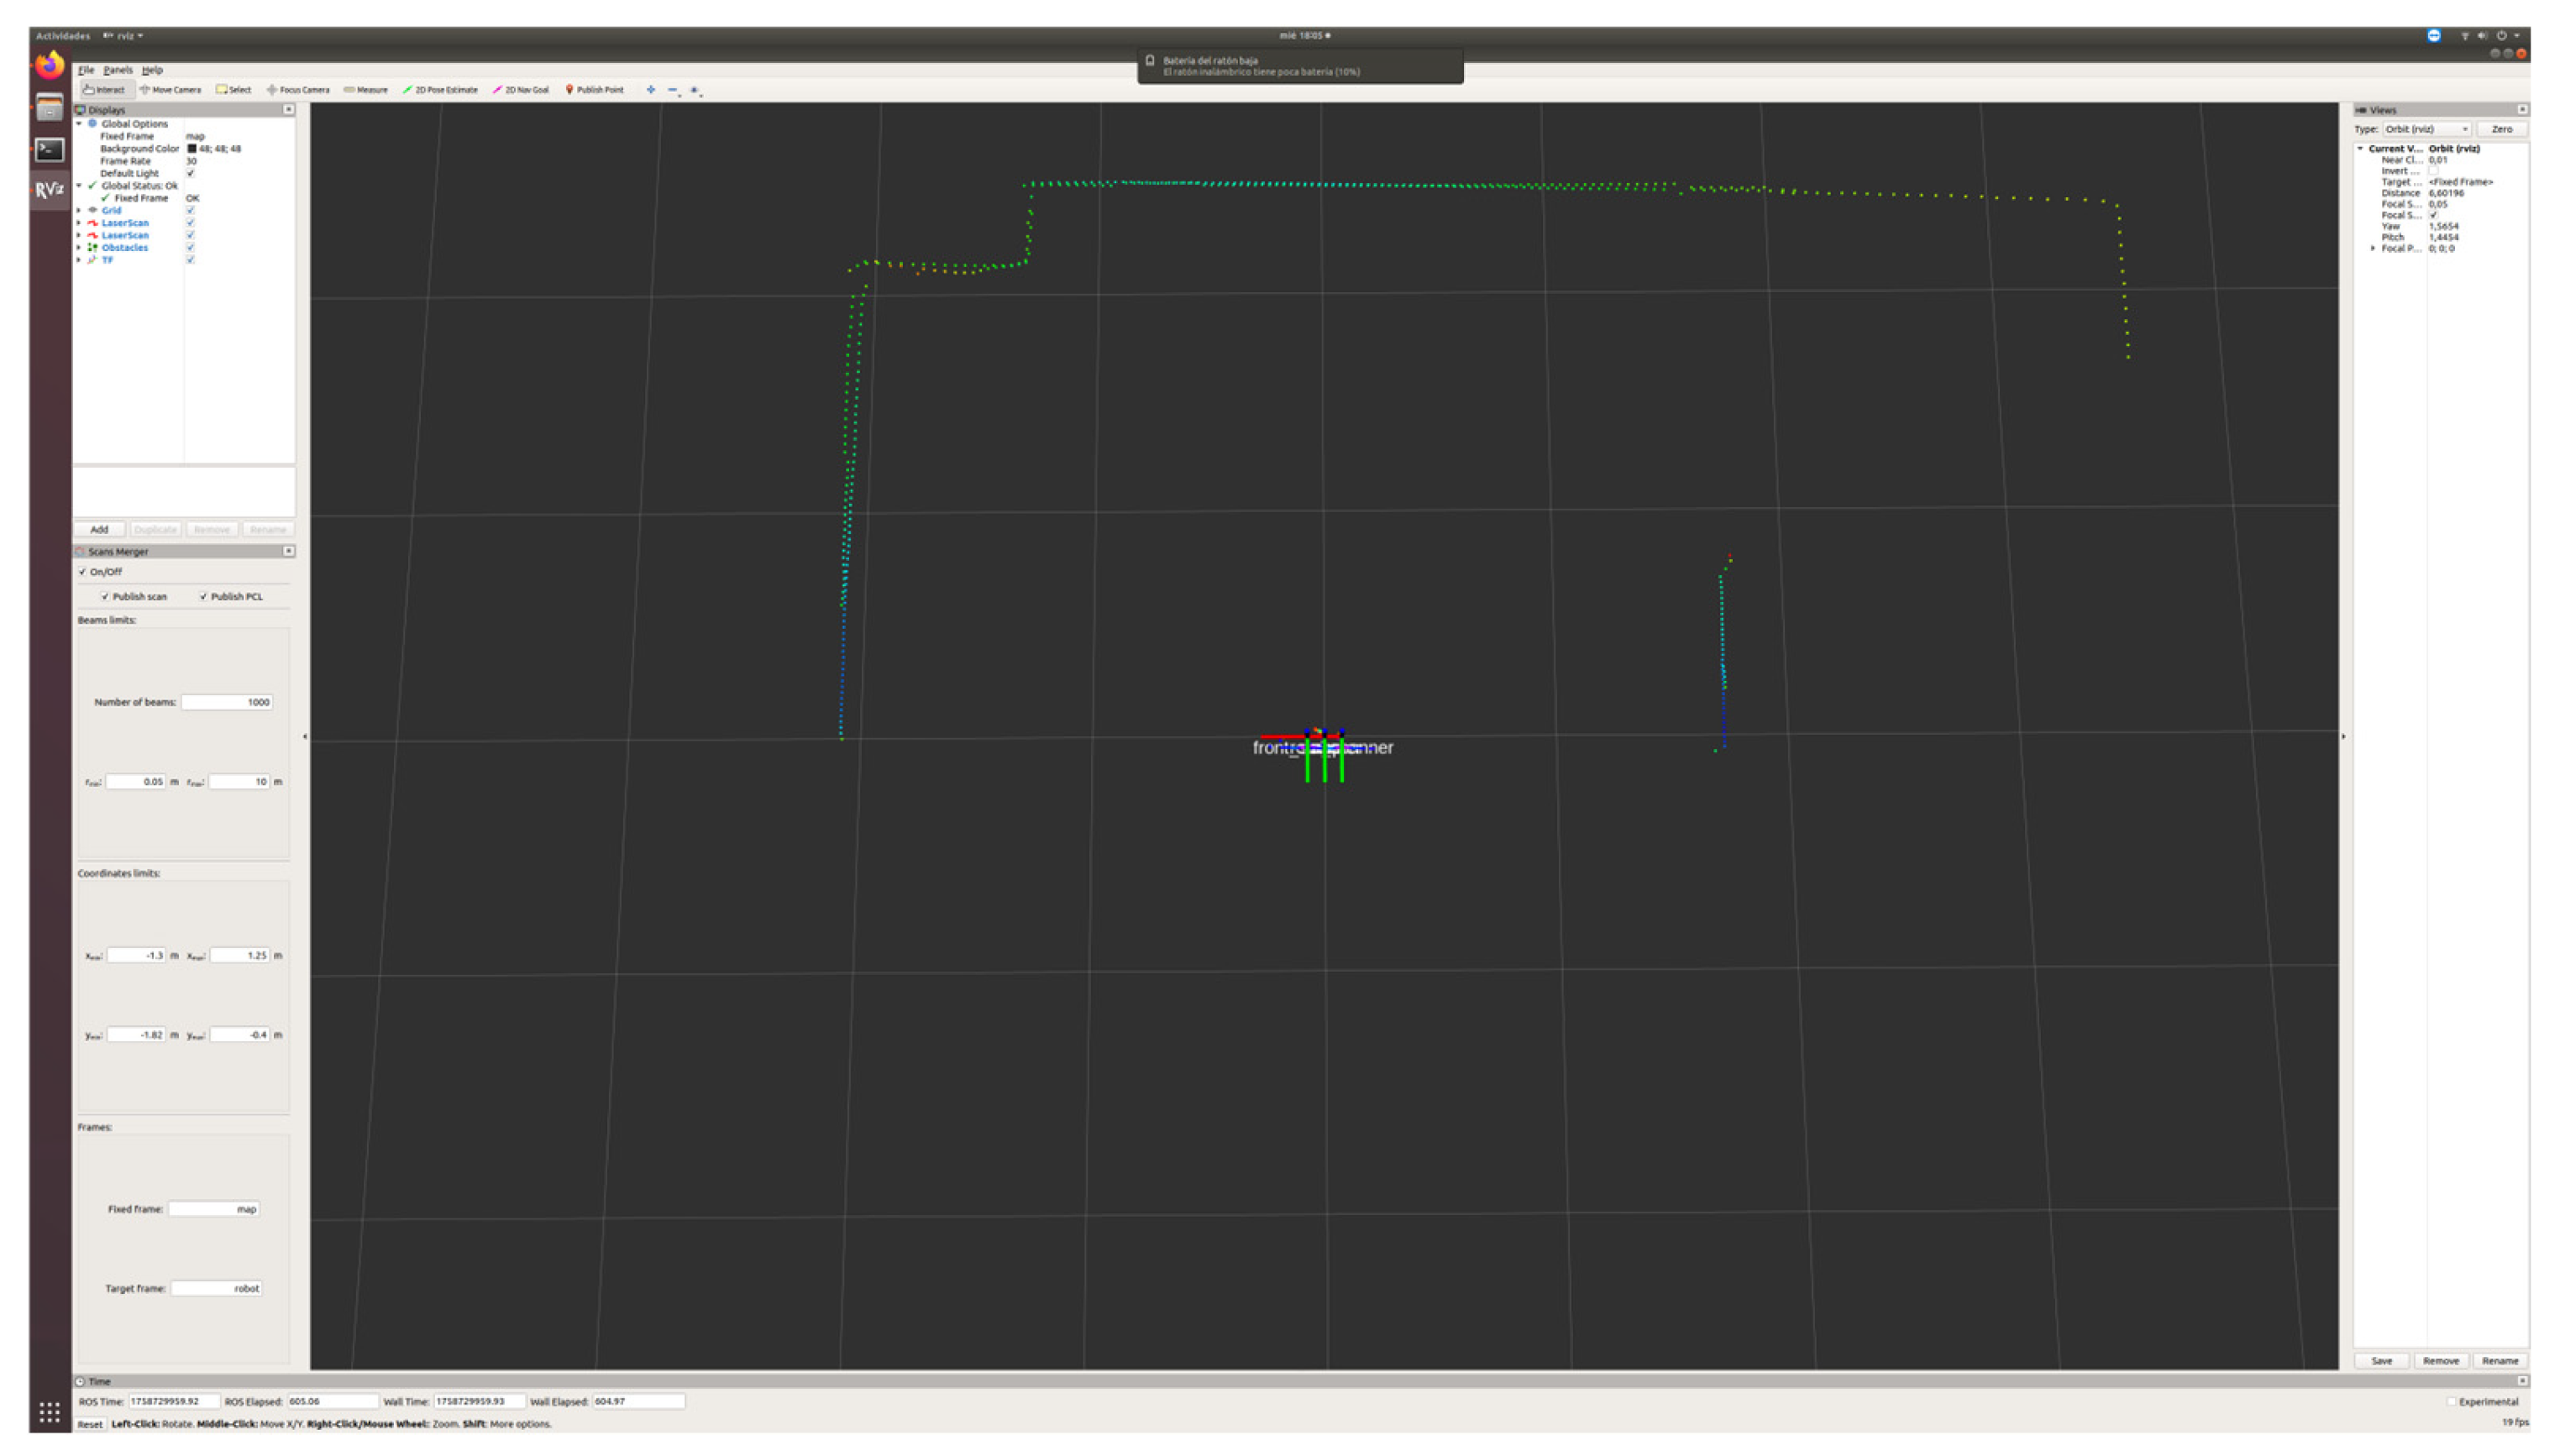
The flow of data within the system follows a clear sequence that connects physical detection with immediate visual feedback. First, the sensors capture the environment in the form of point clouds, where both static geometries (e.g., the wall surface) and dynamic disturbances produced by the user’s gestures (finger approach or pressure on the surface) are represented.
Figure 4 shows the visualization of these point clouds in RViz, showing how the sensors are able to differentiate the wall and other elements present in the environment.
Subsequently, the raw data is continuously sent to the microcomputer through ROS topics, where the information is centralized and managed in real time.
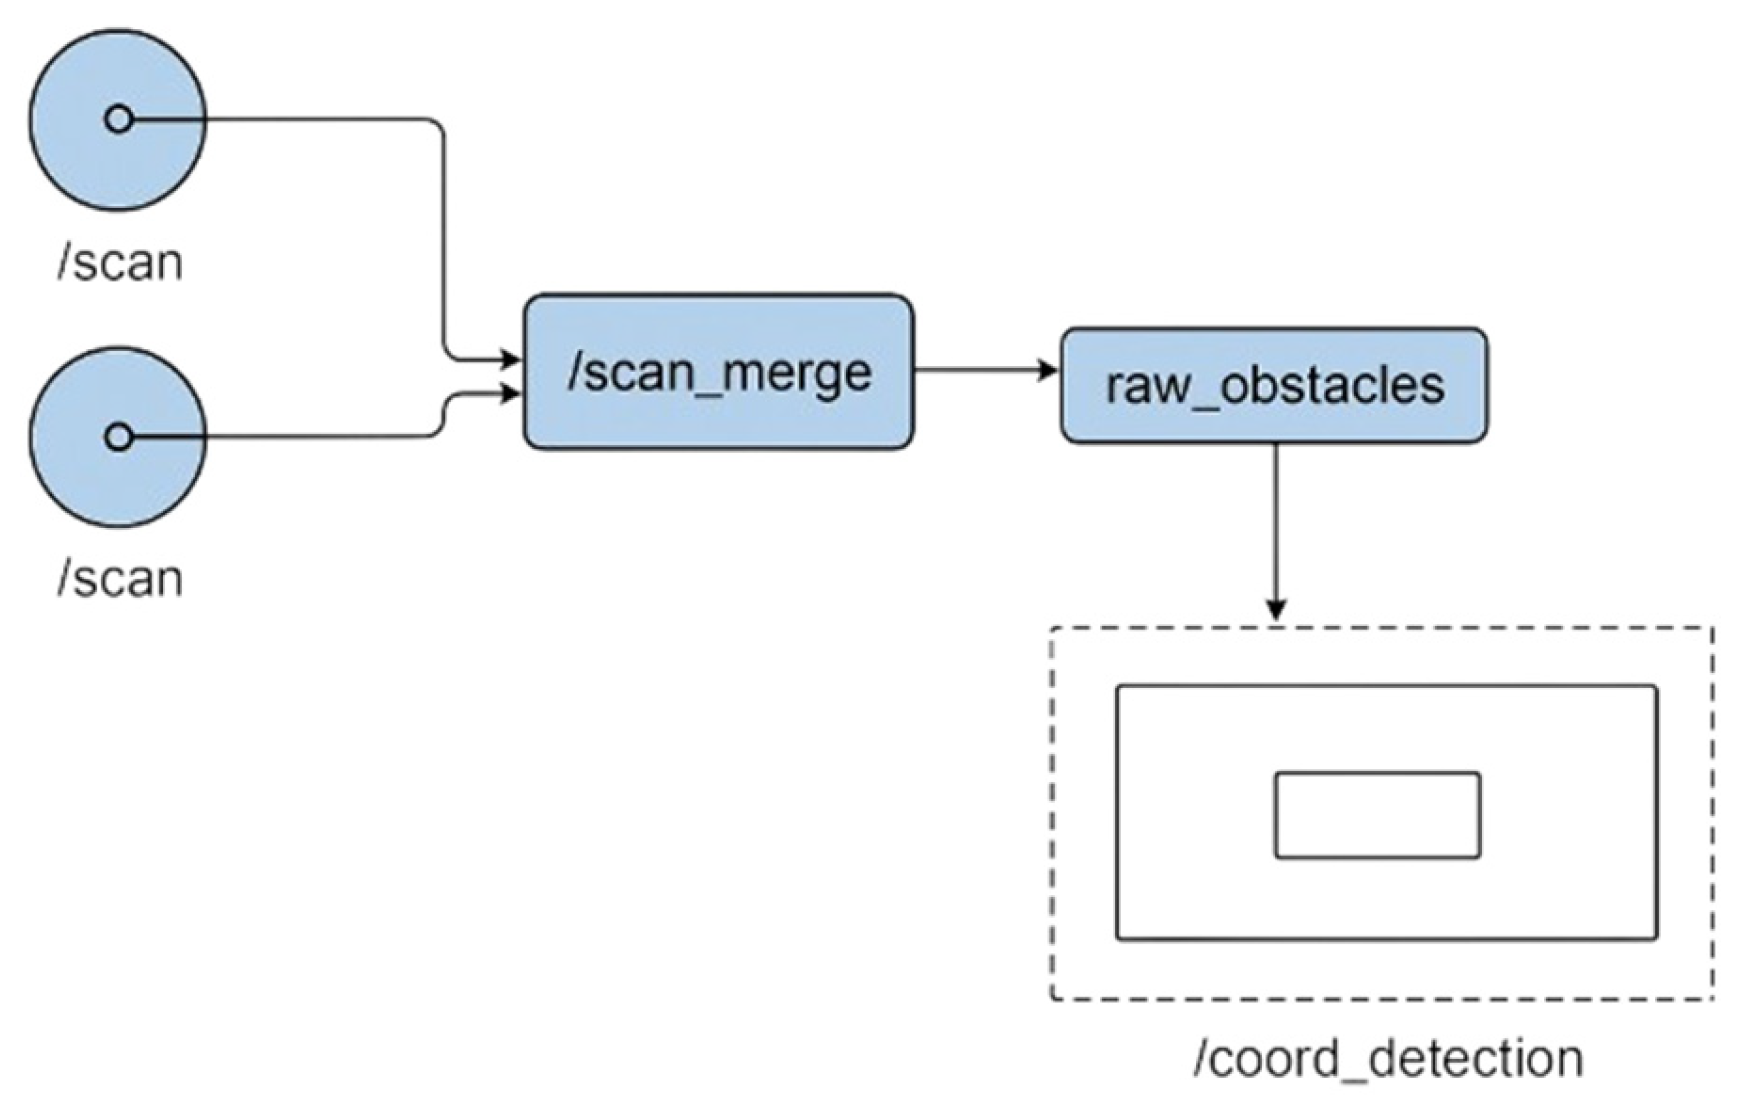
To optimize capture, the point clouds generated by each sensor are merged into a single reference frame, expanding the effective field of view and reducing shadow areas. Figure 5 illustrates the overall flow of processing, from capture to final projection of interaction events.
The processing within ROS1 Melodic is organized around several nodes and topics that structure the flow of information from capture to final detection.

3.2.4. Data Detection and Fusion Logic with ROS

First, each sensor publishes its scan readings in the standard /scan topic, where measured distances within the sensor’s field of view are recorded in real time. This data, while complete, is limited to the perspective of each device.
To overcome this limitation, a point cloud fusion node was implemented that combines the publications of the two sensors into a single topic called /scan_merge. This step is essential to expand the field of view and reduce blind spots, as each sensor provides information from a different angle.
The fusion process implemented in the /scan_merge topic is based on a geometric alignment using static transforms between the two LIDAR sensors, defined through the tf ROS package. Each sensor publishes its scan data in its own reference frame (/lidar_1 and /lidar_2), which are related to a common base frame using a fixed transformation matrix established during calibration. The fusion node converts the polar data from each sensor into Cartesian coordinates and projects them onto this shared frame, eliminating overlapping points through distance thresholds and angular interpolation. This approach provides a continuous and unified 2D representation of the interaction area without requiring iterative registration methods such as ICP, since both sensors are rigidly mounted and their spatial relationship remains constant after calibration. The resulting merged scan extends the field of view and minimizes occlusion zones while maintaining real-time performance.
Once the merged cloud is obtained, the raw_obstacles package is used, which processes the data in /scan_merge to detect objects in real time. This node publishes the information in a new topic, limiting detection to only a defined rectangle in the projection area. This spatial restriction ensures that only objects that interfere with the projected surface (e.g., a finger, a hand, or any object such as a ball) are considered interaction events, preventing false detections outside the area of interest. As can be seen in Figure 5, the diagram illustrates the data processing flow from capture by sensors to projection of the interaction.
To clarify the operational details of the package, it is important to note that the system operates by creating a virtual, invisible detection plane, akin to a “light curtain”, rather than using a physical background for subtraction. A fixed rectangular area of interest is defined in the sensors coordinate frame, and any measurement outside this area is disregarded. An interaction is registered only when an object, such as a user’s hand or a pointer, physically enters this predefined virtual space.
The package processes the incoming merged point cloud in real-time and employs a Euclidean distance-based clustering algorithm to group nearby points that have entered the detection area. These groups, or clusters, are treated as distinct interaction events. For each valid cluster identified, the system calculates its geometric centroid to determine a single, precise coordinate for the interaction. This centroid’s coordinate is then published to the /coord_detection topic, effectively translating the physical intrusion into the virtual plane into a digital click event.
The package processes the incoming merged point cloud in real-time and employs a Euclidean distance-based clustering algorithm. For full replicability, the key configuration parameters are as follows:
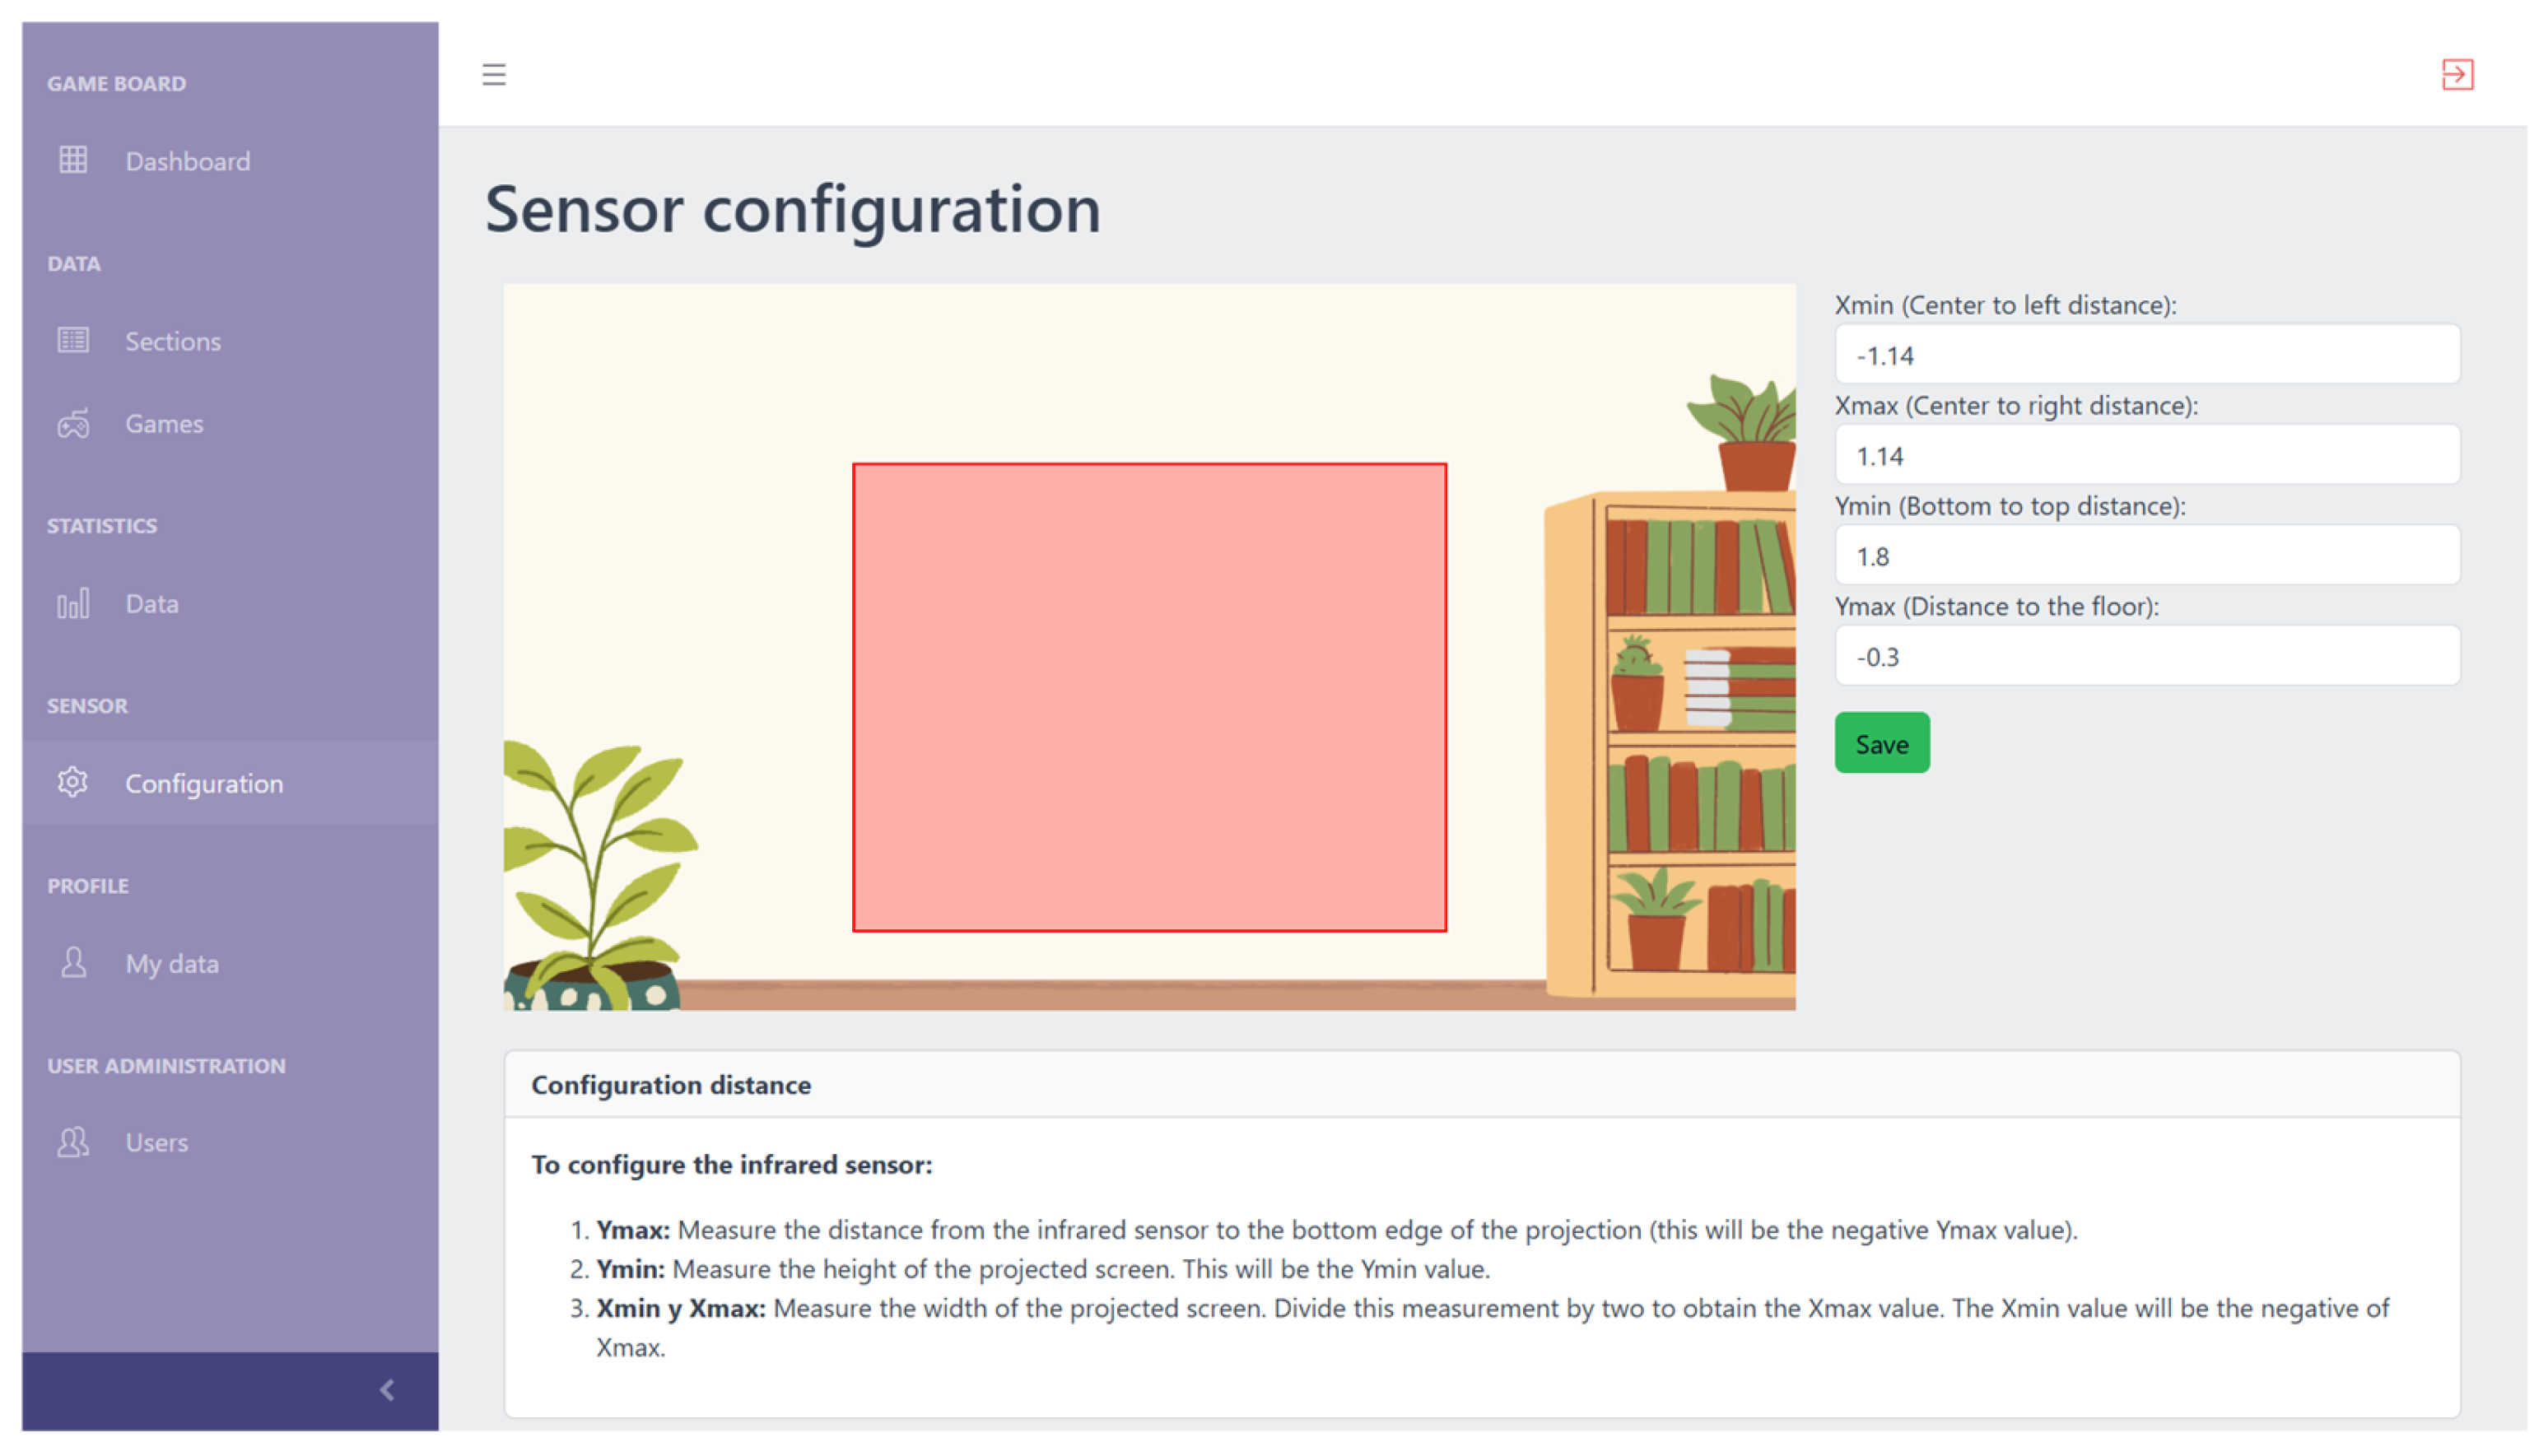
  • Area of interest boundaries: The detection is constrained to a rectangular area defined by xmin, xmax, ymin, and ymax. These values are dynamically configured through our web platform to match the dimensions of the projected screen, effectively creating the virtual detection plane.
  • Minimum cluster size (min_points): This parameter is set to 4. This threshold ensures that small, spurious detections (e.g., electronic noise or dust particles) are filtered out, and only clusters with at least four points, typical of an intentional interaction, are considered valid.
  • Clustering distance (cluster_dist_euclidean): This is set to 0.05 m. This value defines the maximum distance between two points for them to be considered part of the same cluster, which is effective for grouping points generated by a hand or a small object.
  • Frame ID: All detections are processed within a unified coordinate frame, typically base_link, ensuring consistency between the two LIDAR sensors.
The result of this processing is transmitted in the topic /coord_detection, which contains the exact coordinates of the detected collision point within the delimited area.

3.2.5. Coordinate Mapping

The coordinates published in /coord_detection correspond to the ROS reference system, expressed in meters with respect to the physical position of the sensors. However, in order for these positions to be interpreted in the projected visual plane, it is necessary to carry out a process of transformation towards the coordinate system of the screen.
This procedure was implemented in a custom node developed in Node.js, which subscribes directly to the /coord_detection topic and applies the corresponding scaling formulas. The node performs a linear transformation of coordinates, adapting the information from the physical space (meters) to the digital space (pixels).
In general, the transformation can be expressed as Equations (1) and (2):
x p a n t a l l a =   x x m i n x m a x x m i n   · s c r e e n _ w i d t h
y p a n t a l l a = 1 y R O S y m i n y m a x y m i n · s c r e e n _ h e i g h t
where
  • x R O S and are the coordinates published in /coord_detection y R O S .
  • x p a n t a l l a ,   y p a n t a l l a are the equivalent positions in the projected interface, i.e., the coordinates within the screen where the click will be made.
  • x m i n , x m a x ,   y m i n , y m a x correspond to the boundaries of the detection rectangle defined in the raw_obstacles packet, i.e., they delimit the area detected by the sensor.
  • s c r e e n _ w i d h t   y   s c r e e n _ h e i g h t represent the resolution of the screen (or projector).
This mapping ensures that a physical point detected on the wall corresponds exactly to a position within the projected screen, ensuring consistency between the user’s gesture and visual feedback.

3.2.6. Transforming Detections into User Actions

Once the physical coordinates detected by the infrared sensors have been transformed into the reference system of the projected screen, the next step is to convert these detections into user actions on the visual interface.
This process is implemented by a node in Node.js that subscribes to the topic /coord_detection. The node receives in real time the pixel positions resulting from the mapping and interprets them as events equivalent to user interactions on the projection.
The generation of these actions is done programmatically, emulating standard input events of the operating system, which allows any projected application to react as if it were a physical click or touch. This approach ensures that every gesture detected in the physical space is accurately translated, consistently, and synchronized onto the projected surface, while maintaining the fidelity of the user-system interaction.
In this way, the processing flow is completed: from data acquisition in /scan, through fusion in /scan_merge, detection filtered with raw_obstacles, publication of coordinates in /coord_detection, to the transformation of these detections into user actions on the projected interface.
The end result validates the system’s ability to turn any flat surface into a functional touchscreen, ensuring that physical gestures correspond to the projected digital interaction accurately and reliably.
It is important to note that the system’s primary interaction model is based on discrete “virtual click” events. This point-and-click mechanism is compatible with a wide range of H5P content types, including many activities that offer a two-click alternative for drag-and-drop functionalities (i.e., one click to select an object and a second click to place it). However, the current implementation does not support continuous gestures such as direct dragging, dropping, or drawing.

3.3. Materials Used

To build the prototype, different materials and components were used to meet the needs of detection, processing and projection. These include, on the one hand, the main electronic devices, such as the processing unit and the sensors responsible for capturing information from the environment, and on the other hand, the physical and assembly elements, which ensure the correct integration of all the parts into a compact and functional system.
In Table 2 the main materials and components that were used to build the prototype are shown. The list includes the mini PC in charge of processing, the LIDAR sensors for detection, the projector as a user interface, as well as cables, connectors, 3D printing materials and a carrying case. All these elements were chosen to ensure that the system can function properly, be stable and easy to transport.
While the total estimated cost of our self-contained prototype is EUR 2602, it is important to clarify that this figure is primarily driven by the inclusion of a high-end, ultra-short-throw projector (EUR 1500) selected to create a fully portable, all-in-one demonstration unit. A core design principle of our platform is modularity and compatibility with existing infrastructure to ensure affordability.
The interactive system itself—comprising the processing unit and LIDAR sensors—is display-agnostic. It is fully compatible with any standard projector or display screen that accepts an HDMI connection. This means that educational institutions can integrate our technology with their existing classroom projectors, drastically reducing the barrier to adoption. By leveraging equipment already on hand, the implementation cost is limited to the core detection and processing hardware, making the solution significantly more accessible and aligning with our primary goal of creating an affordable and impactful STEM education tool.
In terms of object detection, the prototype has been developed using two different types of LIDARs to evaluate their effectiveness and size. The system is designed to operate with two units of the same sensor type, either using both RPLIDAR S2 or both FHL-LD19, but in no case is it necessary to have both types of sensors to develop a prototype.

Component Selection Criteria

Each component of the prototype was selected according to criteria of performance, cost and ease of integration. The ultra-short throw projector was chosen not only for its ability to generate large images at close range, but also for its compatibility with educational environments where the user’s proximity to the projected surface is unavoidable. The A2 and LD-19 LIDARs were selected for their reliability, detection range, and refresh rate, which ensure data is captured quickly enough to maintain smooth interaction. The microcomputer, on the other hand, offers a versatile processing platform that is powerful enough to run point cloud analysis algorithms in real time without requiring high power consumption or a complex cooling system.

3.4. Web Platform

The web platform is the core of interaction between users (teachers and students) and the multi-agent system. It was designed with a modular architecture based on frontend and backend, which allows both its deployment on a separate server and its execution locally on the microcomputer integrated within the portable kit. This flexibility ensures that the system can be used in educational environments without the need for an internet connection, or integrated with wider infrastructures in institutional networks.
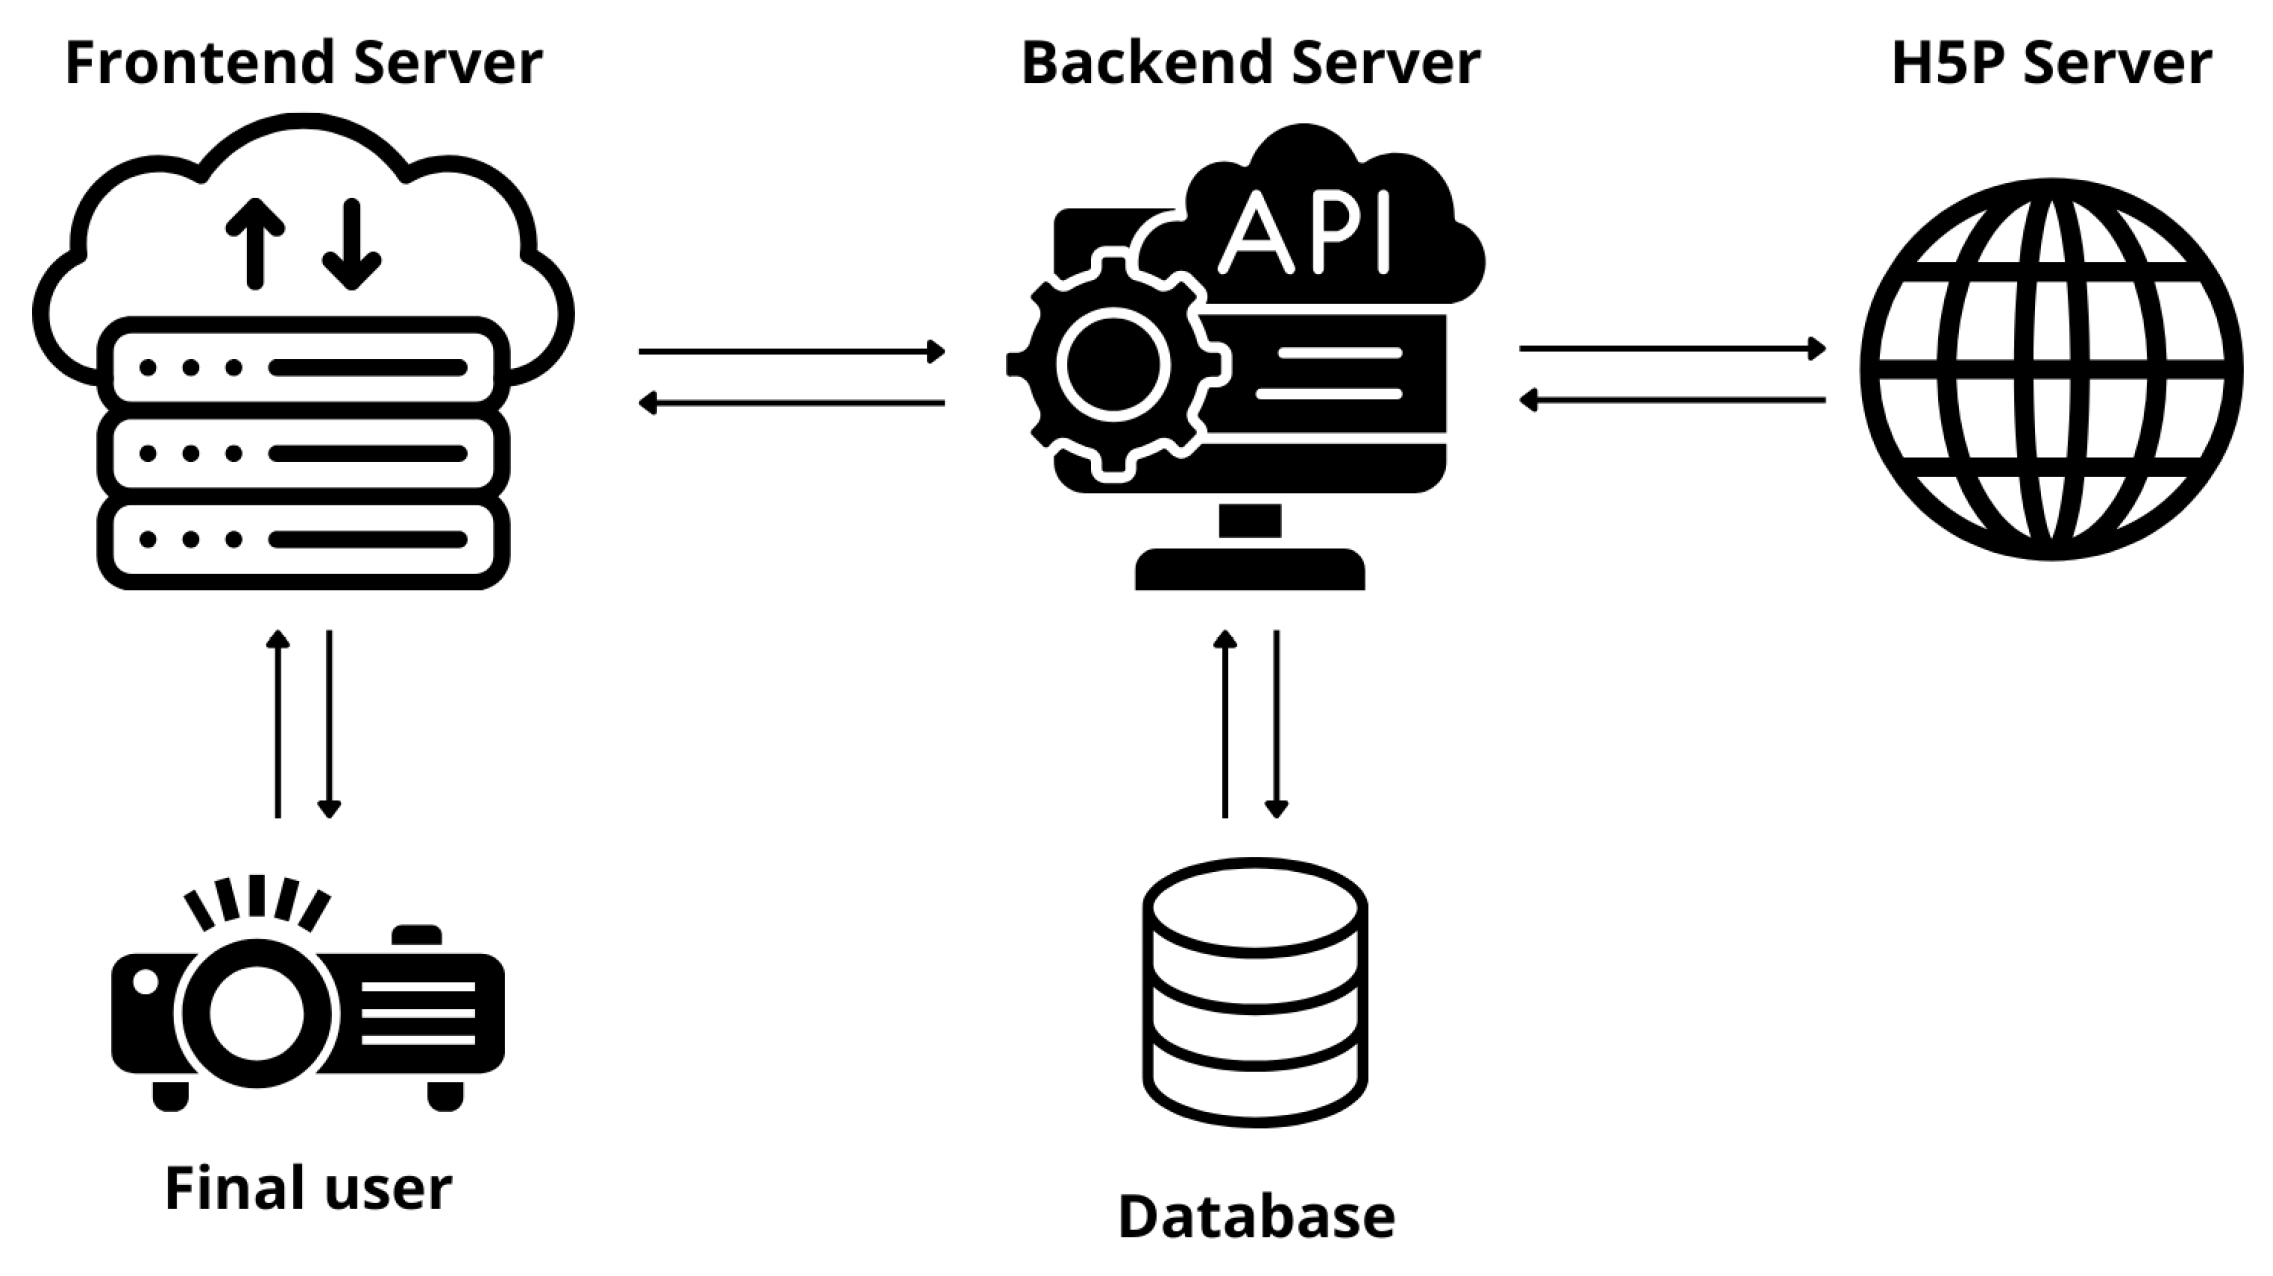
In Figure 6 the general architecture proposed for the web platform is shown.

3.4.1. Web Platform and Activity Management

The development of the physical prototype is accompanied by a web platform that plays an essential role in the management of educational activities, the customization of the system and the subsequent analysis of user performance. This platform constitutes the link between the hardware layer responsible for detecting interactions on the projected surface and the pedagogical field, where these interactions are translated into learning and evaluation dynamics. From its conception, the platform was designed to offer an intuitive interface for teachers and a solid architecture capable of storing, processing and analyzing the information generated in each session.
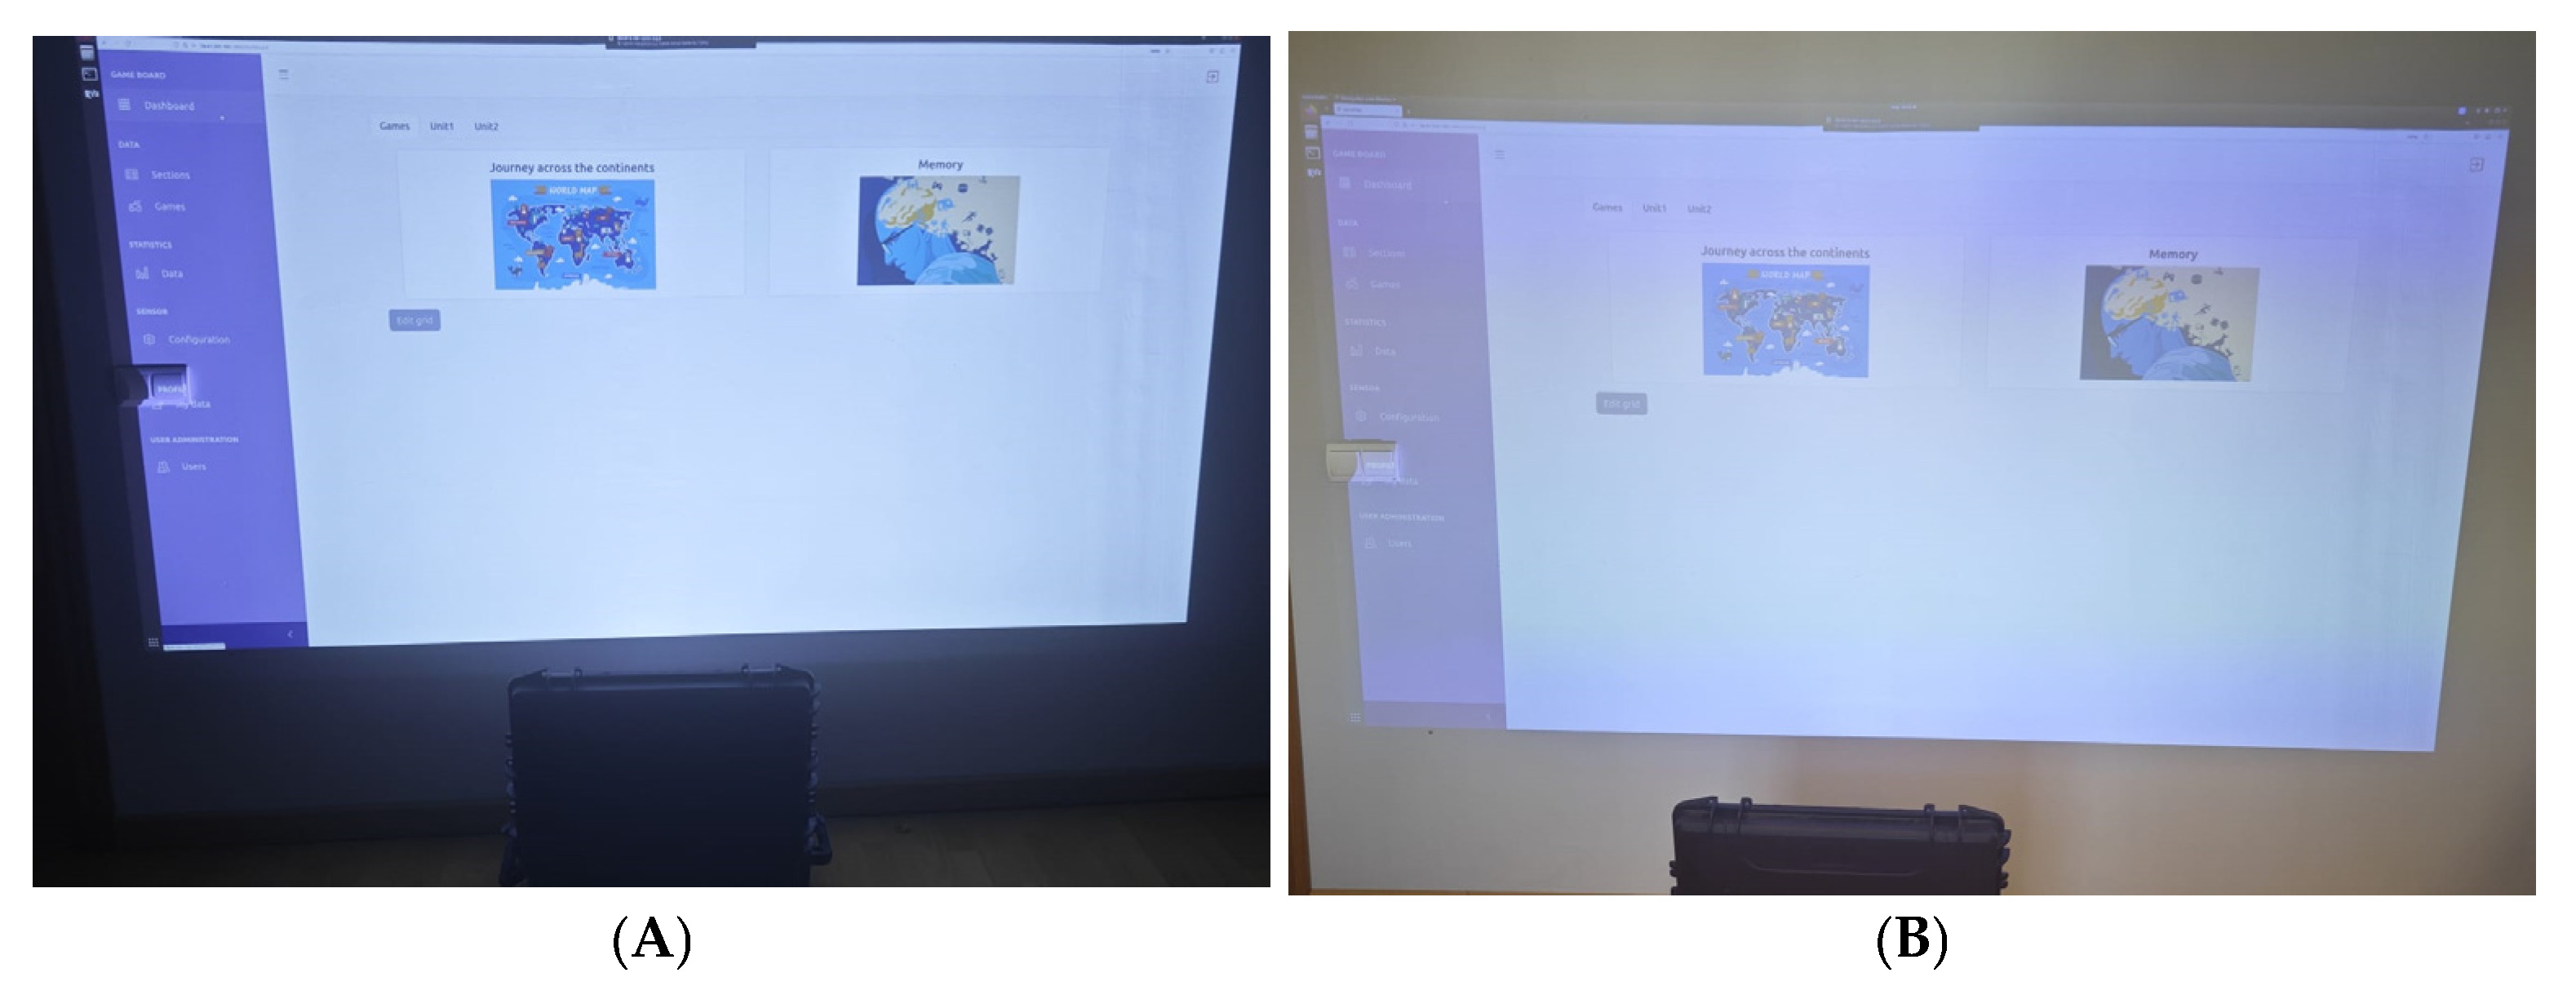
The integration between the hardware and the web platform is articulated in two complementary directions. On the one hand, the application allows you to enter fundamental physical parameters for the correct calibration of the detection system. As explained in the previous section, the user can specify the dimensions of the projected surface and the height at which it is located with respect to the ground (see Figure 7). These values are stored on the platform and are automatically used by the microcomputer software to define the spatial transformation between the point cloud captured by the LIDARs and the area visualized by the projector. Thanks to this mechanism, the platform becomes the central control point to ensure that the interaction is accurate and consistent with the physical deployment environment.
On the other hand, the platform constitutes the repository where the educational content that will be projected in the classroom is managed. This ensures that the system is not just a detection device, but a complete pedagogical tool that integrates hardware, software, and content.
The web platform is structured into different modules that respond to the roles of the different actors involved. The authentication and user management module allows each teacher to access their personal account, which includes both the activities created and those selected from a common catalog. The system contemplates two main profiles: teacher and administrator.
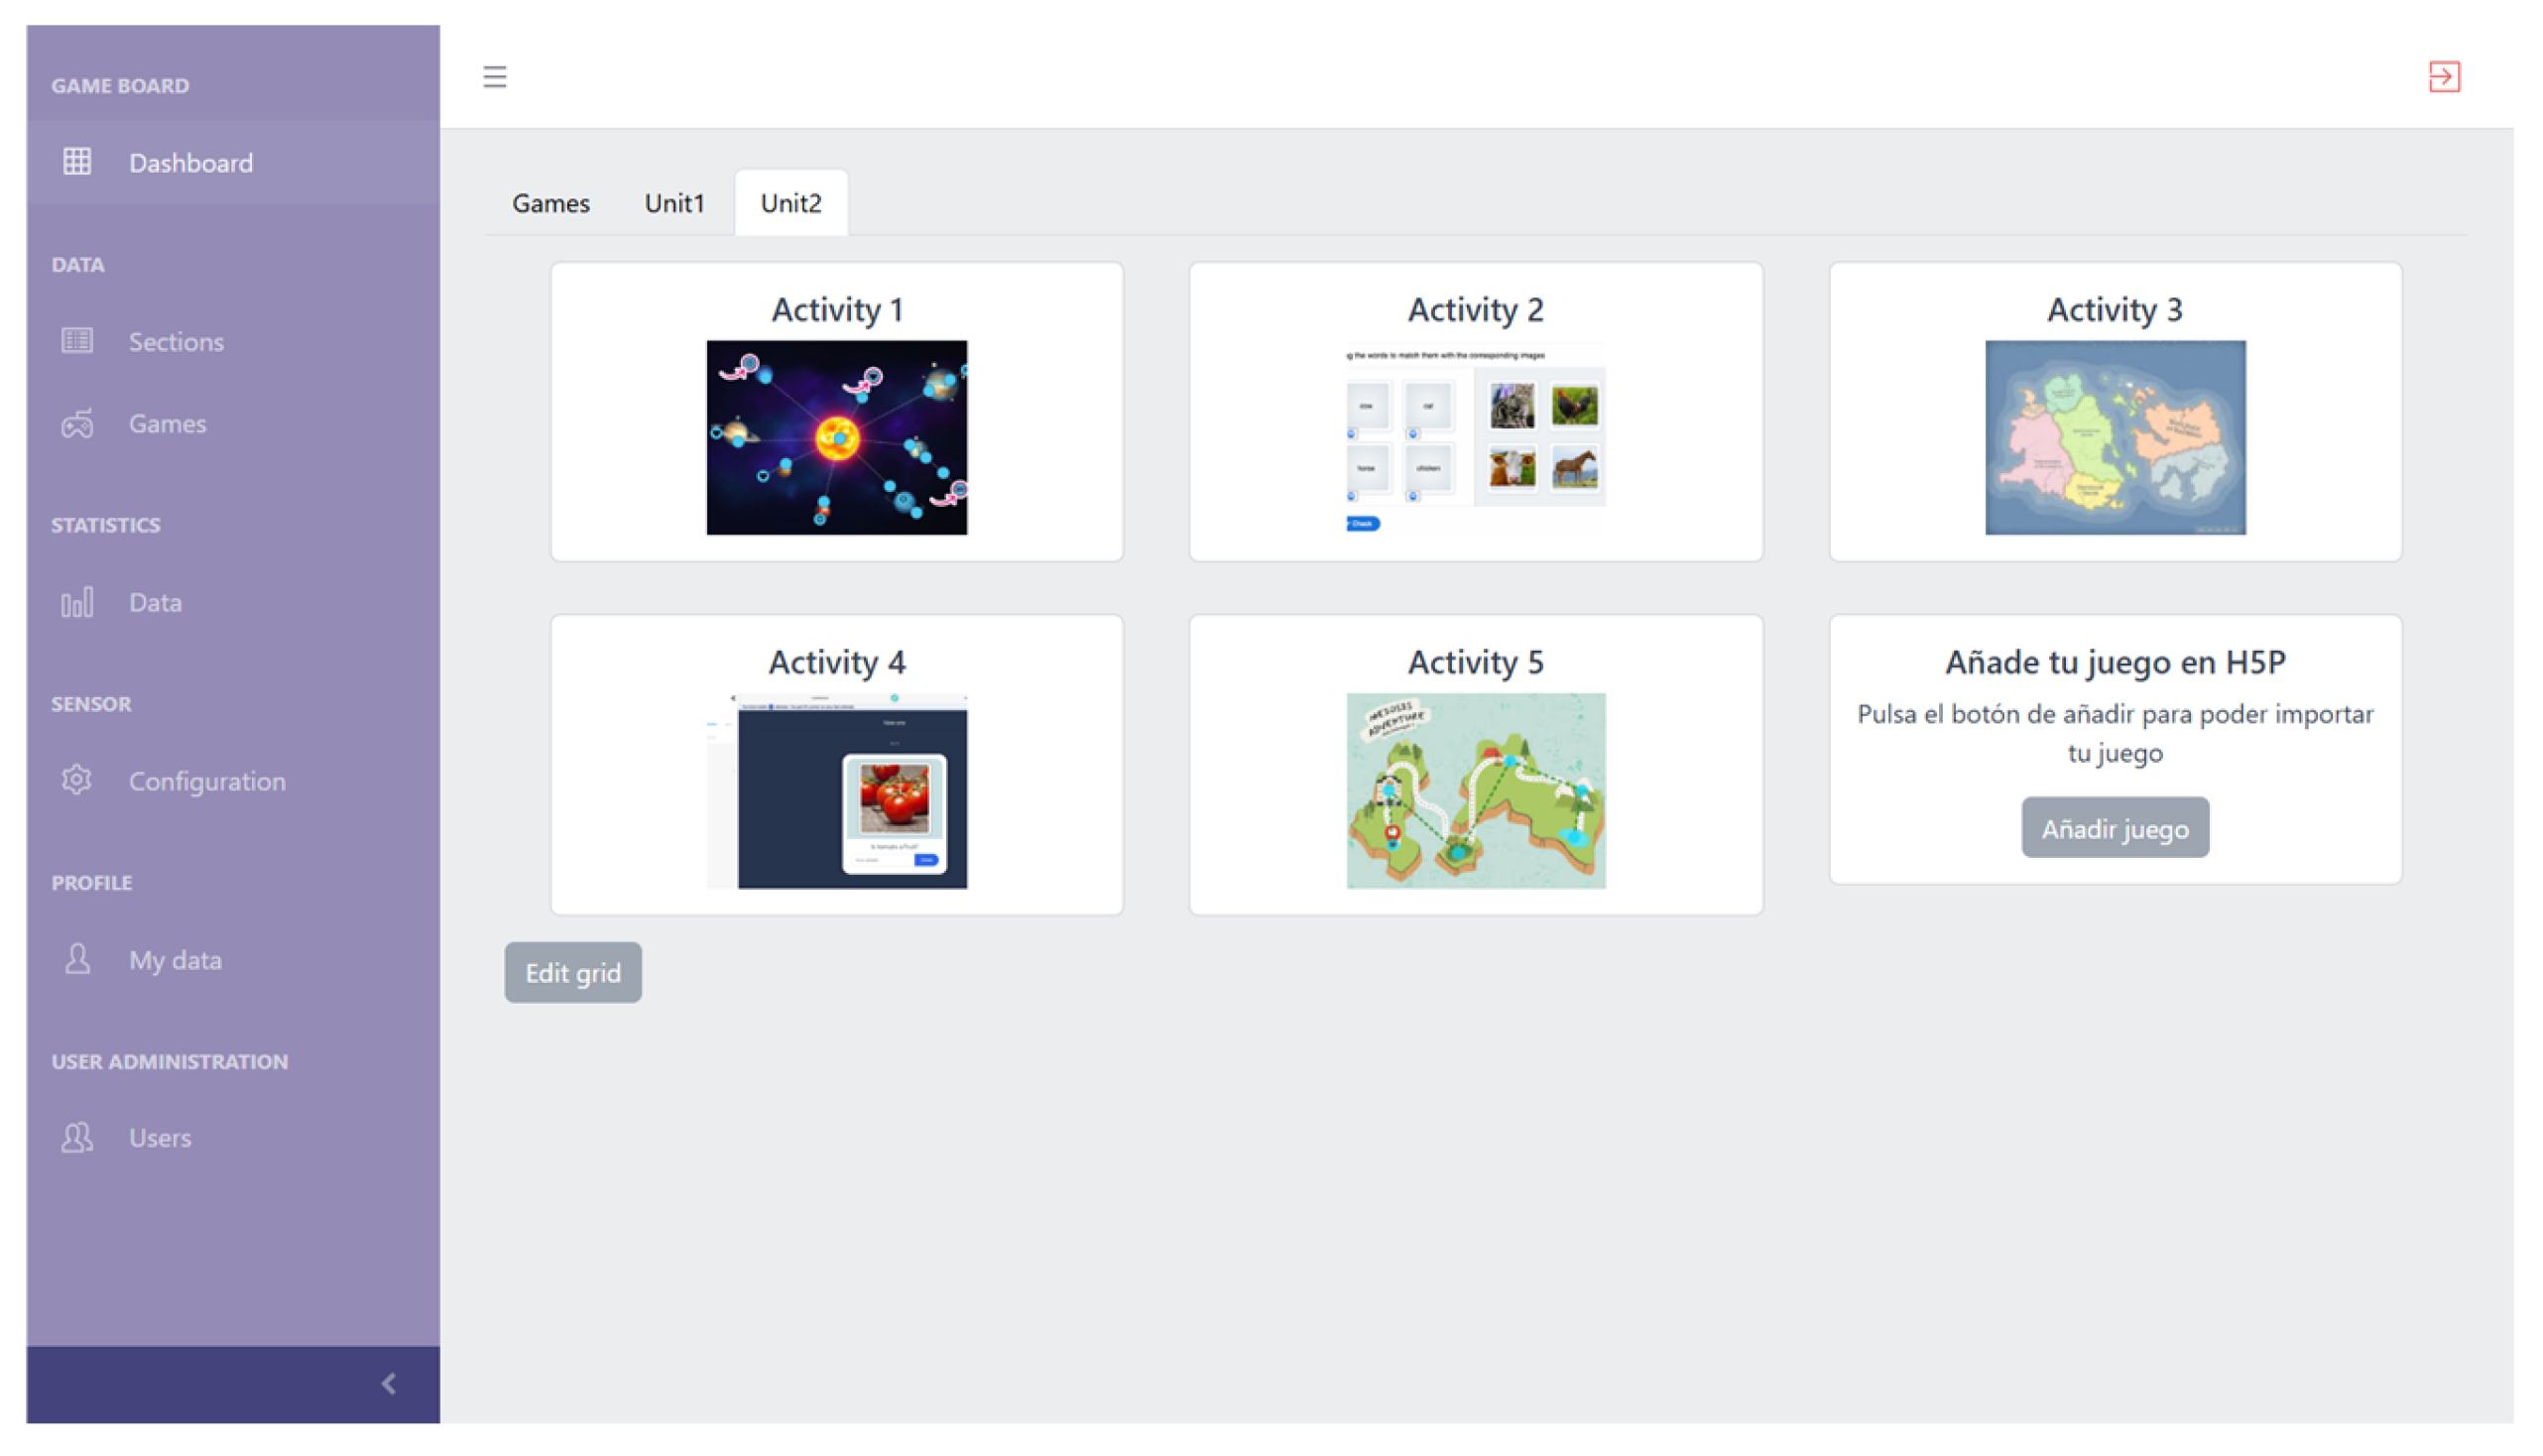
The teacher has a working environment in which he or she can design, select and organize interactive activities. To this end, the H5P standard has been integrated, widely used in educational contexts due to its versatility and compatibility with web browsers. H5P allows you to generate activities of different nature, such as quizzes, association games, memory exercises or drag-and-drop activities. These activities (see Figure 8) are stored in the teacher’s account and can be projected onto the interactive surface, so that students interact directly on them.
The administrator, on the other hand, has a set of additional tools aimed at monitoring and configuring the system. Its functions include the possibility of registering and managing users and controlling access permissions.
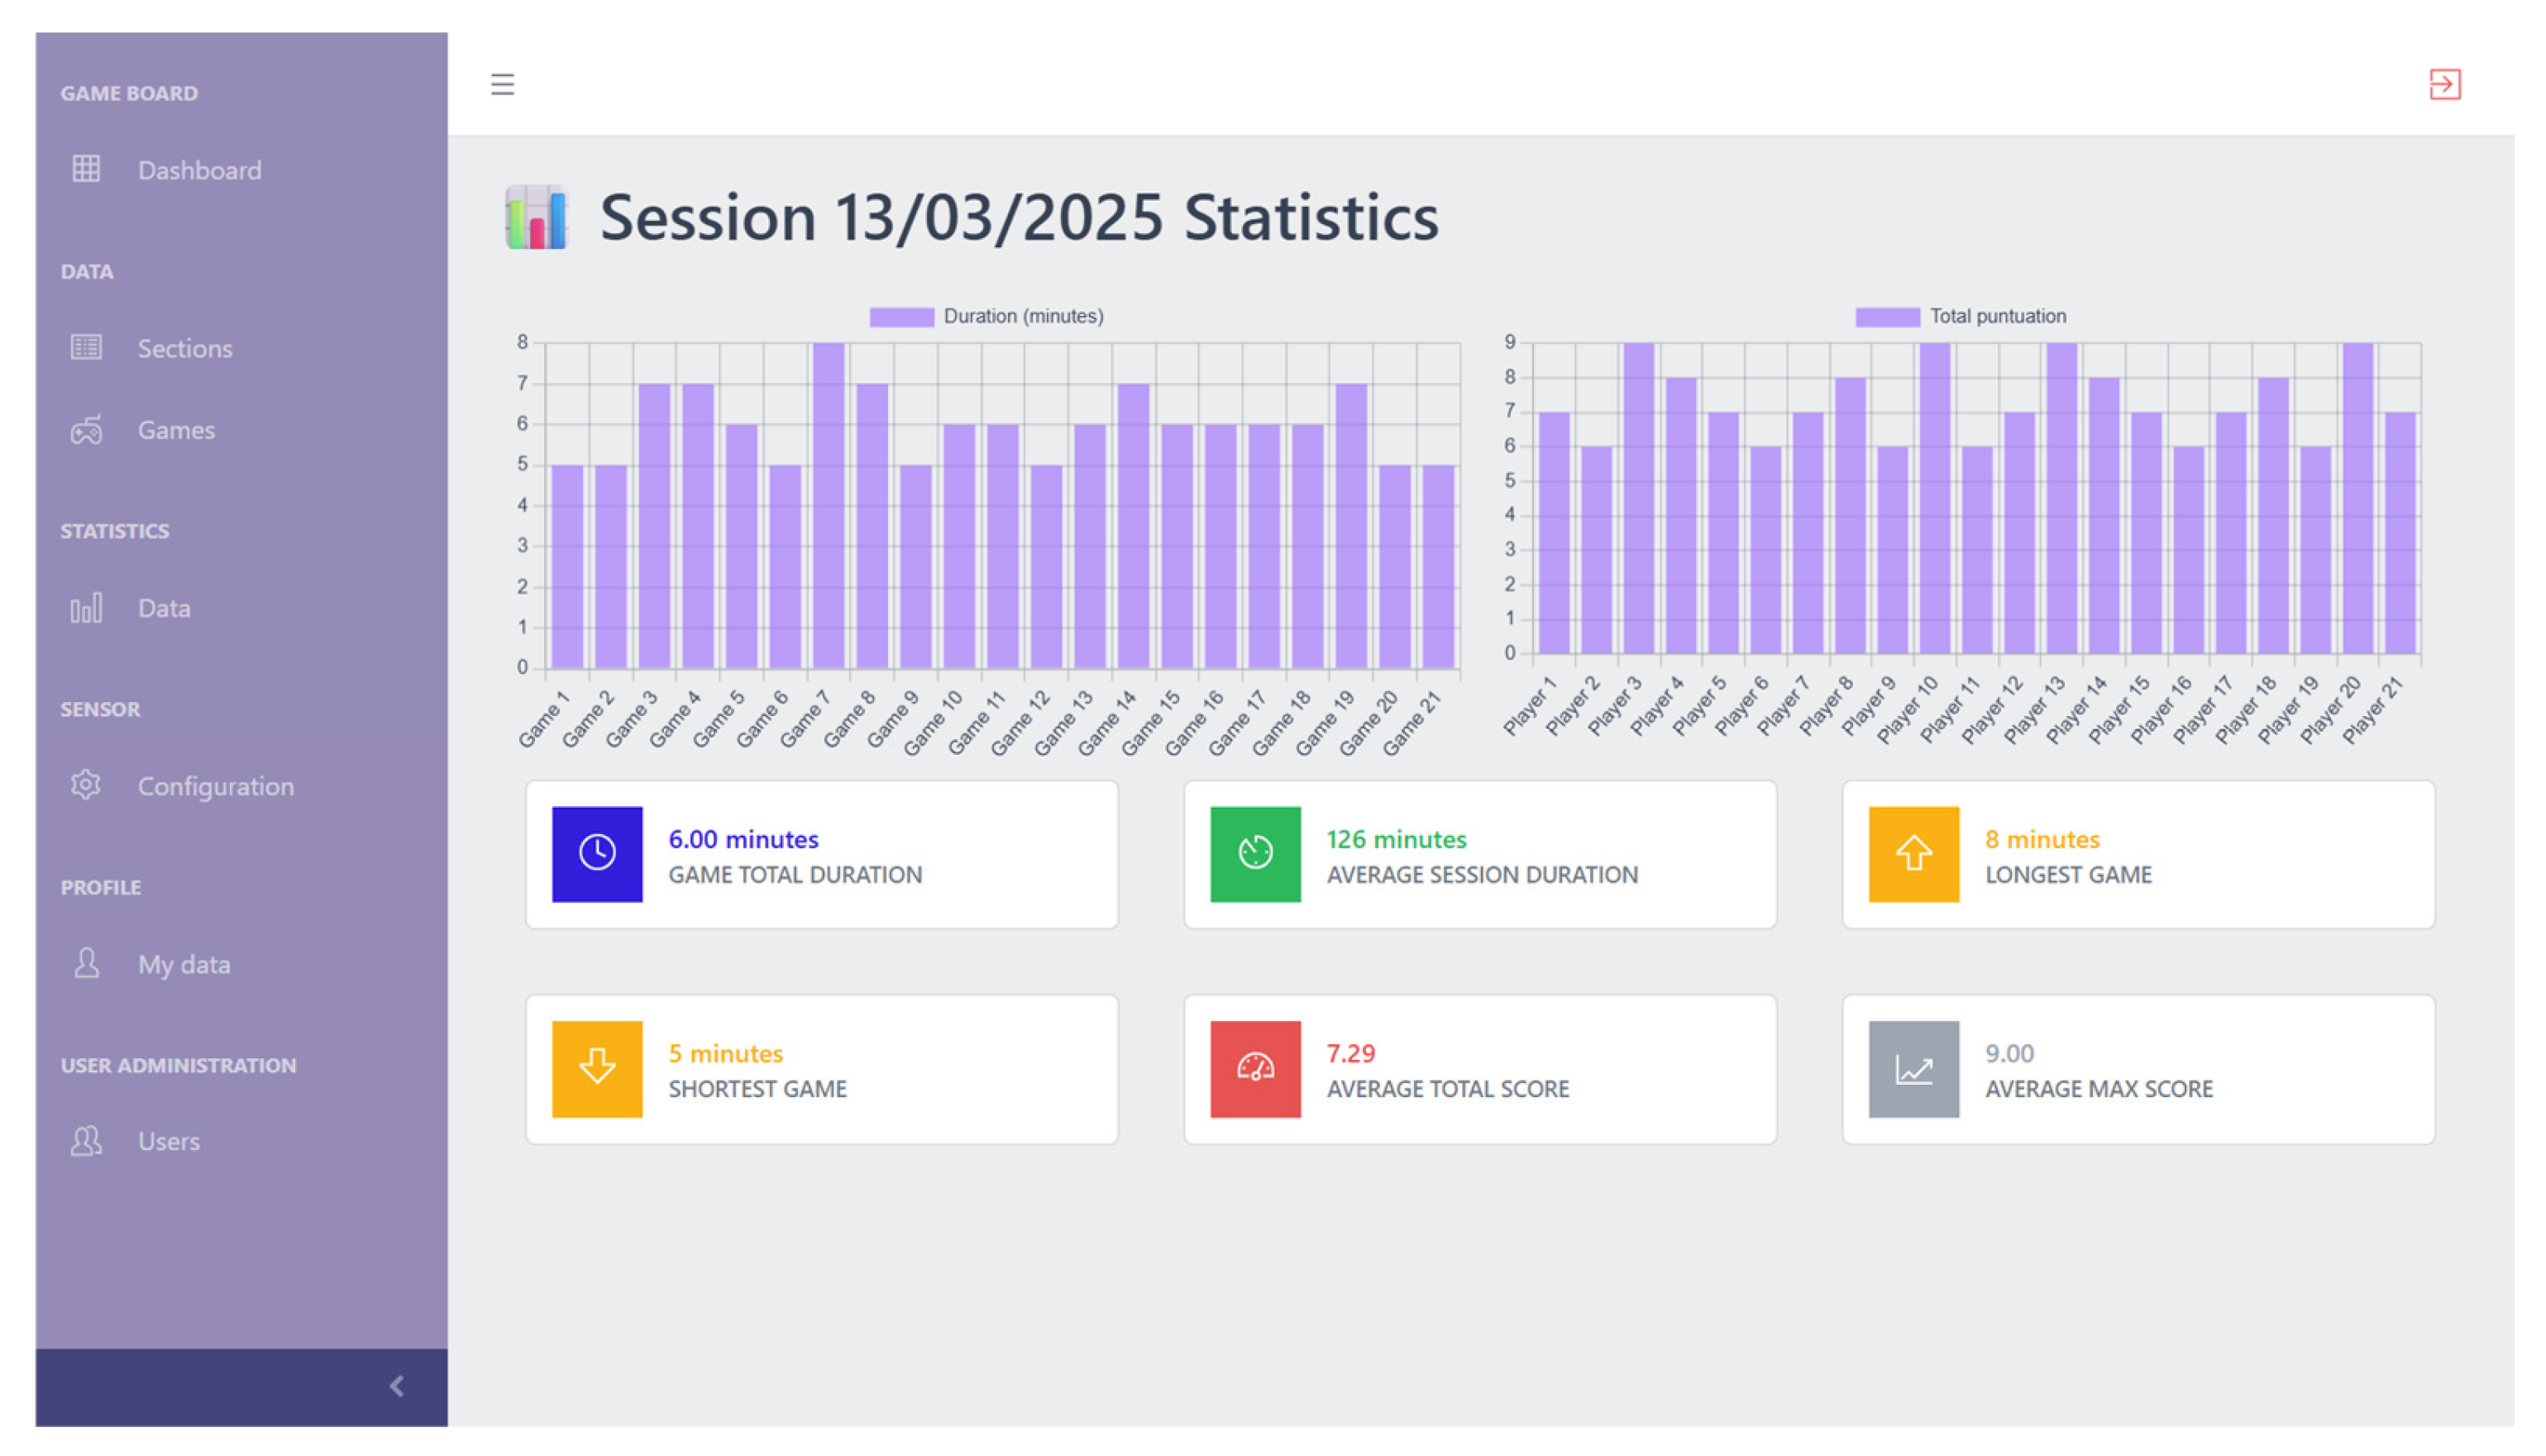
One of the most relevant contributions of the platform is its ability to systematically record the interactions carried out during each session. Each time an activity is executed, the system generates a CSV file that contains detailed information about the performance of the group or individual. The parameters collected (see Figure 9) include, but are not limited to, the total time spent on the activity, the total score for the activity per student, and then the average time of an activity is calculated, the average time of the entire session, what was the shortest and longest time to complete the activity, the average score of the session, and what was the highest score of the session.
This data, which is initially generated through H5P’s own official website or through an LMS, is then uploaded to the web platform, where it is stored and made available to the teacher. In this way, the teacher can access a complete history of the sessions, allowing them to make a deeper analysis of their students’ progress. In addition, the availability of data in structured format opens the door to statistical exploitation and the future incorporation of learning analytics algorithms, with which it would be possible to identify patterns of behavior, recurrent difficulties or atypical response times.

3.4.2. Frontend Server

The frontend of the web platform functions as the graphical user interface and constitutes the access point for both teachers and students. It has been developed as a modern SPA (Single Page Application) type application, which ensures a smooth and accessible experience from any standard browser without requiring additional installations on the client. Through this interface, users can manage accounts with different levels of permissions, organize and add educational content in H5P format within thematic sections, configure activities and visualize the results obtained by students. In addition, the system offers evaluation dashTables that present individual and group metrics, and provides tools to easily adjust sensor parameters, such as detection area or calibration, without the need for advanced technical knowledge. The communication of the frontend with the backend is carried out exclusively through REST APIs and WebSockets, which guarantees a clear separation between the presentation logic and the business logic, favoring the modularity and scalability of the system.

3.4.3. Backend Server

The backend of the web platform forms the central logic layer of the system and acts as an intermediary between the user interface, educational content, and the database. Its main function is to offer an API that allows you to manage and obtain stored information in a structured way, including users with their roles and permissions, links to interactive games in H5P format, activity configurations and evaluations resulting from student interaction. In this way, the backend not only ensures the persistence and consistency of the data, but also facilitates communication with the frontend and with the physical agents of the system, guaranteeing a flow of information in real time and a solid basis for the exploitation of metrics and performance reports.

4. Results

This section presents the results derived from the development and implementation of the proposed system. Given that the main objective of the work is the construction of a functional prototype capable of transforming any projected surface into an interactive one through the use of sensors and an ultra-short throw projector, the results are structured around two fundamental axes.
The first axis focuses on the preliminary technical validation of the prototype. The construction of a next-generation interactive system usually requires studies with end users that allow us to analyze aspects such as usability, pedagogical acceptance or the impact on learning processes. However, in this initial phase of the project, the main objective has been to test the technical feasibility of the system, ensuring that the selected components and the designed processing algorithms are integrated in a coherent way and offer stable operation in various usage scenarios. The evaluation carried out, therefore, should be understood as a first approach, focused on aspects such as stability under different lighting conditions, robustness in the detection of objects and gestures, and efficiency in different interaction modalities.
The second axis corresponds to an initial validation with real users, where it was sought to observe how people interacted with the games developed on the system and with different physical objects projected on the interactive surface. This experimental phase made it possible to collect both quantitative and qualitative data, derived from the performance of the participants during the recreational activities, as well as from the application of a survey based on the TAM (Technology Acceptance Model) [33]. With this, it was possible to identify perceptions related to ease of use, perceived usefulness and willingness to adopt this type of technology in educational and recreational contexts.

4.1. Preliminary Evaluation of the Prototype

The validation of a next-generation interactive system usually requires studies with end users to measure aspects such as usability, pedagogical acceptance or impact on learning. However, in this initial phase of the project the main objective has been to test the technical feasibility of the prototype, ensuring that the selected components and the implemented processing algorithms are properly integrated and provide stable operation in different scenarios. For this reason, the evaluation carried out should be considered preliminary, focused on verifying the stability under different lighting conditions, the robustness of the detection and the different forms of interaction.

4.1.1. Validation Methodology

To carry out this first validation, tests were designed in a controlled environment. The prototype was deployed in front of a projection surface of known dimensions. After completing the calibration using the web application, different interactive activities were planned and repeated interactions were carried out on the surface in order to check the consistency of the detection.
For this reason, the evaluation should be considered preliminary, focusing on three main axes:
  • Stability in different lighting conditions, with tests carried out both in the absence of ambient light and under intense lighting.
  • Robustness of detection, verifying the response of the system to varied interactions and the presence of multiple users.
  • Diversity in the forms of interaction, including slow approaches, direct contacts, and rapid gestures on the projected surface.
Although no detailed quantitative measurements were collected (e.g., in milliseconds), the trials offer a first validation that the prototype meets the essential requirements for future deployment in educational settings.

4.1.2. Robustness Under Variable Lighting Conditions

One of the main risks in vision-based interaction systems is their dependence on ambient lighting conditions. Sudden changes in light, cast shadows, or reflections can introduce significant noise into images captured by optical cameras, reducing detection reliability. In this sense, the use of sensors in the prototype is a substantial advantage, since these devices operate by emitting and receiving laser pulses, independent of external lighting.
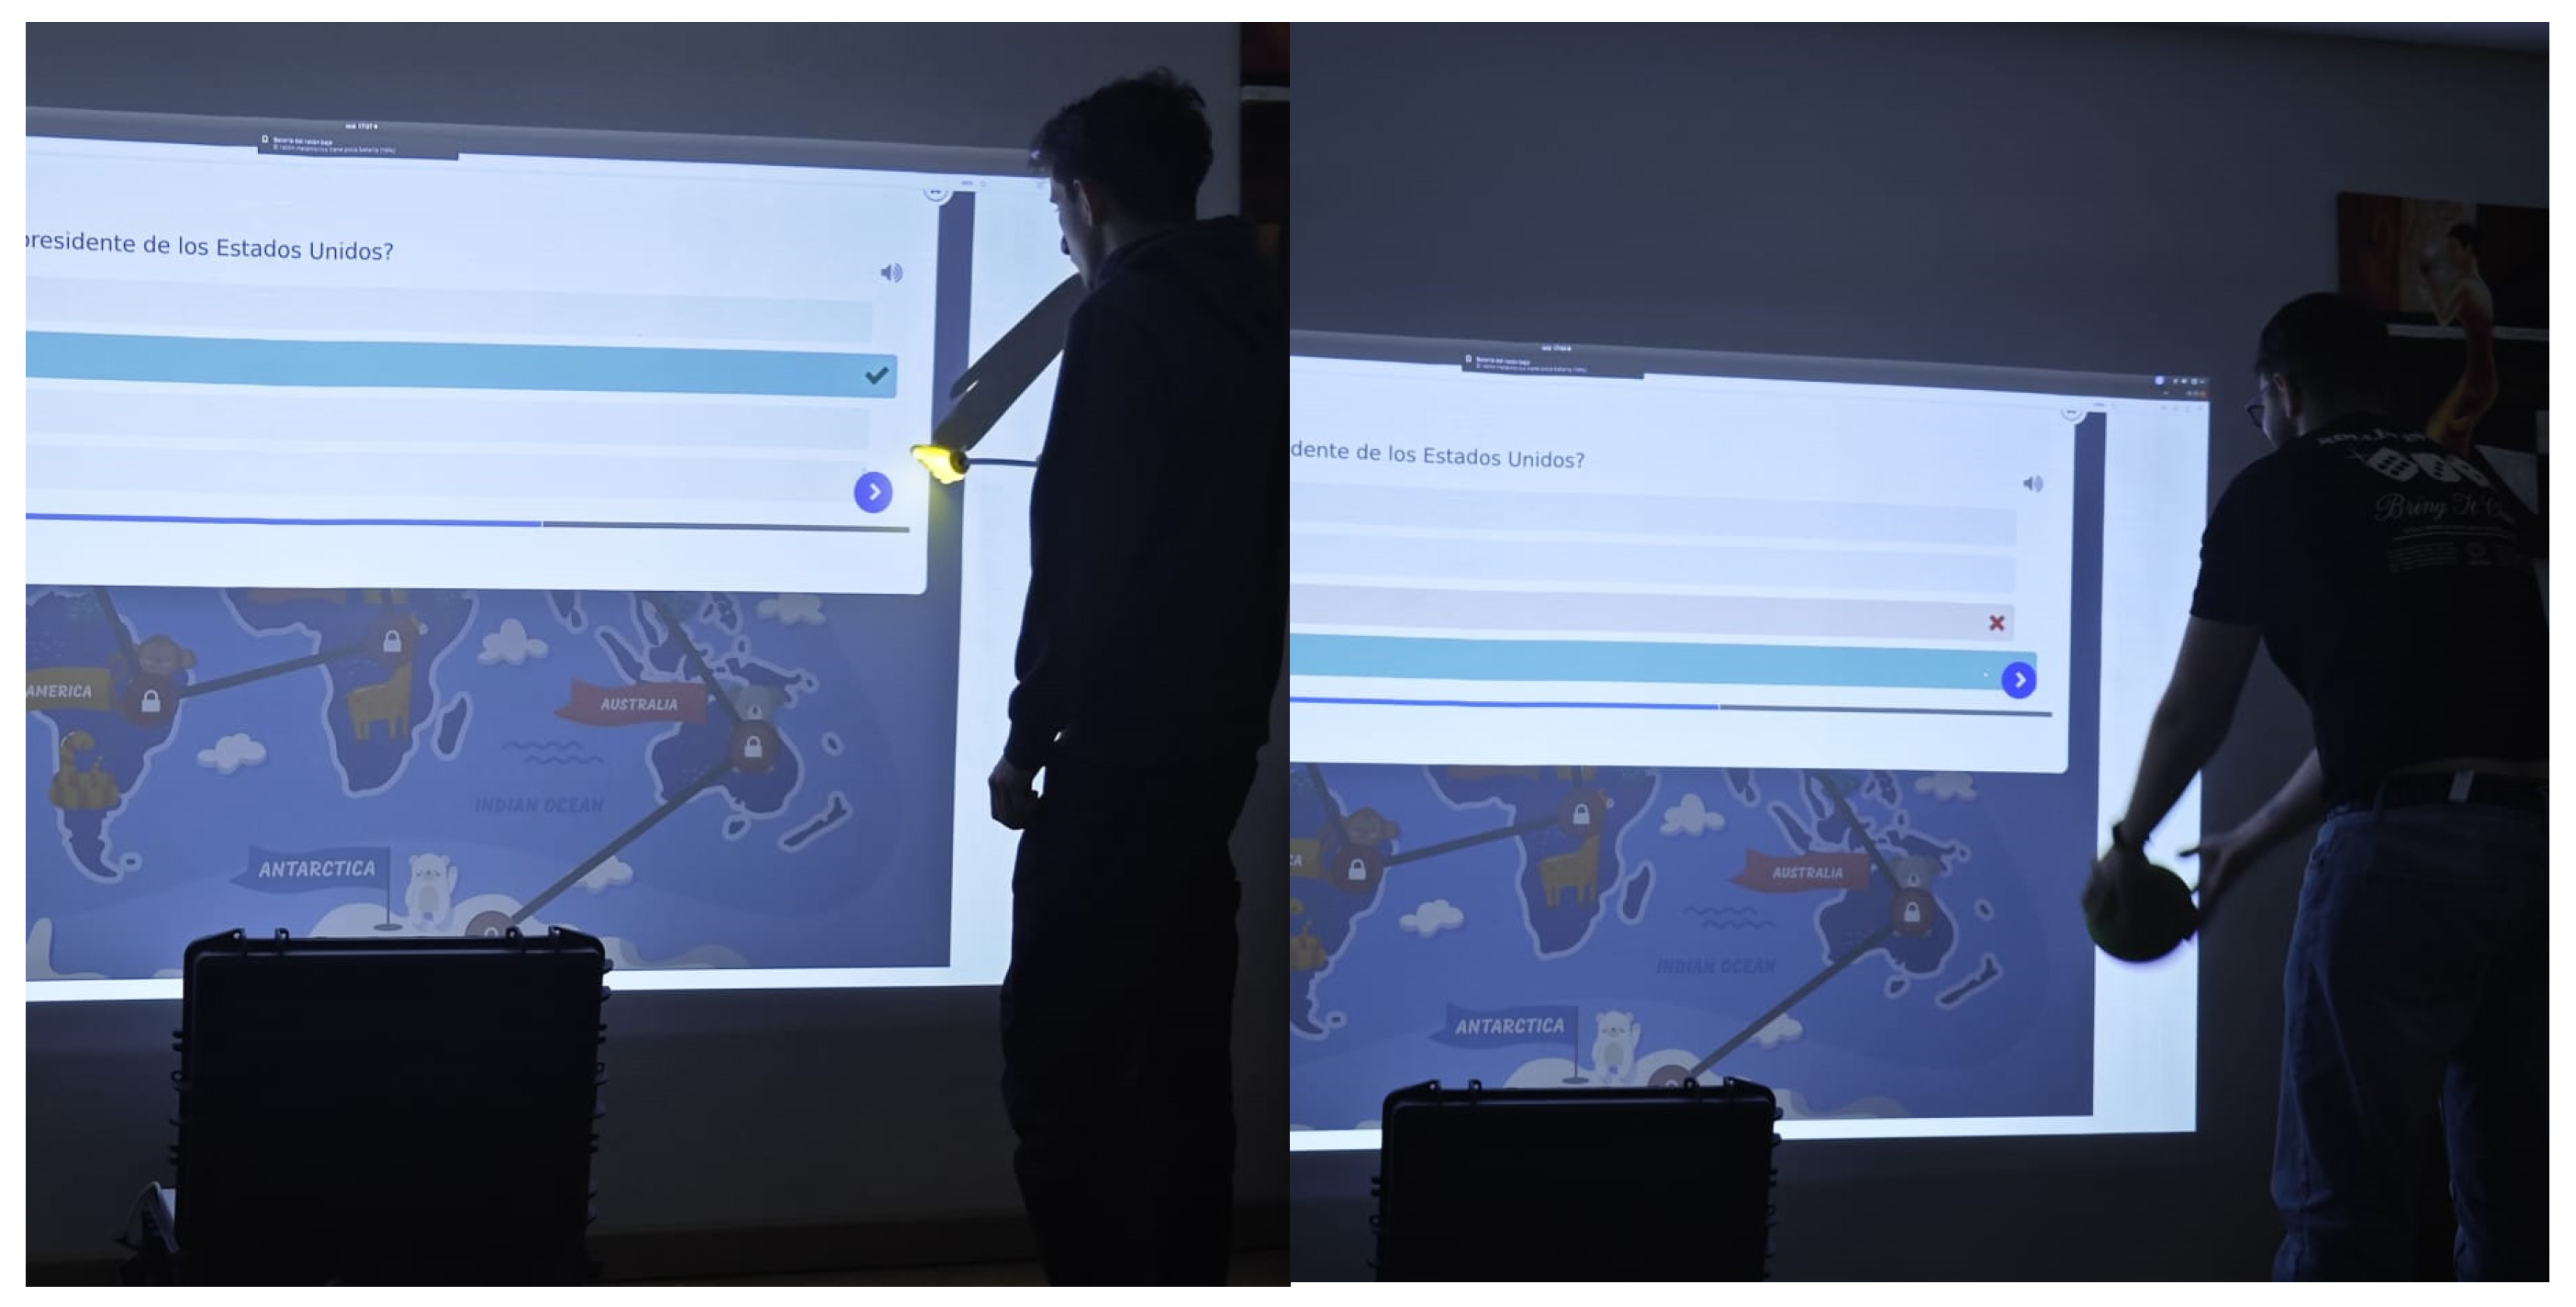
To test this advantage, tests were carried out in two extreme scenarios. First, the operation in a completely dark classroom was evaluated, without any external light source. Under these conditions, the sensors maintained a stable level of detection, with no loss of accuracy. Subsequently, the tests were repeated with intense artificial lighting aimed directly at the projection surface. In both cases, detection remained stable, with no false positives or interaction losses (Table 3).
In addition, in Figure 10 examples of the tests carried out in both extreme conditions: total darkness and high artificial lighting are shown. These images illustrate the stability of the system in the face of light variations.
These results allow us to conclude that the prototype is highly robust against changes in lighting, which considerably expands its practical applicability. In practice, this means that the system can be deployed in classrooms with diverse lighting conditions without the need for additional adjustments.

4.1.3. Estimated Interaction Latency

Although no dedicated instrumentation was available to measure latency in milliseconds, an estimation can be derived from the specifications of the hardware and software components involved in the detection-to-projection pipeline. The RPLIDAR A2 sensors operate at a scanning frequency of 10 Hz with 8000 samples per second, which ensures a distance update rate below 15–20 ms. The data fusion and obstacle detection process implemented in ROS introduces an additional processing time of approximately 10–15 ms, while the Node.js event translation and projection rendering contribute less than 5–10 ms of additional delay.
Considering the sum of these stages, the theoretical end-to-end latency of the system is estimated to range between 30 and 50 milliseconds, which is below the commonly accepted perceptual threshold for real-time interaction (typically <70 ms for touchscreen interfaces). This estimation is consistent with the qualitative feedback reported by users, who described the interaction as smooth and immediate.
Future iterations of the system will include quantitative latency measurements using high-speed camera analysis or timestamp-based event logging to obtain precise end-to-end timing. Additionally, hardware optimization and higher-frequency LIDAR sensors could further reduce latency, enhancing the responsiveness and precision of the interactive projection.

4.1.4. System Stability in Prolonged Use

In addition to robustness and latency, the overall stability of the system was assessed by repeated interaction sessions over extended periods. The prototype remained operational for several hours without interruptions, projecting different activities and recording the interactions carried out. No communication failures between components or degradation in detection quality were detected over time.
Likewise, the system’s robustness was tested in scenarios involving multiple users, such as turn-based games. The system correctly registered each sequential interaction without errors, confirming its suitability for collaborative activities where participants take turns.

4.1.5. Diversity in the Forms of Interaction

Another relevant aspect in the evaluation of the prototype is its ability to respond to different forms of interaction. To do this, tests were carried out in which users used different objects and parts of the body to activate the projected surface, including: the finger, the entire hand, a foam churro, a ball and a pointer in the shape of a foam rubber hand.
Interactions were categorized into slow approaches, direct contacts, and rapid gestures on the surface. In all cases, the system showed consistent detection, with no significant impact on the reliability of the response by the shape or material of the object used.
Minimal differences in detection accuracy were recorded between objects (see Figure 11), smaller ones (such as the finger or foam rubber pointer) and the largest or bulkiest ones (such as the hand or the ball), especially in quick gestures, where the system presented some occasional failures. However, the overall detection rate remained high in all the conditions evaluated, which shows the flexibility of the system in the face of different modes of interaction.
These preliminary tests indicate that the prototype can be adapted to various forms of interaction, which expands its applicability and facilitates its use in educational and recreational environments, where both hands and different objects can be used as tools for interaction.

4.2. Preliminary Evaluation with Users

In order to complement the technical validation of the prototype, a preliminary evaluation was carried out with real users. The main objective of this phase was to analyze how people interact with the projected surface and to collect perceptions related to the usability and acceptance of the proposed system (see Figure 12).

4.2.1. Methodology Used

The test was carried out with a group of 10 university student participants. Each participant interacted with two activities developed on the system:
  • Card memory game: Users had to discover and match pairs of cards projected on the surface.
  • Quiz game: Participants answered multiple-choice questions associated with different regions of a projected map.
The sessions were held in a classroom with controlled lighting conditions. During the interaction, qualitative observations on user performance were recorded, as well as simple success metrics (number of correct answers, response time and errors made).
Subsequently, a questionnaire based on the TAM model was applied, structured in three dimensions:
  • Perceived ease of use
  • Perceived profit
  • Intent for Future Use
The instrument used a 5-point Likert scale (1 = strongly disagree; 5 = strongly agree).

4.2.2. User Performance Results

The participants managed to complete both activities in most of the attempts, showing a consistent and adequate performance of the proposed dynamics. In the memory game, the system responded stably to users’ touches and movements, with an average of 85% hits. It was observed that the participants tended to quickly make their movements for the selection of cards since they have a considerable size, which indicated a thoughtful and attentive interaction. Some errors occurred mainly when matching similar cards, suggesting that the difficulty of the game was appropriate for the group.
In the multiple-choice quiz game, students answered correctly on an average of 78% of the attempts. The interaction was more challenging than in the memory game, because the projected response options were smaller and required greater precision when selecting. Each participant carried out the activity individually, without simultaneous tests with other users. Despite this greater difficulty, the students showed speed of adaptation to the interface, managing to easily manage the selection of answers.
During both activities, relevant qualitative observations were recorded:
  • Some specific difficulties were observed in the detection of rapid gestures, although without impeding the normal development of the dynamics.
  • Users showed expressions of surprise and joy when they got answers right, indicating motivation even though they had some mistakes in making the shots.
In general terms, the students highlighted that the interaction was natural and intuitive, with few errors derived from technology, which allowed them to concentrate on solving the activities and learning the content. These preliminary results suggest that the prototype offers stable and reliable performance in real-world use situations.

4.2.3. TAM Survey Results

The analysis of the questionnaires reflected a positive assessment of the prototype, as can be seen in Table 4:
  • Perceived Ease of Use (PEOU): Measures the degree to which participants feel that using the platform is effortless and untrained. It includes the items: “Learning to use the platform was easy for me.”; “The interaction with the screen was clear and understandable.”; “I feel comfortable using the platform without assistance.” The mean obtained was 4.4/5, indicating that most of the participants considered the system simple to use.
  • Perceived usefulness (PU): students identified a high potential of the system to reinforce content in educational environments, especially in dynamic and collaborative activities. It includes the items: “Using this platform helped me learn the content better.”; “The platform makes the activity more productive than in a traditional classroom.”; “I find the platform useful for my studies.” The average obtained was 4.5/5, showing a high educational potential, especially for dynamic and collaborative activities.
  • User satisfaction (US): measures the pleasure and motivation generated by the use of the system. This dimension reflects the user’s attitude towards interacting with the platform. It includes the items: “Using this platform is a good idea.”; “I find it nice to work with this platform.”; “I enjoyed using the platform during the activity.”; The mean obtained was 4.5/5, evidencing that the user experience was positive and pleasant for the students.
  • Intention to use future (IB): Participants expressed willingness to use the system in the future and recommend it to other colleagues. Include the items: “I would like to use this platform in future activities.”; “I would recommend this platform to my colleagues.”; “I think I would still use this platform if it was available.” The average obtained was 4.3/5, showing a real interest in continuing to use the system.
Table 4. Preliminary results of the evaluation with users using the TAM model.
TAM DimensionMedium (Out of 5)Standard DeviationRemarks
Perceived ease of use4.40.5Intuitive interaction, no prior training required.
Perceived profit4.50.4Outstanding educational potential, especially for collaborative dynamics.
User satisfaction4.50.5Pleasant and motivating user experience for the participants.
Intent for Future Use4.30.6High willingness to use and recommend the system, with interest in new applications.
In addition to these initial results, a more detailed analysis of the constructs of the TAM model was performed, obtaining the statistics shown in Table 5. The minimum and maximum values reflect the lowest and highest individual responses recorded in the items of each construct, while the mean and standard deviation were calculated from the average of the items for each participant. This approach allows combining a global view of the dispersion of individual responses with the consistency of the averages of each construct, following the methodology used in previous TAM studies.
To evaluate the relationship between the dimensions of the TAM, the Pearson correlation matrix was calculated, which indicates the degree of linear association between two variables. The values can vary between −1 and 1: a value close to 1 indicates a strong positive correlation, 0 indicates no linear relationship, and −1 indicates a perfect negative correlation. This analysis allows us to identify how the perception of ease of use, usefulness and user satisfaction is related to the intention of future use. Table 6 shows the calculation of the Pearson correlation matrix between the dimensions, with the aim of analyzing the degree of relationship between them (see Table 6).
All correlations were positive and high, indicating that the perception of ease of use and usefulness directly influences user satisfaction, and these, in turn, reinforce the intention to continue using the platform.
Finally, the internal reliability of each construct was evaluated by calculating Cronbach’s alpha coefficient [34], a statistical measure that indicates the internal consistency of the items that make up a scale. According to the literature, values above 0.7 are considered acceptable for social science research.
The results obtained show that all constructs have a high reliability, which supports the validity of the questionnaire used. This can be seen in Table 7.
The results obtained show that all constructs have high reliability, with Cronbach’s alpha values between 0.83 and 0.88. This supports the validity of the questionnaire used, indicating that the items in each dimension consistently measure the same construct and that the data obtained are reliable for the analysis of the acceptance of the system by users.

5. Discussion

The comparison between the prototype developed in this work and the system described by [35] allows us to evidence substantial improvements both at the technical and pedagogical levels. The previous prototype was based on a system that combined a projector, a depth camera and a computer, designed to detect the interaction of users by the collision of balls projected on the surface. While this approach was functional and allowed for the assessment of students’ physical interaction, it had significant limitations that restricted its applicability and the flexibility of the system.

5.1. Installation and Configuration

In the previous prototype, the installation of the system required careful adjustment of the depth camera and projector to ensure that the playing surface was properly covered and that interactions were accurately captured. The camera had to be oriented towards the play area and calibration was essential to determine the correspondence between the physical space and the projected space. This procedure involved significant manual intervention and limited the speed with which the system could be deployed in different classrooms or educational settings.
In contrast, the current prototype significantly reduces installation and calibration requirements. Thanks to the integration of LIDARs and the use of the web platform to enter the dimensions of the projected surface and the height with respect to the ground, the system can be configured in a few minutes, without the need for complex manual adjustments. This simplification of the process allows its immediate use in multiple scenarios, increasing the flexibility and portability of the system compared to previous versions.

5.2. Detection Accuracy and Shadow Sensitivity

The system described by Blas et al. used depth cameras that detected the position of the balls through image processing and contour analysis. This approach had some limitations: accuracy could be affected by changes in lighting or shadows cast by the users themselves, and optimal detection was conditional on the use of balls of specific colors (usually green) to facilitate HSV filtering in the camera.
The prototype developed overcomes these limitations by using LIDAR sensors, which operate independently of ambient lighting and are not affected by cast shadows or changes in light in the classroom. In this way, the system maintains stable and accurate detection under varying conditions, which represents a significant advance over the previous prototype. In addition, there is no need to restrict the system to specific colored balls, allowing for greater freedom in activity design and reducing reliance on pre-calibrated physical elements.

5.3. Flexibility in Content Creation

In the previous prototype, the activities available were limited to specific pre-programmed games, such as tic-tac-toe games, shooting projected elements or geography exercises and quizzes. While these games had educational value, the system did not offer the ability to easily create custom activities or integrate them with learning management platforms (LMS).
The current prototype, on the other hand, incorporates the web platform that allows the creation and management of activities through H5P, an authoring tool that allows the generation of games, quizzes and highly customizable exercises. This integration opens up the possibility of creating an unlimited number of activities adapted to different educational and thematic levels. In addition, by being compatible with LMS systems such as Moodle, learner interactions can be recorded centrally, making it easy to track and evaluate performance without restrictions.

5.4. Latency and User Experience

The previous system exhibited noticeable latency during interactions, especially when gestures were fast or when multiple collisions occurred simultaneously. Although this delay was acceptable for experimental use, it occasionally affected the perception of fluidity and naturalness.
In contrast, the current prototype significantly improves responsiveness thanks to the high sampling rate of the LIDAR sensors and the optimized processing pipeline implemented in ROS and Node.js. Based on the hardware specifications, the estimated end-to-end latency ranges between 30 and 50 milliseconds, which is below the perceptual threshold typically reported for real-time human–computer interaction (<70 ms). This theoretical estimation aligns with user feedback, which described the response as smooth and immediate.
Even though these values are derived from component specifications rather than direct measurements, they provide a reasonable indication that the system achieves a low latency consistent with natural interaction. In future work, this will be validated experimentally through quantitative latency analysis using high-speed imaging or event timestamp logging, which will allow precise benchmarking and optimization of the system’s response time.

5.5. Robustness and Adaptability

Another significant advantage of the current prototype is its robustness under different operating conditions. While the previous system depended on correct lighting and control of the environment, the use of LIDARs allows detection to be maintained even in environments with intense light, variable light or diverse projection surfaces. This increases the versatility of the system, allowing it to be used not only in traditional classrooms, but also in temporary spaces or itinerant workshops.
In addition, the current prototype can be adapted to different projection dimensions and surface heights by configuring it on the web platform. This adaptability eliminates the need for thorough calibration procedures and reduces the manual intervention required by the user, representing a major advance in terms of ease of use and applicability.

5.6. Conclusions and Comparison with Other Models

Table 8 summarizes the most relevant differences between the previous prototype [35] and the prototype developed in this work, highlighting the technical, pedagogical and usability improvements:
The comparison shows that the current prototype constitutes a substantial advance over the previous system, both in terms of physical infrastructure and data processing and pedagogical flexibility. First, the modular design with LIDARs integrated into a portable case allows for quick and easy deployment, without the need for extensive manual adjustments. This approach improves portability and reduces installation time compared to previous systems that relied on oriented depth cameras and careful projector calibration.
Secondly, detection accuracy and robustness against environmental conditions is significantly improved. While the depth camera of the previous prototype was sensitive to shadows and changes in light, the sensors provide a three-dimensional mapping of physical space that is independent of lighting and does not require specific color objects for detection. The fusion of point clouds in ROS1 also guarantees minimal latency, improving the fluidity and naturalness of the experience.
From a pedagogical point of view, the incorporation of H5P and compatibility with LMS such as Moodle allows for the creation of unlimited activities, the customization of games and quizzes, and the collection of real-time performance metrics. This makes the prototype a comprehensive tool for teaching, overcoming the rigidity of the pre-programmed games of the previous system and offering a scalable solution for different educational levels and topics.
In conclusion, these improvements consolidate the current prototype as a robust, flexible and scalable system, which not only overcomes the technical constraints of the previous prototype, but also enhances the educational experience through precise interactions, collaborative dynamics and highly customizable authoring tools. This technological evolution establishes a solid foundation for future applications in educational environments, enabling the effective integration of interactive technologies into real classrooms and favoring student motivation and engagement.

5.7. Future Lines of Work

Although the current prototype is a significant advance compared to other systems, there are still several opportunities for improvement and expansion that can guide future lines of research and development:
  • Hardware optimization: Explore the integration of more compact and less energy-efficient LIDAR sensors, in order to reduce costs and simplify installation.
  • Shared repository system: develop a centralised platform that allows teachers from the same school (or between different schools) to create, store, and share games and activities in a simple way.
  • Educational challenges between schools: implement a system of scores, classifications or collaborative/competitive challenges between classrooms and schools, in order to increase student motivation and interest.
  • Adaptive gamification: implement algorithms that automatically adjust the difficulty of games according to the level of the students, favoring more personalized learning.
  • There are also additional future lines of work aimed at addressing current limitations of the prototype and enhancing its overall performance:
  • Migration to ROS 2 for long-term viability: we acknowledge that the current prototype was implemented on ROS1 Melodic, a version that has reached its end-of-life. To ensure the project’s long-term maintainability and sustainability, a priority line of future work is the migration of the entire data processing architecture to ROS 2. This transition will not only address the issue of obsolescence but also allow us to capitalize on the inherent advantages of ROS 2, such as its improved real-time capabilities, a more robust communication framework, and access to ongoing community support and updates.
  • Enhanced calibration for improved robustness: We acknowledge that the current coordinate mapping relies on a linear transformation, which assumes the LIDAR scanning plane is perfectly parallel to the projection surface. This simplification can make the system sensitive to misalignments in the physical setup. To address this and increase robustness, a future line of work will involve implementing an advanced calibration process using a perspective transformation (homography). This would require the user to touch four designated corner points on the projected area at the beginning of a session. By mapping these four physical points to their corresponding screen coordinates, the system can compute a homography matrix. This method would automatically correct for tilt, rotation, and perspective distortions, ensuring a highly accurate and reliable user interaction even when the physical setup is not perfectly aligned.
  • Implementation of multi-user tracking: Although the current system’s wide detection area is well-suited for collaborative environments, the data processing pipeline currently tracks only a single interaction point at a time. A key future enhancement will be to implement a multi-user tracking mechanism. This would involve upgrading the detection algorithm to identify, track, and differentiate multiple concurrent contact points (e.g., from different users or hands). Each distinct interaction would be published as a unique event, enabling true simultaneous collaboration within educational games and activities. This would significantly enhance the platform’s potential for collaborative learning scenarios.
  • Expanded user validation: We acknowledge that the preliminary user evaluation, while yielding positive results, was conducted with a limited sample of 10 university students. For this initial validation phase, recruitment efforts resulted in this sample size. We recognize that this demographic is not fully representative of the primary target audience for a STEM education platform, namely K-12 students and their teachers. Therefore, a crucial future line of work is to conduct a large-scale validation study with these specific user groups. This expanded evaluation will be essential to confirm the current findings regarding usability and acceptance and to gather valuable pedagogical feedback directly from real-world classroom environments. This will allow us to refine the system’s features to better meet the needs of both students and educators.
  • The current version of the platform relies on manual export of activity data from external H5P or LMS environments due to licensing and integration constraints. Future iterations will include a dedicated H5P server and an xAPI listener integrated into the backend to capture learning events in real time through a Learning Record Store (LRS). This will allow fully automated and seamless data collection during sessions, eliminating the need for manual uploads and enabling more advanced learning analytics.
  • Advanced gesture recognition for continuous interaction: To broaden compatibility with more dynamic educational content, a key future goal is to implement an advanced gesture recognition system. This would allow the platform to support continuous interactions like true drag-and-drop. One proposed implementation involves a mechanism where the user could perform two successive collisions to define the start and end points of a drag path. The system would then automatically execute the drag action between these points, enabling a much richer and more intuitive user experience for a wider array of H5P activities.
Together, these future lines aim to consolidate the prototype as an increasingly flexible, inclusive and motivating educational tool. The combination of technical optimizations, collaboration between teachers and schools, and adaptive gamification strategies will not only improve the student experience, but also enhance the integration of the system in real educational environments.

6. Conclusions

The prototype developed is an important advance over previous systems, standing out for its precise detection by sensors, robustness against changes in lighting and low latency in interactions. The integration of a web platform and authoring tools allows teachers to create and manage personalized educational activities, increasing the flexibility and scalability of the system for different levels and subjects.
In addition, the theoretical analysis of end-to-end latency suggests that the system operates within a response time of 30–50 ms, which supports the users’ perception of seamless and immediate interaction. Although this estimation is based on hardware specifications rather than direct measurement, future versions will incorporate quantitative latency analysis and sensor upgrades to validate and further improve real-time responsiveness.
The modular and portable design facilitates its installation in different educational environments, enabling the interaction of several students in turn-based activities and promoting collaborative dynamics. Technical improvements overcome the limitations of previous prototypes, offering a more natural user experience and greater freedom in content creation.
The results of the evaluation with users, based on the TAM model, show a positive assessment of the system: participants perceived ease of use (PEOU), perceived utility (PU) and user satisfaction (US) at high levels, and expressed a consistent intention for future use (BI). These data reflect that the platform is not only technically functional, but also accepted and appreciated by users, which is a key indicator of success for its educational implementation.
Additional statistical analysis reinforces these findings: the constructs have high internal reliability (Cronbach’s alpha between 0.83 and 0.88) and the descriptive statistics show that the participants’ responses are concentrated at high levels according to the scales used, evidencing consistency in the perception of the platform. Likewise, Pearson’s correlation matrix indicates a positive relationship between the dimensions of the TAM, suggesting that the perception of ease of use and usefulness is strongly associated with user satisfaction and their intention to use it in the future.
Likewise, the future lines identified open up new opportunities to enhance the motivation, cooperation, and active learning of students. Overall, the system is consolidated as a versatile, innovative educational tool with great potential to be integrated into different school contexts, promoting both learning and student participation.

Author Contributions

Conceptualization, A.Á.S.; Methodology, A.Á.S. and R.H.P.; Software, D.C.G.; Validation, D.C.G.; Formal analysis, G.V.G.; Investigation, D.C.G. and S.G.G.; Writing—review & editing, D.C.G. and S.G.G.; Supervision, S.G.G. and G.V.G.; Funding acquisition, G.V.G. All authors have read and agreed to the published version of the manuscript.

Funding

The APC was supported by the project Self-adaptive platform based on intelligent agents for the optimization and management of operational processes in logistic warehouses (PLAUTON), PID2023-151701OB-C21, funded by MCIN/AEI/10.13039/501100011033/FEDER, EU. The founders had no role in study design, data collection and analysis, decision to publish, or preparation of the manuscript.

Data Availability Statement

The data presented in this study are available within the article.

Conflicts of Interest

The authors declare no conflicts of interest.

References

  1. Ouyang, F.; Xu, W. The effects of educational robotics in STEM education: A multilevel meta-analysis. Int. J. STEM Educ. 2024, 11, 7. [Google Scholar] [CrossRef]
  2. Morsy, S.; Shaker, A. Evaluation of LiDAR-Derived Features Relevance and Training Data Minimization for 3D Point Cloud Classification. Remote Sens. 2022, 14, 5934. [Google Scholar] [CrossRef]
  3. Rodrigues, W.G.; Vieira, G.S.; Cabacinha, C.D.; Bulcão-Neto, R.F.; Soares, F. Applications of Artificial Intelligence and LiDAR in Forest Inventories: A Systematic Literature Review. Comput. Electr. Eng. 2024, 120, 109793. [Google Scholar] [CrossRef]
  4. Castro, A.; Medina, J.; Aguilera, C.A.; Ramirez, M.; Aguilera, C. Robotics Education in STEM Units: Breaking Down Barriers in Rural Multigrade Schools. Sensors 2023, 23, 387. [Google Scholar] [CrossRef]
  5. Ponce, P.; López-Orozco, C.F.; Reyes, G.E.B.; López-Caudana, E.; Parra, N.M.; Molina, A. Use of Robotic Platforms as a Tool to Support STEM and Physical Education in Developed Countries: A Descriptive Analysis. Sensors 2022, 22, 1037. [Google Scholar] [CrossRef]
  6. Tselegkaridis, S.; Sapounidis, T. Exploring the Features of Educational Robotics and STEM Research in Primary Education: A Systematic Literature Review. Educ. Sci. 2022, 12, 305. [Google Scholar] [CrossRef]
  7. Ortiz-Rojas, M.; Chiluiza, K.; Valcke, M.; Bolaños-Mendoza, C. How Gamification Boosts Learning in STEM Higher Education: A Mixed Methods Study. Int. J. STEM Educ. 2025, 12, 1. [Google Scholar] [CrossRef]
  8. Zourmpakis, A.-I.; Kalogiannakis, M.; Papadakis, S. The Effects of Adaptive Gamification in Science Learning: A Comparison Between Traditional Inquiry-Based Learning and Gender Differences. Computers 2024, 13, 324. [Google Scholar] [CrossRef]
  9. Montenegro-Rueda, M.; Fernández-Cerero, J.; Mena-Guacas, A.F.; Reyes-Rebollo, M.M. Impact of Gamified Teaching on University Student Learning. Educ. Sci. 2023, 13, 470. [Google Scholar] [CrossRef]
  10. Kalogiannakis, M.; Papadakis, S.; Zourmpakis, A.-I. Gamification in Science Education. A Systematic Review of the Literature. Educ. Sci. 2021, 11, 22. [Google Scholar] [CrossRef]
  11. Zato, C.; Villarrubia, G.; Sánchez, A.; Barri, I.; Rubión, E.; Fernández, A.; Rebate, C.; Cabo, J.A.; Álamos, T.; Sanz, J.; et al. PANGEA—Platform for Automatic coNstruction of or Ganizations of intElligent Agents. In Distributed Computing and Artificial Intelligence. Advances in Intelligent and Soft Computing; Omatu, S., De Paz Santana, J., González, S., Molina, J., Bernardos, A., Rodríguez, J., Eds.; Springer: Berlin/Heidelberg, Germany, 2012; Volume 151, pp. 229–239. [Google Scholar] [CrossRef]
  12. Villarrubia, G.; De Paz, J.F.; Bajo, J.; Corchado, J.M. Ambient Agents: Embedded Agents for Remote Control and Monitoring Using the PANGEA Platform. Sensors 2014, 14, 13955–13979. [Google Scholar] [CrossRef]
  13. Lewis, J.; Lima, P.U.; Basiri, M. Collaborative 3D Scene Reconstruction in Large Outdoor Environments Using a Fleet of Mobile Ground Robots. Sensors 2023, 23, 375. [Google Scholar] [CrossRef] [PubMed]
  14. Khoramak, S.; Mahmoudi, F.T. Multi-Agent Hyperspectral and LiDAR Features Fusion for Urban Vegetation Mapping. Earth Sci. Inform. 2023, 16, 165–173. [Google Scholar] [CrossRef]
  15. Xia, Y.; Wu, X.; Ma, T.; Zhu, L.; Cheng, J.; Zhu, J. Multi-Robot Collaborative Mapping with Integrated Point-Line Features for Visual SLAM. Sensors 2024, 24, 5743. [Google Scholar] [CrossRef] [PubMed]
  16. Karim, M.R.; Reza, M.N.; Jin, H.; Haque, M.A.; Lee, K.-H.; Sung, J.; Chung, S.-O. Application of LiDAR Sensors for Crop and Working Environment Recognition in Agriculture: A Review. Remote Sens. 2024, 16, 4623. [Google Scholar] [CrossRef]
  17. Zhang, X.; Ding, Y.; Huang, X.; Li, W.; Long, L.; Ding, S. Smart Classrooms: How Sensors and AI Are Shaping Educational Paradigms. Sensors 2024, 24, 5487. [Google Scholar] [CrossRef]
  18. He, X.; Hua, X.; Montillet, J.-P.; Yu, K.; Zou, J.; Xiang, D.; Zhu, H.; Zhang, D.; Huang, Z.; Zhao, B. An Innovative Virtual Simulation Teaching Platform on Digital Mapping with Unmanned Aerial Vehicle for Remote Sensing Education. Remote Sens. 2019, 11, 2993. [Google Scholar] [CrossRef]
  19. Stein, G.; Jean, D.; Kittani, S.; Deweese, M.; Lédeczi, Á. A Novice-Friendly and Accessible Networked Educational Robotics Simulation Platform. Educ. Sci. 2025, 15, 198. [Google Scholar] [CrossRef]
  20. Plókai, D.; Détár, B.; Haidegger, T.; Nagy, E. Deploying an Educational Mobile Robot. Machines 2025, 13, 591. [Google Scholar] [CrossRef]
  21. Verner, I.M.; Cuperman, D.; Reitman, M. Exploring Robot Connectivity and Collaborative Sensing in a High-School Enrichment Program. Robotics 2021, 10, 13. [Google Scholar] [CrossRef]
  22. Deterding, S.; Dixon, D.; Khaled, R.; Nacke, L. From game design elements to gamefulness: Defining “gamification”, Proceedings of the 15th International Academic MindTrek. Envisioning Future Media Environ. 2011, 9, 15. [Google Scholar] [CrossRef]
  23. Huotari, K.; Hamari, J. A definition for gamification: Anchoring gamification in the service marketing literature. Electron Mark. 2017, 27, 21. [Google Scholar] [CrossRef]
  24. Marasco, E.; Behjat, L.; Rosehart, W. Enhancing EDA education through gamification. In Proceedings of the 2015 IEEE International Conference on Microelectronics Systems Education, Pittsburgh, PA, USA, 20–21 May 2015; Volume 25, p. 27. [Google Scholar] [CrossRef]
  25. Gini, F.; Bassanelli, S.; Bonetti, F.; Mogavi, R.H.; Bucchiarione, A.; Marconi, A. The Role and Scope of Gamification in Education: A Scientometric Literature Review. Acta Psychol. 2025, 259, 105418. [Google Scholar] [CrossRef] [PubMed]
  26. Mitgutsch, K.; Alvarado, N. Purposeful by design?: A serious game design assessment framework. In Proceedings of the International Conference on the Foundations of Digital Games, New York, NY, USA, 29 May 2012; Volume 121, p. 128. [Google Scholar] [CrossRef]
  27. Zarraonandia, T.; Diaz, P.; Aedo, I.; Ruiz, M.R. Designing educational games through a conceptual model based on rules and scenarios. Multimed. Tools Appl. 2015, 74, 4535–4559. [Google Scholar] [CrossRef]
  28. Ar, A.Y.; Abbas, A. Role of Gamification in Engineering Education: A Systematic Literature Review. In Proceedings of the 2021 IEEE Global Engineering Education Conference (EDUCON), online, 21–23 April 2021; Institute of Electrical and Electronics Engineers: New York, NY, USA, 2021; Volume 210, p. 215. [Google Scholar] [CrossRef]
  29. Pineda-Martínez, M.; Llanos-Ruiz, D.; Puente-Torre, P.; García-Delgado, M.Á. Impact of Video Games, Gamification, and Game-Based Learning on Sustainability Education in Higher Education. Sustainability 2023, 15, 13032. [Google Scholar] [CrossRef]
  30. Páez Quinde, C.; Arroba-Freire, E.; Espinosa-Jaramillo, M.T.; Silva, M.P. Gamification as Collaborative Learning Resources in Technological Education. In Proceedings of the IEEE Global Engineering Education Conference, Salmiya, Kuwait, 1–4 May 2023; pp. 1–5. [Google Scholar] [CrossRef]
  31. Hare, R.; Tang, Y.; Zhu, C. Combining Gamification and Intelligent Tutoring Systems for Engineering Education. In Proceedings of the IEEE Frontiers in Education Conference, College Station, TX, USA, 18–21 October 2023; pp. 1–5. [Google Scholar] [CrossRef]
  32. Jääskä, E.; Aaltonen, K.; Kujala, J. Game-Based Learning in Project Sustainability Management Education. Sustainability 2021, 13, 8204. [Google Scholar] [CrossRef]
  33. Silva, P. Davis’ Technology Acceptance Model (TAM) (1989). In Information Seeking Behavior and Technology Adoption: Theories and Trends; IGI Global: Hershey, PA, USA, 2015; pp. 205–219. [Google Scholar] [CrossRef]
  34. Roco-Videla, Á.; Flores, S.V.; Olguín-Barraza, M.; Maureira-Carsalade, N. Cronbach’s alpha and its confidence interval. Hosp. Nutr. 2024, 41, 270–271. [Google Scholar] [CrossRef]
  35. Sánchez San Blas, H.; Sales Mendes, A.; de la Iglesia, D.H.; Silva, L.A.; Villarrubia González, G. Multiagent Platform for Promoting Physical Activity and Learning through Interactive Educational Games using the Depth Camera Recognition System. Entertain. Comput. 2024, 49, 100629. [Google Scholar] [CrossRef]
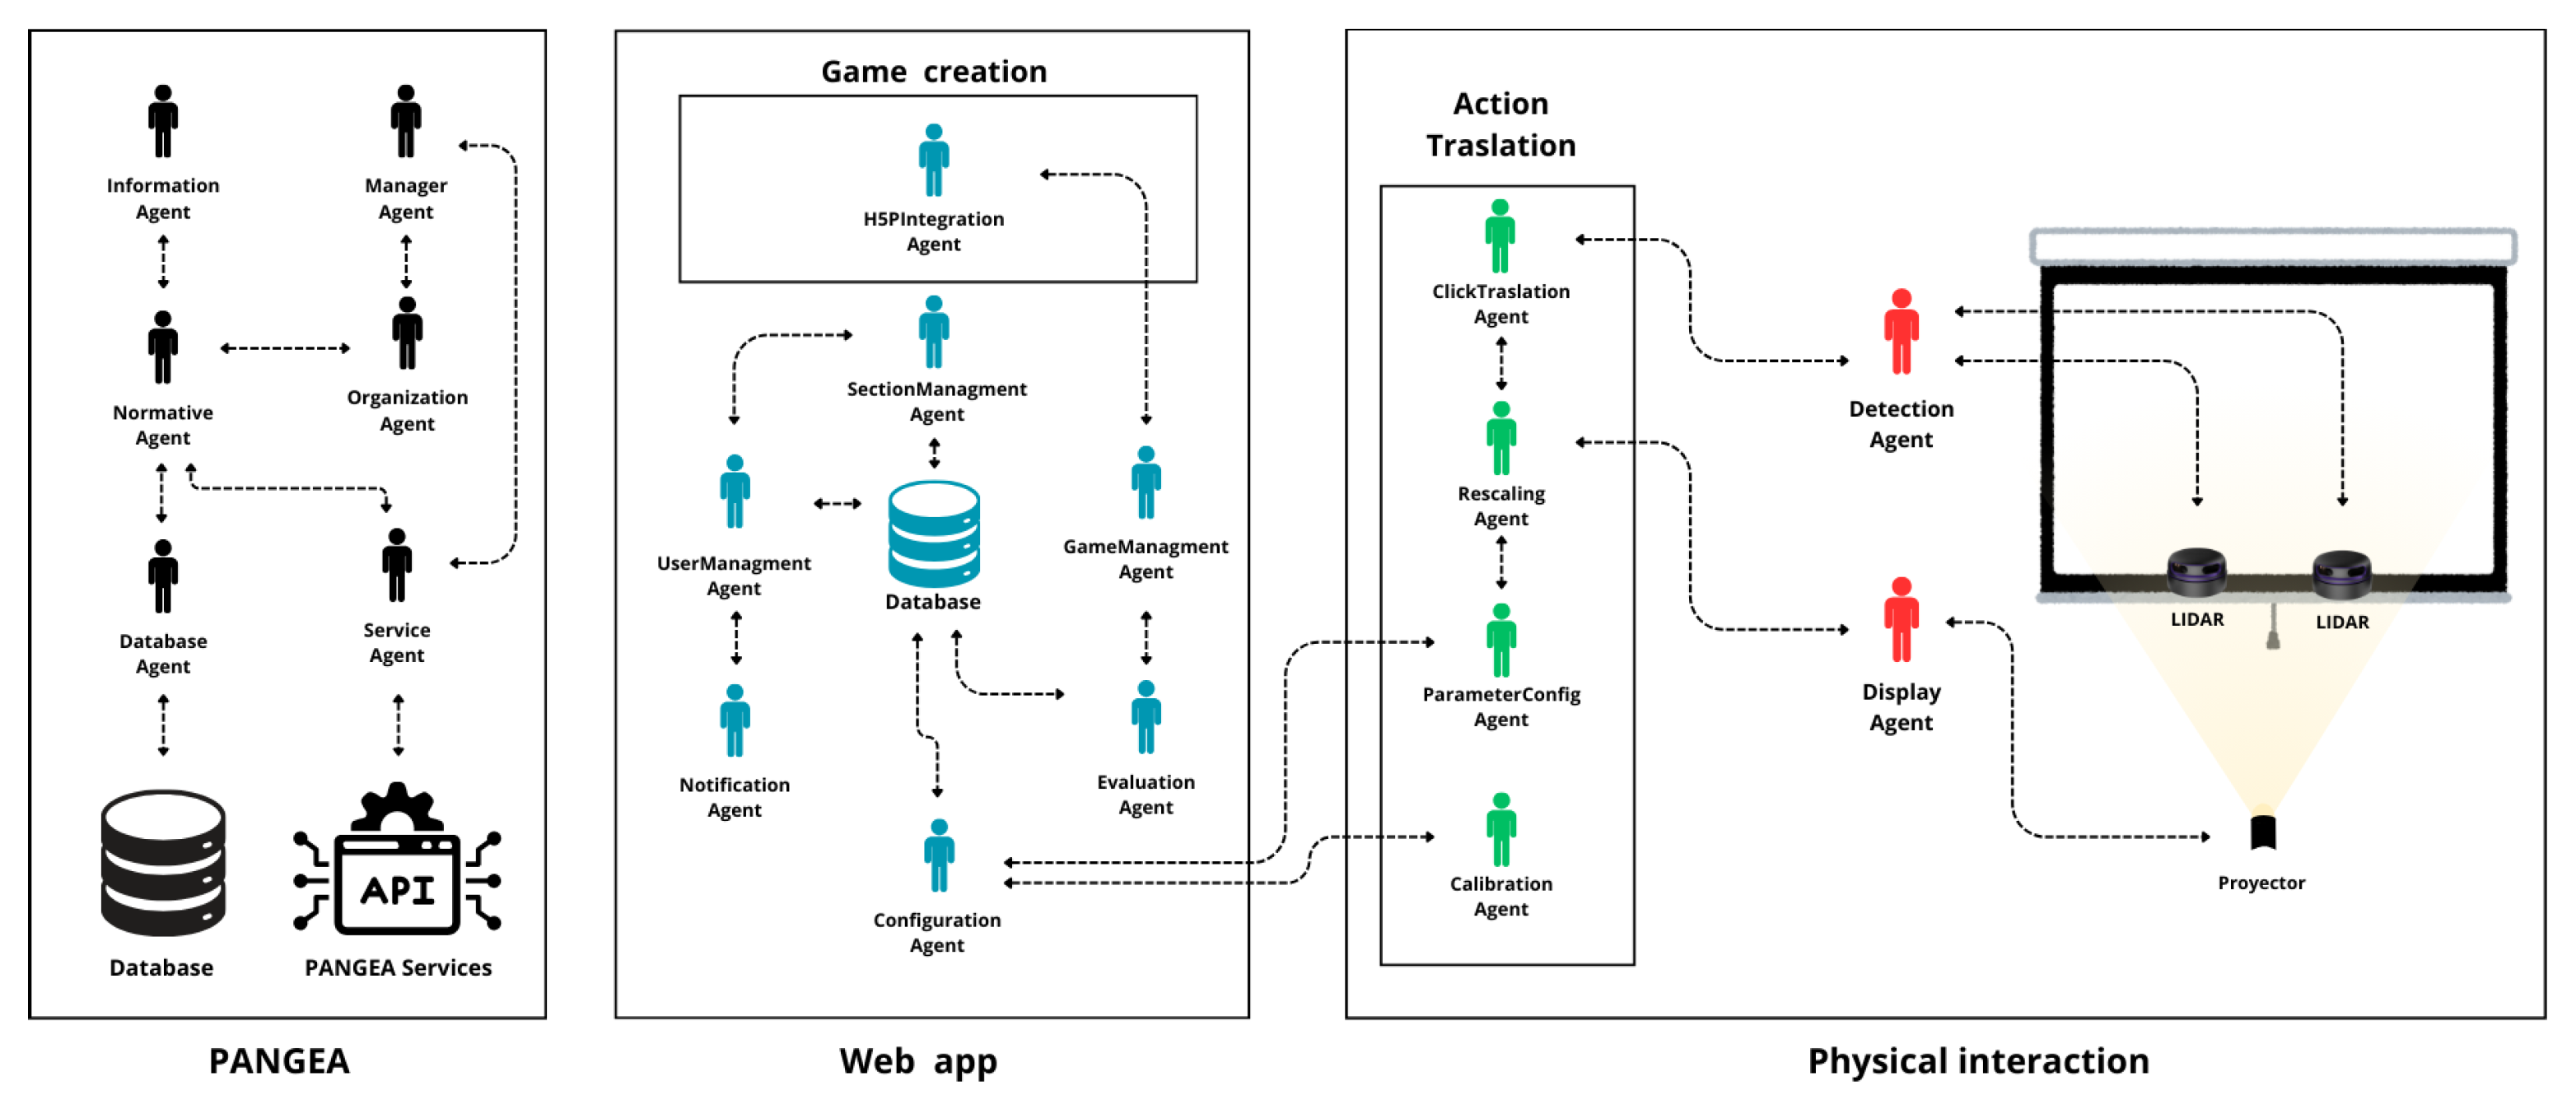
Figure 1. Multi-agent system architecture.
Applsci 15 11053 g001
Figure 2. General outline of the prototype where you can see how the different parts communicate and connect and how users interact.
Applsci 15 11053 g002
Figure 3. Overview of the actual prototype in the case.
Applsci 15 11053 g003
Figure 4. RViz visualization of the data obtained by the sensors, showing the detection of the wall and other elements of the environment.
Applsci 15 11053 g004
Figure 5. Diagram of the data processing flow, from capture by LIDARs to projection of the interaction.
Applsci 15 11053 g005
Figure 6. Web Platform Architecture.
Applsci 15 11053 g006
Figure 7. Configuration interface of the LIDAR system of the developed prototype, showing the adjustable parameters.
Applsci 15 11053 g007
Figure 8. System web interface, showing the sections organized into tabs and the different activities that teachers can add.
Applsci 15 11053 g008
Figure 9. Statistics section of the web interface corresponding to the session held on 13 March 2025, showing graphs and summaries of one of the activities developed by the teachers.
Applsci 15 11053 g009
Figure 10. Examples of the prototype in extreme lighting conditions. (A) Total darkness; (B) Intense lighting.
Applsci 15 11053 g010
Figure 11. Examples of interaction with different objects on the projected surface. (A) Foam churro; (B) Foam rubber hand-shaped pointer.
Applsci 15 11053 g011
Figure 12. Usability evaluation with users using the prototype’s touch wall.
Applsci 15 11053 g012
Table 1. Key features comparison between PANGEA and JADE multi-agent systems.
FeaturesPangeaJADE
Support for organizationsNative and explicitLimited, requires manual extensions
RFC-based communicationSimilar style to web protocolsNo, use FIFA-ACL (more closed)
Focus on virtual organizationsUO-oriented designNot directly, focused on individual agents
Organizational scalabilityHigh (with hierarchies and roles)Stocking
External interoperabilityHigh (by use of network standards)Low (requires adaptations)
ModularityHigh (decoupled components)Stocking
Community and documentationMore academic and specializedLarger and industrially supported
Table 2. Materials used in the development of the prototype.
CategoryComponentDescriptionEstimated Price (EUR)
Processing UnitMini PC Asus NUC 12 Intel
(ASUS, Taipei, Taiwan)
Compact PC for data processing and ROS executionEUR 350
Sensing and Vision(×2) Youyeetoo RPLIDAR A2 360° (Youyeetoo, Shenzhen, China) *360° LIDAR sensor for object detection and mappingEUR 250 (×2)
(×2) Youyeetoo FHL-LD19 LiDAR
(Youyeetoo, Shenzhen, China) *
High-precision LIDAR sensor for short-
Range detection
EUR 80 (×2)
Construction MaterialsEnder PLA Filament 1.75 mm (1 kg spool, black)
(Creality, Shenzhen, China)
PLA filament for prototyping and
Structural Components
EUR 17
Connectivity & PowerPack of power, HDMI, and USB cablesBasic connectivity and data/power transmissionEUR 40
Power connector with fuseSafe power distribution and protectionEUR 5
User InterfaceLG CineBeam HU715QW Projector
(LG Electronics, Seoul, Republic of Korea)
High-resolution projector for interactive displayEUR 1500
Support & TransportHMF ODK100 Outdoor Photographer Case
(HMF, Sundern, Germany)
Protective case for safe transport of the prototypeEUR 30
TOTAL EUR 2602
* The system uses 2 units of RPLIDAR A2 LIDAR or 2 units of FHL-LD19 LIDAR.
Table 3. Preliminary detection results in extreme lighting conditions.
Condition of
Lighting
Type of
Interaction
No. of
Attempts
Detections
Correct
FailuresSuccessful Detections (%)Remarks
Total darknessSlow approach2019195%Stable response, no false positives
Total darknessDirect contact20200100%Immediate and consistent detection
Total darknessQuick gesture2018290%Some failures in very fast movements
Moderate ambient lightSlow approach2019195%Dark-like performance
Moderate ambient lightDirect contact20200100%No incidents
Moderate ambient lightQuick gesture2017385%Slight reduction in accuracy
Intense lightingSlow approach2018290%Some loss of spot detection
Intense lightingDirect contact2019195%Small perceived latency
Extensive lightingQuick gesture2017385%Greater variability, less robust detection
Table 5. Descriptive Statistics of TAM Constructs.
VariableMinimalMaximumStockingStandard Deviation
PEOU354.40.47
PU454.50.38
US354.50.40
BI354.30.50
Table 6. Correlations between TAM constructs.
VariablePEOUPUUSBI
PEOU10.780.740.70
PU0.7810.820.76
US0.740.8210.80
BI0.700.760.801
Table 7. Construct reliability using Cronbach’s alpha.
VariableCronbach’s AlphaBI
PEOU0.833
PU0.853
US0.873
BI0.883
Table 8. Summary comparison of the characteristics of the two prototypes developed.
FeaturePrevious PrototypeCurrent Prototype
InstallationRequires manual adjustment and careful calibrationQuick configuration using parameters on the web platform
PortabilityLimited, fixed mountingPortable case with all elements integrated
Lighting sensitivityAffected by shadows and changes in lightNot affected by ambient lighting or shadows
Dependence on physical objectsNeed for specific colored balls for detectionCompatible with different objects and materials, without color restriction
Interaction detectionBased on 2D image processing, perceptible latencyLiDAR and point cloud fusion, virtually unnoticeable latency
Content flexibilityPre-programmed and limited gamesH5P to create unlimited activities, integrable with LMS (Moodle)
Multiple usersLimited, one-on-one interactionSupports interaction of multiple users for turn-based activities
RobustnessSensitive to environmental changesHigh robustness, stable in different environments and surfaces
Educational scalabilityLimited to deployed gamesScalable, adaptable to different educational levels and topics
Disclaimer/Publisher’s Note: The statements, opinions and data contained in all publications are solely those of the individual author(s) and contributor(s) and not of MDPI and/or the editor(s). MDPI and/or the editor(s) disclaim responsibility for any injury to people or property resulting from any ideas, methods, instructions or products referred to in the content.