Article

Integrating Process Mining and Machine Learning for Surgical Workflow Optimization: A Real-World Analysis Using the MOVER EHR Dataset

1
Management Information Systems Department, Omer Seyfettin Faculty of Applied Sciences, Bandirma Onyedi Eylul University, Bandırma 10200, Türkiye
2
Department of Computer Technologies, Gönen Vocational School, Bandırma Onyedi Eylül University, Bandırma 10200, Türkiye
3
Department of Electrical Power Engineering, University of Ruse, 7017 Ruse, Bulgaria
*
Author to whom correspondence should be addressed.
Appl. Sci. 2025, 15(20), 11014; https://doi.org/10.3390/app152011014
Submission received: 16 September 2025 / Revised: 4 October 2025 / Accepted: 10 October 2025 / Published: 14 October 2025
(This article belongs to the Special Issue Machine Learning for Healthcare Analytics)

Abstract

The digitization of healthcare has enabled the application of advanced analytics, such as process mining and machine learning, to electronic health records (EHRs). This study aims to identify workflow inefficiencies, temporal bottlenecks, and risk factors for delayed recovery in surgical pathways using the open-access MOVER dataset. A multi-stage framework was implemented, including heuristic control-flow discovery, Petri net-based conformance checking, temporal performance analysis, unsupervised clustering, and Random Forest-based classification. All analyses were simulated on pre-discharge (“preliminary”) patient records to enhance real-time applicability. Control-flow models revealed deviations from expected pathways and issues with data quality. Conformance checking yielded perfect fitness (1.0) and moderate precision (0.46), indicating that the model generalizes despite clinical variability. Stratified performance analysis exposed duration differences across ASA scores and age groups. Clustering revealed latent patient subgroups with distinct perioperative timelines. The predictive model achieved 90.33% accuracy, though recall for delayed recovery cases was limited (24.23%), reflecting class imbalance challenges. Key features included procedural delays, ICU status, and ASA classification. This study highlights the translational potential of integrating process mining and predictive modeling to optimize perioperative workflows, stratify recovery risk, and plan resources.

1. Introduction

The enactment of the Health Information Technology for Economic and Clinical Health (HITECH) Act in 2009 has markedly accelerated the digital transformation of healthcare institutions, particularly by promoting the widespread adoption of health informatics technologies [1]. A central outcome of this legislative initiative has been the rapid proliferation of electronic health record (EHR) systems across clinical settings, which now serve as critical infrastructure for capturing and managing patient-level healthcare data. Despite these advancements, comprehensive access to high-quality medical datasets remains constrained, with only a limited number of publicly available resources to support reproducible research and methodological development.
In response to this data accessibility gap, the University of California, Irvine (UCI) Medical Center has released the Medical Informatics Operating Room Vitals and Events Repository (MOVER), a freely available and high-resolution surgical dataset designed to support a broad range of research activities [2]. This dataset facilitates novel inquiry not only within the scope of artificial intelligence and machine learning, but also across traditional domains such as statistical modeling, clinical epidemiology, operations research, and workflow optimization [3].
Among the emerging methods for extracting actionable insights from such datasets, process mining has demonstrated increasing relevance. Distinct from conventional data analytics, process mining integrates techniques from business process management and data science to reconstruct and evaluate the actual execution of care pathways, leveraging event log data derived from EHR systems [4,5]. Hospital Information Systems (HIS)—which serve as the operational backbone of modern healthcare delivery—record granular, timestamped sequences of patient encounters, including admissions, diagnostic procedures, interventions, and discharge activities [6,7].
Each patient encounter within the HIS is typically encoded as a unique case ID, with associated event types and timestamps. These structured records serve as the foundational input for process mining algorithms, which aim to discover, monitor, and improve real-world care processes. By systematically analyzing such time-ordered event logs, researchers can uncover inefficiencies, deviations from standard procedures, and performance bottlenecks—thereby generating a more transparent and evidence-based understanding of healthcare workflows [8,9].
This study aims to investigate how process mining techniques can be utilized to assess operating room efficiency and patient throughput. The motivation stems from persistent challenges in operating room scheduling, workflow timing, and bottlenecks—issues that significantly impact healthcare quality and cost. The main objectives are to:
  • Identify delays in the operating room process, specifically between room entry and exit times (as proxies for surgery start and end).
  • Detect unusual or inefficient patterns during off-hours or non-standard workflows.
  • Characterize common and uncommon process variants in surgical patient pathways.
  • Clustering patients to observe unusual conditions.
  • Define the outliers of surgery and recovery durations.
The key contributions of this study include:
  • A refined question-oriented framework tailored to operating room workflows using the L* life cycle model.
  • A reproducible pipeline for event log creation and analysis using the MOVER database.
  • Identification of process inefficiencies and potential improvement points in operating room workflows.
  • Demonstration of basic premortem analysis capabilities based on real-time data simulations.

2. Related Work

Process mining has gained prominence in healthcare as an analytical tool that enables the examination of complex workflows, particularly in high-stakes environments such as operating rooms. Studies have shown that process mining can help uncover inefficiencies, variations, and bottlenecks in healthcare processes, which is crucial for enhancing operational efficiency and improving patient outcomes. The literature reveals a progression from early explorations of process discovery toward more structured, goal-driven methodologies, although challenges persist—especially regarding data quality and achieving actionable outcomes.
Early work by Mans et al. [3,5,10] and Van der Aalst [10] demonstrated that process mining can be used to visualize clinical pathways and compare real-world execution against ideal models. Building on these foundational studies, more recent contributions have emphasized the translation of process mining into structured, goal-driven evaluations of surgical workflows. For example, Erdogan and Tarhan [11] introduced the Goal–Question–Feature–Indicator (GQFI) methodology, which directly links process insights to operational outcomes. Similarly, Wilkins-Caruana et al. [12] and Benevento et al. [13] highlighted the value of detecting deviations and bottlenecks in real-world data, underscoring the importance of contextualizing anomalies rather than treating them solely as data quality issues. These advances resonate with our approach, which combines process mining with predictive modeling to uncover both structural inefficiencies and clinically meaningful risk factors.
Another ongoing challenge in healthcare process mining lies in data quality and standardization. Rojas et al. [14], Munoz-Gama et al. [7], and Homayounfar [4] have demonstrated that the fragmented, multi-source nature of healthcare data presents challenges for effective log generation. Most existing studies rely on proprietary datasets, limiting reproducibility. However, recent research has begun to utilize open access repositories, such as MIMIC-III [15,16] and MOVER [2], which promote transparency and broader applicability. Our study contributes to this movement by leveraging the MOVER dataset, one of the few real-world open repositories of operating room event logs.
To synthesize the contributions and position of this study, Table 1 compares key methodological features from literature with our approach:
For instance, Mans et al. [17] explored the potential of process mining to map and optimize clinical pathways, finding that process mining could reveal both expected and unexpected treatment sequences, providing healthcare professionals with valuable insight for process optimization.
Much of the existing literature focuses on data quality and preparation challenges due to the diverse, fragmented, and sensitive nature of healthcare data. Studies by Rojas et al. [14] have highlighted that while process mining holds great promise in healthcare, adapting data to fit process mining standards is often one of the most challenging aspects of the process. The quality of event logs directly influences the accuracy and relevance of the insights generated. To address these issues, data preparation frameworks, such as the L* life cycle model, have been introduced to systematize the cleaning and preparation of healthcare data for process mining purposes. Researchers, such as Van der Aalst [31], have emphasized the importance of lifecycle models in maintaining data integrity, particularly in sensitive fields like healthcare.
The MOVER database represents a noteworthy advancement by providing an open-access repository of operating room records, which is rare in healthcare research due to stringent privacy regulations. The availability of such a dataset enables the application of data-driven techniques, such as process mining, in real-world hospital settings, as demonstrated in other open access healthcare databases. Researchers have used similar resources to analyze patient flow, hospital admission patterns, and surgical procedures, generating actionable insights that can support policy and process improvements [12,13,15,16,18]. For example, studies have shown how process mining could enhance resource allocation in hospitals, emphasizing the impact of transparent and accessible data repositories on healthcare research [19,20].
Building upon these general methodologies, recent scholarship has increasingly focused on surgical workflow optimization and prediction of perioperative outcomes. Surgical processes are among the most complex and resource-intensive hospital activities and thus have been the subject of intensive analysis. Mans et al. [28], for instance, applied process mining to surgical pathways and identified key sources of delay, while Padoy [24,30] reviewed computer-assisted workflow analysis in the operating room, underscoring the potential of integrating workflow models with surgical decision support systems. Parallel to workflow optimization, studies on perioperative outcome prediction have highlighted the importance of patient characteristics: large-scale analyses, such as those by Khuri et al. [25], demonstrated the predictive value of comorbidities and ASA class in postoperative complications. More recent machine learning-based approaches, such as the work by Futoma et al. [29], have further leveraged electronic health record data for risk stratification, showcasing the potential of predictive analytics in perioperative care. Taken together, these contributions illustrate how process mining and predictive modeling can be combined to address both efficiency and risk.
This study extends this growing body of research by applying a reproducible process mining pipeline to the open access MOVER dataset. Specifically, the use of the L* life cycle model provides a structured framework to address the complexities of healthcare data quality and workflow variability. By combining process mining with predictive modeling, our approach offers novel insights into the management of surgical processes, demonstrating how adequately prepared open access data can be effectively utilized to enhance both patient care and operational performance.

3. Materials and Methods

3.1. Data Description

The data used in this study were obtained from the University of California, Irvine (UCI) Medical Center in Orange County, California/USA publication at the address https://mover.ics.uci.edu/index.html (accessed on 3 Augst 2025) by signing the UCI-OR Data UCI Agreement.
Each patient is assigned a unique Medical Record Number (MRN), allowing for longitudinal case tracking. Key timestamped attributes include hospital admission and discharge times, operating room entry and exit (IN_OR_DTTM, OUT_OR_DTTM), and anesthesia start and stop times. Planning and cancelation timestamps were also included to enable process reconstruction.
Basic statistics of the dataset are as follows:
  • Patients (cases): 39,685.
  • Events: 402,647.
  • Start activities:
    ‘Hospital Admission’: 39,673.
    ‘Surgery Passed’: 3.
    ‘Operating Room Enter’: 6.
    ‘Anesthesia Start’: 1.
  • End activities:
    ‘Hospital Discharge’: 39,573.
    ‘Anesthesia Stop’: 22.
    ‘Operating Room Exit’: 88.
In compliance with the Health Insurance Portability and Accountability Act (HIPAA), all patient-identifying information has been removed or anonymized to ensure confidentiality and privacy. The MOVER dataset applies privacy-preserving transformations that affect temporal analyses. Specifically, dates are shifted individually per patient, preserving intra-patient temporal order but preventing cross-patient or calendar-level comparisons (e.g., daily or seasonal workload trends). Additionally, surgical incision and closure timestamps are inconsistently available, requiring anesthesia start/stop or operating room entry/exit times as proxies for surgical duration. While these constraints limit system-wide or high-granularity analyses, they do not affect patient-level workflow reconstruction, which remains valid and clinically interpretable.
As a result, although the internal sequence and duration of events for a single patient remain intact (e.g., surgery durations, time from admission to discharge), cross-patient comparisons are not valid in real-time. Two patients who appear to have undergone surgery on the same date may, in fact, have done so in entirely different time periods.
This limitation precludes reliable bottleneck analysis and prevents the determination of time-based patterns, such as peak surgery days [32,33]. Nonetheless, the dataset supports accurate intra-case analysis, including:
  • Trace variant discovery.
  • Inter-activity time calculations.
  • Workflow visualization at the hourly scale.
Accordingly, the present study focuses on patient-level process mining, emphasizing individual surgical workflows rather than system-wide or calendar-based temporal trends.

3.2. Methodology

This study adopts the healthcare process mining reference model proposed by R.S. Mans et al. [5], which provides a conceptual framework for analyzing clinical processes based on health information systems. According to this model, analysis begins with extracting data from the hospital information system—in this case, the MOVER database—and continues through event log generation and process discovery using process mining techniques.
The MOVER dataset, available in CSV format upon approval of the agreement [2], features clearly labeled tables. These tables allow for structured data transformation and process reconstruction through Extract–Transform–Load (ETL) operations.
Following the L* life cycle model described in the Process Mining Manifesto [34], a multi-stage methodology was implemented to structure the discovery, analysis, and interpretation phases [31].
At the planning and adjustment stage, hospital registration and surgical processes within the MOVER database were explored using a question-driven analytical approach. Research questions were formulated based on structured frameworks, such as the Goal–Question–Metric (GQM) and Goal–Question–Fact–Indicator (GQFI) models [3,35,36,37], which are well-suited for analyzing healthcare performance.
The following key research questions guided the analysis:
Q1.
What is the hourly distribution of operating room activities?
Q2.
Where do deviations from expected process sequences occur?
Q3.
Which process variants are most prevalent, and which ones exhibit anomalies?
Q4.
What are the typical delays between operating room entry and exit, and where do bottlenecks emerge?
Q5.
Are there any abnormal event sequences (e.g., discharge before surgery)?
Q6.
How do delays influence recovery time or length of stay?
Based on reference architecture, the third stage involved selecting suitable process mining methods aligned with the structure and quality of the extracted data. After iterative refinement, the data were transformed into a process-mining-compatible format, emphasizing patient identity, procedure timelines, and intraoperative steps—from admission to discharge.
To maintain focus on surgical workflows, the analysis included only relevant entities from the MOVER database. Administrative and demographic records were used, while data related to payment, radiology, and laboratory results were deliberately excluded.

3.3. Stage 1: Data Preprocessing

In the initial phase of this study, a structured data preprocessing pipeline was implemented to ensure high-quality input for process mining analysis. The steps are summarized below:
Duplicate removal: Rows were considered duplicates if all core identifiers (MRN, admission date, discharge date, and intraoperative timestamps) were identical. Using this criterion, 1364 duplicate records, identified by patient MRN, Activity, and datetime columns, were removed.
Timestamp validation and correction: Logical consistency rules were enforced to detect anomalies:
  • Hospital admission must precede hospital discharge.
  • Operating Room Entry must precede Operating Room Exit.
  • Anesthesia Start must precede Anesthesia Stop.
  • Surgery planning and cancelation must occur within the admission–discharge window.
Records violating these rules were flagged. For example, one patient record with reversed OR entry/exit times was corrected. A small number of unresolved anomalies (<0.01%) were excluded from downstream analysis.
Algorithmic corrections: Two algorithms (Algorithms 1 and 2, were implemented:
  • Algorithm 1: Surgery validation—identified valid surgeries using intraoperative timestamps and corrected SURGERY_DATE inconsistencies (e.g., dates defaulted to 00:00 that incorrectly preceded admission).
Algorithm 1 Determine the Surgery Type for Each Patient
Result: Determine the type of surgery for each patient in the dataframe
Input: A row of the dataframe containing the following columns:
  • IN_OR_DTTM: Date and time the patient entered the operating room
  • OUT_OR_DTTM: Date and time the patient exited the operating room
  • AN_START_DATETIME: Anesthesia start datetime
  • AN_STOP_DATETIME: Anesthesia stop datetime
  • HOSP_ADMSN_TIME: Hospital admission datetime
  • SURGERY_DATE: Scheduled surgery datetime
Output: A new column SURGERY_TYPE with values:
  • “Surgery Date Passed”, “Surgery Cancelled”, “Surgery Performed”
Function surgery_type(row):
if all {IN_OR_DTTM, OUT_OR_DTTM, AN_START_DATETIME, AN_STOP_DATETIME} are NULL then
’There is no surgery”
if (HOSP_ADMSN_TIME − SURGERY_DATE) > 1 day then
return ’Surgery Date Passed’
else
return ’Surgery Cancelled’
end
else
return ’Surgery Performed’
end
foreach row in DataFrame do
Call surgery_type(row)store the result in a new column SURGERY_TYPE
end
  • Algorithm 2: Planning/cancelation adjustment—aligned planning and cancelation timestamps with the admission–discharge interval, and reclassified cases lacking intraoperative timestamps as canceled.
Algorithm 2 Determine Surgery Plan and Cancellation Times
Result: Determine surgery plan and cancellation times for each patient in the DataFrame
Input: A row of the DataFrame containing the following columns:
  • SURGERY_TYPE: Type of surgery, i.e., “Surgery Date Passed”, “Surgery Performed”, or “Surgery Cancelled”
  • SURGERY_DATE: Scheduled surgery datetime
  • HOSP_ADMSN_TIME: Hospital admission datetime
  • HOSP_DISCH_TIME: Hospital discharge datetime
Output: New columns SRG_PLN_TIME and SRG_CNL_TIME with calculated planned surgery time and surgery cancel times
Function times(row):
if row[’SURGERY_TYPE’] == ’Surgery Date Passed’ then
plan_time = row[’SURGERY_DATE’]
cancel_time = row[’SURGERY_DATE’]
else if row[’SURGERY_TYPE’] == ’Surgery Performed’ then
cancel_time = NaT;
if row[’SURGERY_DATE’] ≤ row[’HOSP_ADMSN_TIME’] then
plan_time = row[’HOSP_ADMSN_TIME’] + 1 min
else
plan_time = row[’SURGERY_DATE’]
end
else if row[’SURGERY_TYPE’] == ’Surgery Cancelled’ then
if row[’SURGERY_DATE’] + 23 h 59 min >= row[’HOSP_DISCH_TIME’] then
plan_time = row[’HOSP_ADMSN_TIME’] + 1 min
cancel_time = row[’HOSP_DISCH_TIME’] − 1 min
else
plan_time = row[’SURGERY_DATE’]
cancel_time = row[’SURGERY_DATE’] + 23 h 59 min
end
return plan_time, cancel_time
foreach row in DataFrame do
Call times(row) and store the results in new columns as
SRG_PLN_TIME and SRG_CNL_TIME
end
A significant data quality issue was identified in the SURGERY_DATE field, which was provided in a date-only format without associated time information—defaulting to 00:00. This inconsistency frequently caused surgery dates to appear before hospital admission timestamps, which is logically incorrect and can bias temporal analyses [21,22,38]. To address this, Algorithms 1 and 2 were implemented. Before applying Algorithms 1 and 2, a total of 40,510 (62.95%) patient records contained logical inconsistencies (SURGERY_DATE < Admission) where the SURGERY_DATE field (defaulted to 00:00) preceded hospital admission. After preprocessing, 40,505 (99.99%) of these anomalies were corrected using intra-op timestamps, aligning surgical timestamps with admission–discharge windows. Only five records (0.01%) remained unresolved due to SURGERY_DATE passed before admission, and these were excluded from downstream analyses to avoid bias.
This logic identifies surgeries that were carried out based on the presence of intraoperative timestamps, such as anesthesia start and OR entry, and flags inconsistencies.
Following this step, Algorithm 2 was executed to correct the planning and cancelation timestamps of surgical events. The goal was to ensure that all surgery-related timestamps fell within the admission and discharge window.
If surgery was recorded as “cancelled”, the planning and cancelation times were verified to fall within the hospitalization period. Similarly, for performed surgeries, the planning time was constrained to be between admission and discharge.
An additional rule was introduced to classify surgeries that occurred on the same day as the admission date and lacked intraoperative timestamps as canceled surgeries.
Validation: After cleaning, anomalies in the SURGERY_DATE field were reduced from 62.95% of records to <0.01%. To validate Algorithms 1 and 2, a random sample of 50 patient records was manually reviewed by two of the study authors, both with expertise in process mining and healthcare informatics. Each author independently checked the temporal consistency of admission, discharge, and intraoperative timestamps, and compared these with the algorithmic classifications (performed, canceled, or passed). The manual review and algorithm agreed in 98% of cases. Inter-rater reliability between the two authors was assessed using Cohen’s kappa, which was 0.878, indicating near-perfect agreement beyond chance. No negative durations (e.g., discharge before admission) remained in the processed dataset.
This rigorous pipeline ensured that the resulting event log was both structurally consistent and clinically interpretable, providing a reliable foundation for subsequent process mining and predictive modeling. Additionally, 14 patient records missing either hospital admission or discharge dates were excluded from further analysis.
The results of both algorithms were incorporated into a refined dataset. Table 2 presents selected records, demonstrating post-processing outputs including surgery planning and cancelation information:
Because incision start/end times are not specific in the MOVER dataset, precise surgical start and end times (i.e., incision timestamps) are not available. Therefore, the start of anesthesia or entry into the operating room (whichever occurs first) was used as a proxy for the start of surgery. Similarly, anesthesia stop or operating room exit (whichever occurs later) was used as a proxy for the end of surgery. This approach aligns with conventions in surgical process mining studies, where intraoperative timestamps are incomplete [21,22,38].
Using the cleaned dataset, an event log was generated from the patient_information.csv file as shown in Table 3. Each patient was identified by their Medical Record Number (MRN), which was used as the case_id in the event log. For every patient, discrete medical events such as Hospital Admission, Surgery Planned, Operating Room Entry, and Anesthesia Start were extracted and timestamped appropriately.
Each row in the event log includes the case_id, the activity, and its corresponding timestamp. For example, the HOSP_ADMSN_TIME field was converted into an event named Hospital Admission, and HOSP_DISCH_TIME was mapped to Hospital Discharge. Similarly, OR entry/exit and anesthesia start/stop fields were transformed into sequential events, respecting their temporal order.
The resulting event log conforms to the XES-like format required by process mining libraries and tools. All preprocessing steps, including timestamp validation, algorithmic classification, and event generation, were implemented using the PM4PY (Version 2.7.17.1) library [23,39].

4. Results

This section presents the findings obtained by applying process mining methodologies to the MOVER surgical dataset, following a structured lifecycle that includes control-flow discovery, performance analysis, predictive modeling, and clustering. Each analytical phase was designed to address specific research questions related to process transparency, operational deviations, time-related inefficiencies, and potential predictive capabilities in perioperative care. The results are organized chronologically to reflect this methodological sequence and are supported by statistical visualizations and event-log-driven insights.
The control-flow discovery phase aimed to uncover both standard and deviant surgical workflows by applying heuristic and direct-follows graph algorithms. These techniques enabled the identification of procedural inconsistencies and exceptional cases that deviate from established clinical pathways. The subsequent integrated process modeling utilized Petri nets and token-based replay algorithms to assess model fitness and precision, offering a formalized representation of care delivery sequences.
In the operational performance stage, preliminary simulation techniques were implemented by excluding outcome-dependent variables, enabling real-time anomaly detection scenarios. Temporal distribution patterns, such as hourly trends in OR usage and stratified analysis of surgery duration by ASA score and patient age, provided operationally actionable insights.
Finally, the predictive modeling and clustering stage employed both unsupervised (K-Means) and supervised (Random Forest Classifier) approaches to explore underlying patterns and risk factors associated with delayed postoperative recovery. Despite limitations due to class imbalance, the models highlighted key process variables and patient-level features that could inform future interventions, resource planning, and risk stratification in surgical care.

4.1. Control-Flow Model Discovery

To initiate control-flow analysis, a heuristic miner algorithm was employed to generate an initial process flow graph, as depicted in Figure 1. This technique is well-suited for extracting dominant process structures from noisy healthcare datasets, providing a generalized but interpretable overview of patient journeys through surgical care [40].
Unlike directly following graphs, the heuristic miner summarizes frequent behavioral patterns by suppressing infrequent paths and incomplete traces [41,42]. Although this abstraction aids in clarity and resilience, it may conceal rare but clinically significant deviations from standard procedures [43,44].
To address this limitation, a directly follows graph was subsequently constructed (see Figure 2), which visualizes the complete set of activity transitions along with their frequency, allowing for a more granular inspection of the process landscape [45,46]. This graph was instrumental in identifying process deviations and anomalies that are not visible in the heuristic model.
While the dataset did not explicitly encode emergency vs. elective status, we applied a proxy classification based on admission to surgery start interval. If a patient is operated on within an hour of the scheduled surgery time, we assume it is an emergency-like. Anomalies such as anesthesia initiation prior to registration and discharge during anesthesia were disproportionately concentrated in unplanned or rapid-turnaround cases, suggesting that many deviations reflect urgent clinical workflows rather than data-entry errors. This finding increases the clinical relevance of the detected deviations. To refine the anomaly analysis, we focused on a subset of clinically relevant workflow deviations shown in Table 4.
Notably, “Anesthesia Start before Admission” (n = 5) and “Discharge before Anesthesia Stop” (n = 42) were among the most critical inconsistencies. Many of these deviations were disproportionately concentrated in emergency-like cases (e.g., 80% of anesthesia-before-admission events), consistent with urgent workflows where patients bypass formal admission processes or documentation lags behind clinical action.
Other anomalies, such as “Anesthesia Stop before OR Entry” (n = 375) or “OR Entry before Discharge” (n = 32), may in part reflect cases where patients underwent multiple surgeries during the same hospital stay. In such scenarios, overlapping timestamps between consecutive operations can create apparent logical inconsistencies in the directly follows graph.
Overall, this contextualized analysis suggests that while some anomalies indeed signal documentation quality issues, others represent legitimate clinical adaptations (e.g., emergencies, repeated surgeries). This distinction underscores the importance of combining process mining with domain expertise when interpreting deviations.
While the raw event log reported only a single instance of Anesthesia Start without Registration, this discrepancy arose from normalization steps in the visualization algorithm, which aggregates repeated and concurrent events for clarity. These findings underscore the importance of utilizing detailed graphical representations to identify subtle process violations and offer partial answers to Research Question 2 (Q2) regarding deviations from expected process sequences.

4.2. Integrated Process Model

In the second stage of the analysis, a Petri net model was constructed to represent the underlying structure of patient-related surgical processes, as illustrated in Figure 3 [47]. This model was derived from the directly follows graph (Figure 2) and captures key transitions and temporal metrics associated with different process variants.
While Figure 2 and Figure 3 appear visually dense, this reflects the inherent complexity of surgical workflows and the inclusion of all transitions. To aid interpretation, we provide enlarged and high-resolution versions in the Supplementary Materials and include zoomed-in examples of key pathways to illustrate the clinical relevance of the observed deviations.
To assess the quality of the discovered model, the original event log was replayed on the Petri net using a token-based replay algorithm, a well-established method in process mining for conformance checking [48,49]. This algorithm evaluates the model’s accuracy in replicating real-world execution by computing fitness (i.e., the degree to which observed behavior is accurately captured) and precision (i.e., the degree to which the model avoids overgeneralization).
The fitness evaluation yielded perfect scores across all metrics:
Fitness: {
‘perc_fit_traces’: 100.0, //Percentage of fit traces (from 0.0 to 100.0);
‘average_trace_fitness’: 1.0,//Average trace fitness (between 0.0 and 1.0);
‘log_fitness’: 1.0,//Overall fitness of the log (between 0.0 and 1.0);
‘percentage_of_fitting_traces’: 100.0}//Percentage of fit traces (from 0.0 to 100.0).
However, precision was observed to be moderate (≈0.46):
Precision: 0.4593725046653312.
The Petri net achieved a fitness score of 1.0, meaning all recorded cases could be replayed without deviations. However, the precision was moderate (0.46), indicating that the model permits behaviors beyond those frequently observed in the dataset. This reflects the inherent variability of surgical workflows, where deviations arise from urgent procedures, documentation delays, or atypical care pathways. These findings indicate that while the model accurately captures the observed behavior, it may overgeneralize by allowing additional behavior not present in the event log. Such a trade-off is common in complex clinical environments, where variability in care paths requires balancing specificity with generalizability [49].
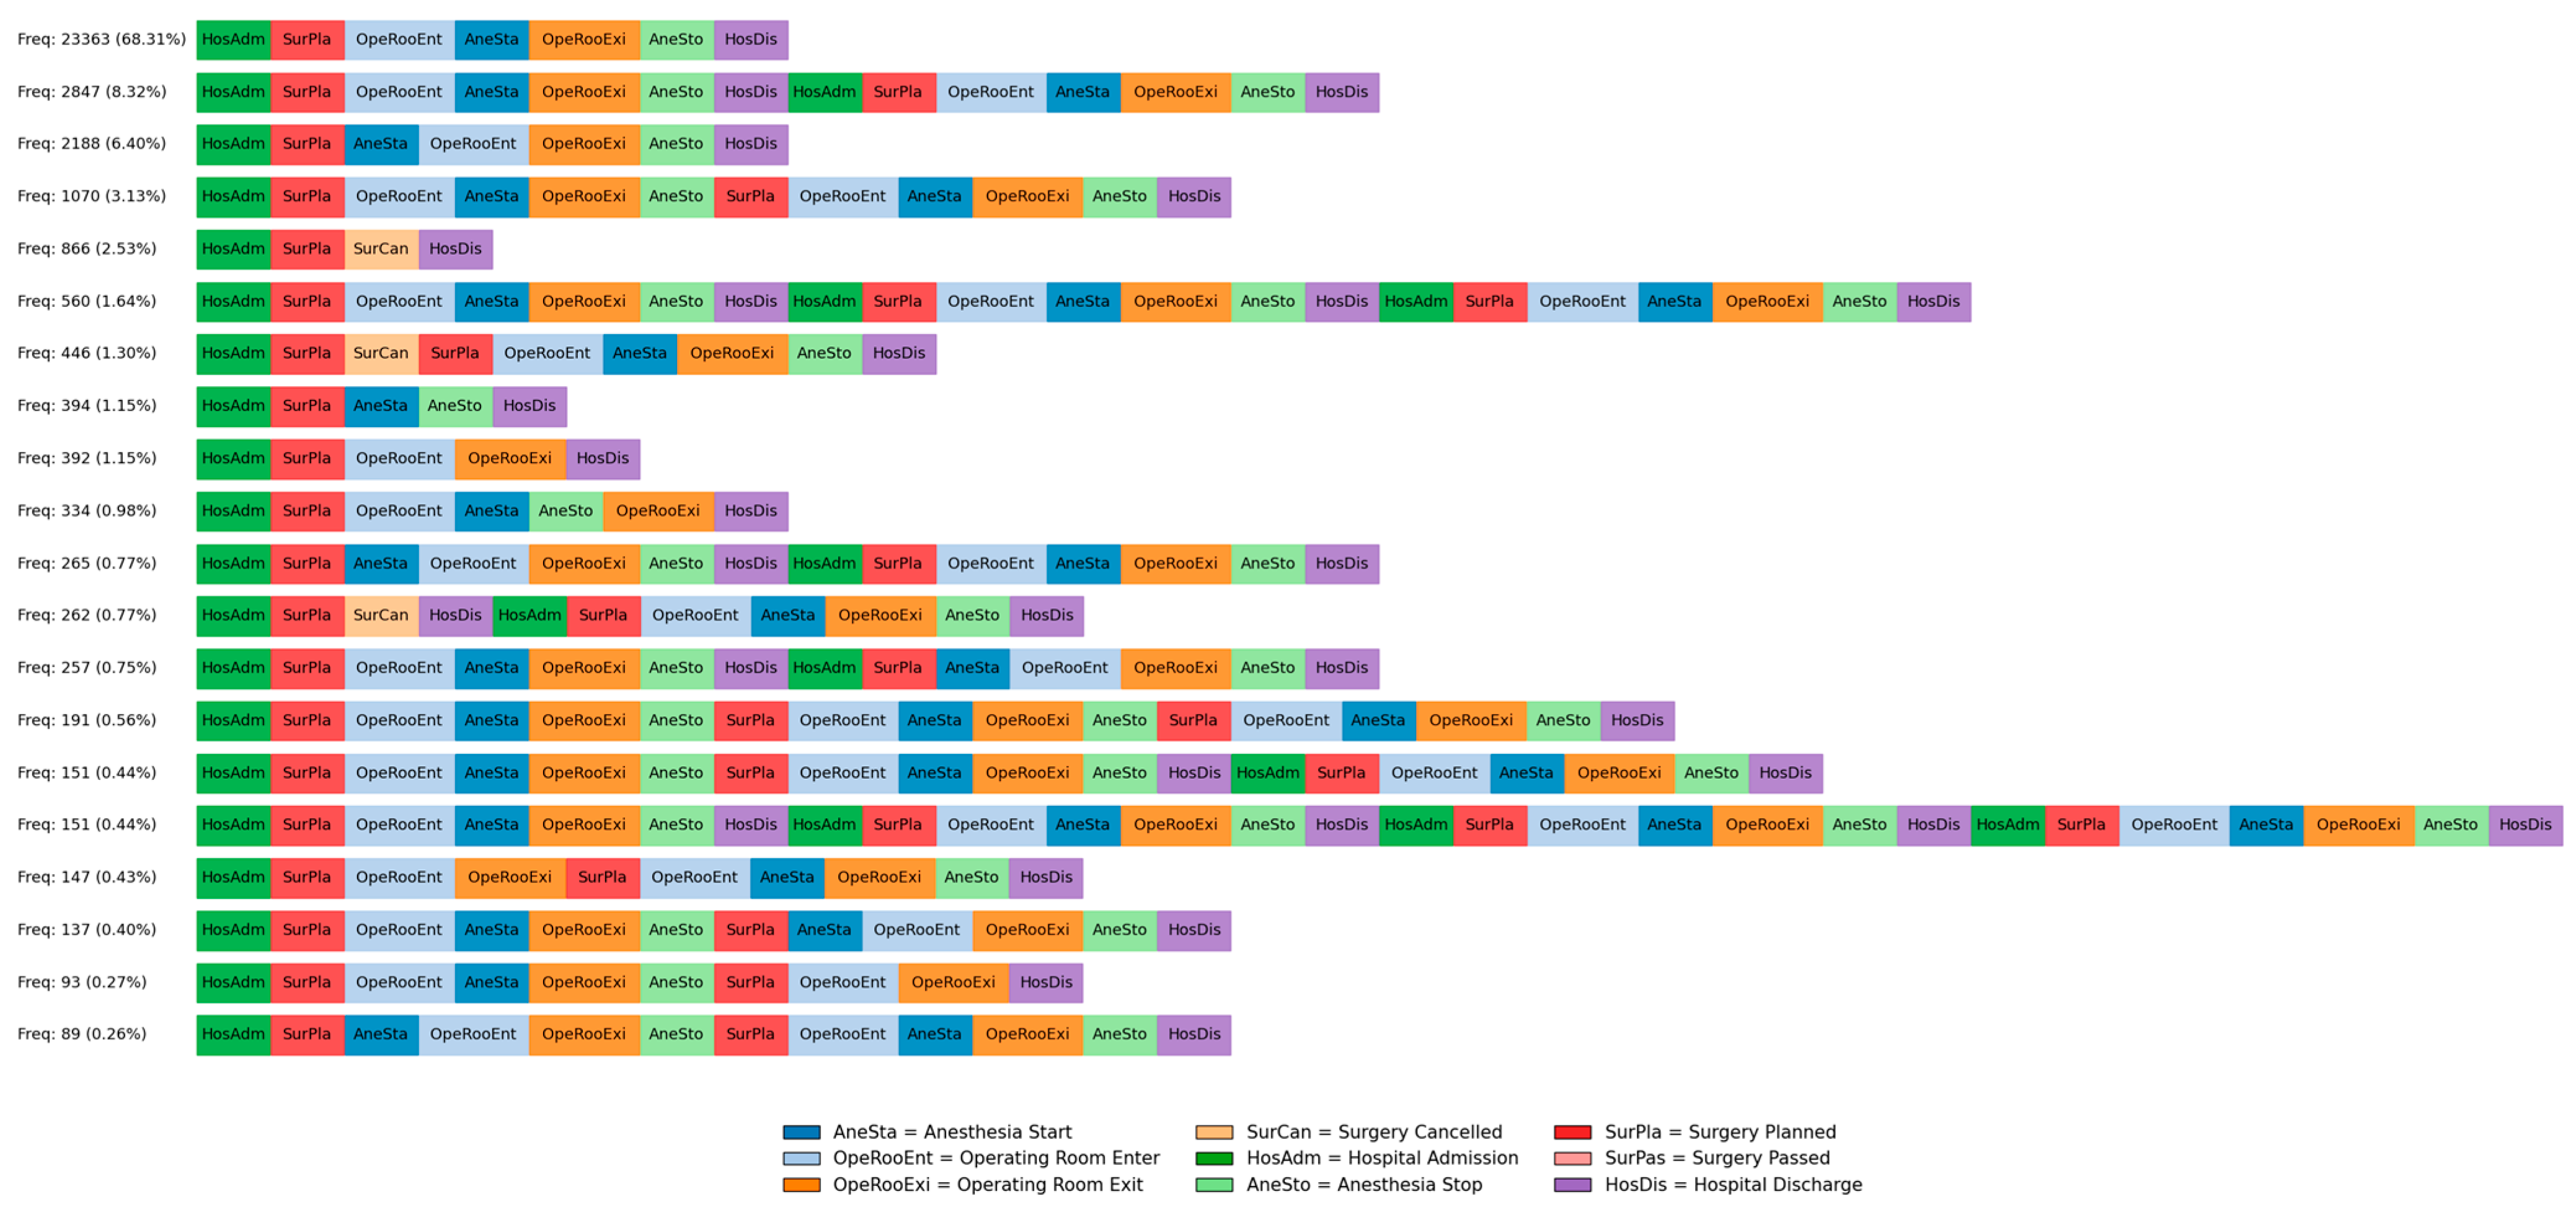
To further explore real-world execution paths, variant analysis was conducted. This step examines distinct sequences of activities (or traces) that different patients follow, enabling a more granular understanding of how workflows deviate in practice [50]. The Trace Explorer, presented in Figure 4, visualizes the frequency of the top process variants.
Key observations from the variant analysis include:
  • The top three variants accounted for 87.48% of all patient cases, suggesting a high degree of standardization in core surgical workflows.
  • A total of 4477 cases (2847, 1070, and 560 combined) involved patients who underwent multiple surgeries, indicating potential follow-up interventions or complications.
  • Variants with surgery cancelations represent a small proportion, highlighting exceptions where planned procedures were not performed.
  • Several low-frequency variants (<1%) contain repeated anesthesia start/stop events or multiple operating room entries, suggesting either complex surgical procedures or documentation inconsistencies.
  • Loops involving hospital admission, surgery planning, and re-admission indicate cases of postponed or rescheduled surgeries.
  • Despite the presence of deviations, the overall process remains highly structured, with most patients following a well-defined pathway from admission to discharge.
Such anomalies are typically attributed to recording errors, exceptional cases, or canceled procedures. Despite their low frequency, they provide valuable signals for process improvement and system resilience. Notably, these findings provide empirical support for Research Questions Q2 and Q5, which focus on identifying workflow deviations and anomalous event sequences, respectively.

4.3. Operational Support

In this final stage of process mining, three core operational support functionalities—detection, prediction, and recommendation—were examined, each contributing to the optimization of clinical workflows and data-driven decision-making [51,52,53,54]. These functionalities rely on preliminary data, defined as event logs captured in real-time or near real-time before patient discharge [55].
In this study, a basic preliminary simulation was implemented by masking all post-discharge fields and excluding future outcome variables from the model. This simulation enabled focused filtering and monitoring of ongoing or recently completed operating room cases, specifically highlighting cases that (i) deviated from expected activity sequences, or (ii) exhibited unusually long durations between key timestamps, such as OR entry and exit.
Although no predictive models were applied in this iteration, the simulation demonstrates how proof-of-concept data can be utilized for early detection of process anomalies, enabling proactive intervention before adverse outcomes occur. These methods lay the foundation for real-time anomaly detection systems in hospital environments, particularly in surgical and critical care contexts.
The insights obtained from this operational support stage contribute not only to identifying business exceptions but also to recommending process improvements that align with or exceed institutional performance standards [56,57]. When historical event logs are combined with real-time case progression data, targeted operational adjustments become feasible.
However, due to daily rolling timestamps within the MOVER database, temporal performance comparisons across days, weeks, or months are unreliable. Therefore, the analysis was confined to hourly patterns, which provided a more stable and meaningful breakdown of operational intensity.
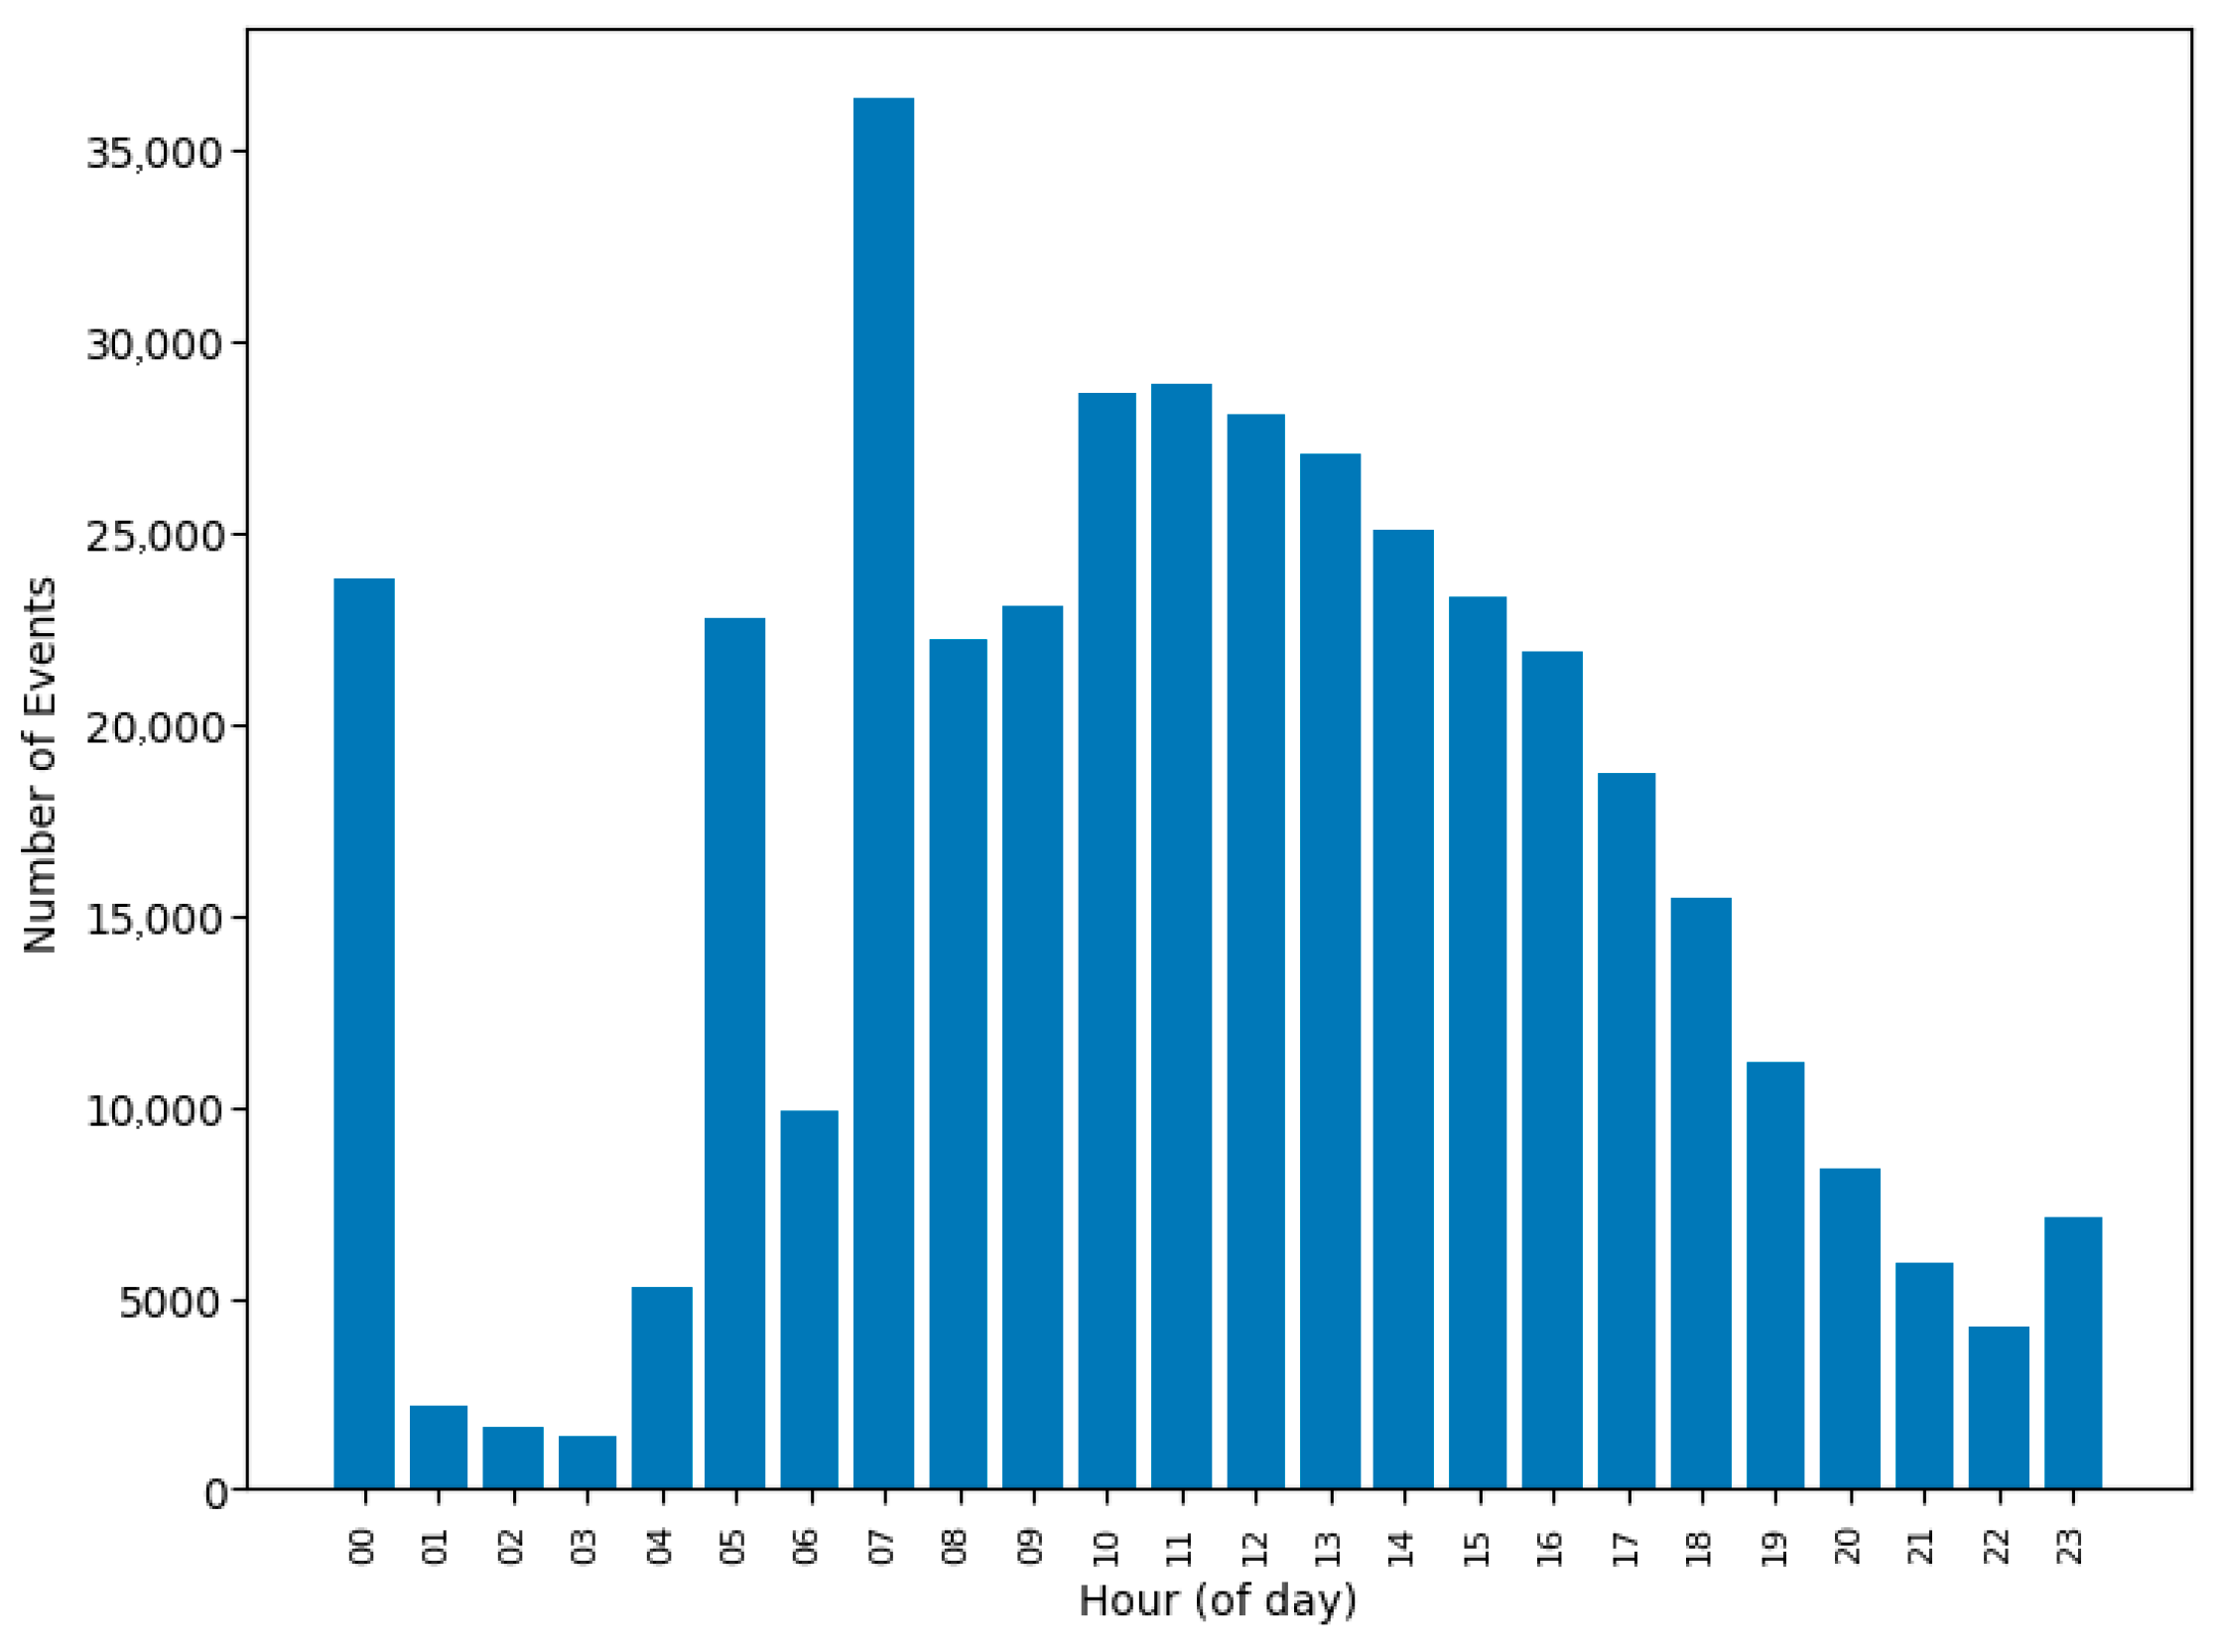
As shown in Figure 5, the highest density of surgical events occurred between 07:00 and 08:00, consistent with the expected start of elective procedures. An anomalous peak was observed between 00:00 and 01:00, which likely results from timestamp normalization errors around midnight. Interestingly, another rise in activity occurred between 05:00 and 06:00, the cause of which remains unclear but warrants further investigation—possibly related to early-morning emergency workflows or data entry practices.
The hourly distribution of surgical events, as visualized in Figure 5, reveals that the highest operational intensity occurs around 07:00, consistent with the scheduling of routine elective surgeries. This aligns with standard clinical expectations, where preoperative preparations typically culminate in early morning procedures.
Interestingly, an unexpected spike in activity is observed between 00:00 and 01:00, which is likely an artifact introduced by the midnight timestamp transition during hourly aggregation. Such patterns often result from inconsistencies in time normalization within health information systems.
Moreover, a notable increase in case frequency between 05:00 and 06:00 warrants further investigation. While this could indicate early morning emergency surgeries or preparatory activities, the cause remains unclear. This anomaly may reflect institution-specific operational routines, undocumented rescheduling patterns, or potential data entry irregularities.
To assess operating room occupancy dynamics, the duration between IN_OR_DTTM and OUT_OR_DTTM was computed for each case. These durations were then aggregated by hour to evaluate workload intensity across the 24 h cycle. The resulting visualization in Figure 6 provides a time-resolved view of operating room utilization, highlighting key fluctuations in intra-day clinical throughput.
Furthermore, Figure 6 demonstrates the total volume of surgical procedures conducted in the operating room, stratified by hour of the day. An apparent increase in activity is observed starting from 07:00, with the workload peaking around midday. Surgical interventions appear to be distributed consistently across most hours, followed by a gradual tapering toward the evening, suggesting a structured yet flexible scheduling pattern with potential implications for staffing and resource allocation.
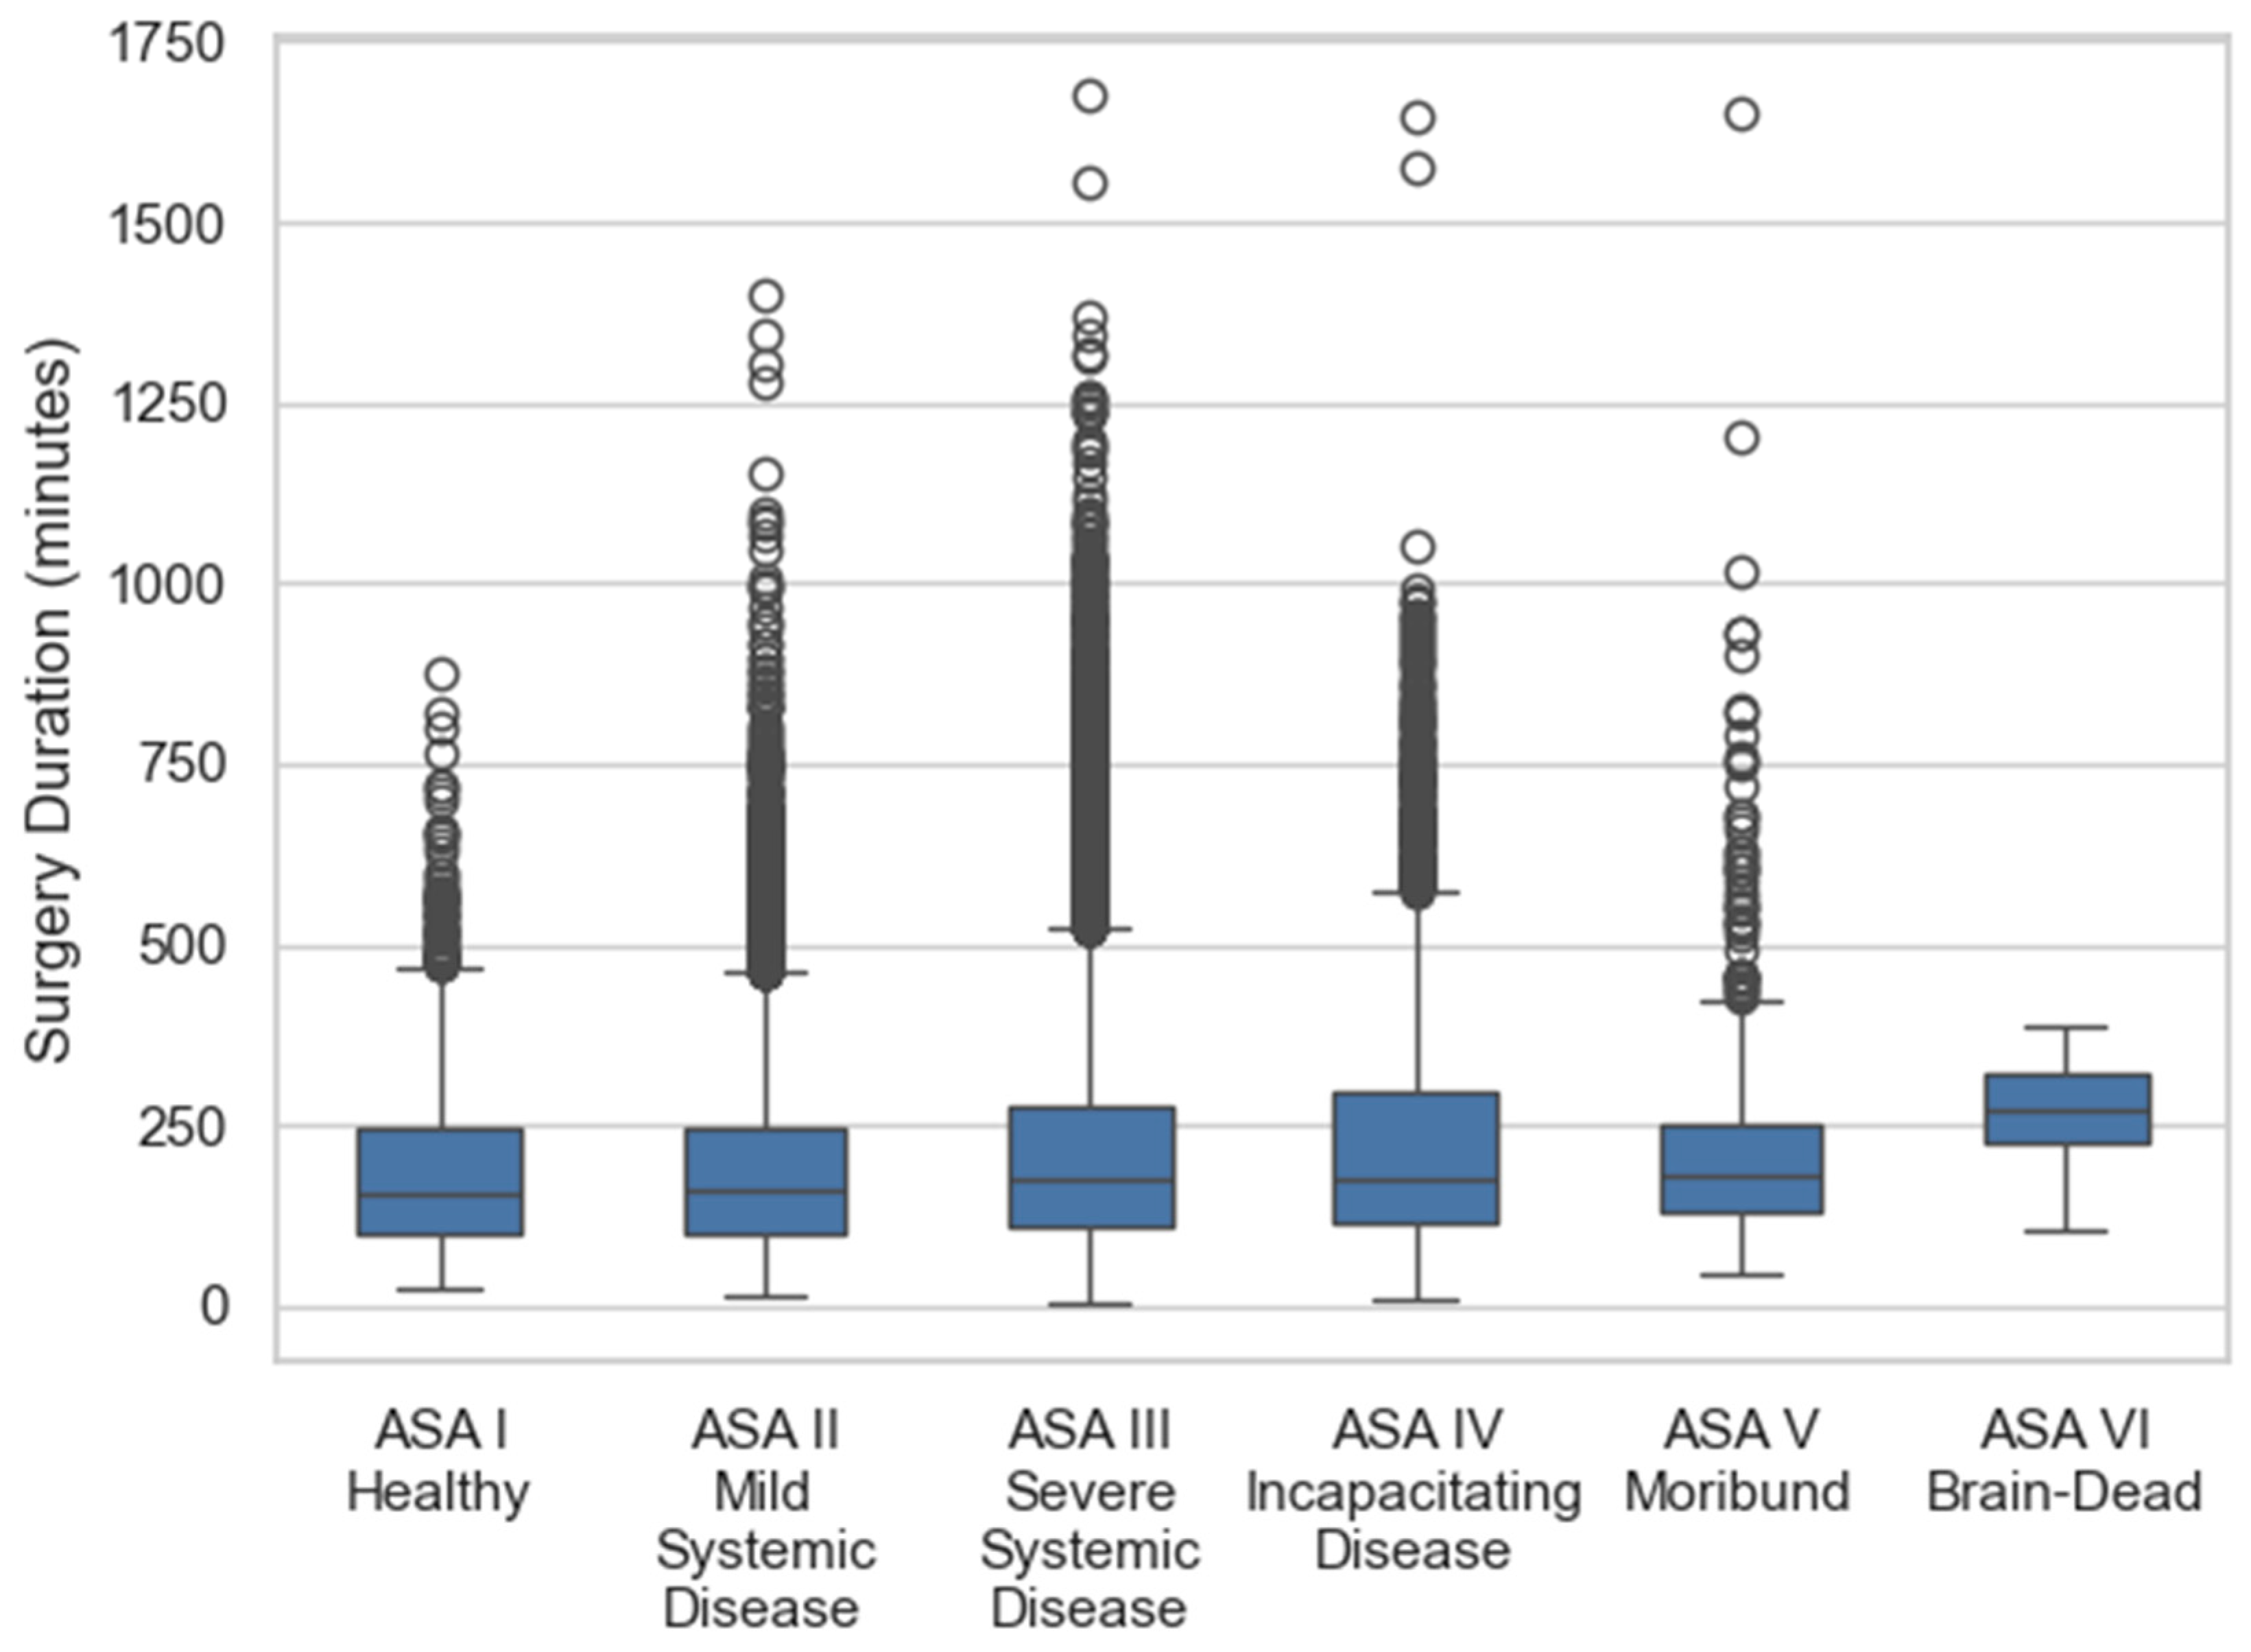
To further contextualize operating room efficiency, the American Society of Anesthesiologists (ASA) Physical Status Classification System was employed as a stratification tool [58]. This system offers a standardized method to assess patients’ preoperative health status, ranging from ASA I (healthy individuals) to ASA VI (brain-dead organ donors). In the subsequent analysis, we investigated how surgery duration varies across different ASA categories, thereby linking patient physiological risk to intraoperative resource utilization.
To formally test the observed group differences, we applied the Kruskal–Wallis H test. For ASA categories, the test indicated significant differences in surgery duration across groups (H = 296.8, p < 0.001). Post hoc pairwise Mann–Whitney U tests with Bonferroni correction confirmed that higher ASA scores (e.g., ASA 4–6) were associated with significantly longer surgical durations compared to lower ASA scores (ASA 1–3). Statistical testing confirmed significant differences across groups (Kruskal–Wallis H = 296.8, p < 0.001). Post hoc pairwise Mann–Whitney U tests with Bonferroni correction showed that higher ASA scores were associated with significantly longer durations.
As illustrated in Figure 7, patients with lower ASA ratings—such as ASA I (healthy individuals) or ASA VI (brain-dead organ donors)—tend to experience shorter and more consistent surgery durations. In contrast, as the ASA classification increases—signaling more severe systemic disease or critical physiological instability, the mean surgical duration extends, and the interquartile range broadens, reflecting greater variability. This observed pattern is clinically plausible, as patients in poorer preoperative condition often necessitate more complex, risk-managed, or multidisciplinary interventions, inherently lengthening the procedure duration.
From a healthcare operations standpoint, this correlation between ASA classification and procedure time is of strategic relevance. It suggests that ASA-based stratification can inform surgical scheduling algorithms, resource allocation plans, and preoperative risk assessments, thereby reducing scheduling conflicts and improving perioperative throughput.
Extending this analysis, Figure 8 investigates the variation in surgery duration across decade-based age groups (e.g., 0–9, 10–19, …, 90–99). This stratification was chosen to minimize individual-level noise and reveal age-related temporal patterns in operative workflow.
For age groups, the Kruskal–Wallis test also revealed significant variation in surgery duration (H = 545.6, p < 0.001). Pairwise post hoc analysis showed that older patients (≥60 years) had significantly longer surgical durations compared with younger age groups (p < 0.001 after correction). Statistical testing confirmed significant differences across groups (Kruskal–Wallis H = 545.6, p < 0.001). Post hoc pairwise Mann–Whitney U tests with the Bonferroni correction showed that older patients (≥60 years) had significantly longer durations than the younger groups.
These findings statistically validate the visual trends presented in Figure 7 and Figure 8.
As shown in Figure 8, surgery durations exhibit a mild but discernible upward trend with increasing age, particularly within the 40–79 age bracket. This pattern likely reflects a combination of heightened clinical complexity, prevalence of comorbidities, and extended intraoperative precautions required in older patients. In contrast, younger age cohorts (e.g., 0–39 years old) demonstrate shorter and more consistent surgical durations, often associated with routine, low-risk procedures or standardized elective interventions. However, overlapping distributions across age groups suggest that age alone is not a sole determinant, but interacts with procedural type and physiological status to shape operative time requirements.
To improve the clinical interpretability of these findings, additional stratified analyses were conducted using structured patient-level features from the MOVER dataset. These variables included:
  • Demographics and patient status:
    Age, Sex, ASA Physical Status Classification, ICU Admission Flag.
  • Operative characteristics:
    Primary Anesthesia Type, Surgery Category (e.g., General, Orthopedic, Cardiothoracic, Neurosurgical).
  • Workflow-derived time intervals:
    Surgery Duration (min): Operating room entry → exit.
    Anesthesia Duration (min): Anesthesia start → stop.
    Delay from Scheduled Time (min): Deviation between the scheduled surgery time and the OR entry.
    Anesthesia Induction Lag (min): OR entry → anesthesia starts.
    Recovery Duration (min): OR exit → hospital discharge.
    Total Hospital Stay (min): Admission → discharge.
To facilitate downstream analysis, surgical procedures were automatically categorized using a keyword-matching algorithm based on operative notes and descriptions. This enabled a structured comparison across specialties and supported variant-aware performance analysis.

4.4. Predictive Modeling and Clustering

To identify underlying patterns in perioperative data, a K-means clustering analysis was performed using four numerical features: Surgery Duration, Anesthesia Duration, Delay From Planned, and Age. Delay_From_Planned was calculated as the time deviation between the scheduled surgery start (SURGERY_DATE, adjusted via Algorithm 2) and the actual Operating Room Entry (IN_OR_DTTM). This measure captures discrepancies between planned and actual operating room utilization, reflecting potential schedule overruns, emergency interruptions, or patient-related preparation delays.
Clustering was restricted to four continuous variables (surgery duration, anesthesia duration, delay from planned start, and patient age). This selection emphasized process-related and demographic factors while deliberately excluding outcome-related clinical covariates such as ASA classification and ICU admission. Including the latter could bias subgroup discovery toward known risk markers and reduce the capacity of clustering to reveal latent temporal patterns in perioperative workflows—our design, therefore, prioritized parsimony, interpretability, and avoidance of label leakage.
To evaluate cluster validity, we computed multiple internal validation metrics, including the average silhouette coefficient, Davies–Bouldin index, and Calinski–Harabasz index, for K values ranging from 2 to 10 clusters. These metrics offer complementary insights into intra-cluster cohesion and inter-cluster separation.
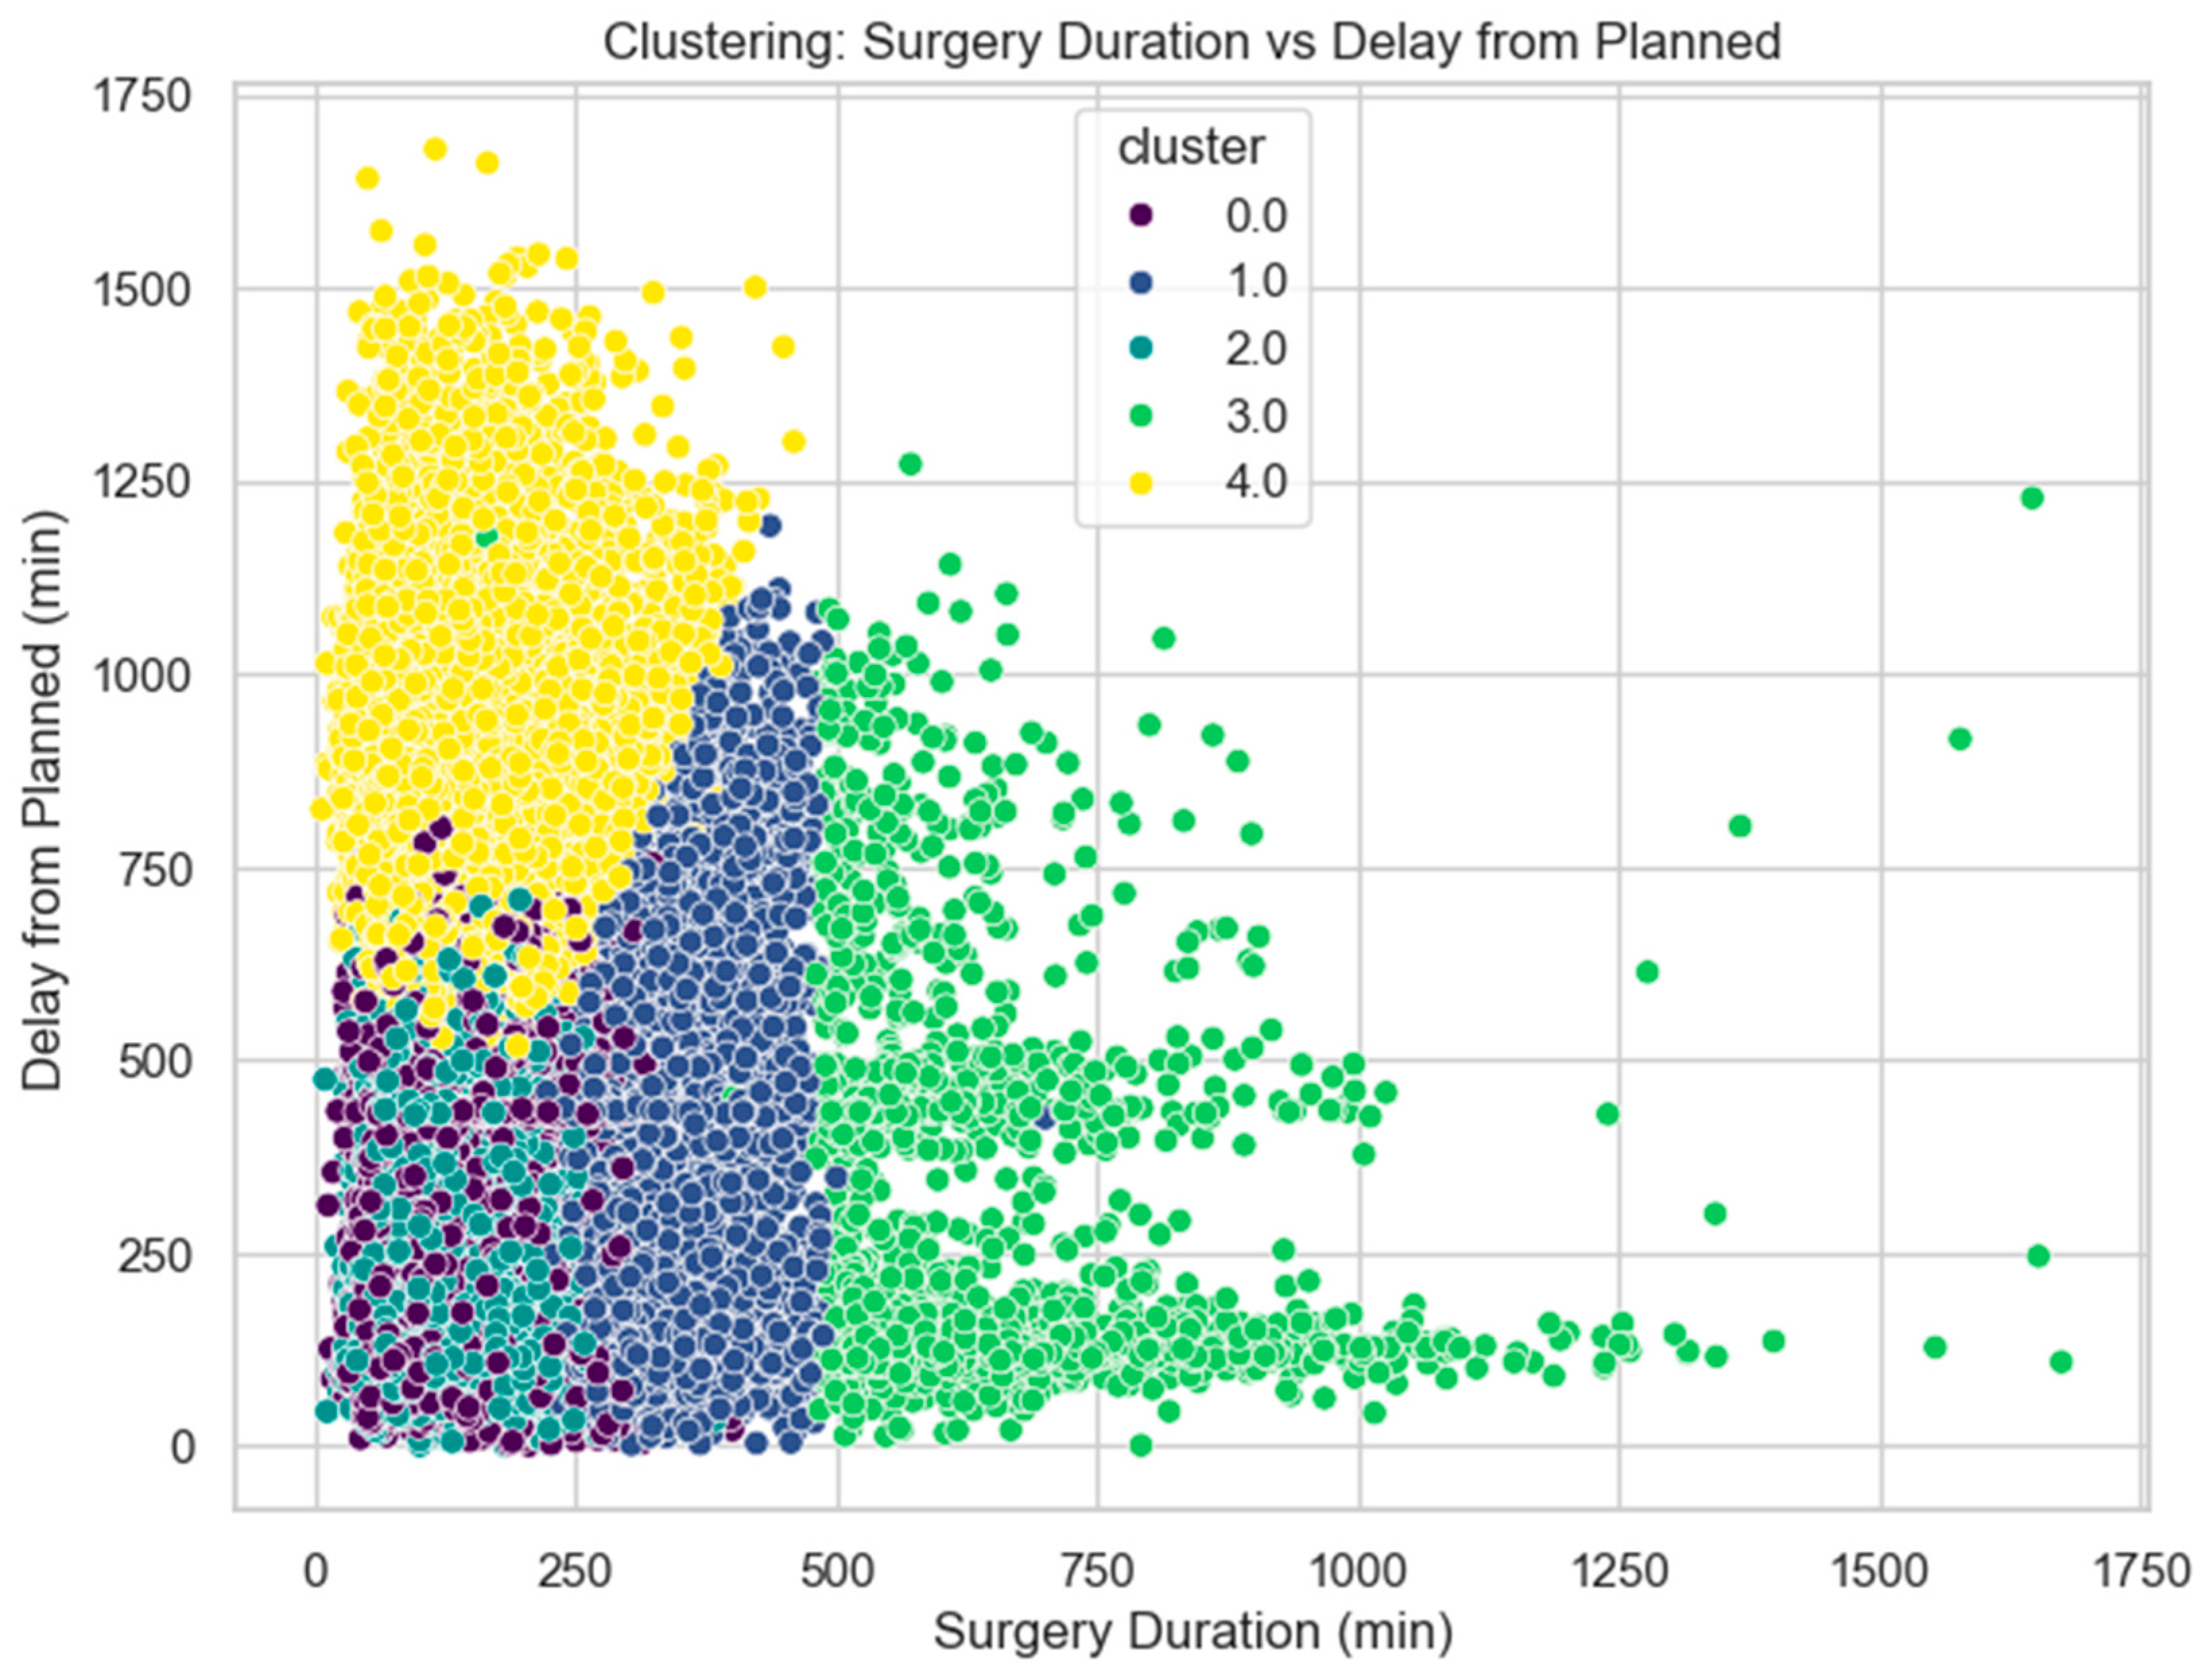
The resulting clusters are visualized in Figure 9, which plots surgery duration against procedural delays.
To assess the robustness of the clustering solution, we calculated multiple internal validity metrics for K = 2–10 clusters. The silhouette coefficient peaked at K = 2 (0.345) but remained relatively stable for K = 3–5 (0.320–0.327), declining thereafter. The Davies–Bouldin index reached its lowest value at K = 5 (0.955), indicating optimal intra-cluster compactness and inter-cluster separation. Similarly, the Calinski–Harabasz index was highest for K = 4 (28,268) and comparable for K = 5 (28,048), both substantially exceeding the values for higher K. These findings support the selection of K = 5, which balances interpretability with statistical coherence.
Each cluster appears to have distinct characteristics:
  • Cluster 0.0 (purple): Concentrated in the lower left corner with short surgery durations and relatively small delays.
  • Cluster 1.0 (blue): Also, in the lower left, but with slightly longer durations or delays than Cluster 0.
  • Cluster 2.0 (teal): Forms a band with moderate surgery durations and variable delays.
  • Cluster 3.0 (light green): Spreads across longer surgery durations with varying delays.
  • Cluster 4.0 (yellow): Concentrated in the upper left, showing short to moderate surgery durations but long delays.
This unsupervised approach enables operational stratification of patient groups, revealing process bottlenecks and potential inefficiencies in surgical scheduling.
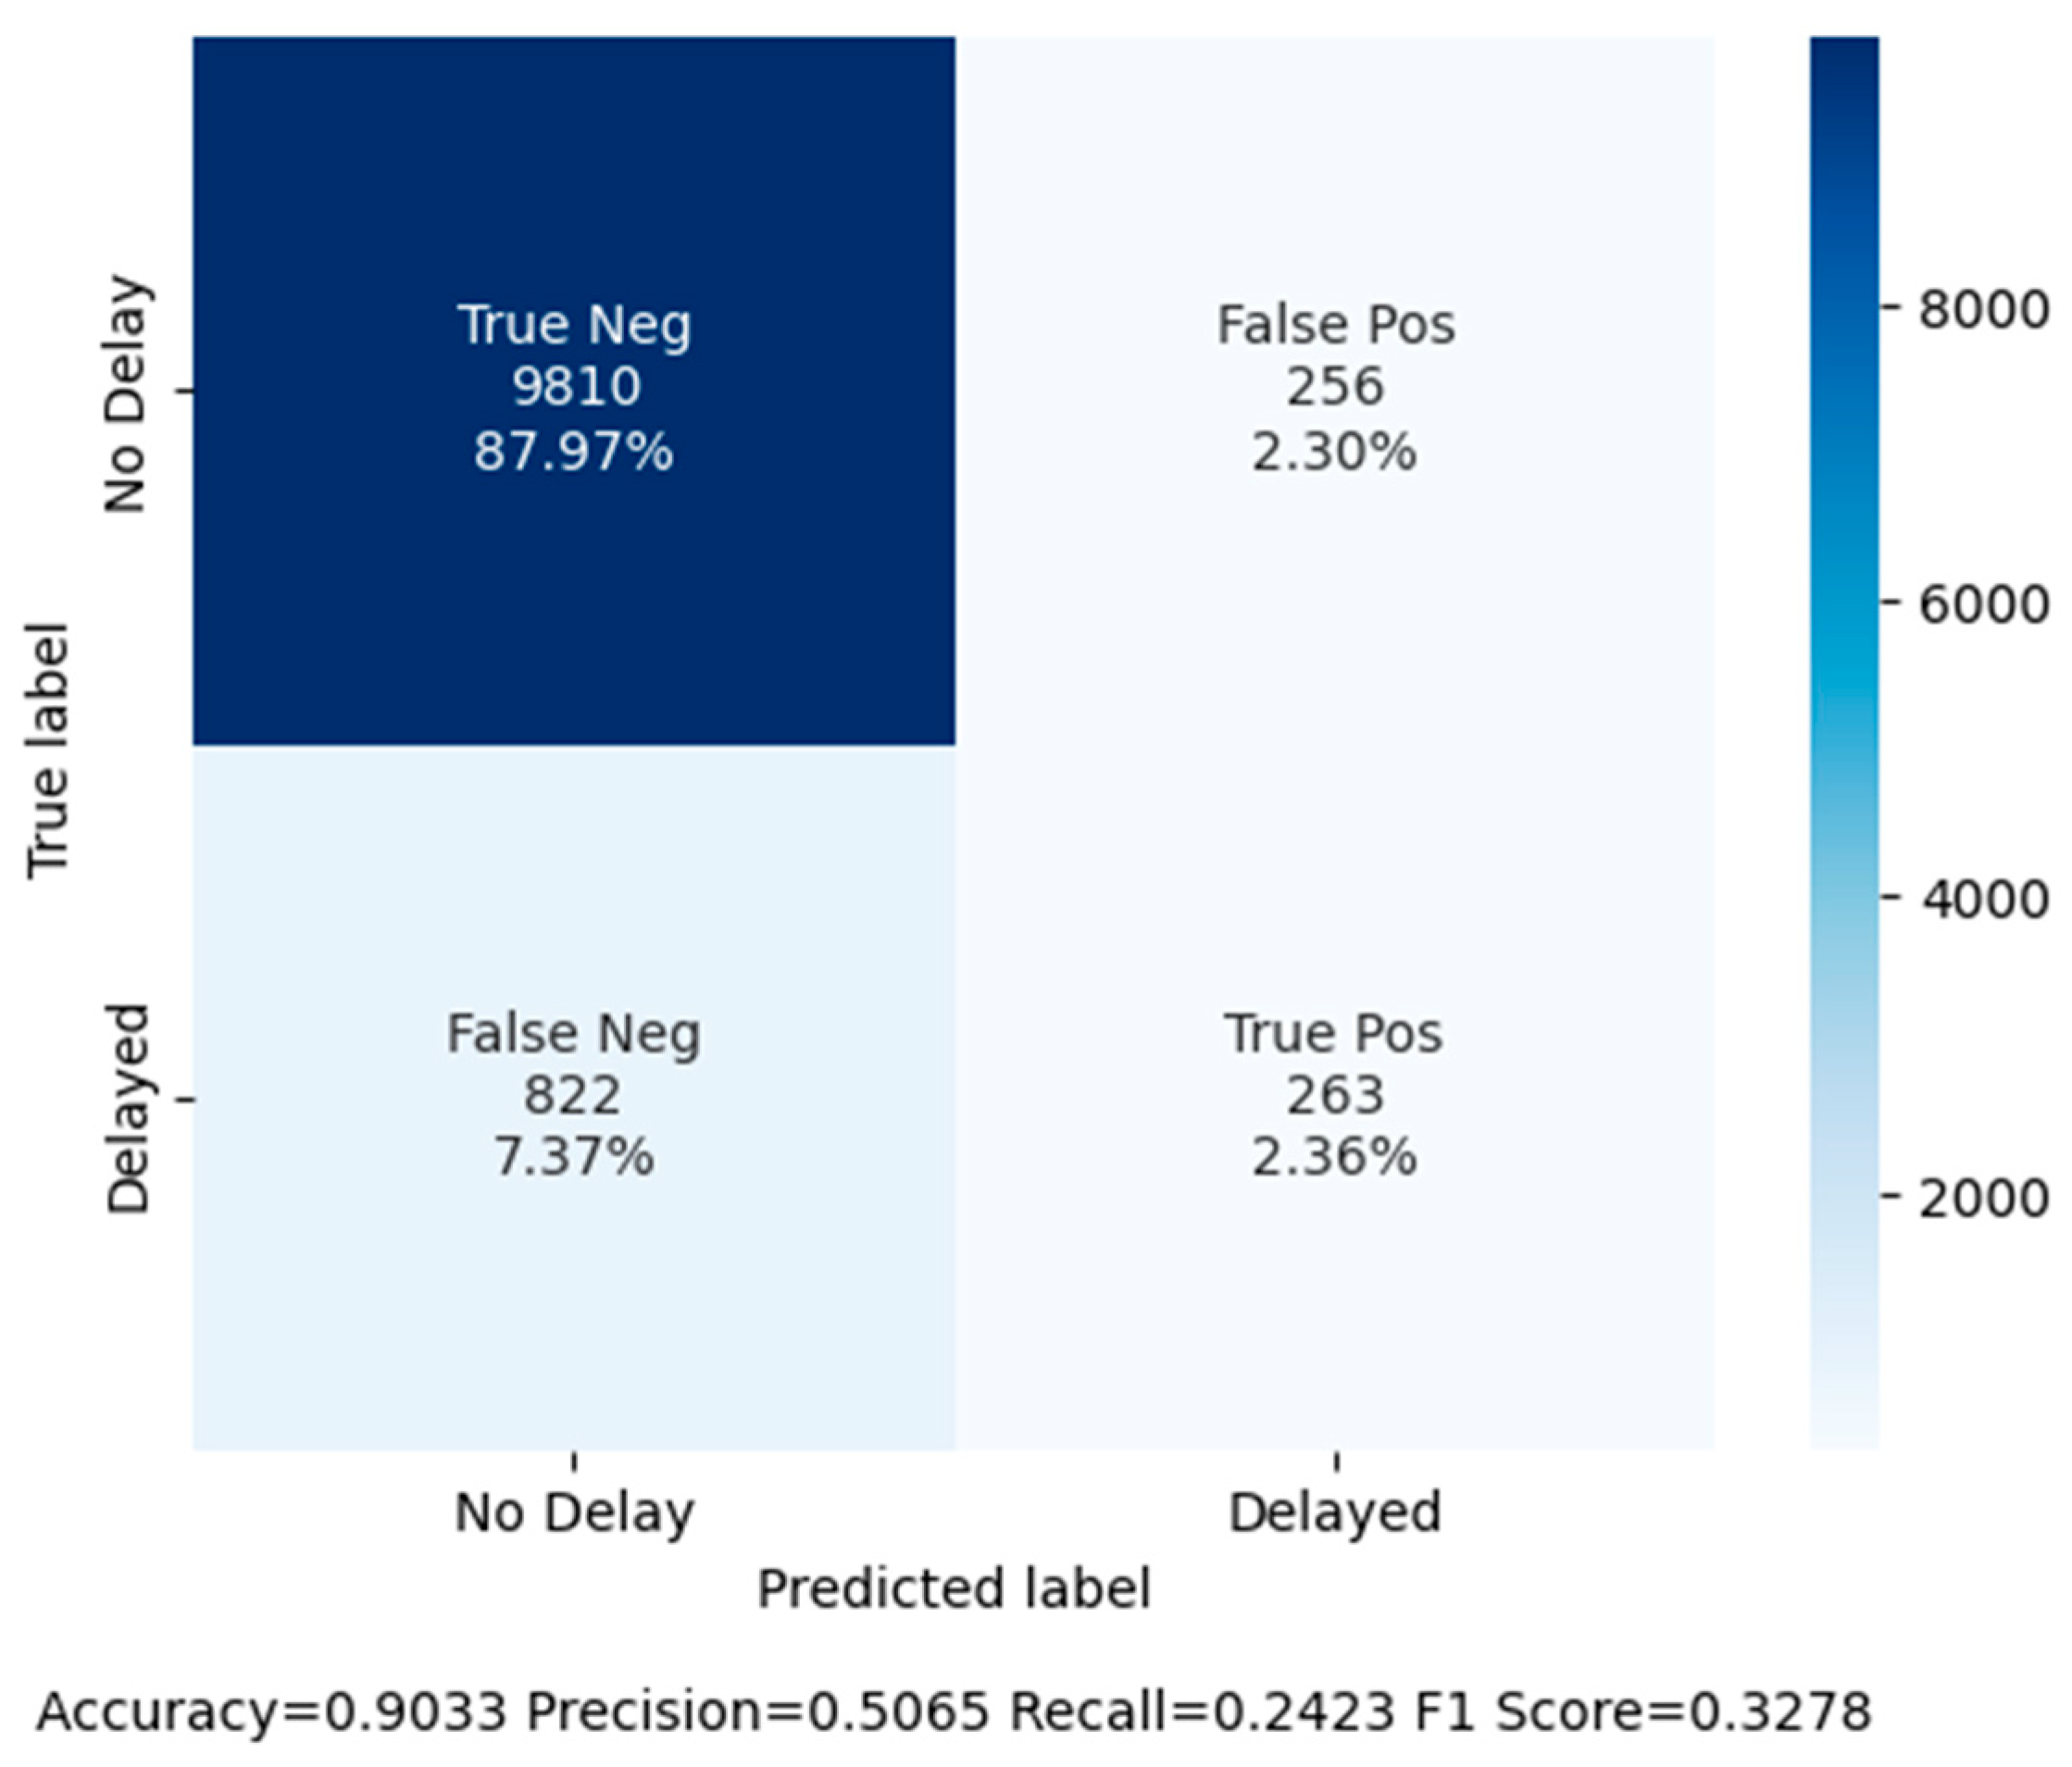
To further explore factors associated with delayed postoperative recovery, a supervised learning approach was employed. A Random Forest Classifier was trained on a feature-rich dataset, and the resulting performance is visualized in Figure 10. Unlike Figure 7 and Figure 8, which utilized the complete dataset, this model was specifically simulated using preliminary data, excluding post-discharge fields to emulate real-time prediction.
The binary target variable, Delayed_Recovery_Duration, was constructed using an interquartile range (IQR)-based statistical outlier definition. Delayed recovery was defined as a recovery duration > 1.5× IQR above the third quartile. The dataset was highly imbalanced, with delayed cases representing < 10% of the population.
Categorical features, such as age group, sex, ASA classification, ICU admission flag, surgery category, and anesthesia type, were transformed using one-hot encoding. Additionally, temporal process features—including delay from scheduled time, anesthesia induction lag, surgery duration, and anesthesia duration—were incorporated. All numerical features were standardized before model fitting.
The Random Forest algorithm was selected due to its robustness against overfitting and its capability to model complex, nonlinear relationships, making it particularly suited for healthcare applications involving heterogeneous patient data and process variation. To evaluate generalizability, the Random Forest model was trained and assessed using 5-fold cross-validation. This approach partitions the dataset into multiple training–test splits to reduce the risk of overfitting and provide a more robust estimate of performance compared to a single hold-out test set. Temporal validation was not feasible because the MOVER dataset randomizes dates to preserve privacy, thereby preventing construction of a chronological train–test split.
To investigate the impact of class imbalance on predictive performance, we compared the baseline Random Forest model with three imbalance mitigation strategies: random undersampling, SMOTE oversampling, and class-weight adjustments (Table 5). The baseline model achieved high overall accuracy (90.33%) but poor recall (24.23%) and modest F1-score (0.33), indicating limited sensitivity to rare but clinically significant events. The confusion matrix (Figure 8) illustrates this imbalance.
Among the tested approaches, undersampling significantly improved recall to 85.18% and increased the F1-score to 0.42, although this came at the cost of a reduction in accuracy (77.10%) and precision (27.87%). In contrast, SMOTE (Recall 26.59%, F1-score 0.34) and class-weighting (Recall 22.76%, F1-score 0.32) produced negligible improvements compared to baseline but retained class imbalance effects. These results underscore the difficulty of predicting rare outcomes from heterogeneous perioperative data.
These results demonstrate that class imbalance was a significant factor limiting recall in the baseline model, and that even simple resampling can significantly increase sensitivity to delayed recovery. However, the observed trade-off with accuracy highlights the need for more sophisticated methods to handle imbalance and optimize models in future work, thereby achieving balanced and clinically meaningful predictive performance.
While these values suggest moderate confidence when a delay is predicted, they also indicate that the model captures only a small subset of actual delayed cases, thus underscoring a standard limitation in predictive modeling on imbalanced clinical datasets. The high overall accuracy is primarily driven by the correct classification of the majority class (non-delayed recoveries) and should not be mistaken for balanced performance.
To explore feature contributions, the top 20 predictors influencing recovery duration classification are visualized in Figure 11.
The most influential predictors included deviation from planned surgery time, ASA classification, ICU admission flag, and surgery duration. These features align with clinical intuition: patients with severe preoperative status or prolonged intraoperative times are at elevated risk of delayed recovery. Key predictors include:
  • Deviation from planned surgery time, which was strongly associated with extended downstream delays.
  • ICU admission flag, where the absence of ICU admission correlated with shorter recovery, while ICU entry indicated increased clinical risk.
  • Surgery and anesthesia durations, which reflect procedure complexity and recovery burden.
  • Anesthesia induction lag, potentially capturing operational inefficiencies.
  • ASA rating and surgical category are both significant indicators of patient risk and surgical scope.
Among the predictors identified by the Random Forest model, Delay_From_Planned emerged as one of the strongest features associated with delayed recovery. Patients experiencing larger deviations between the scheduled surgery time and the actual time of OR entry were more likely to have a prolonged recovery. This relationship can be interpreted through two complementary mechanisms:
  • Operational bottlenecks—extended delays may indicate OR overcrowding or cascading schedule overruns, which create downstream strain on recovery units.
  • Patient complexity—delays may also be linked to high-risk patients requiring additional preoperative stabilization. Consistent with this interpretation, higher ASA categories were associated with both greater delays and longer recovery durations.
These findings suggest that delays are not merely technical anomalies but may serve as early indicators of elevated postoperative risk.
Despite these limitations, the current model provides meaningful clinical utility by identifying atypical recovery trajectories and highlighting procedural bottlenecks. It supports perioperative risk stratification and sheds light on workflow inefficiencies that may otherwise remain hidden in traditional EHR review pipelines.
More broadly, this study systematically applied a multi-stage framework combining process mining and machine learning to the MOVER surgical EHR dataset. Control-flow discovery revealed non-trivial deviations from standard surgical pathways, including temporally disordered activities and data-quality anomalies. Conformance evaluation via token-based replay achieved perfect fitness yet moderate precision—underscoring the challenge of capturing complex and sometimes inconsistent clinical behaviors. Temporal performance analysis revealed stratified trends in operative duration by ASA status and age cohort, while hourly patterns indicated both expected and anomalous peaks in operational throughput.
Unsupervised clustering surfaced latent patient segments with distinct perioperative time characteristics, facilitating a more targeted view of efficiency and risk. Finally, supervised learning using preliminary features yielded high predictive accuracy overall (90.44%), but lower recall for delayed recovery events, reinforcing the need for targeted optimization of imbalanced outcome prediction. Key predictors—such as anesthesia timing deviations, ICU admission indicators, and ASA classification—highlight the intertwined nature of clinical and operational determinants in recovery trajectories.
Taken together, these findings demonstrate the technical feasibility and translation potential of integrating process mining with predictive analytics in surgical informatics. The proposed approach offers actionable insights to support real-time process surveillance, adaptive scheduling, and postoperative risk mitigation in high-throughput hospital environments.

5. Discussion

The research questions established in Stage 0 have been effectively addressed in the subsequent stages, underscoring the critical role of the data extraction process carried out in Stage 1 [33]. Inconsistent data that deviated from the expected normal flow of processes was identified and corrected during Stage 1. This involved meticulous data cleansing, which included removing repetitive entries that could skew the analysis.
Although the dataset contains varied timestamp information that generally supports process mining, as detailed in the Methods, the anonymization of dates prevents cross-patient calendar analyses, and proxy measures were necessary for surgical timing. For instance, attempting to evaluate overall performance on a daily or weekly basis would lead to unreliable conclusions due to these shifts. As a result, the focus shifted to examining hourly patterns, which allowed for a more precise understanding of operational dynamics.
In Stages 2 and 3, we completed the process mining analysis, employing various methodologies to extract meaningful insights from the data. This included constructing process models that visually represented the flow of activities, identifying bottlenecks, and assessing overall process efficiency [59].
By the conclusion of Stage 4, the research questions were comprehensively answered as shown in Table 6. The findings revealed not only the operational patterns within the healthcare processes but also highlighted areas for potential improvement. The emphasis on hourly data analysis proved instrumental in overcoming the limitations posed by random shifts, ultimately leading to a more precise and actionable understanding of surgical workflows.
Overall, the meticulous data preparation and structured approach across the stages have ensured that conclusions are robust and reliable, paving the way for future research and process optimization initiatives.
Key observations include:
  • Statistical testing strengthens the clinical interpretation of our subgroup analyses. While Figure 7 and Figure 8 visually suggested increasing surgical and recovery durations with higher ASA classification and advanced age, the formal Kruskal–Wallis and Mann–Whitney U tests confirmed these associations to be statistically significant. In particular, the differences between higher-risk ASA patients (ASA 4–6) and lower-risk categories, as well as between older (≥60 years) and younger age groups, remained significant after Bonferroni correction for multiple testing. These results reinforce the validity of ASA and age as critical covariates influencing perioperative resource utilization.
  • Oncological and plastic reconstructive procedures showed a more complex, wider variance and greater variability in workflow patterns, indicating operational flexibility or inconsistency, while ophthalmological surgery cases followed more predictable sequences.
  • Surgery delays were more common in complex categories and among patients with ASA IV, hinting at resource allocation challenges.
  • Male patients exhibited marginally longer durations from hospital admission to surgery, potentially due to differing clinical pathways.
  • Female patients had slightly shorter median surgery durations and less delay from planned time, though not statistically significant.
  • The use of machine learning—particularly the Random Forest classifier—provides an interpretable and actionable tool for anticipating prolonged postoperative recovery.
While clustering was limited to four features, this design choice was intentional to highlight latent process-based patient subgroups. Richer covariates such as ASA class or ICU status were excluded to avoid outcome-driven clustering. Future work may explore hybrid clustering approaches that integrate temporal features with selected clinical risk factors to enhance subgroup characterization.
The combination of perfect fitness and moderate precision underscores a key trade-off in healthcare process mining. While the model may appear overgeneralized, this flexibility increases applicability in heterogeneous clinical environments where strict models could exclude valid but infrequent variants. Nevertheless, improving precision through domain-informed filtering or hybrid conformance approaches represents an important direction for future work to enhance clinical utility.
While this study did not provide a direct numerical benchmark against existing surgical workflow optimization models, this limitation stems from the lack of standardized, publicly available datasets in prior research. Most published studies rely on proprietary data sources, which limit their reproducibility and comparability. Instead, our analysis was deliberately aligned with methodologies established in earlier healthcare process mining research (e.g., process discovery, conformance checking, clustering). By applying these approaches to the open access MOVER dataset, we provide a transparent and reproducible baseline that can facilitate future benchmarking across studies. Establishing shared datasets and evaluation metrics remains an essential direction for advancing comparative research in surgical workflow optimization.
Although process discovery and conformance checking are computationally demanding, these steps are typically performed offline and updated periodically, rather than in real-time. In contrast, the predictive modeling component (e.g., Random Forest inference) is computationally lightweight and can be executed in milliseconds per case, supporting real-time clinical decision support. Furthermore, advances in incremental and streaming process mining offer promising avenues for reducing computational overhead by dynamically updating models without full recomputation. Taken together, these strategies suggest that while our current pipeline demonstrates feasibility, a hybrid deployment—periodic offline process mining coupled with real-time predictive inference—represents the most realistic pathway to clinical adoption.
In contrast to prior studies that often focus on broad hospital processes, this work provides a focused and reproducible evaluation of surgical workflows using a publicly accessible dataset. Clinical interpretation (pending collaboration) suggests workflow gaps that may be mitigated by improved scheduling, enhanced operating room throughput management, or optimized post-anesthesia care unit readiness. Using machine learning can enable earlier interventions, better resource planning (e.g., intensive care unit beds, postoperative care), and improved patient outcomes by flagging high-risk cases during or immediately after surgery.
While this study focused on retrospective analysis, the methodological framework has clear implications for real-time deployment in clinical environments. Process discovery and conformance checking are computationally demanding and are best suited for periodic offline updates to maintain updated models of surgical workflows. In contrast, predictive inference (e.g., Random Forest classification) is computationally lightweight, with predictions generated in milliseconds per case, making it feasible for integration into perioperative dashboards. The primary barriers to real-time implementation include EHR data streaming, interoperability across hospital systems, and clinician acceptance of automated alerts. A hybrid deployment model—offline process mining for model calibration combined with real-time anomaly detection and recovery risk flagging—represents the most practical pathway toward clinical adoption.

6. Conclusions

This study applied a structured process mining and machine learning framework to the open access MOVER dataset, focusing on operating room workflows. By systematically addressing data quality issues and reconstructing event logs, we demonstrated how process discovery, conformance checking, temporal analysis, clustering, and predictive modeling can generate clinically relevant insights. The process mining analysis conducted with a data-driven approach has the potential to yield invaluable insights, particularly for healthcare professionals who may lack engineering expertise [7,60,61]. Key findings include the identification of workflow deviations, ASA- and age-stratified differences in surgical duration, and the predictive value of factors such as surgical delays, ICU admission, and ASA classification for prolonged recovery. However, to effectively integrate process mining technologies into the healthcare domain, it is crucial to consider the unique characteristics and requirements of this field [28]. Importantly, this work illustrates the translational potential of combining process mining with predictive analytics in perioperative care. The methodological pipeline is reproducible, extensible, and suitable for adaptation in other hospital contexts, providing a transparent baseline for future benchmarking. Beyond retrospective analysis, the integration of these methods into real-time perioperative dashboards could support proactive scheduling, anomaly detection, and patient risk stratification.
Looking ahead, the refinement of predictive models for rare outcomes, validation across multi-institutional datasets, and the incorporation of surgical domain expertise will be essential to strengthen clinical applicability. By bridging methodological rigor with operational relevance, this study underscores the value of open datasets like MOVER in advancing reproducible, data-driven improvements in surgical workflow management.

7. Limitations and Future Work

This study has several limitations that should be considered when interpreting the findings:
  • Dataset constraints: The MOVER dataset applies date anonymization at the patient level, preserving intra-patient temporal order but preventing calendar-level or cross-patient time-series analyses. Surgical incision and closure timestamps were inconsistently recorded, requiring the use of anesthesia or operating room timestamps as proxies for surgical duration.
  • Generalisability: Findings are based on a single institutional dataset, which may limit external validity. Replication across multi-institutional and international datasets is needed.
  • Outcome imbalance: Rare outcomes (e.g., ICU admission, prolonged recovery) were underrepresented, which may affect predictive model performance despite balancing strategies.
  • Interpretability: Machine learning models, such as Random Forests, provide strong predictive accuracy but limited interpretability compared to clinical guidelines, underscoring the importance of domain expert validation.
Future research directions emerging from this study include:
  • Multi-institutional validation: Extending the framework to other hospitals and healthcare systems to test robustness and generalizability.
  • Enhanced predictive modeling: Developing tailored approaches for rare outcomes and exploring explainable AI techniques to improve clinical interpretability.
  • Integration into clinical workflows: Investigating how offline process mining models can be combined with lightweight, real-time predictive tools in perioperative dashboards.
  • Collaborative evaluation: Incorporating surgical domain experts more directly into the iterative design of models to ensure clinical relevance and adoption.

Supplementary Materials

The following supporting information can be downloaded at: https://www.mdpi.com/article/10.3390/app152011014/s1. Full-detail versions of Figure S1. Heuristic Miner Algorithm Graph (Green ellipse denotes for start and orange ellipse denotes for Finish. Rectangles have color variations according to their values) and Figure S2. Directly Follows Graph. (Circles denote start and end activities. Full-detail version is provided in the Supplementary Materials) are now provided in the Supplementary Materials.

Author Contributions

Conceptualization, U.C. and A.K.; methodology, U.C.; software, U.C., A.K. and I.S.; validation, U.C., A.K. and I.S.; investigation, U.C., A.K. and I.S.; writing—original draft preparation, U.C., A.K. and I.S.; writing—review and editing, U.C., A.K. and I.S.; visualization, U.C., A.K. and I.S. All authors have read and agreed to the published version of the manuscript.

Funding

This study is partially financed by the European Union-NextGenerationEU, through the National Recovery and Resilience Plan of the Republic of Bulgaria, project № BG-RRP-2.013-0001.

Institutional Review Board Statement

Not applicable.

Informed Consent Statement

Not applicable.

Data Availability Statement

The data used in this study were obtained from the University of California, Irvine (UCI) Medical Center in Orange County, California/USA publication at the address https://mover.ics.uci.edu/index.html (accessed on 3 Augst 2025) by signing the UCI-OR Data UCI Agreement.

Acknowledgments

The codes that are developed for this study have been published on the GitHub page https://github.com/ufukcelikblog/mover, accessed on 3 Augst 2025.

Conflicts of Interest

The authors declare that they have no conflicts of interest.

References

  1. Everson, J.; Rubin, J.C.; Friedman, C.P. Reconsidering Hospital EHR Adoption at the Dawn of HITECH: Implications of the Reported 9% Adoption of a “Basic” EHR. J. Am. Med. Inform. Assoc. 2020, 27, 1198–1205. [Google Scholar] [CrossRef]
  2. Samad, M.; Angel, M.; Rinehart, J.; Kanomata, Y.; Baldi, P.; Cannesson, M. Medical Informatics Operating Room Vitals and Events Repository (MOVER): A Public-Access Operating Room Database. JAMIA Open 2023, 6, ooad084. [Google Scholar] [CrossRef]
  3. Mans, R.S.; van der Aalst, W.M.P.; Vanwersch, R.J.B.; Moleman, A.J. Process Mining in Healthcare: Data Challenges When Answering Frequently Posed Questions. In Proceedings of the Process Support and Knowledge Representation in Health Care, Tallinn, Estonia, 3 September 2012; Riaño, D., Lenz, R., Miksch, S., Peleg, M., Reichert, M., ten Teije, A., Eds.; Springer International Publishing: Tallinn, Estonia, 2012; Volume 7738, pp. 140–153. [Google Scholar]
  4. Homayounfar, P. Process Mining Challenges in Hospital Information Systems. In Proceedings of the 2012 Federated Conference on Computer Science and Information Systems (FedCSIS), Wrocław, Poland, 9–12 September 2012; pp. 1135–1140. [Google Scholar]
  5. Mans, R.S.; van der Aalst, W.M.P.; Vanwersch, R.J.B. Process Mining in Healthcare: Evaluating and Exploiting Operational Processes; vom Brocke, J., Ed.; SpringerBriefs in Business Process Management; Springer International Publishing: Cham, Switzerland, 2015; ISBN 978-3-319-16070-2. [Google Scholar]
  6. Striani, F.; Colucci, C.; Corallo, A.; Paiano, R.; Pascarelli, C. Process Mining in Healthcare: A Systematic Literature Review and A Case Study. Adv. Sci. Technol. Eng. Syst. J. 2022, 7, 151–160. [Google Scholar] [CrossRef]
  7. Munoz-Gama, J.; Martin, N.; Fernandez-Llatas, C.; Johnson, O.A.; Sepúlveda, M.; Helm, E.; Galvez-Yanjari, V.; Rojas, E.; Martinez-Millana, A.; Aloini, D.; et al. Process Mining for Healthcare: Characteristics and Challenges. J. Biomed. Inform. 2022, 127, 103994. [Google Scholar] [CrossRef]
  8. Mans, R.S.; Schonenberg, M.H.; Song, M.; Van Der Aalst, W.M.P.; Bakker, P.J. Application of Process Mining in Healthcare—A Case Study in a Dutch Hospital. In Proceedings of the International Joint Conference on Biomedical Engineering Systems and Technologies, Funchal, Madeira, Portugal, 28–31 January 2008; pp. 425–438. [Google Scholar]
  9. Gupta, S. Workflow and Process Mining in Healthcare. Master’s Thesis, Eindhoven University of Technology, Eindhoven, The Netherlands, 2007. [Google Scholar]
  10. van der Aalst, W. Process Mining; Springer: Berlin/Heidelberg, Germany, 2016; ISBN 978-3-662-49850-7. [Google Scholar]
  11. Gurgen Erdogan, T.; Tarhan, A. A Goal-Driven Evaluation Method Based on Process Mining for Healthcare Processes. Appl. Sci. 2018, 8, 894. [Google Scholar] [CrossRef]
  12. Wilkins-Caruana, A.; Bandara, M.; Musial, K.; Catchpoole, D.; Kennedy, P.J. Inferring Actual Treatment Pathways from Patient Records. J. Biomed. Inform. 2023, 148, 104554. [Google Scholar] [CrossRef] [PubMed]
  13. Benevento, E.; Aloini, D.; van der Aalst, W.M.P. How Can Interactive Process Discovery Address Data Quality Issues in Real Business Settings? Evidence from a Case Study in Healthcare. J. Biomed. Inform. 2022, 130, 104083. [Google Scholar] [CrossRef] [PubMed]
  14. Rojas, E.; Munoz-Gama, J.; Sepúlveda, M.; Capurro, D. Process Mining in Healthcare: A Literature Review. J. Biomed. Inform. 2016, 61, 224–236. [Google Scholar] [CrossRef] [PubMed]
  15. Kurniati, A.P.; Hall, G.; Hogg, D.; Johnson, O. Process Mining in Oncology Using the MIMIC-III Dataset. J. Phys. Conf. Ser. 2018, 971, 012008. [Google Scholar] [CrossRef]
  16. Chen, Q.; Lu, Y.; Tam, C.; Poon, S. Process Mining to Discover and Preserve Infrequent Relations in Event Logs: An Application to Understand the Laboratory Test Ordering Process Using the MIMIC-III Dataset. In Proceedings of the ACIS 2021 Proceedings, Sydney, Australia, 6–10 December 2021. [Google Scholar]
  17. Mans, R.S.; Schonenberg, M.H.; Song, M.; van der Aalst, W.M.P. Process Mining in Healthcare—A Case Study. In Proceedings of the First International Conference on Health Informatics, Funchal, Madeira, Portugal, 28–31 January 2008; SciTePress—Science and Technology Publications: Funchal, Portugal, 2008; pp. 118–125. [Google Scholar]
  18. Yang, S.; Sarcevic, A.; Farneth, R.A.; Chen, S.; Ahmed, O.Z.; Marsic, I.; Burd, R.S. An Approach to Automatic Process Deviation Detection in a Time-Critical Clinical Process. J. Biomed. Inform. 2018, 85, 155–167. [Google Scholar] [CrossRef]
  19. Andrews, R.; Goel, K.; Corry, P.; Burdett, R.; Wynn, M.T.; Callow, D. Process Data Analytics for Hospital Case-Mix Planning. J. Biomed. Inform. 2022, 129, 104056. [Google Scholar] [CrossRef]
  20. Alvarez, C.; Rojas, E.; Arias, M.; Munoz-Gama, J.; Sepúlveda, M.; Herskovic, V.; Capurro, D. Discovering Role Interaction Models in the Emergency Room Using Process Mining. J. Biomed. Inform. 2018, 78, 60–77. [Google Scholar] [CrossRef]
  21. Back, C.O.; Manataki, A.; Harrison, E. Mining Patient Flow Patterns in a Surgical Ward. In Proceedings of the HEALTHINF 2020—13th International Conference on Health Informatics, Proceedings; Part of 13th International Joint Conference on Biomedical Engineering Systems and Technologies, BIOSTEC 2020, Valletta, Malta, 24–26 February 2020; SciTePress: Valletta, Malta, 2020; pp. 273–283. [Google Scholar]
  22. Back, C.O.; Manataki, A.; Papanastasiou, A.; Harrison, E. Stochastic Workflow Modeling in a Surgical Ward: Towards Simulating and Predicting Patient Flow. In Communications in Computer and Information Science; Springer: Cham, Switzerland, 2021; Volume 1400, pp. 565–591. [Google Scholar] [CrossRef]
  23. Berti, A.; van Zelst, S.; Schuster, D. PM4Py: A Process Mining Library for Python. Softw. Impacts 2023, 17, 100556. [Google Scholar] [CrossRef]
  24. Padoy, N. Machine and Deep Learning for Workflow Recognition during Surgery. Minim. Invasive Ther. Allied Technol. 2019, 28, 82–90. [Google Scholar] [CrossRef] [PubMed]
  25. Khuri, S.F.; Henderson, W.G.; DePalma, R.G.; Mosca, C.; Healey, N.A.; Kumbhani, D.J. Determinants of Long-Term Survival after Major Surgery and the Adverse Effect of Postoperative Complications. Ann. Surg. 2005, 242, 326–343. [Google Scholar] [CrossRef]
  26. Oliver, C.M.; Wagstaff, D.; Bedford, J.; Moonesinghe, S.R. Systematic Development and Validation of a Predictive Model for Major Postoperative Complications in the Peri-Operative Quality Improvement Project (PQIP) Dataset. Anaesthesia 2024, 79, 389–398. [Google Scholar] [CrossRef] [PubMed]
  27. Lakshmanan, G.T.; Rozsnyai, S.; Wang, F. Investigating Clinical Care Pathways Correlated with Outcomes. In Lecture Notes in Computer Science (Including Subseries Lecture Notes in Artificial Intelligence and Lecture Notes in Bioinformatics); Springer: Berlin/Heidelberg, Germany, 2013; Volume 8094, pp. 323–338. [Google Scholar] [CrossRef]
  28. Mans, R.S.R.; van der Aalst, W.; Vanwersch, R.J.B.R. Process Mining in Healthcare: Opportunities Beyond the Ordinary; BPMcenter.org: Eindhoven, The Netherlands, 2013. [Google Scholar]
  29. Futoma, J.; Morris, J.; Lucas, J. A Comparison of Models for Predicting Early Hospital Readmissions. J. Biomed. Inform. 2015, 56, 229–238. [Google Scholar] [CrossRef] [PubMed]
  30. Blum, T.; Padoy, N.; Feußner, H.; Navab, N. Workflow Mining for Visualization and Analysis of Surgeries. Int. J. Comput. Assist. Radiol. Surg. 2008, 3, 379–386. [Google Scholar] [CrossRef]
  31. van der Aalst, W. Process Mining, 2nd ed.; Springer: Berlin/Heidelberg, Germany, 2018; ISBN 978-3-662-57041-8. [Google Scholar]
  32. Dahlin, S.; Eriksson, H.; Raharjo, H. Process Mining for Quality Improvement: Propositions for Practice and Research. Qual. Manag. Health Care 2019, 28, 8–14. [Google Scholar] [CrossRef]
  33. Andrews, R.; Wynn, M.; Vallmuur, K.; ter Hofstede, A.; Bosley, E.; Elcock, M.; Rashford, S. Leveraging Data Quality to Better Prepare for Process Mining: An Approach Illustrated Through Analysing Road Trauma Pre-Hospital Retrieval and Transport Processes in Queensland. Int. J. Environ. Res. Public Health 2019, 16, 1138. [Google Scholar] [CrossRef]
  34. van der Aalst, W.; Adriansyah, A.; de Medeiros, A.K.A.; Arcieri, F.; Baier, T.; Blickle, T.; Bose, J.C.; van den Brand, P.; Brandtjen, R.; Buijs, J.; et al. Process Mining Manifesto. In Business Process Management Workshops: BPM 2011 International Workshops, Clermont-Ferrand, France, 29 August 2011; Revised Selected Papers, Part I.; Daniel, F., Barkaoui, K., Dustdar, S., Eds.; Springer: Berlin/Heidelberg, Germany, 2012; pp. 169–194. [Google Scholar]
  35. Dasari, D.; Varma, P.S. Employing Various Data Cleaning Techniques to Achieve Better Data Quality Using Python. In Proceedings of the 2022 6th International Conference on Electronics, Communication and Aerospace Technology, Coimbatore, India, 1–3 December 2022; pp. 1379–1383. [Google Scholar]
  36. Oladipupo, M.A.; Obuzor, P.C.; Bamgbade, B.J.; Adeniyi, A.E.; Olagunju, K.M.; Ajagbe, S.A. An Automated Python Script for Data Cleaning and Labeling Using Machine Learning Technique. Informatica 2023, 47, 219–232. [Google Scholar] [CrossRef]
  37. Goyle, K.; Xie, Q.; Goyle, V. DataAssist: A Machine Learning Approach to Data Cleaning and Preparation. In Intelligent Systems and Applications; Arai, K., Ed.; Springer Nature: Cham, Switzerland, 2024; pp. 476–486. [Google Scholar]
  38. Gholinejad, M.; Loeve, A.J.; Dankelman, J. Surgical Process Modelling Strategies: Which Method to Choose for Determining Workflow? Minim. Invasive Ther. Allied Technol. 2019, 28, 91–104. [Google Scholar] [CrossRef] [PubMed]
  39. Berti, A.; Van Zelst, S.J.; Van Der Aalst, W.M.P.; Gesellschaf, F. Process Mining for Python (PM4py): Bridging the Gap between Process- and Data Science. In Proceedings of the CEUR Workshop Proceedings, Aachen, Germany, 24–26 June 2019; Volume 2374, pp. 13–16. [Google Scholar]
  40. Helm, E.; Paster, F. First Steps Towards Process Mining in Distributed Health Information Systems. Int. J. Electron. Telecommun. 2015, 61, 137–142. [Google Scholar] [CrossRef]
  41. Bernard, G.; Andritsos, P. Accurate and Transparent Path Prediction Using Process Mining. In Proceedings of the European Conference on Advances in Databases and Information Systems, Bled, Slovenia, 8–11 September 2019; pp. 235–250. [Google Scholar]
  42. Fernandez-Llatas, C.; Benedi, J.M.; Gama, J.M.; Sepulveda, M.; Rojas, E.; Vera, S.; Traver, V. Interactive Process Mining in Surgery with Real Time Location Systems: Interactive Trace Correction. In Interactive Process Mining in Healthcare; Fernandez-Llatas, C., Ed.; Health Informatics; Springer: Cham, Switzerland, 2021; pp. 181–202. ISBN 978-3-030-53992-4. [Google Scholar]
  43. Alharbi, A.; Bulpitt, A.; Johnson, O. Improving Pattern Detection in Healthcare Process Mining Using an Interval-Based Event Selection Method. In Lecture Notes in Business Information Processing; Springer: Cham, Switzerland, 2017; Volume 297, pp. 88–105. [Google Scholar]
  44. Rabbi, F.; Banik, D.; Hossain, N.U.I.; Sokolov, A. Using Process Mining Algorithms for Process Improvement in Healthcare. Healthc. Anal. 2024, 5, 100305. [Google Scholar] [CrossRef]
  45. van der Aalst, W.; Weijters, T.; Maruster, L. Workflow Mining: Discovering Process Models from Event Logs. IEEE Trans. Knowl. Data Eng. 2004, 16, 1128–1142. [Google Scholar] [CrossRef]
  46. van der Aalst, W.M.P.; van Dongen, B.F.; Herbst, J.; Maruster, L.; Schimm, G.; Weijters, A.J.M.M. Workflow Mining: A Survey of Issues and Approaches. Data Knowl. Eng. 2003, 47, 237–267. [Google Scholar] [CrossRef]
  47. Petri, C.; Reisig, W. Petri Net. Scholarpedia 2008, 3, 6477. [Google Scholar] [CrossRef]
  48. Perimal-Lewis, L.; de Vries, D.; Thompson, C.H. Health Intelligence: Discovering the Process Model Using Process Mining by Constructing Start-to-End Patient Journeys. In Proceedings of the 7th Australasian Workshop on Health Informatics and Knowledge Management (HIKM), Auckland, New Zealand, 20–23 January 2014; pp. 59–67. [Google Scholar]
  49. Berti, A.; Van Der Aalst, W. Reviving Token-Based Replay: Increasing Speed While Improving Diagnostics. In Proceedings of the International Workshop on Algorithms & Theories for the Analysis of Event Data 2019, Aachen, Germany, 25 June 2019; Volume 2371, pp. 87–103. Available online: https://ceur-ws.org/Vol-2371 (accessed on 3 August 2025).
  50. Norouzifar, A.; Rafiei, M.; Dees, M.; van der Aalst, W. Process Variant Analysis Across Continuous Features: A Novel Framework. In Enterprise, Business-Process and Information Systems Modeling; van der Aa, H., Bork, D., Schmidt, R., Sturm, A., Eds.; Springer Nature: Cham, Switzerland, 2024; pp. 129–142. [Google Scholar]
  51. Burattin, A. Process Mining Techniques in Business Environments; van der Aalst, W., Mylopoulos, J., Rosemann, M., Shaw, M.J., Szyperski, C., Eds.; Lecture Notes in Business Information Processing; Springer International Publishing: Cham, Switzerland, 2015; Volume 207, ISBN 978-3-319-17481-5. [Google Scholar]
  52. Dakic, D.; Stefanovic, D.; Cosic, I.; Lolic, T.; Medojevic, M. Business Process Mining Application: A Literature Review. In Proceedings of the 29th International DAAAM Symposium ‘Intelligent Manufacturing & Automation’, Zadar, Croatia, 24–27 October 2018; Katalinic, B., Ed.; DAAAM International: Vienna, Austria, 2018; pp. 0866–0875. [Google Scholar]
  53. van der Aalst, W.M.P.; La Rosa, M.; Santoro, F.M. Business Process Management: Don’t Forget to Improve the Process! Bus. Inf. Syst. Eng. 2016, 58, 1–6. [Google Scholar] [CrossRef]
  54. van der Aalst, W.M.P. Process Mining, 1st ed.; Springer: Berlin/Heidelberg, Germany, 2011; ISBN 978-3-642-19345-3. [Google Scholar]
  55. Esiefarienrhe, B.M.; Omolewa, I.D. Application of Process Mining to Medical Billing Using L* Life Cycle Model. In Proceedings of the 2021 International Conference on Electrical, Computer and Energy Technologies (ICECET), Cape Town, South Africa, 9–10 December 2021; IEEE: Cape Town, South Africa, 2021; pp. 1–6. [Google Scholar]
  56. Rebuge, Á.; Ferreira, D.R. Business Process Analysis in Healthcare Environments: A Methodology Based on Process Mining. Inf. Syst. 2012, 37, 99–116. [Google Scholar] [CrossRef]
  57. De Weerdt, J.; Schupp, A.; Vanderloock, A.; Baesens, B. Process Mining for the Multi-Faceted Analysis of Business Processes—A Case Study in a Financial Services Organization. Comput. Ind. 2013, 64, 57–67. [Google Scholar] [CrossRef]
  58. Mayhew, D.; Mendonca, V.; Murthy, B.V.S. A Review of ASA Physical Status—Historical Perspectives and Modern Developments. Anaesthesia 2019, 74, 373–379. [Google Scholar] [CrossRef] [PubMed]
  59. Shafei, I.; Karnon, J.; Crotty, M. Process Mining and Customer Journey Mapping in Healthcare: Enhancing Patient-Centred Care in Stroke Rehabilitation. Digit. Health 2024, 10, 20552076241249264. [Google Scholar] [CrossRef] [PubMed]
  60. Schuh, G.; Gützlaff, A.; Cremer, S.; Schopen, M. Understanding Process Mining for Data-Driven Optimization of Order Processing. Procedia Manuf. 2020, 45, 417–422. [Google Scholar] [CrossRef]
  61. van der Aalst, W.; Zhao, J.L.; Wang, H.J. Editorial: “Business Process Intelligence: Connecting Data and Processes”. ACM Trans. Manag. Inf. Syst. 2015, 5, 1–7. [Google Scholar] [CrossRef]
Figure 1. Heuristic Miner Algorithm Graph (Green ellipse denotes for start and orange ellipse denotes for Finish. Rectangles have color variations according to their values).
Applsci 15 11014 g001
Figure 2. Directly Follows Graph. (Circles denote start and end activities. Full-detail version is provided in the Supplementary Materials).
Applsci 15 11014 g002
Figure 3. Petri Net. (Circles with dotes denote the start and end activities. Empty circles represent places and black rectangles show transitions. Full-detail version is provided in the Supplementary Materials).
Applsci 15 11014 g003
Figure 4. Trace Explorer of Variants with Frequencies.
Applsci 15 11014 g004
Figure 5. Distribution of Events Over the Hours.
Applsci 15 11014 g005
Figure 6. Distribution of Surgeries in the Operating Room by Hour.
Applsci 15 11014 g006
Figure 7. Box plots of surgery duration across ASA categories. (Circles show outliers).
Applsci 15 11014 g007
Figure 8. Box plots of surgery duration across age groups. (Circles show outliers).
Applsci 15 11014 g008
Figure 9. K-means clustering of surgery duration vs. delay from planned (K = 5).
Applsci 15 11014 g009
Figure 10. Confusion Matrix for Delayed Recovery Duration Outliers using Random Forest Classifier without undersampling, SMOTE, and class weights.
Applsci 15 11014 g010
Figure 11. The top 20 essential features.
Applsci 15 11014 g011
Table 1. Comparative Contributions of Literature and This Study.
Refs.Contribution to the Literature
[1]Highlights foundational challenges in digitizing hospital workflows due to low EHR adoption.
[2]Introduces the open access MOVER dataset, enabling reproducible process mining in surgical workflows.
[3,5]Provide foundational frameworks for healthcare process mining, including the L* lifecycle model and reference models.
[4]Discusses challenges of applying process mining in real hospital settings.
[6]Presents a systematic review, categorizing healthcare process mining methods.
[7]Offers an extensive review of process mining characteristics and challenges in healthcare.
[10,14,17]Apply discovery and conformance checking on clinical event logs.
[11]Introduces the GQFI method for goal-driven evaluation of surgical workflows.
[13,18]Analyze performance deviations and bottlenecks in clinical processes to identify areas for improvement and optimization, thereby enhancing overall efficiency and effectiveness.
[15,16]Utilize the MIMIC-III dataset for an open and reproducible process mining approach.
[19,20]Apply process mining for resource allocation and emergency care modeling.
[21,22]Utilize process mining and simulation to model patient flow in the surgical ward.
[23]Presents PM4Py, a scalable and customizable Python library for process mining.
[24]Applies machine learning and deep learning for workflow recognition during surgery.
[25]Identifies determinants of long-term survival after major surgery and adverse effects of complications.
[26]Develops and validates predictive models for major postoperative complications (PQIP dataset).
[27,28]Investigate clinical care pathways correlated with outcomes using process analysis.
[29]Compares predictive models for early hospital re-admissions.
[30]Introduces workflow mining methods for visualization and analysis of surgical procedures.
This StudyIntroduces a complete, question-driven framework applied to the MOVER dataset, combining process discovery, conformance checking, temporal analysis, clustering, and predictive modeling. The study not only identifies surgical variants, outliers, and bottlenecks but also demonstrates how process mining and machine learning can jointly support efficiency improvements and perioperative risk prediction.
Table 2. Surgery Information After Algorithm Run.
MRNHOSP_ADMSN_TIMEHOSP_DISCH_TIMESURGERY_DATESURGERY_TYPESRG_PLN_TIMESRG_CNL_TIMEIN_OR_DTTMAN_START_DATETIMEOUT_OR_DTTMAN_STOP_DATETIME
0b1b3c15740e98de15.08.2021 14:5029.08.2021 17:0224.08.2021 00:00Surgery Performed24.08.2021 00:00 24.08.2021 15:1324.08.2021 15:1324.08.2021 17:1024.08.2021 17:15
0b1b3c15740e98de10.01.2022 04:5810.01.2022 07:2510.01.2022 00:00Surgery Canceled10.01.2022 04:5910.01.2022 07:24
0b1b3c15740e98de27.01.2022 05:2531.01.2022 13:1027.01.2022 00:00Surgery Performed27.01.2022 05:26 27.01.2022 07:3227.01.2022 07:3327.01.2022 14:4527.01.2022 14:55
0000e45237d1fc9612.02.2021 07:2313.02.2021 17:0512.02.2021 00:00Surgery Canceled12.02.2021 07:2412.02.2021 23:59
0b30d71ac00f133915.06.2022 04:4615.06.2022 09:2930.05.2022 00:00Surgery Date Passed30.05.2022 00:0030.05.2022 23:59
0b30d71ac00f133915.06.2022 04:4615.06.2022 09:2915.06.2022 00:00Surgery Performed15.06.2022 04:47 15.06.2022 07:0615.06.2022 07:0615.06.2022 08:3415.06.2022 08:35
Table 3. Event Logs of Patient Information.
Case_IdActivityTimestamp
0b1b3c15740e98deHospital Admission15.08.2021 14:50
0b1b3c15740e98deSurgery Planned24.08.2021 00:00
0b1b3c15740e98deOperating Room Enter24.08.2021 15:13
0b1b3c15740e98deAnesthesia Start24.08.2021 15:13
0b1b3c15740e98deOperating Room Exit24.08.2021 17:10
0b1b3c15740e98deAnesthesia Stop24.08.2021 17:15
0b1b3c15740e98deHospital Discharge29.08.2021 17:02
0b1b3c15740e98deHospital Admission10.01.2022 04:58
0b1b3c15740e98deSurgery Planned10.01.2022 04:59
0b1b3c15740e98deSurgery Canceled10.01.2022 07:24
0b1b3c15740e98deHospital Discharge10.01.2022 07:25
Table 4. Clinically Relevant Workflow Deviations.
Anomaly (Transition)Elective-likeEmergency-likeTotal% Emergency
Anesthesia Start before Admission14580%
Anesthesia Start before Discharge39165529%
Anesthesia Start before Planning788869%
Anesthesia Stop before OR Entry347283757%
Discharge before Anesthesia Start1010%
Discharge before Anesthesia Stop27154236%
Discharge before OR Entry8080%
Discharge before OR Exit67117814%
OR Entry before Discharge311323%
OR Entry before Planning2432711%
Table 5. Class Imbalance in Predictive Modeling.
ModelAccuracyPrecisionRecallF1-Score
Random Forest (Baseline)90.3350.6624.230.33
Random Forest + Undersampling77.1027.8785.180.42
Random Forest + SMOTE90.0047.5526.590.34
Random Forest + Class Weights90.3851.3022.760.32
Table 6. Research Questions Mapping.
QuestionsAnswerClinical Insight
Q1Peak hours 7 AM–3 PM (Figure 3 and Figure 4)Schedules can be adjusted for efficiency
Q2Deviations include anesthesia before registrationData quality or urgent cases
Q3Top 3 variants = 87.5%; rare paths flaggedOutlier paths can be audited
Q4Surgery durations are longer in ASA III+ (Figure 5)High-risk patients need extended slots
Q572 cases entered OR post-dischargeWorkflow or data entry errors
Q6Delays (defined as deviation between scheduled surgery time and actual OR entry) correlated with prolonged recovery. This association may reflect both operational bottlenecks (e.g., OR overcrowding) and patient complexity (e.g., ASA III–IV).Consequently, delays may serve as early warning indicators to trigger ICU preparation for high-risk patients.
Disclaimer/Publisher’s Note: The statements, opinions and data contained in all publications are solely those of the individual author(s) and contributor(s) and not of MDPI and/or the editor(s). MDPI and/or the editor(s) disclaim responsibility for any injury to people or property resulting from any ideas, methods, instructions or products referred to in the content.