Article

Estimation of Tunnel Pressure Arch Zone Based on Energy Density Difference of Surrounding Rock

1
Department of Civil Engineering, Zhejiang Ocean University, Zhoushan 316022, China
2
Zhejiang Ocean University-Jurong Petroleum and Natural Gas University-Enterprise Joint Laboratory, Zhoushan 316022, China
*
Author to whom correspondence should be addressed.
Appl. Sci. 2025, 15(20), 10990; https://doi.org/10.3390/app152010990
Submission received: 26 August 2025 / Revised: 29 September 2025 / Accepted: 30 September 2025 / Published: 13 October 2025

Abstract

The pressure arch effect limits the influence range of excavation on the surrounding rock, reduces the geological pressure on underground structures, and serves as an important indicator for evaluating the stability of underground engineering. By accounting for the energy transfer process in surrounding rock during the tunnel-induced pressure arch formation, this paper proposes a novel approach for determining the range of the pressure arch around tunnels—the energy density difference (EDD) method. Numerical analysis is conducted to evaluate the effects of tunnel span, internal friction angle, and lateral pressure coefficient on post-excavation energy density fields and pressure arch zones in tunnels. Comparative studies with three existing approaches confirm the EDD method’s efficacy in identifying the arch zones of tunnel-surrounding rock. Critically, the proposed approach addresses the controversy regarding the determination of the deviation degree of principal stress vectors and provides a physically meaningful interpretation of the formation and evolution mechanisms of pressure arches.

1. Introduction

After tunnel excavation, the overlying strata undergo deformation, loosening, and even caving processes. However, these processes terminate within a relatively stable zone above the tunnel, known as the ground arching effect [1,2,3,4]. Terzaghi [5] first demonstrated the existence of the pressure arch effect in sandy soil through the “trapdoor experiment”. Subsequently, the pressure arch effect in surrounding rock post-excavation has been extensively studied using numerical [6,7,8] and experimental [9,10,11] approaches. Arching effect-based ground improvement and reinforcement approaches have also been developed across various geological formations in underground engineering [12,13,14]. A pressure arch confines the excavation influence zone in rock masses, alleviates the geological pressure on structures, and significantly reduces the risk of rock mass deformation and damage [15,16,17]. With the continuous development of large underground spaces, such as long mountain tunnels, large-scale hydropower station caverns, and underground mining stopes, in-depth research on the pressure arch theory of surrounding rock is crucial for the rational design and safe construction of underground projects.
At present, research on the surrounding rock pressure arch primarily focuses on its formation mechanism, boundary definition, and evolutionary behavior [6,18,19,20,21,22,23]. Among these aspects, the characterization of the geometry and dimensions of pressure arch zones is essential for the assessment and control of tunnel stability. Therefore, numerous criteria have been proposed for accurately determining pressure arch boundaries. From a theoretical perspective, Fu et al. [24] proposed a method for predicting the boundaries of the pressure arch based on complex variable theory, classical elastoplastic theory, and the Mohr–Coulomb (M–C) yield criterion, in which the zone of increased tangential stress in the surrounding rock was selected as the range of pressure arch. Kong et al. [25] utilized Terzaghi’s soil stress arch approach and introduced a “thrust line” to examine the boundary shapes of pressure arches. This method identifies the inner and outer boundaries as trajectories of principal stresses, determined by the inflection points of principal stress–depth curves along the central cavern line. From the perspective of stress field visualization, the scope of the pressure arch above the tunnel roof is intuitively recognized as an arched stress concentration zone formed due to the deflection of the maximum principal stress. Therefore, Zheng et al. [26] proposed defining the horizontal stress inflection point and the point of deflection in the direction of maximum compressive stress as the base points for the inner and outer boundaries of the vault’s pressure arch, respectively. The corresponding boundary lines were then delineated along the vector flow lines of the maximum compressive stress emanating from these base points. Yang et al. [27] defined the inner boundary of the pressure arch as a curve connecting the peak points of maximum principal stress in the surrounding rock, whereas the outer boundary was defined by points exhibiting a stress change of 10%. As the pressure arch zone can also be characterized by horizontal and vertical stresses in place of principal stresses, Huang et al. [28] demarcated the arch zone as lying beneath the region of reverse principal stress, where the stress components are solely vertical and horizontal. Furthermore, Chen et al. [29] scrutinized the inflection points on the vertical stress–depth profile above the tunnel roof as indicators of ground arching progression. Further studies related to the determination of pressure arches are available in Refs. [30,31,32].
Based on the characteristics of stress transfer during the formation of pressure arches, some scholars have defined the arching ratio to delimit the pressure arch zone and proposed additional zoning curves to describe the stress transfer characteristics. Through centrifugal modeling tests and numerical simulations, Lee et al. [33] found that the non-yielding components within the arching zone receive load transfer from elements within the plastic zone. They defined the region between the outer boundary of the plastic zone and the boundary where elements exhibit an arching ratio exceeding 1% as the arching zone and further delineated the boundaries of the positive and negative arching zones. In a study by Kong et al. [34], a two-dimensional finite element numerical approach was utilized to identify three characteristic lines in the arching region based on horizontal and vertical stress distributions. These lines include the outer boundary of the pressure arch, which aligns with the boundary of the stress perturbation field; the inner boundary, defined by the line connecting the inflection points of the σ x –depth curves; and the center of mass line, which links the inflection points of the σ z –depth curves. Wang et al. [35] contended that the in situ stress zone is located outside the outer boundary of the pressure arch, while the lower pressure zone and tension stress zone lie within the inner boundary. They have also defined a stress concentration index, k, to further divide the pressure arch into the nucleus zone and the outer zone of the nucleus.
In previous research, both the definition of the pressure arch and the methods for determining its boundaries have relied on the magnitude and direction of surrounding rock stress; however, most studies have not incorporated rock deformation in their analyses. Considering the formation mechanism of pressure arches, which is a self-adjusting process of surrounding rock under uneven deformation, relying solely on indicators derived from the redistribution of surrounding rock stress after tunnel excavation may not fully reflect the essence of pressure arch formation. Although the pressure arch is deduced from the perspective of the stress field, stress is often insufficiently intuitive for assessing the macroscopic rock status, and it is even more difficult to quantitatively express its relationship with the pressure arch zone. Therefore, this paper proposes a method for determining the range of pressure arches based on the energy density of the surrounding rock. On one hand, since the energy density of surrounding rock is a scalar that does not account for stress direction, the new approach can eliminate some controversial issues regarding the degree of principal stress vector deflection in certain pressure arch determination methods. On the other hand, as rock strain energy is a holistic physical measure that combines principal stress, elastic modulus, Poisson’s ratio, and other properties of the rock mass, the proposed approach can provide a more thorough explanation of the formation and progression of the pressure arch phenomena.

2. Boundary Delineation Criterion and Numerical Modeling of Pressure Arch Based on Energy Density Theory

2.1. Relationship Between Surrounding Rock Energy Density and Pressure Arch

After tunnel excavation, the surrounding rock experiences uneven deformation [36], triggering stress redistribution and subsequent pressure arch formation. This geomechanical process involves complex stress–strain behavior [37,38,39] with inherent thermodynamic uncertainty. Due to this uncertainty, using stress alone as a criterion for determining pressure arch boundaries is often insufficient. From a thermodynamic perspective, energy transfer fundamentally governs physical processes in deformable materials, and the formation of a pressure arch in surrounding rock is ultimately a stabilization–destabilization–restabilization process driven by energy redistribution. Consequently, systematic analysis of energy transfer and conversion during tunnel excavation, particularly the relationship between energy changes across pressure arch boundaries, enables more accurate characterization of its formation and evolutionary mechanisms.
Following the creation of an opening in rock mass, the surrounding rock undergoes radial stress release and converges unevenly toward the excavation, leading to increased magnitude and directional deflection of tangential stresses. Analysis of maximum principal stress vector streamlines reveals an arched distribution pattern of the maximum principal stresses within a specific range of the surrounding rock. From an energy perspective, the properties of this arched zone closely correspond to the excavation-induced energy changes. Before excavation, the rock mass stores elastic strain energy under triaxial compression in a stable equilibrium state. After excavation, the energy storage threshold decreases in localized zones due to reduced radial confinement pressure. Once accumulated energy exceeds the storage threshold, plastic damage occurs, releasing part of the energy and transferring the remainder to deeper rock layers. This energy adjustment and redistribution process drives the formation of pressure arches. The plastically damaged rock mass is generally excluded from the pressure arch zone due to its low residual stress and inability to self-stabilize [15,40]. In addition, the rock mass farther from the opening remains largely undisturbed by excavation and exhibits minimal change in energy density. Considering these established characteristics, this paper proposes the energy density difference (EDD) method, which utilizes the EDD of the surrounding rock before and after tunnel excavation as a criterion for defining the pressure arch zone. Specifically, the rock unit adjacent to the tunnel with zero EDD is defined as the inner boundary of the pressure arch, while the unit farther from the tunnel with a relatively small EDD (e.g., a 10% energy density change) is designated as the outer boundary.

2.2. Numerical Implementation of the EDD Method for Tunnel-Surrounding Rock Mass

Under triaxial stress conditions, the strain energy stored in the rock mass before tunnel excavation equals the work done by external forces. This energy depends exclusively on the final magnitudes of the applied forces and resulting deformations. Assuming linear elasticity, each principal stress is directly proportional to its corresponding principal strain; thus the strain energy density v ε of the rock mass can be expressed as
v ε = σ 1 2 + σ 2 2 + σ 3 2 2 μ σ 1 σ 2 + σ 1 σ 3 + σ 2 σ 3 / 2 E
where σ 1 , σ 2 and σ 3 are the principal stresses of the rock mass, μ denotes the Poisson’s ratio and E represents the modulus of elasticity.
After tunnel excavation, the original triaxial stress state of the surrounding rock is disturbed, leading to a redistribution of the energy previously stored in the rock mass. The strain energy density stored in the surrounding rock consists of two components: the volume change energy density v v , associated with volume changes, and the distortion (or shape change) energy density v d , associated with changes in element shape. The expressions of v y and v d can be described by
v v = [ ( 1 2 μ ) / 6 E ] σ 1 + σ 2 + σ 3 2
v d = [ ( 1 + μ ) / 6 E ] σ 1 σ 2 2 + σ 2 σ 3 2 + σ 3 σ 1 2
  Yielding occurs when the distortion energy density exceeds its critical threshold. Adopting the M–C yield criterion as the plastic failure criterion, the principal stress is expressed as
( σ 1 σ 3 ) / 2 sin ϕ ( σ 1 + σ 3 ) / 2 c cos ϕ = 0
where ϕ and c denote the friction angle and cohesion of the rock, respectively. The critical distortion energy density at the onset of yielding in the surrounding rock can be obtained by substituting Equation (4) into Equation (3).
Incorporating the energy density theory of the rock body and yield damage conditions, a computational program for analyzing the energy field of surrounding rock during tunnel excavation was developed based on the three-dimensional finite difference software FLAC3D [41]. A boundary identification approach for the tunnel’s surrounding rock pressure arch is also proposed based on the energy density theory. First, a three-dimensional tunnel model is constructed using pre-processing software (e.g., Rhino [42]), and a realistic rock mass model is generated by adjusting polyhedral elements within the mesh. This numerical model is then imported into FLAC3D, where the energy equation is integrated through the graphical user interface. Conditional statements are used to identify elastic and plastic zones in the surrounding rock during excavation and to compute the corresponding energy density. The program iterates until the surrounding rock reaches a stable state. The post-excavation strain energy density is saved in the Extra data field of each grid cell and exported via an interface file to Tecplot for visualization of the density distribution. By computing the EDD before and after excavation, contour plots of the EDD distribution in the surrounding rock are obtained. A pseudocode summarizing the procedure of the proposed pressure arch identification approach can be found in Algorithm 1.
Algorithm 1 Pseudocode for the EDD approach to determine pressure arch zone
  • Demarcate the examined surrounding rock zone and create 3D tunnel model
  • Define properties of surrounding rock
  • Apply boundary conditions and loadings
  • Embed energy density formula and M-C yield criterion
  • Define terminal condition (e.g., tolerable unbalanced force) and maximum iteration number T
  • Set generation t = 0
  • while terminal condition not met and  t T  do
  •     if Plastic failure in surrounding rock then
  •         Calculate energy density for plastic rock
  •     else
  •         Calculate energy density for elastic rock
  •     end if
  •      t = t + 1
  • end while
  • Store energy density distribution data
  • Compute EDD before and after the excavation
  • Define discrimination indices for pressure arch zone (inner and outer)
  • Import data to Tecplot and return pressure arch zone for target tunnel
Note: Tolerable unbalanced force and T are set to 1 × 10 5 N and 6000, respectively, as a demonstration.
In this study, the contour line where the EDD equals 0 is defined as the inner boundary of the pressure arch, while the contour for EDD equal to 10% of the original rock energy density is defined as the outer boundary. These criteria are derived from extensive numerical trials and comparisons with previously reported methods. While the proposed approach provides a practical basis for identifying pressure arch zones, it remains an empirical simplification whose universality requires further validation. In addition, the FLAC3D platform is subject to inherent assumptions and numerical constraints, which may restrict the broader applicability of the method to other computational frameworks or more complex geological conditions. However, the integration of the proposed criterion with FLAC3D is considered adequate for investigating the energy characteristics of pressure arch development and for conducting related parametric evaluations.

2.3. Numerical Simulation Scheme

To assess the effectiveness of the proposed EDD method and further investigate the formation and evolution mechanisms of pressure arches in tunnel-surrounding rock, numerical experiments are performed based on the geological conditions of a tunnel in Changchun, China [43], where the strata are relatively uniform and free from major adverse geological structures such as faults. The surrounding rock is primarily siltstone, exhibiting relatively low strength and moderate integrity. Based on the geological stratum conditions of the tunnel and the spatial effects during the construction process, the final computational model adopts rock mass dimensions of 100 m × 5 m × 100 m as the investigation range, as shown in Figure 1. The model, developed through theoretical estimations and model test results, contains a total of 24,000 elements. The strata are represented using solid elements and follow the Mohr–Coulomb yield criterion. Given the simplicity of the geological setting, the rock mass is idealized as a homogeneous material with unit weight γ = 26 kN/m3, elastic modulus E = 5.0 GPa, Poisson’s ratio μ = 0.25, and cohesion c = 0.85 MPa. These key geomechanical parameters are the same as those reported in Ref. [43], which were based on laboratory test results, and the sensitivity analysis of these parameters is also presented in that study. The removal of the blocks corresponding to the tunnel chamber achieves the post-excavation conditions. In terms of the boundary conditions, the model is constrained against horizontal displacement on both sides and is fixed at the bottom.
The initial distribution of ground stress in the computation area is considered to be uniform, with two principal stress components acting along the x-axis and y-axis directions. These initial stresses increase linearly with burial depth, and the horizontal stress is directly related to the vertical stress, with a lateral pressure coefficient λ representing the ratio between them. The depth of overlying rock, from the surface to the tunnel roof, is 150 m. A uniformly distributed load, σ z , equivalent to the weight of a 105 m thick rock layer, is applied to the model’s top surface. Due to horizontal symmetry in both the rock mass model and the tunnel geometry, the energy density in the surrounding rock must be symmetrically distributed along both sides of the tunnel’s vertical symmetry axis. To examine the energy density distribution in the roof rock layer, 10 monitoring lines are established within the tunnel section. The first line aligns with the x-axis through the section center, with nine additional lines radially spaced at 10° angular intervals. The tunnel excavation model and monitoring paths are illustrated in Figure 1.
Based on numerical experiments, parametric studies are conducted to evaluate the effects of different geometry and geomechanical parameters, i.e., tunnel span D, internal friction angle ϕ , and lateral pressure coefficient λ , on the energy density field of the surrounding rock and the pressure arch zone after tunnel excavation. The considered parameter series are summarized in Table 1. In series A, the impact of tunnel span D is assessed using values of 10 m, 12 m, 14 m, 16 m, 18 m, and 20 m. The other two parameters are kept constant, i.e., ϕ equals 30° and λ equals 0.5. Series B evaluates the influence of the rock mass’s internal friction angle ϕ across 20°, 25°, 30°, 35°, 40°, and 45°, with D fixed at 10 m and ϕ at 0.5. Series C primarily explores the effect of the lateral pressure coefficient λ for 0.5, 0.8, 1.0, 1.5, 2, and 2.5, while keeping D equal to 10 m and ϕ equal to 30°.

3. Assessment of Energy Density Field and Pressure Arch Zone in the Surrounding Rock of Circular Tunnels

3.1. Effect of Tunnel Span

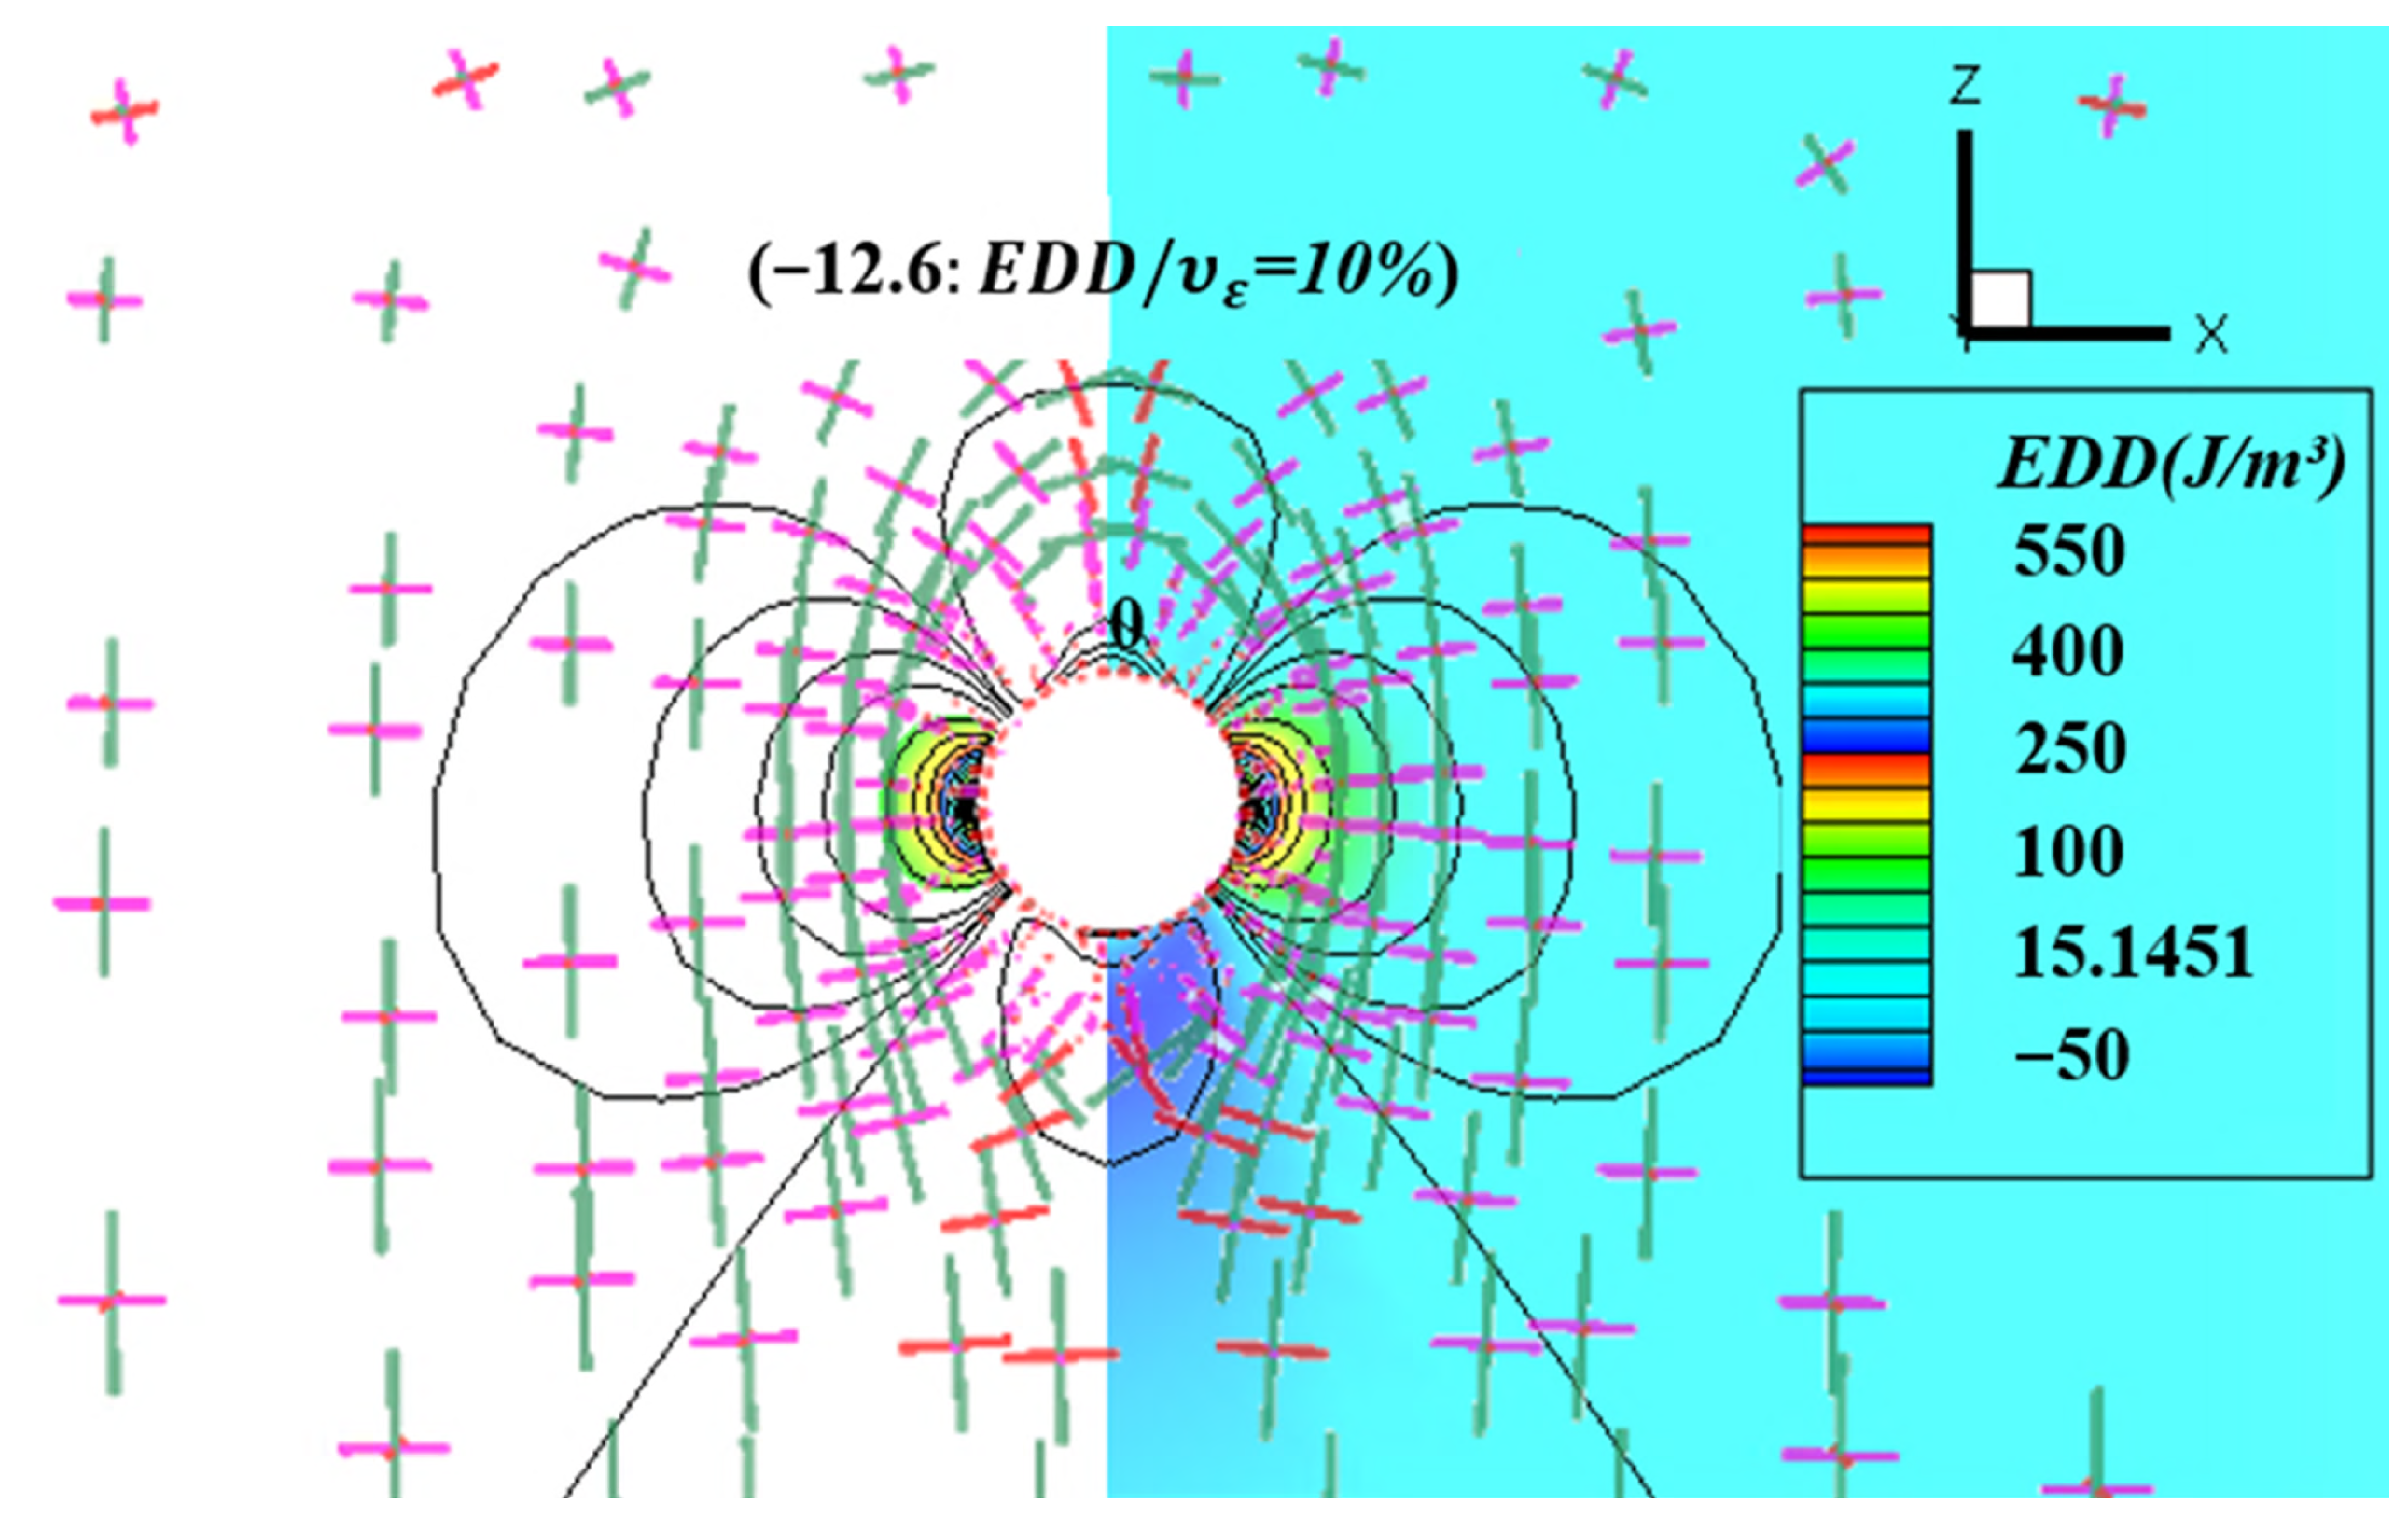
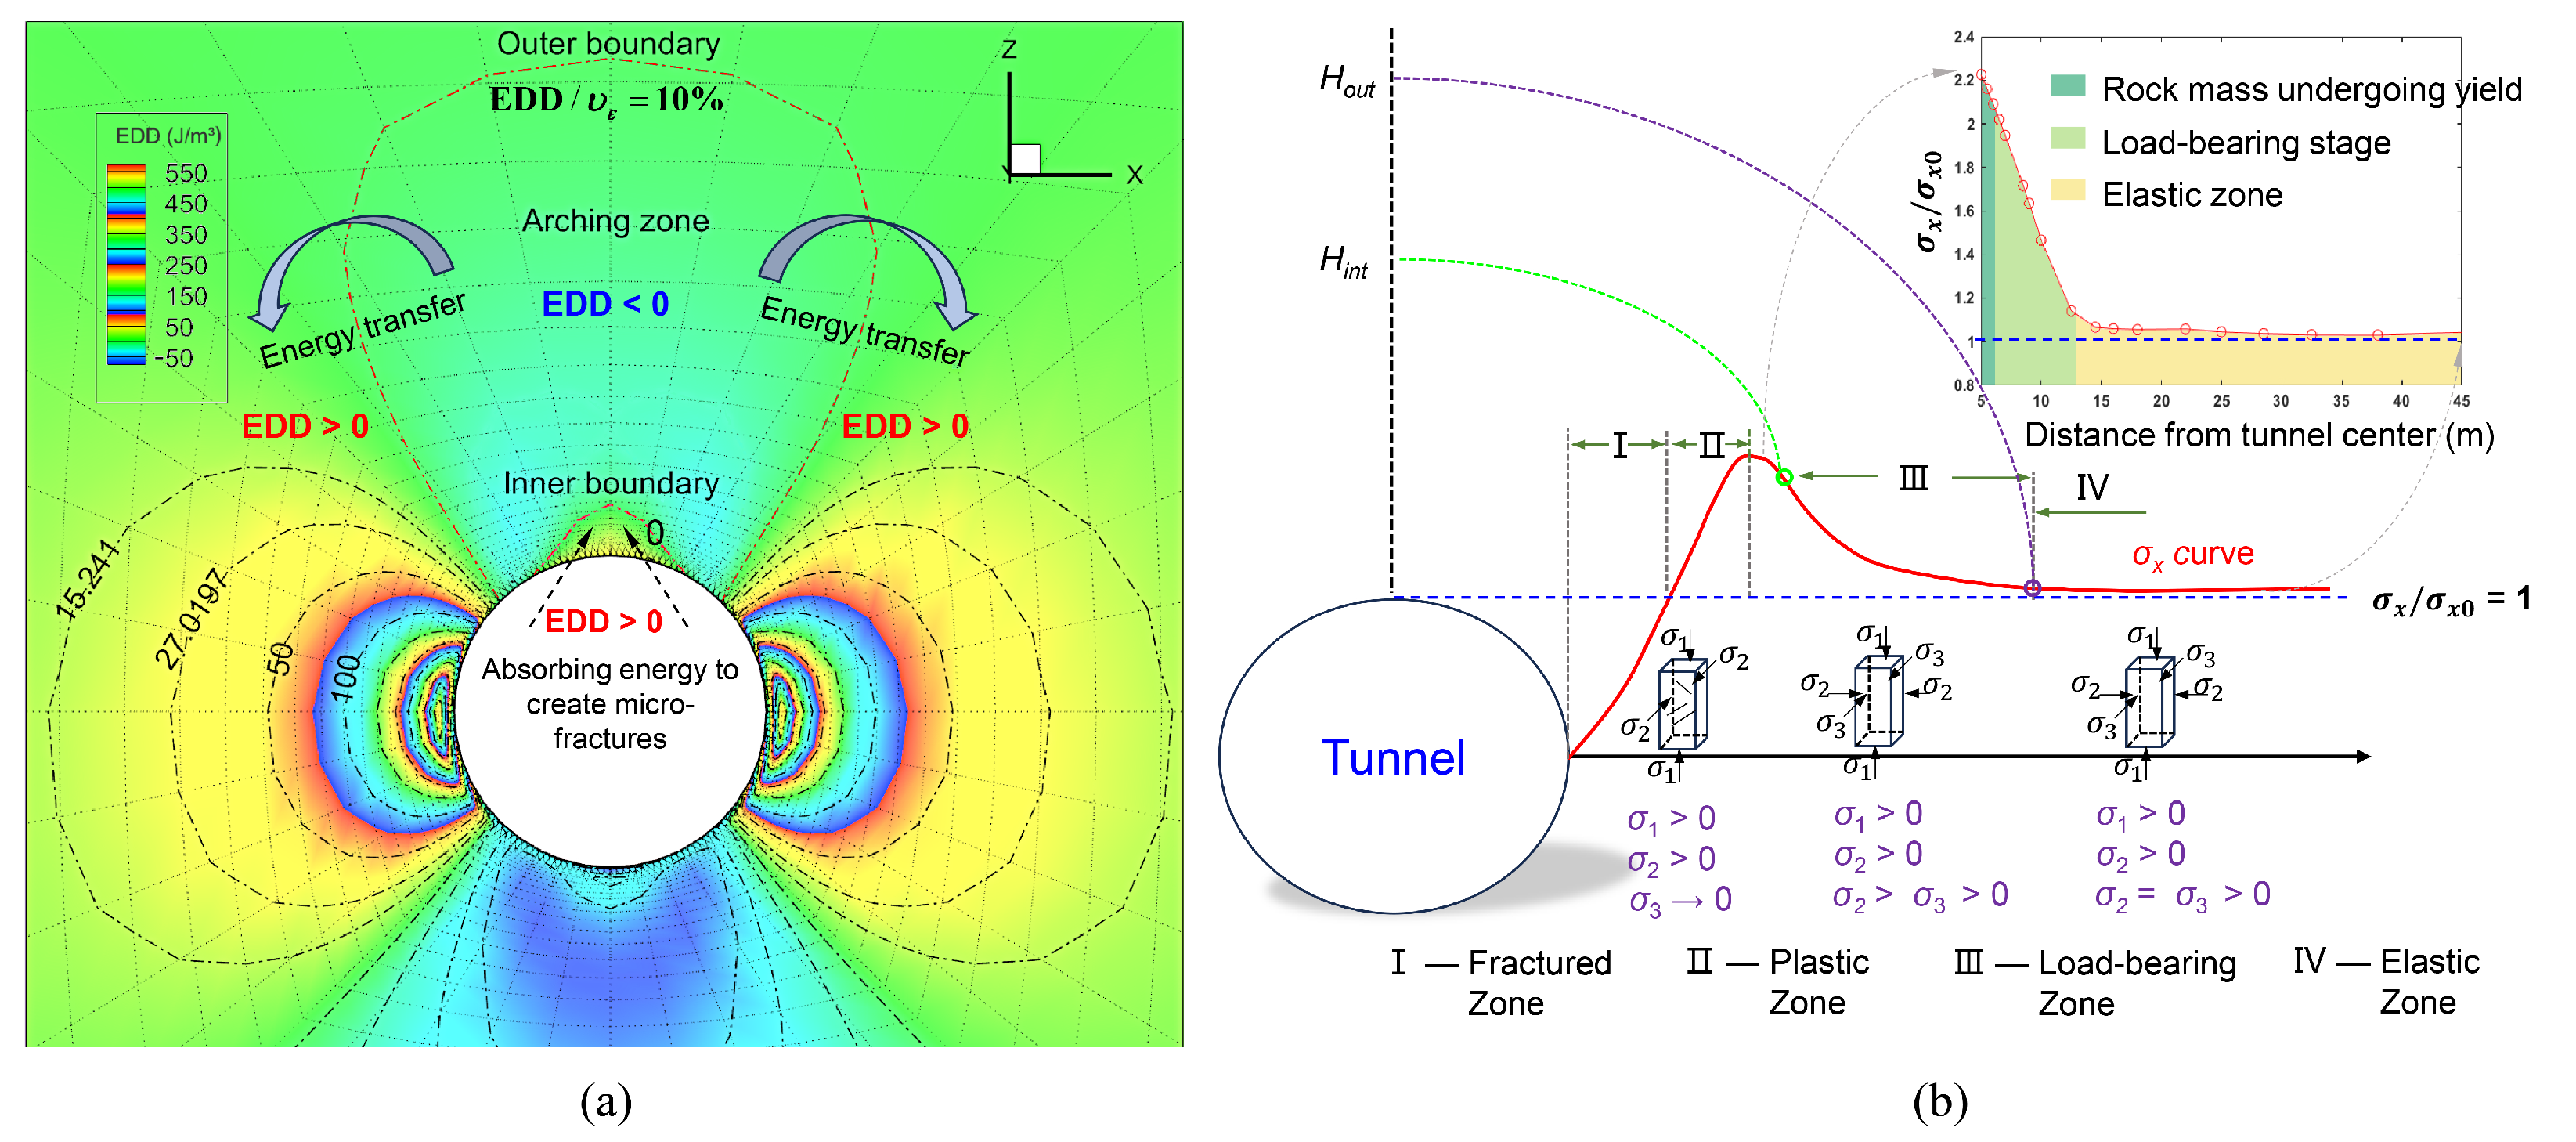
Numerical results show that for the six working conditions (Case A1–A6) with tunnel spans ranging from 10 m to 20 m, the distribution patterns of the EDD in the surrounding rock are similar across all cases. Here, the model with a 10 m span (Case A1) is selected for detailed analysis. Figure 2 depicts the contours of the principal stress distribution and the EDD of the surrounding rock of the tunnel, in which the “+” marks represent the maximum and minimum principal stress vectors. The arching zone is approximately bounded by the contour lines, indicating a zero energy density change in the near field and a 10% change in the far field of the surrounding rock. As illustrated in Figure 3, the rock mass region beneath the zero-energy-density-change contour (i.e., the inner boundary of the pressure arch) absorbs energy during excavation, as indicated by its positive EDD values. The resulting high energy accumulation in this region promotes the initiation of microcracks. Conversely, the rock mass within the pressure arch (above the inner boundary) exhibits negative EDD values, indicating that it releases energy to surrounding rock regions. This observation aligns with the findings by Lee et al. [33], who reported that under a lateral pressure coefficient of less than 1, vertical load is transferred from the rock mass in the negative arching zone to its adjacent positive arching zones on both sides. These results collectively suggest that uneven deformation of the surrounding rock facilitates load and energy redistribution between different rock mass regions.
Figure 4 presents the variation in the EDD of the tunnel-surrounding rock with depth along different monitoring paths. From the figure, it is evident that the rock masses along the 10°–40° monitoring lines lie within the energy-absorbing zones on both sides of the pressure arch, as their EDDs are generally larger than zero. As the depth of the surrounding rock increases, the energy-changing rates of these masses gradually decrease until reaching zero. Along the 60°–90° monitoring lines crossing the pressure arch zone, EDD values are initially positive but decrease rapidly with distance from the tunnel center, reaching a minimum before increase to zero. This demonstrates substantial energy accumulation in rock immediately above the excavation boundary, while the energy dissipation intensities in the pressure arch zone first reach peaks and then diminish with increasing rock depth. The energy density variation along the 50° monitoring line remains consistently low, as this line is situated near the outer boundary of the pressure arch zone.
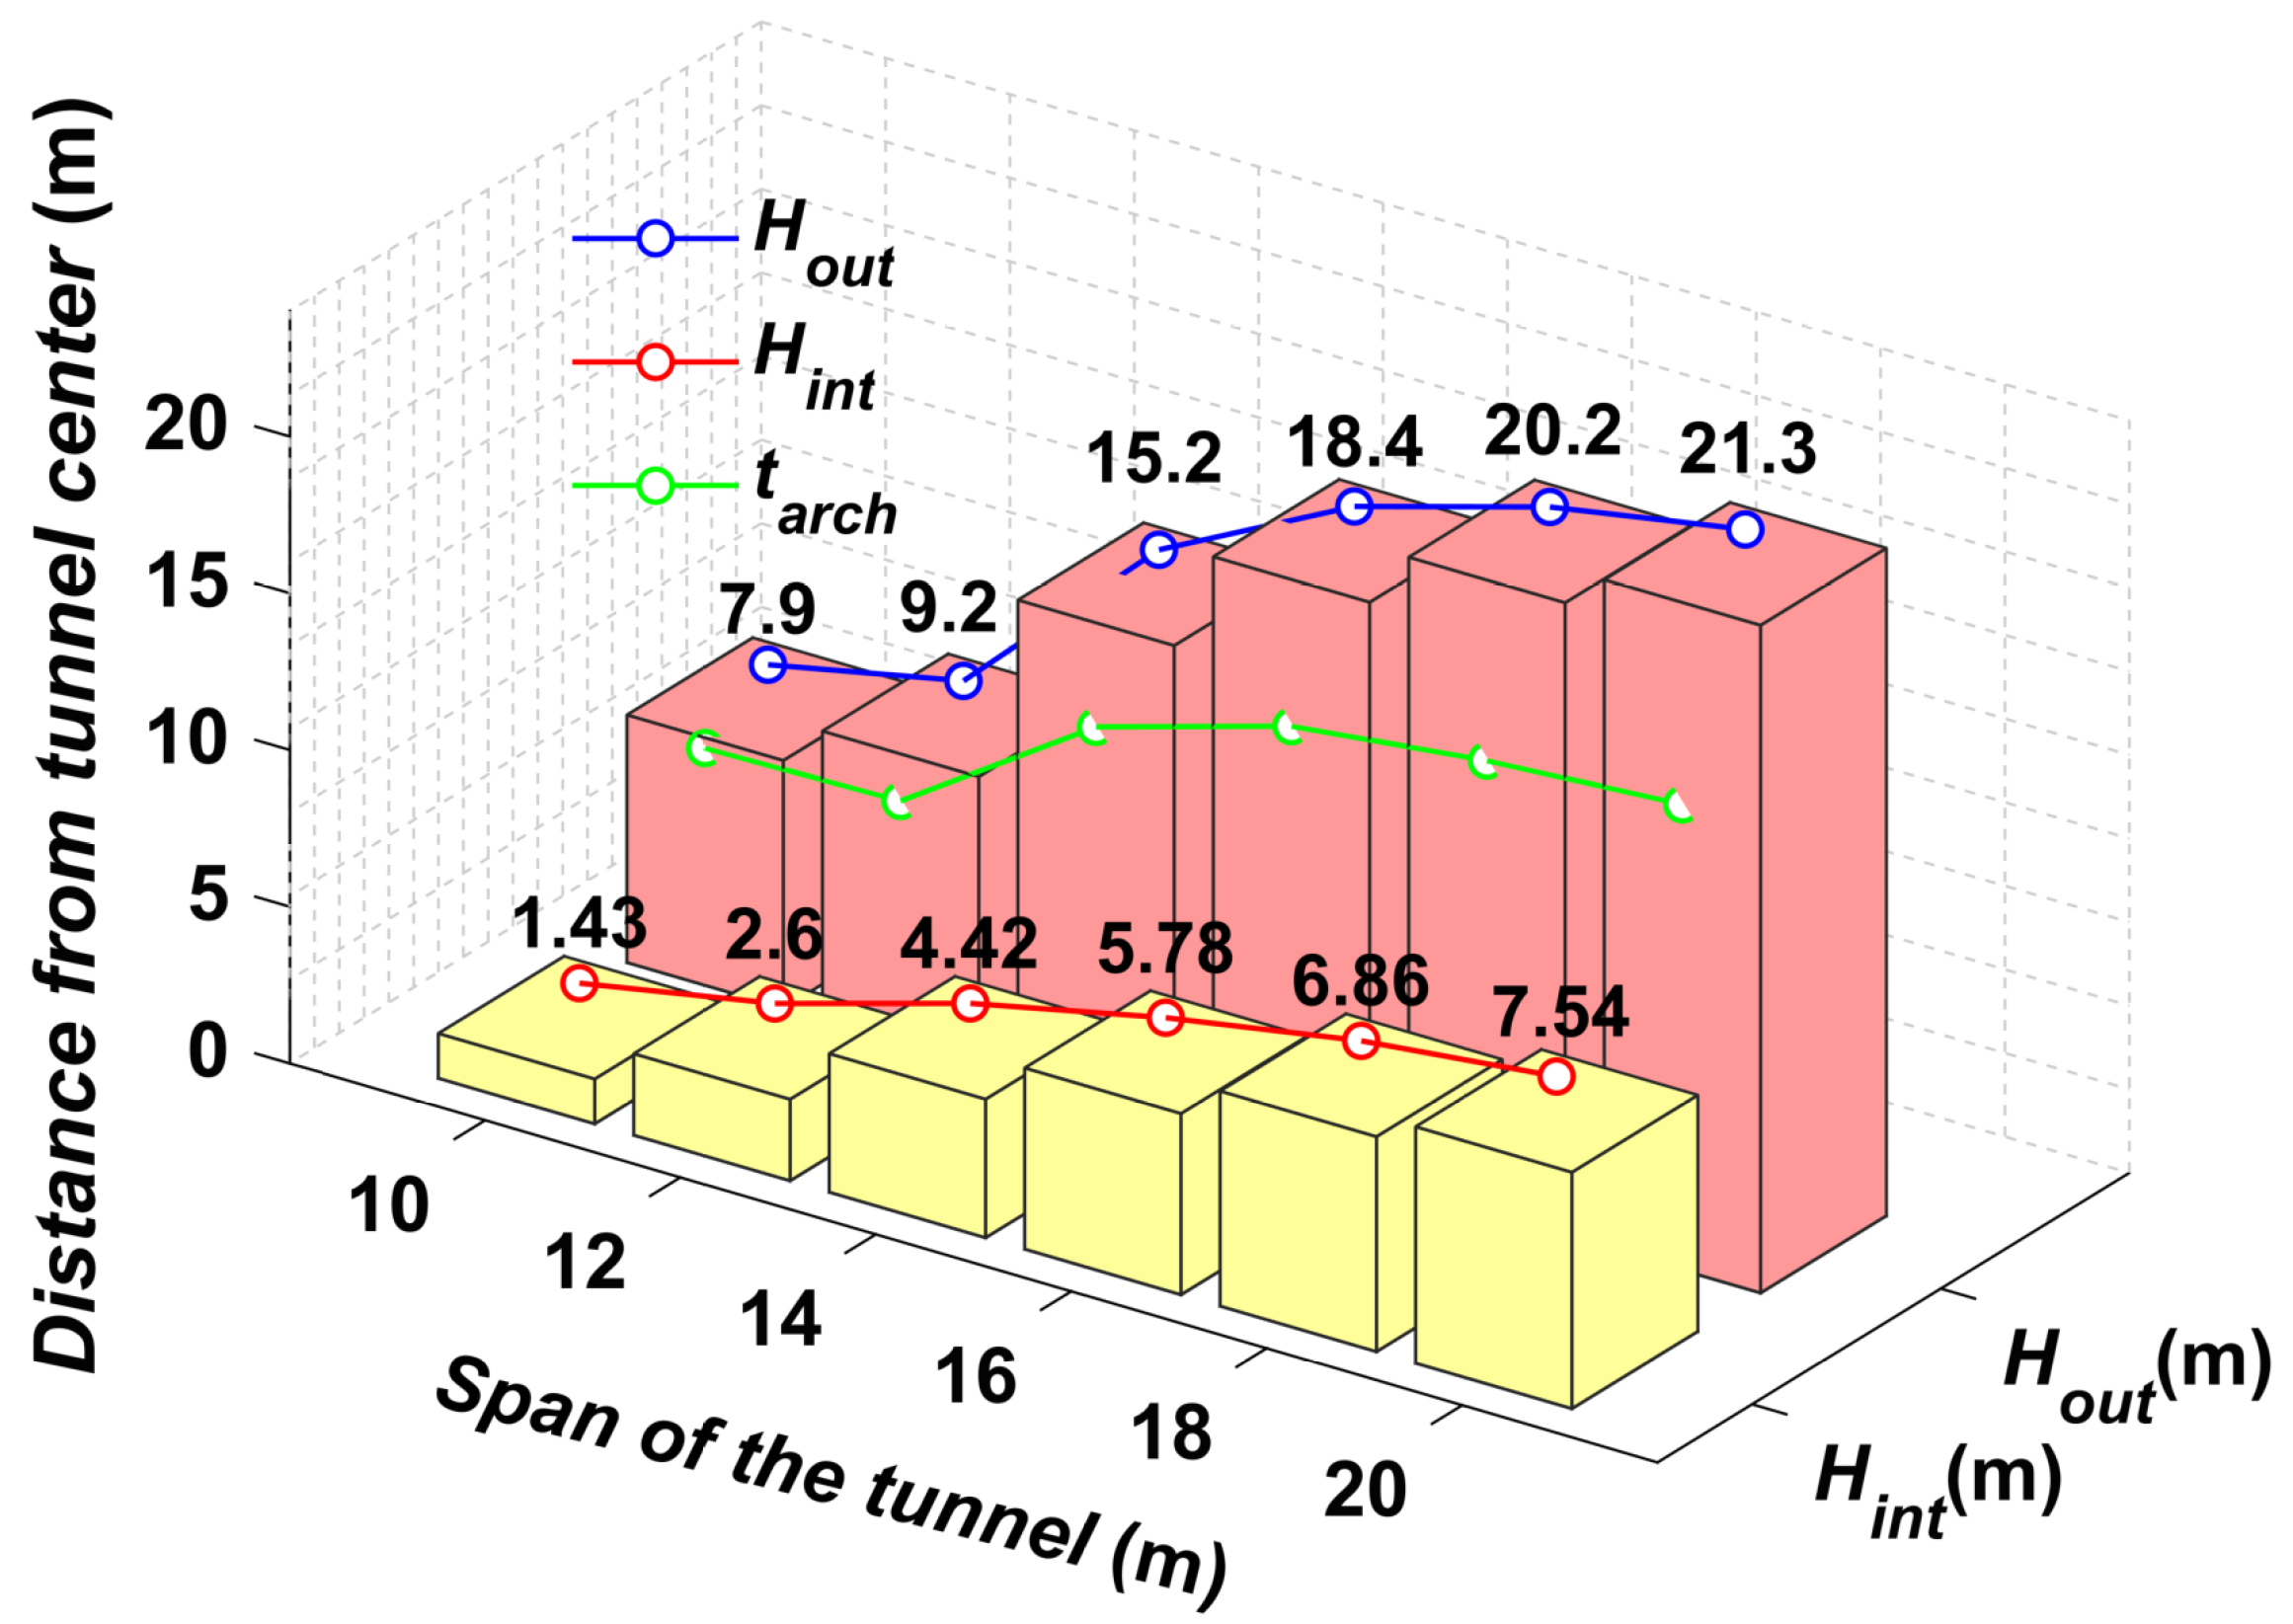
To quantitatively describe the dimensions of the pressure arch zone, inner and outer boundary heights are defined, denoted as H i n t and H o u t , respectively. These parameters are defined as the vertical distances from the top edge of the tunnel to the intersection points of the arch boundaries with the tunnel centerline (i.e., the 90° monitoring line), as illustrated in Figure 4. The arch thickness t a r c h , defined as the difference between H o u t and H i n t , is also evaluated. Figure 5 shows these parameters for varying tunnel spans D. It is evident that H i n t , H o u t , and t a r c h all increase continuously with D. This indicates that larger excavation spans displace the pressure arch away from the tunnel, inducing energy fluctuations across broader surrounding rock regions and thereby enlarging the pressure arch ranges. This phenomenon implies that the dimensions of the pressure arch zone can, to some extent, serve as an indicator of the stability of the surrounding rock. In particular, a smaller height and thickness of the pressure arch are associated with greater tunnel roof stability.

3.2. Effect of Internal Friction Angle of the Surrounding Rock

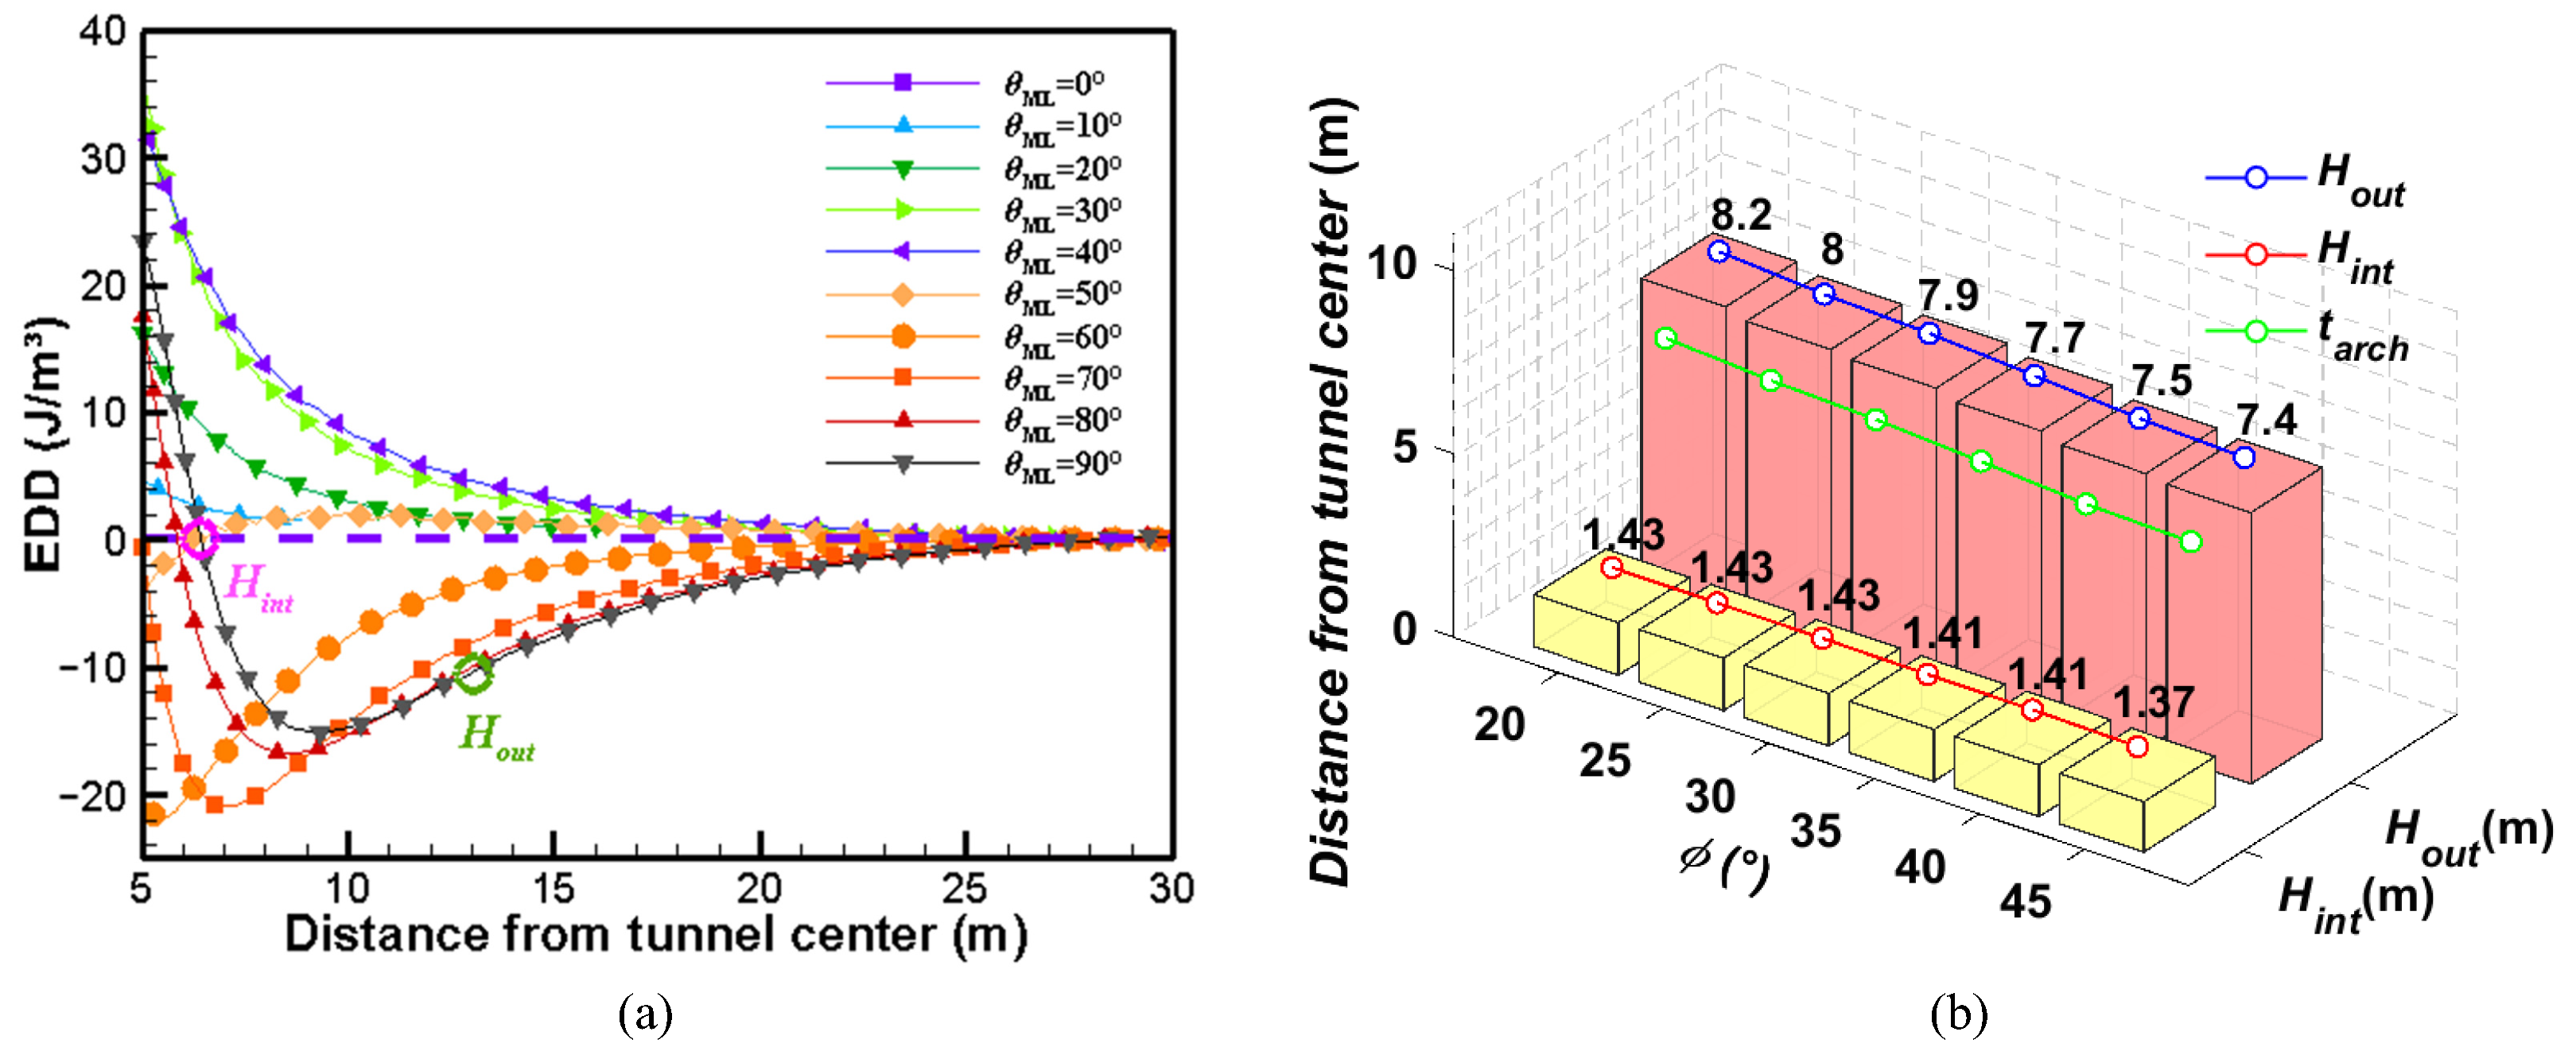
Across the six cases in Experiment Series B (Case B1–B6), where the internal friction angle ϕ of the surrounding rock ranges from 20° to 45°, the distribution patterns of their EDDs remain generally consistent. Specifically, the rock mass beneath the inner boundary of the pressure arch accumulates energy, while the pressure arch zone itself facilitates the transfer of released energy to the rock masses on both sides of the arching region. For Case B2, where the internal friction angle is 25°, the variation in EDD with increasing rock depth along different monitoring paths is illustrated in Figure 6a, which shows similar angular-dependent trends of EDD curves to those in Figure 4. By calculating the vertical distance from the tunnel roof edge to the intersection of the near-field 0%-energy-density-change contour with the 90° monitoring line and the one for the far-field 10%-density-change contour, H o u t and H i n t can be determined, with magnitudes of 1.43 m and 8 m, respectively.
Figure 6b shows the dimensions of the pressure arch zones for different internal friction angles of the surrounding rock, from which it can be seen that the vertical ranges of the arch zones are quite similar. As the internal friction angle increases, slight decreases are observed in H i n t , H o u t , and t a r c h . It is worth noting that, for all the numerical experiments in Series B, there is almost no plastic zone in the tunnel roof, while the ranges of the small plastic zones on both sides of the tunnel slightly reduce with increasing internal friction angle. The above observations demonstrate that the boundaries of the roof pressure arch remain insensitive to variations in the internal friction angle of the surrounding rock when the tunnel roof is in an elastic state.

3.3. Effect of Lateral Pressure Coefficient

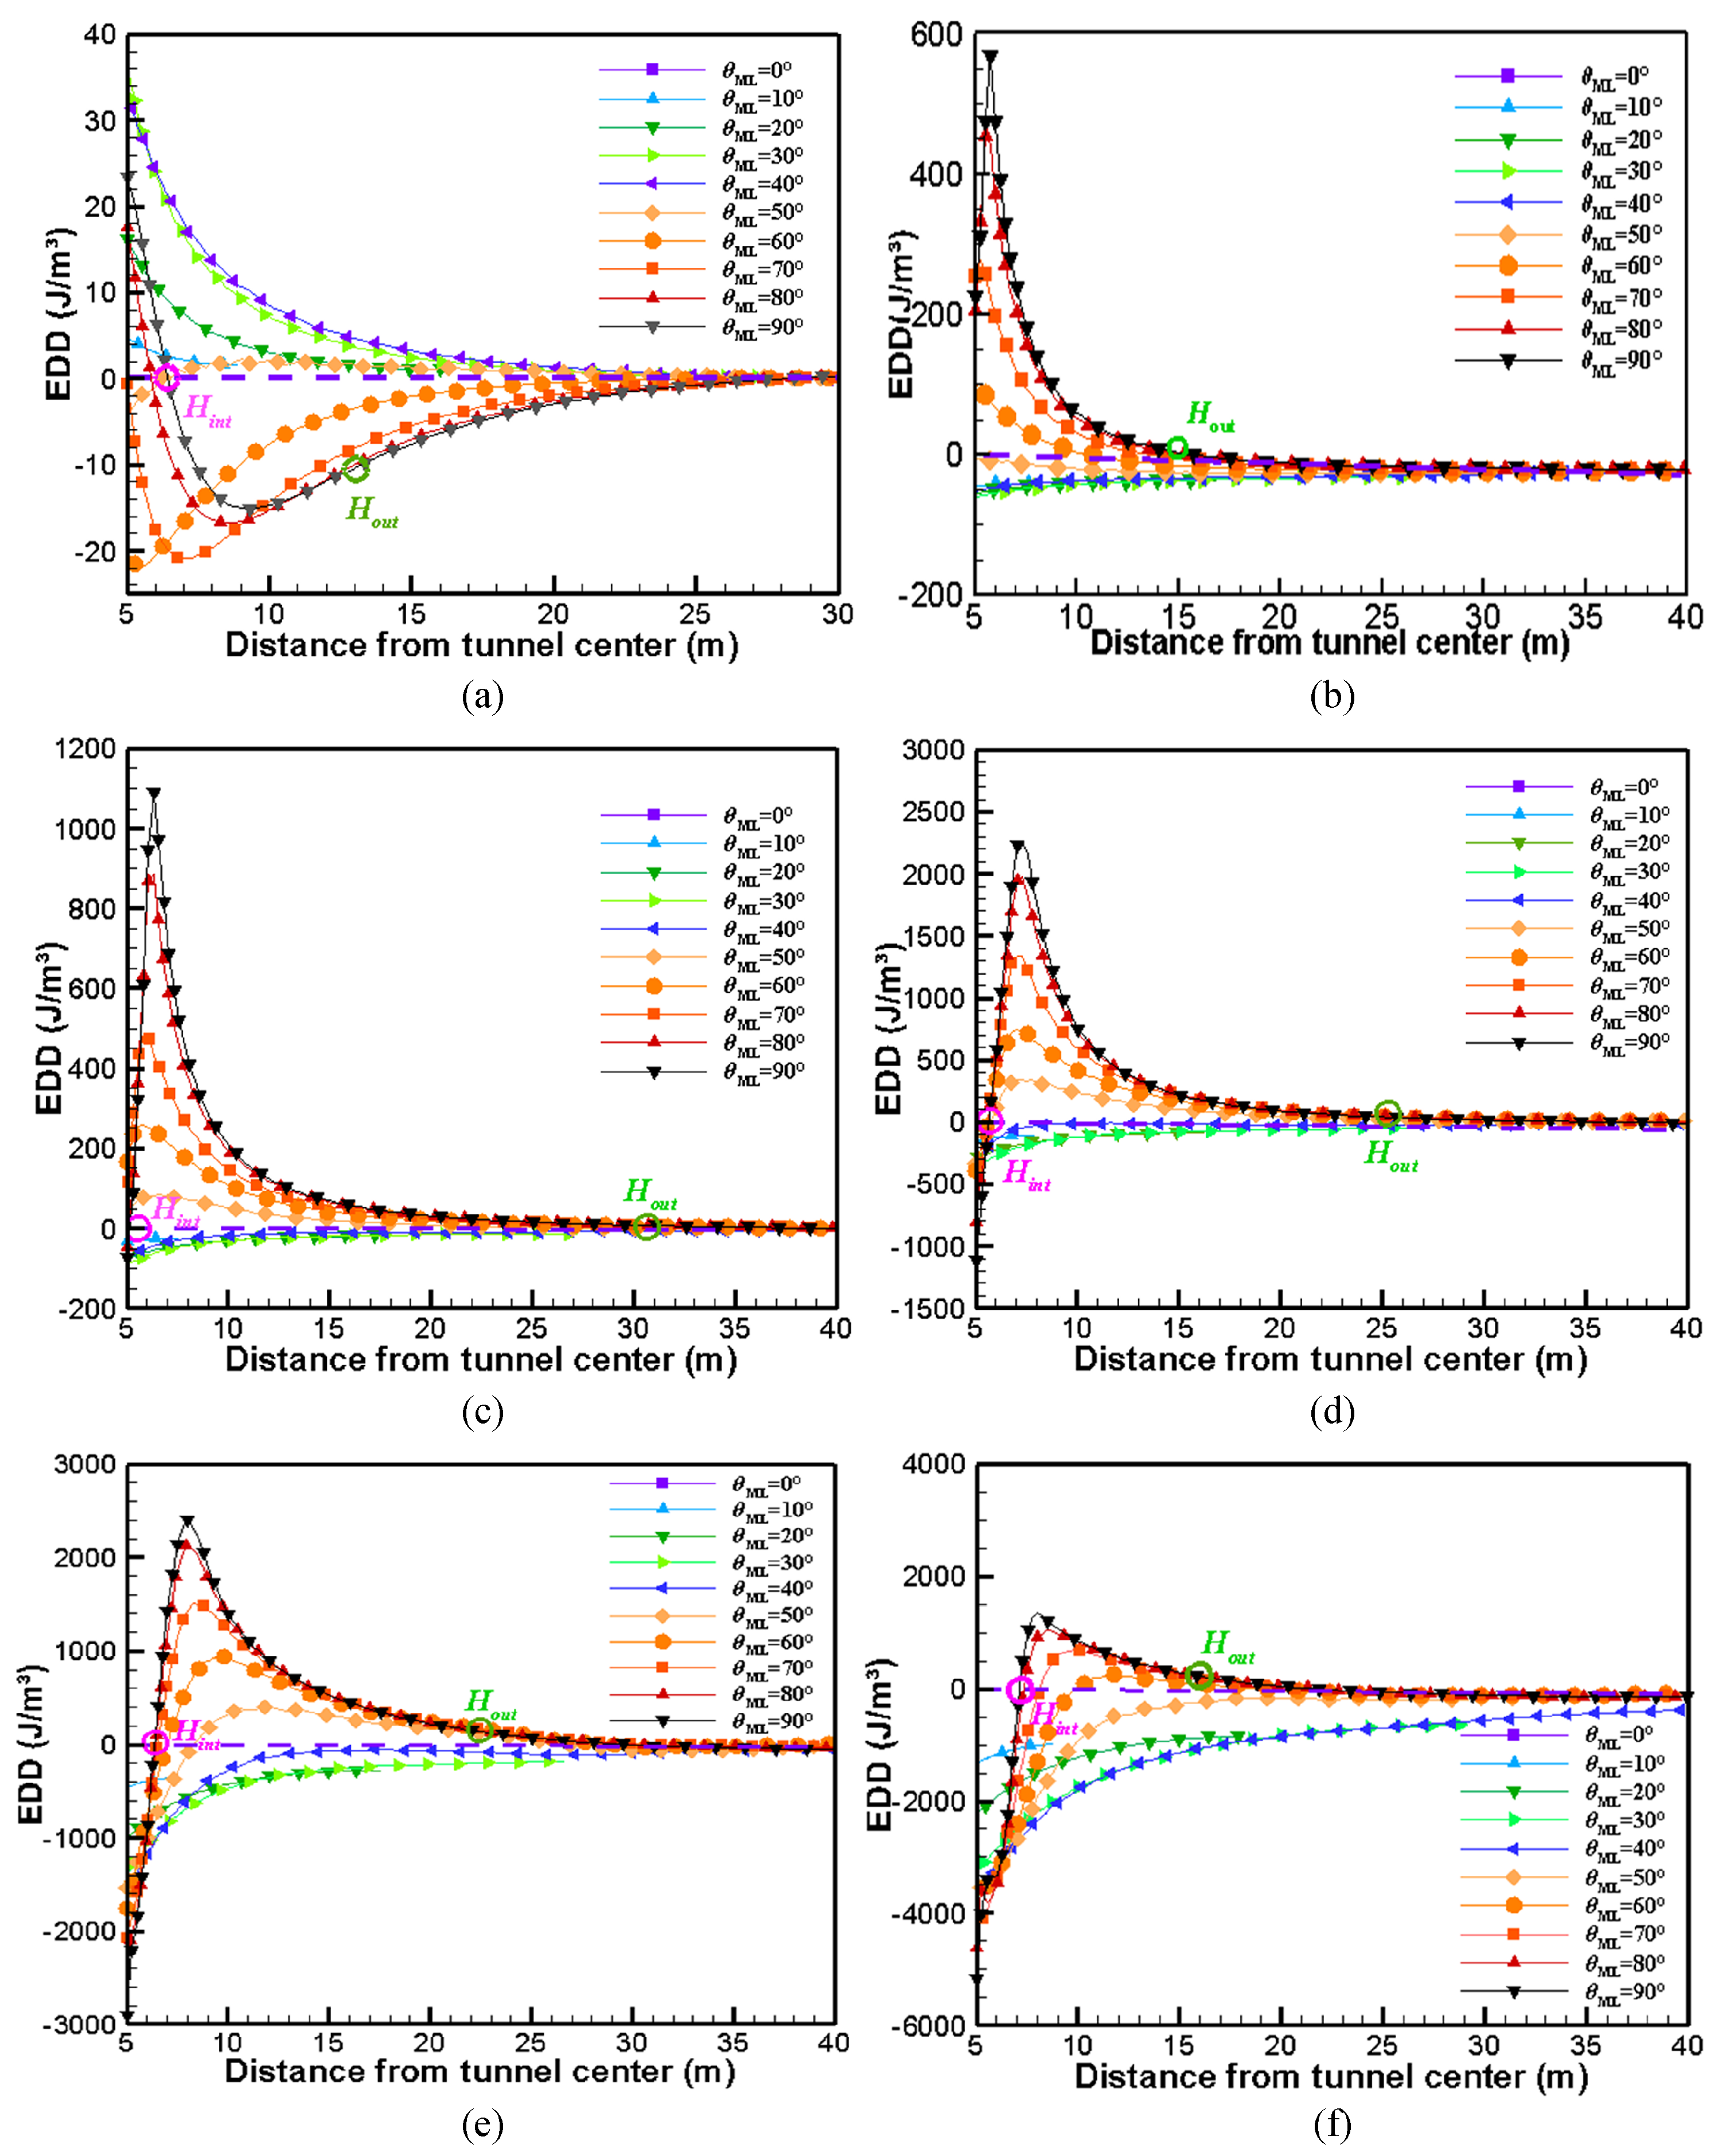
For the six working conditions (Case C1–C6) in series C, where the lateral pressure coefficient λ ranges from 0.5 to 2.5, the distribution characteristics of the EDD of the tunnel-surrounding rock are strongly influenced by whether λ exceeds 1. Unlike the cases where 0 < λ < 1 , an increase in lateral pressure beyond unity results in the rock mass beneath the inner boundary of the tunnel roof pressure arch being unable to withstand the intensified horizontal stresses, leading to plastic failure and subsequent energy release. As shown in Figure 7, the rock mass within the pressure arch zone absorbs energy transferred from the surrounding rock masses on both sides of the arching region. This observation agrees with the results reported by Li [44], who found that under high lateral confining pressure (i.e., λ > 1 ), energy tends to accumulate within the pressure arch zone, while the surrounding rock outside the arch experiences energy dissipation.
Figure 8 depicts the EDDs of the tunnel roof along different monitoring paths versus the depth of surrounding rock for each experimental case. From the figure, it can be observed that the direction of energy transfer at the tunnel’s top edge depends largely on the lateral pressure coefficient λ . For the monitoring lines passing through the pressure arch (50°–90° lines), the magnitudes of EDD at 5 m from the tunnel center, namely those at the tunnel top edge, are positive when 0 < λ < 1 (Figure 8a,b) and become negative for λ > 1 (Figure 8d–f). This indicates that the excavation induces energy absorption in tunnel roof rock at low lateral confining pressures and energy release at high pressures. When the lateral pressure coefficient equals unity, the energy differences at the top edge approach zero, as shown in Figure 8c. For Case C1, the variations in EDD with rock depth are similar to those described in Section 3.1. When λ is larger than unity (Case C4–C6), in rock masses outside the energy release zones (along the 10°–40° monitoring lines), the energy release gradually diminishes to zero for increasing rock depth; along the 50°–90° monitoring lines, the rock first releases energy with a reducing rate, then accumulates energy till a peak value, and gradually reaches a steady state with no energy fluctuation, as shown in Figure 8d–f. Notably, Case C2 ( λ = 0.8 , Figure 8b) exhibits no zero-EDD contour in the near-field rock, suggesting the absence of plastic deformation at the top of the tunnel. In this scenario, energy accumulates in the pressure arch zone, and the tunnel top edge itself can be adopted as the inner boundary of the pressure arch.
Figure 9 presents the variations in the inner and outer boundary heights and the arch thickness ( t a r c h ) of the pressure arch under different lateral pressure coefficients. As λ increases, H i n t initially decreases and then increases, while both H o u t and t a r c h increase first and reduce afterwards. The turning point for all pressure arch parameters occurs at λ equals 1. When the horizontal stress is less than the vertical stress, namely, 0 < λ < 1 , the outer boundary of the pressure arch gradually shifts away from the tunnel wall as λ increases, while the inner boundary moves closer. This pattern indicates that rising horizontal tectonic stress enlarges the pressure arch zone; thus more support will be required by the surrounding rock to resist the excavation-induced pressure increase. Nevertheless, moderate horizontal stress can be beneficial, as it reduces energy concentration in the sidewalls, thereby enhancing their stability. In contrast with 0 < λ < 1 cases, when λ is larger than one, the outer boundary moves closer to the tunnel wall, while the inner boundary shifts outward with increasing λ . This trend reflects a shrinking pressure arch zone and indicates higher energy concentration within the arch region, which negatively impacts the stability of the surrounding rock within the arch.

4. Discussion

Considering the mechanisms of energy release, transfer, and restabilization in surrounding rock following tunnel excavation, this study proposes using the energy density difference before and after excavation as a criterion for identifying the surrounding rock pressure arch zone. By visualizing the energy field of the surrounding rock with FLAC3D, the inner and outer boundary heights can be computed for measuring the range of the pressure arch. To further evaluate the efficacy of the proposed approach, these dimension properties are compared and analyzed against the pressure arch zones determined by three other commonly used methods from previous studies under identical modeling conditions. The tunnel span, internal friction angle, and lateral pressure coefficient evaluated in this comparative study are 10 m, 30°, and 0.5, respectively. The H i n t and H o u t values computed from the proposed EDD approach are 1.43 m and 7.9 m, respectively.

4.1. Comparison with Pressure Arch Discrimination Method Based on Tangential Stress of Surrounding Rock

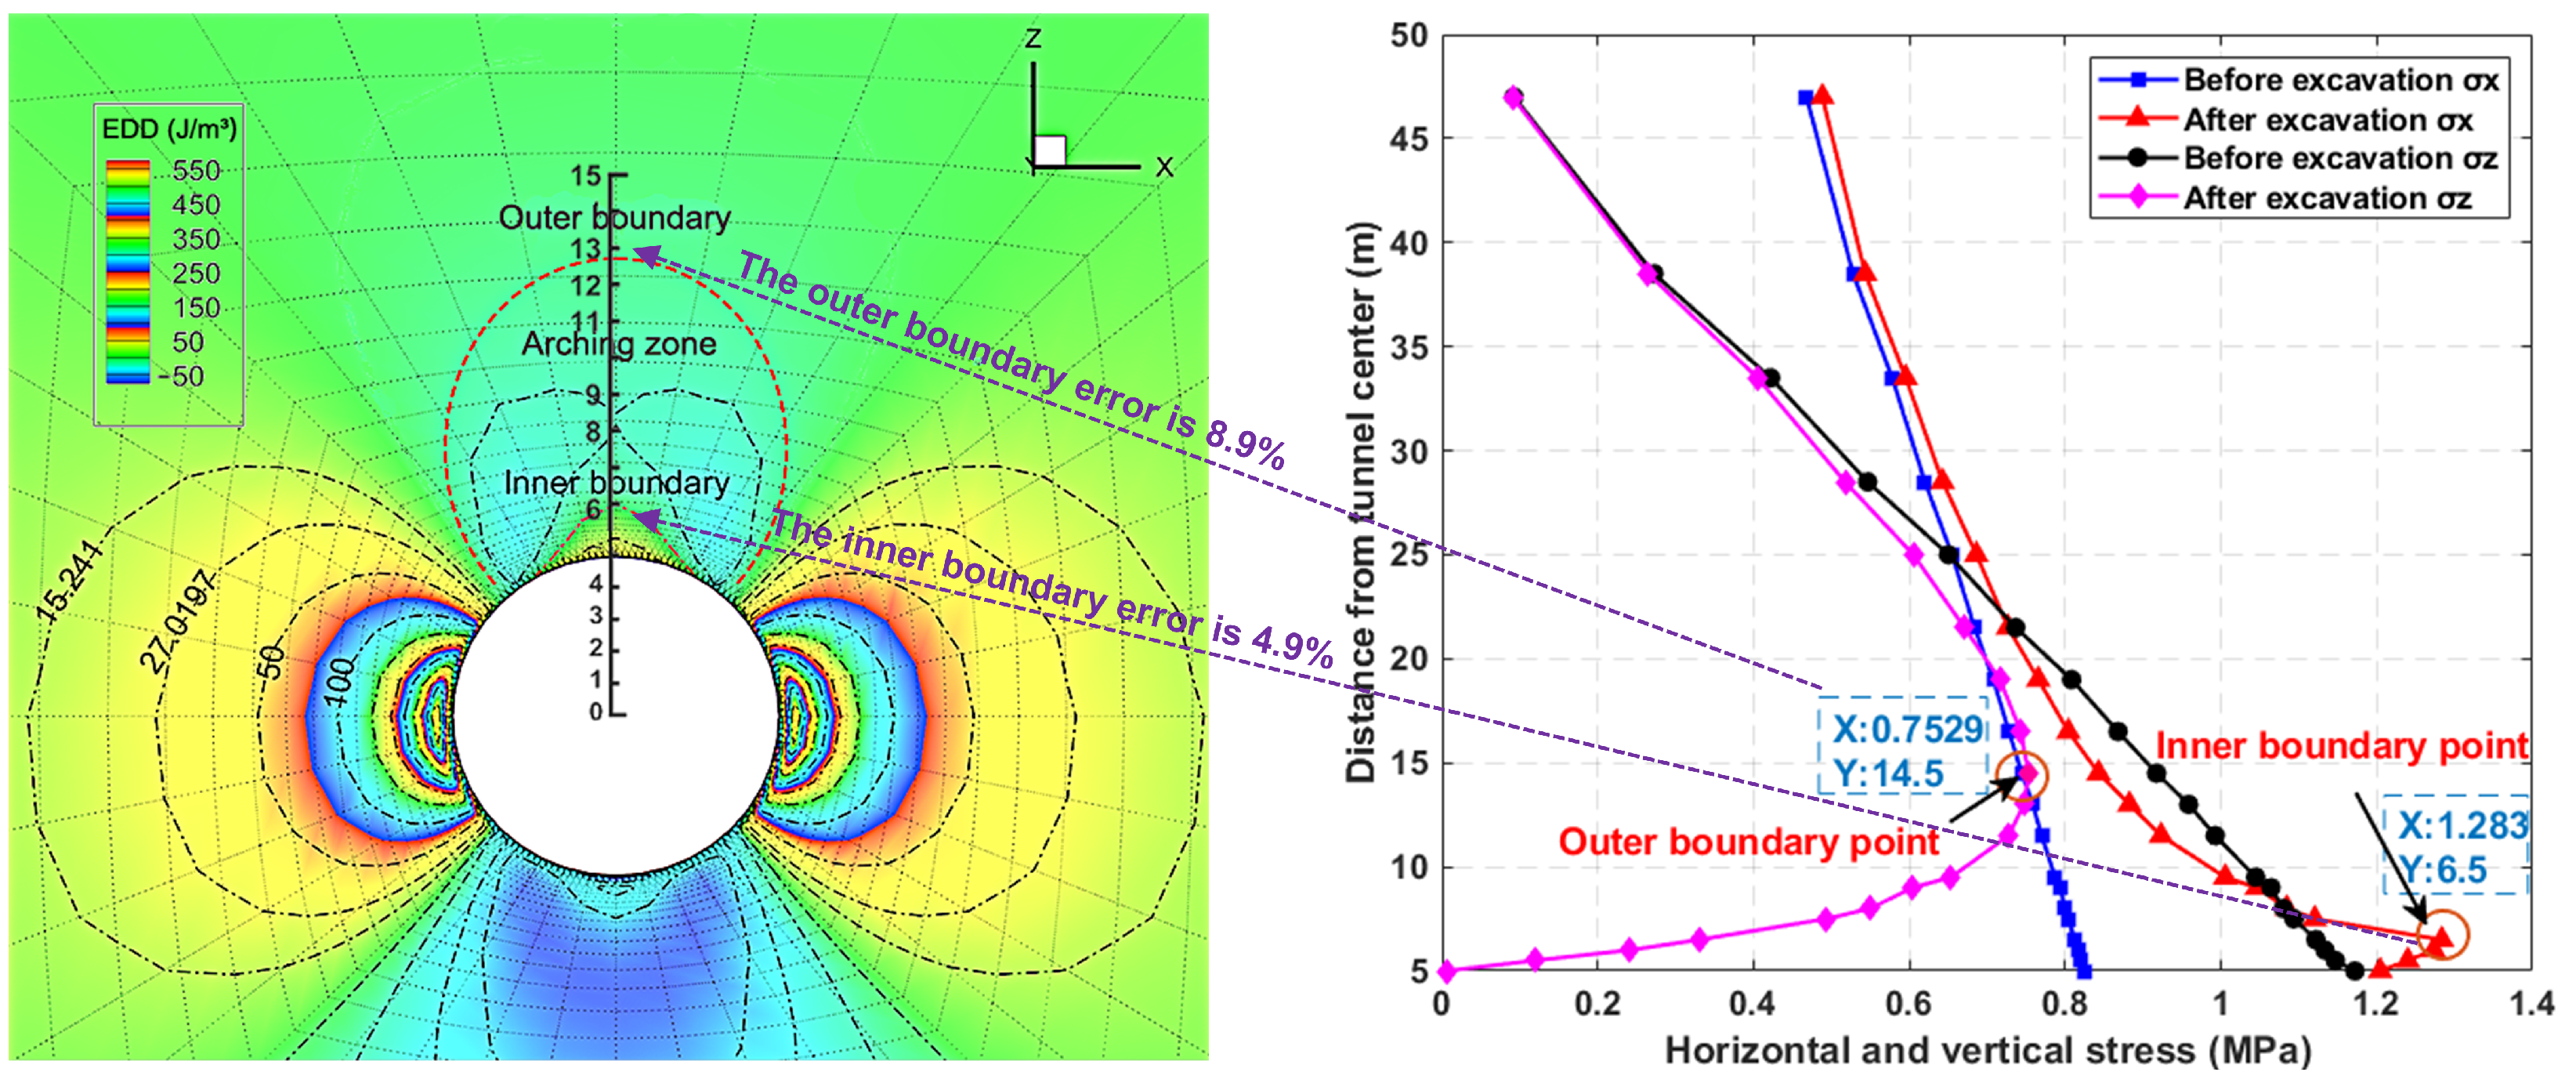
Fu et al. [24] defined the pressure arch boundaries through increased tangential stress in the surrounding rock after tunnel excavation. Specifically, the contour where the tangential stress in the near-field post-excavation rock equals the original rock’s stress is identified as the inner boundary of the pressure arch, and the contour where the far-field tangential stress recovers to 90% of the original stress is taken as the outer boundary. Figure 10 depicts the tangential stress distributions of the surrounding rock along the 90° monitoring line before and after excavation. The corresponding H i n t and H o u t can be obtained through identifying the locations of inner and outer pressure arch boundaries in the right subfigure of Figure 10 using Fu et al.’s approach [24]. From the subfigure, it can be seen that the computed vertical distances from the tunnel’s center to the inner and outer boundaries are 6.5 m and 13.8 m, respectively. Subtracting the tunnel’s radius gives the corresponding H i n t and H o u t , i.e., 1.5 m and 8.8 m, respectively. Compared to the EDD-derived results, the inner boundary height shows a 4.9% deviation, while the outer one differs by 11.4%, suggesting a generally good agreement between the two approaches.

4.2. Comparison with Pressure Arch Discrimination Methods Based on Inflection Points of Principal Stress–Depth Curves

Kong et al. [34] suggested the use of the principal stress trajectories passing through the inflection points of the principal stress–depth curve along the tunnel centerline for defining the pressure arch boundaries. In particular, the inner boundary is defined by the trajectory that passes through the point experiencing maximum horizontal stress on the roof centerline, while the outer boundary corresponds to the trajectory crossing the point with maximum vertical stress along the centerline. The right subfigure of Figure 11 illustrates the distributions of horizontal and vertical stresses in the surrounding rock before and after the tunnel excavation along the 90° monitoring path. It can be seen from the figure that, after tunnel excavation, both the σ x –depth and σ z –depth curves along the roof centerline exhibit an increasing-then-decreasing trend. The peak value of σ x appears at 6.5 m from the tunnel center, marking a reference point for the inner boundary, while the peak σ z occurs at 13.6 m, indicating the depth of the outer boundary. Therefore, the pressure arch heights ( H i n t and H o u t ) derived from these inflection points are 1.5 m and 8.6 m, respectively. Compared to those determined via the EDD method, as indicated in the right subfigure of Figure 11, the relative differences for the inner and outer boundaries are 4.9% and 8.9%, respectively.

4.3. Comparison with the Pressure Arch Determination Method Based on the Contour Lines of Vertical Stress in Surrounding Rock

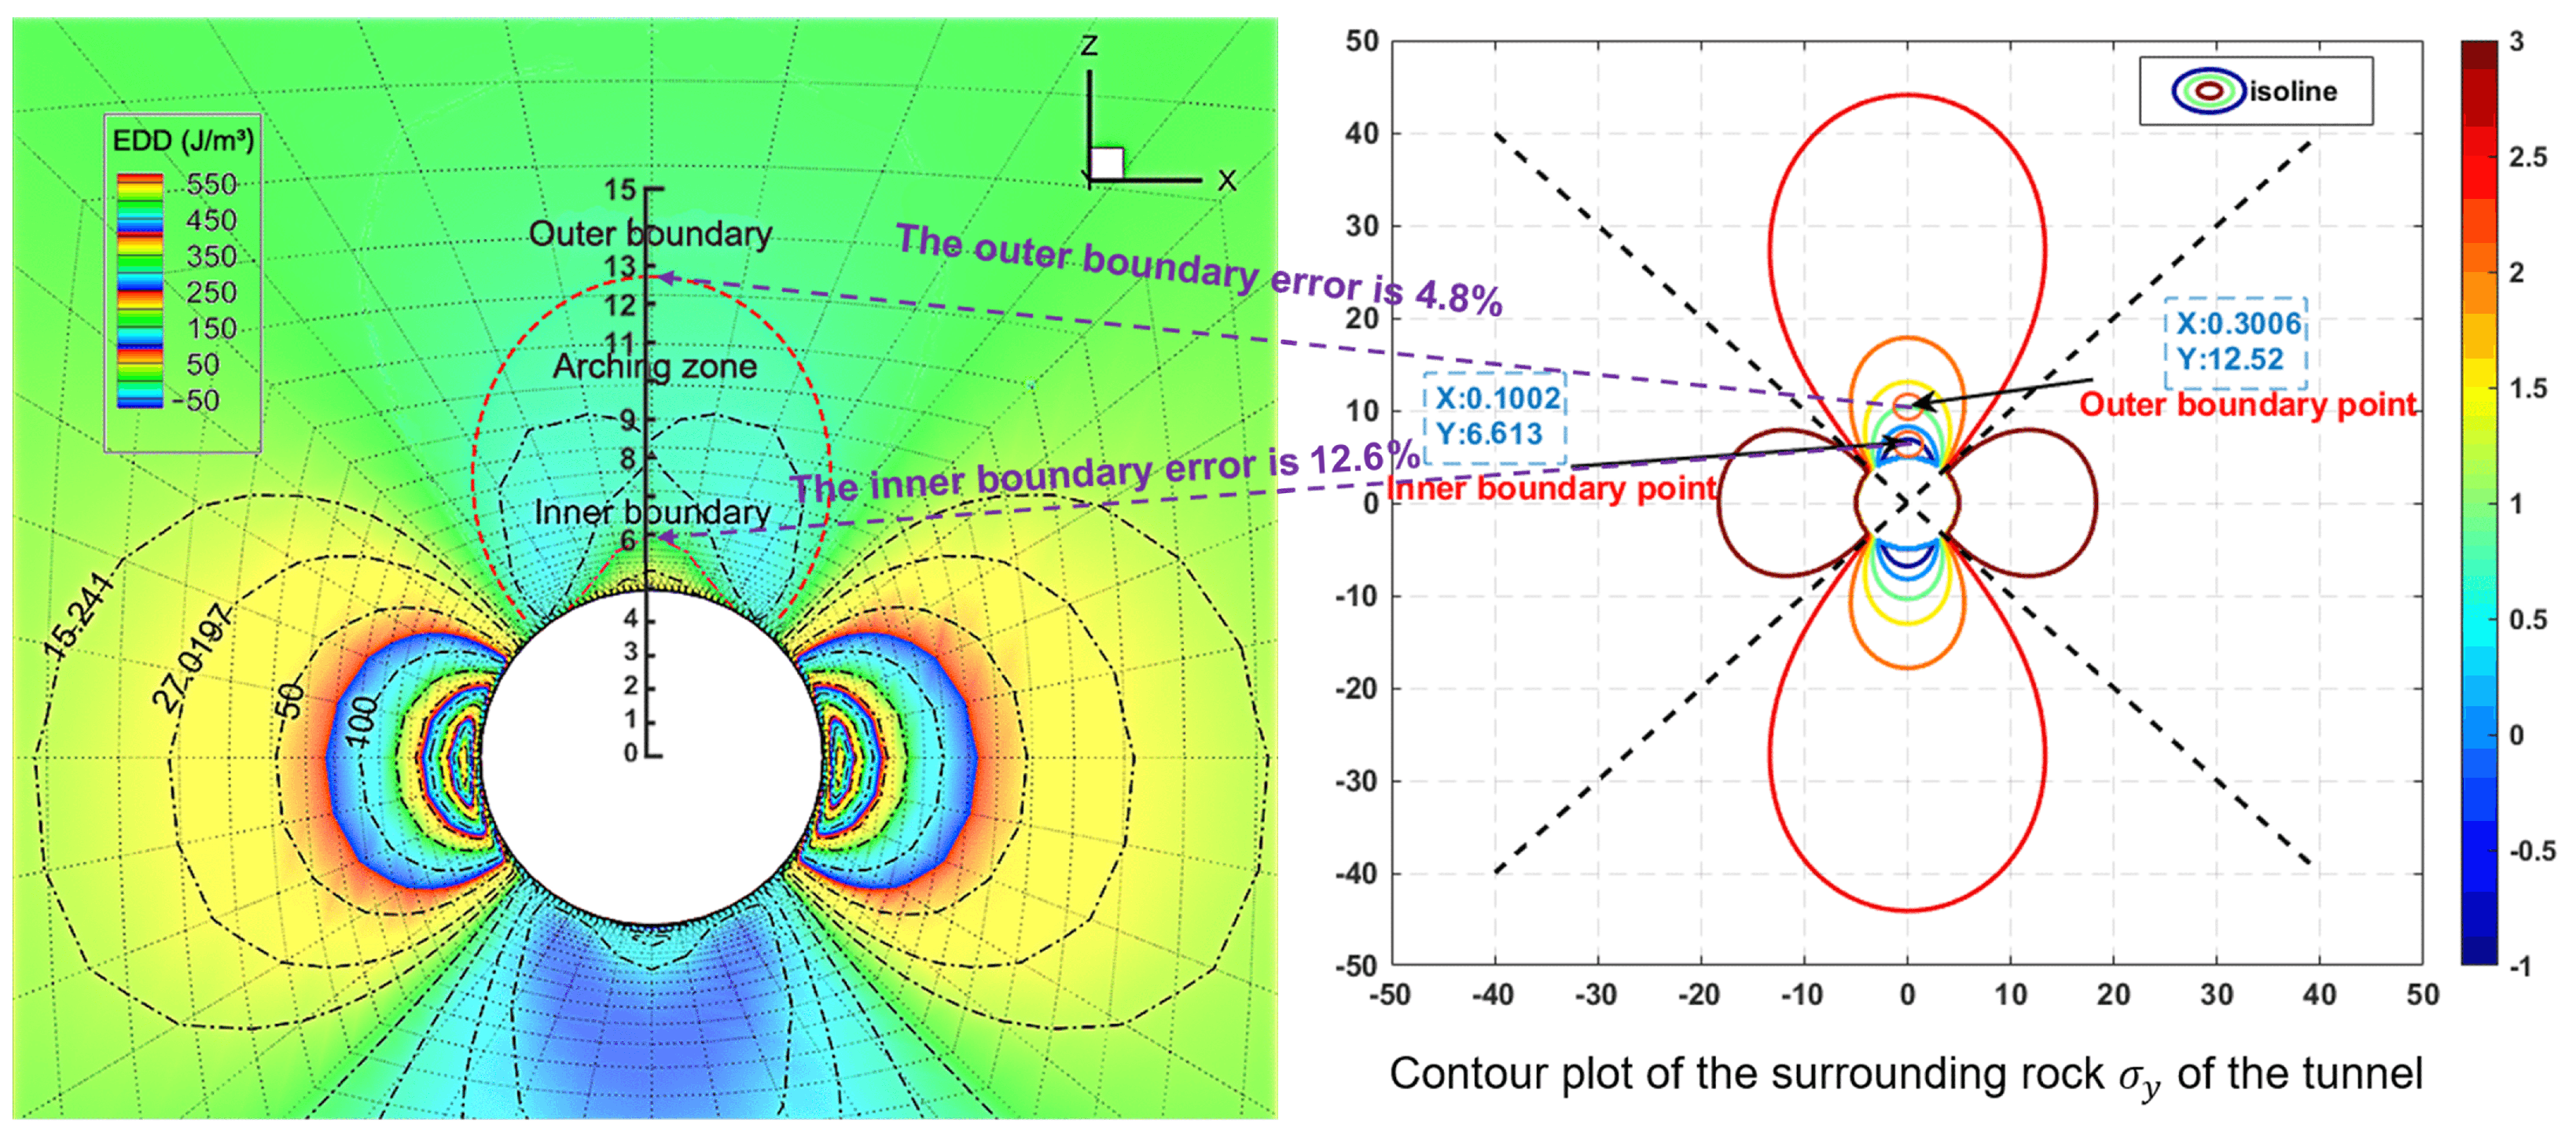
Lv et al. [45] developed a methodology based on the secondary stress state of tunnel-surrounding rock. They derived analytical expressions for the horizontal ( σ x ) and vertical ( σ y ) secondary stress components, as shown in Equations (5) and (6), and suggested that the pressure arch range can be delineated using the vertical stress contours of the surrounding rock after excavation.
σ x = λ P 0 + ( 1 λ ) P 0 cos 2 2 θ 2 R 0 2 r 2 3 R 0 4 r 4 1 2 ( 1 λ ) P 0 2 R 0 2 r 2 3 R 0 4 r 4 + 1 2 ( 1 3 λ ) P 0 R 0 2 r 2 cos 2 θ
σ y = P 0 + ( 1 λ ) P 0 cos 2 2 θ 3 R 0 4 r 4 2 R 0 2 r 2 + 1 2 ( 1 λ ) P 0 2 R 0 2 r 2 3 R 0 4 r 4 + 1 2 ( 1 3 λ ) P 0 R 0 2 r 2 cos 2 θ
where P 0 is the vertical load, R 0 is the tunnel radius, r represents the radial coordinate of an arbitrary point, and θ is the angle measured counterclockwise from the horizontal axis. Figure 12 shows the post-excavation distribution of vertical stress contour lines in the surrounding rock obtained from the EDD method (left subfigure) and the approach proposed by Lv et al. [45] (right subfigure). According to Lv et al. [45], the inner pressure arch boundary corresponds to the near-field contour where σ y deviates by 10% from its pre-excavation value, while the outer boundary aligns with the far-field contour, showing a 10% change in σ y . Based on this definition, the boundary heights H i n t and H o u t of the pressure arch are calculated to be 1.61 m and 7.52 m, respectively. Compared with the results obtained using the EDD method, the relative differences are 12.6% for H i n t and 4.8% for H o u t , indicating good agreement between the two approaches.
Although the present approach relies mainly on numerical simulations, the comparative analysis with the alternative approaches demonstrates the effectiveness of the EDD-based method in identifying the arch zone for tunnel-surrounding rocks. More importantly, the proposed energy-based methodology addresses controversies regarding principal stress vector deviations while providing a physical explanation—through an energy perspective—for the formation and evolution of the pressure arch during tunnel excavation. While experimental or field validation is not included in this study, the demonstrated consistency with established methods lends credibility to the results. Future investigations will further extend this work through targeted experimental studies.

5. Conclusions

This study presents a novel theoretical approach—the energy density difference (EDD) method—for delineating the pressure arch zone in tunnel-surrounding rock, accounting for stress redistribution and energy transfer during excavation. The method defines the arch zone through pre- and post-excavation energy densities: the inner boundary corresponds to near-field rock units with zero EDD, while the outer boundary is determined by a smaller energy fluctuation, such as a 10% change in energy density, in the far field.
Parametric studies are performed to examine the effects of tunnel span D, internal friction angle ϕ , and lateral pressure coefficient λ on the energy field and pressure arch characteristics. The results show that increasing the tunnel span pushes the arch zone outward and extends energy fluctuations deeper into the surrounding rock. Moreover, the arch boundaries are found to be largely insensitive to the internal friction angle for tunnel roofs under elastic conditions. Under low lateral pressure ( 0 < λ < 1 ), the outer boundary moves outward while the inner boundary shifts inward with increasing λ . Conversely, when λ > 1 , the outer boundary contracts toward the tunnel wall and the inner boundary expands outward, reflecting greater energy concentration within the arch zone.
A comparative analysis with three established methods is also conducted. The proposed EDD-based approach yields results in close agreement with the existing methods for defining the pressure arch zone, while avoiding reliance on stress vector directions. Overall, the EDD method effectively identifies tunnel pressure arch zones, resolves controversies regarding principal stress vector deviations, and offers a physically grounded explanation for the formation and evolution of pressure arches. Beyond experiments and field validations, future research may explore the dynamic evolution of three-dimensional pressure arch forms under conditions more representative of practical engineering scenarios, such as dual-bore tunnels and staged excavation processes.

Author Contributions

Conceptualization, X.H.; methodology, X.H.; software, X.H., Y.Y. and Z.Y.; validation, X.H. and S.L.; investigation, X.H., S.L. and Y.Y.; resources, S.L. and X.H.; writing—original draft preparation, X.H., Y.Y. and Z.Y.; writing—review and editing, S.L.; visualization, X.H., Y.Y. and Z.Y.; project administration, S.L.; funding acquisition, S.L. and X.H. All authors have read and agreed to the published version of the manuscript.

Funding

This research was funded by the Fundamental Research Funds for Zhejiang Provincial Universities and Research Institutes under grant number JX6311041723, and a project from Scientific Research Fund of Zhejiang Provincial Education Department under grant number Y202457275.

Data Availability Statement

The original contributions presented in this study are included in the article. Further inquiries can be directed to the corresponding author.

Conflicts of Interest

The authors declare no conflicts of interest.

References

  1. Akl, S.A.; Metwally, K.G. Optimizing arching creation for Abou Muharik Tunnel in Egypt using numerical analysis. KSCE J. Civ. Eng. 2017, 21, 160–167. [Google Scholar] [CrossRef]
  2. Bi, Z.; Gong, Q.; Guo, P.; Cheng, Q. Experimental study of the evolution of soil arching effect under cyclic loading based on trapdoor test and particle image velocimetry. Can. Geotech. J. 2019, 57, 903–920. [Google Scholar] [CrossRef]
  3. George, T.I.; Dasaka, S.M. Mechanics of arch action in soil arching. Acta Geotech. 2022, 18, 1991–2009. [Google Scholar] [CrossRef]
  4. Khosravi, M.H.; Sarfaraz, H.; Pipatpongsa, T.; Sharifdeljuyi, A. Active Earth Pressure Distribution inside Narrow Backfill Considering Soil-Arching Effect. Int. J. Geomech. 2022, 22, 06022013. [Google Scholar] [CrossRef]
  5. Terzaghi, K. Theoretical Soil Mechanics; John Wiley and Sons: New York, NY, USA, 1943. [Google Scholar]
  6. Khatami, H.; Deng, A.; Jaksa, M. The arching effect in rubber–sand mixtures. Geosynth. Int. 2020, 27, 432–450. [Google Scholar] [CrossRef]
  7. Tangjarusritaratorn, T.; Miyazaki, Y.; Sawamura, Y.; Kishida, K.; Kimura, M. Numerical investigation on arching effect surrounding deep cylindrical shaft during excavation process. Undergr. Space 2022, 7, 944–965. [Google Scholar] [CrossRef]
  8. Khandouzi, G.; Khosravi, M.H. An analytical investigation of soil arching induced by tunneling in sandy ground. Tunn. Undergr. Space Technol. 2023, 140, 105242. [Google Scholar] [CrossRef]
  9. Sadrekarimi, J.; Abbasnejad, A. Arching effect in fine sand due to base yielding. Can. Geotech. J. 2010, 47, 366–374. [Google Scholar] [CrossRef]
  10. Iglesia, G.R.; Einstein, H.H.; Whitman, R.V. Investigation of Soil Arching with Centrifuge Tests. J. Geotech. Geoenviron. Eng. 2014, 140, 04013005. [Google Scholar] [CrossRef]
  11. Franza, A. Tunneling and Its Effects on Piles and Piled Structures. Ph.D. Thesis, University of Nottingham, Nottingham, UK, 2016. [Google Scholar]
  12. Park, J.J.; Cho, I.S.; Lee, I.M.; Lee, S.W. Tunnel reinforcement by using pressure-induced inflatable pipes method. J. Geotech. Geoenviron. Eng. 2012, 138, 1483–1491. [Google Scholar] [CrossRef]
  13. Lee, J.S.; Sagong, M.; Park, J.; Choi, I.Y. Experimental analysis of penetration grouting in umbrella arch method for tunnel reinforcement. Int. J. Rock Mech. Min. Sci. 2020, 130, 104346. [Google Scholar] [CrossRef]
  14. Morovatdar, A.; Palassi, M.; Ashtiani, R.S. Effect of pipe characteristics in umbrella arch method on controlling tunneling-induced settlements in soft grounds. J. Rock Mech. Geotech. Eng. 2020, 12, 984–1000. [Google Scholar] [CrossRef]
  15. He, L.; Zhang, Q. Numerical investigation of arching mechanism to underground excavation in jointed rock mass. Tunn. Undergr. Space Technol. 2015, 50, 54–67. [Google Scholar] [CrossRef]
  16. Li, T.; Zhang, Z.; Luo, M.; Liu, B.; Wang, Y.; Li, L. Analytical Solution of Loosening Pressure Model for Shallow Tunnel Based on Pile-Beam-Arch Method. KSCE J. Civ. Eng. 2022, 26, 3648–3662. [Google Scholar] [CrossRef]
  17. Cui, X.; Li, P.; Wu, J.; Wei, Y. Stability analysis of a shield tunnel in unsaturated soil considering the soil arch effect. Int. J. Geomech. 2024, 24, 04024041. [Google Scholar] [CrossRef]
  18. Huang, X.; Zhang, Z. Stress arch bunch and its formation mechanism in blocky stratified rock masses. J. Rock Mech. Geotech. Eng. 2012, 4, 19–27. [Google Scholar] [CrossRef]
  19. Xia, B.; Zhang, X.; Yu, B.; Jia, J. Weakening effects of hydraulic fracture in hard roof under the influence of stress arch. Int. J. Min. Sci. Technol. 2018, 28, 951–958. [Google Scholar] [CrossRef]
  20. Huang, X.; Ruan, H.; Shi, C.; Kong, Y. Numerical simulation of stress arching effect in horizontally layered jointed rock mass. Symmetry 2021, 13, 1138. [Google Scholar] [CrossRef]
  21. He, J.; Liao, S.; Liu, M.; Sun, J.; Xi, X. The soil arching effect induced by shield tunnelling under asymmetric surface loading. Comput. Geotech. 2023, 154, 105145. [Google Scholar] [CrossRef]
  22. Li, R.; Zhang, D.; Song, Y.; Li, A.; Luo, J. Pressure Arch Effect of Deeply Buried Symmetrically Distributed Triple Tunnels. Symmetry 2023, 15, 673. [Google Scholar] [CrossRef]
  23. Chen, F.; Wang, Y.; Liang, C.; Zhu, Z. Experimental and theoretical study on the stratum cavity collapse induced by water and sand leakage in subway tunnels. Int. J. Geomech. 2024, 24, 04024079. [Google Scholar] [CrossRef]
  24. Fu, H.L.; Zhang, J.B.; Chen, W.; Huang, Z.; Yuan, W. Study on the range of pressure arch of surrounding rock in deeply buried circular karst tunnels. J. Hunan Univ. Nat. Sci. 2008, 45, 117–124. [Google Scholar]
  25. Kong, X.; Liu, Q.; Zhang, Q.; Wu, Y.; Zhao, J. A method to estimate the pressure arch formation above underground excavation in rock mass. Tunn. Undergr. Space Technol. 2018, 71, 382–390. [Google Scholar] [CrossRef]
  26. Zheng, K.; Ding, W.; Jin, W. Formation law of pressure arch in circular tunnel by TBM based on model test and FEM. J. China Coal Soc. 2015, 40, 1270–1275. [Google Scholar]
  27. Yang, J.; Wang, S.; Li, C. Analysis of arching mechanism and evolution characteristics of tunnel pressure arch. Jordan J. Civ. Eng. 2015, 9, 125–132. [Google Scholar]
  28. Huang, Z.; Broch, E.; Lu, M. Cavern roof stability—Mechanism of arching and stabilization by rockbolting. Tunn. Undergr. Space Technol. 2002, 17, 249–261. [Google Scholar] [CrossRef]
  29. Chen, C.N.; Huang, W.Y.; Tseng, C.T. Stress redistribution and ground arch development during tunneling. Tunn. Undergr. Space Technol. 2011, 26, 228–235. [Google Scholar] [CrossRef]
  30. Sun, Z.; Zhang, D.; Xu, T.; Chen, X. Formation estimation and evolution mechanism of the pressure arch for non-circular tunnels under asymmetrical stress field. Sci. China Technol. Sci. 2024, 67, 2919–2938. [Google Scholar] [CrossRef]
  31. Li, W.T.; Su, L.Y.; Yin, X.F.; Wang, K.; Li, Z.; Wang, L.Y.; Mei, Y.C.; Zeng, Z.N. A new evaluating approach for pressure arch stability of the surrounding rock in a shallow-buried rock tunnel. Phys. Fluids 2025, 37, 087202. [Google Scholar] [CrossRef]
  32. Zhang, C.; Ren, Z.; He, J.; Ma, J. Model of overburden pressure arch in mining areas considering thick-hard rock layer and application. China Min. Mag. 2025, 34, 113–124. [Google Scholar] [CrossRef]
  33. Lee, C.; Wu, B.; Chen, H.; Chiang, K. Tunnel stability and arching effects during tunneling in soft clayey soil. Tunn. Undergr. Space Technol. 2006, 21, 119–132. [Google Scholar] [CrossRef]
  34. Kong, X.X.; Liu, Q.S.; Pan, Y.C.; Liu, J.P. Stress redistribution and formation of the pressure arch above underground excavation in rock mass. Eur. J. Environ. Civ. Eng. 2021, 25, 722–736. [Google Scholar] [CrossRef]
  35. Wang, S.; Wu, X.; Zhao, Y.; Hagan, P. Mechanical performances of pressure arch in thick bedrock during shallow coal mining. Geofluids 2018, 2018, 2419659. [Google Scholar] [CrossRef]
  36. Qiu, S.; Han, Y.; Wang, B.; Nie, X.; Zhang, Z.; He, J.; Lyu, L.; Wang, X.; Tang, K. Calculation method of shield tunnel displacement in the case of pit excavation and in-tunnel loading. China Min. Mag. 2024, 33, 179–185. [Google Scholar]
  37. An, F.H.; Cheng, Y.P.; Wang, L.; Li, W. A numerical model for outburst including the effect of adsorbed gas on coal deformation and mechanical properties. Comput. Geotech. 2013, 54, 222–231. [Google Scholar] [CrossRef]
  38. Zhao, Y.; Wang, S.; Hagan, P.C.; Guo, W. Evolution characteristics of pressure-arch and elastic energy during shallow horizontal coal mining. Teh. Vjesn.-Tech. Gaz. 2018, 25, 867–875. [Google Scholar] [CrossRef]
  39. Lin, X.T.; Chen, R.P.; Wu, H.N.; Meng, F.Y.; Su, D.; Han, K. Calculation of earth pressure distribution on the deep circular tunnel considering stress-transfer mechanisms in different zones. Tunn. Undergr. Space Technol. 2022, 119, 104211. [Google Scholar] [CrossRef]
  40. Wu, J.H.; Ohnishi, Y.; Nishiyama, S. Simulation of the mechanical behavior of inclined jointed rock masses during tunnel construction using Discontinuous Deformation Analysis (DDA). Int. J. Rock Mech. Min. Sci. 2004, 41, 731–743. [Google Scholar] [CrossRef]
  41. Shariatmadari, N.; Mahdi, M. Back analysis of Tehran Metro Tunnel construction using FLAC-3D. In Proceedings of the International Geotechnical Conference, Moscow, Russia, 7–10 June 2010; pp. 97–106. [Google Scholar]
  42. Tang, Z.; Wu, Z.; Jia, D.; Lv, J. The distribution law of ground stress field in Yingcheng Coal Mine based on Rhino surface modeling. Processes 2024, 12, 668. [Google Scholar] [CrossRef]
  43. Huang, X.; Jin, J.; Tong, Y.; Mei, G. Evolution of 3D stress arch in surrounding rock during segmented excavation of a circular tunnel. Geotech. Geol. Eng. 2025, 43. [Google Scholar] [CrossRef]
  44. Li, K. Pressure Arch Theory Study of Horizontal Bedded Tunnel Surrounding Rock. Ph.D. Thesis, Southwest Jiaotong University, Chengdu, China, 2010. [Google Scholar]
  45. Lv, Y.; Liang, G.; Lu, L.; Lin, S.; Wu, X.C.; Li, D. Analytical study on the pressure arch range of surrounding rock in circular tunnel. West China Explor. Eng. 2022, 28, 165–169. [Google Scholar]
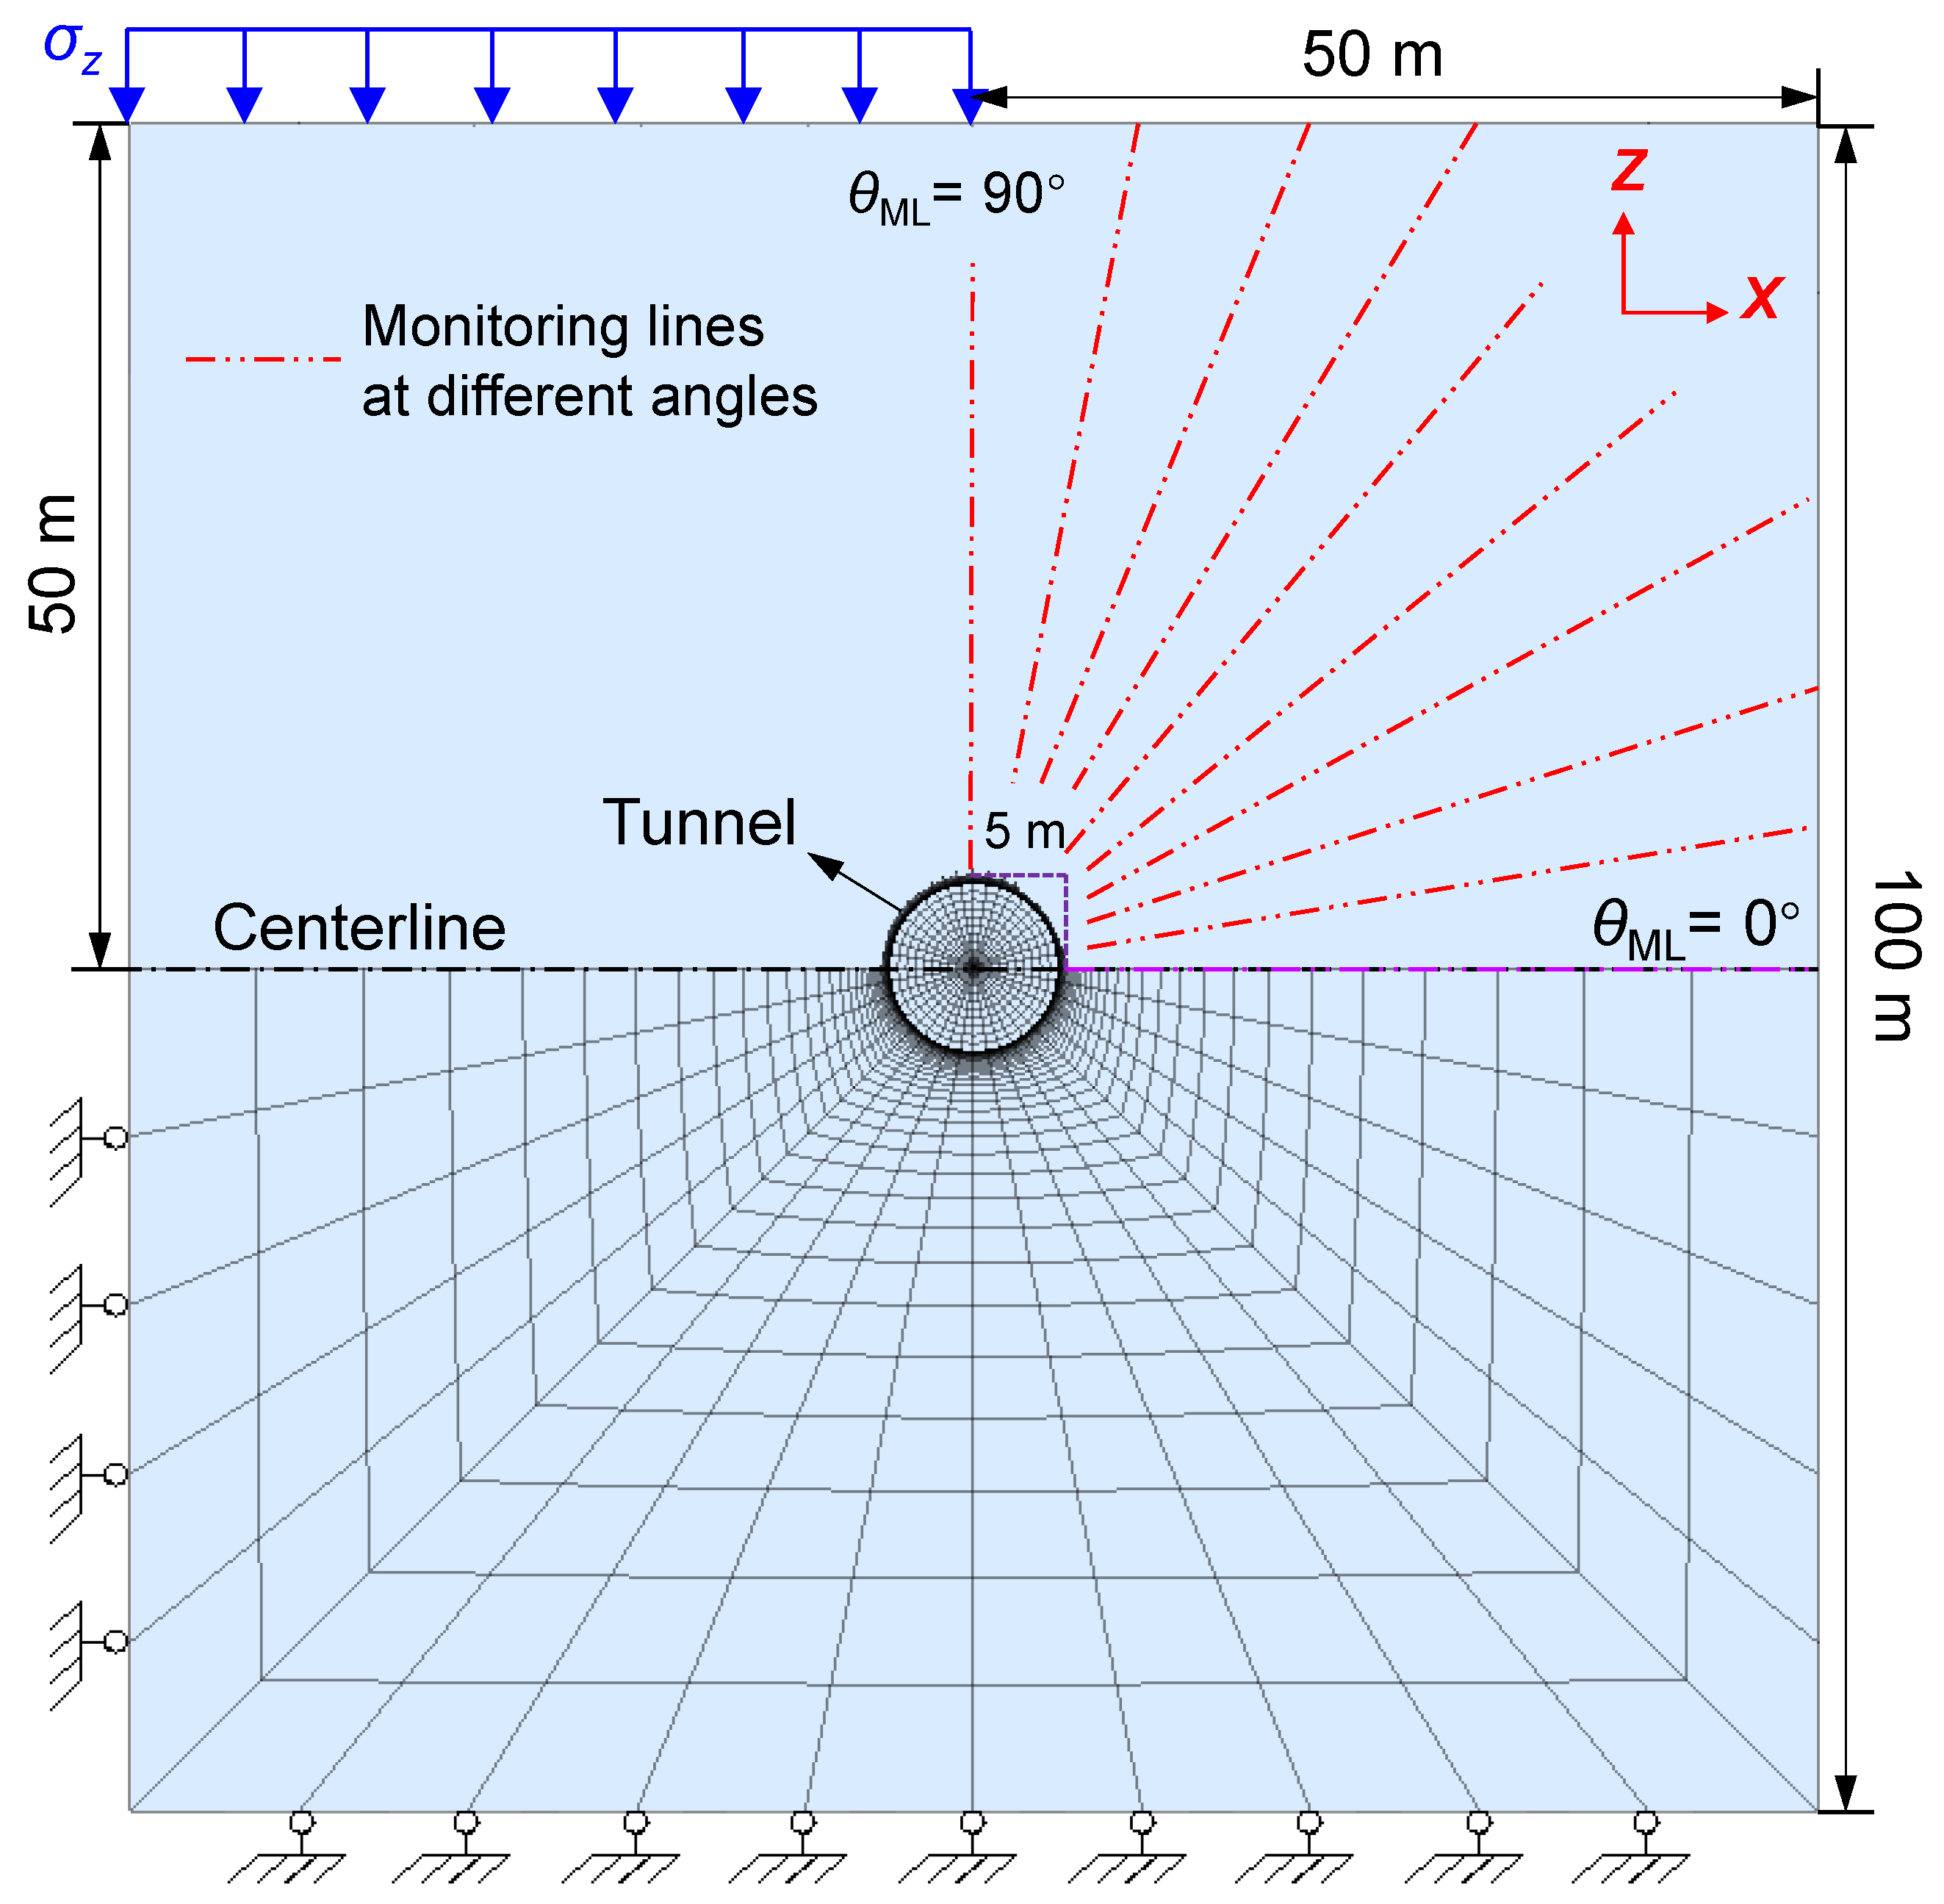
Figure 1. Computational model and monitoring lines for the target tunnel.
Applsci 15 10990 g001
Figure 2. Contours of principal stress distribution and EDD of the surrounding rock in the tunnel (Case A1).
Applsci 15 10990 g002
Figure 3. Energy field and bearing zones of tunnel-surrounding rock ( λ < 1 ): (a) distribution of EDD in the surrounding rock (Case A1); (b) load-bearing partition of surrounding rock.
Applsci 15 10990 g003
Figure 4. The EDDs of tunnel-surrounding rock along different monitoring paths (Case A1).
Applsci 15 10990 g004
Figure 5. The ranges of tunnel roof pressure arch zones for different tunnel spans.
Applsci 15 10990 g005
Figure 6. Tunnel pressure arch zones for different internal friction angles of surrounding rock: (a) the EDDs of tunnel-surrounding rock along different monitoring paths (Case B2); (b) the pressure arch ranges for Series B.
Applsci 15 10990 g006
Figure 7. Energy field and bearing zones of tunnel-surrounding rock ( λ > 1 ): (a) distribution of EDD in the surrounding rock (Case C4); (b) load-bearing partition of surrounding rock.
Applsci 15 10990 g007
Figure 8. The EDDs of tunnel-surrounding rock along different monitoring paths in Series C: (a) Case C1; (b) Case C2; (c) Case C3; (d) Case C4; (e) Case C5; (f) Case C6.
Applsci 15 10990 g008
Figure 9. The ranges of tunnel pressure arch zones for different lateral pressure coefficients.
Applsci 15 10990 g009
Figure 10. Comparison results with the pressure arch determination method based on tangential stress of surrounding rock.
Applsci 15 10990 g010
Figure 11. Comparison results with the pressure arch discrimination method based on inflection points of principal stress–depth curves.
Applsci 15 10990 g011
Figure 12. Comparison results with the pressure arch discrimination method based on vertical stress contours in surrounding rock.
Applsci 15 10990 g012
Table 1. Tunnel model parameters for numerical evaluations.
SeriesCaseD (m) ϕ (°) λ
AA110300.5
A212
A314
A416
A518
A620
BB110200.5
B225
B330
B435
B540
B645
CC110300.5
C20.8
C31.0
C41.5
C52.0
C62.5
Disclaimer/Publisher’s Note: The statements, opinions and data contained in all publications are solely those of the individual author(s) and contributor(s) and not of MDPI and/or the editor(s). MDPI and/or the editor(s) disclaim responsibility for any injury to people or property resulting from any ideas, methods, instructions or products referred to in the content.