1. Introduction
Wind energy represents a rapidly growing source of renewable energy, having demonstrated significant global expansion over the past few decades. Data from the International Renewable Energy Agency (IRENA) indicate that global wind power capacity increased from 23,900 MW in 2001 to 539,581 MW by 2017. Concurrently, since 2008, the annual costs associated with wind energy have decreased by approximately 40% [
1].
In recent years, technological advancements have significantly improved the performance of wind turbines, with horizontal-axis wind turbines (HAWTs) emerging as the predominant commercial option. Nonetheless, vertical-axis wind turbines (VAWTs) have garnered increasing interest due to their adaptability to both urban and rural environments across a wide range of wind conditions [
2]. Among VAWT designs, the Darrieus type stands out, offering advantages such as lower maintenance requirements and enhanced structural durability. However, they also present several limitations, including difficulties with self-starting, dynamic stall behavior, and fluctuations in the angle of attack, all of which can affect their operational efficiency [
3,
4].
Over the years, a variety of aerodynamic models have been developed, with the Double-Multiple Streamtube (DMST) model emerging as a fundamental tool for simulating the aerodynamics of vertical-axis wind turbines (VAWTs) [
5,
6,
7]. The DMST model combines blade element theory with actuator disk theory to provide a detailed representation of flow dynamics and induction distribution around the rotor [
8,
9]. In the academic literature, this model is frequently referenced for evaluating the performance of VAWTs across a range of geometric configurations and operational conditions. Notably, it has been employed to investigate the influence of blade flexibility [
10,
11], analyze the effects of flow expansion and dynamic stall [
12], and perform multi-objective design optimizations of curved rotors [
13].
The accuracy of the DMST model heavily depends on the aerodynamic coefficients (specifically, lift and drag) as well as the airfoil geometries used. Traditionally, these coefficients are obtained from CFD simulations or wind-tunnel experiments, both of which are costly and limited to specific conditions. In [
14], a bidimensional interpolation algorithm based on the angle of attack and the Reynolds number was proposed to obtain aerodynamic coefficients. However, if the simulation or experimental data exceed the interpolation range, the algorithm becomes non-functional, resulting in inaccurate aerodynamic coefficients. In contrast, artificial neural networks (ANNs) have been explored as efficient and reliable alternatives [
15,
16,
17,
18] for predicting aerodynamic coefficients across a wider operating range. Recent studies suggest that multilayer perceptron (MLP) networks can accurately predict lift and drag coefficients using inputs such as the angle of attack and the Reynolds number [
19].
This paper presents a mathematical model of a vertical-axis wind turbine (VAWT) with a variable-pitch angle, developed within the Double-Multiple Streamtube (DMST) framework. The model incorporates aerodynamic coefficients predicted by a multi-input, two-output multilayer perceptron (MLP) neural network, specifically for lift and drag. The network is trained to estimate these coefficients based on the angle of attack and Reynolds number of the selected airfoil. This approach enables the efficient integration of aerodynamic data into the DMST model, thereby enhancing its applicability under a wide range of operating conditions.
Two numerical simulations were conducted to validate the proposed model, each utilizing step and sinusoidal wind input profiles. These simulations were complemented by experimental tests performed on a VAWT prototype equipped with a variable-pitch angle. The results revealed a strong correlation between the simulation outputs and the experimental data, thereby confirming the reliability and effectiveness of the proposed approach.
This study advances the modeling of vertical-axis wind turbines (VAWTs) by integrating artificial intelligence with traditional analytical methods. The main contribution of this work is the development and experimental validation of a hybrid DMST–MLP framework for VAWTs with variable-pitch angles, which enhances aerodynamic analysis and expands design and control possibilities for unconventional wind turbine systems.
2. Mathematical Modeling
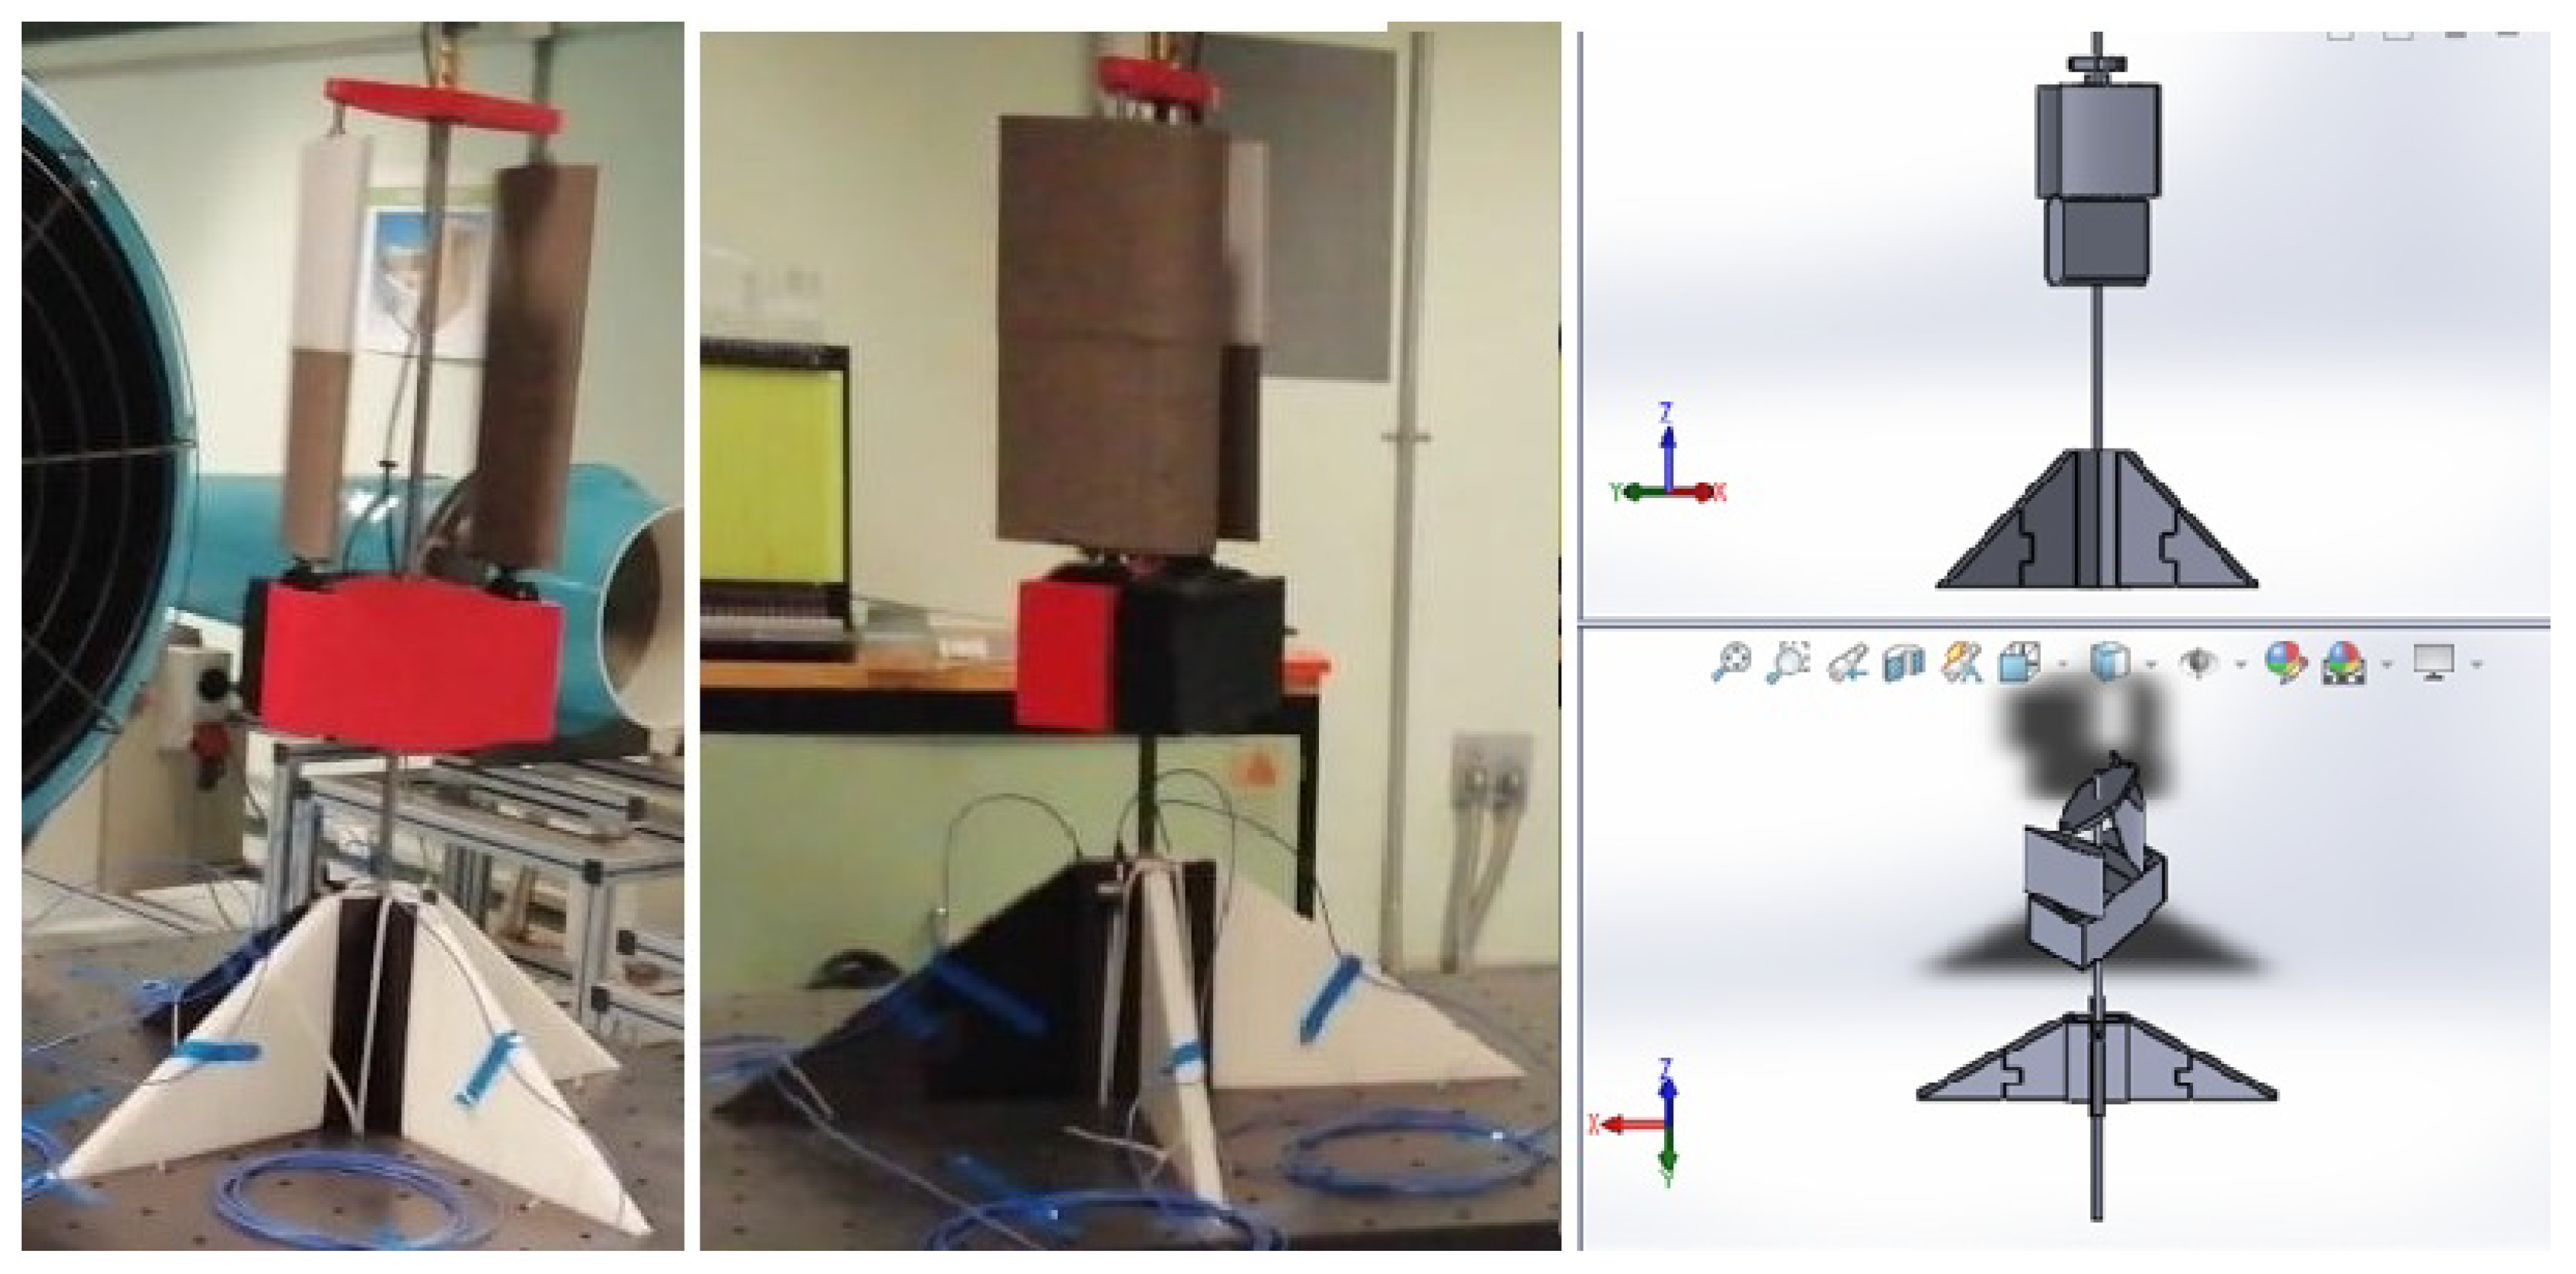
Figure 1 shows the scaled prototype of the vertical-axis wind turbine (VAWT) analyzed in this study. The turbine consists of two straight blades mounted symmetrically around the central shaft and equipped with a variable-pitch mechanism actuated by servomotors. The operational principle of the system is based on adjusting the pitch angle of each blade in response to the instantaneous wind direction and velocity. By actively controlling the pitch, the blades increase lift and reduce drag during the upwind portion of the rotation while minimizing negative torque contributions in the downwind region. This dynamic adjustment enhances energy-capture efficiency and improves the aerodynamic stability of the rotor under both steady and unsteady wind inflow conditions. The integration of this variable-pitch mechanism provides a robust framework for evaluating the turbine’s aerodynamic performance across a wide range of operating conditions.
Various mathematical models have been suggested to characterize both the static and dynamic performance of a vertical wind turbine. Typically, these models incorporate elements from fields like aeronautics, mechanics, and electrical engineering.
This section develops a mathematical model to forecast the performance and behavior of a vertical-axis wind turbine under both steady-state and transient conditions. The principal factors for modeling are aerodynamics and mechanics.
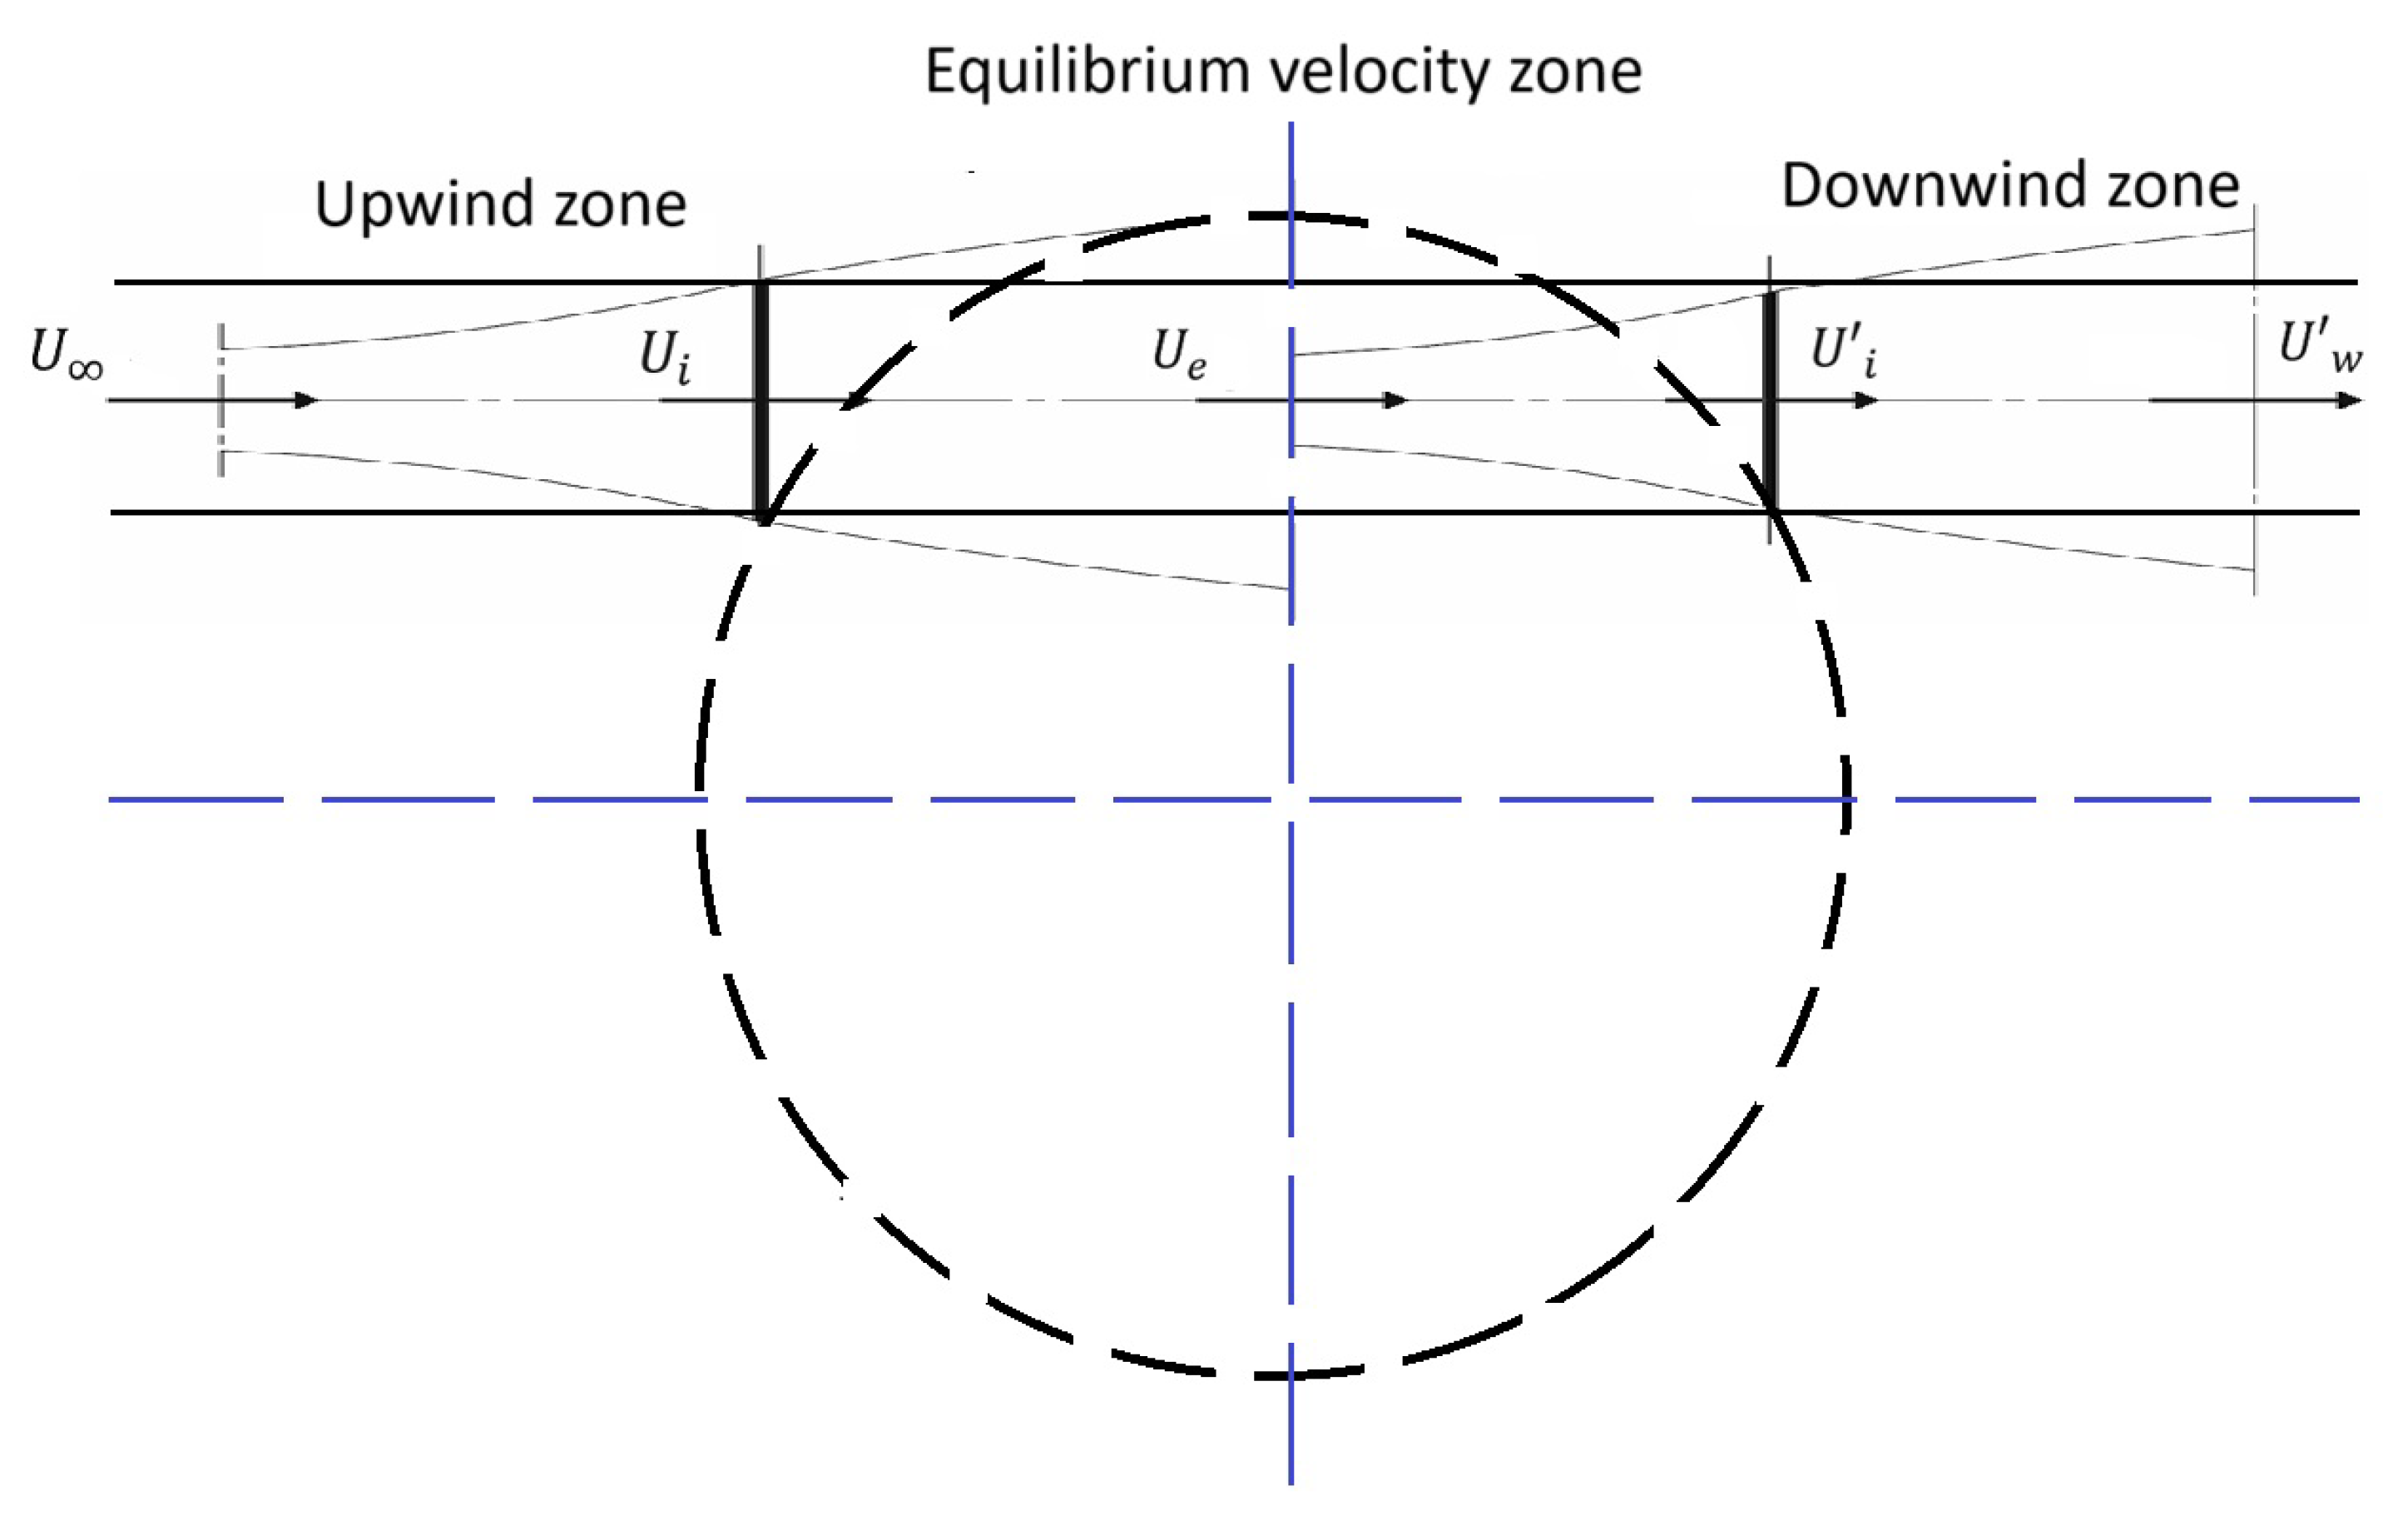
In [
20,
21,
22,
23,
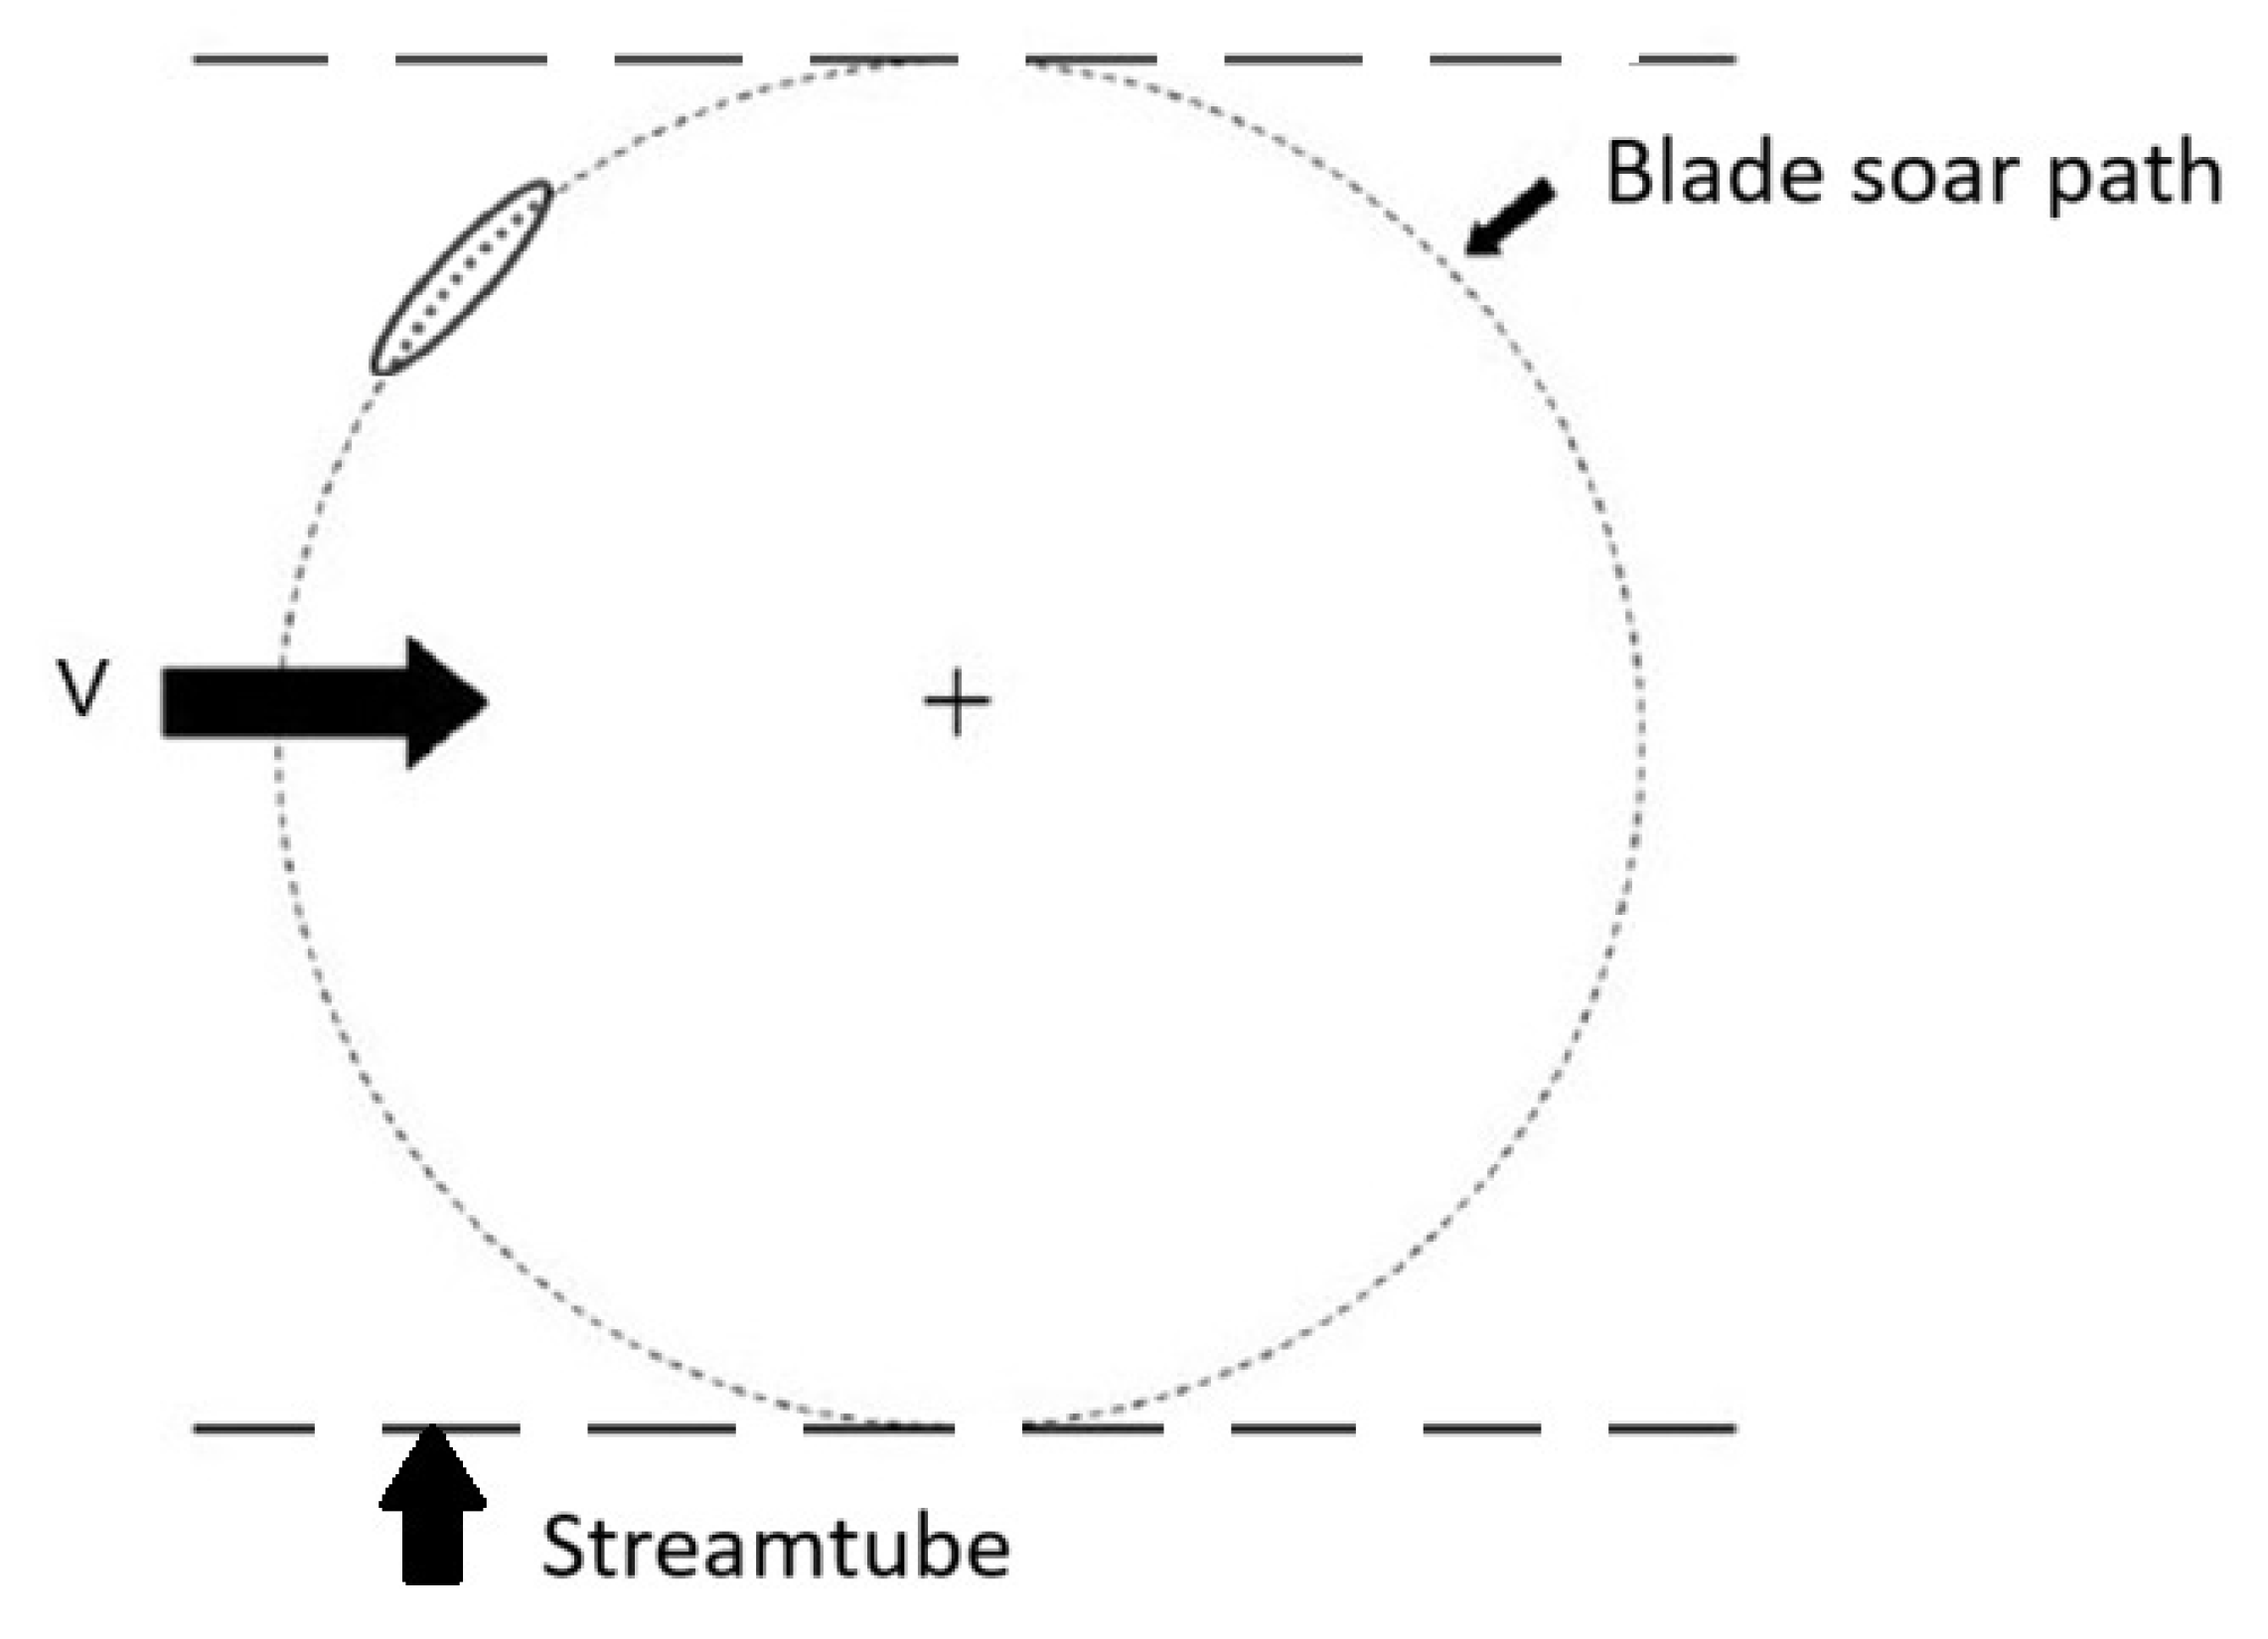
24], a mathematical model for vertical-axis wind turbines (VAWTs), known as the Double-Multiple Streamtube (DMST) model, was presented. The model was built upon two approaches: (1) the two-actuator disk model, which divides the turbine’s influence region into three distinct zones (
Figure 2): a high-velocity zone (upwind), an equilibrium-velocity zone, and a low-velocity zone (downwind); and (2) the single streamtube model, which assumes a uniform wind speed
across the rotor, as it considers a single streamtube (
Figure 3).
2.1. Double-Multiple Streamtube Model
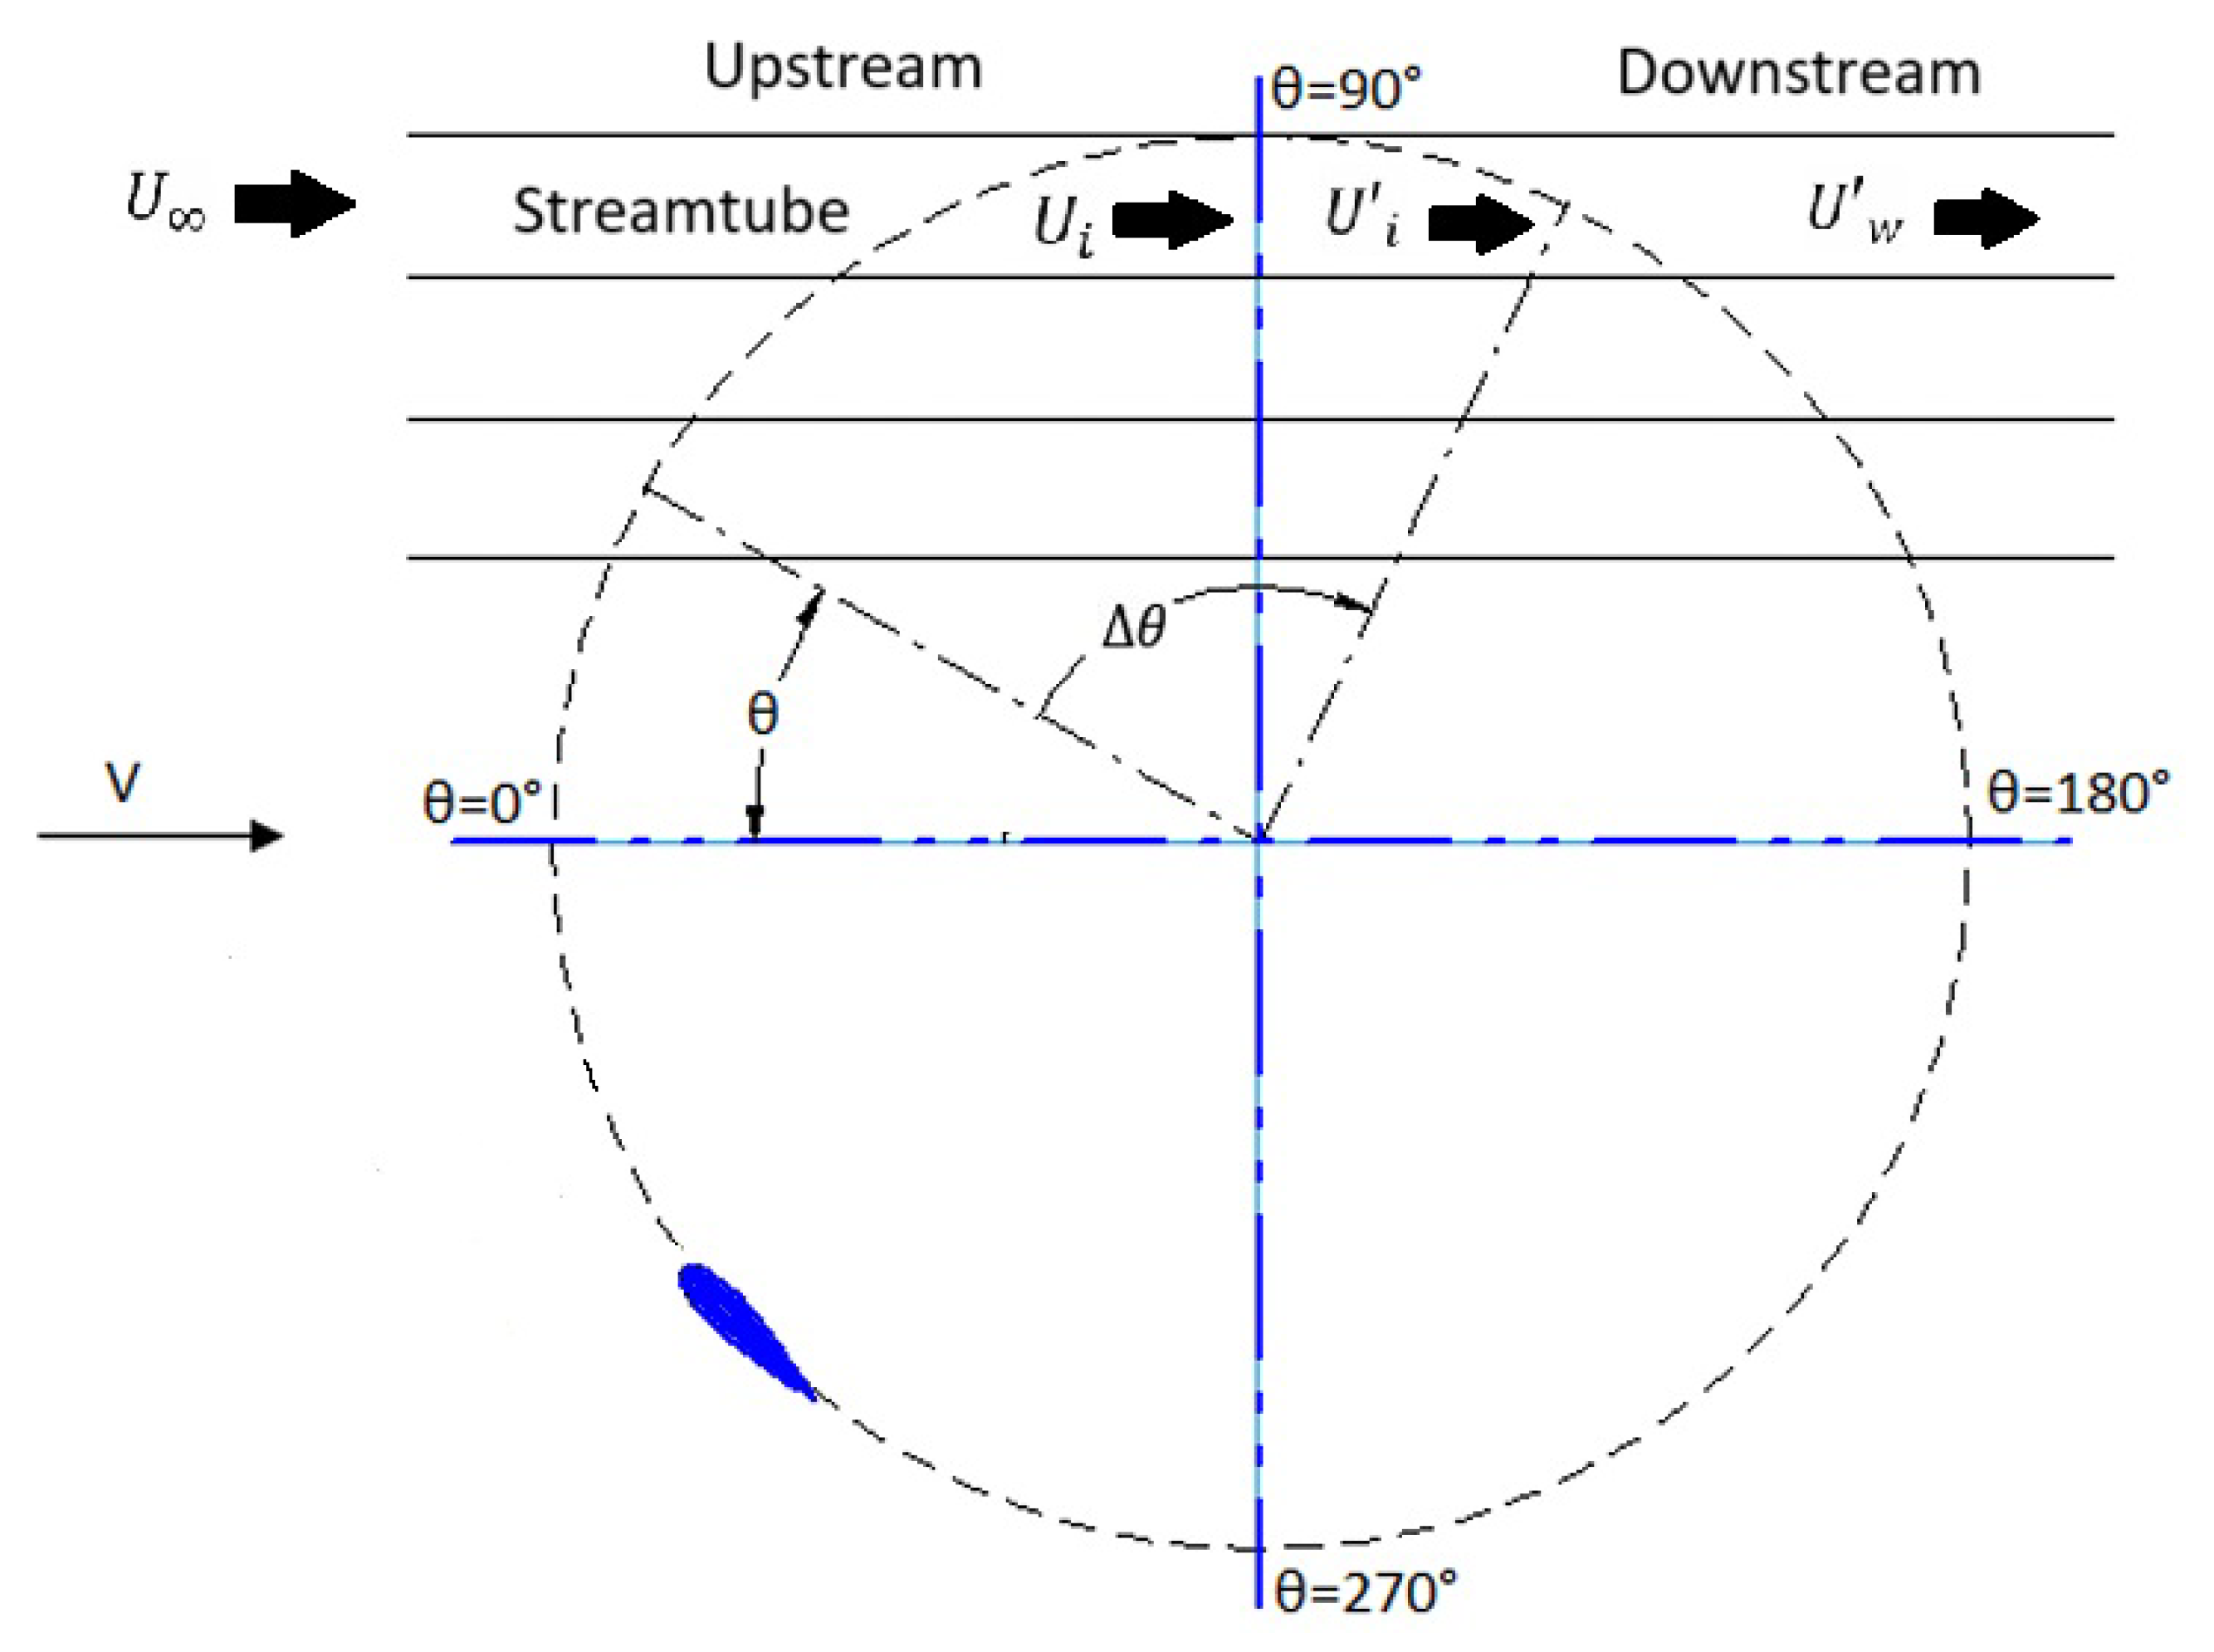
The DMST model incorporates multiple streamtubes within the rotor swept area, each characterized by its own induction velocity. As a result, the aerodynamic behavior is computed individually for each streamtube (
Figure 4).
The equations from [
11,
25,
26,
27,
28] were employed to calculate the mean turbine torque by analyzing multiple streamtubes aligned with the wind direction within the turbine’s influence region.
The first region (upwind zone) is affected by the free-stream air velocity
. This flow generates an induced velocity
, which is calculated using Equation (
1), where
represents the upstream interference factor (Equation (
2)), obtained through an iterative process applied to the upwind flow conditions,
(Equation (
3)).
The upwind flow conditions can be described using both blade element theory and the momentum equation as follows, where
N is the number of blades,
c is the blade chord,
R is the rotor radius, and
and
are the normal and tangential force coefficients:
Equation (
4) defines the equilibrium region located between the high- and low-velocity zones (second region):
Equation (
5) characterizes the induced velocity
in the third region, which results from the equilibrium velocity
. Here,
denotes the induction factor associated with the low-velocity region, obtained by iterating the downwind flow conditions at the actuator disk,
:
At each azimuthal position
, the normal force
, tangential force
, and output torque
are computed from the resultant of the normal and tangential components of the lift and drag forces. These components are subsequently used to define the tangential force coefficient
and the normal force coefficient
:
where
is the air density,
c is the blade chord,
L is the blade length,
W is the relative wind speed, and
is the angle of attack. In
Section 2.2, the aerodynamic coefficients
and
, representing lift and drag, respectively, are computed.
The blade’s angle of attack
, defined by Equation (
13), is used to determine the local angle of attack at each position along the blade:
where
is the initial angle of attack,
is the tip-speed ratio (Equation (
14)), and
X is the local tip-speed ratio (Equation (
15)), with
as the angular speed and
as the induced velocity.
The torque (
) generated by a blade is calculated by combining the lift and torque equations (Equation (
10)). Therefore, the average torque values for the upwind region
and the downwind region
can be computed using the following equations:
The numerical model developed in this study builds upon the static vertical-axis wind turbine model presented in [
14], extending it by incorporating a dynamic component, as described in
Section 2.3.
2.2. Aerodynamic Coefficients ( and )
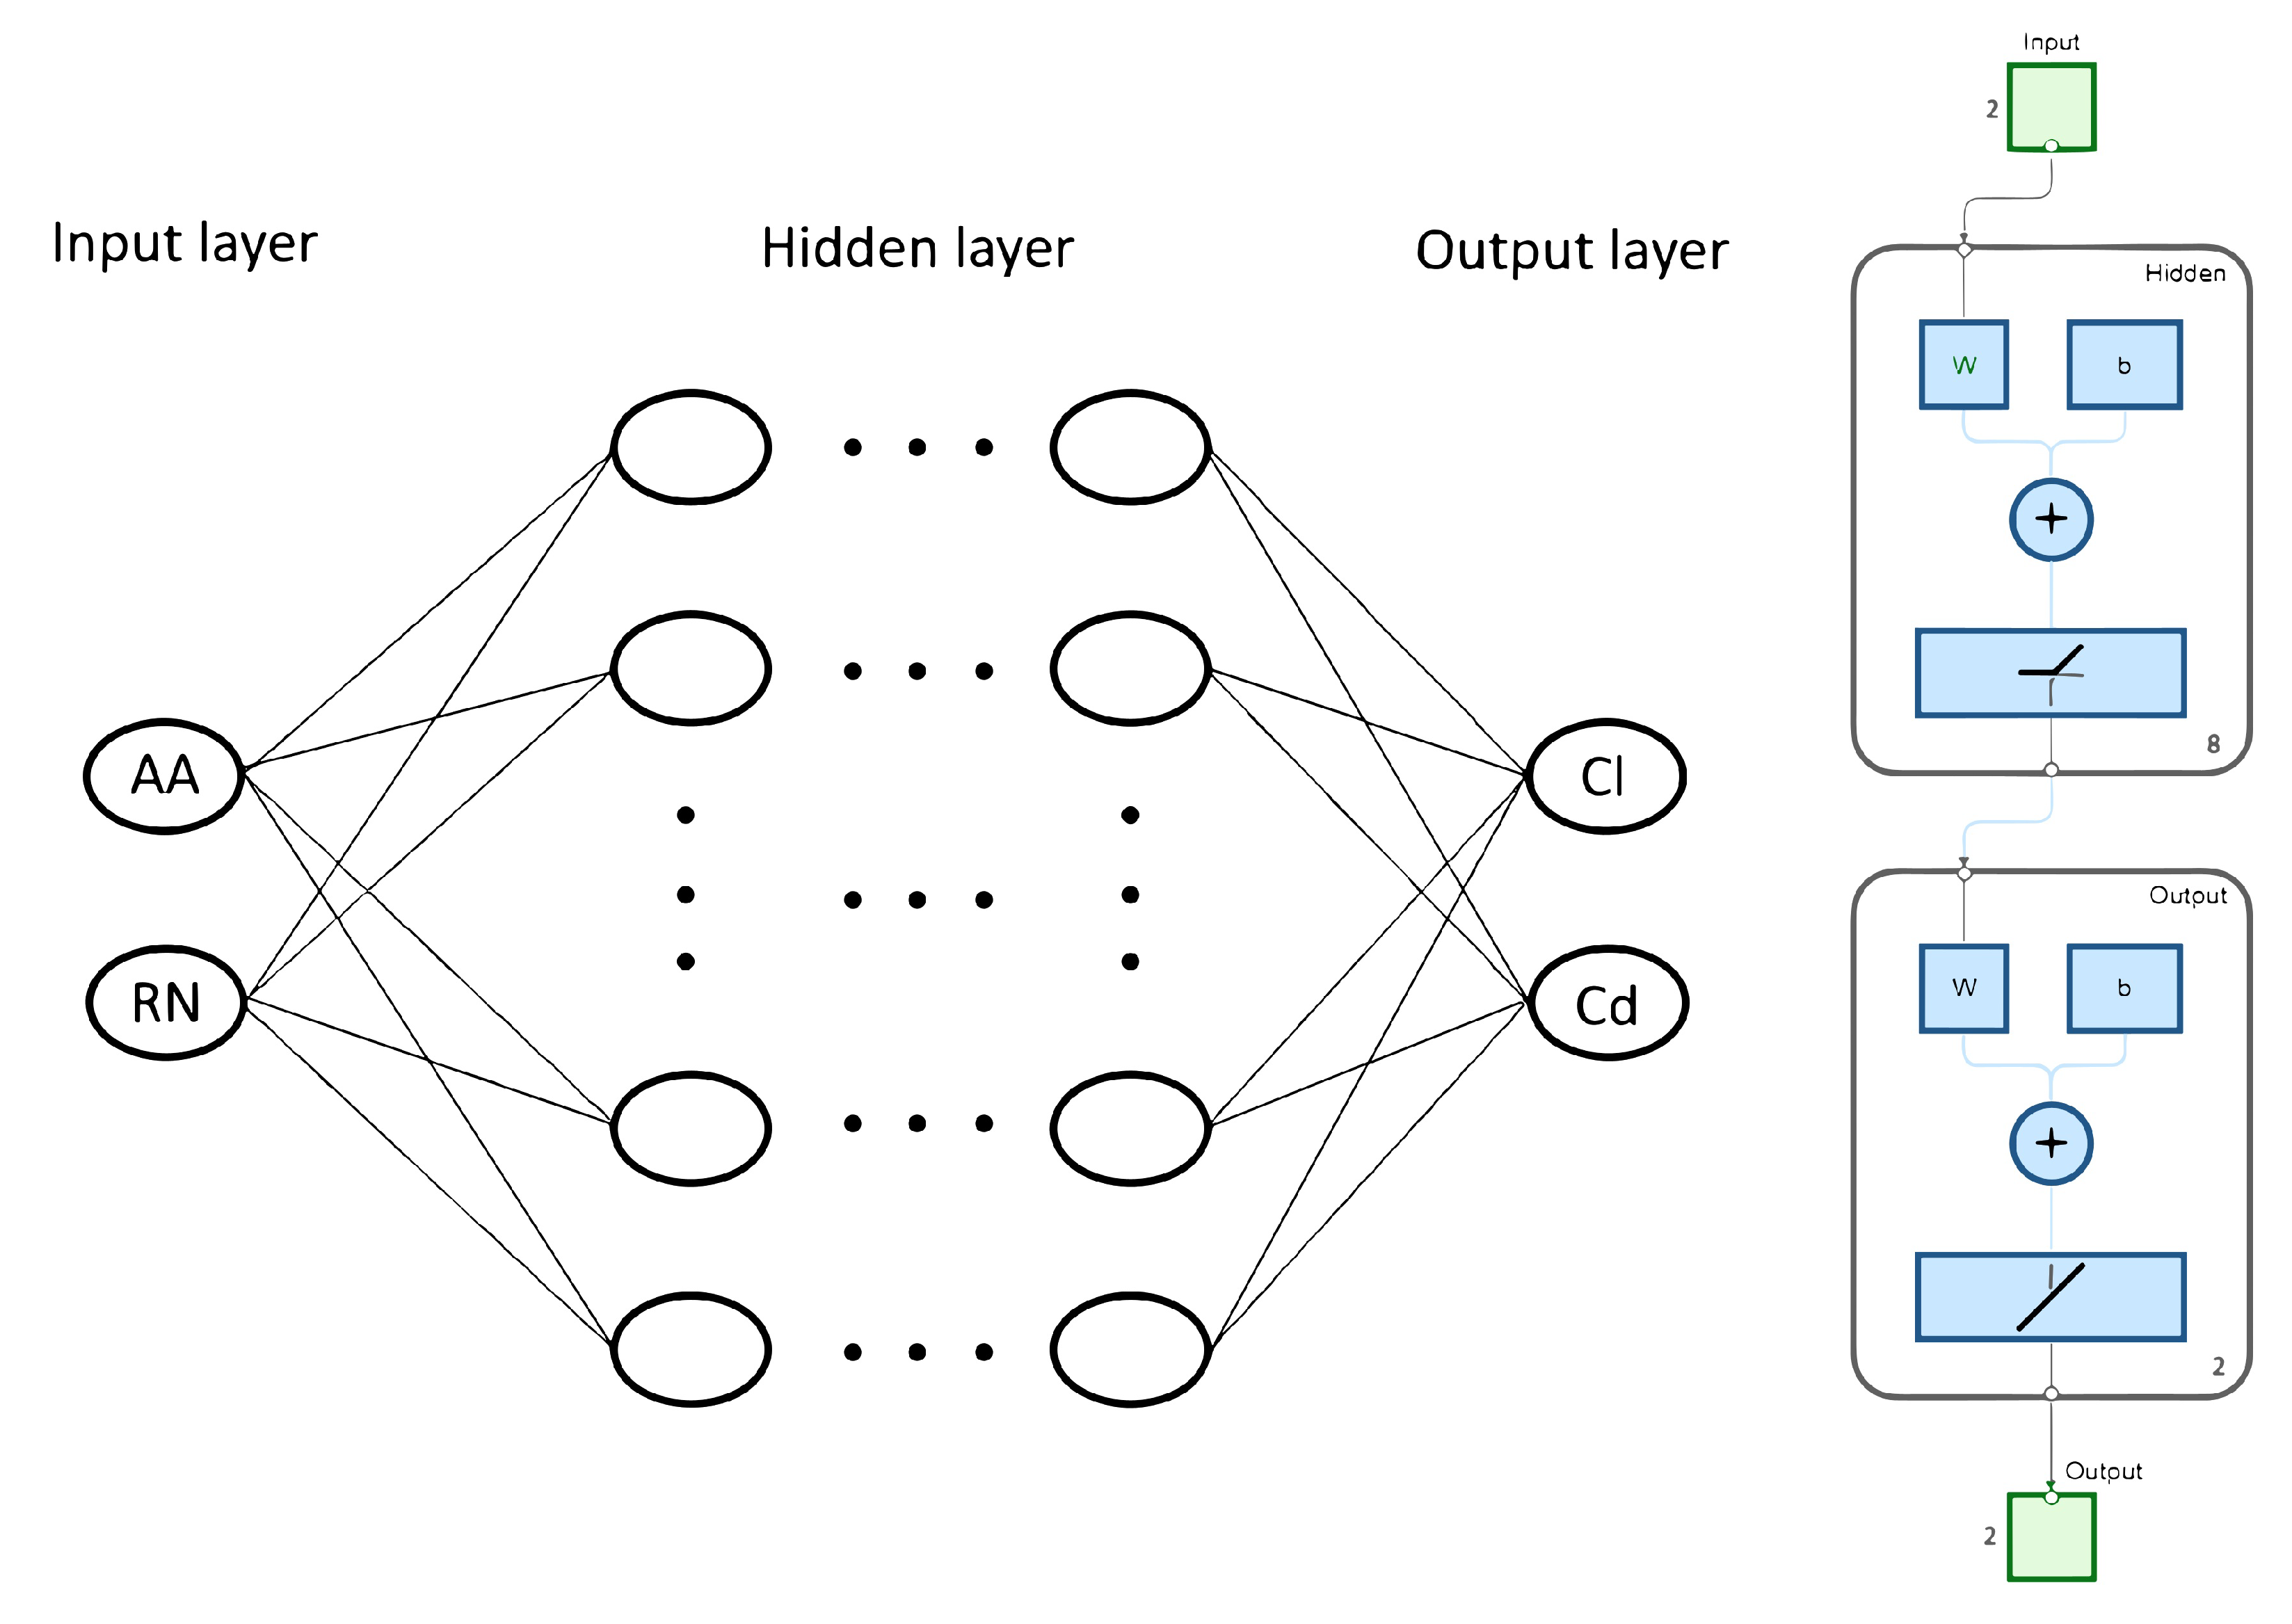
The aerodynamic coefficients required by the DMST model were estimated through a multilayer perceptron artificial neural network (MLP–ANN). The network was trained with the angle of attack (
) and the Reynolds number (
) as input features and was designed to predict the lift (
) and drag (
) coefficients as output variables (
Figure 5).
The dataset, generated from CFD simulations and complemented by experimental data obtained from measurements conducted by Sandia Laboratories [
29], encompassed a wide range of angle-of-attack (
) and Reynolds number (
) values. Data were standardized and partitioned into training, validation, and test sets. The neural network architecture, training configuration, and error metrics are summarized in
Table 1.
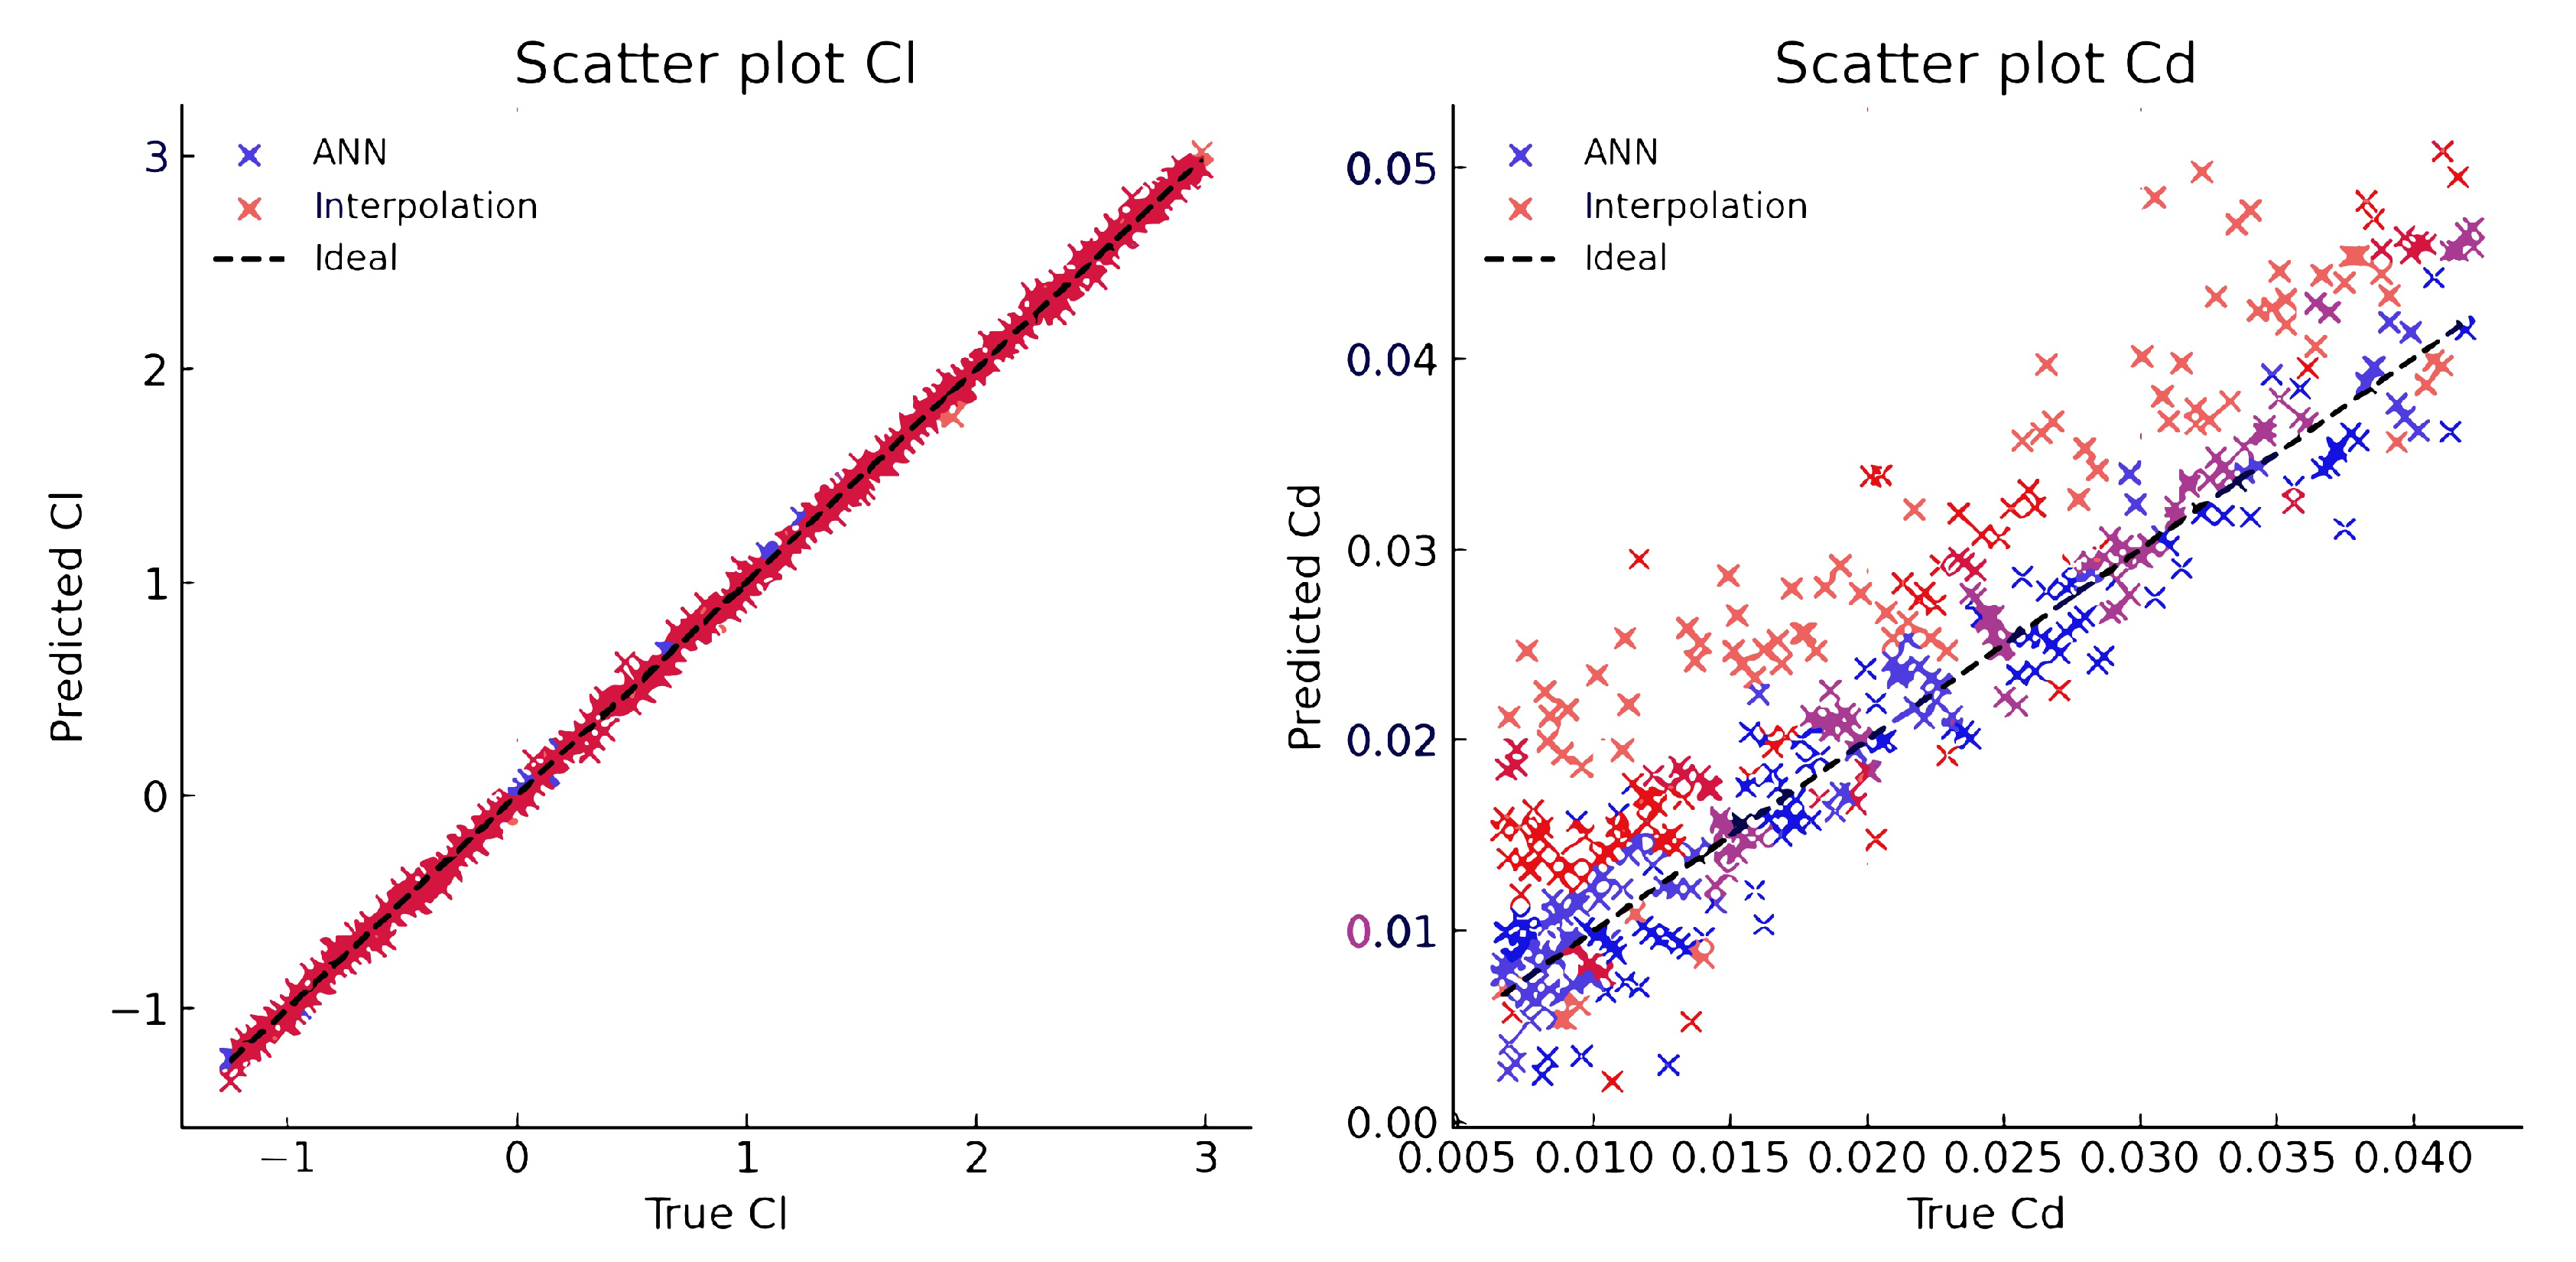
The ANN achieved high predictive accuracy, with relative errors ranging from 1 to 5% for and 5 to 10% for , the latter being more sensitive due to its smaller magnitude. The root-mean-square error (RMSE) values ranged from 0.01 to 0.05 for and 0.001 to 0.02 for . The performance of the ANN was compared with interpolation using scatter plots and error trend analyses across the full range of angle-of-attack values.
Figure 6 shows the predicted versus reference values for both
and
. The ANN predictions align closely with the ideal identity line, while interpolation shows larger deviations, particularly for the drag coefficient (
) due to its smaller magnitude and greater sensitivity.
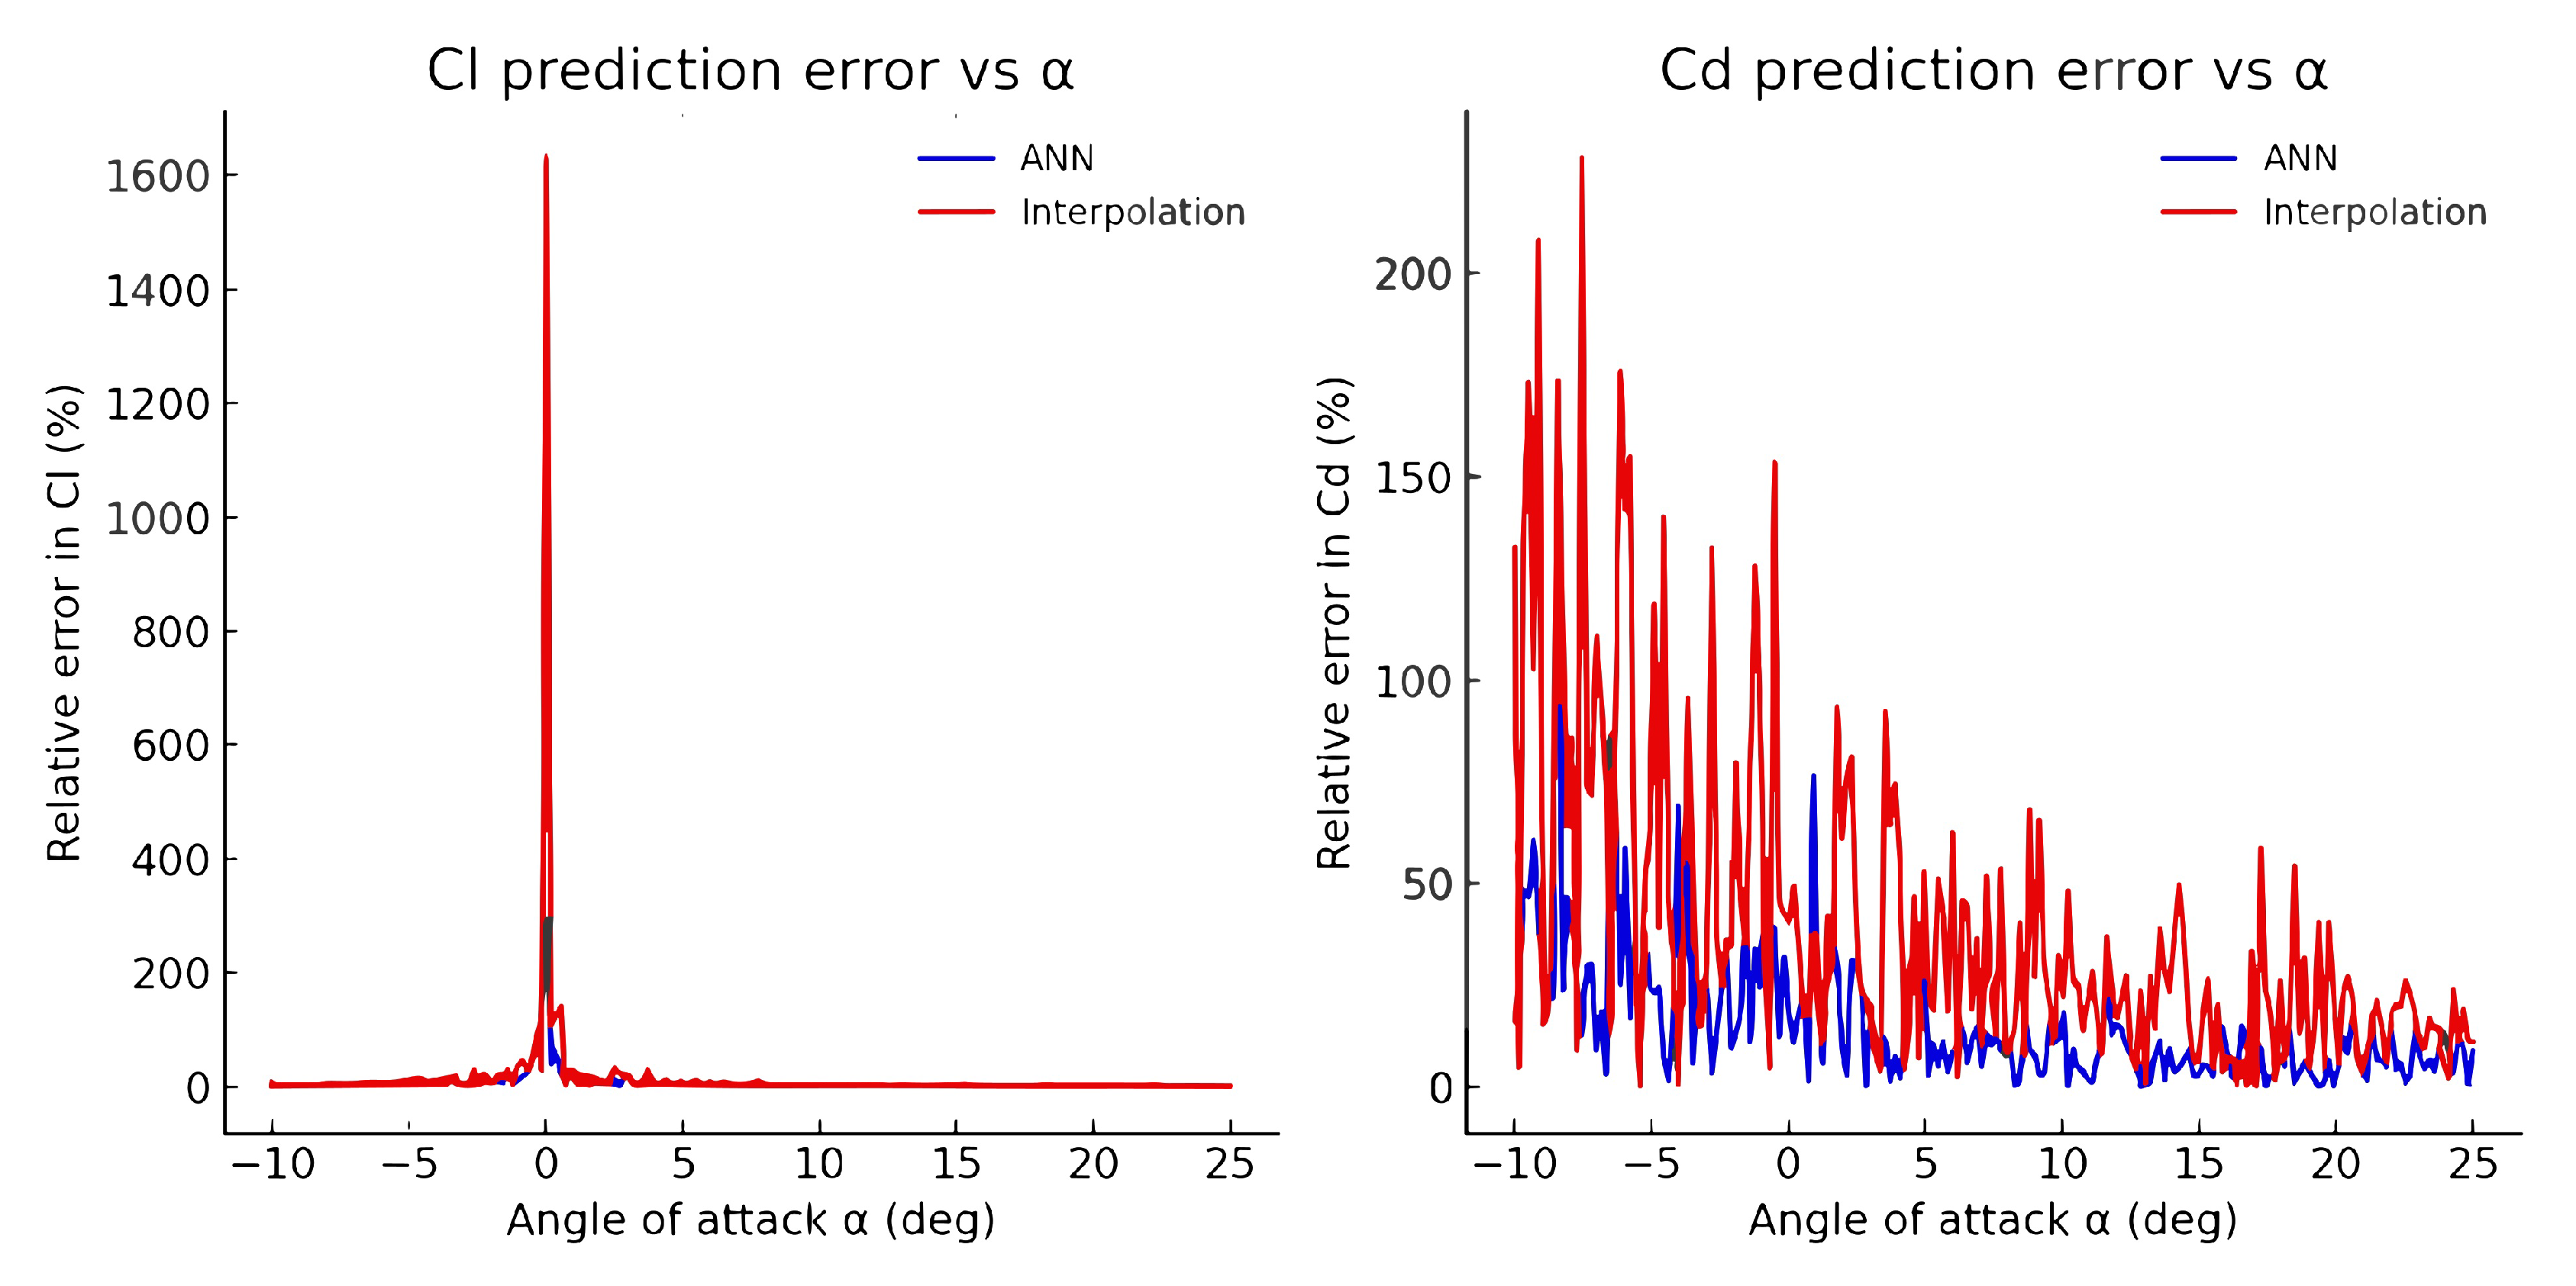
Figure 7 shows the relative error distributions as a function of the angle of attack. The ANN consistently maintains errors below approximately 5% for
and 10% for
, with stable performance across the entire domain. By contrast, interpolation shows greater variability and significantly larger errors near the extremes of
, where extrapolation effects dominate.
Compared with interpolation, the ANN demonstrated superior robustness, particularly beyond the interpolation domain. This facilitated reliable aerodynamic predictions, enabling the determination of the tangential and normal force coefficients at each angular position.
2.3. Dynamic Model
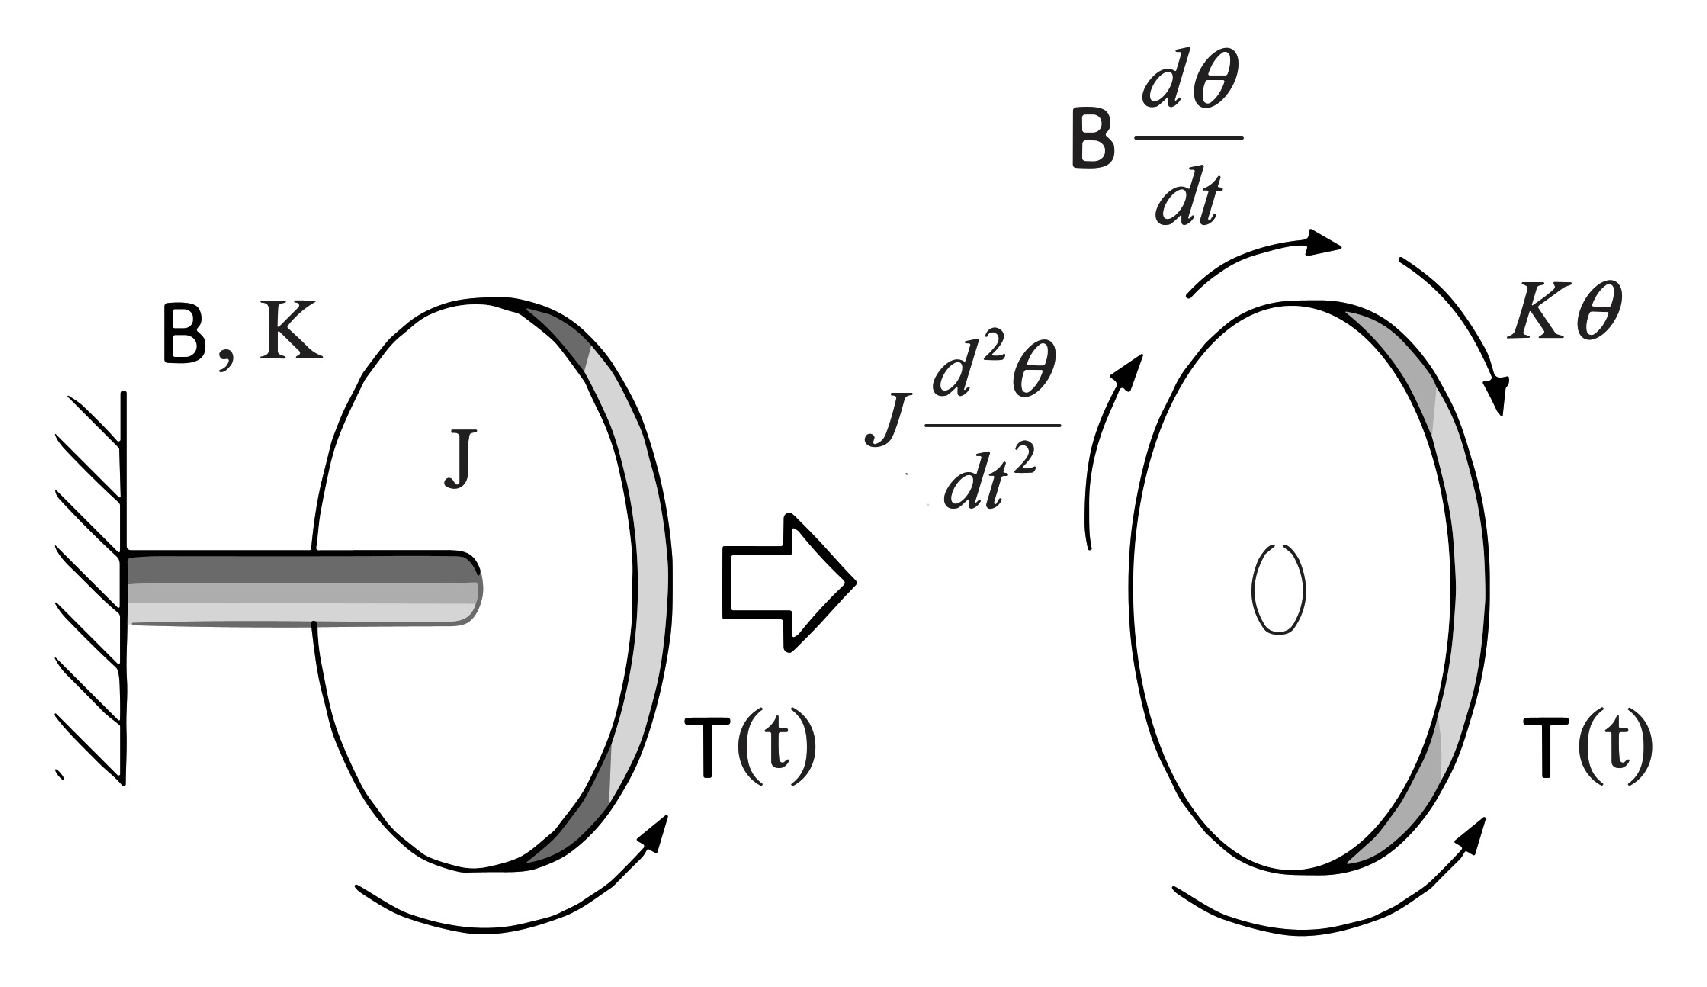
Consider the rotational system [
20,
22] shown in
Figure 8, with a disk with a moment of inertia
J mounted on a shaft. The damping due to viscous friction between the interacting surfaces is denoted as
B, while the shaft torsional spring constant (stiffness) is represented by
K.
The torque
T of the disk is expressed by the following equation, where
,
, and
denote the angular position, angular velocity, and angular acceleration, respectively:
The configuration of the rotational mechanical system is analogous to that of the wind turbine system and is modeled using the same approach. The difference lies in the fact that stiffness is considered negligible and is therefore omitted.
A second-order dynamic model, incorporating rotational inertia and viscous friction, is introduced. This model is employed to analyze both high-speed and low-speed operational regimes.
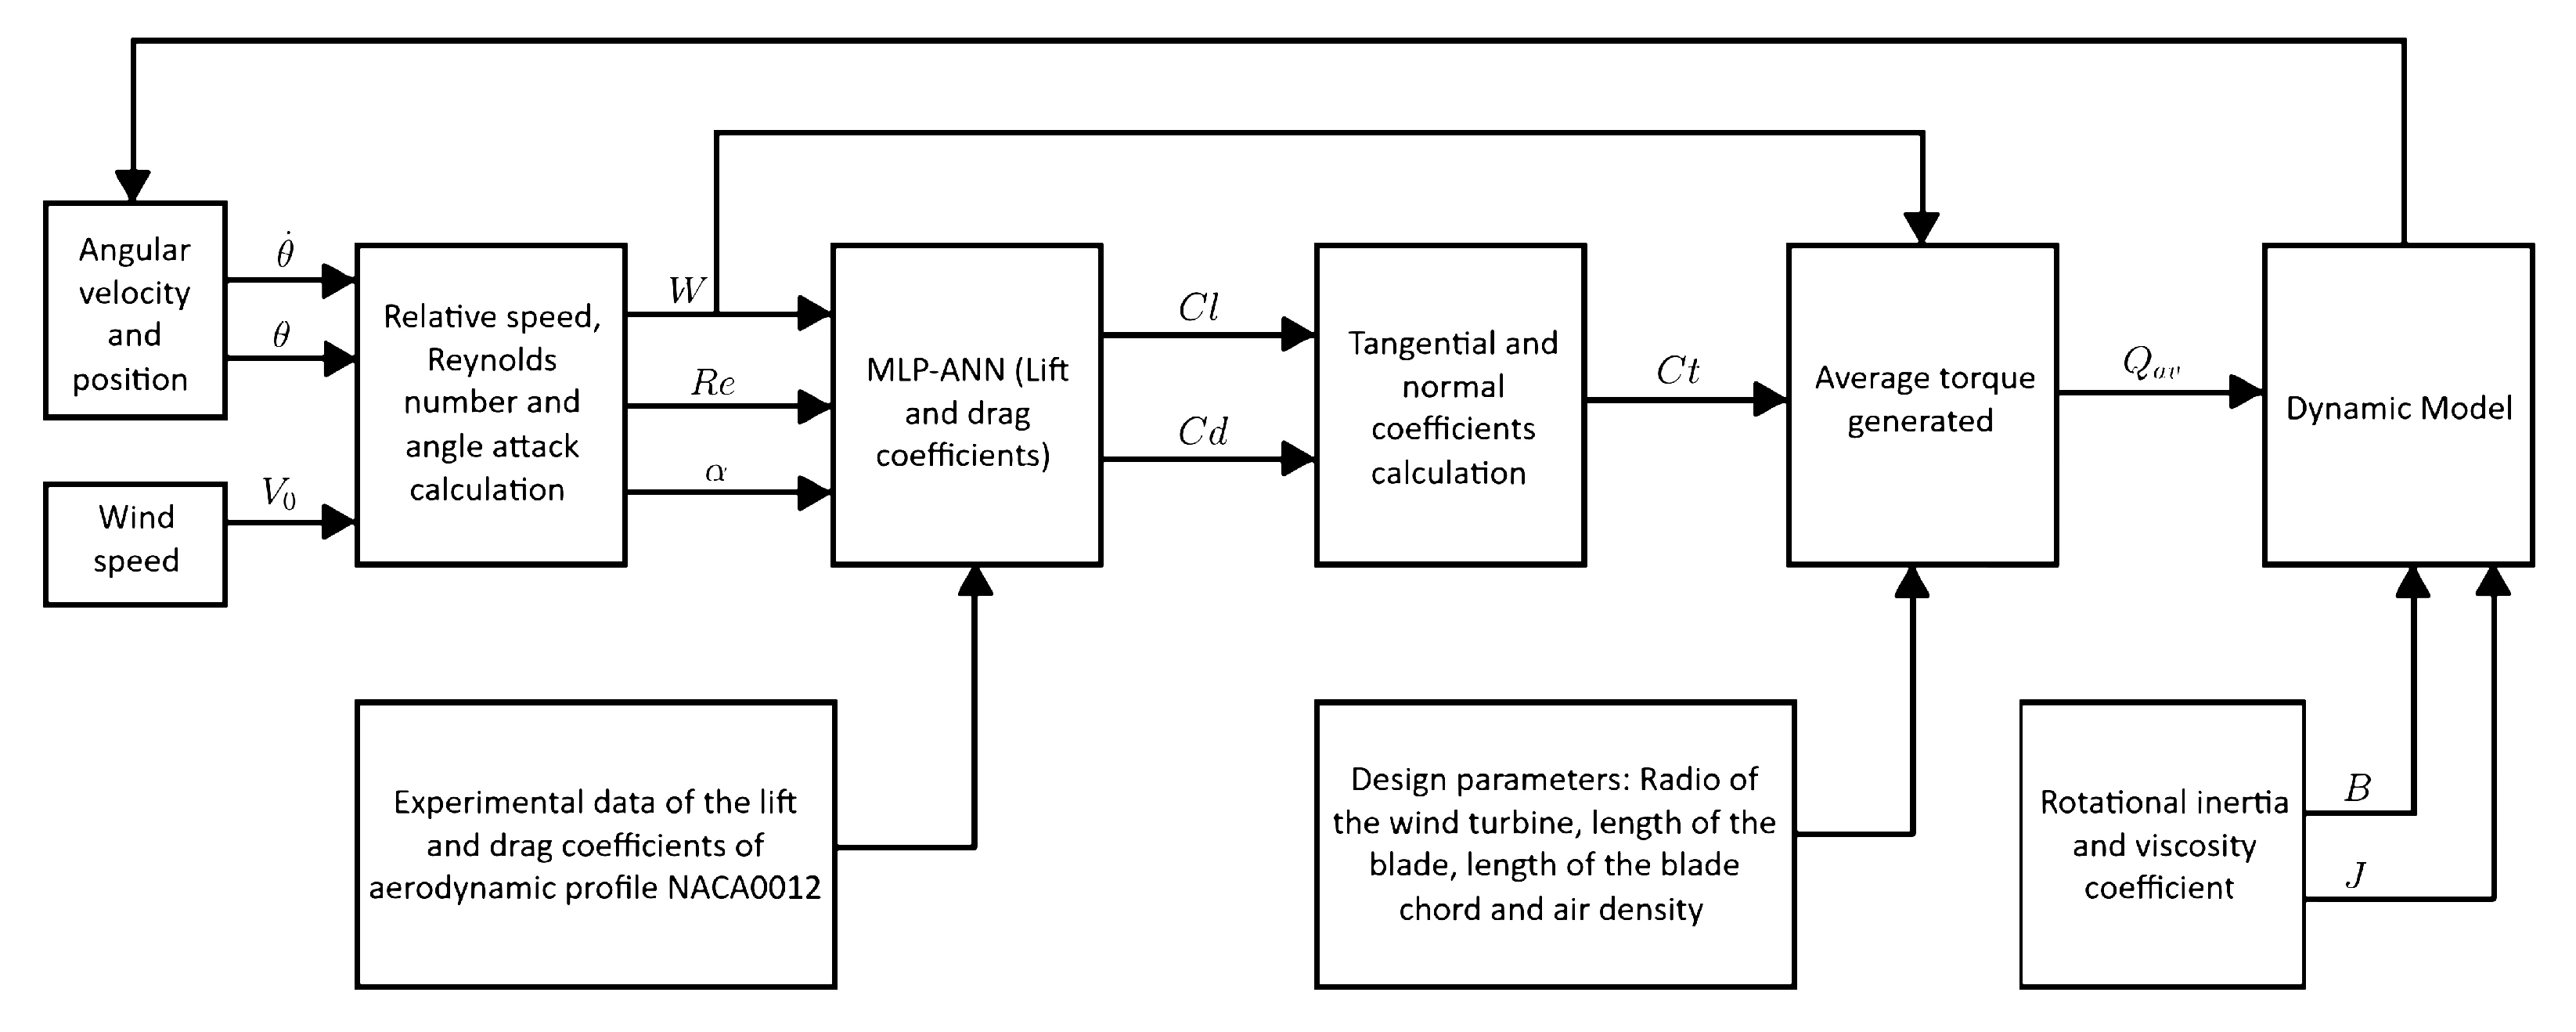
The algorithm depicted in
Figure 9 is represented schematically. It enables the assessment of a wind turbine’s transient response and facilitates the analysis of the system’s dynamic behavior under varying wind speeds.
The algorithm requires as inputs the angular position, angular velocity, and wind speed. These inputs are applied to calculate the relative wind velocity, the Reynolds number, and the angle of attack for each angular position. Subsequently, the system performs a prediction using a multilayer perceptron artificial neural network (MLP–ANN) based on the angle of attack and Reynolds number to obtain the blade lift and drag coefficients and, consequently, the tangential and normal force coefficients at each angular position. To compute the average turbine torque, the tangential coefficient is combined with the following design parameters: the turbine radius, blade length, blade chord, and air density. Finally, the average torque is incorporated into the dynamic model, combined with the system’s rotational inertia and viscous damping coefficient, to determine the angular acceleration.
The information obtained includes (i) the torque produced by each blade and by the entire wind turbine, (ii) the angular position, (iii) the angular velocity, (iv) the normal force, and (v) the tangential force exerted by each blade.
3. Simulation Results
The parameters of the wind turbine are defined for the algorithm simulation. The aerodynamic profile selected was NACA0012, chosen due to its lower lift coefficient and higher drag coefficient compared to other symmetric airfoils.
The physical parameters of the wind turbine are summarized in
Table 2.
The simulation parameters are summarized in
Table 3.
The step-input signal is characterized by rising and falling edges. The wind turbine started from a stationary state and, after 10 s, experienced a 10 m/s wind gust that lasted 4 min before subsiding.
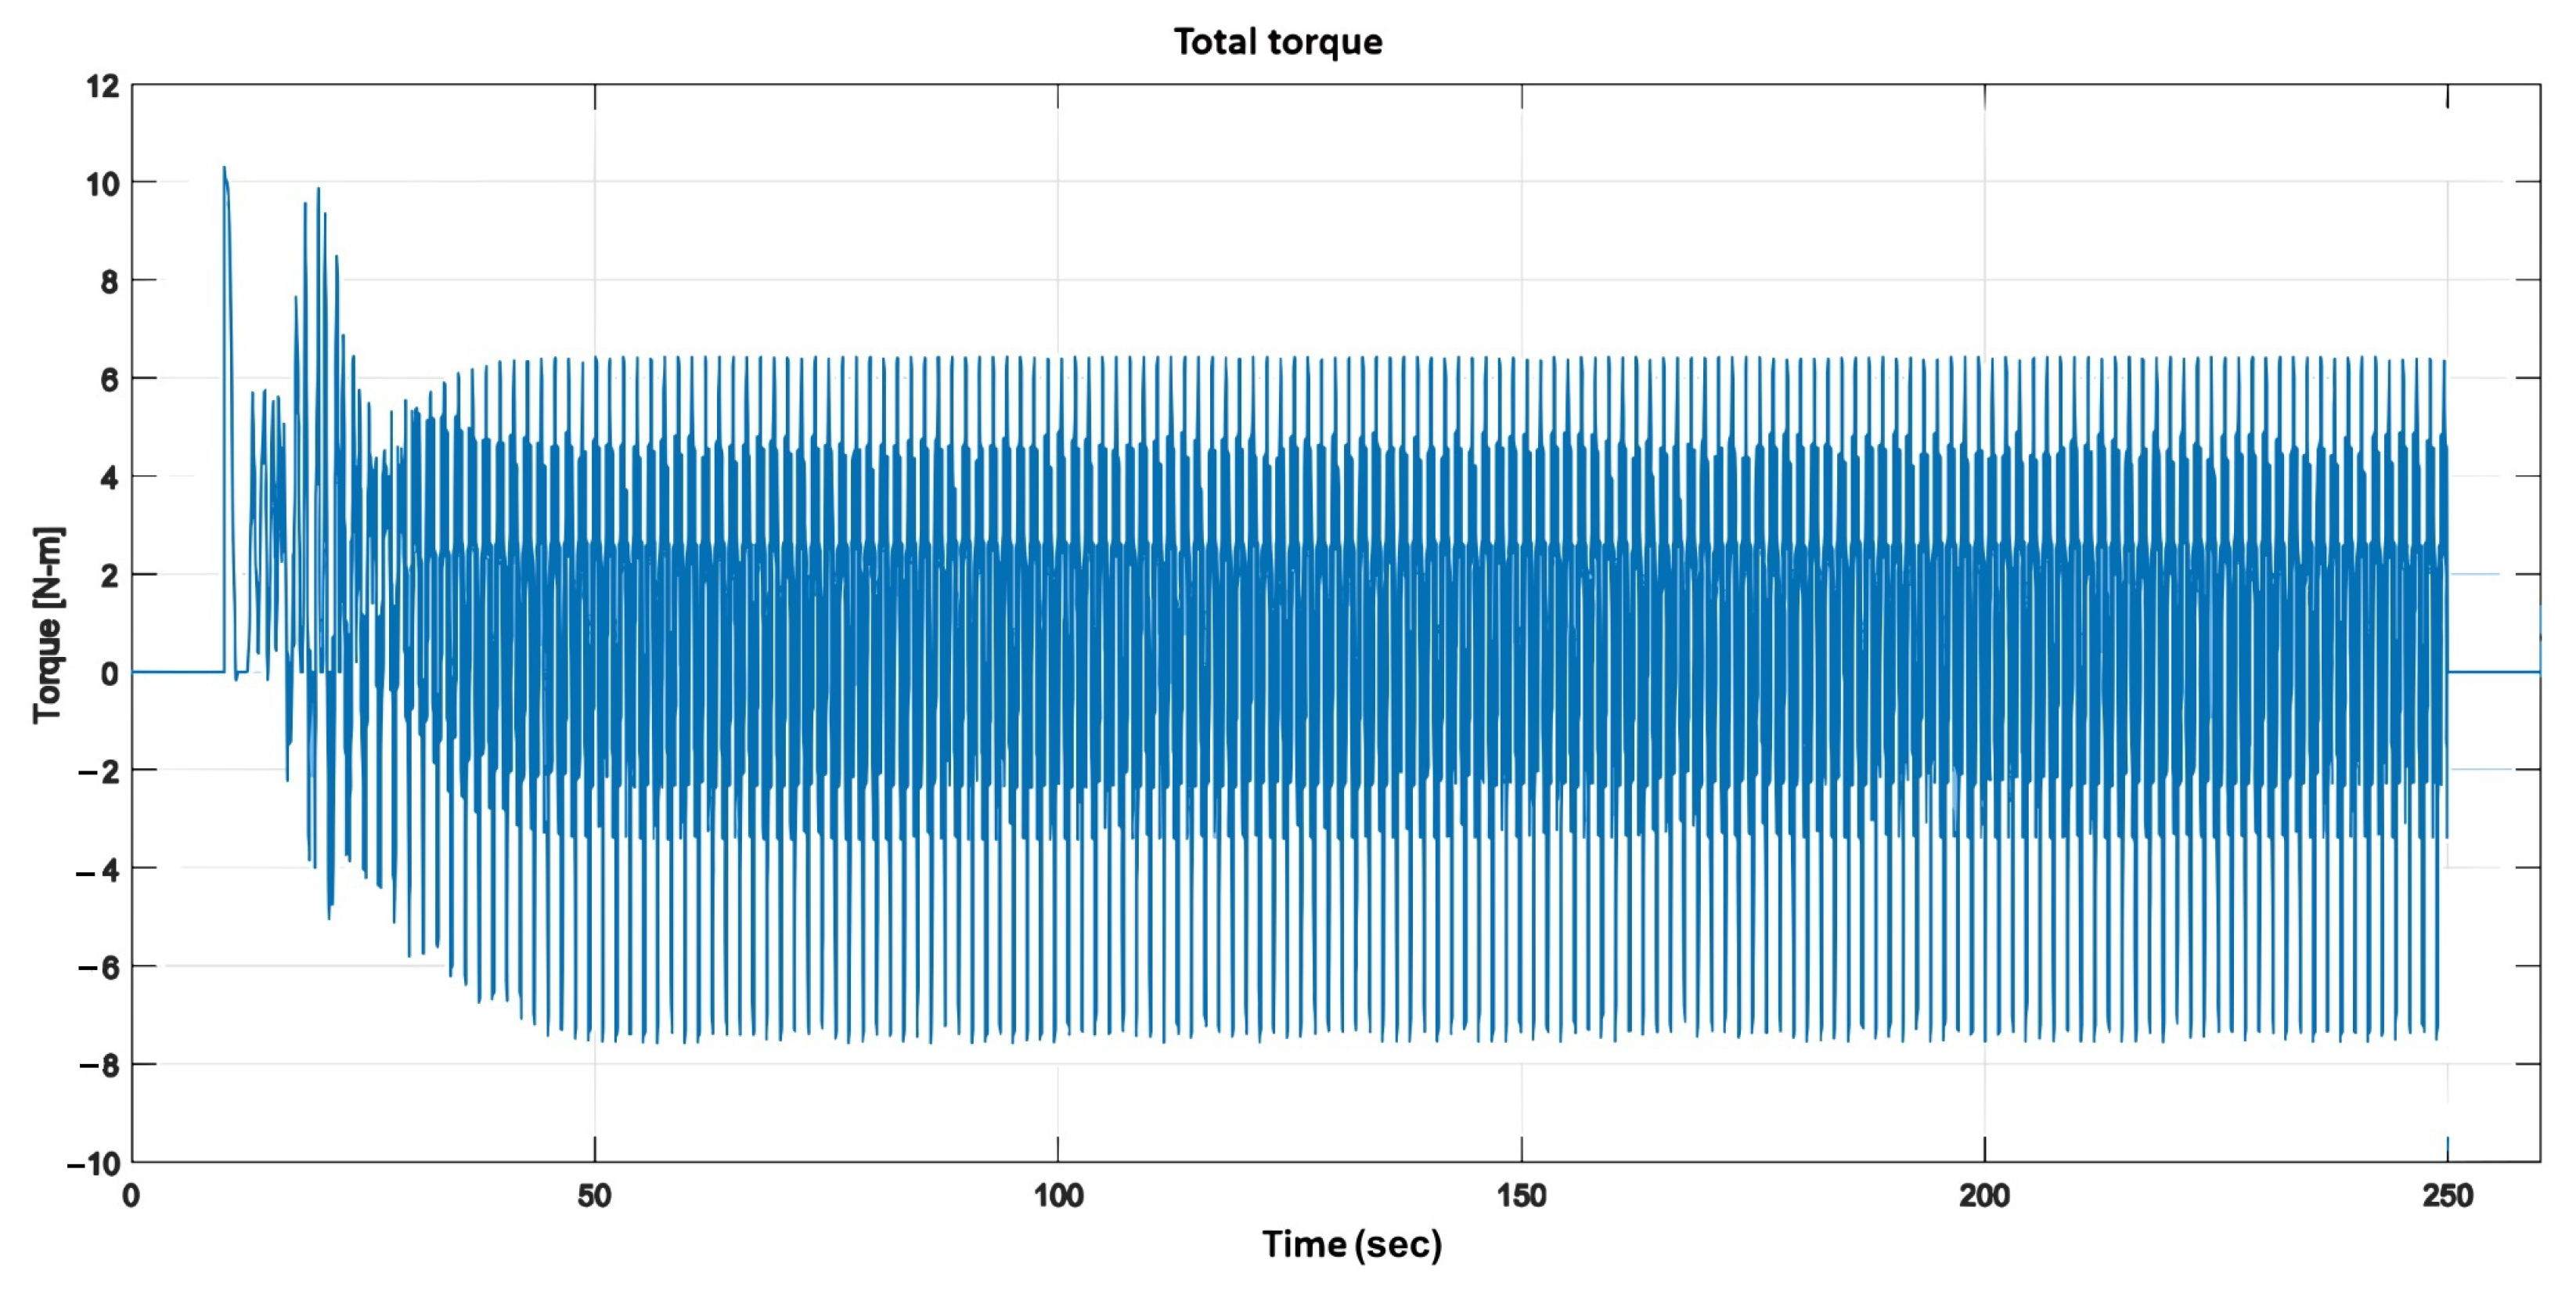
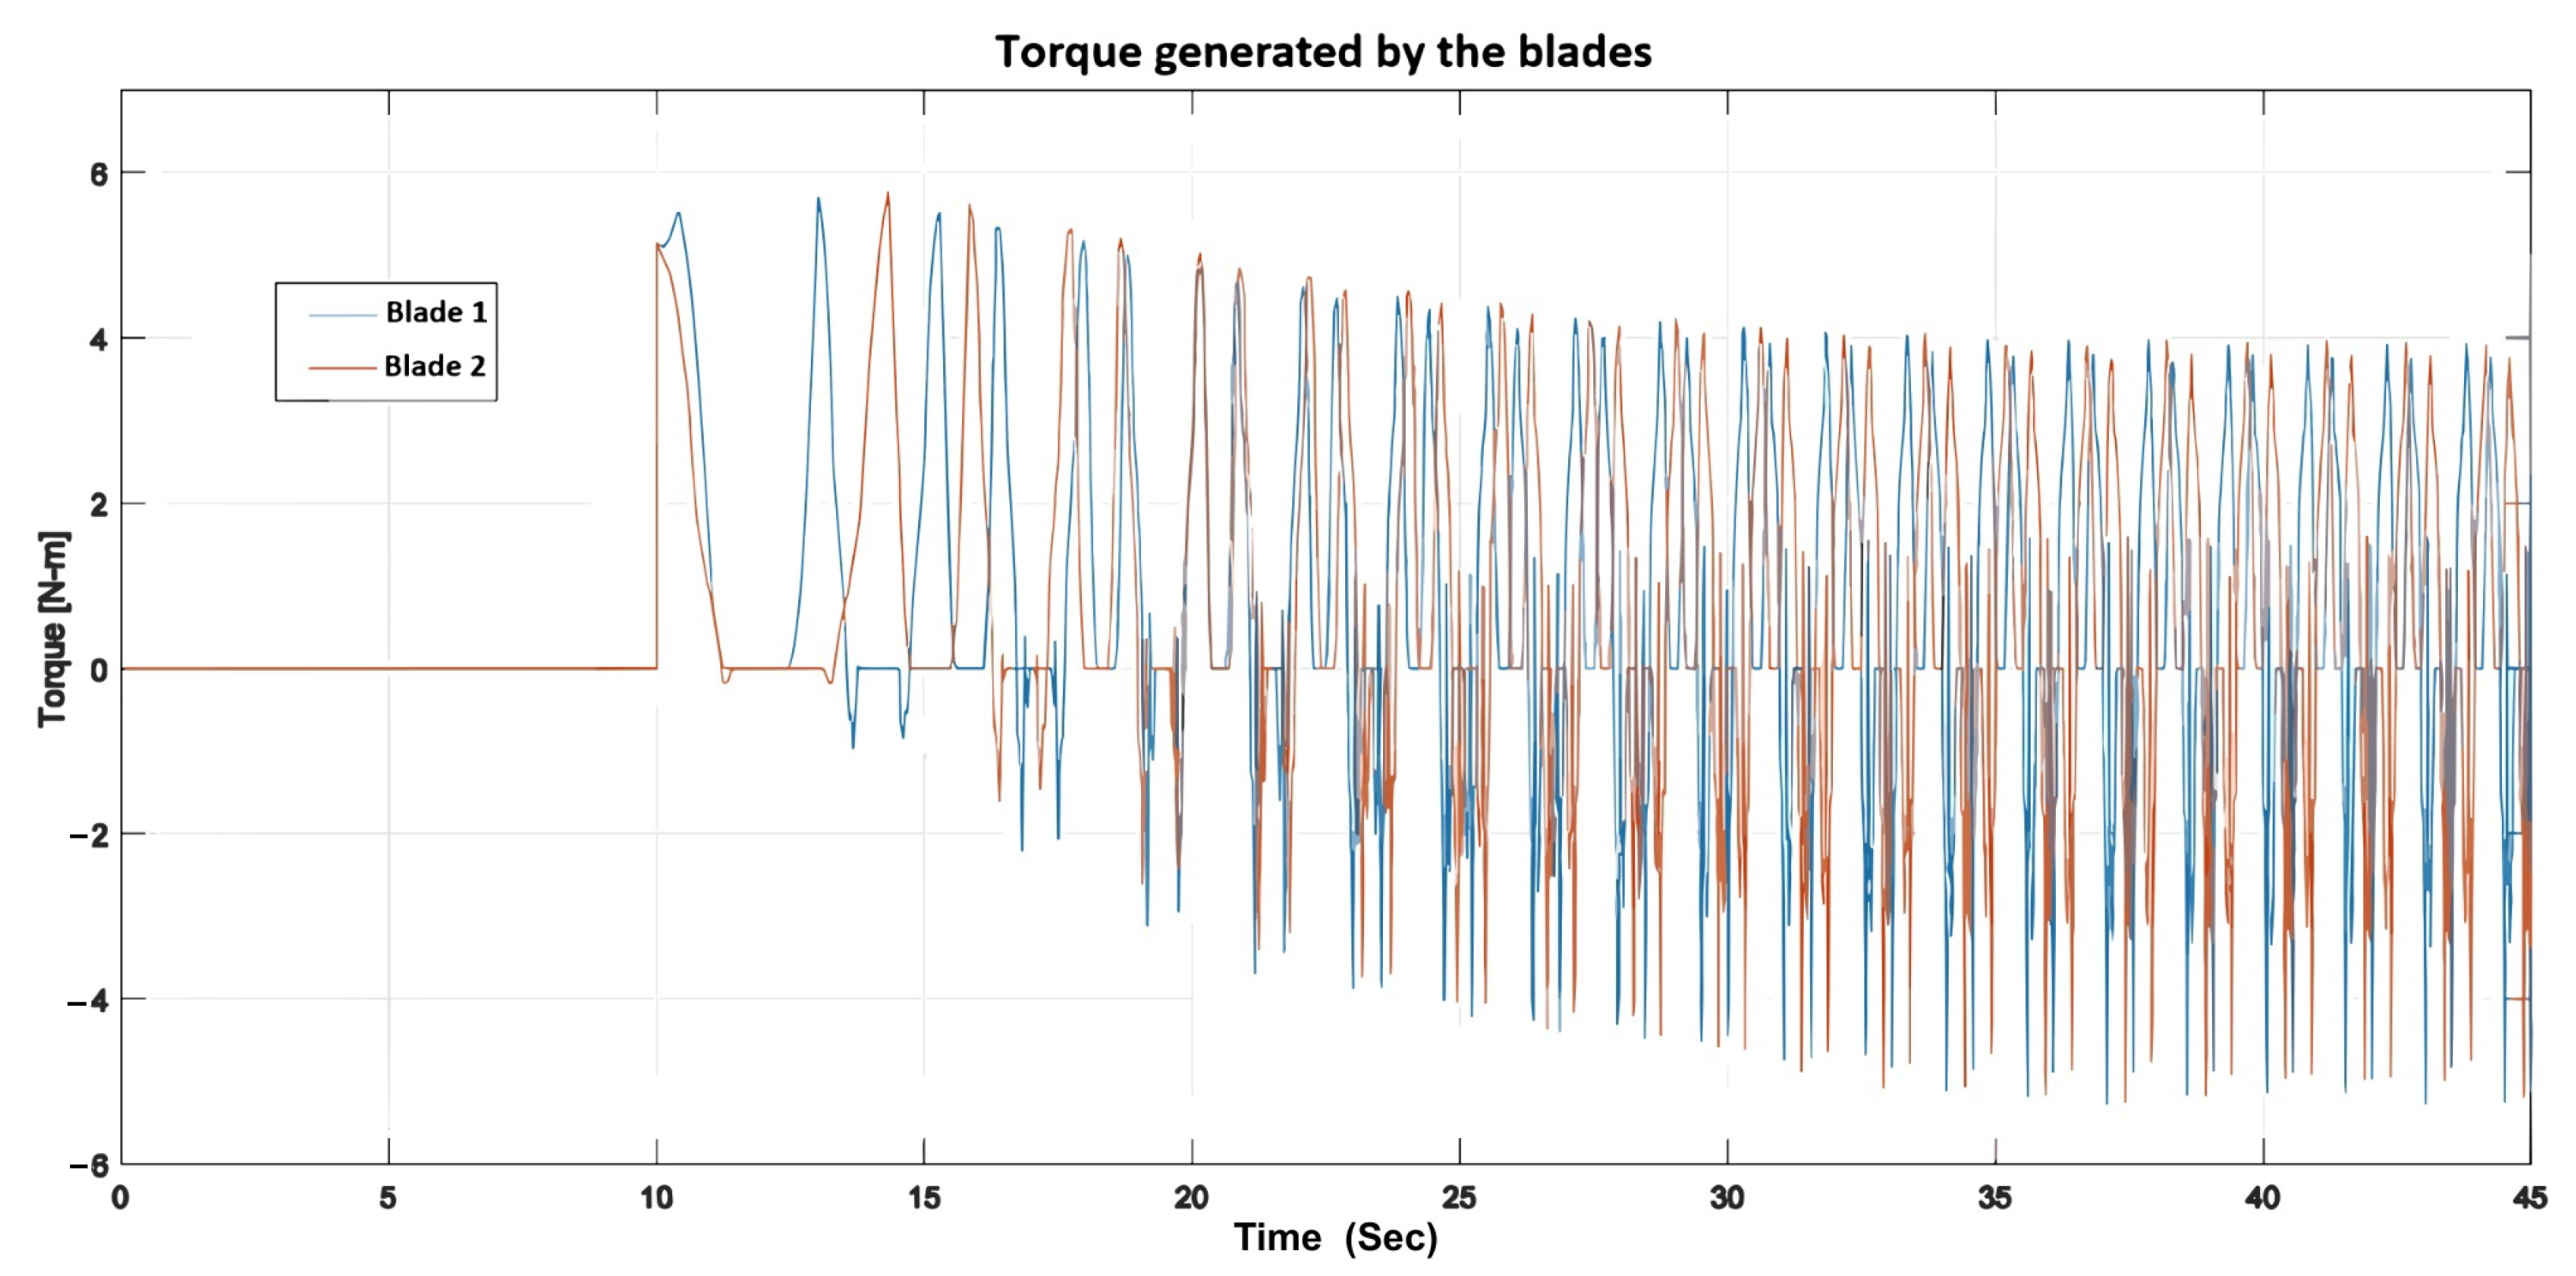
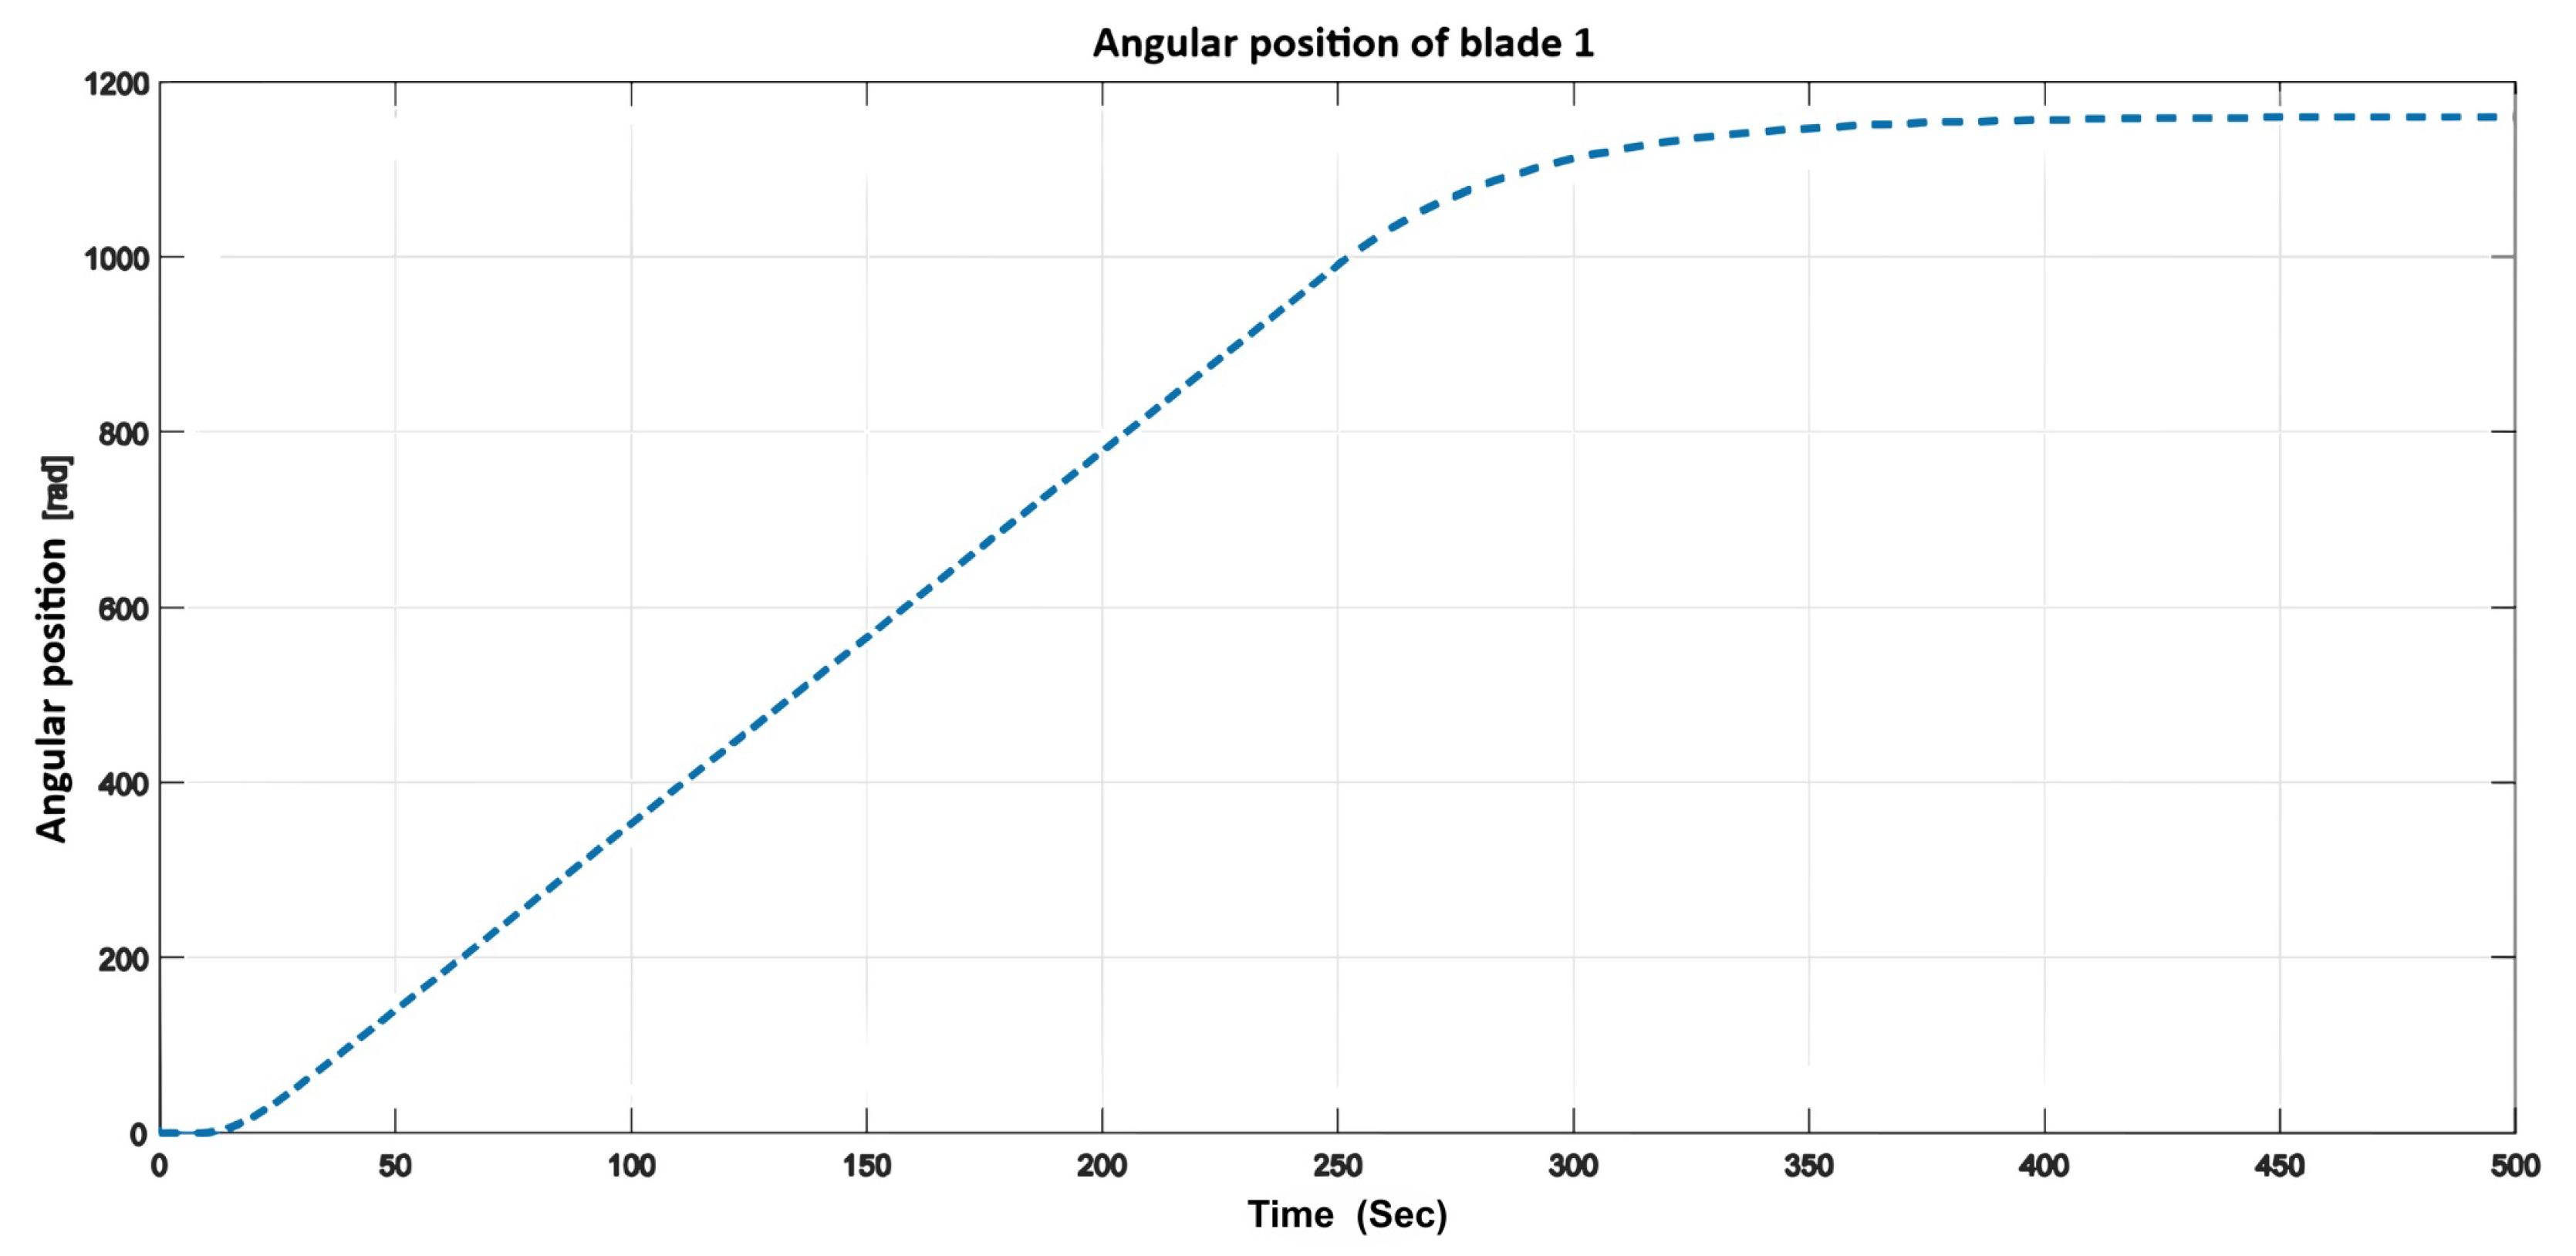
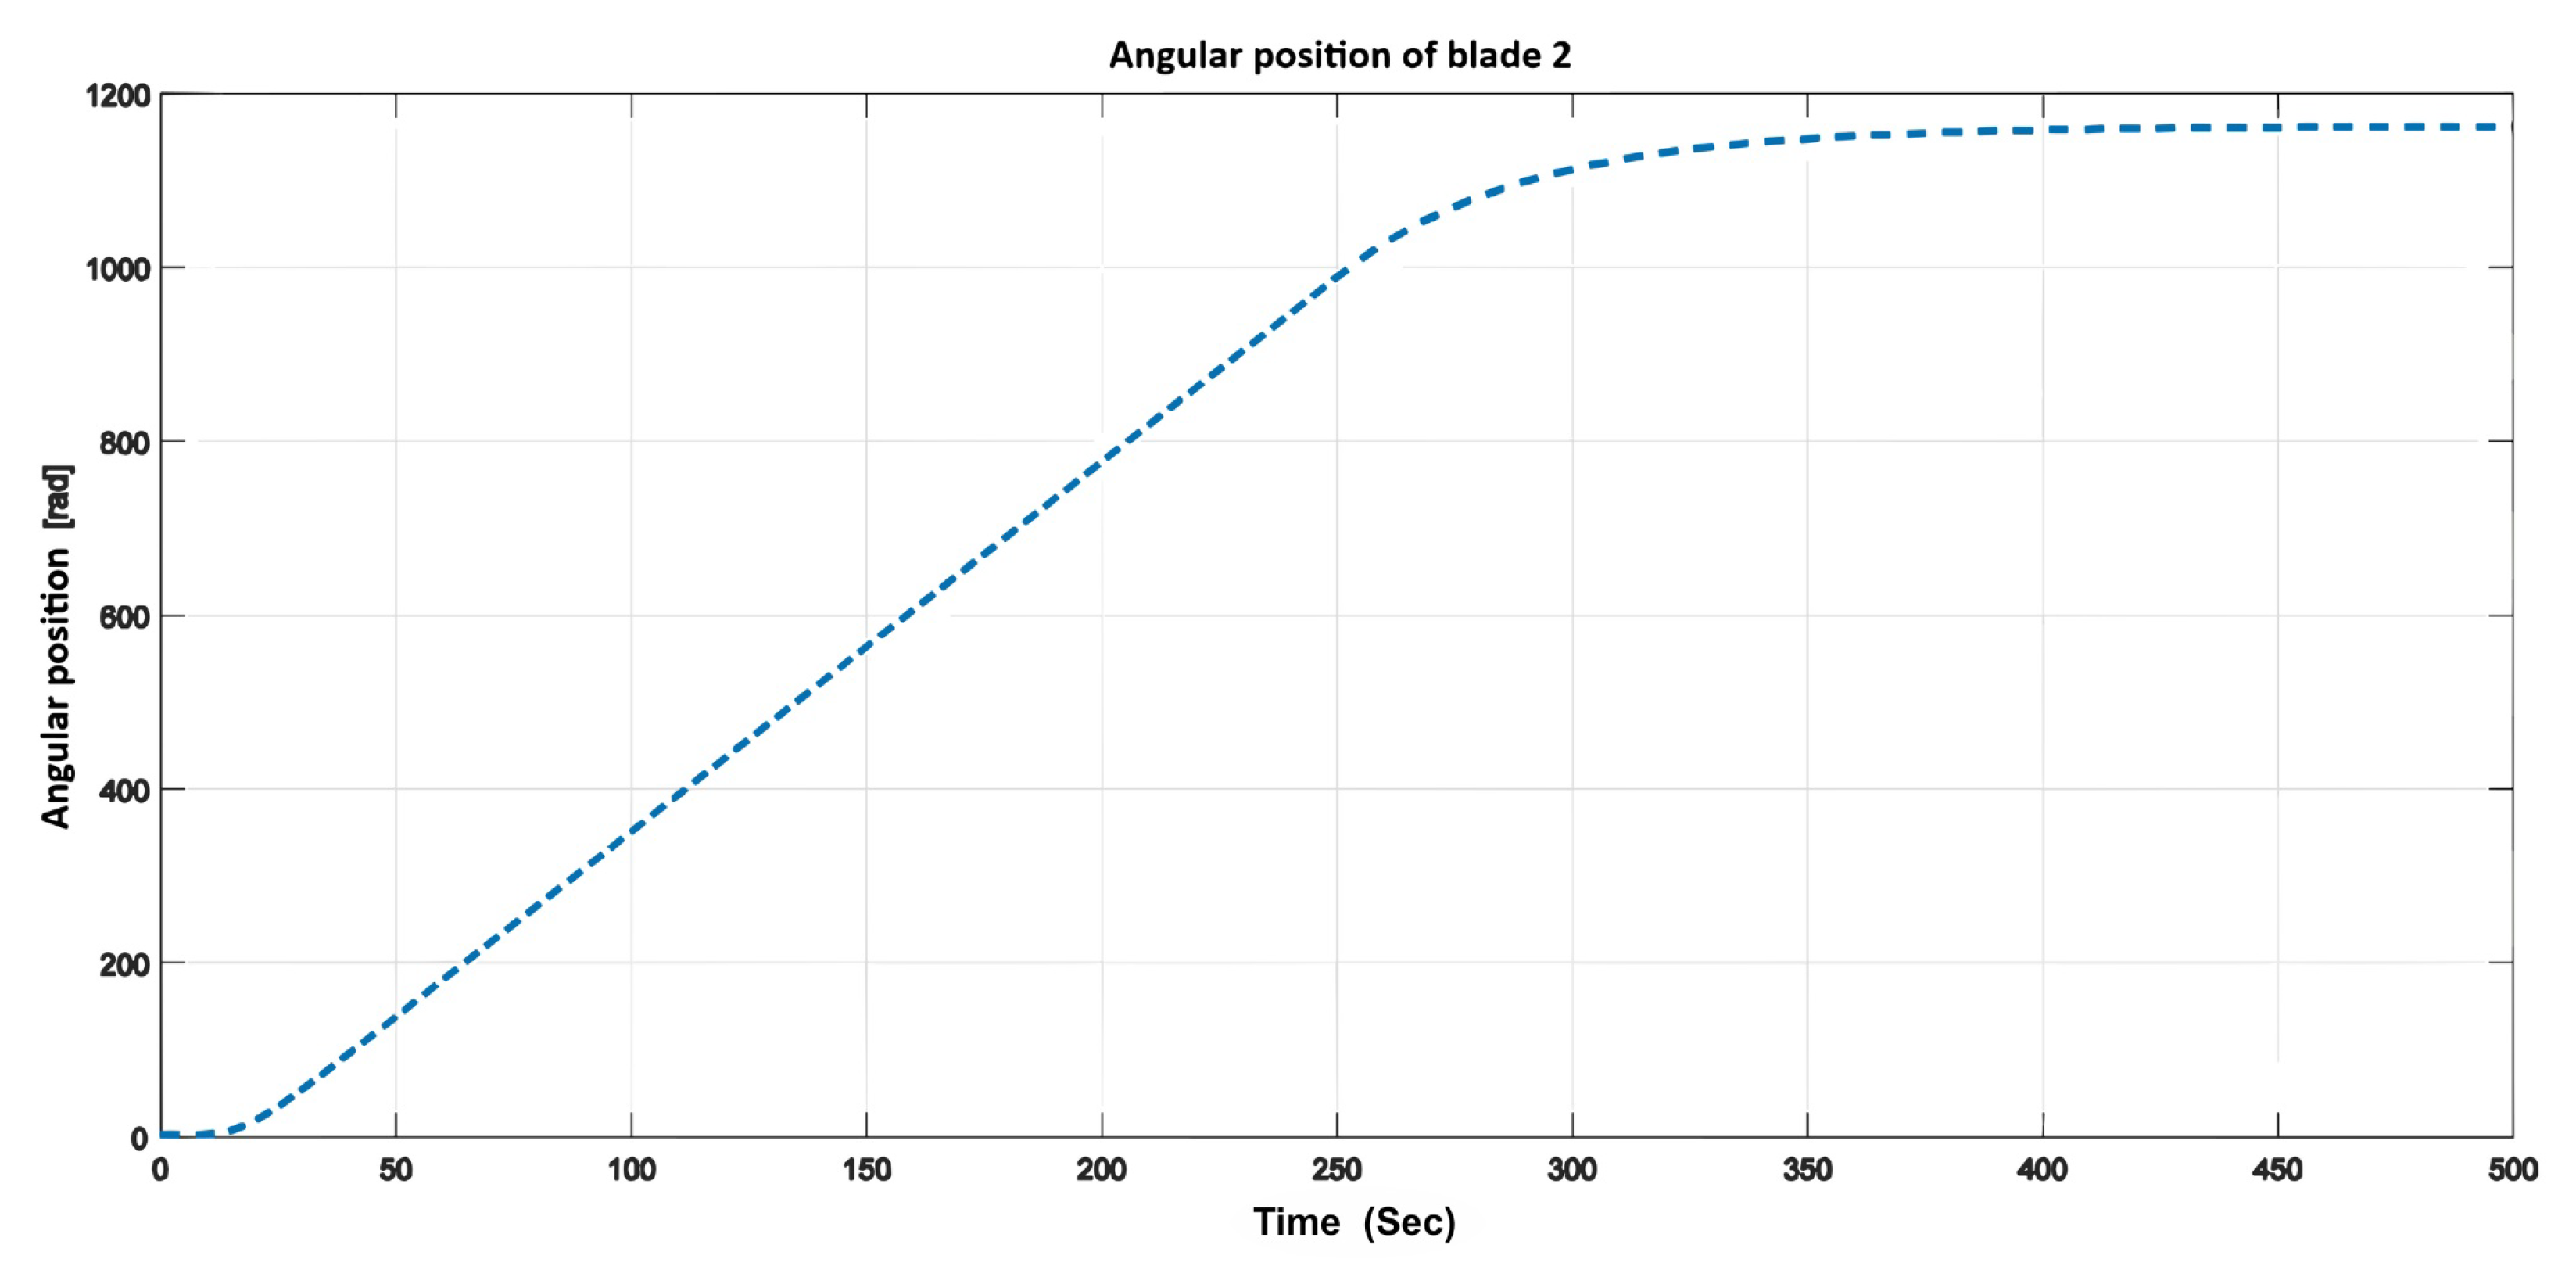
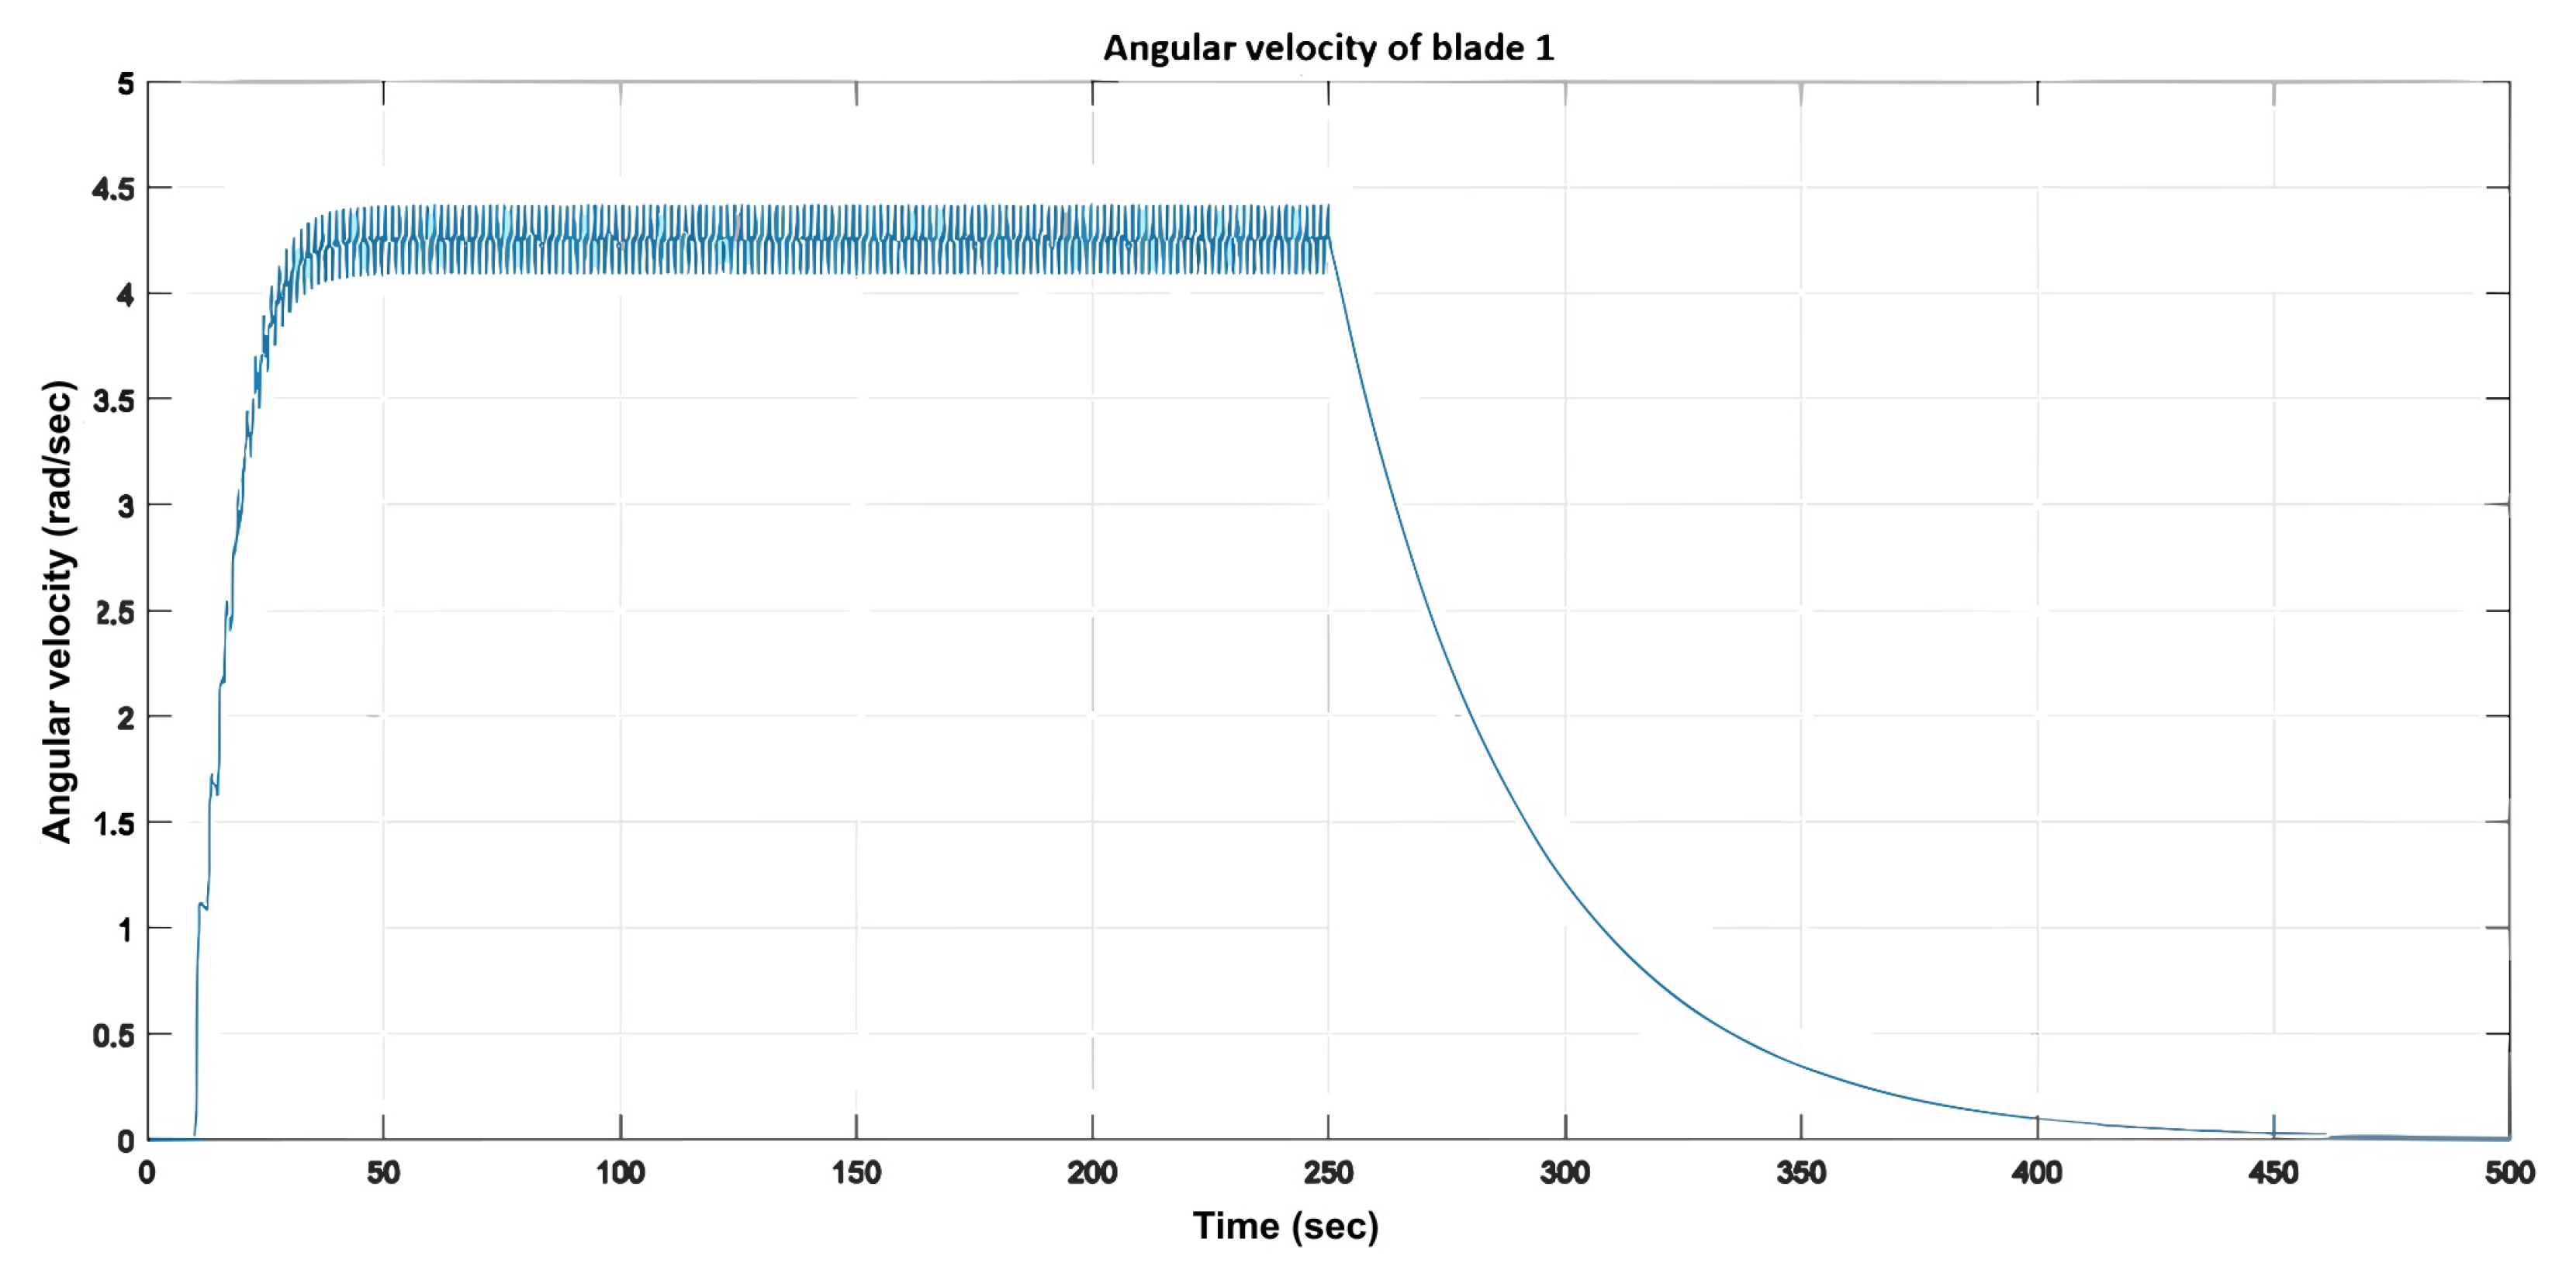
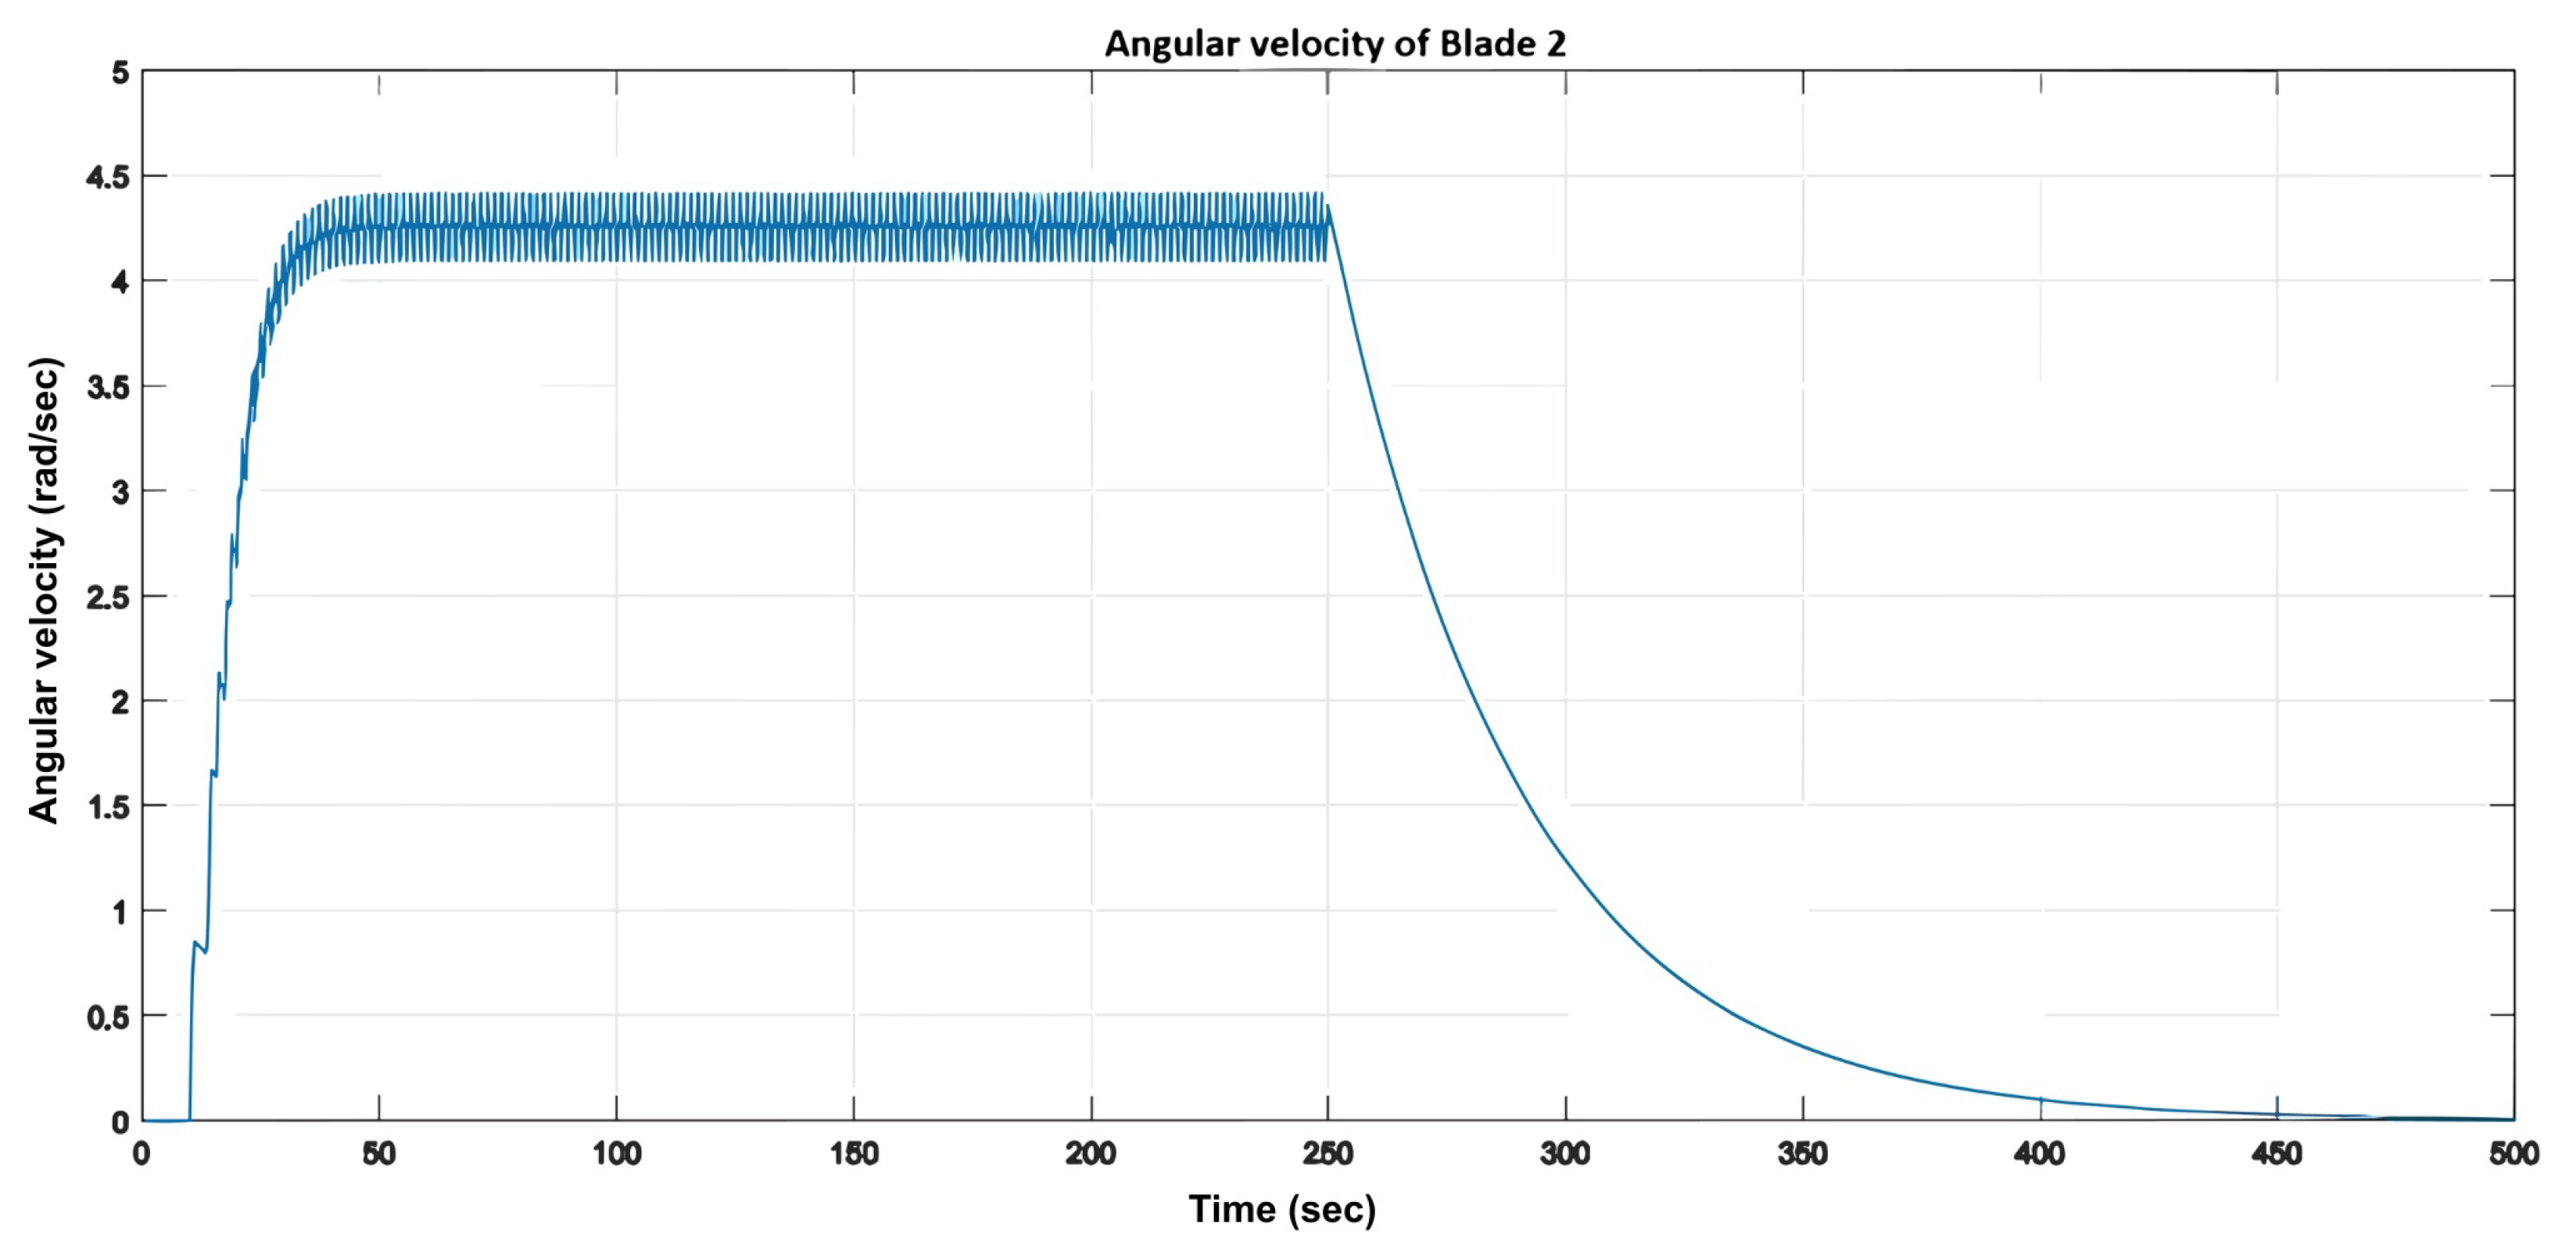
Figure 10,
Figure 11,
Figure 12,
Figure 13,
Figure 14,
Figure 15 and
Figure 16 depict the following outputs in response to the input
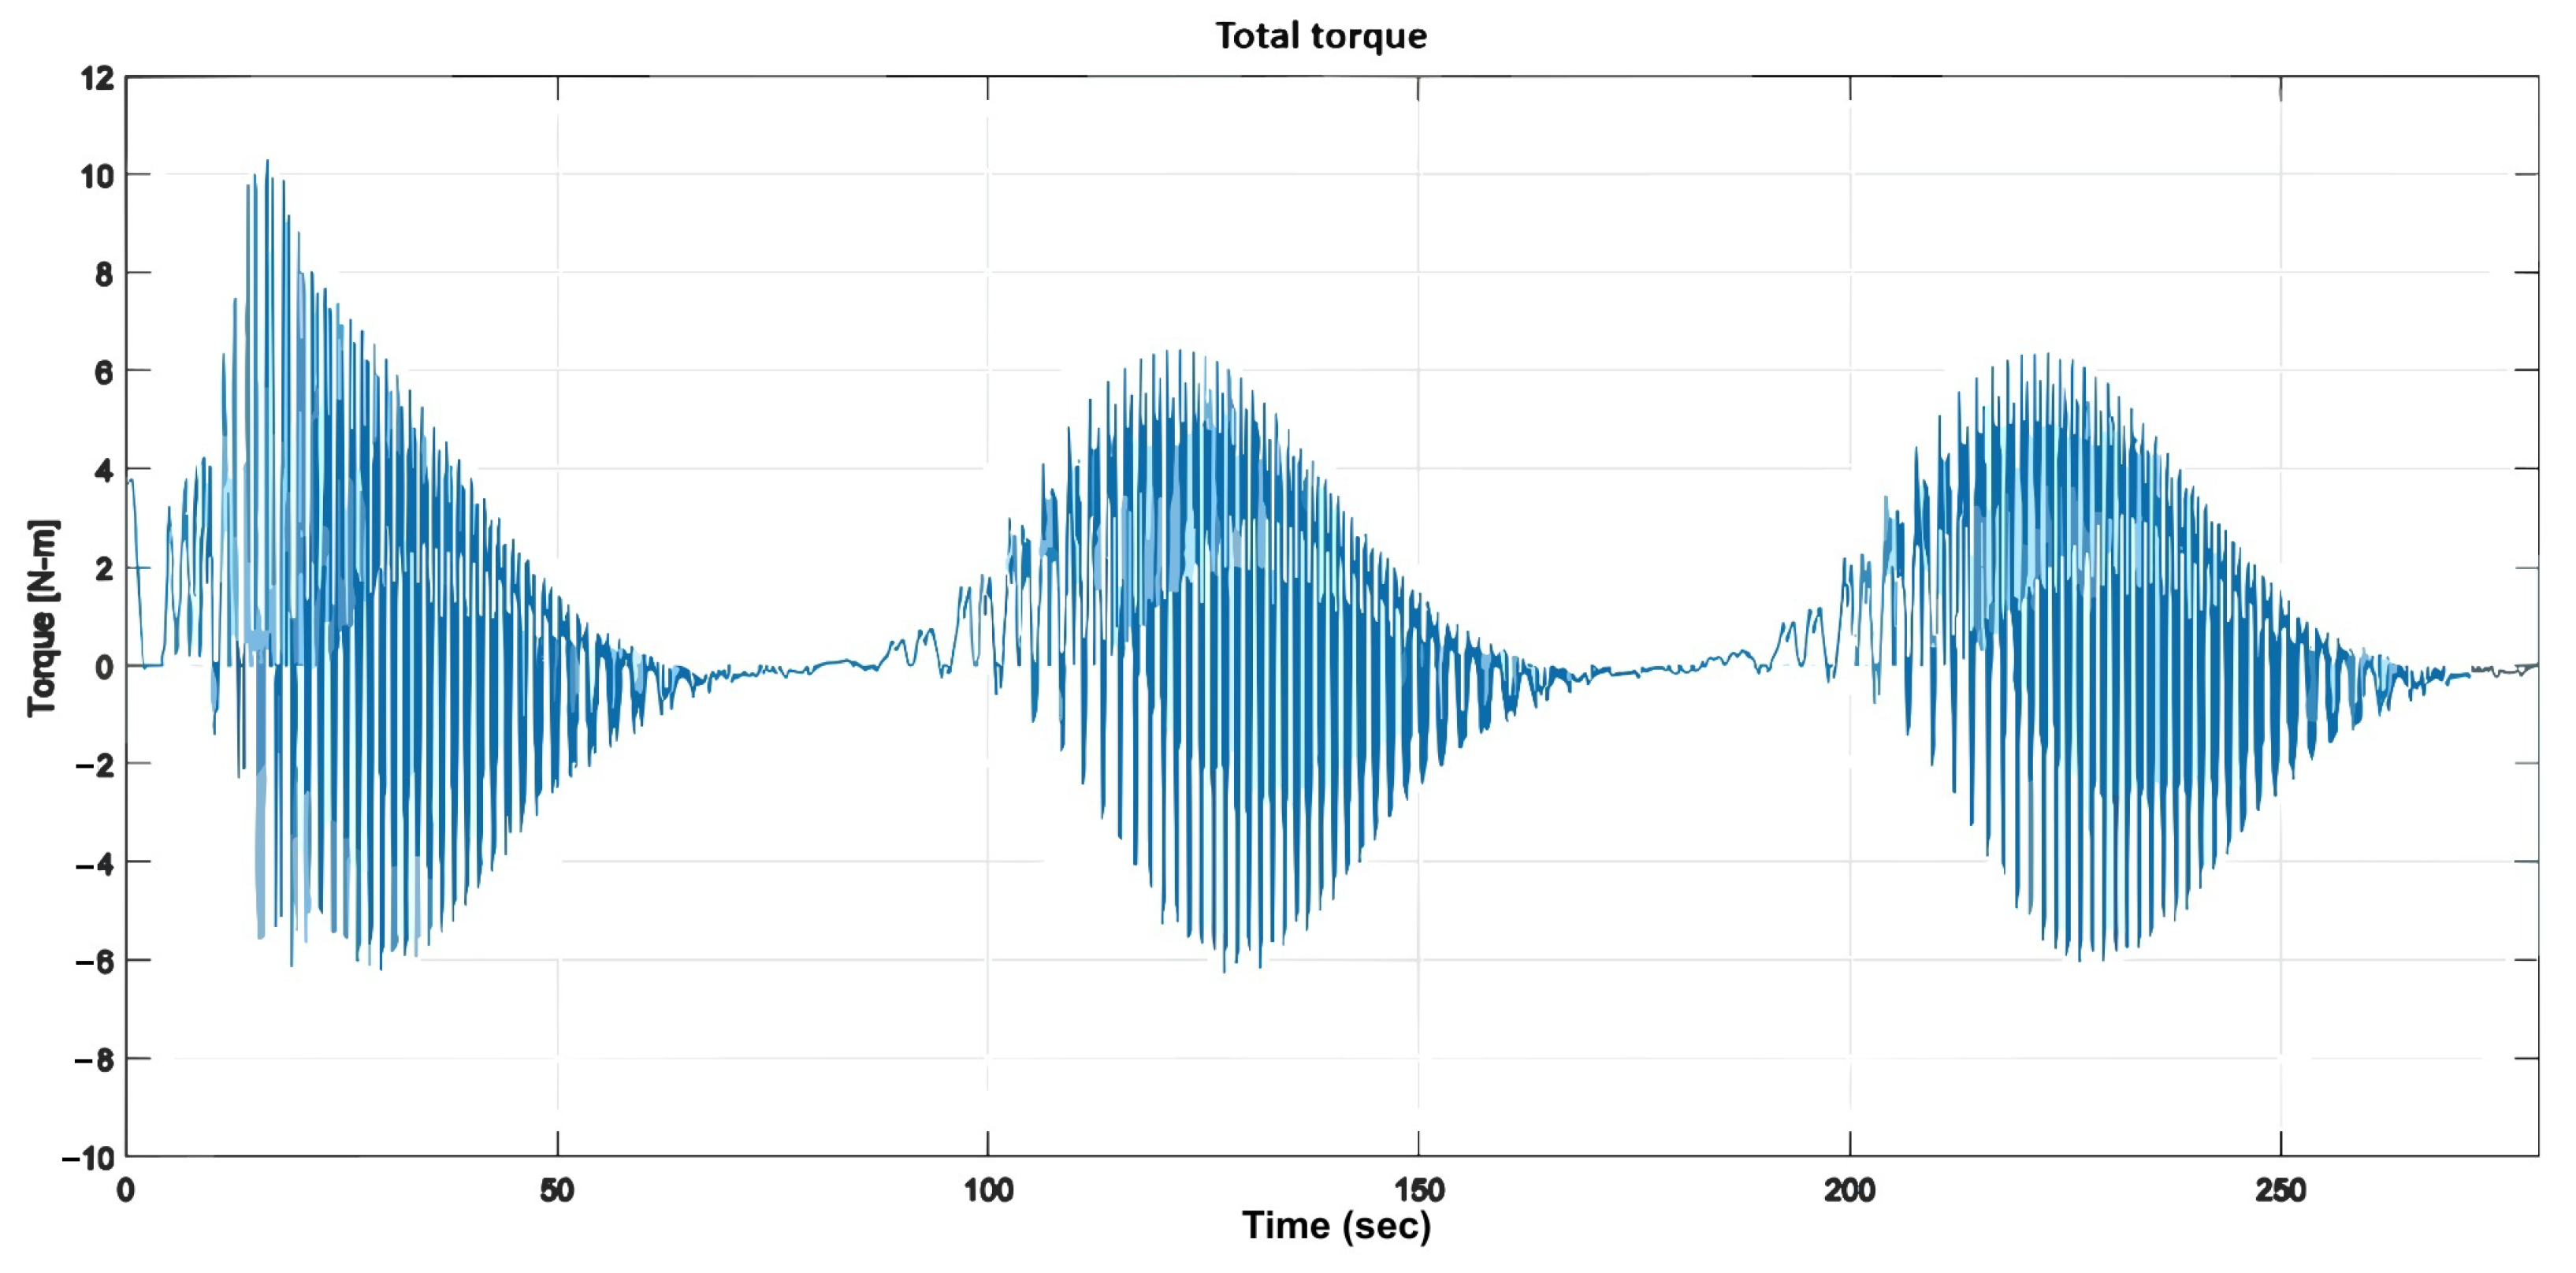
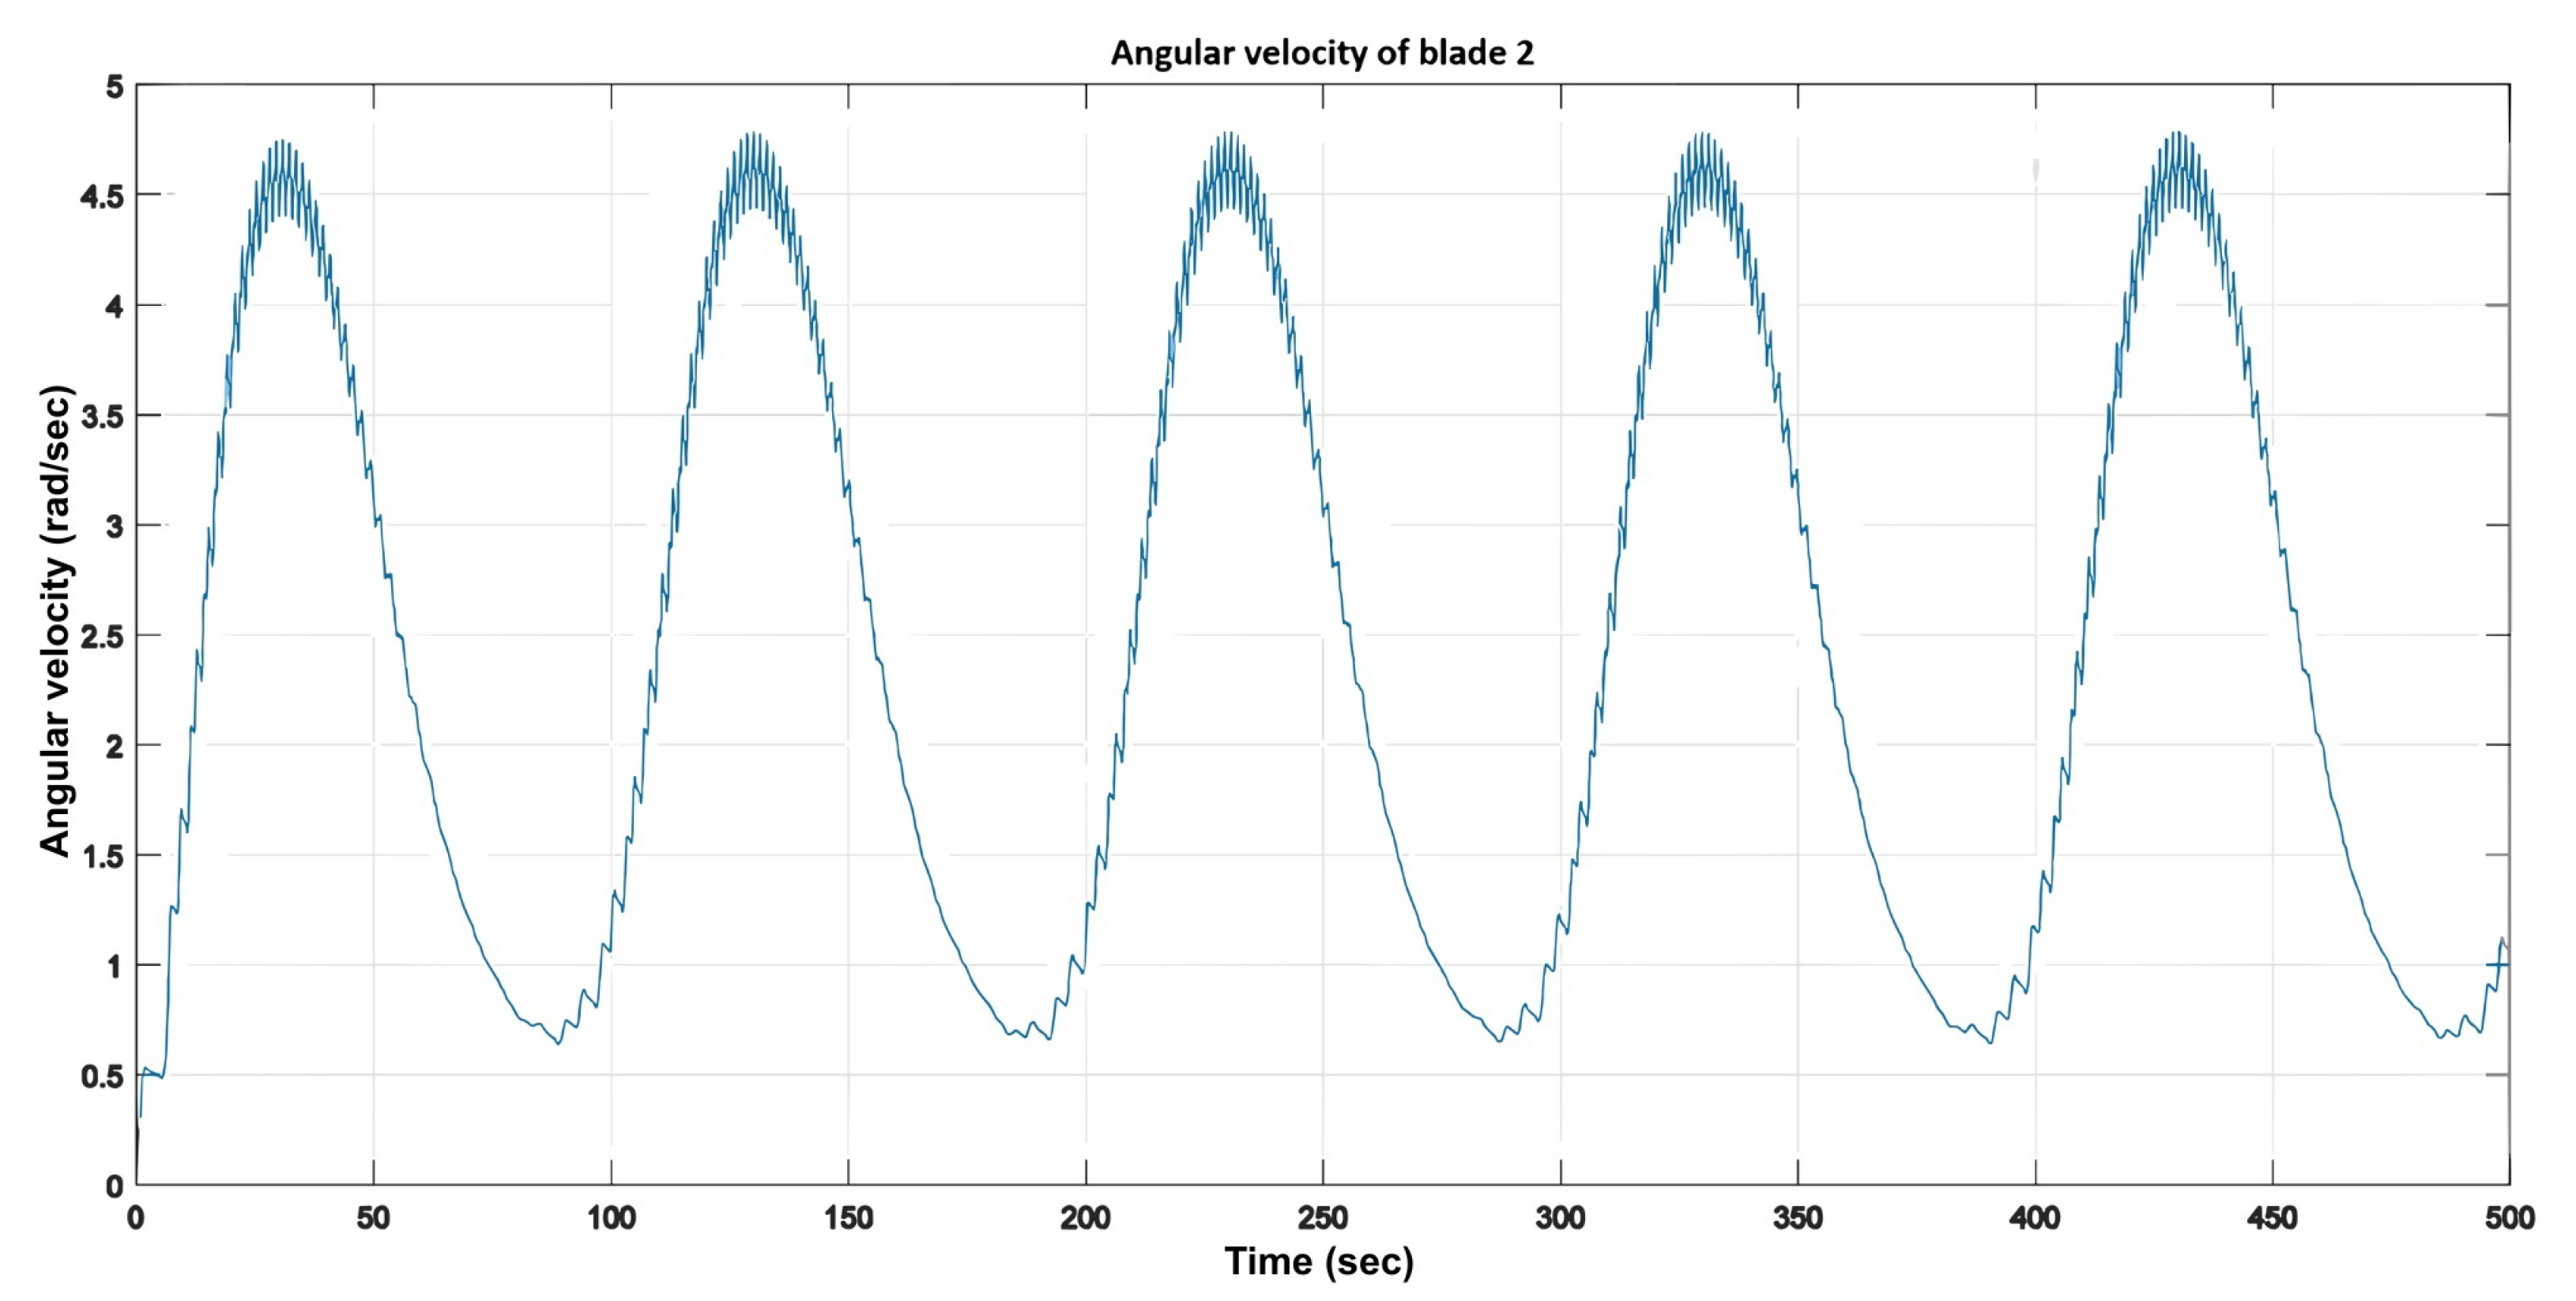
: (1) the wind-speed input; (2) the total and individual torque generated by the blades, exhibiting a cyclic pattern; (3) the blades’ angular positions; and (4) the angular velocity of each blade, which shows an upward transient response with a settling time of approximately 35 s, followed by a downward transient response lasting about 200 s.
It was observed that the duration of the downward transient was approximately six times longer than that of the upward transient. This behavior highlights a singularity occurring when the wind-speed input approaches zero, resulting in an infinite tip-speed ratio (). To mitigate this issue, the input was adjusted to 0.01 m/s instead of zero. Nonetheless, a significant discrepancy remained between the system’s stabilization times during the upward and downward transients.
The signal is a sinusoidal input representing a periodic wind gust centered around 6 m/s, characterized by the parameters , , and . This test was designed to simulate the wind turbine’s performance under varying high- and low-wind-speed conditions.
Figure 17 shows the input
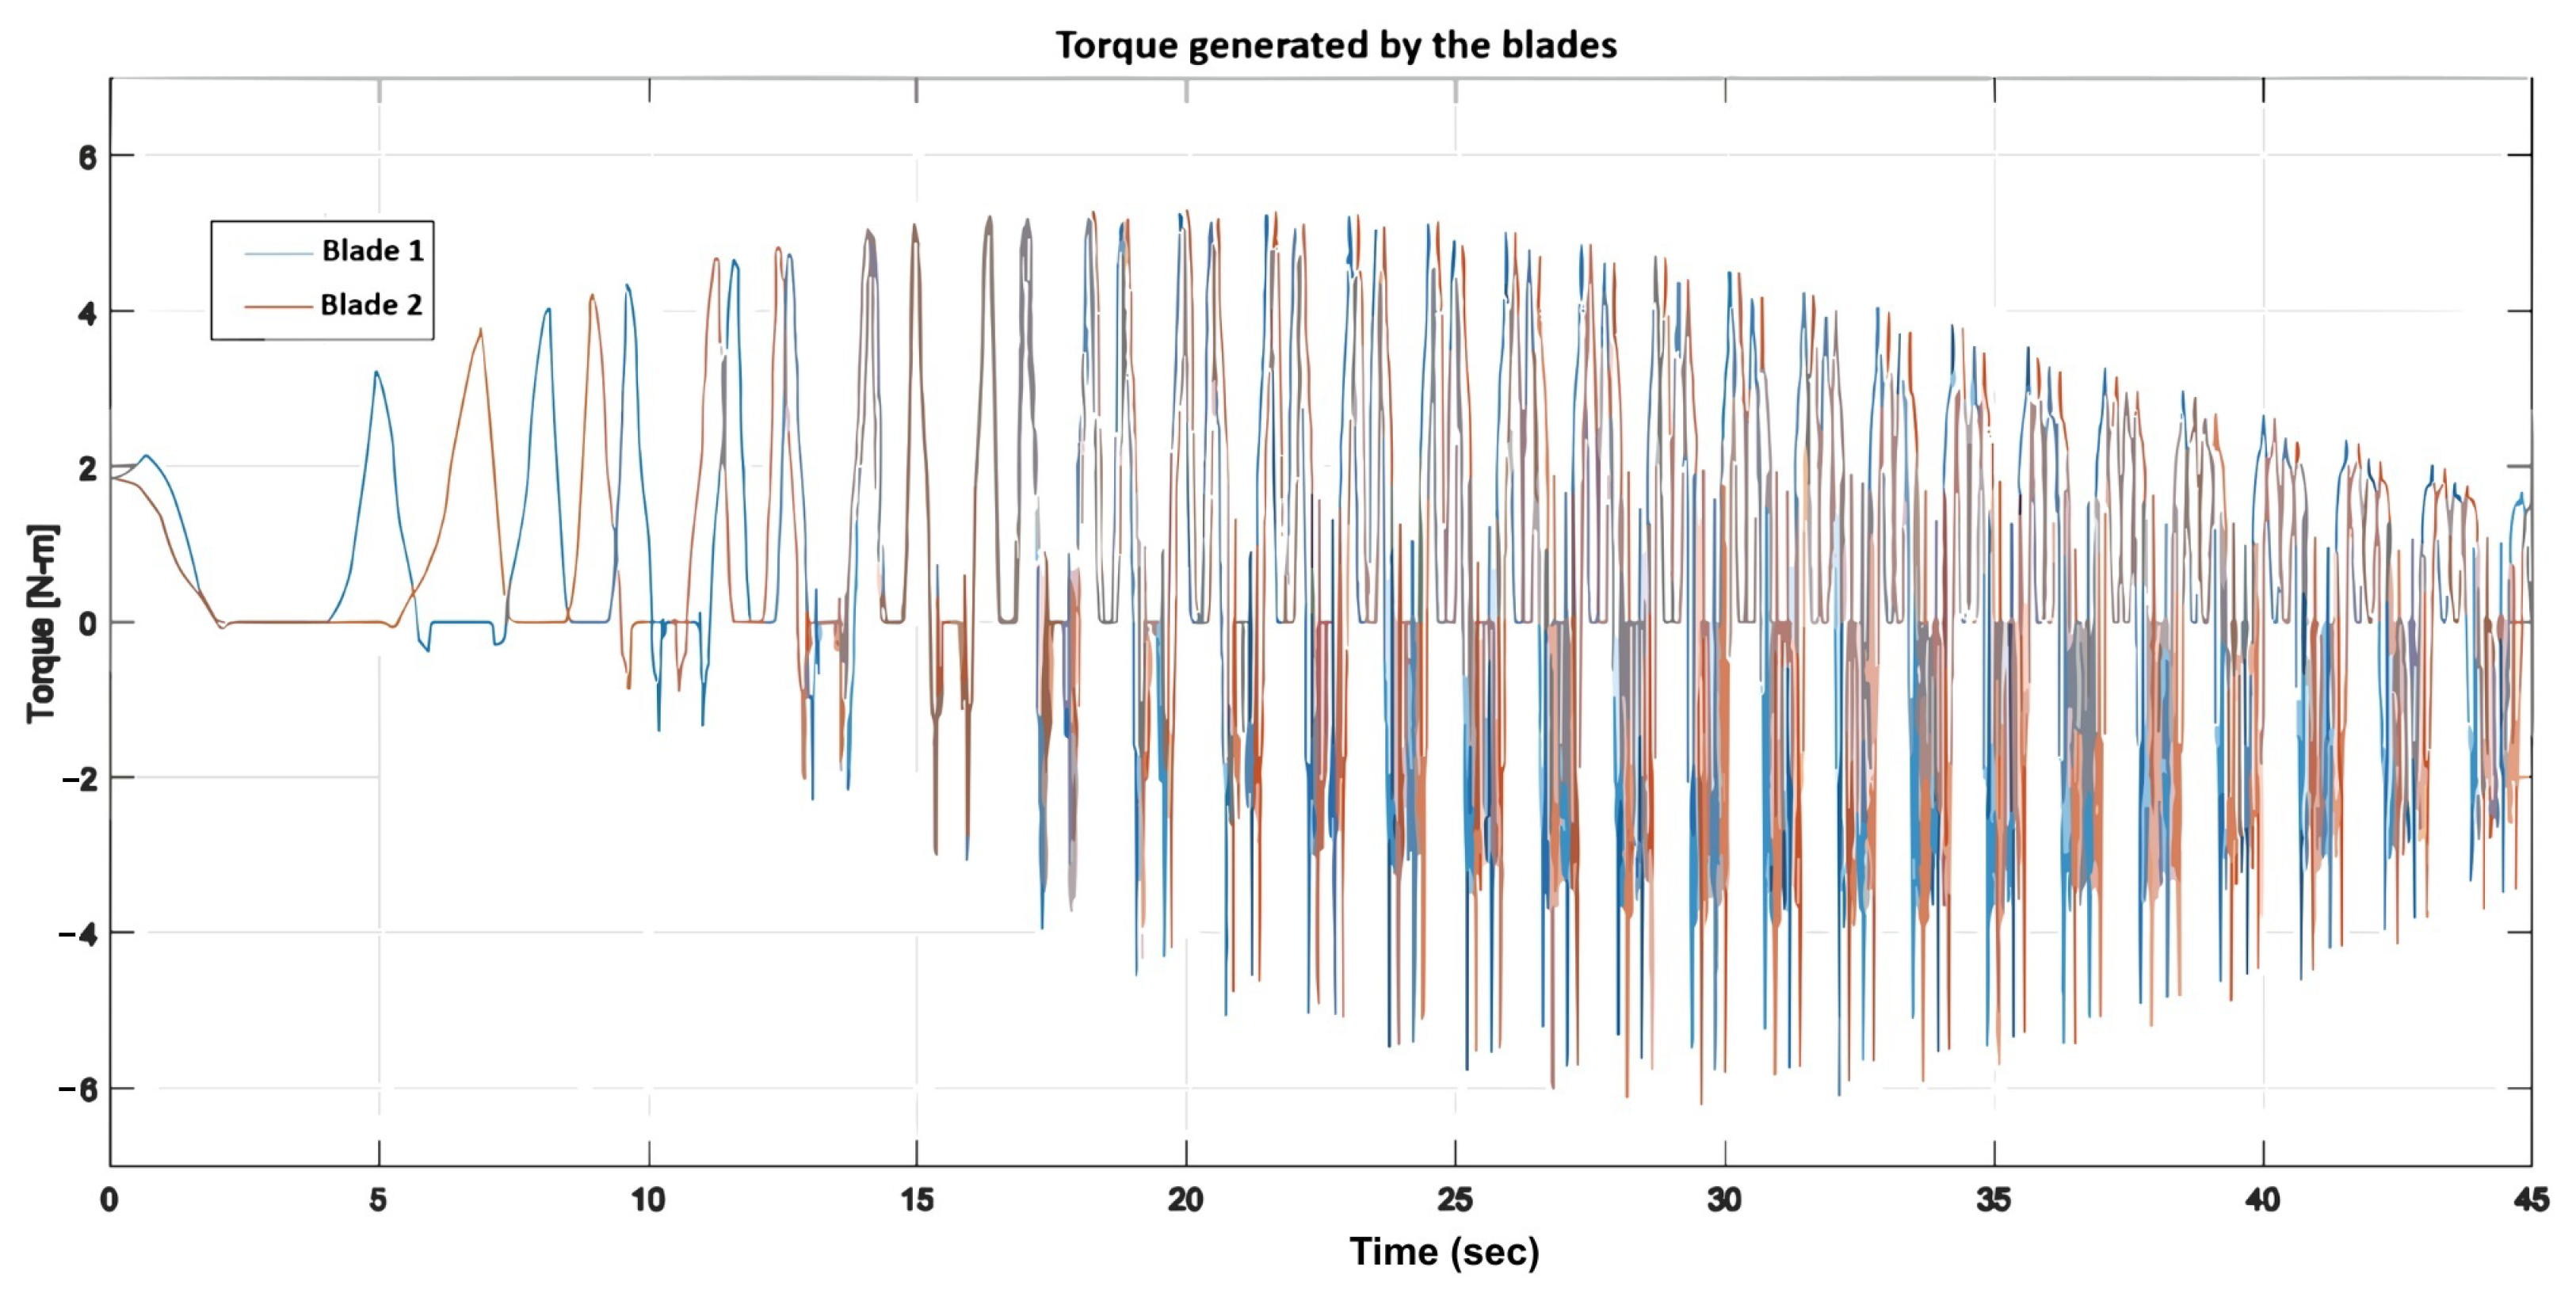
, while
Figure 18 and
Figure 19 illustrate the total torque of both blades and the individual torque of each blade. The output preserves the oscillation period of the input and reflects the quadratic relationship between wind speed and torque, as described in the model.
Similar to the step-input scenario, the system reached steady-state conditions in approximately 35 s, indicating that the settling time is an intrinsic property of the system and is mainly independent of the input signal. Additionally, the blade torques dropped to zero during specific time intervals (such as between 12 and 17 s), leading to a reduction in each blade’s angular velocity and, consequently, a decrease in the overall generated torque.
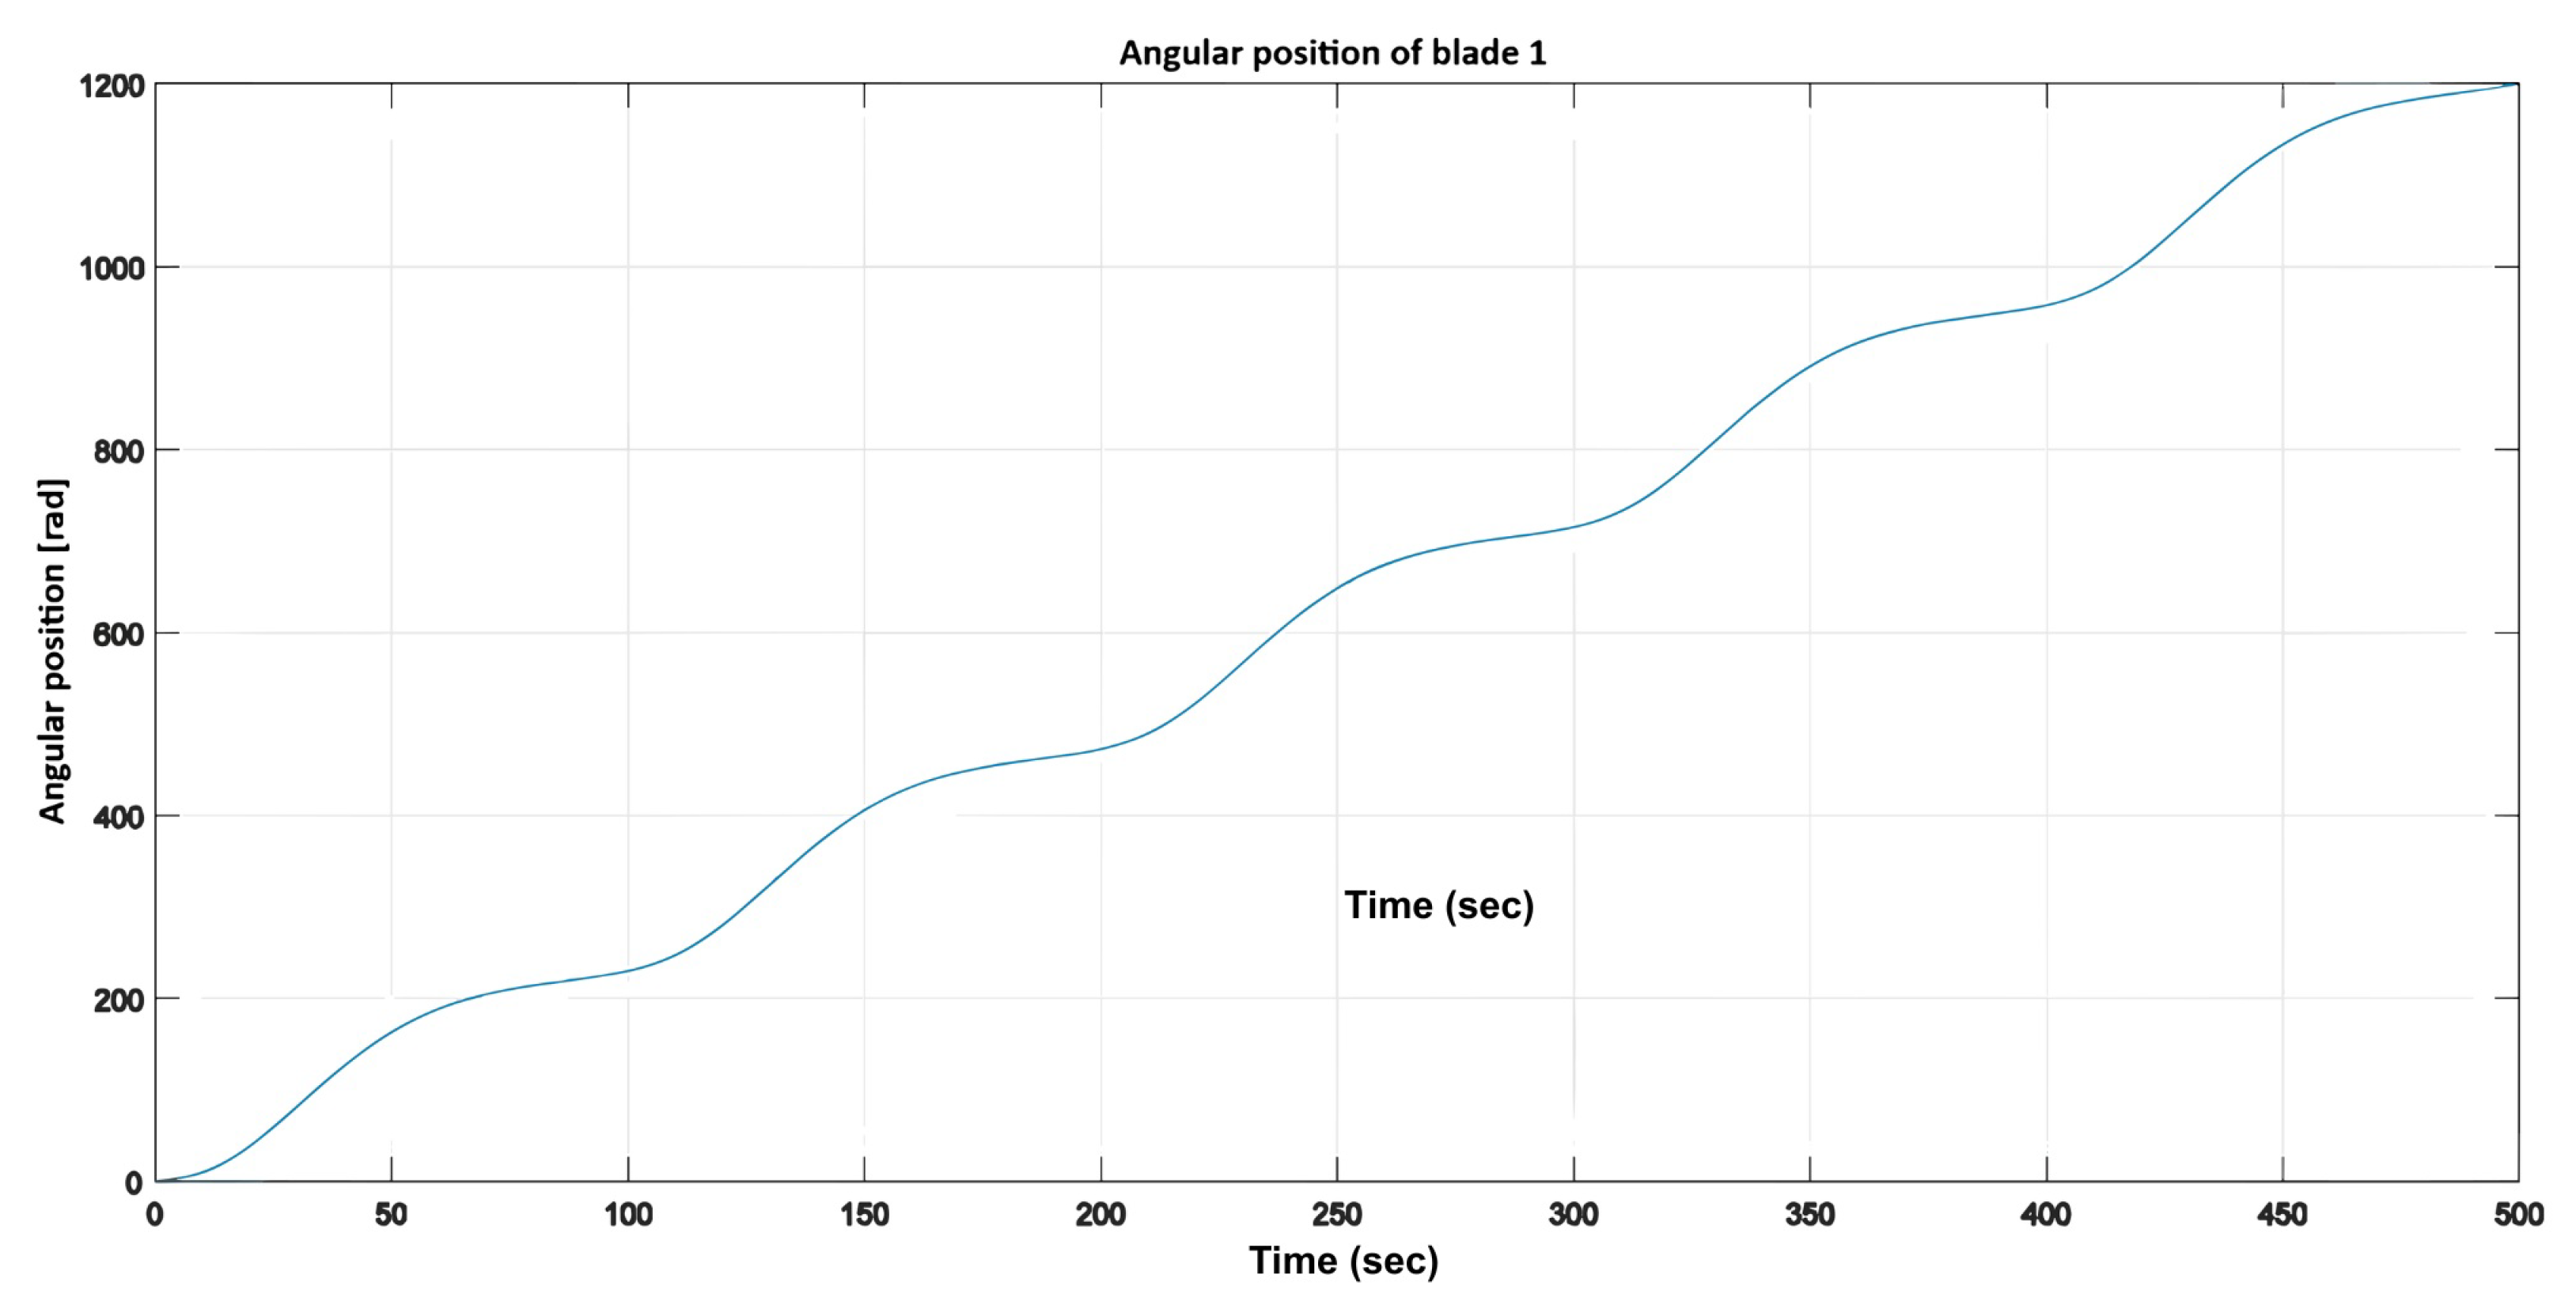
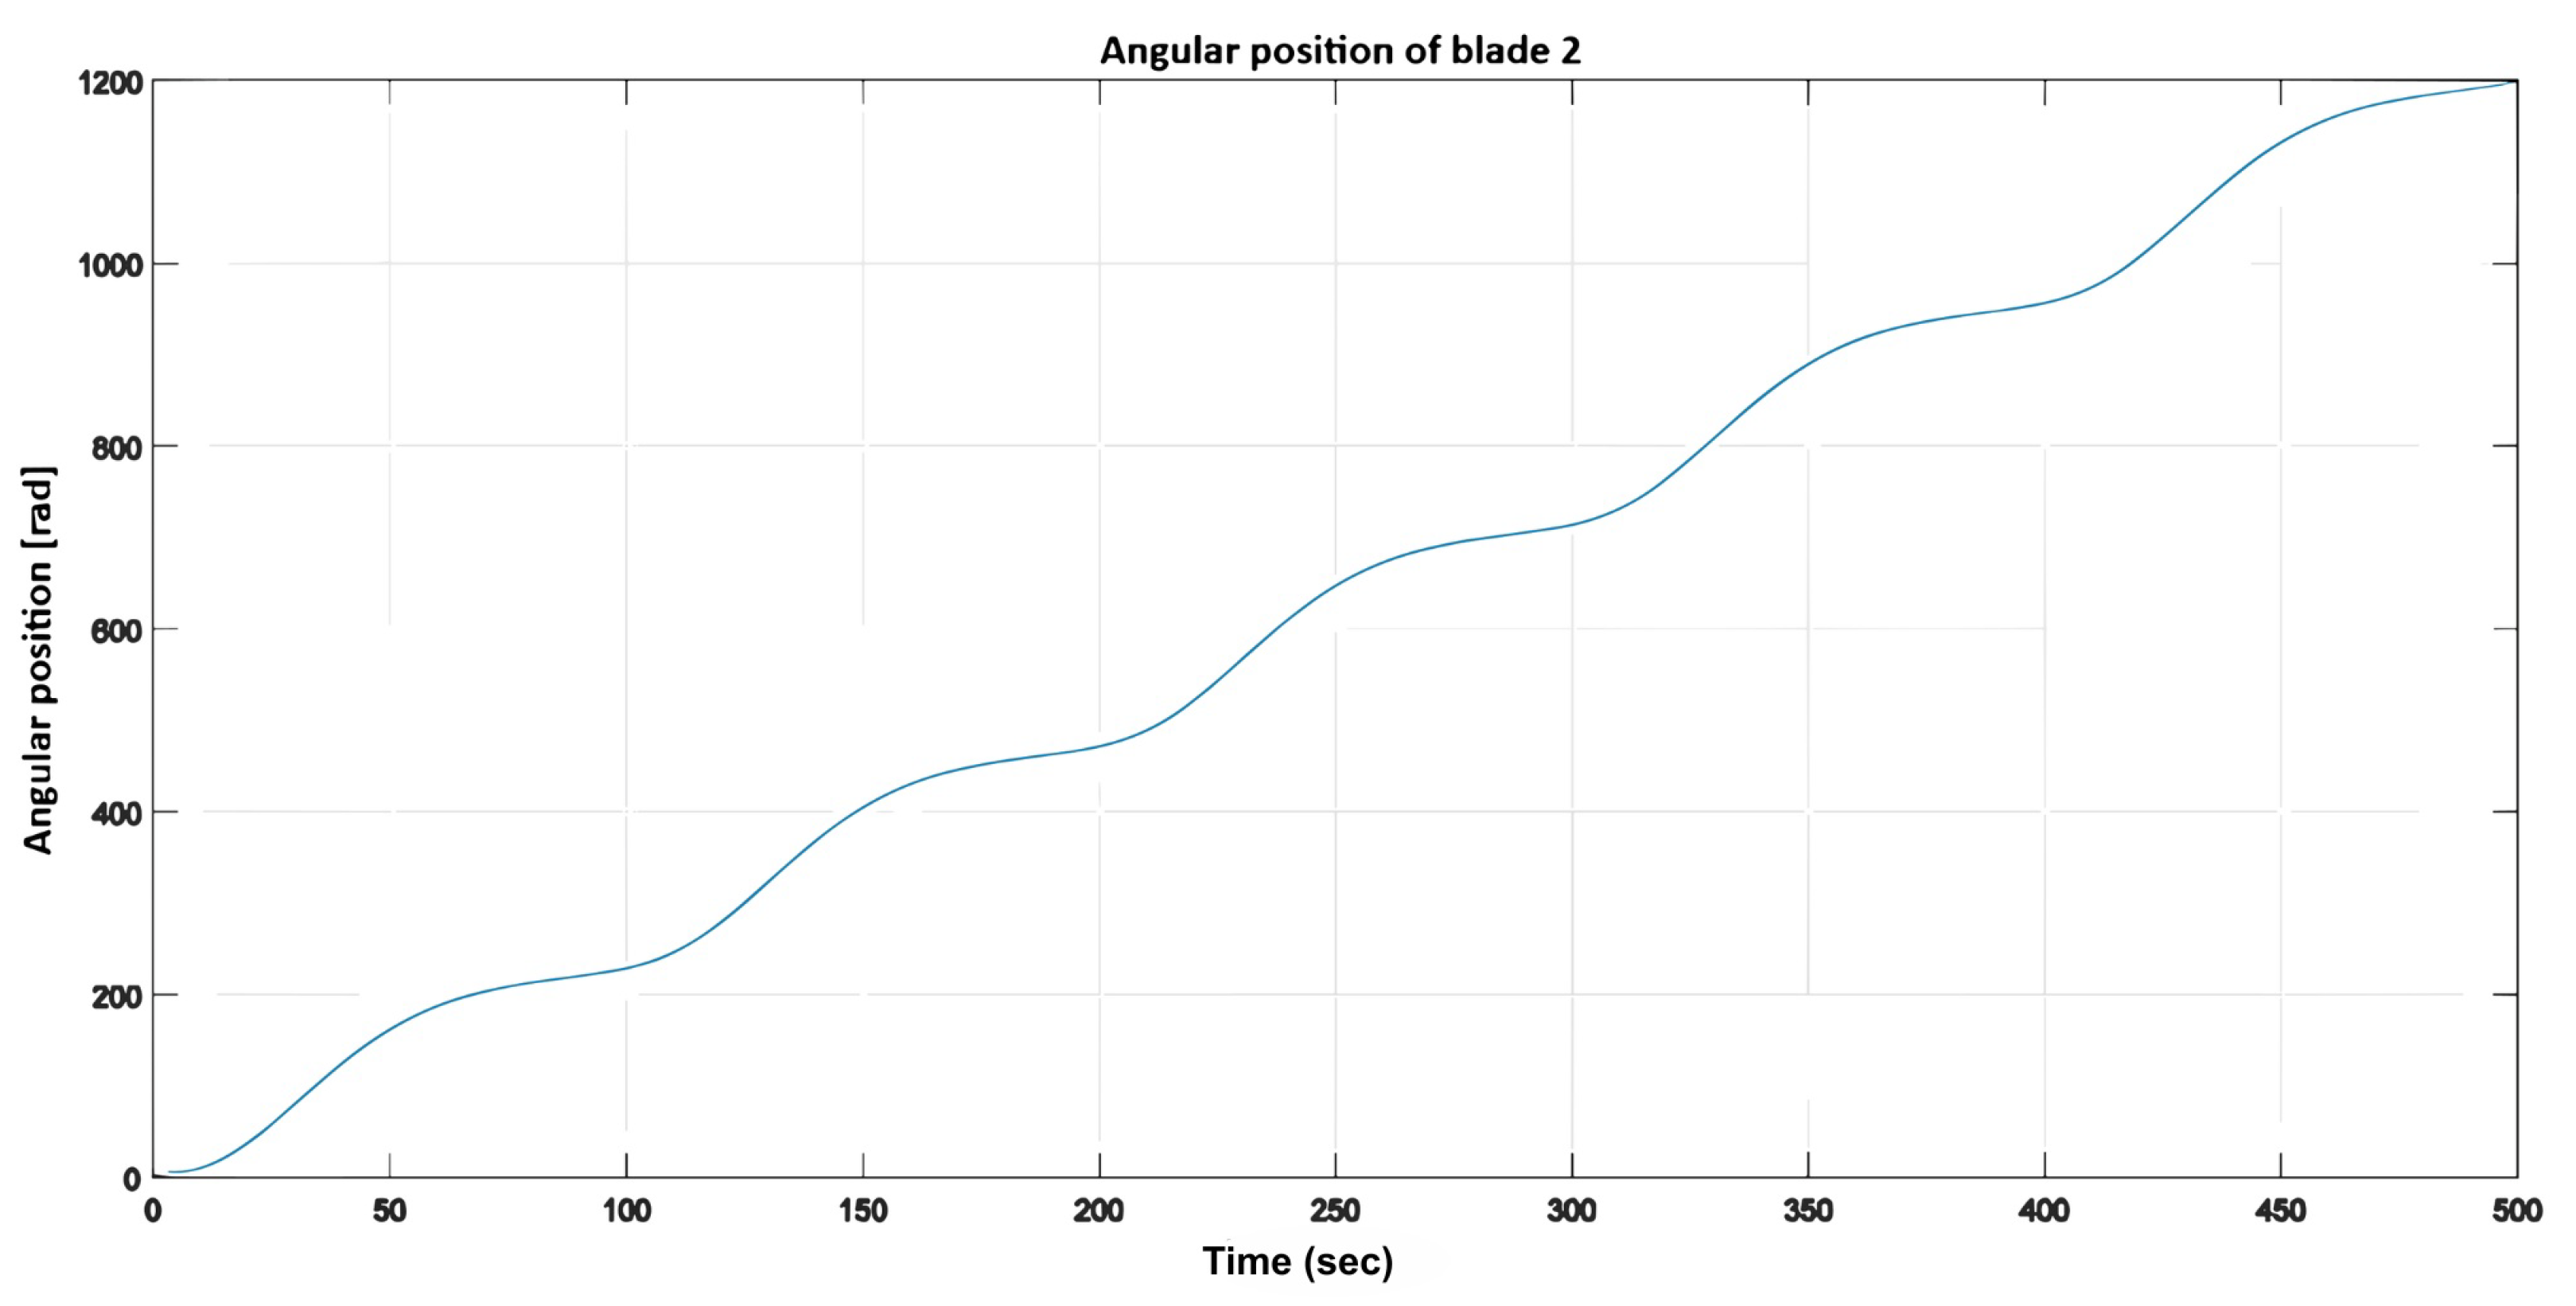
Figure 20 and
Figure 21 depict the angular position variations in accordance with the expected input period. Despite fluctuations in wind speed, the blades continued to exhibit an increasing angular position, indicating sustained rotation of the wind turbine.
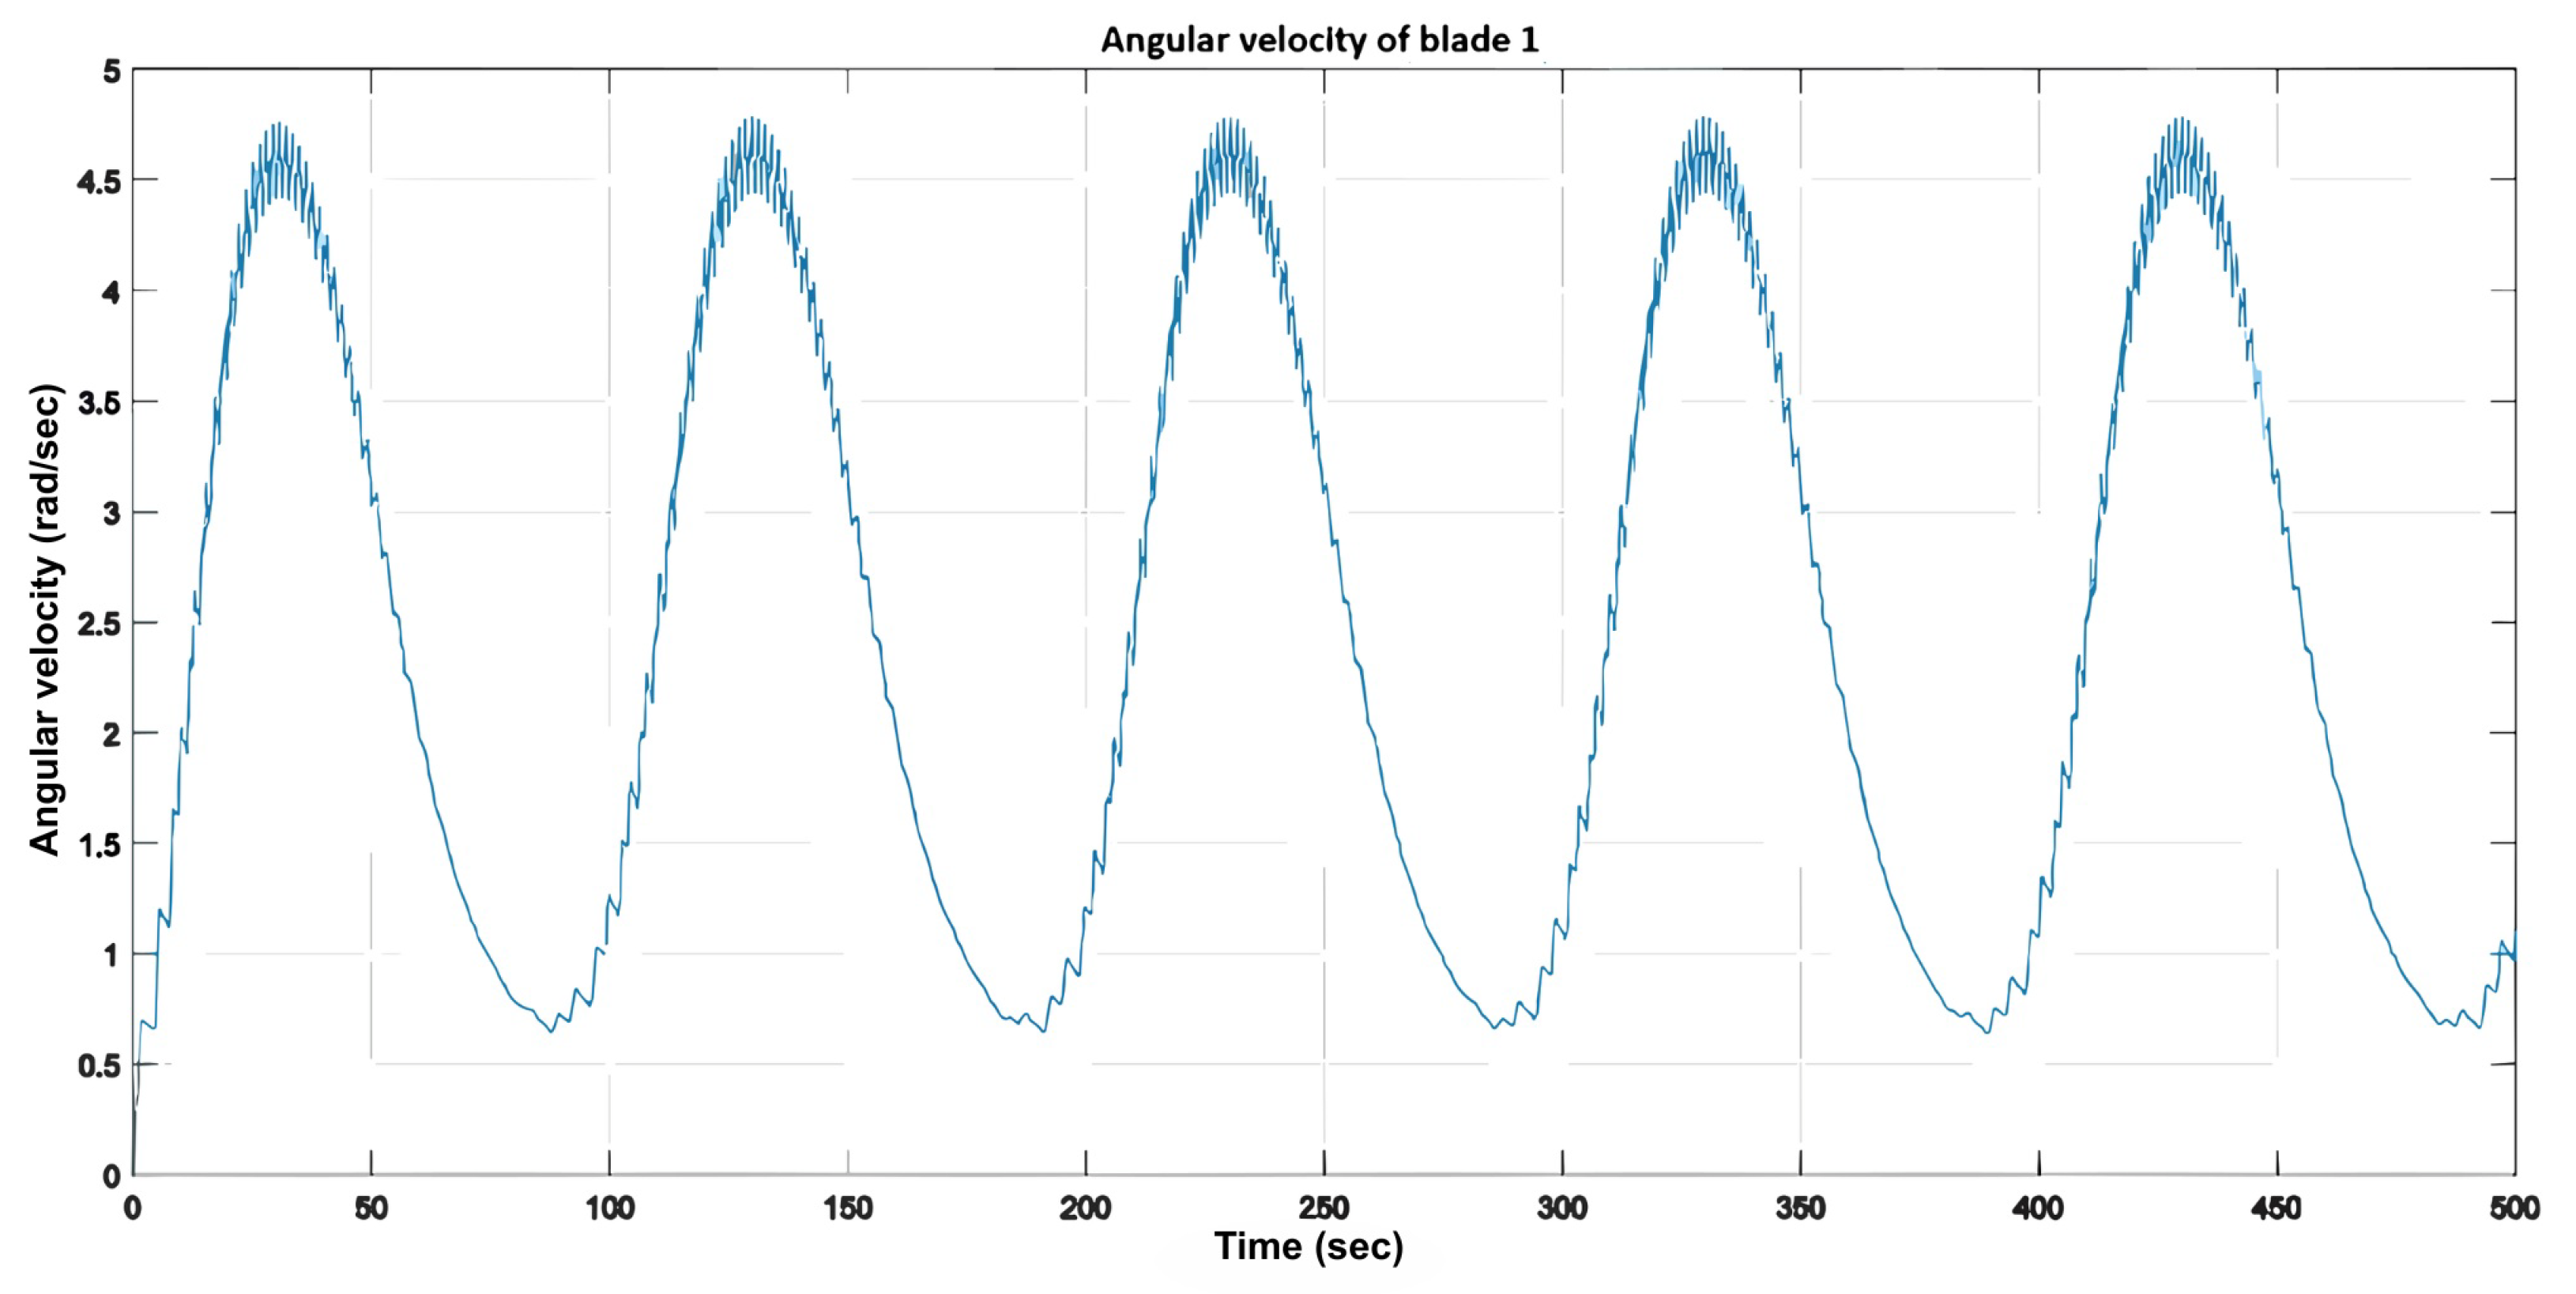
Figure 22 and
Figure 23 show that the angular velocity fluctuated within the range of 0.75 rad/s to 5 rad/s.
4. Experimental Results
For the experimental tests, a two-bladed wind turbine was constructed, with each blade having independent angular motion generated by servomotors. The turbine dimensions were defined based on three design constraints: (i) the size of the manufactured blades (dimensions provided in
Table 2), (ii) the dimensions of the wind-tunnel test section, and (iii) the size of the additional prototype components (sensors, actuators, bearings, and rotation shafts).
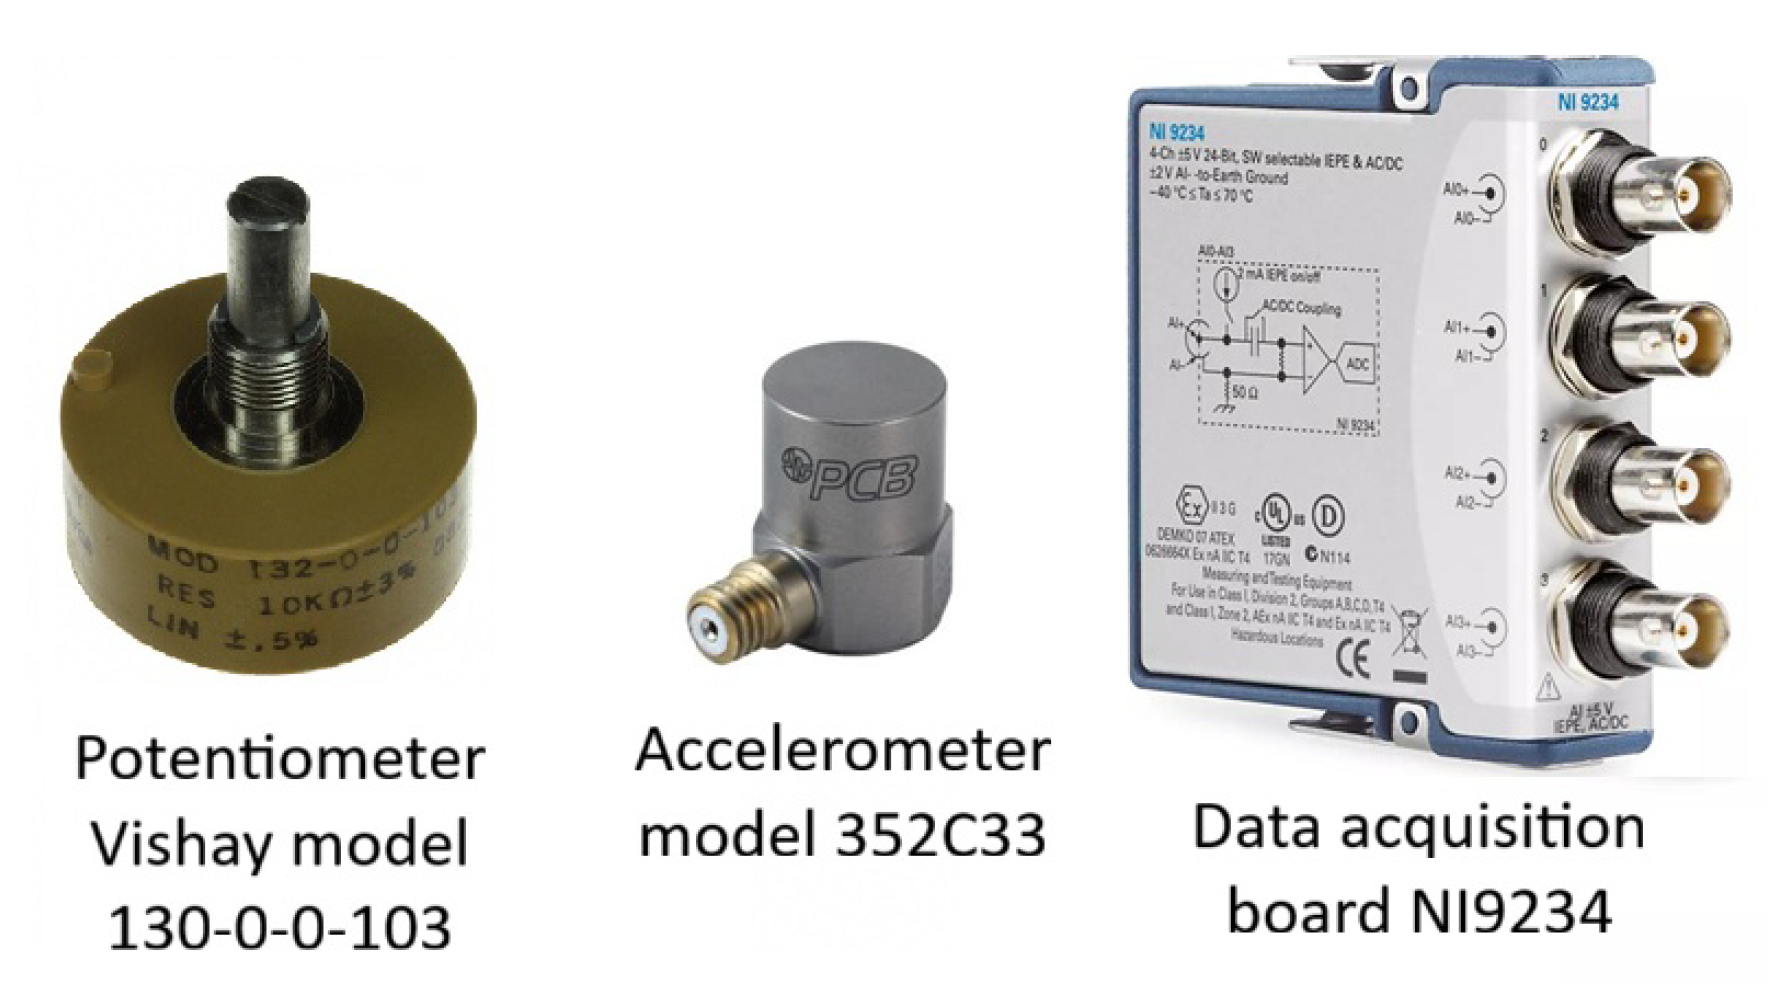
An electronic control circuit was employed to receive the analog input signal from the position sensor, which was the linear rotary potentiometer Vishay model 130-0-0-103. The wind turbine’s angular velocity and angular acceleration were computed based on the position signal recorded by the sensor. In addition to the potentiometer, an accelerometer (model 352C33) was incorporated to validate the potentiometer data. The input and output signals were acquired and transferred through an NI 9234 data acquisition board to a LabVIEW interface, where they were monitored and recorded. The electronic components are shown in
Figure 24.
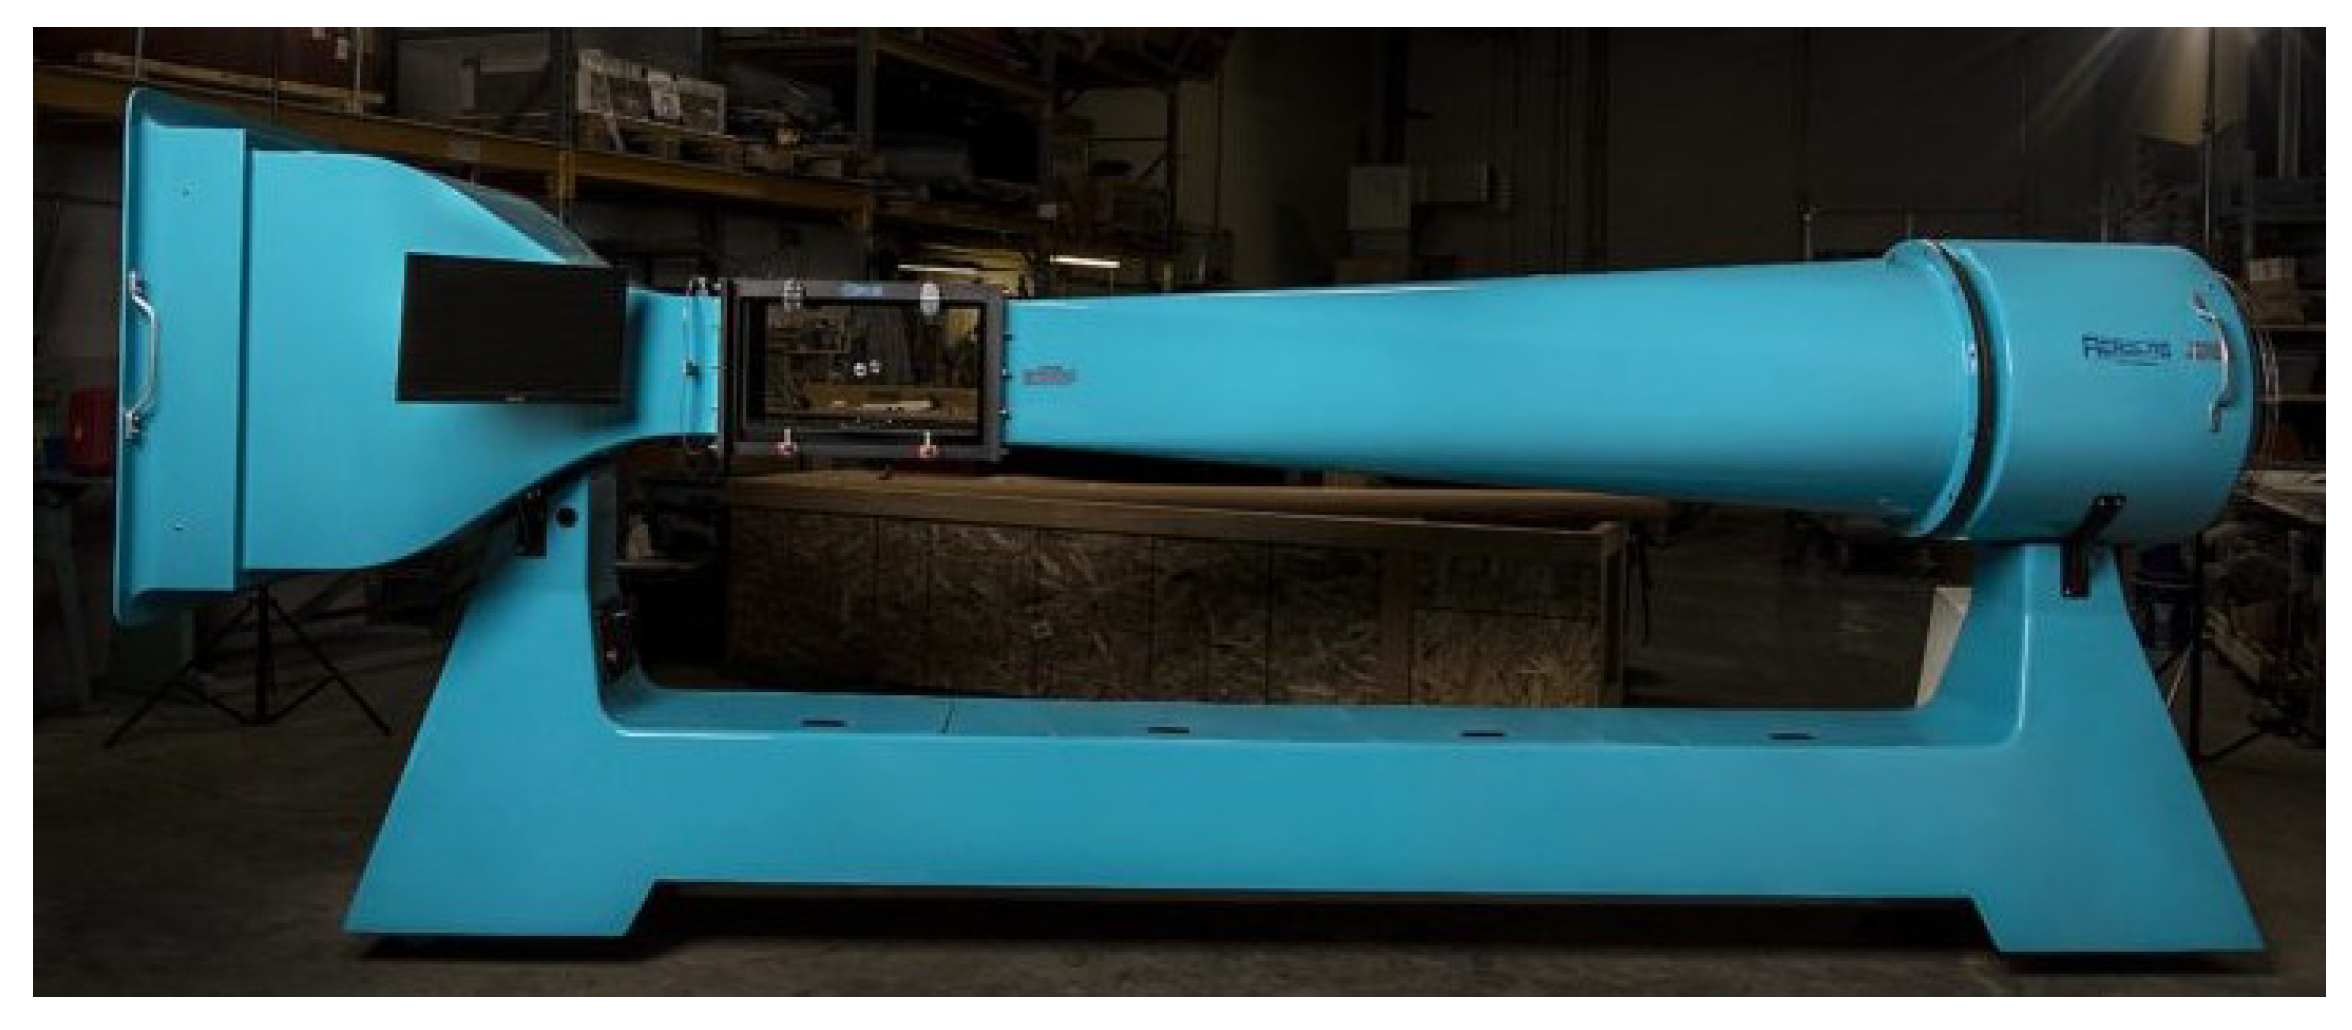
The wind tunnel used for the experimental tests is the EWT (Educational Wind Tunnel) model from Aerolab (
Figure 25). It is a low-speed suction-type tunnel with a closed test section [
30].
Table 4 lists the main characteristics of the wind tunnel.
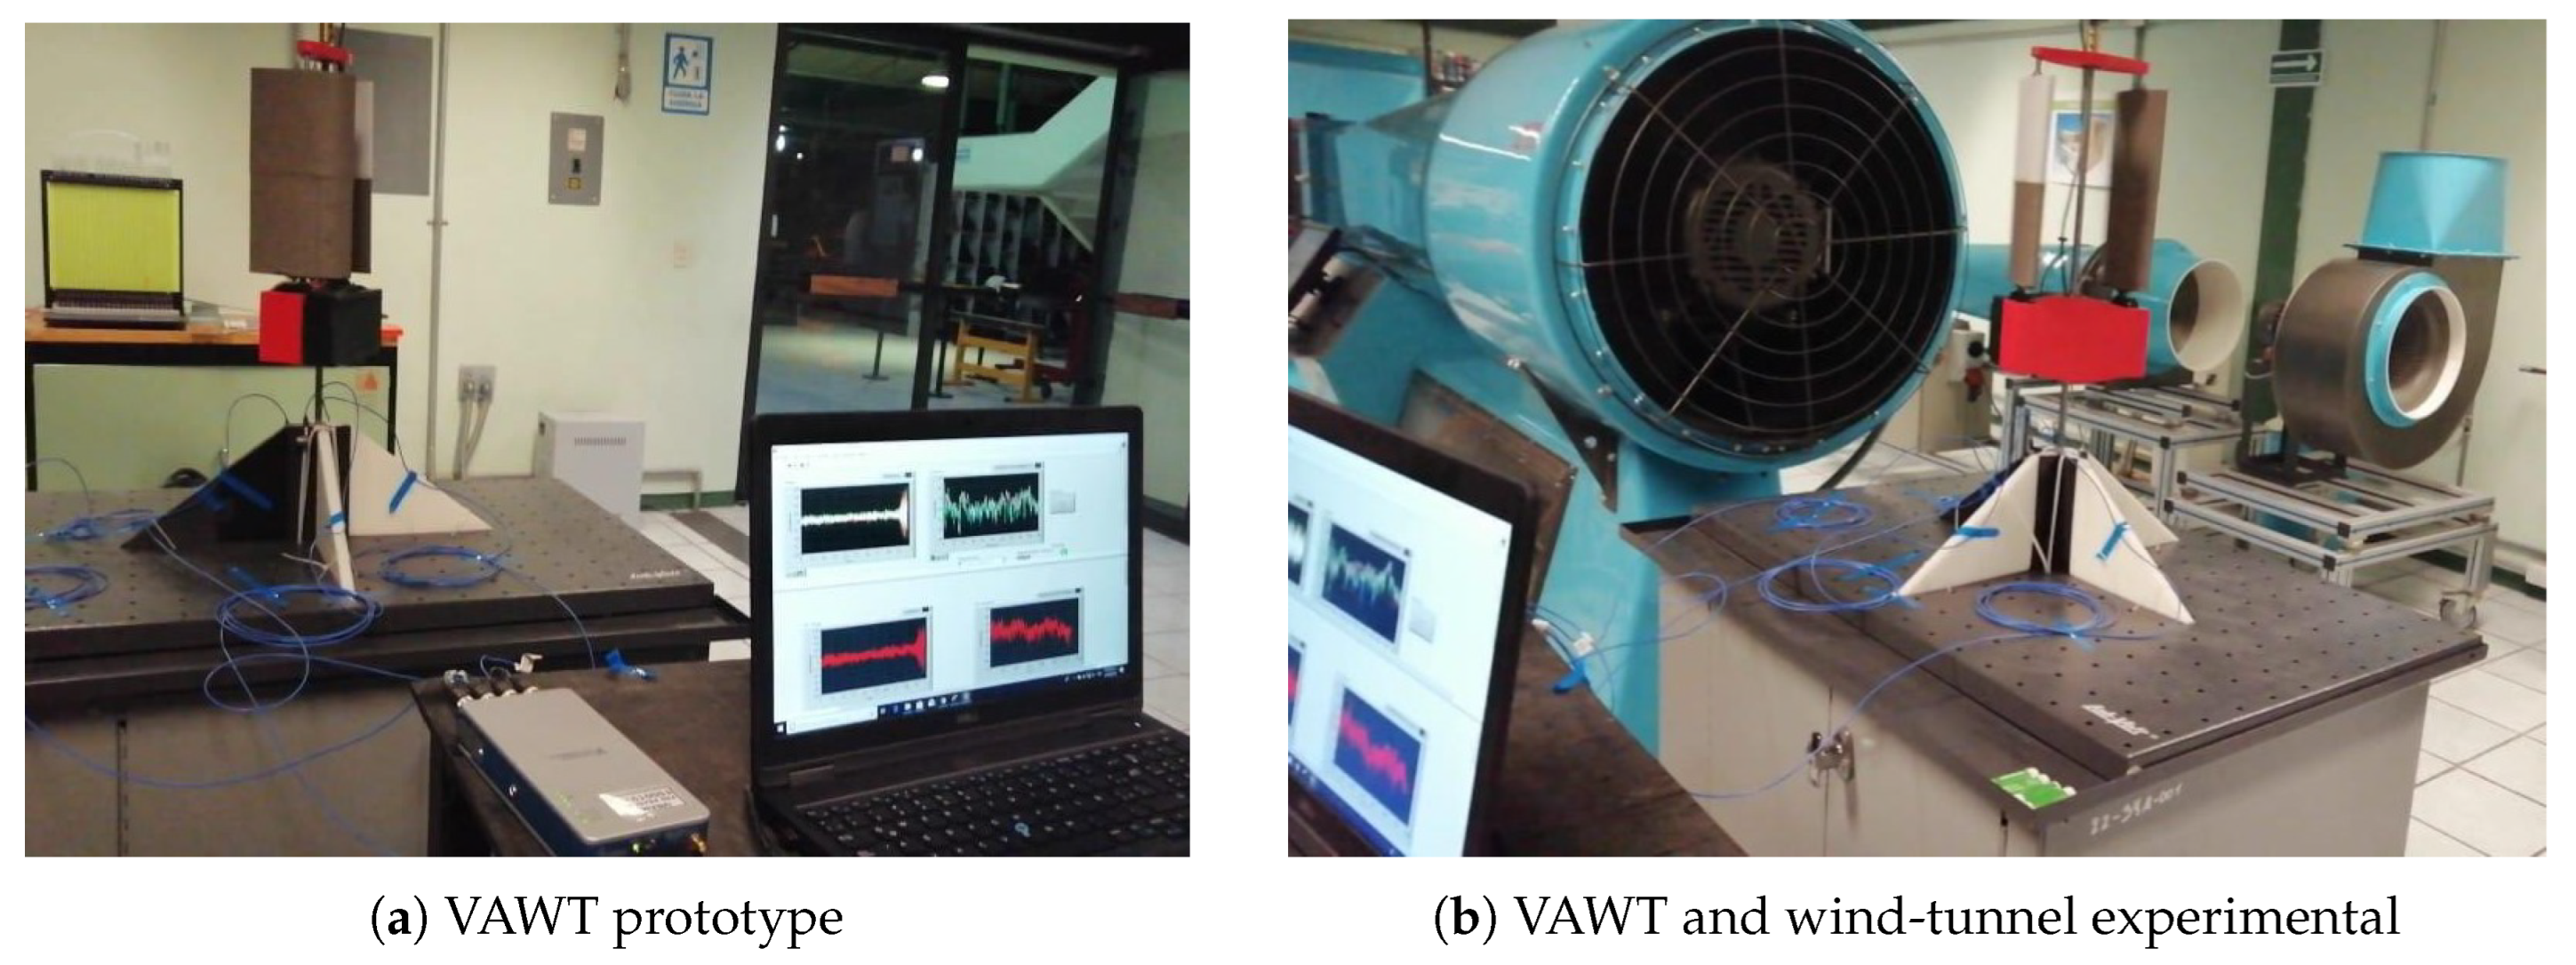
Figure 26 shows the VAWT used in the wind-tunnel experiments conducted to validate the proposed dynamic model.
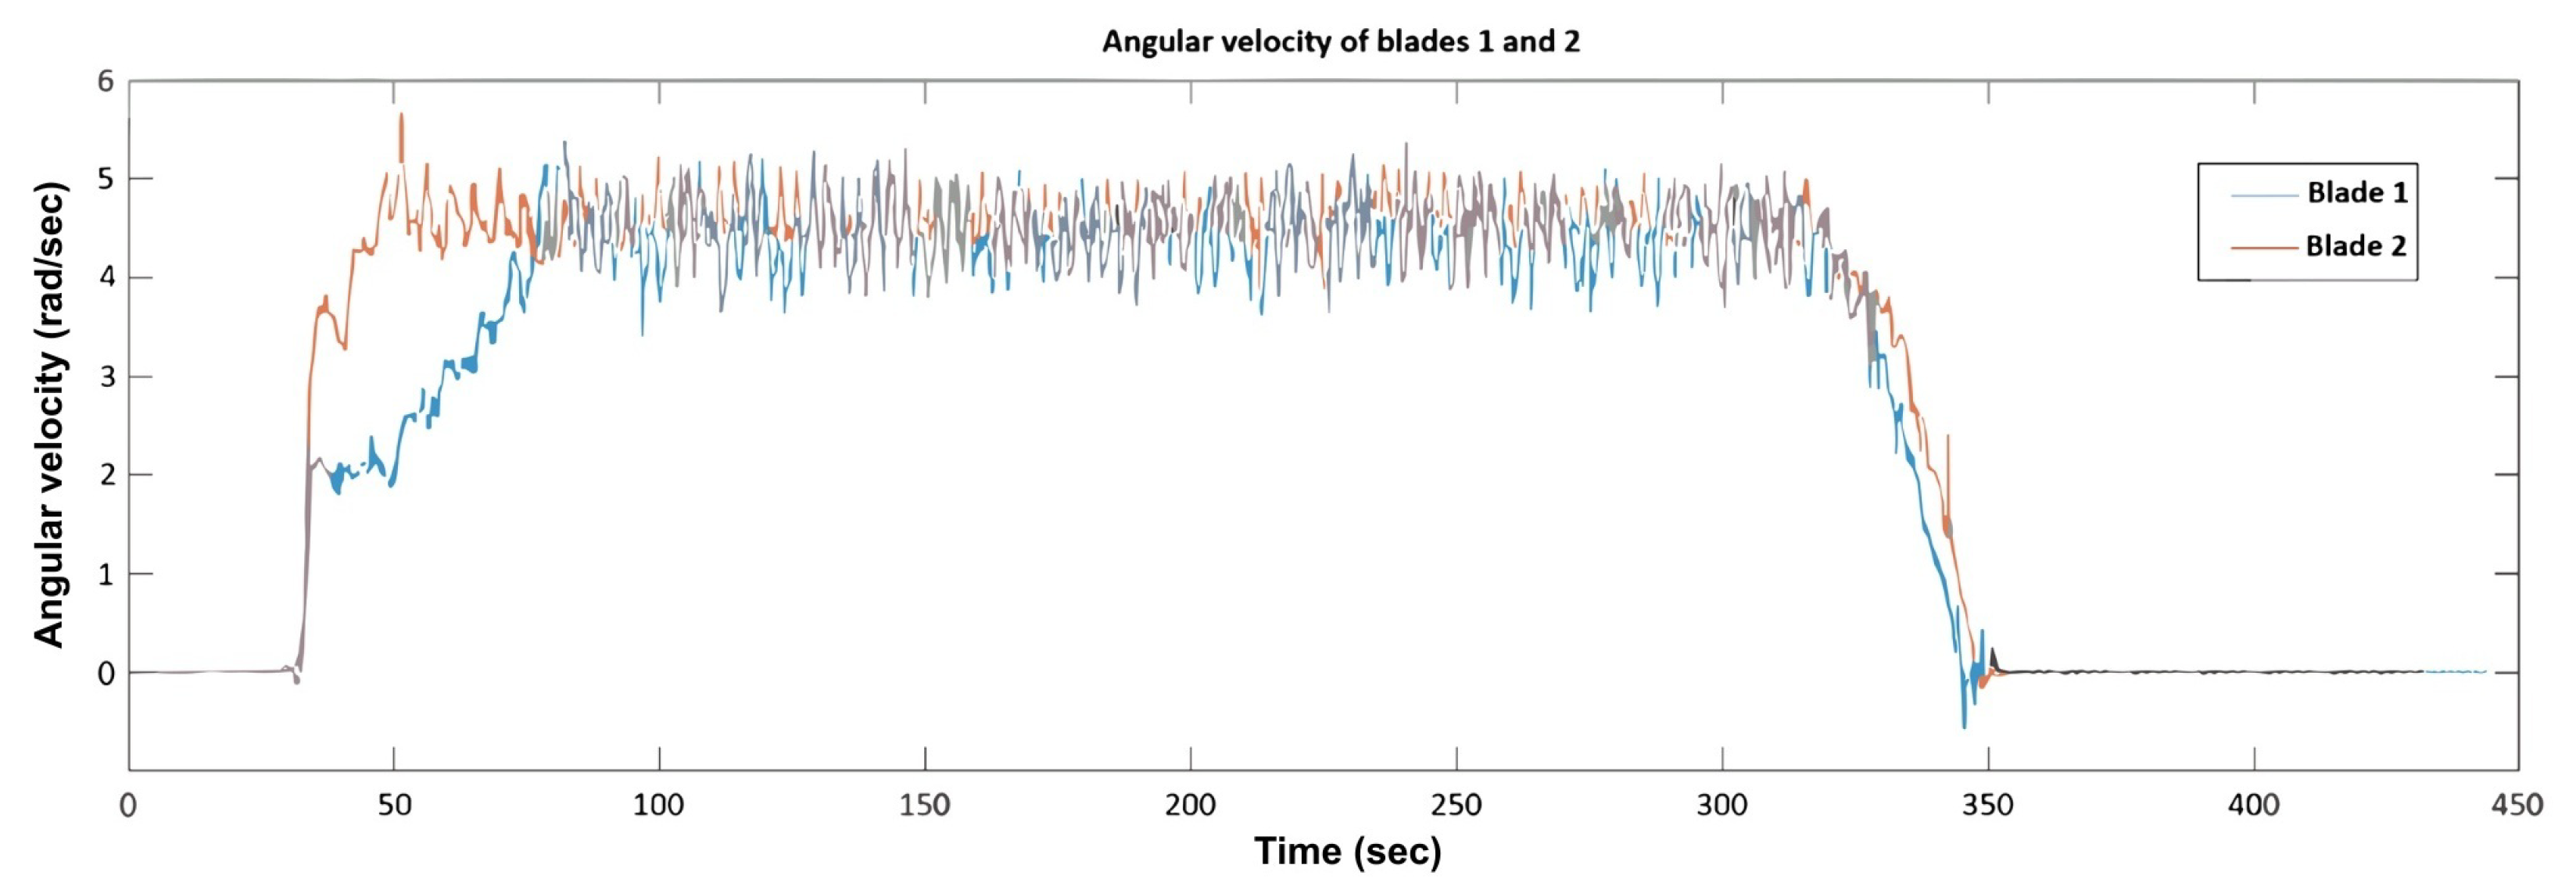
The experimental step-input test was designed to replicate the simulation scenario, enabling a direct comparison between the numerical and experimental results. As shown in
Figure 22,
Figure 23 and
Figure 27, the simulated and experimental angular velocity responses demonstrate close agreement.
In the experimental evaluation, the wind turbine was initialized from rest. The wind tunnel was operated for 4 min before shutdown, replicating the step-input excitation ().
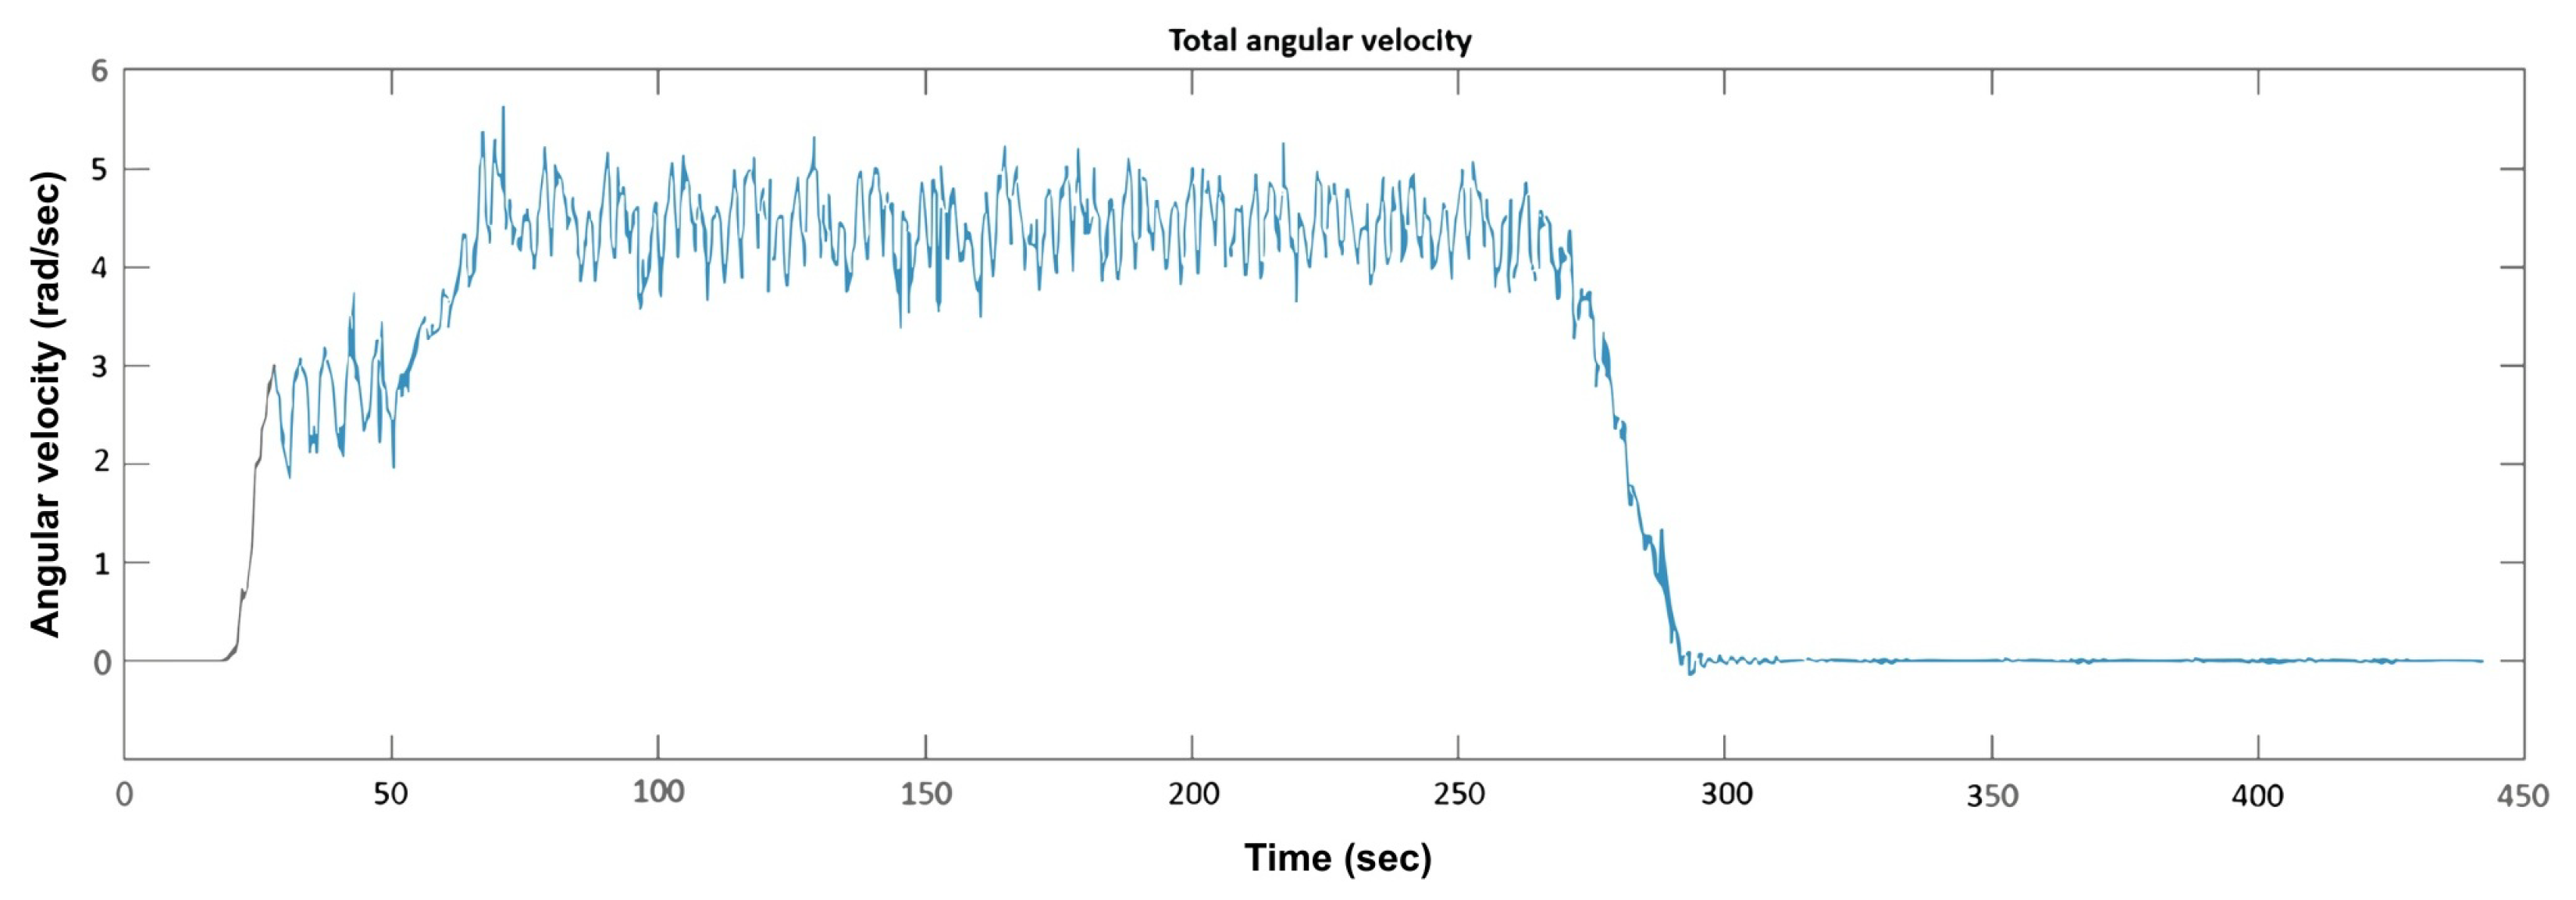
Figure 27 and
Figure 28 illustrate the real-time overall rotor angular velocity together with the individual blade angular velocities, measured using high-precision velocity-sensing instrumentation.
An initial acceleration phase of approximately 50 s was observed, followed by a transient period of about 200 s and a deceleration phase of roughly 30 s. The angular velocity fluctuated between 35 RPM (3.66 rad/s) and 55 RPM (5.75 rad/s), with an average value ranging from 40 RPM (4.2 rad/s) to 45 RPM (4.7 rad/s), consistent with the simulation predictions. Although the experimental transient settling time was slightly longer and the oscillations more pronounced, these deviations can be attributed to mechanical friction, aerodynamic losses, and wind-tunnel turbulence, which were not fully captured in the numerical model.
In summary, the experimental evaluation confirms the numerical results, thereby validating the hybrid DMST–MLP model as a robust methodology for analyzing and predicting the dynamic behavior of VAWTs.
5. Conclusions and Future Work
This study proposes and evaluates a modeling-oriented methodology designed to enhance the dynamic performance of wind turbines, with a focus on energy efficiency and system stability under varying operational conditions. Results from extensive simulations demonstrate the model’s capability to adapt to fluctuating wind speeds, highlighting its robustness and practical relevance. A comparison between the simulated and experimental data further confirms the reliability of the proposed methodology, showing close agreement with the predicted angular velocity. In addition, the implementation of a neural network for aerodynamic coefficient estimation within the DMST framework proved more efficient than interpolation-based approaches, which exhibited notable limitations in several operating conditions. The proposed approach therefore represents a significant advancement in the domain of advanced control for wind energy systems, integrating efficiency, stability, and adaptability within a unified control framework.
For future work, the development and implementation of a neural network-based control model is proposed, with the aim of autonomously and intelligently adjusting the pitch angle of wind turbine blades. Such a method would enhance the system’s responsiveness to sudden wind fluctuations, thereby increasing energy efficiency and reducing mechanical wear on turbine components. Furthermore, the integration of artificial intelligence techniques could enable real-time optimization of wind turbine performance, aligning with current advancements in intelligent renewable energy systems.
Author Contributions
Conceptualization, L.M.S.-R. and J.D.-S.; methodology, L.M.S.-R., J.D.-S. and O.M.H.-C.; software, L.M.S.-R., J.G.-B. and O.M.H.-C.; validation, J.G.-B. and J.D.-S.; formal analysis, L.M.S.-R., J.D.-S. and J.G.-B.; investigation, L.M.S.-R. and J.D.-S.; resources, J.D.-S., O.M.H.-C. and J.G.-B.; data curation, L.M.S.-R., J.D.-S. and J.G.-B.; writing—original draft preparation, L.M.S.-R.; writing—review and editing, L.M.S.-R., J.D.-S. and O.M.H.-C.; visualization, L.M.S.-R. and J.D.-S.; supervision, J.D.-S. and O.M.H.-C.; project administration, J.D.-S. and O.M.H.-C.; funding acquisition, J.D.-S. and O.M.H.-C. All authors have read and agreed to the published version of the manuscript.
Funding
This research was funded by the Programa de Investigadores e Investigadoras of the Consejo Mexiquense de Ciencia y Tecnología (COMECyT) through a Chair at the Tecnológico de Estudios Superiores de Ecatepec.
Data Availability Statement
The original contributions presented in this study are included in the article. Further inquiries can be directed to the corresponding author.
Conflicts of Interest
The authors declare no conflict of interest.
References
- International Renewable Energy Agency (IRENA). Global Renewable Generation Continues Its Strong Growth, New IRENA Capacity Data Shows, Abu Dhabi. 2018. Available online: https://www.irena.org/newsroom/pressreleases/2018/Apr/Global-Renewable-Generation-Continues-its-Strong-Growth-New-IRENA-Capacity-Data-Shows (accessed on 13 January 2025).
- Rezaeiha, A.; Kalkman, I.; Blocken, B. CFD simulation of a vertical-axis wind turbine operating at a moderate tip speed ratio: Guidelines for minimum domain size and azimuthal increment. Renew. Energy 2017, 107, 373–385. [Google Scholar] [CrossRef]
- Amar, A.; Berkache, A.; Amroune, S.; Noura, B.; Boumehani, A. Numerical modeling of dynamic stall in a vertical axis wind turbine. J. Manuf. Eng. 2022, 20, 135–145. [Google Scholar]
- Damota, J.B.; García, J.d.R.; Casanova, A.C.; Miranda, J.T.; Caccia, C.G.; Galdo, M.I.L. Analysis of a Nature-Inspired Shape for a Vertical Axis Wind Turbine. Appl. Sci. 2022, 12, 7018. [Google Scholar] [CrossRef]
- Abdalrahman, G.; Daoud, M.A.; Melek, W.W.; Lien, F.-S.; Yee, E. Design and Implementation of an Intelligent Blade Pitch Control System and Stability Analysis for a Small Darrieus Vertical-Axis Wind Turbine. Energies 2022, 15, 235. [Google Scholar] [CrossRef]
- Chen, W.; Lam, T.T.; Chang, M.; Jin, L.; Chueh, C.; Augusto, G.L. Optimizing H-Darrieus Wind Turbine Performance with Double-Deflector Design. Energies 2024, 17, 503. [Google Scholar] [CrossRef]
- Zhao, Z.; Yan, C.; Wang, T.; Xu, B.; Zeng, G. Study on variable pitch strategy of VAWT based on double multiple stream tubes model. J. Mech. Eng. 2019, 54, 168–174. [Google Scholar] [CrossRef]
- Peng, Y.-X.; Xu, Y.-L.; Zhan, S. A hybrid DMST model for pitch optimization and performance assessment of high-solidity straight-bladed vertical axis wind turbines. Appl. Energy 2019, 250, 215–224. [Google Scholar] [CrossRef]
- Ayati, A.A.; Selig, M.S. A double-multiple streamtube model for vertical axis wind turbines of arbitrary rotor loading. Wind. Energy Sci. 2019, 4, 653–664. [Google Scholar] [CrossRef]
- Hijazi, A.; Elcheikh, A.; Elkhoury, M. Numerical investigation of the use of flexible blades for vertical axis wind turbines. Energy Convers. Manag. 2024, 299, 117867. [Google Scholar] [CrossRef]
- Roy, L.; Kincaid, K.; Mahmud, R.; MacPhee, D.W. Double-Multiple Streamtube Analysis of a Flexible Vertical Axis Wind Turbine. Fluids 2021, 6, 118. [Google Scholar] [CrossRef]
- Wang, Q.; Zhao, Q. Numerical Study on Dynamic-Stall Characteristics of Finite Wing and Rotor. Appl. Sci. 2019, 9, 600. [Google Scholar] [CrossRef]
- Sanaye, S.; Hosseinkhani, A. Innovative multiobjective optimization of a curved-blade vertical axis wind turbine modeled by modified double multiple streamtube method. Energy Sci. Eng. 2024, 12, 2118–2136. [Google Scholar] [CrossRef]
- García-Barrera, J.; Díaz-Salgado, J.; Huerta-Chávez, O.M.; Sánchez-López, R. Modeling, Simulation and Analysis of the Characteristics of the Non-conventional Vertical Axis Wind Turbine with Variable Pitch Angle that Allows to Establish Different Control Strategies. In Industrial and Robotic Systems (LASIRS 2019), Mechanisms and Machine Science; Springer: Cham, Switzerland, 2020; Volume 86, pp. 109–118. [Google Scholar] [CrossRef]
- Tona, G.L.; Luna, M.; Piazza, M.C.D.; Pucci, M.; Accetta, A. Development of a High-Performance, FPGA-Based Virtual Anemometer for Model-Based MPPT of Wind Generators. Electronics 2020, 9, 83. [Google Scholar] [CrossRef]
- Damota, J.B.; García, J.d.R.; Casanova, A.C.; Miranda, J.T.; Caccia, C.G.; Galdo, M.I.L. Optimization of a Nature-Inspired Shape for a Vertical Axis Wind Turbine through a Numerical Model and an Artificial Neural Network. Appl. Sci. 2022, 12, 8037. [Google Scholar] [CrossRef]
- Shin, H.; Rüttgers, M.; Lee, S. Neural Networks for Improving Wind Power Efficiency: A Review. Fluids 2022, 7, 367. [Google Scholar] [CrossRef]
- Abdalrahman, G.; Jldain, H.B. Individual Blade Pitch Controller Based on Fuzzy Logic Control (FLC) and Artificial Neural Networks (ANNs) for a Small H-Darrieus Vertical Axis Wind Turbine. J. Eng. Res. 2024, 18, 1–15. Available online: http://uot.edu.ly/journals/index.php/jer/article/view/1156 (accessed on 11 February 2025).
- González-Juez, P.L.; Martínez-Delgado, L.; Ramírez-Tagle, R. Surrogate aerodynamic wing modeling based on a multilayer perceptron. Aerospace 2021, 10, 149. [Google Scholar]
- Semrau, G. Dynamic Modeling and Characterization of a Wind Turbine System Leading to Controls Development. Master’s Thesis, Department of Mechanical Engineering, Rochester Institute of Technology, New York, NY, USA, 2010. Available online: https://repository.rit.edu/theses/5810 (accessed on 18 April 2025).
- Abdalrahman, G.; Melek, W.W.; Lien, F.-S. Pitch angle control for a small-scale Darrieus vertical axis wind turbine with straight blades (H-Type VAWT). Renew. Energy 2017, 114, 1353–1362. [Google Scholar] [CrossRef]
- Santoso, S.; Le, H.T. Fundamental time–domain wind turbine models for wind power studies. Renew. Energy 2007, 32, 2436–2452. [Google Scholar] [CrossRef]
- Thomsen, S.C. Nonlinear Control of a Wind Turbine. Master’s Thesis, Informatics and Mathematical Modelling, Technical University of Denmark (DTU), Kongens Lyngby, Denmark, 2006. [Google Scholar]
- Baburajan, S. Pitch Control of Wind Turbine Through PID, Fuzzy and Adaptive Fuzzy-PID Controllers. Master’s Thesis, Department of Electrical Engineering (KGCOE), Rochester Institute of Technology, New York, NY, USA, October 2017. [Google Scholar]
- Beri, H.; Yao, Y. Double Multiple Streamtube Model and Numerical Analysis of Vertical Axis Wind Turbine. Energy Power Eng. 2011, 3, 262–270. [Google Scholar] [CrossRef]
- Mohammed, A.A.; Ouakad, H.M.; Sahin, A.Z.; Bahaidarah, H.M.S. Parametric Study and Comparison of Aerodynamics Momentum-Based Models for Straight-Bladed Vertical Axis Wind Turbines. Arab. J. Sci. Eng. 2020, 45, 729–741. [Google Scholar] [CrossRef]
- Tudela, J.C. Small-Scale Vertical Axis Wind Turbine Design. Bachelor’s Thesis, Department of Aeronautical Engineering, Tampere University of Applied Sciences, Tampere, Finland, December 2011. Available online: https://www.theseus.fi/handle/10024/39150 (accessed on 18 May 2025).
- Mohammed, A.A.; Ouakad, H.M.; Sahin, A.Z.; Bahaidarah, H.M.S. Vertical Axis Wind Turbine Aerodynamics: Summary and Review of Momentum Models. J. Energy Resour. Technol. 2019, 141, 050801. [Google Scholar] [CrossRef]
- Sheldahl, R.E.; Klimas, P.C. Aerodynamic Characteristics of Seven Symmetrical Airfoil Sections Through 180-Degree Angle of Attack for Use in Aerodynamic Analysis of Vertical Axis Wind Turbines; Technical Report SAND80-2114; Sandia National Laboratories: Albuquerque, NM, USA, 1981. [Google Scholar]
- Aerolab. Educational Wind Tunnel (EWT). Available online: https://www.aerolab.com/aerolab-products/educational-wind-tunnel-ewt/ (accessed on 27 September 2025).
Figure 1.
Vertical-axis wind turbine (VAWT) prototype with variable-pitch blades.
Figure 1.
Vertical-axis wind turbine (VAWT) prototype with variable-pitch blades.
Figure 2.
Two-actuator disc model.
Figure 2.
Two-actuator disc model.
Figure 3.
Single streamtube model.
Figure 3.
Single streamtube model.
Figure 4.
Multiple streamtube model.
Figure 4.
Multiple streamtube model.
Figure 5.
Structure of the MLP–ANN model.
Figure 5.
Structure of the MLP–ANN model.
Figure 6.
Predicted vs. reference and .
Figure 6.
Predicted vs. reference and .
Figure 7.
Relative error vs. for and .
Figure 7.
Relative error vs. for and .
Figure 8.
Rotational mechanical system.
Figure 8.
Rotational mechanical system.
Figure 9.
Block diagram of the dynamic algorithm.
Figure 9.
Block diagram of the dynamic algorithm.
Figure 10.
Wind-speed input.
Figure 10.
Wind-speed input.
Figure 11.
Total torque generated by the blades.
Figure 11.
Total torque generated by the blades.
Figure 12.
Torque generated by blades 1 and 2.
Figure 12.
Torque generated by blades 1 and 2.
Figure 13.
Angular position of blade 1.
Figure 13.
Angular position of blade 1.
Figure 14.
Angular position of blade 2.
Figure 14.
Angular position of blade 2.
Figure 15.
Angular velocity of blade 1.
Figure 15.
Angular velocity of blade 1.
Figure 16.
Angular velocity of blade 2.
Figure 16.
Angular velocity of blade 2.
Figure 17.
Wind speed from input .
Figure 17.
Wind speed from input .
Figure 19.
Torque of blades 1 and 2.
Figure 19.
Torque of blades 1 and 2.
Figure 20.
Angular position of blade 1.
Figure 20.
Angular position of blade 1.
Figure 21.
Angular position of blade 2.
Figure 21.
Angular position of blade 2.
Figure 22.
Angular velocity of blade 1.
Figure 22.
Angular velocity of blade 1.
Figure 23.
Angular velocity of blade 2.
Figure 23.
Angular velocity of blade 2.
Figure 24.
Electronic components of the VAWT prototype.
Figure 24.
Electronic components of the VAWT prototype.
Figure 25.
EWT (Educational Wind Tunnel).
Figure 25.
EWT (Educational Wind Tunnel).
Figure 26.
Experimental tests.
Figure 26.
Experimental tests.
Figure 27.
Angular velocity of blades 1 and 2.
Figure 27.
Angular velocity of blades 1 and 2.
Figure 28.
Real-time total angular velocity.
Figure 28.
Real-time total angular velocity.
Table 1.
Summary of MLP–ANN configuration, training parameters, and prediction errors.
Table 1.
Summary of MLP–ANN configuration, training parameters, and prediction errors.
| Category | Specification |
|---|
| Inputs | Angle of attack (), Reynolds number (),
standardized. |
| Outputs | Lift coefficient (), drag coefficient (), standardized (z-score). |
| Dataset | approx. 10,000 samples (CFD + experimental), [, ],
[, ]. |
| Split | 70% training, 15% validation, 15% testing. |
| Architecture | 3 hidden layers: 128 → 64 → 32 neurons. |
| Activations | ReLU (hidden layers), linear (output). |
| Optimizer | Adam () + ReduceLROnPlateau scheduler. |
| Loss function | Mean squared error (MSE). |
| Batch∕Epochs | Batch size = 64, max. epochs = 1000, early stopping
(patience = 40). |
| Regularization | , dropout = 0.0. |
| Evaluation | RMSE: ≈ 0.01–0.05, ≈ 0.001–0.02; error (%): ≈ 1–5%,
≈ 5–15%. |
Table 2.
Physical parameters.
Table 2.
Physical parameters.
| Parameter | Value | Unit |
|---|
| Number of blades | 2 | unit |
| Blade chord | 0.3 | m |
| Blade length | 2.0 | m |
| Wind turbine radius | 2.0 | m |
Table 3.
Simulation parameters.
Table 3.
Simulation parameters.
| Parameter | Test 1 | Test 2 |
|---|
| Wind speed | | |
| Initial angular position | | |
| Initial angular velocity | | |
Table 4.
Main characteristics of the wind tunnel.
Table 4.
Main characteristics of the wind tunnel.
| Parameter | Value | Unit |
|---|
| Speed range | 4.5–65 | m/s |
| Turbulence level | <0.2 | % |
| Reynolds number | 1.4 × 10⁶ | — |
| Test camera dimension | 30.5 × 30.5 × 61 | cm |
| Power | 7.5 | kW |
| Disclaimer/Publisher’s Note: The statements, opinions and data contained in all publications are solely those of the individual author(s) and contributor(s) and not of MDPI and/or the editor(s). MDPI and/or the editor(s) disclaim responsibility for any injury to people or property resulting from any ideas, methods, instructions or products referred to in the content. |
© 2025 by the authors. Licensee MDPI, Basel, Switzerland. This article is an open access article distributed under the terms and conditions of the Creative Commons Attribution (CC BY) license (https://creativecommons.org/licenses/by/4.0/).
