1. Introduction
With the increasing severity of pollution and gradual environmental degradation, improving the quality of images captured in turbid media has become a crucial research topic for many scientific tasks and daily life applications [
1]. The absorption, scattering, and reflection characteristics of electromagnetic waves at different wavelengths are significantly affected by fog [
2], leading to low contrast [
3] and distortion issues [
4,
5] in outdoor images captured under hazy conditions. Currently, how to effectively enhance image quality through dehazing has become a focal point of research. To date, numerous image dehazing techniques have been proposed, some of which have found extensive applications in fields such as navigation [
6,
7], target detection [
8,
9], and underwater robotics [
10]. Current image dehazing technologies are mainly divided into two categories. The first involves image enhancement techniques, which focus solely on improving target contrast without considering image degradation causes, resulting in inconsistent enhancement effects across different fog conditions and limited dehazing performance. Therefore, most current methods employ image restoration-based approaches, such as the dark channel prior method [
11] and deep learning-based dehazing methods [
12,
13]. Polarization-based dehazing has emerged as an excellent strategy for restoring details in hazy images. Schechner et al. first proposed traditional polarization-based dehazing methods [
14], achieving promising results by capturing “brightest and “darkest” intensity images using linear polarizers combined with physical models. Subsequent research explored optimal sky region selection [
15,
16,
17] to further enhance restored image details. With hardware advancements enabling polarization cameras to acquire multi-channel polarized images in different orientations, Liang et al. introduced Stokes vectors for polarization-based dehazing [
18,
19,
20], improving algorithm robustness. Later studies combined polarization models with deep learning to mitigate haze effects [
21,
22]. However, these traditional polarization-based models assume non-polarized targets, attributing all polarization characteristics to atmospheric light. This assumption fails when targets exhibit significant polarization properties, prompting the development of algorithms combining target and atmospheric polarization information [
23]. Subsequent advancements implemented polarization-based boundary constraints considering sensor polarization performance [
24], achieving improved results. While these algorithms consider joint polarization of atmospheric and target light, they oversimplify by assuming additive polarization degrees while ignoring polarization angle variations. In reality, the combined polarization of target and atmospheric light involves complex interactions. However, deep learning-based dehazing models tend to rely too heavily on datasets and are not particularly effective in scenarios they have not been trained on.
To better address the issue of significantly reduced image contrast and visibility caused by turbid media such as dense fog, this paper proposes a novel polarization-based dehazing model for single images. This model integrates polarization optics theory with the dark channel prior method, combining them through guided filtering of polarization degree images to obtain more accurate atmospheric light information. This approach reduces errors caused by inaccurate estimation of atmospheric light.
Using polarization optics theory, a more precise nonlinear joint polarization model for atmospheric light and airlight is established. This physical model is projected into a Cartesian coordinate system, abstracted into a mathematical framework, and expressed as an analytical geometric model for joint polarization. Subsequently, based on the principle of structural similarity in images, the maximum window polarization information within the image scene is used as a boundary constraint to improve the estimation accuracy of target light.
Finally, image dehazing and enhancement are achieved using the atmospheric scattering model. Experimental results demonstrate that, as a blind image dehazing algorithm, the proposed model does not rely on dataset training. Compared to existing dehazing methods, it achieves superior image restoration and enhancement across multiple scenarios while maintaining the highest structural consistency, thus yielding results closest to natural observation. We combine the dark channel prior theory with polarization optics theory to acquire more accurate polarization information of atmospheric light and intensity at infinity. We employ vector representation to characterize the joint polarization process, establishing a novel analytical geometry-based model for image dehazing. Our boundary constraints derived from the maximum window polarization degree facilitate precise pixel-level airlight estimation while reducing errors.
The remainder of this paper is organized as follows:
Section 2 introduces fundamental concepts, including the atmospheric scattering model and Stokes vector, and derives the theoretical framework.
Section 3 presents experimental validation of the theoretical model, implementing image dehazing through atmospheric window selection via dark channel prior combined with polarization optics, followed by practical implementation.
Section 4 provides subjective and objective evaluations of experimental results, along with conclusions and recommendations.
2. Theoretical Model
As shown in
Figure 1, under foggy conditions, sunlight and the original target light undergo scattering by atmospheric particles, forming airlight and target light, which leads to blurred imaging. Using a polarization camera, polarized images can ultimately be obtained in such foggy weather. McCartney proposed the atmospheric scattering model, which has been widely used in dehazing algorithms. The formula for the atmospheric scattering model is as follows [
25]:
In Equation (
1),
I represents the foggy image captured by the detector;
D represents the directly transmitted light;
A represents the atmospheric light; and
is the atmospheric light intensity at an infinite distance.
The Stokes vector can describe the polarization characteristics of scattered light. Therefore, we can express polarized light using the Stokes vector. Since natural light predominantly exists in the form of linearly polarized light, the Stokes vector in this paper is represented using only the first three components to describe polarized light [
26].
represents the Stokes vector of the detected light,
represents the Stokes vector of the target light, and
represents the Stokes vector of the airlight.
In Equation (
4),
represents the total light intensity,
represents the intensity difference between the
and
directions, and
represents the intensity difference between the
and
directions. Finally, by applying Malus’s law (Equation (
5)) [
27] and Stokes’ law (Equation (
4)), the degree of polarization (DOP) and the polarization angle (AOP) can be determined as shown in Equations (
6) and (
7).
S is denoted as the total light intensity,
p is the degree of polarization,
is the polarization angle, and
a is the detection angle.
Thus, we can calculate the Stokes vector, DOP, and AOP using four images captured at different polarization angles. Since the Stokes vector of the detected light is the superposition of the Stokes vectors of the airlight and the target light, the following Equation (
8) can be derived:
From Equation (
5), the intensity values of the target light and airlight in each component can be determined. Then, through Equations (
4), (
6) and (
8), the solutions can be obtained. Among them,
represents the intensity of the atmospheric light,
is the degree of polarization of the atmospheric light,
is the intensity of the target light,
is the degree of polarization of the target light,
is the polarization angle of the airlight,
is the polarization angle of the target light, and
is the intensity of the detected light.
is the polarization angle of the detected light.
is the degree of polarization of the detected light.
By solving Equations (
4), (
7), and (
9) simultaneously, you can obtain the equation for the polarization angle.
By examining Equations (
9) and (
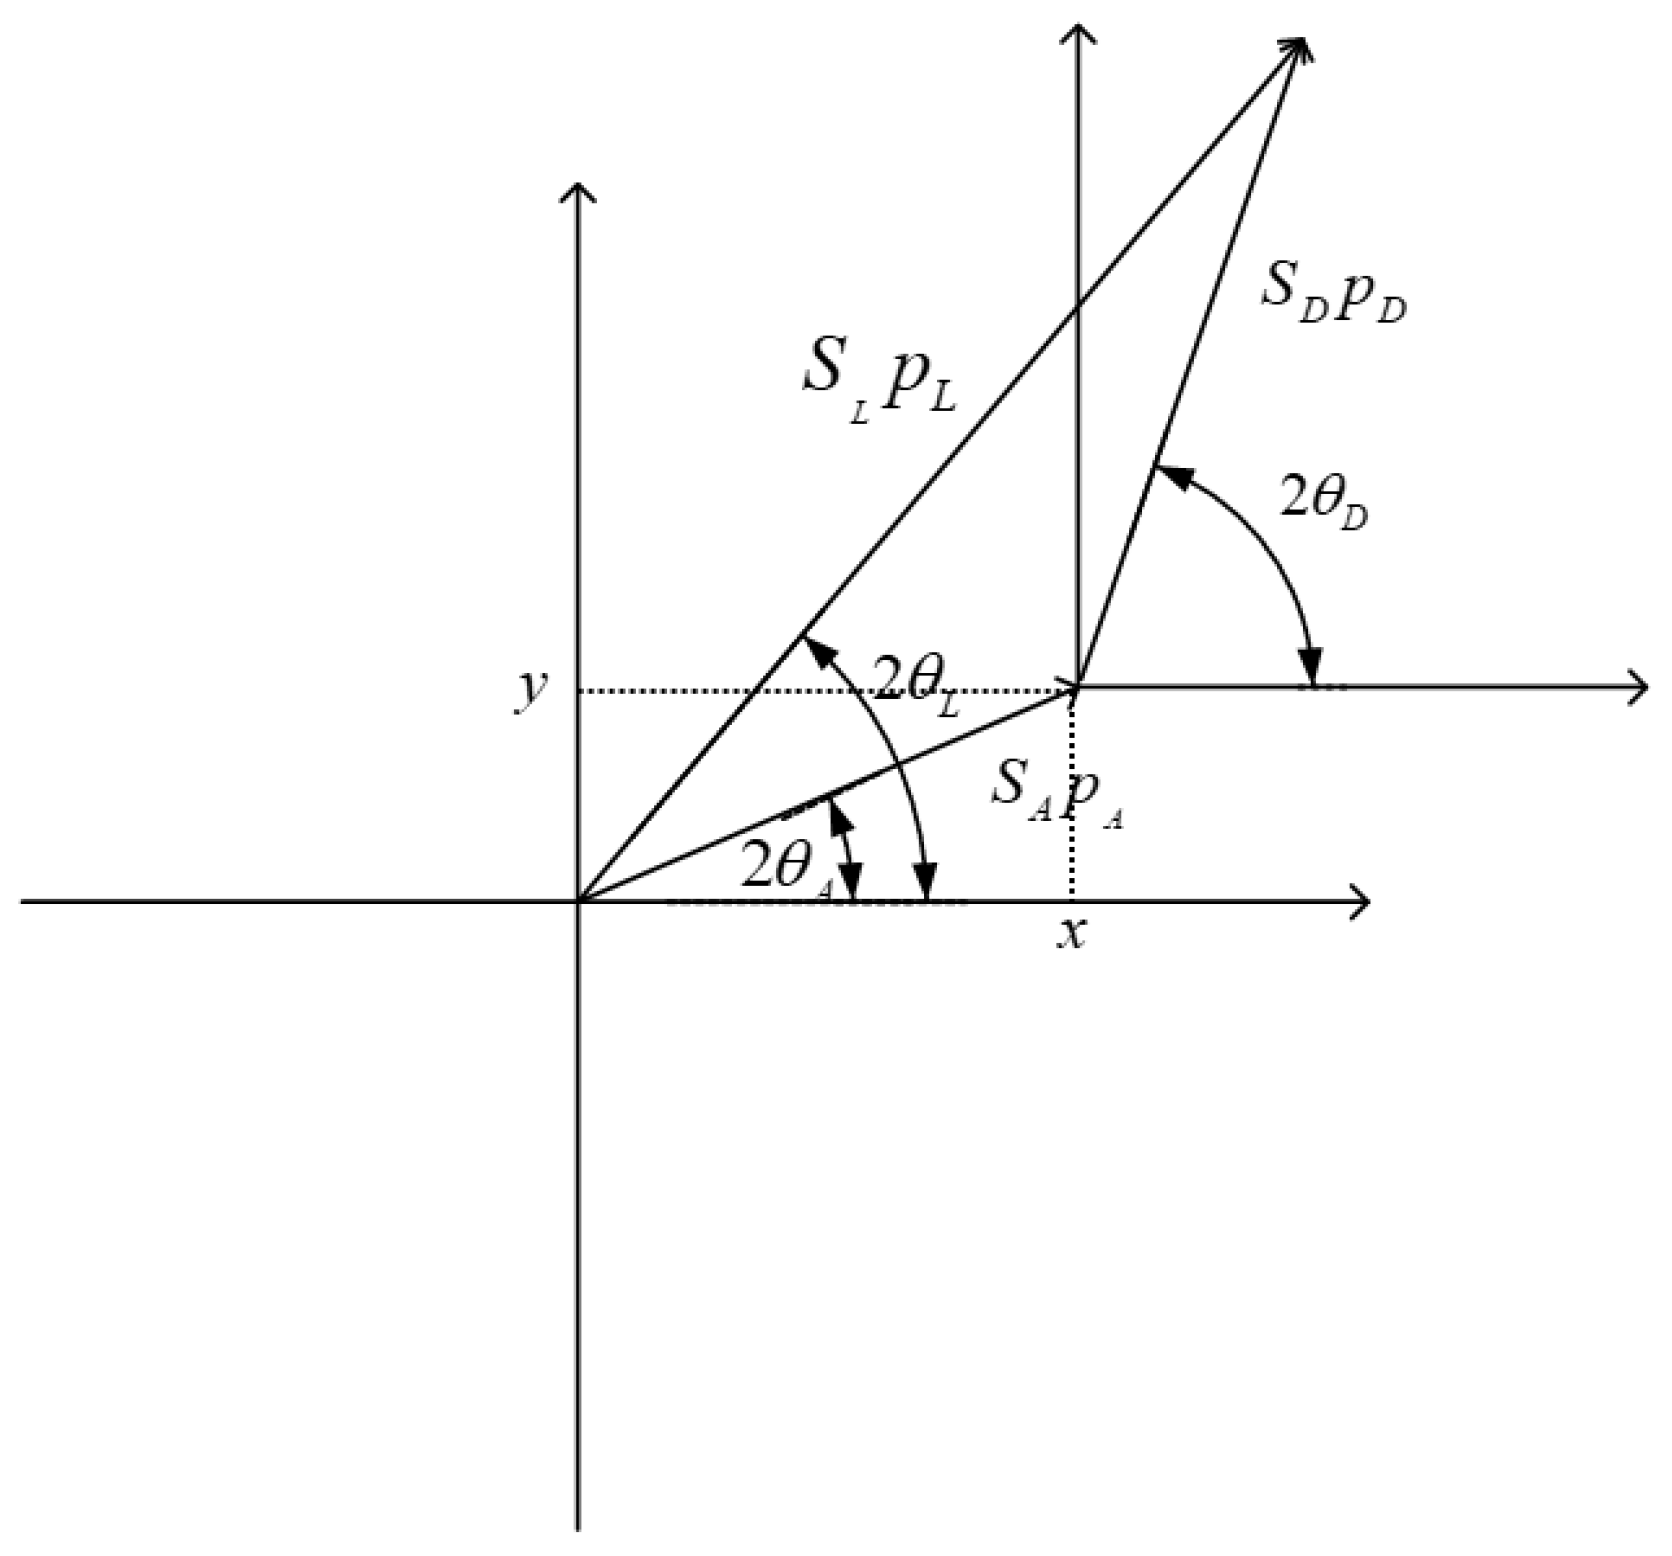
10), it is observed that we can employ vector-based methods for representation. Building on this, we further introduce the concepts of Cartesian coordinates and analytical geometry. As illustrated in
Figure 2 and Equation (
11), a new joint polarization model for atmospheric light and target light is established. Subsequently, this model will be utilized to solve for the target light information.
In polarization-based defogging, we assume that the DOP and the AOP of atmospheric light are constants. Therefore, it is necessary to first identify the sky region to estimate the DOP (
) and AOP (
) of the sky area. By incorporating
and
into the proposed model as prior conditions, the following formula can be established.
The information of the received light is directly obtained and calculated by the polarization camera, so we can determine the coordinates of the received light (
,
):
From this, the following can be determined:
By simultaneously solving Equations (
1), (
12) and (
14), we can obtain:
Expressing
in terms of the slope
k and substituting it into Equation (
15) yields the following formula:
Ultimately, we transformed the problem of joint polarization into an algebraic one. To address the absolute value issue in Equation (
16), we conducted a case-by-case analysis: when
, all
x values are positive, and when
, all
x values are negative. This leads us to the following formula:
3. Model Verification
As shown in
Figure 3, the proposed method involves the following steps: First, we capture four polarized images with different components using a polarization camera equipped with the polarized pixel array depicted in the diagram. The Stokes vector is then applied to calculate the degree of polarization and the angle of polarization. Following the illustrated workflow, by integrating polarization optics theory with the dark channel prior, accurate information about the atmospheric light can be obtained. Next, the acquired data are projected onto a Cartesian coordinate system using the joint polarization model presented in the figure. Subsequently, by utilizing the maximum window polarization degree as a boundary constraint and combining it with the proposed model, the “Solving Analytic Geometric Equations” formula shown in the diagram is derived. Finally, a haze-free image is recovered based on the atmospheric scattering model.
3.1. Data Acquisition
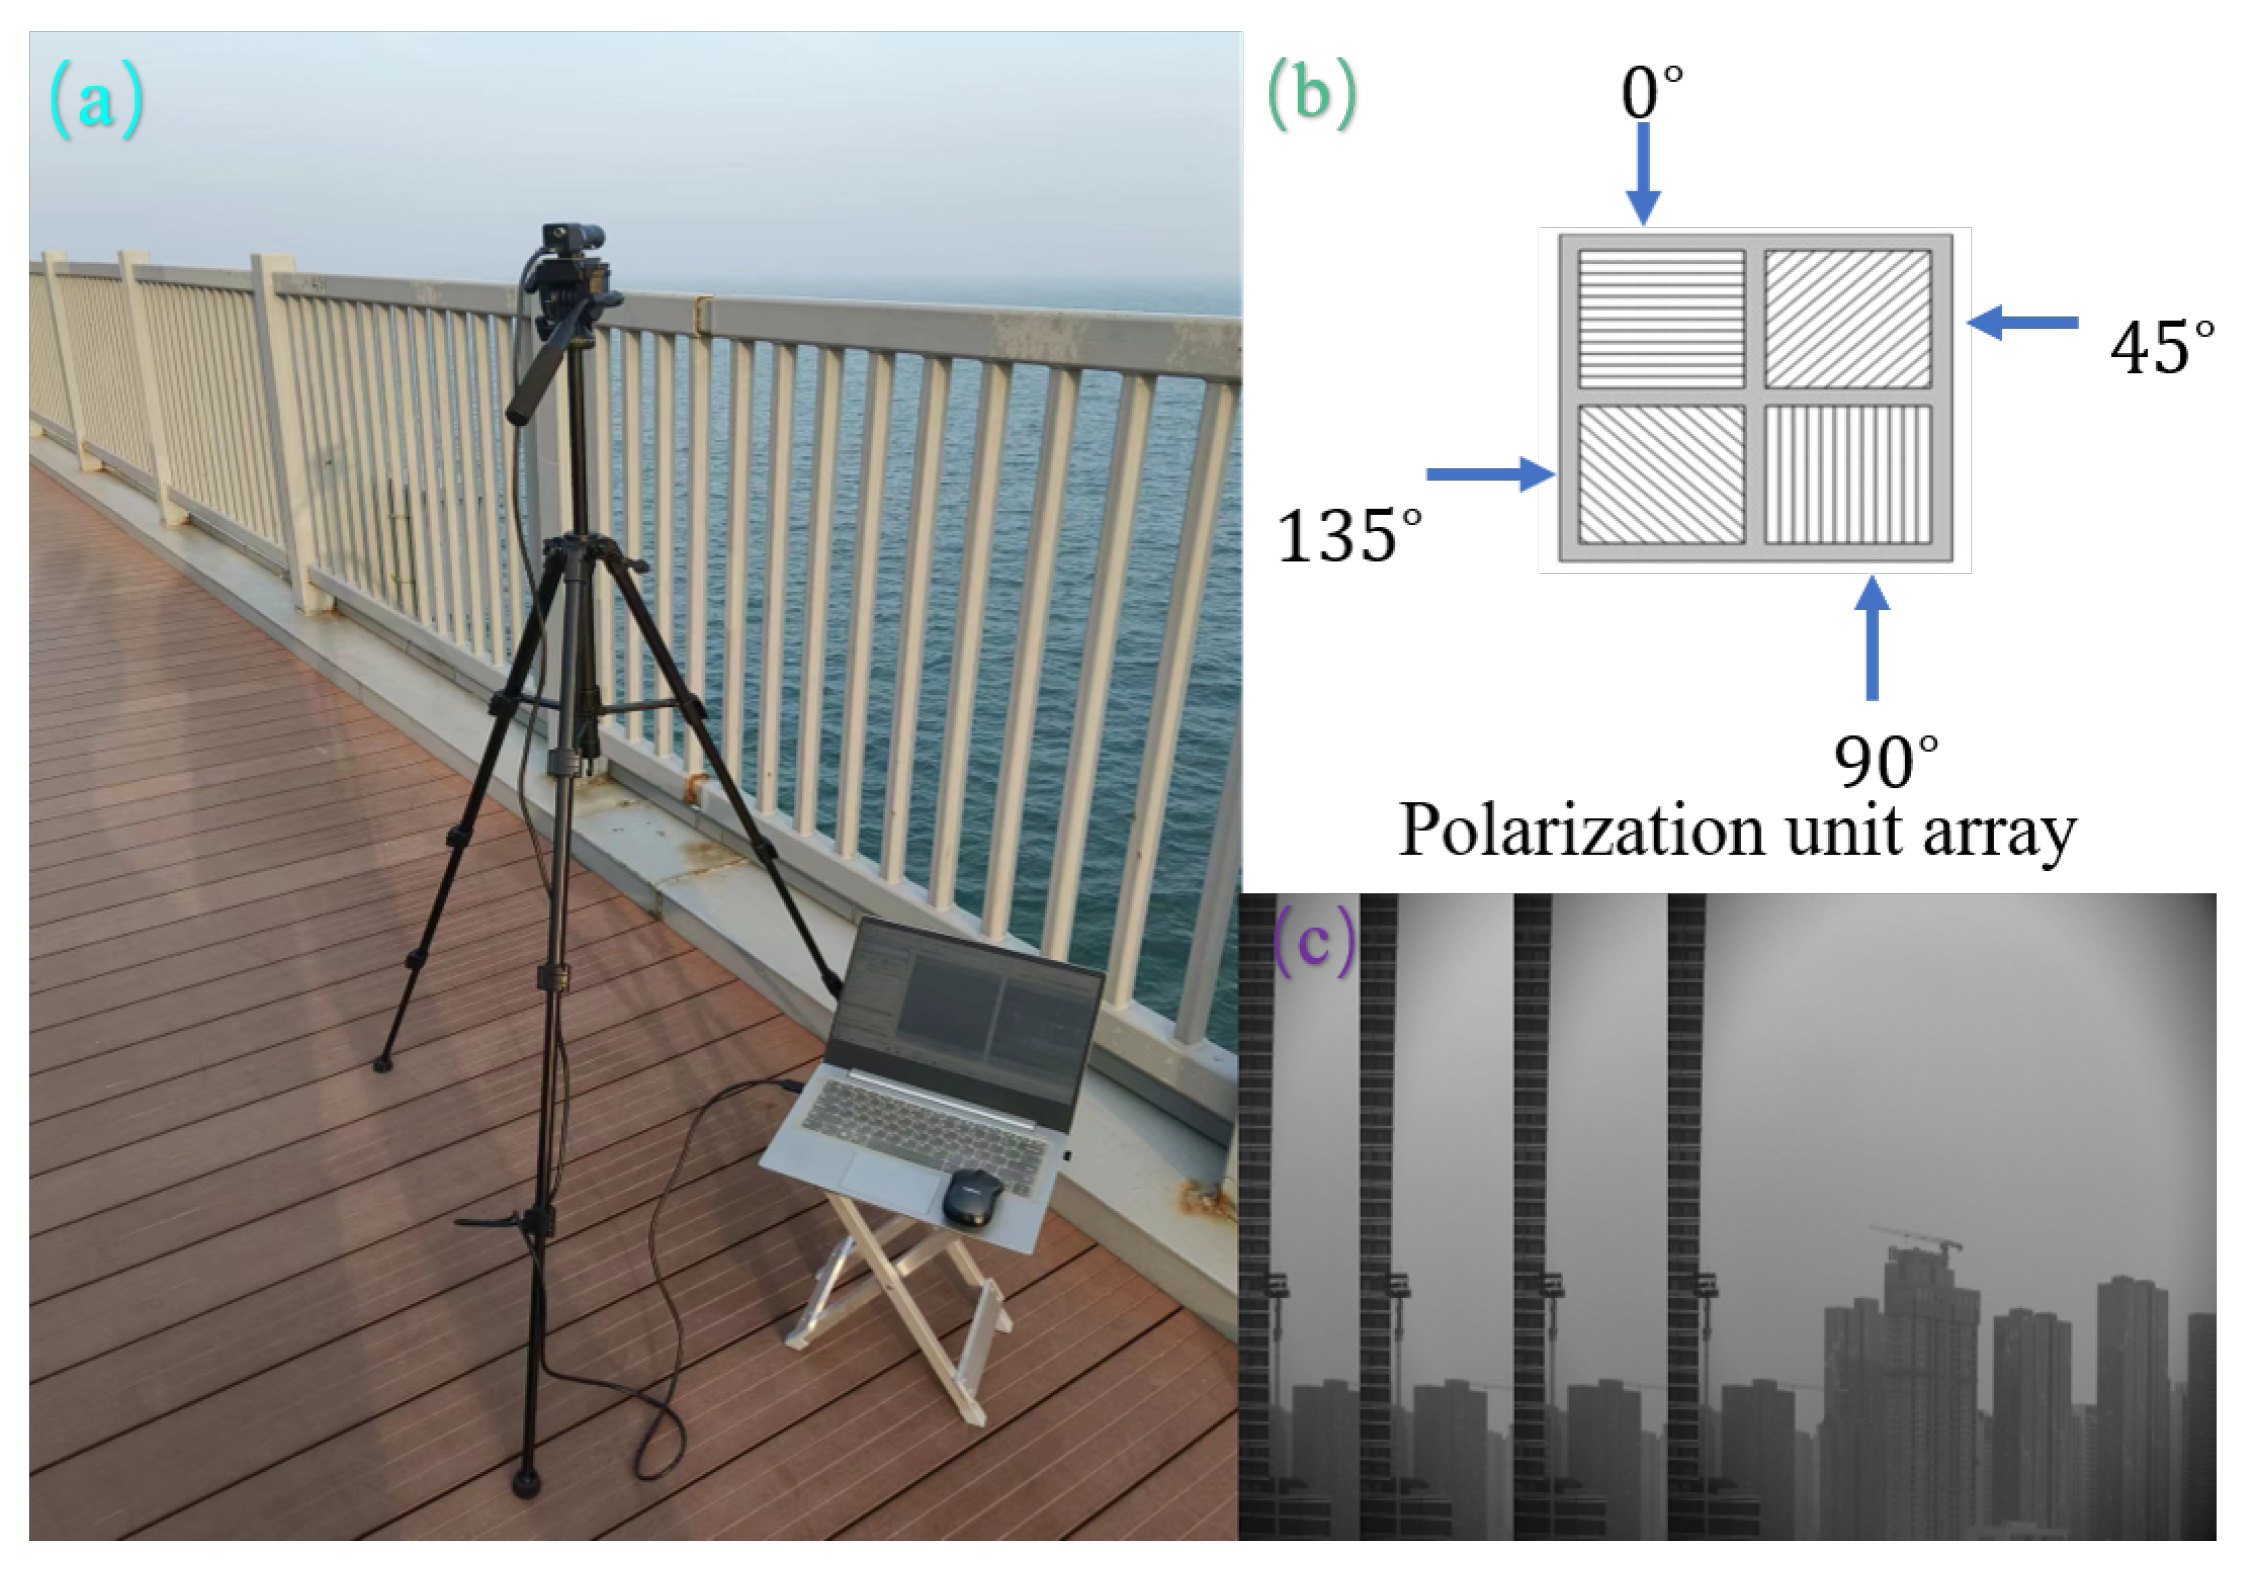
To collect multi-scene data under foggy conditions, we utilize a polarization camera (model: OR-250CNC-P) to capture polarization image information at orientations of
,
,
, and
, as illustrated in
Figure 4.
An experimental imaging platform is constructed using a tripod and a gimbal integrated with the polarization camera. Each polarization unit comprises a 2 × 2 pixel array arranged in a clockwise sequence of
,
,
, and
orientations, following a repeating polarization unit pattern [
28]. This configuration enables the acquisition of polarization images in four distinct directions, as demonstrated in
Figure 4. Using Equation (
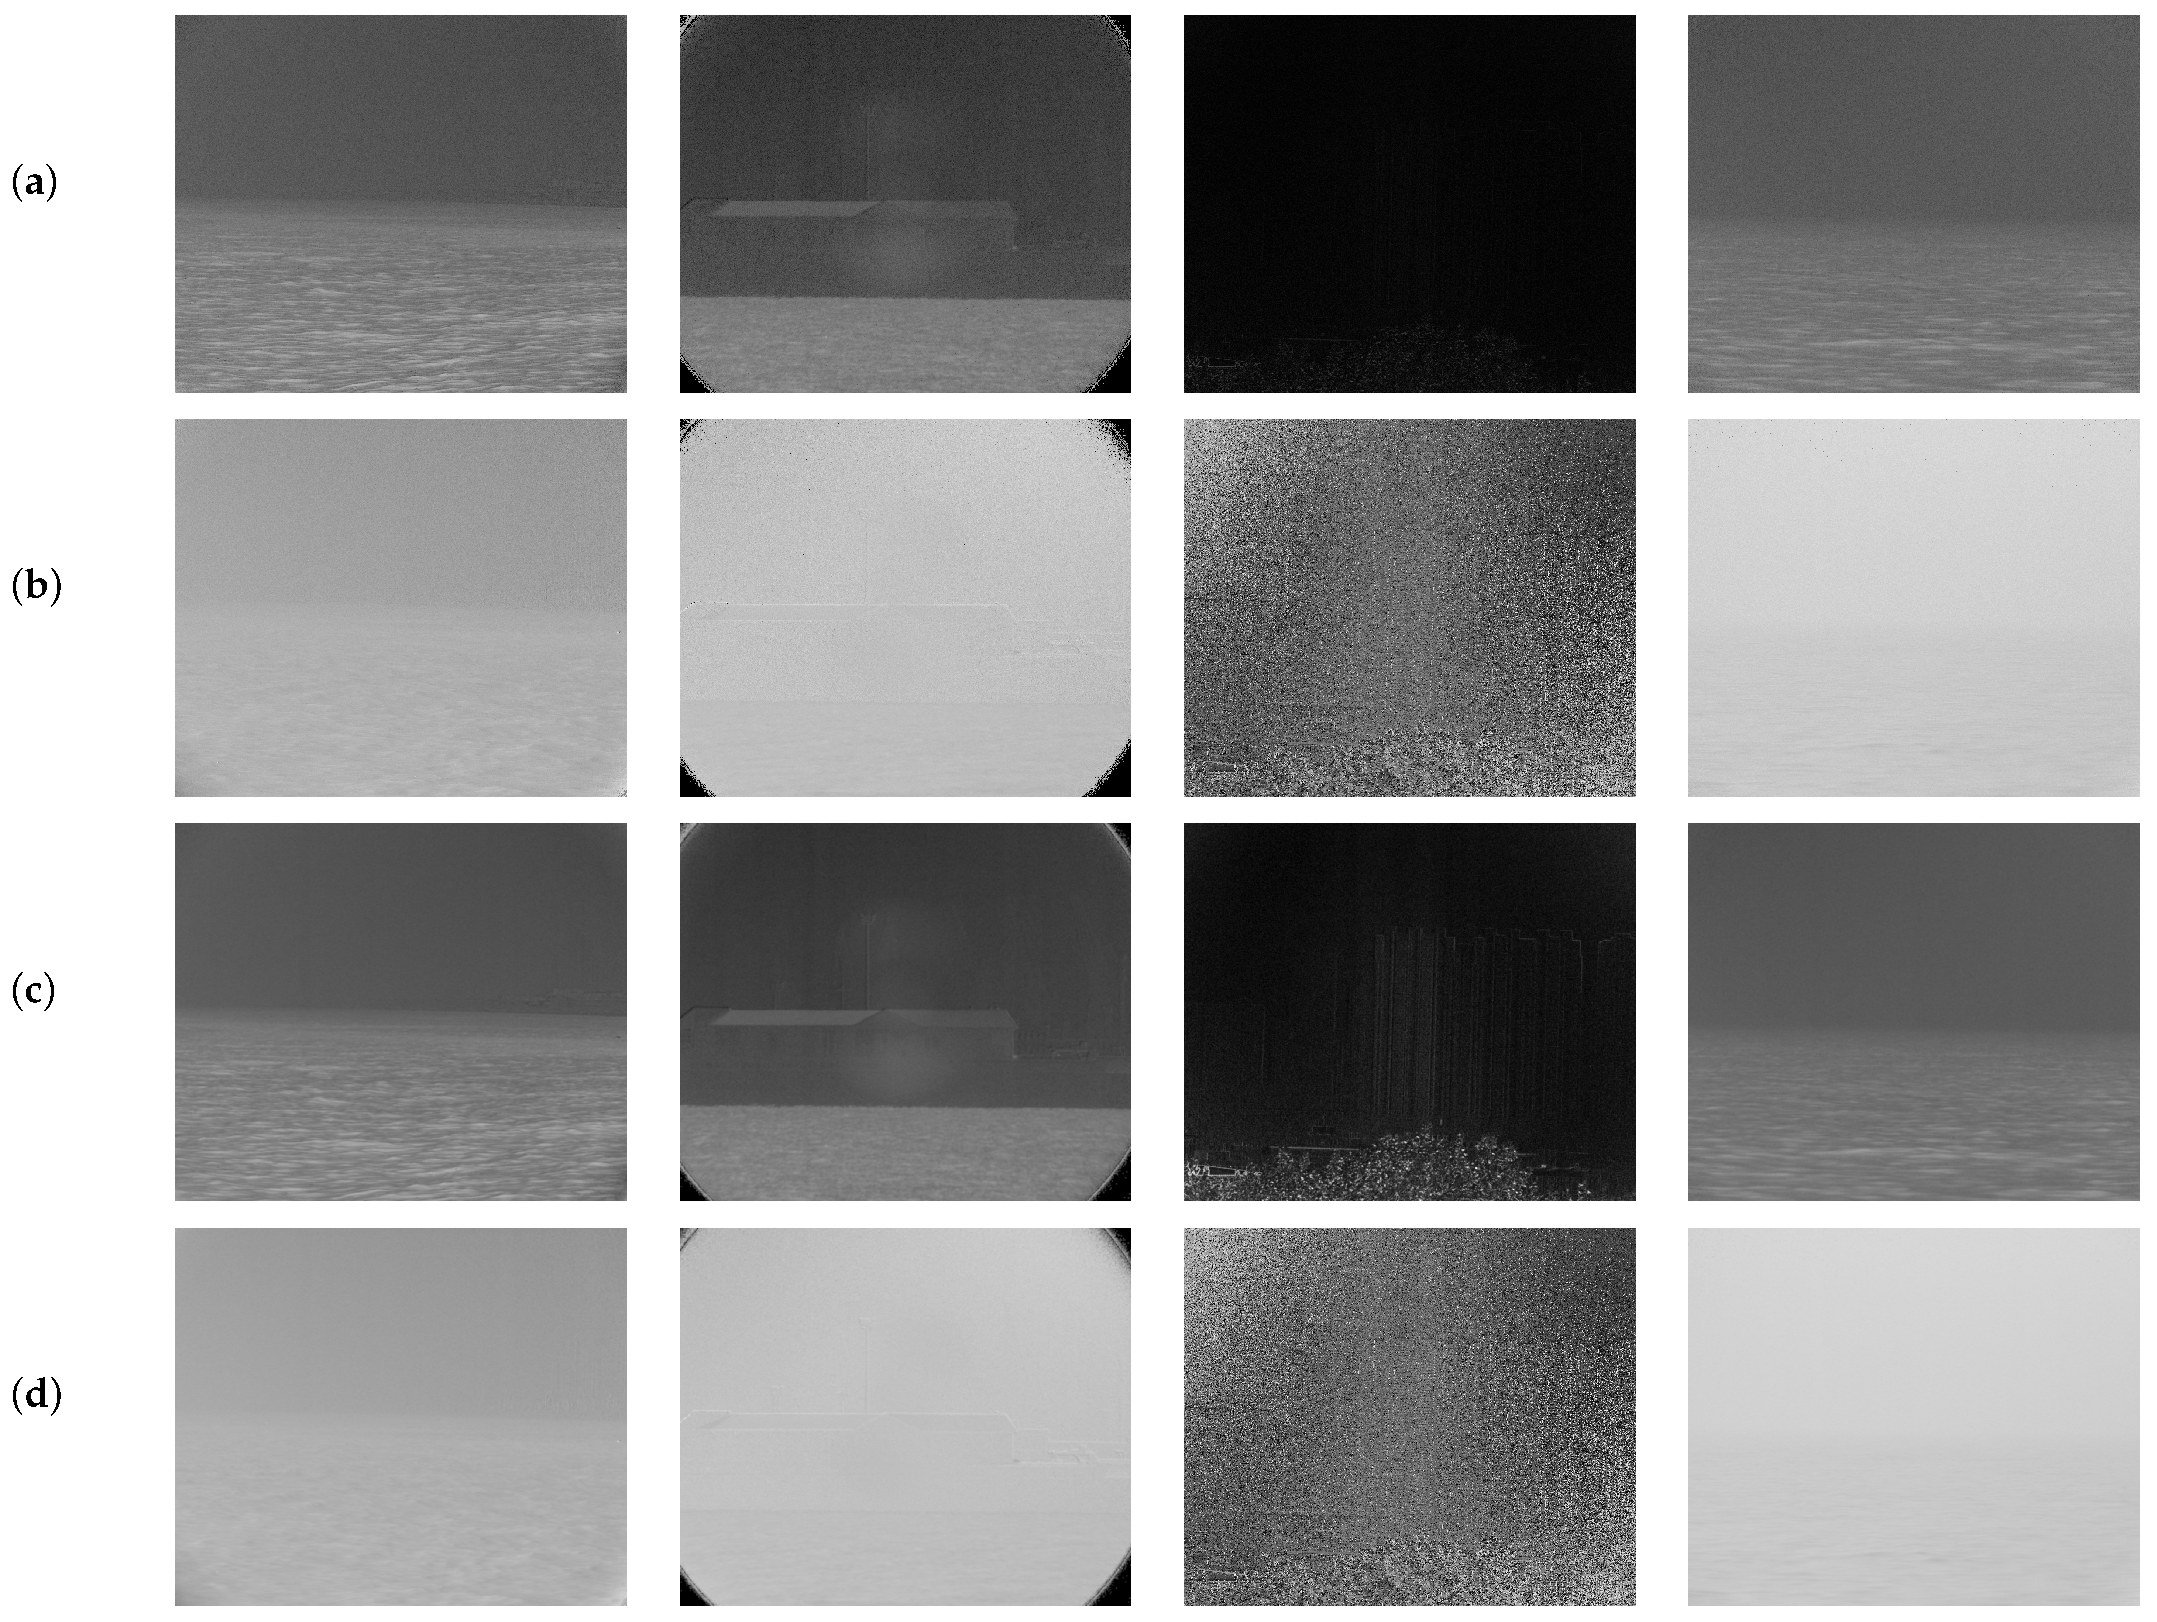
4), we can obtain light intensity maps for different scenarios, as illustrated in
Figure 5. We selected four representative foggy scenarios for evaluation: the first is a large-scale coastal scene under dense fog, the second is a small-scale coastal scene under thick fog, the third is a terrestrial scene with light fog, and the fourth is a maritime scene under heavy fog. These scenarios represent the most common real-world conditions, with the maritime environment being particularly complex and variable, posing significant challenges to dehazing algorithms. The effectiveness of our proposed method will be validated through dehazing performance across these diverse scenarios.
3.2. Determine the Sky Region
To ensure the accuracy of defogging, it is essential to determine the DOP and AOP of the sky region. Therefore, identifying the sky region is a prerequisite. Traditional methods for determining the sky region typically select areas with maximum intensity, such as the atmospheric light region, as atmospheric light generally dominates over target light under heavy fog conditions. However, this approach becomes unreliable in scenarios with light fog or when the target light exceeds atmospheric light. To overcome this limitation, this paper integrates polarization optics theory with the dark channel prior (DCP). Leveraging the principle that the degree of polarization image contains richer texture details, guided filtering is applied to the polarized dark channel image to obtain a more accurate sky region.
In the vast majority of cases, the degree of polarization of the target light is significantly higher than that of the atmospheric light. When the proportion of target light in the detected light is high, the degree of polarization of the detected light is relatively high; when the proportion of atmospheric light is high, the degree of polarization of the target light is relatively low. Thus, according to Malus’s law, the target light typically exhibits low intensity in a specific polarization channel, whereas the atmospheric light remains relatively uniform across all four channels.
First, based on Equation (
19), the minimum intensity value across the four polarization channels (
,
,
,
) is calculated for each pixel (
), as shown in
Figure 6. Since polarization degree images can better reflect the texture and details of objects, we perform fusion filtering on the dark channel image and the polarization degree image through guided filtering (
), as shown in
Figure 7.
Next, using Equation (
20), a window region
(this paper selects 153 × 128) with the highest average intensity is selected as the sky region. Finally, the average DOP and AOP of this window are derived using Equations (
21) and (
22), which are then assigned as the DOP and AOP of the sky region. The far-field light intensity we seek should serve as the maximum value of
. To enhance the robustness of the algorithm, we also introduce a coefficient (set to 1.3 in this study), as shown in Equation (
23), to ensure that the light intensity at infinity corresponds to the maximum value.
Ultimately, we have identified the sky regions across various scenarios, as illustrated in
Figure 8.
3.3. Based on the Boundary Constraints of Maximum Window Polarization Degree
Through experimental observations, it has been found that objects also exhibit distinct characteristics of DOP and AOP, with the DOP of objects typically being higher than that of air. When the target light is not overwhelmed by atmospheric light, object features remain clearly discernible. Even under heavy fog conditions, the target light is not entirely obscured. Building on this prior theory, we employ the maximum window-averaged DOP as a boundary constraint and the image-averaged DOP as a decision criterion. First, a 153 × 128 window is used to calculate the maximum window-averaged DOP. When
(the DOP of a pixel) is less than the average DOP, we assume the target light is fully submerged by atmospheric light. In this case,
is set to the maximum window DOP. Conversely, when
exceeds the average DOP, indicating that target light is not fully obscured,
is slightly amplified (with a scaling factor of 1.2 in this paper). This leads to Equation (
24), and Equation (
25) is derived to compute the maximum window DOP using the 153 × 128 window. To further improve the robustness of the algorithm and the dehazing performance, we applied Gaussian filtering to the DOP and AOP [
1]. For a clearer illustration, the processed data were normalized and mapped onto the image, as shown in
Figure 9.
Combining the results from the previous section, we can obtain the DOP and AOP for the sky region in different scenarios, as presented in
Table 1. Through this section, we further derive the maximum window DOP and the average DOP. Subsequently, we can integrate these findings with the model proposed in this paper to perform image dehazing and enhancement.
3.4. Solving the Target Light
Since airlight has a relatively small dynamic range compared to target light and primarily affects local regions of an image, while target light is determined by various factors such as material properties, reflectivity, and object distance, exhibiting a larger pixel-level dynamic range, directly estimating target light would introduce significant noise interference. Therefore, we first estimate airlight. By analyzing Equations (
17) and (
18), we observe that both are quadratic equations with two roots for x. Through the analysis in
Figure 3, we can easily determine the valid range of x as
. To maximally eliminate the influence of airlight, we select the maximum value of
within the valid range, that is,
.
Finally, using Equation (
26), we calculate the maximum airlight. To preserve the natural characteristics of real-world airlight, we apply mean filtering for refinement. The window size is 15 × 15, achieving the final result shown in
Figure 10. By subtracting the filtered airlight map from the illumination map and applying Equation (
2), we obtain the target light image. Under foggy conditions, the target light is obscured by airlight interference, resulting in low intensity values. The final result is shown in
Figure 11.
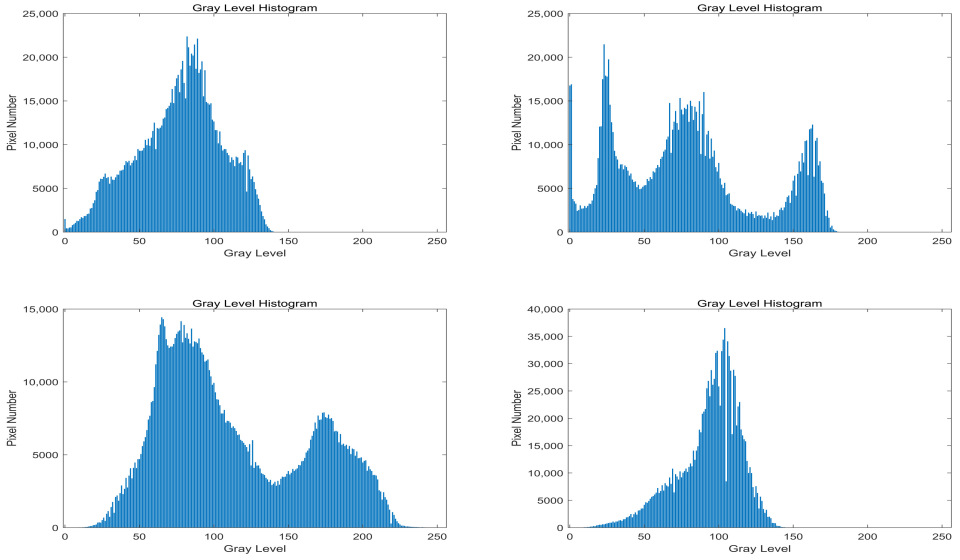
To ensure the final image achieves high-quality results, we computed the histogram of the target light image, as shown in
Figure 12. The histogram analysis reveals that the proposed algorithm effectively eliminates the interference of the airlight. However, due to noise introduced during the processing, some noise points that affect the final image quality may still be present.
To address this, we calculated the cumulative normalized histogram, as illustrated in
Figure 13. The pixel value at the 0.05 percentile was designated as the minimum threshold, while the value at the 0.95 percentile was set as the maximum threshold, as detailed in
Table 2. Pixels falling below the minimum threshold or exceeding the maximum threshold were adjusted to their respective threshold values.
Through threshold suppression and image normalization, the final result is obtained, as shown in
Figure 14.
4. Results Analysis
4.1. Subjective Evaluation
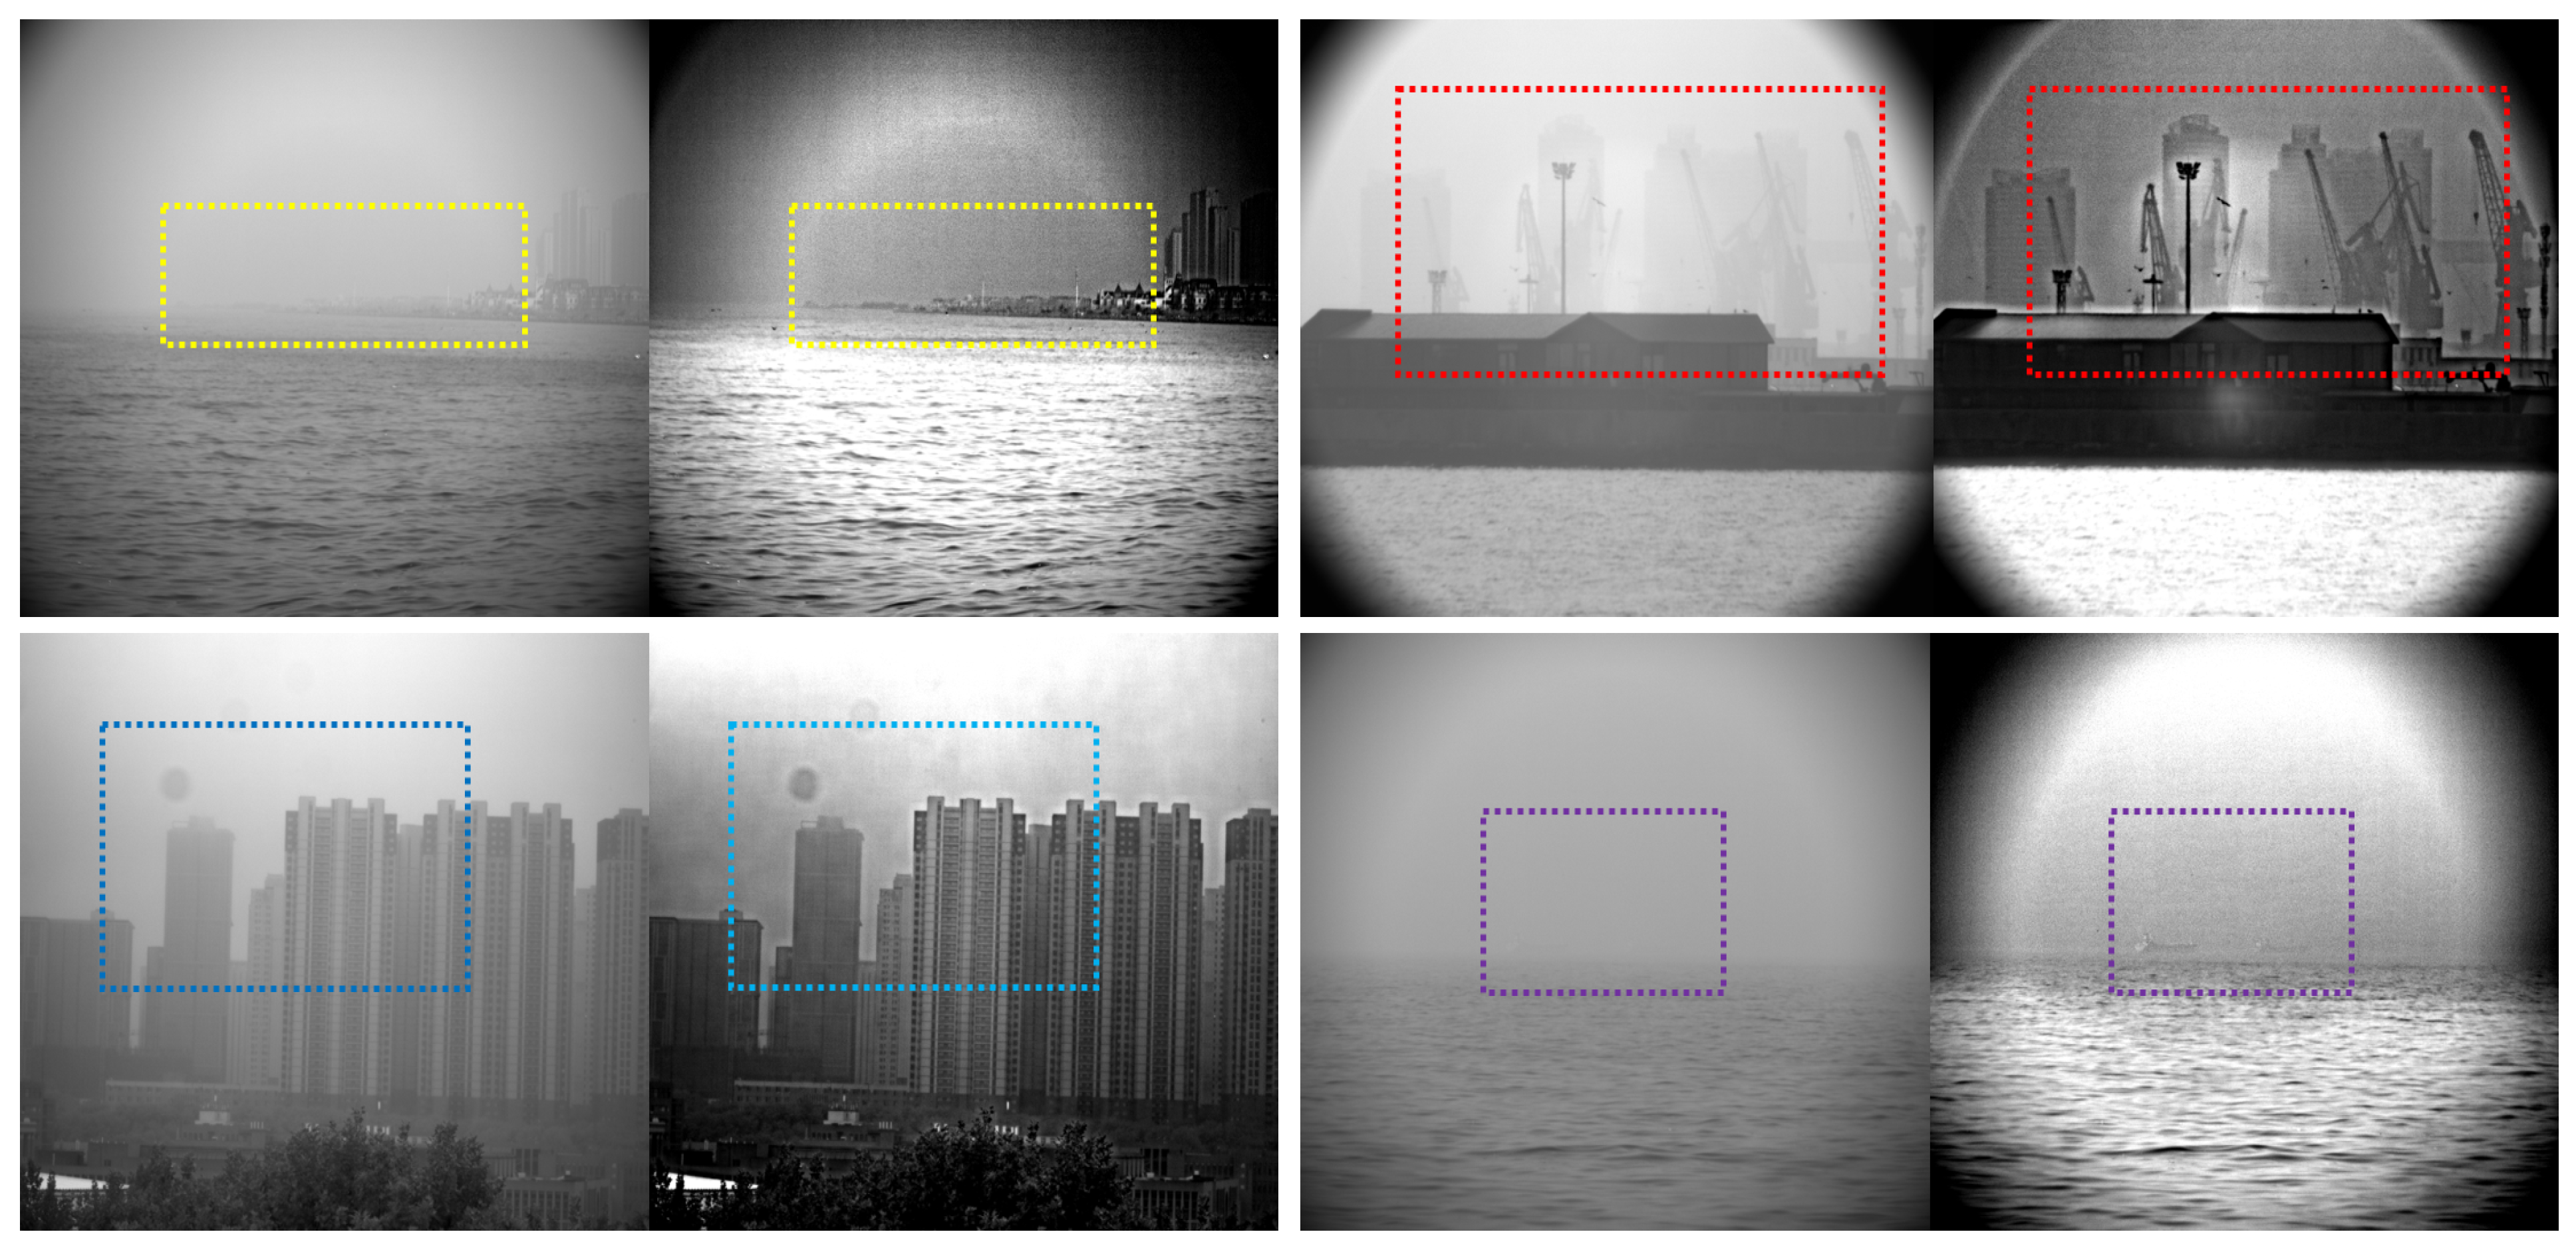
To conduct a more comprehensive analysis of the experimental results, we first compared the intensity map with the final restored image, as shown in
Figure 15. The comparison clearly demonstrates that the atmospheric light has been significantly suppressed, and the image contrast has been notably restored. In Scenario 1, the contrast of architectural structures has been markedly improved. In Scenario 2, urban buildings previously obscured by thick fog have been effectively reconstructed. In Scenario 3, atmospheric interference has been successfully eliminated. In Scenario 4, vessels that were submerged in dense fog have been clearly restored. Comparative analysis across different scenarios clearly demonstrates that the proposed algorithm effectively mitigates the interference of atmospheric light and faithfully restores the information of the target light, thereby achieving high-quality image dehazing.
A comparative analysis was performed among the proposed algorithm, the Polarization Dark Channel algorithm—which processes polarization components in four directions as separate channels—and conventional polarization-based dehazing methods, as illustrated in
Figure 16. Traditional polarization defogging algorithms generally operate under the assumption that target light exhibits negligible polarization. However, in real-world settings, the degree of polarization of objects often constitutes a significant and non-negligible factor. Owing to this inherent limitation, conventional methods tend to introduce considerable errors when handling scenes where the polarization degree of the target light exceeds that of the atmospheric light. This frequently leads to pixel values exceeding the valid dynamic range, manifesting as localized dark spots and artifacts in the recovered images.
Although the Polarization Dark Channel algorithm can be effectively applied to a wide range of foggy scenes, its performance is inherently constrained by the underlying polarization dark channel prior. This prior typically assumes that at least one polarization channel contains very low intensity values in local image regions. Yet, in scenarios such as extensive sky regions or coastal and marine environments—where the sky and sea exhibit similar radiance—the intensity differences across polarization channels become minimal. As a result, the algorithm tends to produce visible distortions and fails to robustly estimate the transmission map.
Meanwhile, the histogram equalization algorithm, as a general image enhancement technique, performs adequately only under conditions of mild haze. In dense fog, where atmospheric light dominates the scene and significantly degrades image contrast, this method falls short due to its inability to physically model and separate the atmospheric veil. Consequently, its enhancement effect remains limited, often leading to over-enhanced noise and unnatural visual outcomes.
In contrast, the proposed method explicitly models both atmospheric and target polarized components, adaptively handles varying polarization degrees, and avoids the limiting assumptions of the prior arts. It, thus, achieves more robust dehazing across diverse scenarios, including those with uniform intensity distributions and strong target polarization.
4.2. Objective Evaluation
To objectively evaluate the dehazing performance of the proposed method, we adopt three image quality metrics for quantitative analysis: information entropy [
27], average gradient [
29], image standard deviation [
30], and SSIM [
31]. The specific interpretations of these metrics for image quality are as follows:
Information entropy quantifies the richness of texture and detail in an image by measuring the uncertainty or randomness of pixel intensity distributions. Higher entropy values indicate greater diversity in texture and more abundant information content, which often corresponds to improved image quality. In defogging applications, elevated entropy suggests successful recovery of subtle details previously obscured by haze.
The average gradient represents the magnitude of spatial variation in intensity transitions, reflecting the sharpness of edges and the clarity of fine structures. A higher average gradient signifies stronger local contrast and enhanced perceptual definition, making it a critical metric for evaluating the effectiveness of defogging algorithms in restoring structural integrity and visual prominence.
Standard deviation measures the dispersion of pixel intensities around the mean value, serving as an indicator of global contrast and dynamic range. Larger values imply a wider distribution of intensities, which often correlates with sharper edges, richer tonal separation, and overall higher image quality. In dehazing contexts, increased standard deviation demonstrates effective removal of haze-induced homogeneity and improved contrast restoration.
In this paper, we conducted a quantitative analysis of different dehazing algorithms using the aforementioned metrics to evaluate the effectiveness of the final dehazed images obtained through various methods, as shown in
Table 3. In most scenarios, the proposed algorithm achieved the best dehazing performance.
In Scenes 1 and 2, the proposed algorithm demonstrates the highest information entropy and average gradient, indicating its effectiveness in restoring both distant and close-range targets obscured by dense fog. In contrast, traditional polarization-based defogging methods exhibit significant distortion in high-polarization environments such as marine scenes. The DCP algorithm falls short in detail recovery, while the histogram equalization method performs poorly in defogging tasks. In Scene 3, the proposed algorithm achieves the highest standard deviation, with metrics comparable to those of traditional polarization defogging and DCP methods, confirming that our approach retains the advantages of polarization-based defogging even in light terrestrial fog scenarios. In Scene 4, the proposed algorithm outperforms all other methods across all three metrics, demonstrating unparalleled defogging capability in highly uniform backgrounds like sea-sky environments. It successfully restores ships hidden by fog, with image details significantly enhanced.
Quantitative and qualitative analyses of the aforementioned algorithm confirm that the proposed method demonstrates exceptional defogging capabilities across diverse targets and scenarios, while exhibiting strong robustness and anti-interference performance. It addresses the distortion issues encountered by traditional defogging methods in high-polarization environments, such as marine scenes, and resolves the problem of insufficient defogging effectiveness in polarized dark channel applications under highly luminous continuous sea-sky backgrounds. The processed images exhibit a notable improvement in contrast at the detail level.
4.3. Limitations
While the proposed algorithm demonstrates promising dehazing performance and image enhancement capabilities, it still has certain limitations that require further improvement in future work:
Dependence on Atmospheric Light Region Selection:
The estimation of parameters and relies heavily on the selection of atmospheric light regions. For images lacking sky regions, prior theoretical assumptions must be used to estimate and , which may introduce significant errors in specific scenarios:
Fixed vs. Variable :
In this study, is treated as a fixed parameter for analysis. However, is inherently a variable in practice, and this simplification could lead to variability in the results.
Boundary Constraints Based on Maximum Window DOP:
Although the boundary constraints derived from the maximum window polarization degree effectively narrow the solution space, they still define a dynamic range rather than providing exact values. This uncertainty limits the precision of the final estimations.

