Article

Self-Calibration Method for the Four Buckets Phase Demodulation Algorithm in Triangular Wave Hybrid Modulation

1
College of Intelligence Science and Technology, National University of Defense Technology, Changsha 410073, China
2
National Key Laboratory of Equipment State Sensing and Smart Support, Changsha 410073, China
3
Hunan Key Laboratory of Ultra-Precision Machining Technology, Changsha 410073, China
*
Author to whom correspondence should be addressed.
Appl. Sci. 2025, 15(20), 10956; https://doi.org/10.3390/app152010956
Submission received: 10 September 2025 / Revised: 10 October 2025 / Accepted: 11 October 2025 / Published: 12 October 2025

Abstract

The four buckets phase demodulation method is a widely used sinusoidal modulation and demodulation technique in interferometry. Strict calibration is essential to minimize nonlinear errors in subsequent measurements. The core of the algorithm calibration lies in determining the initial phase value of the modulation signal that matches the modulation depth while overcoming the influence of system phase delay. Currently, there are few systematic calibration methods specifically designed for optical fiber interferometry. This paper proposes a self-calibration method based on triangular wave mixing for four buckets phase demodulation in fiber optic interferometric probes, which efficiently achieves self-calibration of the phase demodulation while the measured object remains stationary. Simulations and experimental validations were conducted, demonstrating that the optimal initial phase value of 0.62 rad during phase demodulation can be accurately identified under static conditions. The calibrated phase value was then applied to the displacement measurement, where the target displacement was effectively detected, resulting in a root mean square (RMS) error of 3.0337 nm and an average error of 2.4479 nm.

1. Introduction

With the advancement of manufacturing toward high-end fields such as micro-nano technology, ultra-precision machining, and integrated circuits, the importance of precision metrology and inspection technology has become increasingly prominent [1,2]. Optical non-contact metrology, as a mainstream detection method, is widely adopted due to its advantages of rapidity and non-destructiveness [3]. Among these, phase-shifting interferometry, as a key branch of optical metrology, has been extensively developed and applied across various domains [4,5]. In the field of optical freeform surface measurement, point-contact scanning profilometry is widely employed for its high flexibility and capability to measure high-slope surfaces [6]. The core of this technology lies in the probe system: through high-precision displacement measurement combined with motion scanning along three-dimensional axes, it can accurately reconstruct the surface contour characteristics of the measured object [7].
Optical interferometric displacement sensing probes typically employ phase modulation techniques to encode the measured displacement information into intensity signals, which are subsequently demodulated using specific phase retrieval algorithms to recover the phase information and thereby calculate the displacement. Sinusoidal phase modulation, as a mainstream modulation method, is widely used in the field of precision sensing and measurement [8,9]. A variety of phase demodulation algorithms have been developed for this approach, among which the four buckets algorithm is one of the most commonly adopted methods due to its high resolution and good sustainability [10]. However, this algorithm requires strict calibration during the demodulation process to minimize nonlinear errors. The key lies in accurately determining the phase value in the modulation signal that corresponds to the actual modulation depth, thereby effectively suppressing the influence of nonlinear errors [11]. Regarding the calibration of the four buckets algorithm, previous studies have conducted certain explorations; however, in the context of single-point scanning applications, existing calibration methods remain relatively complex. Currently, foreign commercial brands excel at manufacturing displacement interferometric probes for point-scanning profilometers. However, possibly due to commercial competition, there is currently no publicly available and effective four buckets self-calibration method specifically tailored for such probes. Conventional approaches typically require pre-calibration of the system’s modulation depth and precise determination of the phase delay, followed by computational matching of the initial phase value. In our earlier research, a calibration method was proposed to improve the efficiency of single-point displacement measurement calibration. Nevertheless, this method relies on the occurrence of a specific displacement in the measured object for successful calibration, thus limiting its applicability in scenarios where motion cannot be induced [12]. To address this issue, this paper proposes a self-calibration method for four buckets phase demodulation based on a triangular wave mixed signal. This method not only enables efficient calibration for stationary objects but also features a more streamlined processing workflow, effectively expanding the applicability of the technique and filling a technical gap in the field of static calibration.

2. Principles

2.1. Two-Beam Interference

In optical fiber displacement interferometry, the beams reflected from the reference mirror and the target surface interfere with each other, generating an interference phase that contains information about the distance between the two. When the target object displaces relative to the reference mirror, the interference phase changes accordingly, allowing the displacement to be determined by demodulating this phase information. In precision interferometry, displacement is directly reflected as a phase variation. However, when the phase change is extremely weak or slow, direct detection becomes challenging and susceptible to noise. To enhance the detection capability, sinusoidal phase modulation is introduced: it modulates the low-frequency phase signal of interest onto a high-frequency carrier phase, which is then recovered using a dedicated demodulation algorithm [8]. This approach significantly improves the measurement sensitivity, stability, and dynamic range, making it widely applicable in ultra-high-precision metrology.
It is believed that the interference phase forms a double-beam interference [13]. The expression of the light intensity signal after phase modulation is:
I ( t ) = I 0 + I 1 cos [ C cos ( ω c t + θ ) + φ ( t ) ]
where I 0 is the direct current (DC) component of the interference signal I ( t ) , and I 1 is the alternating current (AC) amplitude of the interference signal I ( t ) . C represents the modulation depth. ω c represents the modulation angular frequency. θ represents the sine modulation signal phase.

2.2. Four Buckets Phase Demodulation Algorithm

The primary objective of phase demodulation is to extract information embedded within the phase variations of a carrier signal. Among various demodulation algorithms, the four buckets phase demodulation algorithm is widely adopted in sinusoidal phase modulation systems due to its maturity and reliability, and it is particularly favored for its excellent continuity and accuracy. The signal processing flow of this algorithm is illustrated in Figure 1. Within a single modulation cycle, the intensity signal is sequentially divided into four equally spaced intervals according to the time sequence. The intensity signal within each interval is individually integrated. Subsequently, by performing specific linear combinations and mathematical operations on these four integrated values [12], the phase information contained in the interference signal can be accurately reconstructed.
By continuously integrating the time-varying signal I ( t ) over one quarter of the modulation period T, the frame information of the light intensity E p can be obtained:
E p   =   ( p 1 ) T / 4 p T / 4 I ( t )   d t , p   =   1 , 2 , 3 , 4
The frame information can be represented as:
E p =   ( T / 4 ) ( I 0   +   I 1 J 0 ( C ) cos φ +   ( T / π ) I 1   cos φ n = 1 + J 2 n ( C ) 2 n { sin [ n p π + 2 n   θ ]   sin [ n   (   p     1   ) π   +   2 n   θ ] }   ( T / π ) I 1 n = 0 + J 2 n + 1 ( C ) 2 n   +   1 { cos [ ( 2 n   +   1 ) (   p     1 ) π / 2   +   ( 2 n   +   1 )   θ ]   cos [   ( 2 n   +   1 ) p   π / 2   +   ( 2 n   +   1 )   θ ] }
By linearly combining the four frames’ information obtained within one period according to Equation (3), it is possible to achieve orthogonal signal X and Y :
X   =   E 1     E 2   + E 3     E 4   =   ( 4 T / π ) R c A cos φ
Y   =   E 1     E 2     E 3   +   E 4   =   ( 4 T / π ) R s A sin φ
where
R s = n = 0 + ( 1 ) n J 2 n + 1 ( C ) 2 n + 1 sin [ ( 2 n   +   1 ) θ ]
R c = n = 0 + J 4 n + 2 ( C ) 2 n   +   1 sin [ 2 ( 2 n   +   1 )   θ ]
By linearly combining the four frames’ information obtained within one period according to Equation (3), it is possible to achieve:
φ =   arctan K   Y X = arctan R c R s   Y X
where K represents the nonlinear proportional coefficient, i.e., K   = R c / R s .
The four buckets phase demodulation algorithm determines the phase φ ( t ) at a given point in time by algebraically combining four intensity samples E 1 , E 2 , E 3 , E 4 and applying an arctangent function to their ratio. The accuracy of this operation depends critically on the precise values of these four samples. Moreover, successful implementation of the method requires carefully matching the modulation depth C and initial phase offset θ during interferometric modulation to ensure equal amplitudes in the resulting quadrature signals. Any deviation from this condition introduces nonlinear errors and degrades the measurement accuracy [14].
The four buckets algorithm operates solely in the time domain, which inherently limits its capability for effective nonlinear compensation within the algorithm itself. As a result, pre-use calibration becomes particularly critical. Our previous research proposed a self-calibration method that could complete the calibration by simply scanning the workpiece surface during the profiling process [12]. However, this method requires the measured object to undergo displacement, thus limiting its applicability in scenarios where scanning is infeasible. To address this issue, this paper introduces a self-calibration method based on triangular wave hybrid modulation, building upon the original approach. Without the need for preliminary workpiece scanning, the proposed method enables autonomous calibration of the four buckets phase demodulation algorithm solely using the probe’s own hybrid modulation signal, thereby enhancing both the applicability and the practicality of the algorithm.

3. Method

3.1. Measurement System Structure

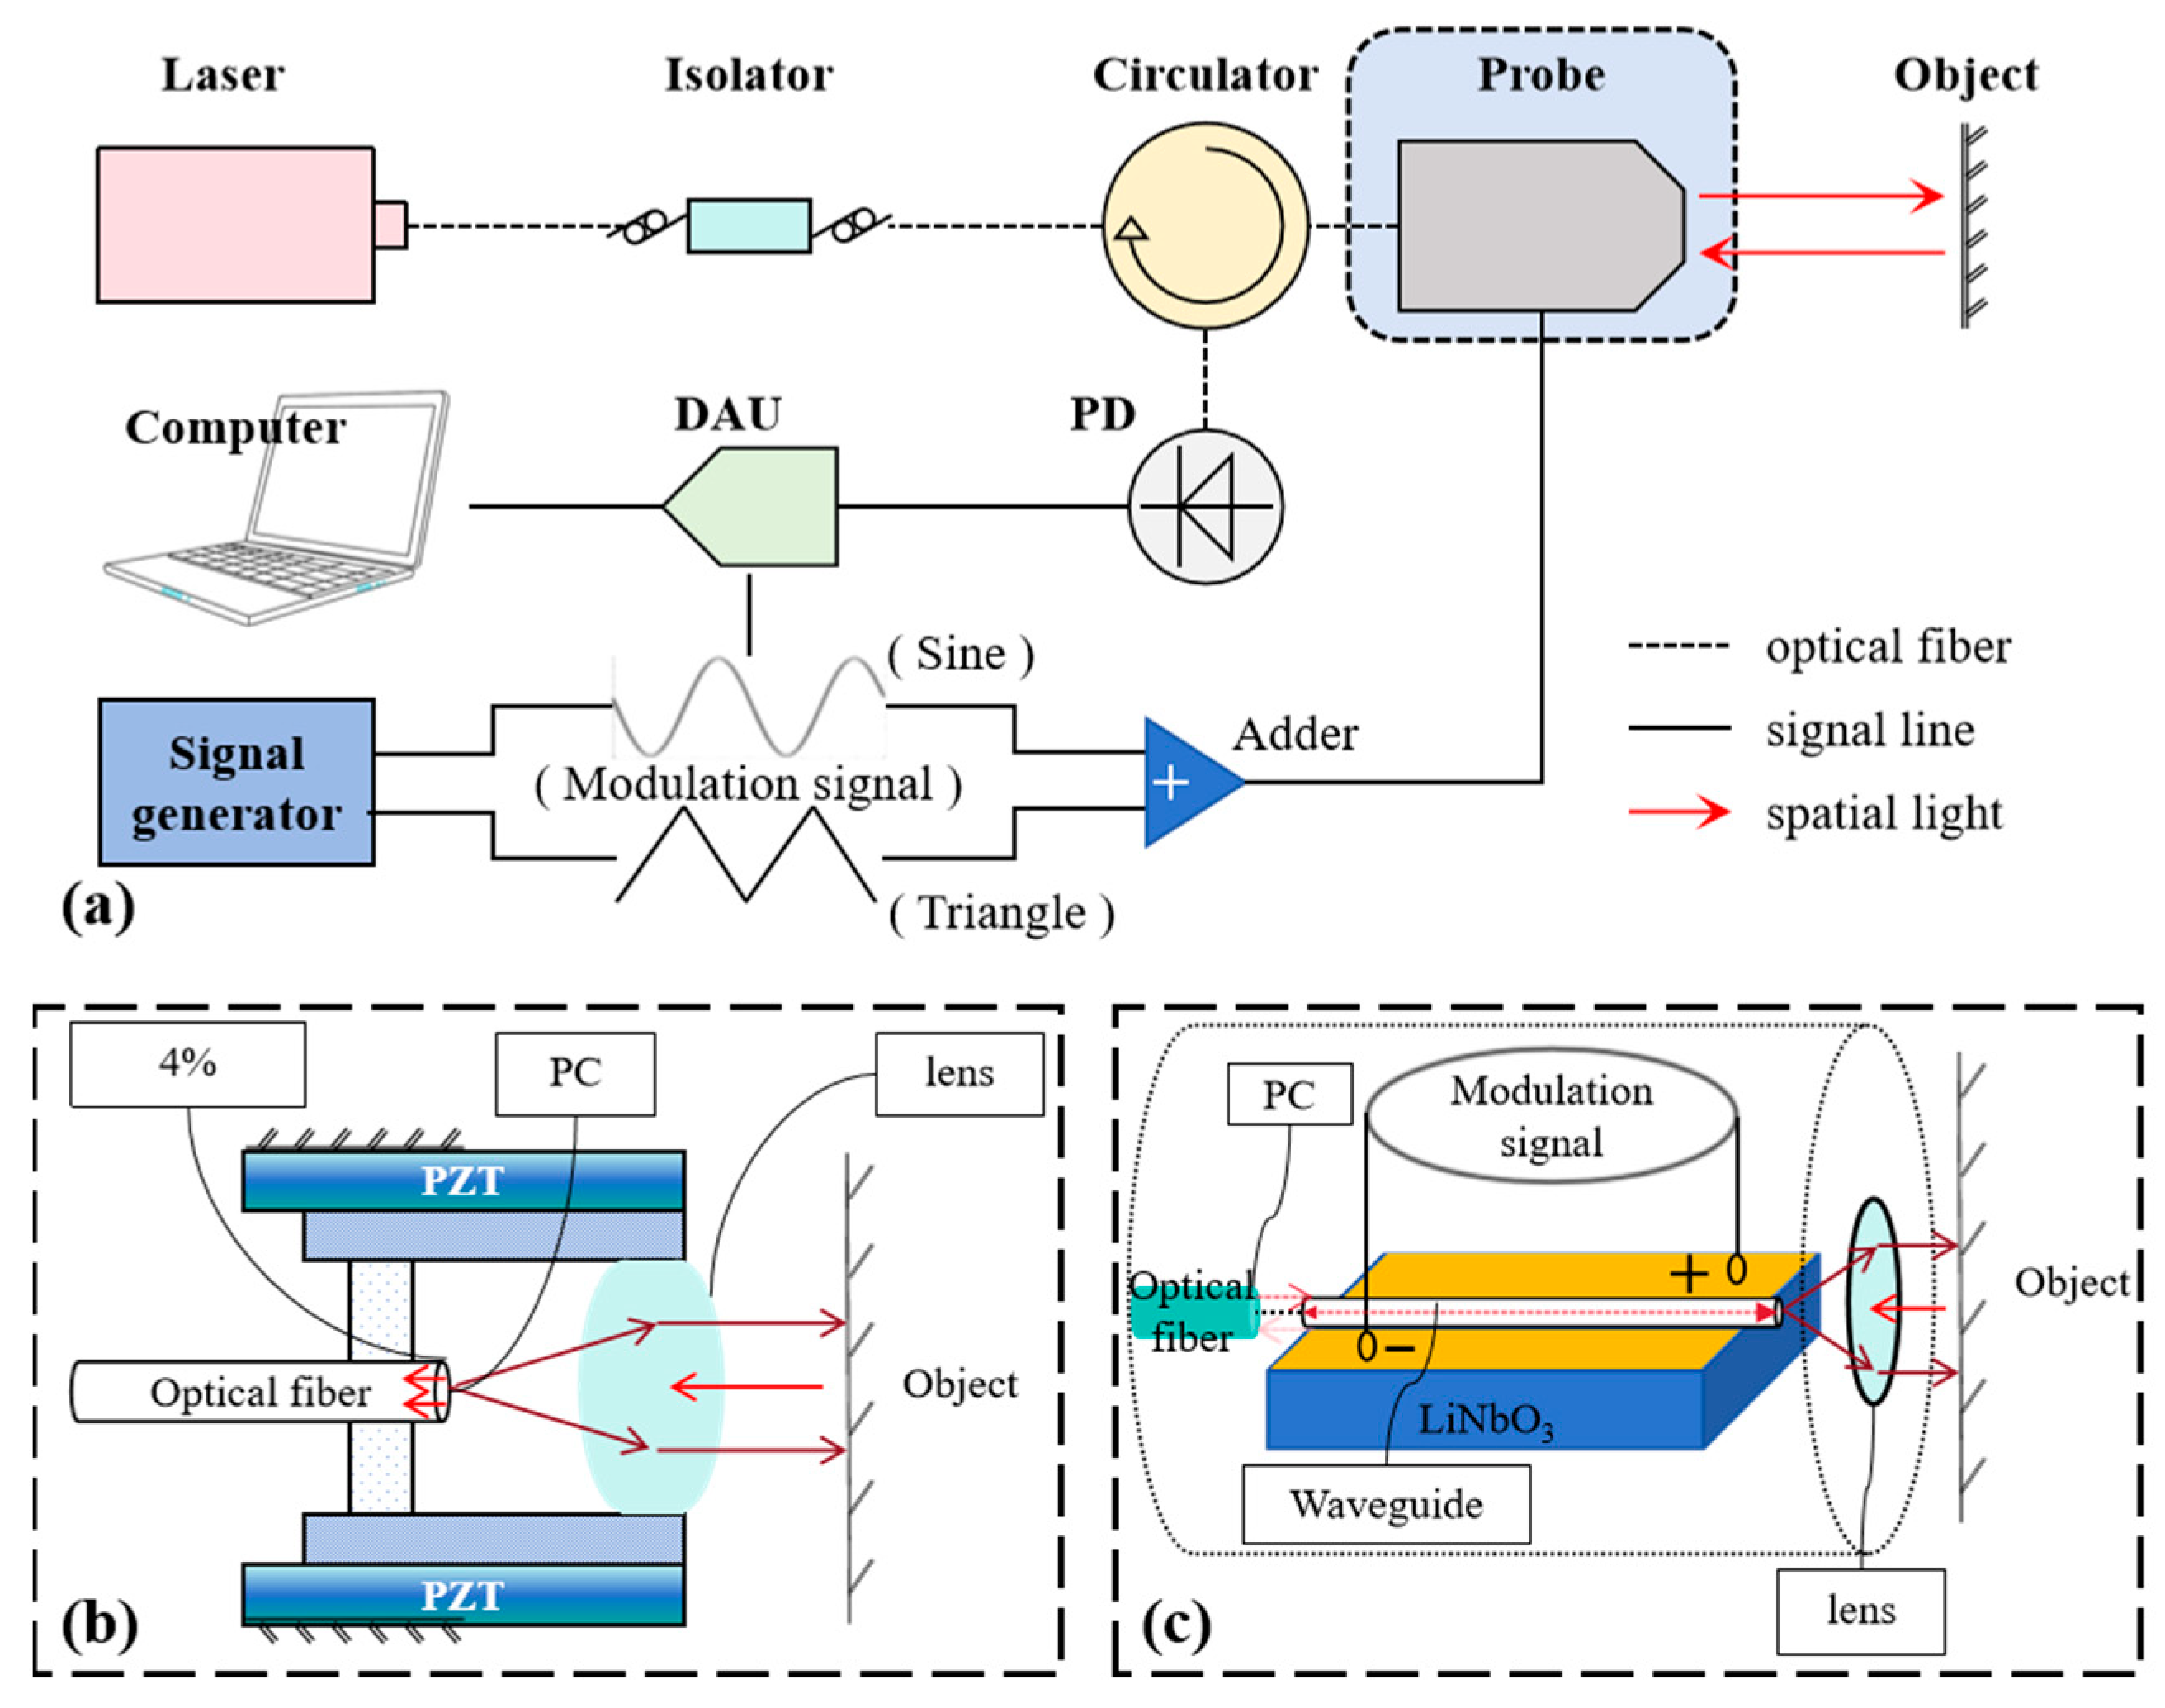
The optical system applicable to the proposed triangular wave mixed phase modulation self-calibration method is illustrated in Figure 2. A narrow-linewidth laser emits wavelength-stable light, which is directed through an optical isolator for protection and then enters an optical circulator before being coupled into the probe assembly. Inside the probe, the beam is reflected by both the reference mirror and the target surface, resulting in an interference signal that returns through the circulator to a photodetector (PD). This signal is converted into a voltage, acquired by a data acquisition unit (DAU), and transmitted to a computer for further processing. This paper introduces a triangular wave mixed modulation approach to phase modulation. As shown in Figure 2a, a signal generator produces both triangular and sinusoidal waveforms, which are linearly superimposed via an adder circuit. The resulting mixed modulation signal drives the probe to achieve phase modulation. During calibration, the sinusoidal modulation signal and the interferometric intensity signal are synchronously acquired by the DAU and transferred to the computer. The proposed calibration method is then applied to accomplish phase demodulation and self-calibration.
The probe serves as the core component of the interferometric optical path. The interferometric hardware employed in this study is based on a heterodyne phase modulation scheme, which supports phase modulation through two distinct methods: one utilizes a piezoelectric ceramic (PZT) actuator integrated at the probe position, while the other employs an electro-optic modulator (EOM). The detailed structures of these configurations are shown in Figure 2b,c, respectively. To enhance system integration and reduce the design complexity, the probe utilizes the inherent approximately 4% Fresnel reflection at the fiber physical contact (PC) end face as the reference beam, with the fiber end itself serving as the reference surface [15]. The principle involves high-frequency vibration of the PZT element when using the piezoelectric ceramic for modulation, which drives minute displacements between the fiber end face and the target surface. This results in periodic phase shifts in the interfering beams, thereby achieving phase modulation [16]. When a driving voltage V P Z T is applied to the PZT, a high-frequency motion is induced in the PZT, which subsequently gives rise to a corresponding phase modulation in the optical path, expressed as Δ φ = 4 π Δ x / λ , where λ is the wavelength of the measured light wave and Δ x is the relative displacement. In the LiNbO3 EOM modulator, high-frequency phase modulation is achieved by leveraging the dependence of the crystal’s refractive index on the applied electric field. The modulation signal alters the phase of the laser wave propagating through the waveguide, thereby enabling precise phase control [16]. When a driving voltage V E O M is applied to the EOM, a high-frequency refractive index change is induced in the EOM, which subsequently gives rise to a corresponding phase modulation in the optical path, expressed as Δ φ = π V E O M / V π , where V π is the half-wave voltage.
In the phase modulation process employing triangular wave mixing, a sinusoidal signal V S i = A sin ( 2 π   f c t + θ ) (where A denotes the signal amplitude, f c the sinusoidal modulation frequency, and θ the initial phase) and a triangular wave signal V T r = B arcsin sin ( 2 π   f d t ) (where B represents the signal amplitude and f d the triangular wave frequency) are linearly superimposed by an adder. In practical applications, the amplitude of the sinusoidal signal determines the phase modulation depth, while its frequency dictates the modulation frequency during probe measurement and also defines the maximum measurable displacement velocity. Triangular wave signals are used to generate low-frequency phase variations and do not have strict requirements. However, to ensure the accuracy of the calibration results, it is recommended that within the signal acquisition time window during application, the triangular wave should drive the probe to produce a displacement of no less than one wavelength. The resulting combined signal serves as the modulation drive signal applied to the measurement optical path, thereby inducing a modulated phase variation in the system.
The corresponding phase change when using PZT for phase modulation can be expressed as:
Δ φ = 4 π Δ x λ = 4 π k ( V S i + V T r ) λ = C sin ( 2 π f c t + θ ) + D arcsin sin ( 2 π   f d t )
where C = 4 π k A / λ and D = 4 π k B / λ , k represents the linear relationship between the PZT and the driving voltage.
Similarly, the corresponding phase change when using EOM for phase modulation can be expressed as:
Δ φ = π V V π = π ( V S i + V T r ) V π = C sin ( 2 π   f c t + θ ) + D arcsin sin ( 2 π   f d t )
where C = π A / V π and D = π B / V π .
After mixed modulation, the phase variation in the optical path not only exhibits high-frequency sinusoidal changes but is also coupled with a linear component introduced by the triangular wave signal.

3.2. Signal Processing Method

It is essential to suppress the nonlinear error introduced by the inequality between R c and R s when applying the four buckets phase demodulation algorithm. The key lies in achieving matching between the modulation depth and the initial phase. In the previous study, the optimal phase values corresponding to different modulation depths were determined through theoretical analysis. This paper proposes a method based on triangular wave hybrid modulation, which enables self-calibration of the four buckets algorithm while the measured object remains stationary, thereby effectively overcoming the limitation of traditional approaches that rely on object displacement.
This paper proposes a simplified calibration method, as shown in Figure 3. The computer first processes the synchronously acquired sinusoidal modulation signal and optical intensity signal: the Hilbert transform is applied to the sinusoidal modulation signal to extract the instantaneous phase values at different time points [17]; for the optical intensity signal, the initial phase value obtained from the Hilbert transform is used to determine the starting moment and processing is carried out according to the methods specified in Equations (2), (4), and (5) to obtain the orthogonal signals X and Y containing nonlinear errors. Subsequently, the nonlinearity level of the orthogonal signals under this initial phase is evaluated using an extremum comparison method, with the evaluation coefficient defined as:
K = V p e a k ( Y ) V p e a k ( X ) = max ( Y ) min ( Y ) max ( X ) min ( X )
The nonlinear evaluation coefficient K corresponding to different initial phase values can be derived from a single set of acquired data by this approach. Under ideal conditions, the nonlinear error is eliminated as the initial phase of the modulation signal perfectly matches the modulation depth, resulting in an evaluation coefficient K = 1 .
The internal phase delay generally remains stable with a fixed measurement system structure [18]. Moreover, the modulation depth of the system also becomes invariant once the external modulation signal is determined. On the other hand, the matching relationship between the initial phase of the modulation signal and the modulation depth in the four buckets algorithm exhibits continuity, and within every π / 2 rad interval, there necessarily exists an optimal matching phase. Based on this, the proposed calibration method in this work consists of two stages: coarse calibration and fine calibration. During the coarse calibration stage, the initial phase is scanned with a certain step size over the range from 0 to π / 2 rad. The nonlinear evaluation coefficient K corresponding to each phase is calculated through the aforementioned signal processing flow, thereby identifying the interval that contains the ideal matching point (where K = 1 ). In the fine calibration stage, a refined search is conducted within this interval using a smaller step size, resulting in a higher-resolution distribution of the K values. The initial phase corresponding to the K value closest to 1 is ultimately selected as the optimal initial phase for the four buckets phase demodulation algorithm.
In practical applications, the proposed method employs triangular wave mixed modulation for phase calibration in measurement systems with relatively stable configurations. A full coarse calibration is performed initially, and only a fine calibration is required in subsequent measurements to complete the calibration process. This strategy simplifies the calibration workflow and effectively reduces the computational overhead.

4. Simulation

To validate the effectiveness of the proposed triangular wave hybrid phase modulation method for self-calibrating the four buckets phase demodulation algorithm under static conditions, a simulation study was conducted. Based on the MATLAB2018b simulation platform, a two-beam interference model was established according to Equation (1) to generate interference signals modulated by the triangular wave hybrid method. The aforementioned calibration method was applied to determine the optimal initial phase under different modulation depths and phase delay conditions. The simulation parameters are listed in Table 1: the sampling frequency was set to 500 kHz, a laser source with a wavelength of 1530 nm was used, and the calibration and measurement were performed on a stationary target. The DC and AC components of the optical intensity were both set to 0.5 V, the sinusoidal phase modulation frequency was 2 kHz, and the triangular wave signal had a frequency of 1 Hz and an amplitude of 20 rad.

4.1. Modulation Depth Matching Verification

In the four buckets phase demodulation algorithm, the optimal initial phase required for the demodulation process varies with the modulation depth of the sinusoidal phase modulation signal. Previous research has systematically analyzed the initial phase values that minimize the demodulation nonlinear error under different modulation depths, with the detailed results summarized in Table 2.
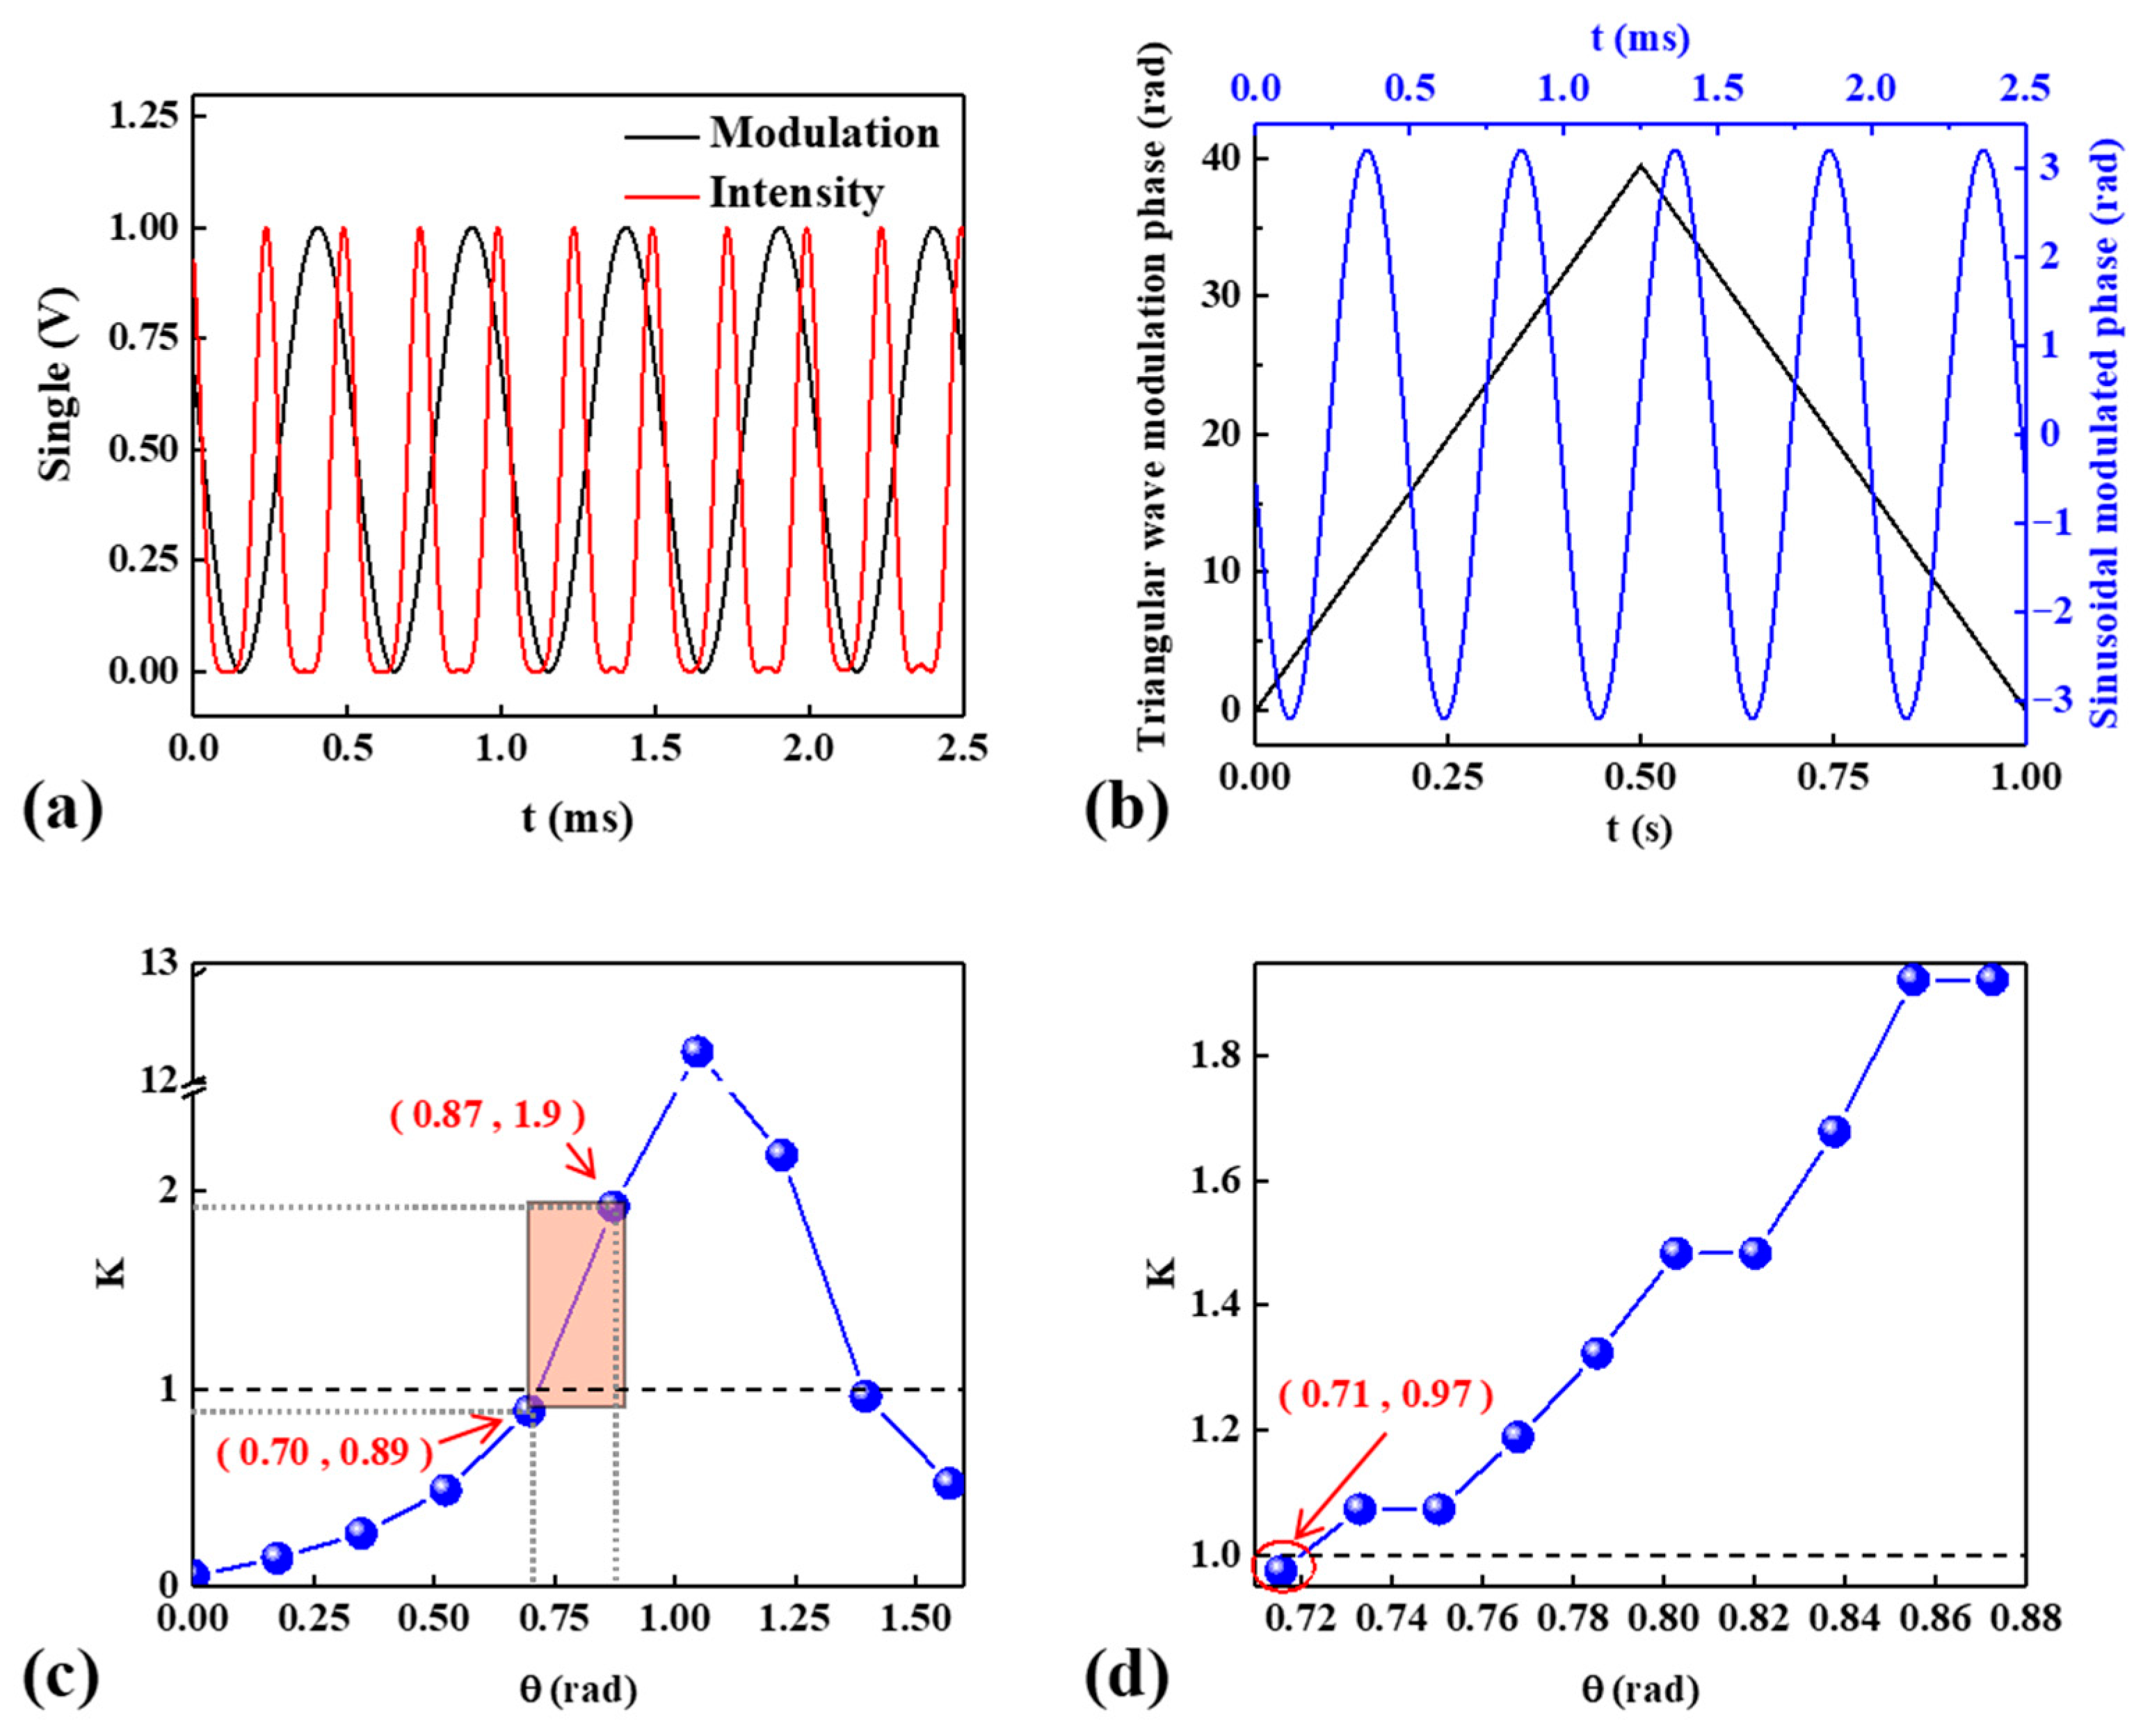
To validate the performance of the proposed calibration method in matching the modulation depth under conditions of negligible system phase delay, a modulation depth of 2.45 rad was selected. The corresponding interferometric intensity model was constructed and calibrated, with the results presented in Figure 4. Specifically, Figure 4a shows the simulated intensity and modulation signals, while Figure 4b illustrates the sinusoidal and triangular waveforms employed in the hybrid modulation. The results of the coarse calibration, shown in Figure 4c, indicate that the evaluation coefficient K traverses the ideal value of 1 within the initial phase range of 0.87 rad to 1.05 rad. Consequently, a fine calibration was performed within this range of 0.87 rad to 1.05 rad with a step size of 0.018 rad, as depicted in Figure 4d. It can be observed that the evaluation coefficient K reaches its value closest to 1 when the initial phase is set to 0.98 rad, indicating that the nonlinear error of the four buckets phase demodulation algorithm is minimized under this condition. These calibration results are consistent with the theoretical values provided in Table 2, thereby demonstrating that the proposed method can effectively calibrate the optimal initial phase corresponding to different modulation depths in a stationary state [19].

4.2. Phase Delay Calibration

In the phase demodulation process, different modulation depths require the corresponding initial phase values to achieve optimal demodulation performance. On the other hand, the phase delay introduced by signal transmission and photoelectric conversion significantly affects the measurement accuracy and may even cause signal distortion after system construction [14]. To address these issues, the triangular wave hybrid calibration method proposed in this paper offers the capability to calibrate the system phase delay. To validate the effectiveness of this method in compensating for phase delay, a simulation experiment was conducted: the sinusoidal phase modulation depth was set to 3.2 rad, the system phase delay was fixed at π / 6 rad, and the described calibration procedure was applied. The final results are shown in Figure 5.
Figure 5a presents the time-domain waveforms of the simulated interferometric intensity and modulation signals, while Figure 5b shows the waveform characteristics of the sinusoidal and triangular signals used for phase modulation. The results of the coarse calibration, displayed in Figure 5c, reveal that the nonlinear evaluation coefficient K continuously crosses the ideal value of 1 within the initial phase range of 0.70 rad to 0.87 rad. Based on this observation, a fine calibration was performed in this range, with a step size of 0.018 rad, as shown in Figure 5d. When the initial phase is set to 0.71 rad, the evaluation coefficient K attains a peak value of 0.97, which is closest to the ideal state, indicating that the nonlinear error of the four buckets phase demodulation algorithm is minimized under this condition. Notably, this calibration result exhibits a systematic deviation of π / 6 rad compared to the theoretically expected initial phase for a modulation depth of 3.2 rad, as listed in Table 2. This discrepancy provides clear evidence of the effectiveness of the proposed method in compensating for system-induced phase delay.

5. Experiment

5.1. Experimental Platform

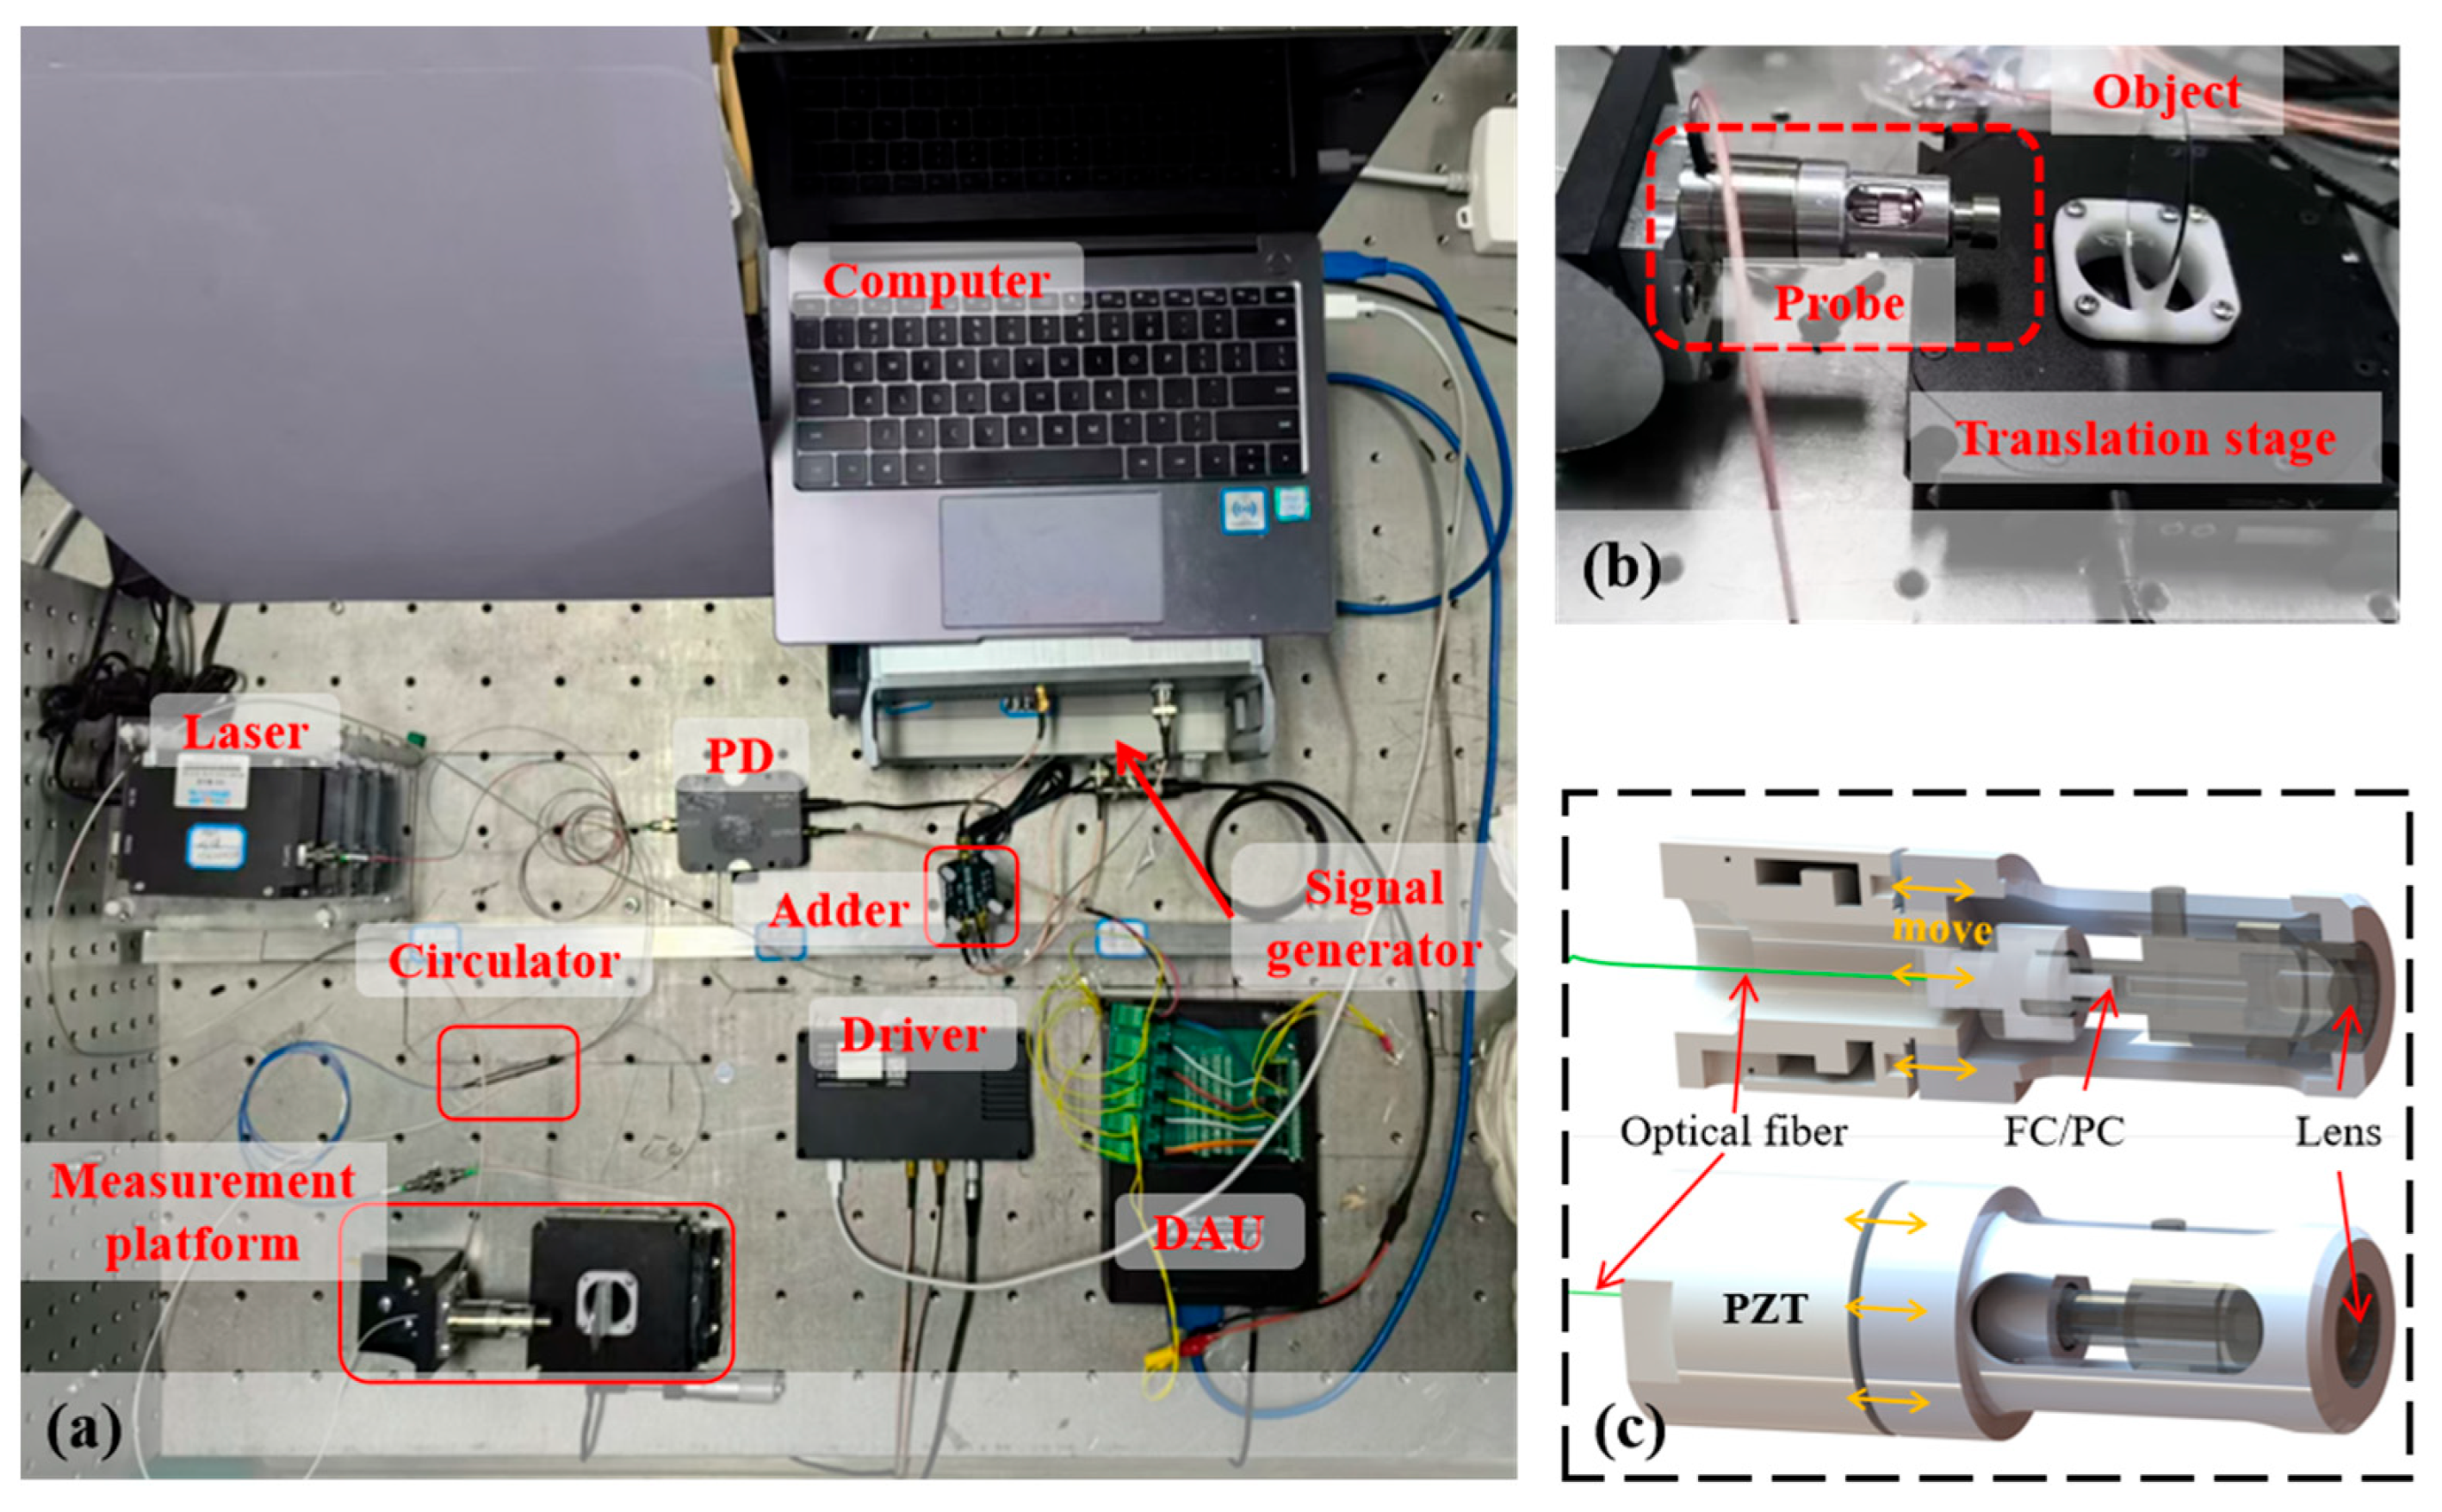
To further demonstrate the effectiveness of the proposed method, experimental validation was carried out on a platform whose setup is illustrated in Figure 6a. In practical engineering applications, non-contact laser-based measurement imposes relatively strict requirements on the environment. Therefore, this experiment was conducted in a constant temperature cleanroom, where factors such as the temperature and air disturbance were strictly controlled throughout the experimental process. The probe employed in the experiment features a heterodyne structure based on PZT phase modulation; consequently, a narrow-linewidth laser was required to provide a laser source with a constant output wavelength.
A narrow-linewidth laser source emitting light at a wavelength of 1530.33 nm passed through an integrated optical isolator and was then directed to a circulator before being transmitted to the measurement platform. The detailed structure of the measurement platform is shown in Figure 6b. The target object was fixed on a precision displacement stage, which can generate predefined displacement signals under closed-loop control. A self-developed phase-modulation probe based on a PZT actuator was employed in the experiment. Its optical configuration, depicted in Figure 6c, operates as follows: the output beam from the optical fiber undergoes 4% Fresnel reflection at the end face to generate the reference beam, while the measurement beam is collimated via a fiber lens and projected onto the target surface [12]. The reflected measurement light then returns into the fiber and interferes with the reference beam.
During the phase modulation process, the high-frequency vibration of the PZT drives the fiber end face to produce axial micro-displacements, thereby achieving high-frequency carrier modulation of the interference phase. The resulting interference signal generated by the measurement platform is transmitted to the PD via the optical circulator, and it is subsequently acquired by the DAU at a sampling rate of 250 kHz before being uploaded to the computer for further processing. Simultaneously, the signal generator produces two signals—a triangular wave and a sinusoidal wave—which are linearly superimposed by an adder circuit and then fed into the PZT driver of the probe to drive the phase modulation process. It should be noted that the computer simultaneously acquires the sinusoidal signal output by the signal generator, which is used for phase synchronization and calibration analysis in the demodulation algorithm.

5.2. Calibration Experiment in Static State

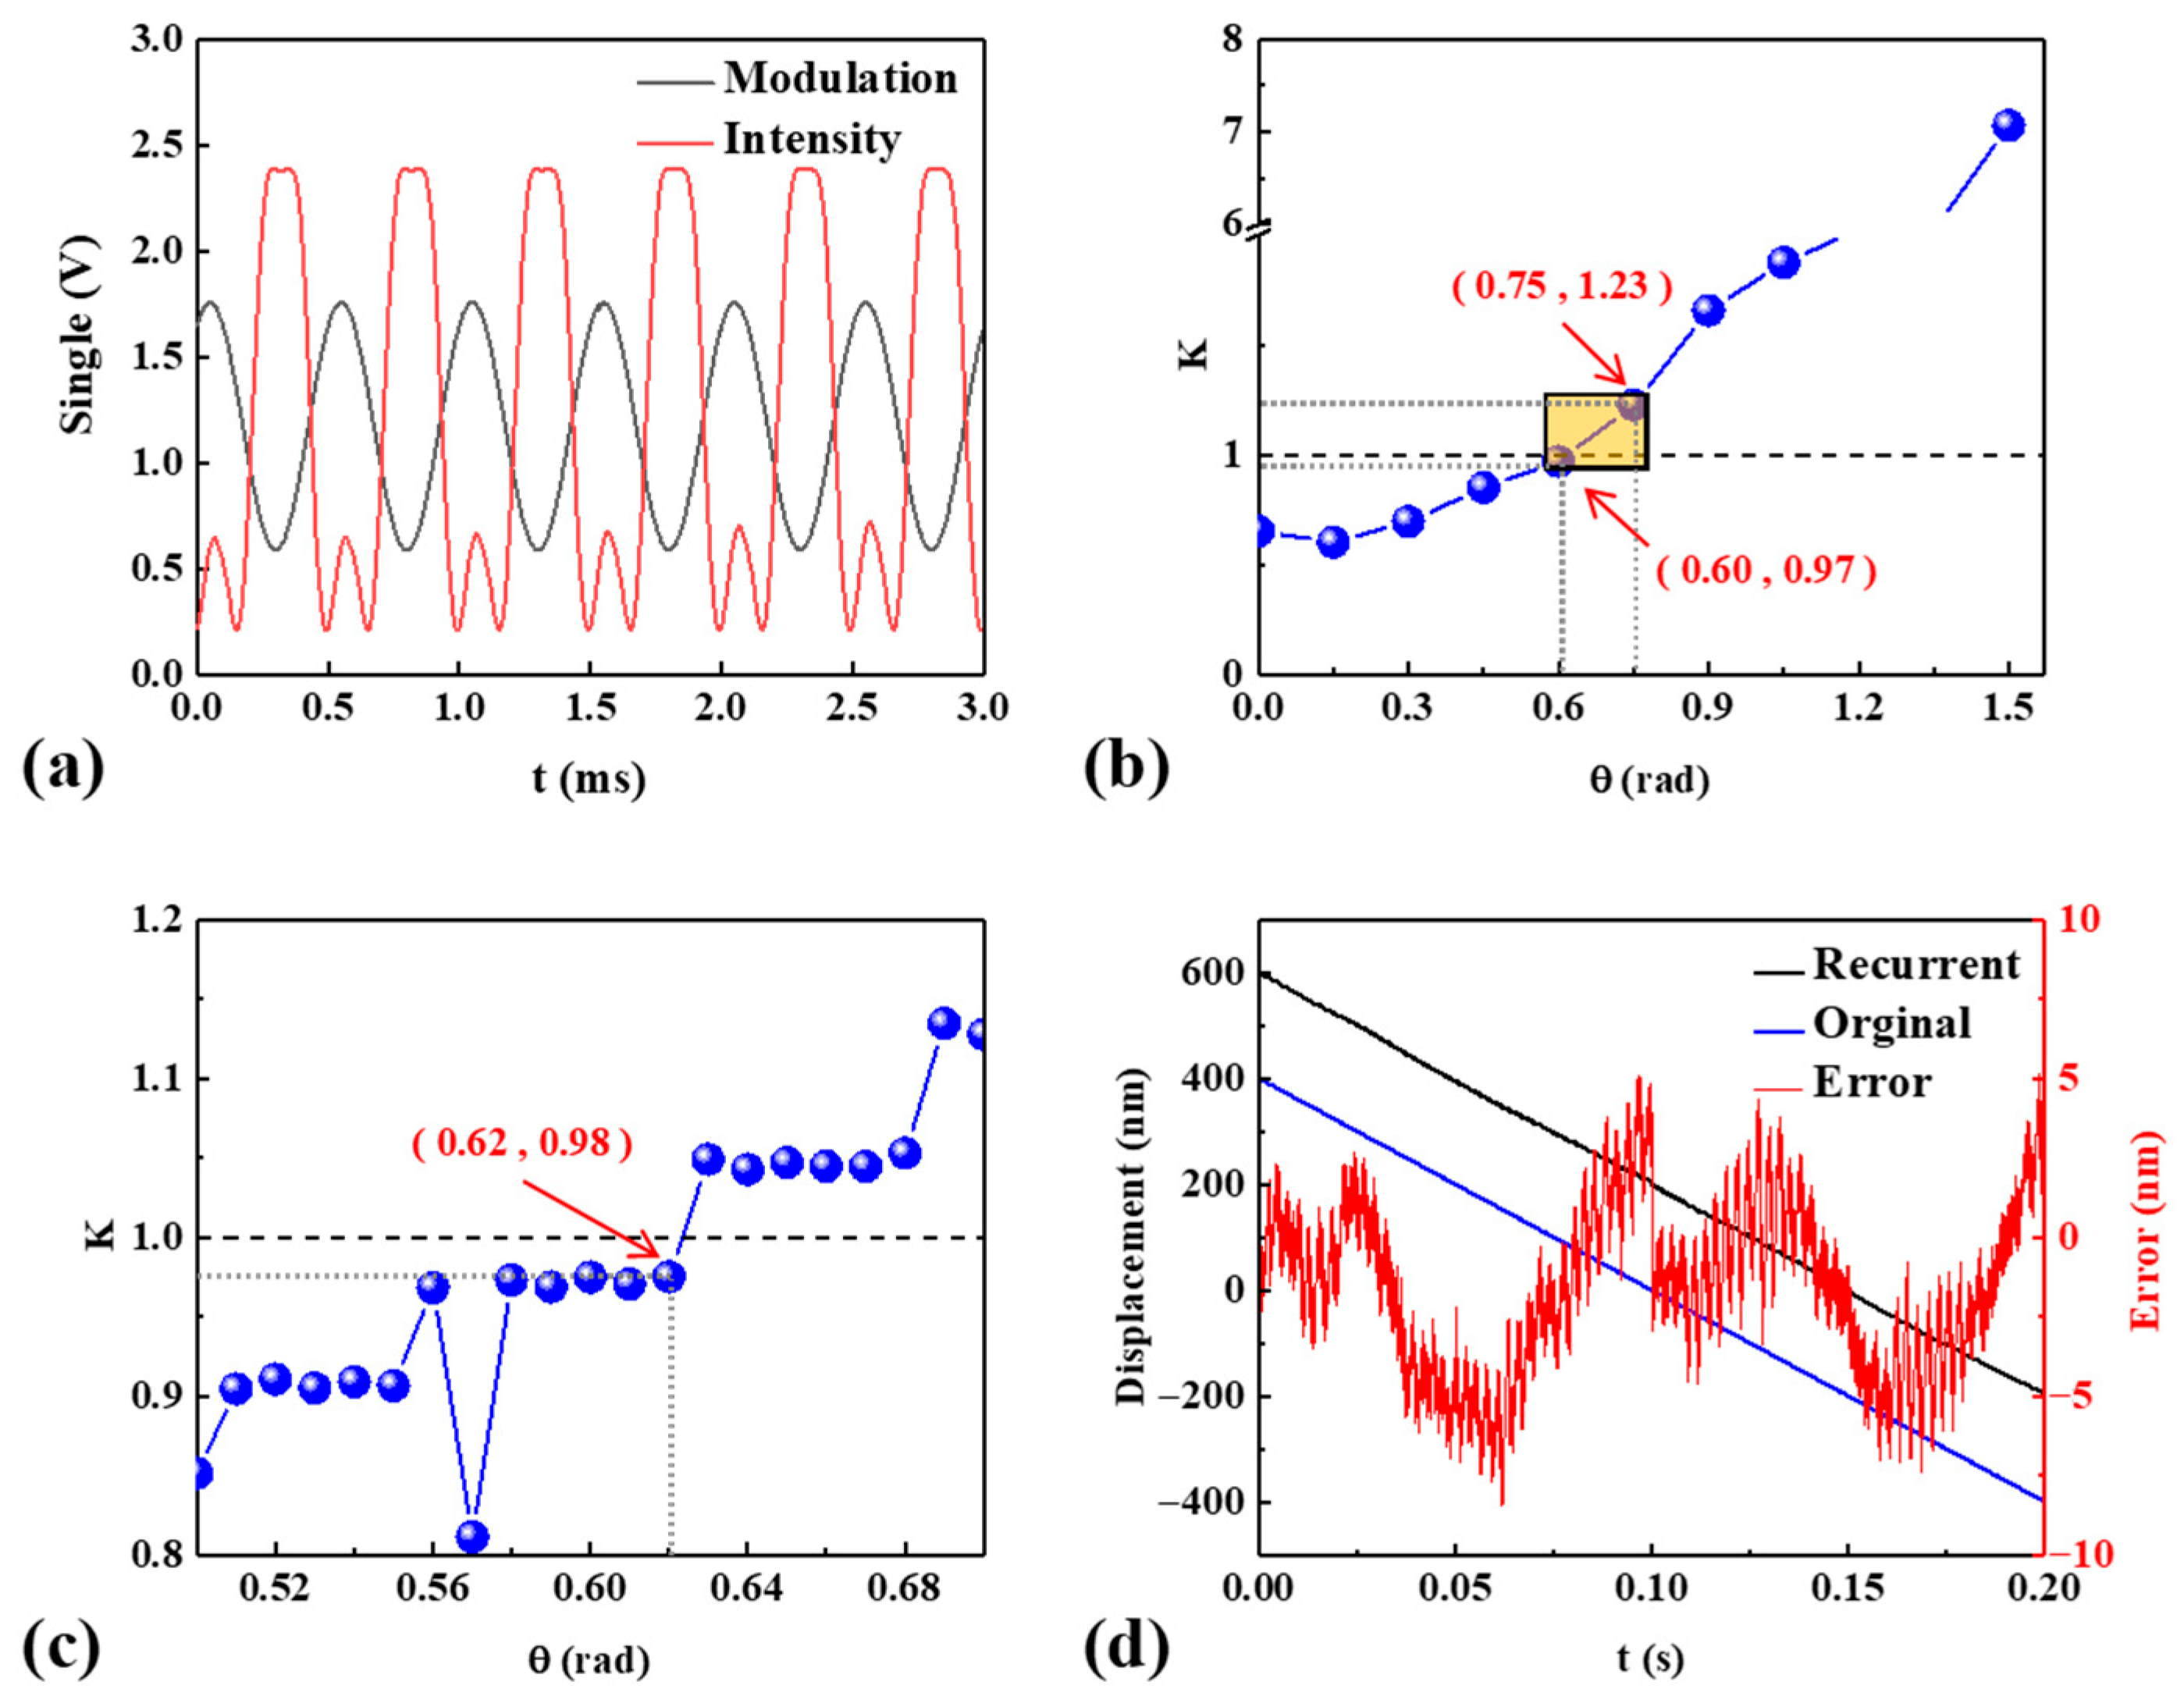
In the experimental validation, the output of the signal generator was adjusted to drive the PZT in the probe to generate a high-frequency sinusoidal motion with an amplitude of 260 nm and a frequency of 2 kHz, corresponding to a phase modulation depth of approximately 2.135 rad. Concurrently, a low-frequency triangular waveform with an amplitude of approximately 1 μm and a frequency of 15 Hz was generated by the triangular wave signal. The target object was maintained in a stationary state using a precision displacement stage. The collected signals were processed using the calibration method proposed in this paper, and the calibration results are presented in Figure 7. Figure 7a presents the synchronously acquired interference intensity signal and the sinusoidal modulation signal. During the coarse calibration stage, a scanning evaluation was performed over the interval from 0 to π/2, with a step size of 0.15 rad. The relationship between the initial phase and the evaluation coefficient is shown in Figure 7b. It can be observed that the evaluation coefficient curve encompasses the ideal value of 1 within the initial phase range of 0.60 rad to 0.75 rad. Based on this result, a refined search was conducted in the fine calibration stage using a step size of 0.01 rad over the aforementioned interval, with the results displayed in Figure 7c. When the initial phase reached 0.62 rad, the evaluation coefficient was closest to the ideal value of 1, indicating minimal nonlinear error under this condition. Thus, the optimal initial phase value after calibration in the static state was determined to be 0.62 rad.
To verify that the optimally calibrated initial phase of 0.62 rad obtained under stationary conditions can effectively suppress nonlinear errors in the four buckets phase demodulation process, an experimental test was conducted in which the triangular wave modulation signal was removed while retaining only the sinusoidal driving signal. A sinusoidal modulation of identical amplitude was applied to the probe, and the target object was driven in linear motion at a constant velocity of 400 nm/s using a precision displacement stage. Phase demodulation was performed using the aforementioned calibrated initial phase, yielding displacement measurement results that were subsequently compared with the preset displacement values. The comparative results are presented in Figure 7d. To more clearly demonstrate the reconstruction performance, the measured results in Figure 7d are displayed with a vertical offset of 200 nm. It can be observed that the linear motion of the displacement stage is accurately reconstructed. The self-calibration method proposed in this paper is applied to the scenario of displacement measurement using a point-scanning profilometer probe. In such a scenario, the evaluation of the calibration results requires an assessment of the displacement measurement error after calibration. Generally, the commonly adopted evaluation metric is the RMS (root mean square) value when a profilometer is used to measure the surface topography error of an optical surface [20,21]. A quantitative analysis of the measurement error shows an RMS error of 3.0337 nm and a mean error of 2.4479 nm. These results fully demonstrate that the proposed triangular wave hybrid calibration method can effectively calibrate the four buckets phase demodulation algorithm while the target remains stationary, significantly reducing nonlinear errors.

6. Conclusions

In the inspection of ultra-precision optical components, the prior calibration of the measurement system is of critical importance. This paper proposes a self-calibration method for four buckets phase demodulation based on triangular wave hybrid modulation, which addresses the key limitation of existing methods—namely, the inability to perform calibration under stationary conditions. The demodulation performance of the four buckets algorithm is jointly influenced by the system’s modulation depth and phase delay: different modulation depths require the corresponding initial phase values for optimal performance, while the inherent phase delay in the system further complicates the accurate determination of the initial phase. A mismatch in phase can introduce significant nonlinear errors and may even lead to distortion in the measurement results.
The method proposed in this work enables rapid self-calibration of fiber optic displacement interferometric probes before measurement by linearly mixing triangular and sinusoidal modulation signals and incorporating a more concise evaluation strategy. It addresses the technical gap that previously hindered effective calibration under stationary conditions. The system structure of heterodyne sinusoidal phase modulation was first introduced, and simulations were conducted to verify the feasibility of the calibration approach. Furthermore, experiments using a PZT-based phase-modulated interferometric displacement probe successfully achieved calibration in a static state, yielding an optimal initial phase value of 0.62 rad for the system. When this phase value was applied to actual displacement measurements, the target displacement was accurately reconstructed with an RMS error of 3.0337 nm and a mean error of 2.4479 nm, confirming the effectiveness and practical applicability of the method.

Author Contributions

Conceptualization, Q.L. and S.C.; methodology, Q.L.; software, T.L.; validation, G.L. and J.L. (Jiajun Lin); writing—original draft preparation, Q.L.; writing—review and editing, J.L. (Junfeng Liu); project administration, J.L. (Junfeng Liu). All authors have read and agreed to the published version of the manuscript.

Funding

This research was funded by the National Natural Science Foundation of China (Grant No. 52375473) and the National Key R&D Program of China (No. 2021YFC2202303).

Data Availability Statement

The original contributions presented in the study are included in the article, further inquiries can be directed to the corresponding author.

Conflicts of Interest

The authors declare no conflict of interest.

References

  1. Qin, J.; Jiang, S.; Wang, Z.; Cheng, X.; Li, B.; Shi, Y.; Tsai, D.P.; Liu, A.Q.; Huang, W.; Zhu, W. Metasurface micro/nano-optical sensors: Principles and applications. ACS Nano 2022, 16, 11598–11618. [Google Scholar] [CrossRef]
  2. Guo, J.; Wang, X.Y.; Zhao, Y.; Hou, C.Y.; Zhu, X.; Cai, Y.D.; Jin, Z.J.; Kang, R.K. On-machine measurement of tool nose radius and wear during precision/ultra-precision machining. Adv. Manuf. 2022, 10, 368–381. [Google Scholar] [CrossRef]
  3. Fu, Y.; Shang, Y.; Hu, W.; Li, B.; Yu, Q. Non-contact optical dynamic measurements at different ranges: A review. Acta Mech. Sin. 2021, 37, 537–553. [Google Scholar] [CrossRef]
  4. Kim, S.; Jeon, J.; Kim, Y.; Sugita, N.; Mitsuishi, M. Design and assessment of phase-shifting algorithms in optical interferometer. Int. J. Precis. Eng. Manuf.-Green Technol. 2023, 10, 611–634. [Google Scholar] [CrossRef]
  5. Eisenhauer, F.; Monnier, J.D.; Pfuhl, O. Advances in optical/infrared interferometry. Annu. Rev. Astron. Astrophys. 2023, 61, 237–285. [Google Scholar] [CrossRef]
  6. Berger, G.; Petter, J. Non-contact metrology of aspheric surfaces based on MWLI technology. In Proceedings of the SPIE Optifab 2013, Rochester, NY, USA, 14–17 October 2013. [Google Scholar]
  7. Sharma, S.; Eiswirt, P.; Petter, J. Study on Interferometric Stability Based on Modulating Frequency, Operating Wavelengths and Temperature using an Electro Optic Multi-Wavelength Distance Sensor. Sens. Transducers 2018, 225, 1–7. [Google Scholar]
  8. Guo, D.; Wang, M.; Tan, S. Self-mixing interferometer based on sinusoidal phase modulating technique. Opt. Express 2005, 13, 1537–1543. [Google Scholar] [CrossRef] [PubMed]
  9. Dubois, A. Phase-map measurements by interferometry with sinusoidal phase modulation and four integrating buckets. J. Opt. Soc. Am. A (Opt. Image Sci. Vis.) 2001, 18, 1972–1979. [Google Scholar] [CrossRef] [PubMed]
  10. Guo, J.; Li, D.; Sun, H.; Qu, T.; Liu, X.; Wang, J. Phase Modulation Depth Deviation Effect Correction for Extended Displacement Sensing Range in Fiber-Optic Sinusoidal Frequency Modulation Interferometer. J. Light. Technol. 2025, 43, 3808–3821. [Google Scholar] [CrossRef]
  11. Duan, F.; Bao, R.; Huang, T.; Fu, X.; Zhang, C. Scale factor calibration method for integrating-bucket sinusoidal phase shifting interferometry(Article). Opt. Laser Technol. 2020, 127, 106149. [Google Scholar] [CrossRef]
  12. Liu, Q.; Lin, J.; Liu, J.; Lai, T.; Luo, G.; Li, Z.; Chen, S. Self-alignment method for four integral bucket phase demodulation in displacement interferometry. Opt. Laser Technol. 2025, 191, 113288. [Google Scholar] [CrossRef]
  13. Zhao, H.; Ma, D. Enhanced PGC displacement sensors: Center frequency stabilization and sub-nanometer precision measurement utilizing laser intensity modulation. Meas. J. Int. Meas. Confed. 2025, 246, 116686. [Google Scholar] [CrossRef]
  14. Shi, Y.; Wang, X.; Duan, H.; Xu, Z.; Yan, S.; Sun, Q.; Liang, Y.; Zhou, Z. Low-Frequency High-Resolution Fiber Fabry–Perot Interferometric Accelerometer Based on Double-Spring-Supported Oscillator. IEEE Sens. J. 2024, 24, 17500–17506. [Google Scholar] [CrossRef]
  15. Zhao, X.; Suzuki, T.; Sasaki, O. Sinusoidal phase modulating laser diode interferometer using an additive operating type of integrating bucket method. Proc. SPIE—Int. Soc. Opt. Eng. 2002, 4919, 275–282. [Google Scholar]
  16. Sharma, S.; Eiswirt, P.; Petter, J. Electro optic sensor for high precision absolute distance measurement using multiwavelength interferometry. Opt. Express 2018, 26, 3443–3451. [Google Scholar] [CrossRef] [PubMed]
  17. Zhao, Y.; Zhang, M.; Zhang, C.; Yang, W.; Chen, T.; Perchoux, J.; Ramírez-Miquet, E.E.; Moreira, R.d.C. Micro Particle Sizing Using Hilbert Transform Time Domain Signal Analysis Method in Self-Mixing Interferometry. Appl. Sci. 2019, 9, 5563. [Google Scholar] [CrossRef]
  18. Zhang, S.; Yan, L.; Chen, B.; Xu, Z.; Xie, J. Real-time phase delay compensation of PGC demodulation in sinusoidal phase-modulation interferometer for nanometer displacement measurement. Opt. Express 2017, 25, 472–485. [Google Scholar] [CrossRef] [PubMed]
  19. Huang, T.; Li, X.; Fu, X.; Zhang, C.; Duan, F. Exposure time shortened integrating-bucket method for sinusoidal phase shifting interferometry. Opt. Commun. 2019, 451, 333–337. [Google Scholar] [CrossRef]
  20. Wang, J.; Zhou, G.; Lei, W.; Dong, X.; Wang, J. X-Ray Mirror Surface Profile Measurement with Nanometer Accuracy Based on Three-Displacement Sensors. Guangxue Xuebao/Acta Opt. Sin. 2025, 45, 0512003. [Google Scholar]
  21. Zhou, Y.; Mo, J.; Peng, L.; Shen, B.; Yu, Y. Measurement of surface profile for transparent flats under dense cavity lengths using wavelength tuning interferometry based on subspace orthogonality. Meas. J. Int. Meas. Confed. 2025, 251, 117291. [Google Scholar] [CrossRef]
Figure 1. Four buckets algorithm [12].
Applsci 15 10956 g001
Figure 2. Optical path system with self-calibration method using triangular wave mixed phase modulation: (a) Triangular wave hybrid phase modulation system, (b) PZT phase modulation probe, (c) EOM phase modulation probe.
Applsci 15 10956 g002
Figure 3. Calibration method’s signal-processing flow.
Applsci 15 10956 g003
Figure 4. Simulation without phase delay: (a) simulated light intensity and sine modulation signal, (b) sinusoidal and triangular wave phases involved in phase modulation, (c) initial phase coarse search result, (d) initial phase fine search result.
Applsci 15 10956 g004
Figure 5. Simulation with phase delay: (a) simulated light intensity and sine modulation signal, (b) sinusoidal and triangular wave phases involved in phase modulation, (c) initial phase coarse search result, (d) initial phase fine search result.
Applsci 15 10956 g005
Figure 6. Experimental platform: (a) system construction, (b) measurement platform, (c) probe structure [12].
Applsci 15 10956 g006
Figure 7. Calibration experiment: (a) collected light intensity and sine modulation signal, (b) initial phase coarse search result, (c) initial phase fine search result, (d) displacement measurement result after calibration.
Applsci 15 10956 g007
Table 1. Parameter setting for the simulation experiment.
ParameterValue
Sampling rate (kHz)500
Wavelength (nm)1530
Displacement (nm)0
DC/AC light intensity (V)0.5
Modulation frequency (kHz)2
Amplitude of triangle (rad)20
Triangle frequency (Hz)1
Table 2. Modulation depth and matching initial phase values [12].
C (rad)1.822.22.42.452.62.833.23.4
θ (rad)0.550.730.860.960.981.041.111.171.231.29
Disclaimer/Publisher’s Note: The statements, opinions and data contained in all publications are solely those of the individual author(s) and contributor(s) and not of MDPI and/or the editor(s). MDPI and/or the editor(s) disclaim responsibility for any injury to people or property resulting from any ideas, methods, instructions or products referred to in the content.