Abstract
This study suggests a newly developed model for estimating city-scale photovoltaic rooftop energy potential. This model aims to provide reasonable universal calculations regarding a city’s available space for mounting rooftop photovoltaic systems and their corresponding annual electricity production capacity. For the development of the model, a thorough literature review has been conducted, which compiles and presents mathematical expressions and performance coefficients. Necessary geographic and meteorological data have been obtained from European statistical repositories and the PVGIS tool, respectively. The main inputs refer to a city’s basic geographical data, population, total actual area, geographical coordinates, and, by extension, the optimum PV unit installation angle. This analysis presents a simple and accurate model applicable to European cities for assessing rooftop photovoltaic energy potential and suitable rooftop space for PV units. The findings can aid in advancing PV development in urban areas and contribute to creating environmentally neutral cities in the future. The methodology is verified with data retrieved from the Google Environmental Insights Explorer tool, which shows a deviation of 9.72%. According to the computational analysis for 40 European countries, the photovoltaic energy potential is between 12.31 GWh and 8200 GWh. These values correspond to a net available PV space between 0.03 km2 and 31.86 km2. The greatest photovoltaic coverage potential is equal to 117.4% for Patras, Greece, while the lowest is 7.27% for Oslo, Norway. Regarding the avoided greenhouse gas emissions, they are found to vary from 5.8 ktons of CO2-equivalent for Valletta, Malta, and 8109.8 ktons for the city of London, United Kingdom. Finally, the final results of 86 additional cities located on the European continent are given.
1. Introduction
The imperative transition towards sustainable and energy-efficient built environments is particularly crucial due to the escalating worldwide energy demands and climate change impacts. The implementation of transformative energy efficiency and renewable energy solutions is necessary for the transformation of the energy-demanding building sector into an energy-efficient and autonomous sector that supports on-site energy production, self-consumption, and community energy distribution. The combination of passive energy-efficient renovation technologies [1] and the incorporation of renewable photovoltaic systems is an effective strategy for the creation of efficient zero-energy buildings [2]. This strategy is in line with the European Union’s (EU) initial towards fully electrified buildings, the decarbonization of its energy mix [3], and the increase in the renewable contribution to electricity generation [4]. The integration of rooftop photovoltaic (RTPV) systems is a means to increase the renewable energy capacity within the building sector and an important step towards the EU’s holistic approach to transforming its energy landscape and achieving the EU’s 2030 and 2050 climate goals [5].
Based on a study by D’Agostino et al. [6], the use of thermal insulation and the appropriate installation of PV modules, exploiting the shading effect for cooling purposes, results in an almost 58% decrease in total primary energy. Ziozas et al. [7] investigated the retrofitting of an old historic Italian building, and proposed an energy renovation strategy of various passive thermal envelope technologies, in combination with the RTPV system, and calculated annual final energy demand savings of 37%. Kitsopoulou et al. [8] systematically investigated the zero energy balance potential of residential buildings, and calculated the maximum possible number of stories for the four distinct climatic categories of Greece. Except for studies that concentrate on building-scale renewable integration, studies and meta-analyses that take into account diverse geographical and environmental conditions that influence solar availability have played a pivotal role in assessing the RTPV potential across Europe. More specifically, an analysis by Kapsalis et al. [9] incorporates various parameters, namely population density, electricity production, and multiple environmental factors such as shading and performance ratio, to calculate RTPV systems’ contribution potential for various climates. Molnár et al. [10] predicted that RTPV electricity production potential in the EU could escalate to 3.56 PWh by 2060, underlying the major contribution of this technology to meeting renewable energy targets.
Estimating PV potential is a complex, multi-dimensional process with significant variability [11]. There are two main approaches: a constant value method, which uses existing building data, for instance, space, population density, and regional PV potential, to identify relationships, and a GIS-based approach, which is more detailed, utilizing layered maps to assess space availability and PV potential [12]. Regarding the constant value approach, in a study by Gernaat et al. [13] the growing role of rooftop PV systems in the global energy market is examined using the integrated assessment model IMAGE [14]. Socioeconomic factors like income and electricity prices impact rooftop PV deployment more than solar irradiation. Moreover, Castellanos et al. [15] examine methodologies for assessing RTPV potential in urban areas, focusing on scalability and resolution. The study compares high-resolution, city-specific methods with generalized, low-resolution approaches, highlighting significant discrepancies in potential estimations. The findings emphasize the need for more accurate, scalable tools to guide policy development and maximize rooftop PV adoption. The study by Mainzer et al. [16], presents an in-depth analysis of the technical potential for residential PV installations across Germany. This research employs a statistical approach, leveraging data on the available roof area which is, and presents estimates of the PV potential on the municipality level by combining socio-economic data with parameters such as building types, roof inclinations, and orientations. This method allows for calculating the technical potential for PV across different municipalities with high resolution. Finally, Defaix et al. [17] estimate the usable area for PV systems in EU countries based on population density and building floors, projecting electricity generation capacity from PV across the European Union. By using a harmonized approach to assess the suitability of building surfaces for PV installation, their analysis highlights significant potential for PV to support the EU’s renewable energy goals.
Regarding the GIS-based method, Molnár et al. [10] investigate the electricity production capability of RTPV systems across the EU using a GIS-based approach. Using high-resolution geospatial techniques to assess the spatial and temporal factors affecting rooftop PV production, they calculated that the current technical potential could reach about 2.7 PWh, which is closely aligned with the EU’s total power consumption. Germany, France, Italy, and Poland stand out as having the highest PV potential, expected to increase by 30% by 2060. Moreover, Bódis et al. [18] utilize a geospatial methodology with satellite data, statistics, and machine learning to assess the technical and economic viability of rooftop PV across Europe with a spatial resolution of 100 m. Their findings suggest that EU rooftops could cover one-fourth of present electricity consumption, with two-thirds of this potential available at costs lower than ongoing residential rates. However, the study also identifies significant challenges in countries where electricity prices are low, but investment rates are high, underscoring the need for policy adjustments and better integration of rooftop PV assessments into grid management and planning. Additionally, in a study by Rodriguez et al. [19] applied to Germany, it was found that utilizing all available rooftop areas could cover 77% of the territory’s electricity needs, with economic potential at 56% for high irradiance roofs, and some municipalities could exceed 100% coverage under certain scenarios. Meanwhile, Izquierdo et al. [20] estimated that solar hot water systems and PV systems in Spain could meet 70% of service hot water demand, with PV alone projected to provide 10 TWh annually, covering 4.0% of total electricity need. In Sweden, Yang et al. [21] developed a framework to analyze roof-mounted solar PV potential, focusing on the city of Västerås, Sweden, estimating a total rooftop space of 5.74 km2 and a potential installed capacity of 727–956 MW, yielding 626–801 GWh annually.
In the study by Assouline et al. [22], a novel GIS method combined with machine learning techniques is used to calculate at a country level the RTPV electricity potential. According to their calculations, for east- or west-oriented rooftops, the annual electricity production potential is equal to 16.3 TWh, which corresponds to one-fourth of the country’s total electricity need for 2017. On the other hand, by combining a GIS method with a statistical model, Phillips et al. [23] calculated that the installation of RTPV systems on residential buildings can result in a 25% contribution to the USA’s electricity market. Lastly, Gassar and Cha [24] conducted a comprehensive review study regarding GIS-based RTPV potential calculation methods in cities. They underlined the combined use of light detection and ranging (LiDAR) technology and GIS as an accurate method for RTPV electrical potential.
The present literature review provides valuable insights into the existing methodologies regarding city-scale photovoltaic electricity production and city energy autonomy. It also aids in optimizing the integration of RTPV, offering valuable perspectives and guidelines for local and national authorities, urban planners, and renewable energy supporters. Building on the insights derived from existing studies, this paper introduces a novel model that broadens the scope of RTPV potential evaluation by incorporating advanced methodologies and open-access statistical data from national, European, and international sources. The newly developed model adjusts the global phenomenological correlational parameters to a regional scale, thereby more accurately estimating RTPV potential for major cities in Europe and Greece. The proposed methodology is an important advancement in comprehending RTPV’s role in building electrification and climate neutrality objectives. This analysis’s novelty and significance stem from the developed model’s accuracy and simplicity, which can be applied across all European cities to provide reasonable estimates of PV energy potentials and the cities’ current PV rooftop availability space. The findings of this study can be used for further photovoltaic implementation in urban areas and to help create future cities that are environmentally sustainable.
2. Materials and Methods
In this chapter, the methodology and the developed calculation model of the RTPV potential in multiple major European is presented in detail.
2.1. Followed Methodology
In this study, a simple model for the calculation of a city’s RTPV electricity production potential is developed. This model aims to provide reasonable universal estimations regarding a city’s available space for PV installation and annual PV electricity production potential. For this reason, basic parameters linked to a city’s geographical data are needed as inputs. These parameters regard a city’s population and total actual area, its latitude angle, and by extension the optimum PV module tilt angle. To first deduct a city’s actual PV available space the utilization factor is defined based on the existing literature. The utilization factor numerates the architectural suitability, solar potential, and shading conditions of a city. Also, an equation correlating the utilization factor with a city’s population density is formed. Following that, for the accurate calculation of the PV installation suitable space, geometric parameters regarding rooftop PV space planning are taken into consideration. These parameters concern corridors between PV clusters and the distances between PV arrays, and information retrieved from existing literature is retrieved for the necessary assumptions. Additionally, a function of the city-scale average packing factor in terms of a city’s latitude is formed. Furthermore, suitable coefficients that take into account operation and shading losses are thoroughly investigated and retrieved from the existing literature. The annual on-plane solar irradiation at the optimum tilt angle is retrieved from the PVGIS tool [25], while a typical PV efficiency is considered. The aforementioned calculation process results in the estimation of a city’s photovoltaic energy potential and net area available for PV installation.
2.2. Mathematical Formulation
For every examined city, information concerning its total actual area, A in [km2] and population, P, are retrieved from Refs. [26,27], and given in detail in Appendix A. According to these numbers, a city’s population density, (ρ) in [m2/capita] as given below:
Following, for every city, the available surface area per capita for PVRT installation, denoted as (Acapita) in [m2/capita] is calculated as [15]:
where (a) and (c) are constants with values equal to 172.3 and 0.352, respectively, according to Ref. [15]. According to this, a city’s available surface area for PVRT installation, denoted as (Acity) in [km2] is calculated as:
Additionally, it is important to define the value of building area density [28], denoted with (D) in [m2/capita], which is calculated according to the following equation:
where (Abuilding) in [m2], denotes a city’s building footprint, equivalent to a city’s area covered with buildings. The density of the building area of every examined city is given in Appendix A. The average value of building area density among the examined cities is denoted with (Daverage) and is calculated at 46 m2/capita, according to Table A1 in Appendix A.
For the calculation of the actual available surface area for PVRT installation per city, the determination of the utilization factor, (Ut) in [%], is necessary [29]. The utilization factor expresses a city’s architectural and solar suitability. More specifically, the term architectural suitability expresses the suitable part of the building for the installation of PV systems, taking into account neighboring constructions, shading, and historical elements. The term solar suitability expresses the percentage of the surface resulting from architectural suitability that is capable of receiving a satisfactory intensity of incident solar irradiation, namely above 80% of the maximum annual solar irradiation. Their average value is around 60% and 55% for rooftops, respectively [30]. According to Gutschner et al. [30], for Western Europe, the mean value of the utilization factor is around 0.4, but it ranges between 0.25 and 0.75, depending on a city’s population density. A city with a higher population density has a higher utilization factor.
In Appendix A, the calculated population density for every examined city is given in Table A1, according to which 60% of the examined European and Greek cities demonstrate a population density between 100 and 300 m2/capita. For these cities, a utilization factor in the range of 30 to 50% is assumed. According to the aforementioned, Figure 1 is constructed, from which the following logarithmic equation for the calculation of (Ut) is extracted, with an R-squared coefficient of 0.9617.
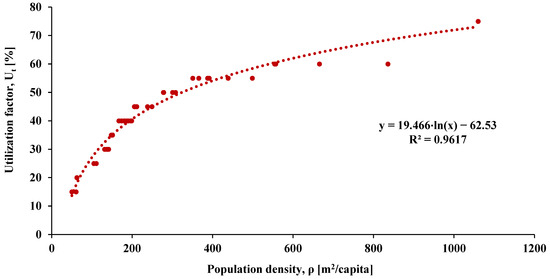
Figure 1.
Utilization factor per city per population density.
The actual suitable PV available surface area for each city, (AS) in [km2], is calculated according to the following equation:
A weigh factor (W) is considered to apply to the correction factor . The weight factor is determined by a city’s population and is calculated as a function of its building area density (D). That is because in smaller cities, which are characterized by a population less than 500,000 capita, the most common building topology is one-story buildings, instead of multistorey as in the case of larger cities. The weight factor is calculated according to the following piecewise function:
The packing factor (PF) is defined as the ratio of the total area covered by the PV arrays, (APV,Net) to the total land area they occupy (APV,Gross). According to the study of Martín-Chivelet [31], the packing factor can be computed based on the following equation:
where (β) is the tilt angle of RTPV, and φ is the city’s latitude. Figure 2 illustrates the geometrical dimensions of the RTPVs space planning, in which (L) denotes the PV module length, (d) the distance between PV arrays, and (γ) the sun azimuth angle. The packing factor is geometrically expressed as the ratio of (L) over (d) [31].
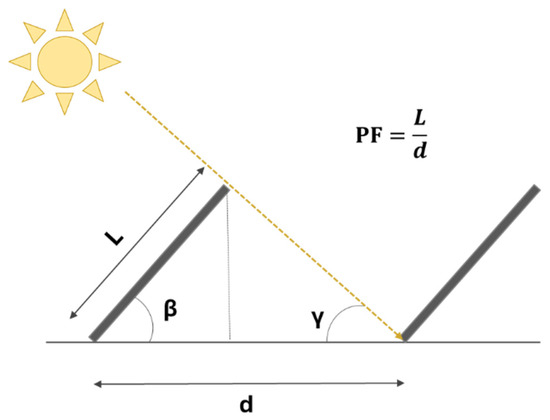
Figure 2.
Visual explanation of packing factor.
For sloped roofs, the packing factor is considered equal to 1.0, because PVs follow the slope of roofs, which is close to the optimum tilt angle. The slope of the roofs is defined mostly according to a location’s latitude, and therefore PV modules are considered to be installed in the best way possible regarding spatial planning, which is translated to a PF equal to 1.0. Northern European countries tend to have more steeply sloped roofs compared to those in southern Europe because of the snowfall. This architectural feature predominantly stems from the climate differences between the two regions. For this reason, it is assumed that for latitudes below 42° (φ < 42°), for the calculation of the packing factor is estimated that RTPVs are installed with the optimum tilt angle on flat roofs. Conversely, for latitudes above or equal to 42° (φ ≥ 42°), the packing factor is estimated as the average between sloped and flat roofs. According to these, Figure 3a,b are plotted, depicting the packing factor in terms of the latitude angle, namely for latitude, φ < 42°, and φ ≥ 42°, respectively. Specifically, for φ < 42° and according to Figure 3a the R-squared is found equal to 0.9715, while for φ ≥ 42° and according to Figure 3b the R-squared is equal to 0.9962, which are both very high coefficients of determination for the two-part linear regression equation of the PF. The calculated PFs for every examined city are summarized in Table A2 in Appendix A.
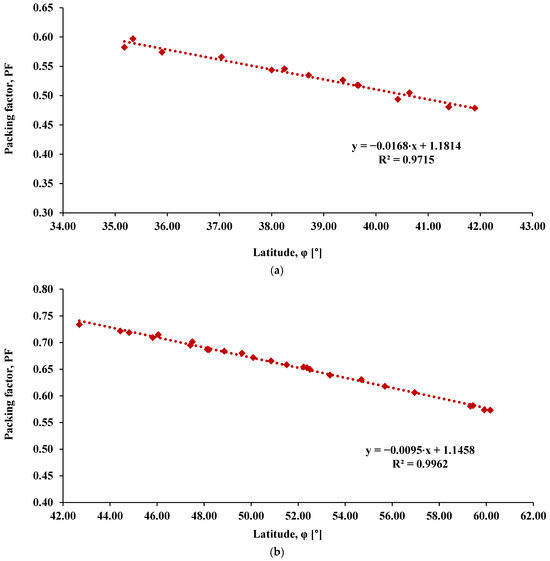
Figure 3.
Packing factor in terms of latitude (a) for latitude (φ < 42°) and (b) for latitude (φ ≥ 42°).
Based on the following plots, (PF) can be estimated as a function of latitude according to the following equations:
The efficiency of the photovoltaic panels, ηPV, including inverter losses, is considered equal to 25% [32], a consideration that takes into account the technological advancement in the field of photovoltaics. The annual on-plane irradiation for every city, (GT) in [kWh/m2], is retrieved from the PVGIS tool [25] for the optimum tilt angle. These values are summarized in Table A2 in Appendix A.
The performance ratio measures the final yield of a photovoltaic (PV) system against its reference yield, comparing the actual energy generated to the energy that would be produced under optimal conditions—specifically, under the same solar irradiation but without any losses [33]. Typically, losses in PV systems arise from factors such as array temperature, solar spectrum variations, angular reflection, surface dirt accumulation, wiring issues, and inefficiencies or failures of other PV components during operation. The annual average PR is typically around 0.8 [34]. In this study, the PR values for each examined city are retrieved from the PVGIS tool [25] and are summarized in Table A2 in Appendix A.
The net area available for PV installation, (APV,Net) is calculated as an expression of a city’s total area (A), population (P) and latitude (φ), as given below:
The overall energy potential by the rooftop PVs, (PVEP) can be calculated accordingly:
Finally, for the calculation of the avoided greenhouse gas emissions, (GHGemissions) in [kton], due to the electricity production from rooftop PVs the following equation is used:
where CO2-equivalent in [kg/GWh], denotes the electricity conversion factor to GHG emissions retrieved from Ref. [35] for every examined city.
3. Results
This section presents the results retrieved by the presently developed method for multiple European-examined cities. Two validation methodologies are used, highlighting the developed methodology’s satisfactory accuracy. Specifically, the Google Environmental Insights Explorer tool and graphical validation using geospatial data confirm the validity and credibility of the present work.
3.1. PV Energy Potential Results
This subsection presents the necessary calculations for the calculation of a city’s PV energy potential and actual PV available space. Firstly, Figure 4 illustrates the calculated total actual PV-occupied area in terms of a city’s population. The almost linear correlation between APV,Net and population shows that a city’s total actual PV-occupied area is directly linked to its population. More specifically, the greater the population, the larger the total actual PV-occupied area of a city. According to the present model, London is characterized as the city with the greatest RTPV potential, with a total actual PV-occupied area of 31.86 km2 and a population of 5.527 million. Moreover, Figure 5 depicts the total actual PV-occupied area per capita in terms of the city’s population density (ρ). It is noticed that the total actual PV-occupied area per capita is sharply increasing from very low to normal population densities, while it remains steadily high for very high densities or sparsely populated cities until it decreases again for the maximum population densities. This phenomenon can be explained by how population density relates to building types and available rooftop space. In densely populated cities, most people live in multi-story buildings, which provide limited rooftop area suitable for installing PV systems. In contrast, less densely populated cities usually have smaller buildings that house fewer people but offer more rooftop space for PV installations. In our study, Ljubljana, Slovenia, is characterized by the highest total actual PV-occupied area per capita equal to 22.62 m2/capita, and a population density of 554.3 m2/capita.
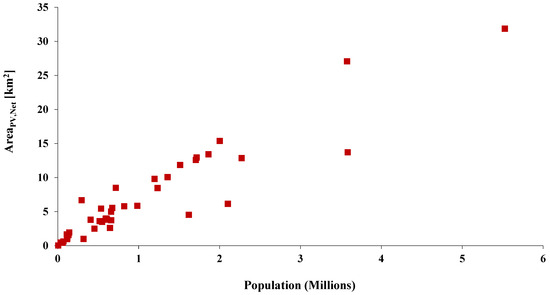
Figure 4.
Total actual PV occupied area in terms of the city’s population.
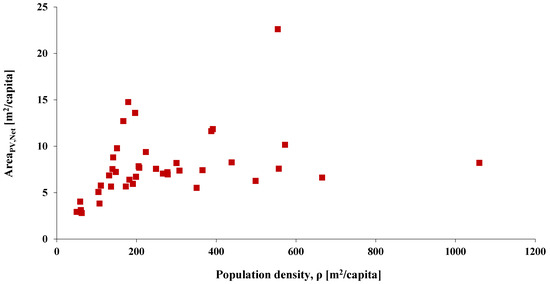
Figure 5.
Total actual PV occupied area per capita in terms of the city’s population density.
Following that, Figure 6 illustrates the photovoltaic energy potential in terms of a city’s population. As in the case of calculating the total actual PV-occupied area, PVEP is strongly, almost linearly linked to a city’s population. The highest PVEP is calculated to be 8200 GWh for the city of London. Additionally, Figure 7 depicts the rooftop PV energy potential in terms of a city’s total PV installed area. According to this figure, the city of London and Berlin present the high PVEP and greatest total PV installation area, which is calculated at 31.86 m2 and 27.08 m2, respectively.
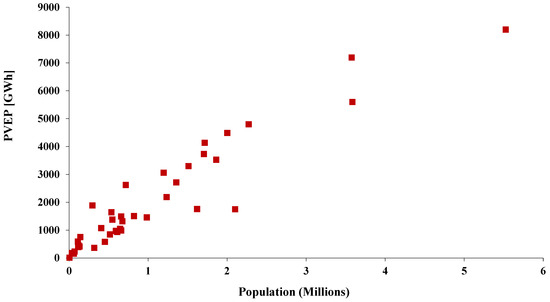
Figure 6.
Rooftop PV energy potential in terms of the city’s population.
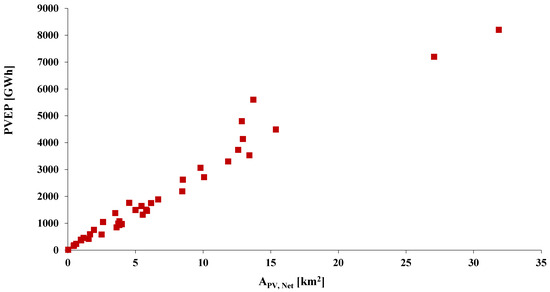
Figure 7.
Rooftop PV energy potential in terms of the city’s total PV installed area.
In Figure 8 the PV energy potential per capita is given for all examined cities in descending order. More specifically, according to the calculations based on the newly developed PVEP method, the highest PVEP is calculated for the city of Ljubljana, Slovenia, at 6389.6 kWh/capita, while the lowest is calculated for the city of Paris, France, at 832.6 kWh/capita.
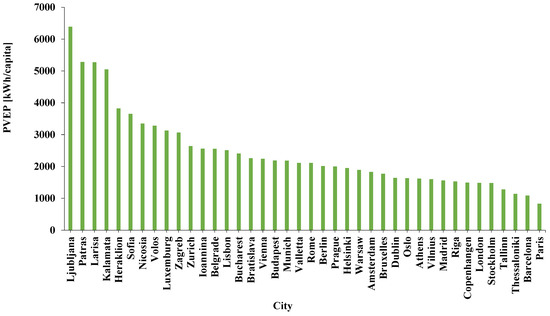
Figure 8.
Rooftop PV energy potential per capita for every examined city.
Given the fact that the calculated APV,Net is the maximum possible PV-covered area of a city, the following calculated PV-coverage corresponds to a city’s maximum possible PV-covered electricity demand. Based on the estimated energy production of RTPV and the total annual electricity consumption per city, retrieved from the EU energy statistics [36], the maximum possible PV-covered electricity demand for every examined city has been calculated and illustrated in Figure 9. Particularly, Patras, Greece, presents the highest possible PV coverage percentage, equal to 117.4%, while Oslo presents the lowest, equal to 7.27%. The highest PV electricity potential is presented for the southern European cities, while the top three PVEPs are calculated for three Greek cities. More information and the calculations for all examined cities are presented in Table A4 in Appendix B.
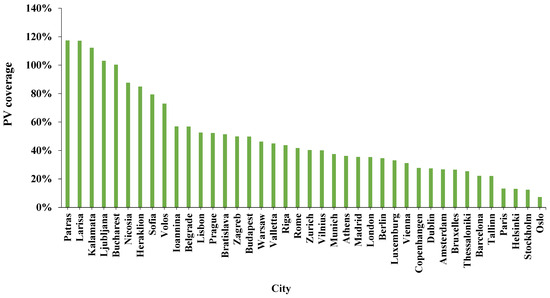
Figure 9.
Maximum electricity demand PV coverage per city.
3.2. Verification of the Followed Methodology
The present developed methodology is validated through the collection of the available geospatial data retrieved from the Google Environmental Insights Explorer tool [37] which uses GIS data. Specifically, Figure 10 and Table 1 summarize the photovoltaic energy potential calculated by the newly developed methodology, the PVEP retrieved from the online tool, and the calculated deviation between them. This data concerns 21 of the investigated cities. The maximum deviation is found for the cities of Ioannina and Stockholm at 19.0% and the lowest, practically zero deviation for the city of Barcelona. The mean absolute deviation is calculated at 9.72%. This result validates that the developed methodology provides satisfactorily accurate calculations, provided that this is a generic model suitable to be applied to any European city. Additionally, in Appendix C, a comparison is performed between the developed methodology and geospatial data processed in CAD. The geospatial analysis conducted for the four cities of Athens, Barcelona, Munich and Stockholm confirms the high accuracy of the methodology in calculating the available rooftop area suitable for PV installation.
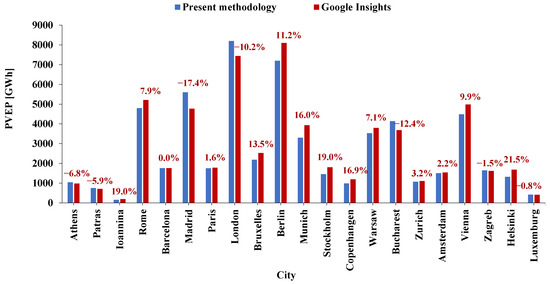
Figure 10.
Deviation in PVEP between the present methodology and Google Insights.

Table 1.
Comparison of PV energy potential calculations of the present methodology and the Google Insights tool.
3.3. Avoided Greenhouse Gas Emissions
The installation of rooftop PV systems will lead to the mitigation of greenhouse gas (GHG) emissions. If the available city area to be equipped is considered to be the maximum one, APV,Net, the maximum possible GHG emissions are calculated. Specifically, Figure 11 illustrates the maximum avoided GHG emissions due to the maximum PV installation capacity per city. The maximum value of avoided GHG emissions is calculated for the city of London, United Kingdom, and is equal to 8109.8 kton per year, while the minimum value of avoided GHG is calculated at 1.2 kton for the city of Valletta, Malta. For the calculation of these values, the necessary electricity to CO2-equivalent conversion factors, according to the life-cycle approach, are retrieved from Ref. [35]. This information and the respective calculations for all the examined cities are also given in Table A5 in Appendix B.
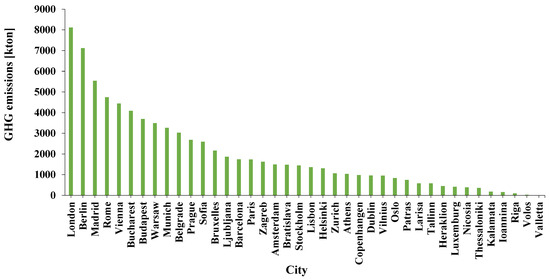
Figure 11.
Maximum avoided GHG emissions per city.
3.4. Expansion of the Methodology in Extra European Cities
At this point, the presently developed PVEP method is applied to numerous European cities spread around the continent. Specifically, Table 2 summarizes the calculations regarding the total actual PV occupied area and PV energy potential for 86 additional cities located in the European continent, corresponding to 33 countries. These findings are important for the electricity production potential mapping in Europe from renewables, and the identification of decarbonization capability in the European area.

Table 2.
Total actual PV occupied area and PV energy potential.
3.5. Discussion on Methodological Sensitivity
The methodology developed in this work relies heavily on the availability and quality of input data. The key datasets required for city-scale assessments of rooftop PV potential and energy autonomy include population statistics, geographical information, and detailed descriptions of the built environment. However, a city’s built environment is constantly evolving, altering its architecture solar accessibility and therefore it is essential that the methodology be regularly updated. This is particularly evident across Europe, where urban environments are continuously undergoing transformation pursuing climate-resilient [38] and adopting the New European Bauhaus policy [39] to promote green transition and attractive urban spaces. To ensure reliable estimations of a city’s photovoltaic energy potential, it is of primary essence to regularly update inputs such as the utilization factor, which depends on population dynamics and stems from available literature data on the built environment. Furthermore, the escalating trend towards deep building renovation and transition to zero energy buildings is predicted to significantly change urban landscapes in the following years, creating expanded opportunities for renewable energy integration to enhance energy autonomy and support decarbonization.
Additionally, the aging demographic profile of Europe needs to be considered when estimating the availability of rooftop areas. In general, older populations tend to occupy smaller apartments or buildings compared to younger households with families, who typically require larger living spaces. Given that Europe is experiencing a declining birth rate and, consequently, a gradual decrease in urban populations, it is essential to regularly update parameters such as the weight factors applied to the correction factor (Daverage − D) to ensure more accurate estimations of the rooftop area available for PV installations. In the present study, the latest population statistics, geographical information and literature-based data on built environment are considered, providing a reliable methodology for city-scale assessments of the available rooftop area for PV installations in Europe.
4. Conclusions
To summarize, this study provides a comprehensive analysis of the feasibility of rooftop photovoltaic systems to cover the electricity demand of multiple major European cities. For this reason, a newly developed methodology is presented that can lead to universally reasonable estimations regarding a city’s net available space for PV installation and its annual PV energy potential. Using basic inputs that concern a city’s total area, population, and latitude, this methodology is applied to multiple European cities, leading to useful numerical results. More specifically, analytical calculations are provided for 40 European countries, according to which the PV energy potential ranges between 12.3 GWh and 8200 GWh for corresponding net available PV spaces that range between 0.03 km2 and 31.86 km2. The minimum calculated values concern the city of Valletta, Malta, and the maximum values are the city of London, United Kingdom. Regarding the PV energy potential per capita, Ljubljana, Slovenia, is characterized by the highest value, equal to 6.39 MWh/capita, while Paris, France, has the minimum, equal to 0.83 MWh/capita.
Calculations that concern a city’s electricity demand coverage by rooftop PV-installed systems are executed. Among the 40 analytically examined cities, Patras, Greece, showcases the highest PV coverage potential, equal to 117.4%, and Oslo, Norway, the lowest, equal to 7.27%. Electricity production from renewable energy sources contributes to decarbonizing a city’s energy mix. According to the present analysis results, 8109.8 kton of greenhouse gas emissions are avoided in the case of London, United Kingdom, which has the highest calculated value. In contrast, only 1.22 ktons of CO2-equivalent emissions are avoided for Valletta, Malta, the lowest calculated value. Finally, except for the 40 major European cities, the final results of 86 additional cities located on the European continent are given. Lastly, the model is validated with data retrieved from the environmental Google insights tool, and an average deviation of 9.10% is found. Future research should focus on combining rooftop photovoltaic systems with various energy storage systems or innovative cooling techniques to enhance RTPV electrical performance. This research field will contribute to transforming cities into climate-neutral and energy-autonomous cities.
Author Contributions
Conceptualization, G.M.; methodology, G.M. and A.T.; software, G.M. and V.K.; investigation, G.M. and V.K.; writing—original draft preparation, G.M., V.K. and A.T.; writing—review and editing, G.M., V.K. and A.T.; supervision, A.T. All authors have read and agreed to the published version of the manuscript.
Funding
This research project is implemented in the framework of H.F.R.I call “Basic research Financing (Horizontal support of all Sciences)” under the National Recovery and Resilience Plan “Greece 2.0” funded by the European Union—NextGenerationEU (H.F.R.I. project number: 14812, BIPV-City).
Data Availability Statement
Data available after request.
Conflicts of Interest
The authors declare no conflict of interest.
Abbreviations
| Nomenclature | |
| A | City’s total area, km2 |
| a | Constant for Acity calculation |
| Acapita | City’s available surface area per capita, m2/capita |
| Acity | City’s available surface area, km2 |
| APV,Gross | Gross suitable area for PV installation |
| APV,Net | Net suitable area for PV installation |
| AS | City’s actual PV-suitable available surface, km2 |
| c | Constant for Acity calculation |
| d | Distance between PV arrays, m |
| GHG | Greenhouse Gas |
| GT | Incident solar irradiation, W/m2 |
| L | PV module length, m |
| P | Population, - |
| PVEP | Photovoltaic Energy Potential, GWh |
| Ut | Utilization factor, % |
| Greek Symbols | |
| β | PV tilt angle, ° |
| γ | Sun azimuth angle, ° |
| ηPV | Reference PV electrical efficiency, - |
| ρ | Population density, m2/capita |
| φ | Latitude angle, ° |
| Superscripts and Subscripts | |
| Gross | Total, overall value |
| Net | Values after deduction |
| Abbreviations | |
| EU | European Union |
| GIS | Geographic Information Systems |
| PF | Packing factor |
| PR | Performance Ratio |
| PV | Photovoltaic system |
| RTPV | Rooftop Photovoltaic system |
Appendix A. Information on Examined Cities
In this appendix, basic information about all examined cities is given. Specifically, Table A1 summarizes information that concerns each examined city’s actual total area, A, and population, P, retrieved from Ref. [26], as well as a city’s population density, ρ. In Table A2 the latitude (φ), the yearly on-plane solar irradiation (GT), the optimum RTPV tilt angle (β), the calculated packing factor (PF), and the PV performance ratio (PR) are given for every examined city.

Table A1.
Population, area, and population density of each examined city.
Table A1.
Population, area, and population density of each examined city.
| City | Population | Area, A [km2] | Density, ρ [m2/capita] | Building Area Density, D [m2/capita] |
|---|---|---|---|---|
| Athens | 646,391 | 38.0 | 59 | 51 |
| Thessaloniki | 319,045 | 19.3 | 61 | 42 |
| Patras | 142,389 | 28.0 | 197 | 84 |
| Heraklion | 119,055 | 18.0 | 151 | 70 |
| Larisa | 111,494 | 20.0 | 179 | 87 |
| Volos | 70,671 | 10.0 | 142 | 71 |
| Kalamata | 35,912 | 6.0 | 167 | 81 |
| Ioannina | 60,763 | 9.0 | 148 | 63 |
| Nicosia | 116,392 | 51.1 | 439 | 59 |
| Rome | 2,273,412 | 394.0 | 173 | 60 |
| Barcelona | 1,620,343 | 101.4 | 63 | 29 |
| Madrid | 3,585,311 | 385.0 | 107 | 25 |
| Paris | 2,102,650 | 105.4 | 50 | 27 |
| London | 5,526,629 | 612.0 | 111 | 38 |
| Bruxelles | 1,235,192 | 162.4 | 131 | 49 |
| Berlin | 3,576,873 | 891.3 | 249 | 52 |
| Munich | 1,512,491 | 310.7 | 205 | 51 |
| Stockholm | 984,748 | 188.0 | 191 | 41 |
| Copenhangen | 660,842 | 90.0 | 136 | 36 |
| Warsaw | 1,863,056 | 517.2 | 278 | 45 |
| Budapest | 1,706,851 | 525.2 | 308 | 40 |
| Belgrade | 1,197,714 | 359.9 | 300 | 47 |
| Bucharest | 1,716,961 | 240.0 | 140 | 48 |
| Zurich | 406,822 | 91.0 | 224 | 58 |
| Lisbon | 548,703 | 100.1 | 182 | 61 |
| Amsterdam | 821,878 | 219.0 | 266 | 44 |
| Vienna | 2,002,821 | 414.8 | 207 | 49 |
| Prague | 1,357,326 | 496.2 | 366 | 44 |
| Sofia | 717,897 | 281.0 | 391 | 83 |
| Zagreb | 536,252 | 307.0 | 572 | 76 |
| Tallinn | 453,864 | 159.2 | 351 | 37 |
| Helsinki | 674,963 | 715.5 | 1060 | 56 |
| Dublin | 592,713 | 117.8 | 199 | 43 |
| Vilnius | 602,430 | 401.0 | 666 | 40 |
| Riga | 609,489 | 304.0 | 499 | 36 |
| Luxemburg | 132,778 | 51.5 | 388 | 70 |
| Valletta | 5826 | 0.6 | 105 | 43 |
| Ljubljana | 295,504 | 163.8 | 554 | 127 |
| Bratislava | 660,000 | 367.6 | 557 | 44 |
| Oslo | 517,497 | 144.0 | 278 | 55 |

Table A2.
Latitude, yearly on-plane solar irradiation, optimum RTPV tilt angle, packing factor, performance ratio and weight factor.
Table A2.
Latitude, yearly on-plane solar irradiation, optimum RTPV tilt angle, packing factor, performance ratio and weight factor.
| City | Latitude, φ [°] | GT [kWh/m2] | Tilt Angle, β [°] | PF | PR | Weight Factor, W |
|---|---|---|---|---|---|---|
| Athens | 38.0 | 2081 | 33.0 | 0.54 | 0.77 | 0.105 |
| Thessaloniki | 40.6 | 1898 | 34.0 | 0.51 | 0.77 | 0.202 |
| Patras | 38.3 | 2010 | 32.0 | 0.55 | 0.77 | 0.389 |
| Heraklion | 35.3 | 2063 | 29.0 | 0.60 | 0.76 | 0.256 |
| Larisa | 39.6 | 1911 | 34.0 | 0.52 | 0.75 | 0.427 |
| Volos | 39.4 | 1912 | 33.0 | 0.53 | 0.78 | 0.263 |
| Kalamata | 37.0 | 2034 | 31.0 | 0.57 | 0.78 | 0.354 |
| Ioannina | 39.7 | 1828 | 34.0 | 0.52 | 0.78 | 0.219 |
| Nicosia | 35.2 | 2168 | 32.0 | 0.58 | 0.75 | 0.206 |
| Rome | 41.9 | 1918 | 36.0 | 0.48 | 0.78 | 0.089 |
| Barcelona | 41.4 | 1976 | 37.0 | 0.48 | 0.78 | 0.088 |
| Madrid | 40.4 | 2102 | 37.0 | 0.49 | 0.78 | 0.089 |
| Paris | 48.9 | 1423 | 38.0 | 0.68 | 0.80 | 0.088 |
| London | 51.5 | 1270 | 40.0 | 0.66 | 0.81 | 0.098 |
| Brussels | 50.9 | 1286 | 39.0 | 0.67 | 0.80 | 0.110 |
| Berlin | 52.5 | 1326 | 40.0 | 0.65 | 0.80 | 0.102 |
| Munich | 48.1 | 1407 | 39.0 | 0.69 | 0.79 | 0.105 |
| Stockholm | 59.3 | 1229 | 44.0 | 0.58 | 0.81 | 0.105 |
| Copenhangen | 55.7 | 1298 | 42.0 | 0.62 | 0.81 | 0.094 |
| Warsaw | 52.2 | 1313 | 39.0 | 0.65 | 0.80 | 0.117 |
| Belgrade | 44.8 | 1606 | 36.0 | 0.70 | 0.79 | 0.102 |
| Bucharest | 44.4 | 1639 | 36.0 | 0.72 | 0.78 | 0.117 |
| Budapest | 47.5 | 1506 | 35.0 | 0.72 | 0.78 | 0.113 |
| Zurich | 47.4 | 1448 | 38.0 | 0.70 | 0.78 | 0.204 |
| Lisbon | 38.7 | 2014 | 33.0 | 0.53 | 0.78 | 0.089 |
| Amsterdam | 52.4 | 1279 | 39.0 | 0.65 | 0.81 | 0.113 |
| Vienna | 48.2 | 1477 | 39.0 | 0.69 | 0.79 | 0.110 |
| Prague | 50.1 | 1361 | 39.0 | 0.67 | 0.79 | 0.113 |
| Sofia | 42.7 | 1563 | 36.0 | 0.73 | 0.79 | 0.124 |
| Zagreb | 45.8 | 1554 | 37.0 | 0.71 | 0.78 | 0.102 |
| Tallinn | 59.4 | 1166 | 42.0 | 0.58 | 0.80 | 0.200 |
| Helsinki | 60.2 | 1188 | 43.0 | 0.57 | 0.80 | 0.094 |
| Dublin | 53.3 | 1193 | 42.0 | 0.64 | 0.82 | 0.110 |
| Vilnius | 54.7 | 1197 | 40.0 | 0.63 | 0.81 | 0.102 |
| Riga | 57.0 | 1210 | 42.0 | 0.61 | 0.81 | 0.094 |
| Luxemburg | 49.6 | 1340 | 37.0 | 0.68 | 0.80 | 0.256 |
| Valletta | 35.9 | 2098 | 32.0 | 0.57 | 0.79 | 0.203 |
| Ljubljana | 46.1 | 1441 | 34.0 | 0.72 | 0.78 | 1.287 |
| Bratislava | 48.2 | 1509 | 39.0 | 0.69 | 0.79 | 0.113 |
| Oslo | 59.9 | 1168 | 45.0 | 0.57 | 0.80 | 0.096 |
Appendix B. Results
In this appendix, detailed results are given for all examined cities. Specifically, Table A3 gives the actual suitable PV available surface area, AS, total area occupied by PV installations (APV,Gross) and total area covered by the PV arrays (APV,Net) for each city. Moreover, Table A4 summarizes the energy potential of RTPV, PVEP, and annual average electricity demand per capita per city, retrieved from EU statistics [36], as well as the PV coverage per examined city. Finally, Table A5 gives the calculated GHG avoided emissions and electricity to the CO2-equivalent conversion factor [35] per city.

Table A3.
Actual suitable PV available surface area, total area occupied by PV installations, and total area covered by the PV arrays for each city.
Table A3.
Actual suitable PV available surface area, total area occupied by PV installations, and total area covered by the PV arrays for each city.
| City | AS [km2] | APV,Gross [km2] | APV,Net [km2] |
|---|---|---|---|
| Athens | 4.802 | 3.579 | 2.608 |
| Thessaloniki | 1.991 | 1.728 | 0.993 |
| Patras | 3.591 | 1.196 | 1.935 |
| Heraklion | 1.983 | 0.946 | 1.165 |
| Larisa | 3.193 | 0.920 | 1.646 |
| Volos | 1.195 | 0.560 | 0.622 |
| Kalamata | 0.817 | 0.293 | 0.457 |
| Ioannina | 0.853 | 0.483 | 0.439 |
| Nicosia | 1.629 | 1.488 | 0.962 |
| Rome | 26.940 | 25.646 | 12.867 |
| Barcelona | 9.346 | 7.963 | 4.542 |
| Madrid | 27.299 | 25.120 | 13.715 |
| Paris | 9.030 | 7.702 | 6.156 |
| London | 48.533 | 41.316 | 31.861 |
| Brussels | 12.771 | 10.937 | 8.464 |
| Berlin | 41.848 | 36.446 | 27.078 |
| Munich | 17.224 | 14.898 | 11.859 |
| Stockholm | 10.058 | 8.562 | 5.856 |
| Copenhangen | 6.061 | 5.159 | 3.738 |
| Warsaw | 20.665 | 17.595 | 13.424 |
| Budapest | 18.133 | 10.817 | 12.595 |
| Belgrade | 13.627 | 15.137 | 9.813 |
| Bucharest | 17.892 | 16.725 | 12.947 |
| Zurich | 5.486 | 4.913 | 3.815 |
| Lisbon | 6.610 | 6.421 | 3.510 |
| Amsterdam | 8.945 | 8.111 | 5.799 |
| Vienna | 22.364 | 19.128 | 15.383 |
| Prague | 15.037 | 12.802 | 10.074 |
| Sofia | 11.489 | 16.006 | 8.505 |
| Zagreb | 7.668 | 7.912 | 5.449 |
| Tallinn | 4.306 | 3.673 | 2.502 |
| Helsinki | 9.648 | 7.194 | 5.540 |
| Dublin | 6.223 | 5.298 | 3.976 |
| Vilnius | 6.372 | 5.423 | 3.990 |
| Riga | 6.313 | 5.373 | 3.818 |
| Luxemburg | 2.290 | 2.321 | 1.544 |
| Valletta | 0.051 | 0.044 | 0.030 |
| Ljubljana | 9.436 | 2.686 | 6.684 |
| Bratislava | 7.272 | 6.191 | 5.006 |
| Oslo | 6.248 | 5.610 | 3.603 |

Table A4.
Energy potential of rooftop PV and electricity demand PV coverage per city.
Table A4.
Energy potential of rooftop PV and electricity demand PV coverage per city.
| City | Consumption [kWh/capita] | PVEP [GWh] | PV Coverage |
|---|---|---|---|
| Athens | 2896 | 1045.8 | 36.1% |
| Thessaloniki | 1436 | 364.0 | 25.4% |
| Patras | 641 | 752.2 | 117.4% |
| Heraklion | 536 | 454.9 | 84.9% |
| Larisa | 502 | 587.8 | 117.2% |
| Volos | 318 | 231.9 | 72.9% |
| Kalamata | 162 | 181.4 | 112.3% |
| Ioannina | 273 | 155.6 | 56.9% |
| Nicosia | 445 | 390.0 | 87.6% |
| Rome | 11,503 | 4798.2 | 41.7% |
| Barcelona | 7940 | 1759.3 | 22.2% |
| Madrid | 15,794 | 5600.1 | 35.5% |
| Paris | 13,247 | 1750.7 | 13.2% |
| London | 23,212 | 8200.0 | 35.3% |
| Brussels | 8276 | 2188.6 | 26.4% |
| Berlin | 20,853 | 7196.0 | 34.5% |
| Munich | 8818 | 3300.3 | 37.4% |
| Stockholm | 11,817 | 1457.9 | 12.3% |
| Copenhangen | 3569 | 988.4 | 27.7% |
| Warsaw | 7639 | 3528.4 | 46.2% |
| Budapest | 7510 | 3732.7 | 49.7% |
| Belgrade | 5390 | 3062.7 | 56.8% |
| Bucharest | 4121 | 4135.5 | 100.4% |
| Zurich | 2670 | 1074.2 | 40.2% |
| Lisbon | 2623 | 1378.0 | 52.5% |
| Amsterdam | 5647 | 1505.7 | 26.7% |
| Vienna | 14,420 | 4489.0 | 31.1% |
| Prague | 5192 | 2715.9 | 52.3% |
| Sofia | 3302 | 2622.6 | 79.4% |
| Zagreb | 3299 | 1643.5 | 49.8% |
| Tallinn | 2632 | 581.5 | 22.1% |
| Helsinki | 10,124 | 1318.1 | 13.0% |
| Dublin | 3556 | 972.5 | 27.3% |
| Vilnius | 2410 | 965.5 | 40.1% |
| Riga | 2133 | 932.7 | 43.7% |
| Luxemburg | 1258 | 415.4 | 33.0% |
| Valletta | 27 | 12.3 | 44.9% |
| Ljubljana | 1832 | 1888.2 | 103.1% |
| Bratislava | 2904 | 1492.6 | 51.4% |
| Oslo | 11,644 | 846.3 | 7.3% |

Table A5.
GHG avoided emissions and electricity to CO2-equivalent conversion factors per city.
Table A5.
GHG avoided emissions and electricity to CO2-equivalent conversion factors per city.
| City | CO2-eq kg/kWh | GHG Emissions [kton] |
|---|---|---|
| Athens | 0.502 | 524.97 |
| Thessaloniki | 0.502 | 182.74 |
| Patras | 0.502 | 377.62 |
| Heraklion | 0.502 | 228.35 |
| Larisa | 0.502 | 295.09 |
| Volos | 0.502 | 116.39 |
| Kalamata | 0.502 | 91.06 |
| Ioannina | 0.502 | 78.10 |
| Nicosia | 0.833 | 324.85 |
| Rome | 0.383 | 1837.71 |
| Barcelona | 0.236 | 415.21 |
| Madrid | 0.236 | 1321.61 |
| Paris | 0.087 | 152.31 |
| London | 0.315 | 2583.01 |
| Brussels | 0.208 | 455.24 |
| Berlin | 0.438 | 3151.87 |
| Munich | 0.438 | 1445.52 |
| Stockholm | 0.027 | 39.36 |
| Copenhangen | 0.138 | 136.40 |
| Warsaw | 0.877 | 3094.36 |
| Budapest | 0.266 | 992.89 |
| Belgrade | 1.046 | 3203.63 |
| Bucharest | 0.418 | 1728.64 |
| Zurich | 0.039 | 41.89 |
| Lisbon | 0.248 | 341.75 |
| Amsterdam | 0.406 | 611.30 |
| Vienna | 0.281 | 1261.41 |
| Prague | 0.59 | 1602.39 |
| Sofia | 0.54 | 1416.21 |
| Zagreb | 0.416 | 683.71 |
| Tallinn | 0.351 | 204.10 |
| Helsinki | 0.073 | 96.22 |
| Dublin | 0.315 | 306.32 |
| Vilnius | 0.1 | 96.55 |
| Riga | 0.437 | 407.58 |
| Luxemburg | 0.334 | 138.73 |
| Valletta | 0.47 | 5.79 |
| Ljubljana | 0.235 | 443.72 |
| Bratislava | 0.396 | 591.08 |
| Oslo | 0.022 | 18.62 |
Appendix C. Comparison of the Developed Methodology with Geospatial Data
In this appendix, a validation process is presented that compares the available rooftop area for PV installation calculated with the methodology of this study and with geospatial data processed using the AutoCAD 2024 software. More specifically, this comparison concerns the four European cities of Athens, Munich, Stockholm, and Barcelona.
The process involves obtaining the city boundaries from Google Maps and aligning them with data from Google Environmental Insights [37]. After importing the city maps into CAD software at the correct scale, the boundaries are drawn and verified against the corresponding area data. The green spaces and water bodies within the city boundaries are also mapped and subtracted from the total available rooftop are for PV installation. In this appendix, the city of Sweeden will be examined, which is illustrated in Figure A1 retrieved from the Google Maps. The city boundaries are shown in orange, while blue areas represent parks and forests. The city center is outlined in black, and the area surrounding the center is outlined in purple. The suburbs are included within the orange boundary, excluding the purple and black areas.
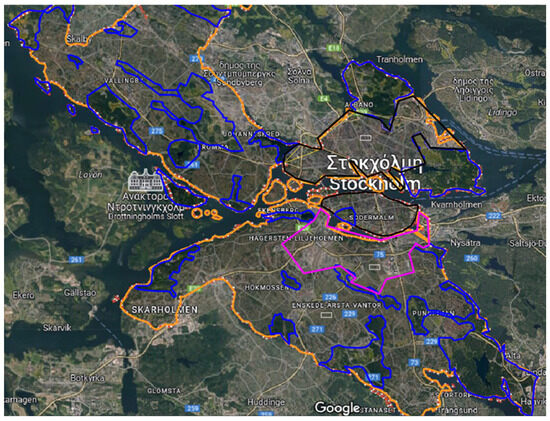
Figure A1.
The city of Stochholm, Swedeen (Data were retrieved from Google Maps).
In the next step, each city is divided into sections based on building characteristics, land use, and urban density, with the division customed to reflect the unique characteristics of each city. In Figure A2, Stockholm’s city center is depicted with the suitable rooftop area for PV installation presented in blue, while the entire rooftop areas are depicted in red. Figure A3 illustrates the area around the city center, while Figure A4 depicts the city’s suburbs. A random polygon is selected within each section, encompassing multiple building blocks, streets, or parks. A detailed graphical analysis is performed within these polygons to identify and measure all available rooftop areas for photovoltaic installation.
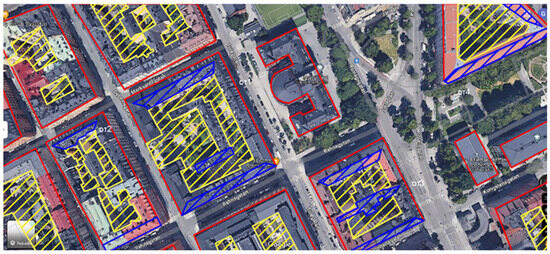
Figure A2.
Stochholm city center and suitable rooftop area for PV installation in blue (Data were retrieved from Google Maps).
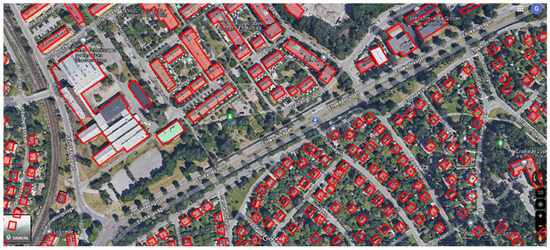
Figure A3.
Stochholm’s area around city (Data were retrieved from Google Maps).
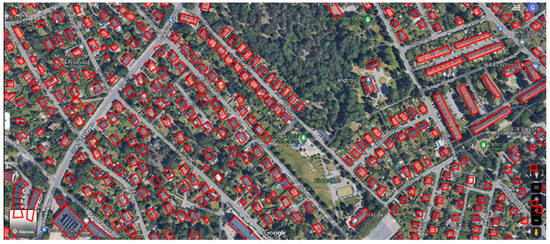
Figure A4.
Stochholm’s suburbs (Data were retrieved from Google Maps).
To refine the measurements, four buildings within each polygon are selected, and the area of their rooftops is assessed. The available surface area for photovoltaics is calculated by considering obstacles, shading, and the functionality of the space after installation. The ratio of available rooftop surface to building surface is then computed, with the average for the four selected buildings used as the representative value.
Finally, by applying this ratio to each representative section of the city, the total available surface area for photovoltaic installation is determined. This area is expressed as a percentage of the total urban area, and the potential energy that can be generated is calculated. The results are compared with the results derives according to the present developed methodology. It is important to mention that the calculated area does not include the PF. For that reason, the city’s actual PV-suitable available surface area of our model is compared with the results. Table A6 gives the comparison for the four examined cities, proving the high accuracy of the developed methodology in calculating a city’s suitable and available surface area. Specifically, the deviation is found to vary from 0.42% to 3.66%.

Table A6.
Available rooftop area for PV installation according to the developed methodology and geospatial data.
Table A6.
Available rooftop area for PV installation according to the developed methodology and geospatial data.
| City | City Total Area (Km2) | Geospatial Data (km2) | Developed Methodology (km2) | Deviation |
|---|---|---|---|---|
| Athens | 38 | 4.82 | 4.80 | 0.42% |
| Munich | 310 | 16.59 | 17.22 | 3.66% |
| Stockholm | 188 | 10.19 | 10.06 | 1.28% |
| Barcelona | 102 | 9.22 | 9.35 | 1.41% |
References
- Kitsopoulou, A.; Bellos, E.; Lykas, P.; Sammoutos, C.; Vrachopoulos, M.G.; Tzivanidis, C. A Systematic Analysis of Phase Change Material and Optically Advanced Roof Coatings Integration for Athenian Climatic Conditions. Energies 2023, 16, 7521. [Google Scholar] [CrossRef]
- Kitsopoulou, A.; Bellos, E.; Tzivanidis, C. An Up-to-Date Review of Passive Building Envelope Technologies for Sustainable Design. Energies 2024, 17, 4039. [Google Scholar] [CrossRef]
- Bellos, E. Progress in Beam-down Solar Concentrating Systems. Prog. Energy Combust. Sci. 2023, 97, 101085. [Google Scholar] [CrossRef]
- Share of Electricity Production from Renewables. Available online: https://ourworldindata.org/grapher/share-electricity-renewables (accessed on 29 March 2024).
- The European Green Deal—European Commission. Available online: https://commission.europa.eu/strategy-and-policy/priorities-2019-2024/european-green-deal_en (accessed on 14 October 2024).
- D’Agostino, D.; Parker, D.; Melià, P.; Dotelli, G. Optimizing Photovoltaic Electric Generation and Roof Insulation in Existing Residential Buildings. Energy Build. 2022, 255, 111652. [Google Scholar] [CrossRef]
- Ziozas, N.; Kitsopoulou, A.; Bellos, E.; Iliadis, P.; Gonidaki, D.; Angelakoglou, K.; Nikolopoulos, N.; Ricciuti, S.; Viesi, D. Energy Performance Analysis of the Renovation Process in an Italian Cultural Heritage Building. Sustainability 2024, 16, 2784. [Google Scholar] [CrossRef]
- Kitsopoulou, A.; Pallantzas, D.; Bellos, E.; Tzivanidis, C. Mapping the Potential of Zero-Energy Building in Greece Using Roof Photovoltaics. Designs 2024, 8, 68. [Google Scholar] [CrossRef]
- Kapsalis, V.; Maduta, C.; Skandalos, N.; Bhuvad, S.S.; D’Agostino, D.; Yang, R.J.; Udayraj; Parker, D.; Karamanis, D. Bottom-up Energy Transition through Rooftop PV Upscaling: Remaining Issues and Emerging Upgrades towards NZEBs at Different Climatic Conditions. Renew. Sustain. Energy Transit. 2024, 5, 100083. [Google Scholar] [CrossRef]
- Molnár, G.; Cabeza, L.F.; Chatterjee, S.; Ürge-Vorsatz, D. Modelling the Building-Related Photovoltaic Power Production Potential in the Light of the EU’s Solar Rooftop Initiative. Appl. Energy 2024, 360, 122708. [Google Scholar] [CrossRef]
- McKenna, R.; Mulalic, I.; Soutar, I.; Weinand, J.M.; Price, J.; Petrović, S.; Mainzer, K. Exploring Trade-Offs between Landscape Impact, Land Use and Resource Quality for Onshore Variable Renewable Energy: An Application to Great Britain. Energy 2022, 250, 123754. [Google Scholar] [CrossRef]
- Rodríguez-Gómez, F.; del Campo-Ávila, J.; Ferrer-Cuesta, M.; Mora-López, L. Data Driven Tools to Assess the Location of Photovoltaic Facilities in Urban Areas. Expert Syst. Appl. 2022, 203, 117349. [Google Scholar] [CrossRef]
- Gernaat, D.E.H.J.; de Boer, H.-S.; Dammeier, L.C.; van Vuuren, D.P. The Role of Residential Rooftop Photovoltaic in Long-Term Energy and Climate Scenarios. Appl. Energy 2020, 279, 115705. [Google Scholar] [CrossRef]
- IMAGE—Integrated Model to Assess the Global Environment|PBL Netherlands Environmental Assessment Agency. Available online: https://www.pbl.nl/en/image/home (accessed on 14 October 2024).
- Castellanos, S.; Sunter, D.A.; Kammen, D.M. Rooftop Solar Photovoltaic Potential in Cities: How Scalable Are Assessment Approaches? Environ. Res. Lett. 2017, 12, 125005. [Google Scholar] [CrossRef]
- Mainzer, K.; Fath, K.; McKenna, R.; Stengel, J.; Fichtner, W.; Schultmann, F. A High-Resolution Determination of the Technical Potential for Residential-Roof-Mounted Photovoltaic Systems in Germany. Sol. Energy 2014, 105, 715–731. [Google Scholar] [CrossRef]
- Defaix, P.R.; van Sark, W.G.J.H.M.; Worrell, E.; de Visser, E. Technical Potential for Photovoltaics on Buildings in the EU-27. Sol. Energy 2012, 86, 2644–2653. [Google Scholar] [CrossRef]
- Bódis, K.; Kougias, I.; Jäger-Waldau, A.; Taylor, N.; Szabó, S. A High-Resolution Geospatial Assessment of the Rooftop Solar Photovoltaic Potential in the European Union. Renew. Sustain. Energy Rev. 2019, 114, 109309. [Google Scholar] [CrossRef]
- Romero Rodríguez, L.; Duminil, E.; Sánchez Ramos, J.; Eicker, U. Assessment of the Photovoltaic Potential at Urban Level Based on 3D City Models: A Case Study and New Methodological Approach. Sol. Energy 2017, 146, 264–275. [Google Scholar] [CrossRef]
- Izquierdo, S.; Montañés, C.; Dopazo, C.; Fueyo, N. Roof-Top Solar Energy Potential under Performance-Based Building Energy Codes: The Case of Spain. Sol. Energy 2011, 85, 208–213. [Google Scholar] [CrossRef]
- Yang, Y.; Campana, P.E.; Stridh, B.; Yan, J. Potential Analysis of Roof-Mounted Solar Photovoltaics in Sweden. Appl. Energy 2020, 279, 115786. [Google Scholar] [CrossRef]
- Assouline, D.; Mohajeri, N.; Scartezzini, J.-L. Large-Scale Rooftop Solar Photovoltaic Technical Potential Estimation Using Random Forests. Appl. Energy 2018, 217, 189–211. [Google Scholar] [CrossRef]
- Phillips, C.; Elmore, R.; Melius, J.; Gagnon, P.; Margolis, R. A Data Mining Approach to Estimating Rooftop Photovoltaic Potential in the US. J. Appl. Stat. 2019, 46, 385–394. [Google Scholar] [CrossRef]
- Gassar, A.A.A.; Cha, S.H. Review of Geographic Information Systems-Based Rooftop Solar Photovoltaic Potential Estimation Approaches at Urban Scales. Appl. Energy 2021, 291, 116817. [Google Scholar] [CrossRef]
- JRC Photovoltaic Geographical Information System (PVGIS)—European Commission. Available online: https://re.jrc.ec.europa.eu/pvg_tools/en/#api_5.1 (accessed on 17 July 2025).
- Eurostat: Demography in Europe. 2024. Available online: https://ec.europa.eu/eurostat/cache/interactive-publications/demography/2024/00/index.html (accessed on 8 October 2024).
- European Commission. European Cities: Territorial Analysis of Characteristics and Trends; JRC Technical Reports; European Commission: Brussels, Belgium, 2015. [Google Scholar]
- Average Floor Area per Capita. Available online: https://entranze.enerdata.net/ (accessed on 22 February 2025).
- Ong, S.K.; Zhu, J. A Novel Maintenance System for Equipment Serviceability Improvement. CIRP Ann. 2013, 62, 39–42. [Google Scholar] [CrossRef]
- Gutschner, M.; Nowak, S.; Ruoss, D.; Toggweiler, P.; Schoen, T. Potential for Building Integrated Photovoltaics; Report IEA—PVPS T7-4; International Energy Agency: Paris, France, 2002. [Google Scholar]
- Martín-Chivelet, N. Photovoltaic Potential and Land-Use Estimation Methodology. Energy 2016, 94, 233–242. [Google Scholar] [CrossRef]
- Kostylyov, V.P.; Sachenko, A.V.; Evstigneev, M.; Sokolovskyi, I.O.; Shkrebtii, A.I. Characterization and Optimization of High-Efficiency Crystalline Silicon Solar Cells: Impact of Recombination in the Space Charge Region and Trap-Assisted Auger Exciton Recombination. J. Appl. Phys. 2025, 137, 023101. [Google Scholar] [CrossRef]
- IEC 61724:1998; Photovoltaic System Performance Monitoring Guidelines for Measurement, Data Exchange and Analysis. International Electrotechnical Commission: Geneva, Switzerland, 1998.
- Nordmann, T.; Clavadetscher, L.; van Sark, W.G.J.H.M.; Green, M. Analysis of Long-Term Performance of PV Systems Different Data Resolution for Different Purposes; International Energy Agency: Paris, France, 2014. [Google Scholar]
- Bastos, J.; Monforti-Ferrario, F.; Melica, G. GHG Emission Factors for Electricity Consumption; European Commission: Brussels, Belgium, 2024. [Google Scholar]
- Electricity and Heat Statistics. Available online: https://ec.europa.eu/eurostat/statistics-explained/index.php?title=Electricity_and_heat_statistics (accessed on 11 October 2024).
- Google Environmental Insights Explorer—Make Informed Decisions. Available online: https://insights.sustainability.google/ (accessed on 15 October 2024).
- SuPeRBE. Climate-Resilient Buildings: Adapting Architecture to Climate Change; Interreg Central Europe: Vienna, Austria, 2024. [Google Scholar]
- NEB—Built4People. European Partnership under Horizon Europe. Available online: https://built4people.eu (accessed on 9 October 2025).
Disclaimer/Publisher’s Note: The statements, opinions and data contained in all publications are solely those of the individual author(s) and contributor(s) and not of MDPI and/or the editor(s). MDPI and/or the editor(s) disclaim responsibility for any injury to people or property resulting from any ideas, methods, instructions or products referred to in the content. |
© 2025 by the authors. Licensee MDPI, Basel, Switzerland. This article is an open access article distributed under the terms and conditions of the Creative Commons Attribution (CC BY) license (https://creativecommons.org/licenses/by/4.0/).