Abstract
This study investigates the microenvironment under face masks and respirators, focusing on the influence of material and design characteristics on carbon dioxide (CO2) concentration, temperature, and relative humidity. Masks and respirators were selected from the three main types of personal protective equipment—textile non-medical masks, surgical masks and respirators. Experimental measurements were conducted to assess how geometric parameters (thickness, bulk density), mass (mass per unit area), and structural parameters (air permeability, face cover area) influence the microclimatic conditions during wear. The results show that thickness, mass per unit area, and bulk density have a significant effect on temperature but negligible influence on CO2 concentration and humidity. In contrast, air permeability and face cover area play a key role in CO2 and moisture accumulation: higher permeability significantly reduces both, while larger coverage tends to increase them. These findings support the need for an integrated design approach that balances filtration efficiency with respiratory and thermophysiological comfort, contributing to improved protective performance and user acceptance.
1. Introduction
Face masks and respirators are among the most frequently used personal protective equipment (PPE) in modern medical practice and daily life. During the COVID-19 pandemic, caused by the SARS-CoV-2 coronavirus, the use of such protective equipment became widespread globally, both among healthcare professionals and within the general population [1].
Masks and respirators provide a physical barrier against the transmission of pathogens spread through airborne droplets [2]. In addition to their filtration function, masks also influence the microenvironment in the area around the nose and mouth [3]. They reduce heat exchange with the external environment, thereby protecting the mucous membranes of the upper respiratory tract from cooling [2].
To assess the protective capabilities of different face masks and respirators against viruses, it is essential to consider both the types of virus-carrying particles and the mechanisms of their transmission. The size of virus-laden aerosols varies widely: from less than 60 μm in the case of ultra-fine particles to over 665 μm for coarse particles [4]. Particular attention is given to particles smaller than 1 μm, as they are often associated with higher infectivity and increased spread in enclosed spaces [5].
The effectiveness of face PPE depends on a combination of factors, including the fit to the face, the filtration properties of the material used (composition, thickness, structure, and number of layers), as well as environmental conditions such as humidity and temperature [6].
Studies have shown that cloth masks have a filtration efficiency below 40%; standard surgical masks provide approximately 67% protection; while certified respirators such as N95 (or FFP2/FFP3) can offer up to 95% protection against aerosols with a particle size of 0.3 μm when properly fitted [7,8]. The use of nanomaterials significantly enhances filtration efficiency by creating combined biological and mechanical filters, due to their large surface area and ability to interact with viral particles [6].
During a mask/respirator is used, a specific microenvironment forms between the face and the inner surface of the PPE [9]. It results from complex interactions between exhaled air, respiratory airflow rate, and the resistance of the mask’s textile structure. This space exhibits elevated temperature, relative humidity, and carbon dioxide (CO2) concentration compared to the ambient environment [10]. It is important to note that the electrostatic charge responsible for capturing particles can be rapidly neutralised during prolonged use, due to the increased temperature and humidity within this microenvironment [4]. The resulting decline in filtration performance and protective function underpins recommendations for regular mask replacement, sometimes as soon as 30 min after initial use [11].
CO2 is a natural metabolic by-product of the human body, exhaled at concentrations of approximately 40,000 ppm [12]. According to international standards, indoor CO2 levels exceeding 1000 ppm are considered indicative of poor ventilation and are associated with adverse effects on comfort, attention, memory, and cognitive performance [13]. At concentrations above 5000 ppm, OSHA identifies prolonged exposure as a significant health risk [14]. Symptoms of exposure to elevated CO2 levels include headache, anxiety, dizziness, restricted airflow, hypoxia, etc. [15,16,17]. Concentrations of 40,000 ppm are potentially life-threatening [18], while levels above 70,000 ppm can lead to loss of consciousness [19], with a fatal risk at 90,000 ppm (9%) [20].
Microenvironmental conditions under face masks and respirators remain insufficiently studied. Most existing research has focused primarily on filtration efficiency, while relatively few have addressed the specific values of CO2 concentration, temperature, and humidity that develop in the microenvironment during mask wear. Some authors have employed miniature temperature and humidity loggers positioned beneath the mask [21], while others have placed CO2 sensors outside the mask or around the face to examine the distribution of exhaled air [22]. Methods involving mannequins or sealed measurement chambers have also been used to simulate the conditions beneath a mask, although these lack real physiological activity [23]. Less frequently, in situ systems integrated into the mask or located in close proximity to the face have been developed, enabling simultaneous monitoring of temperature, humidity, and CO2 under real wearing conditions [24].
The present study aims to fill this gap by conducting direct measurements of these parameters under real-use conditions. Particular emphasis is placed on the role of textile structure, mass characteristics, air permeability, and face cover area in shaping CO2 accumulation, heat retention, and moisture build-up. Understanding these relationships is especially relevant in the context of pandemics and prolonged use by healthcare professionals and other workers, where maintaining both protective efficiency and user comfort is of critical importance.
2. Materials and Methods
2.1. Materials
Nine masks and respirators were considered for the investigation. They were grouped into three categories according to their intended use: textile non-medical masks, surgical masks, and respirators. The description of each mask/respirator is as follows:
- Textile non-medical masks
- ✓
- Sample 1: A fashion mask manufactured in China, compliant with GB/T 32610-2016. It is reusable and can be washed at 30 °C, but it does not provide protection against toxic gases.
- ✓
- Sample 2: No manufacturer or standard data were available. Similarly to Sample 1, it is reusable and washable at 30 °C.
- Surgical masks
- ✓
- Sample 3: Produced by Yavuz Medical® (Turkey) and certified under CE, EN14683, ISO9001:2015, ISO13485:2016. This mask is not reusable, should be disposed of after use, and stored in a dry, cool, and ventilated place.
- ✓
- Sample 4: Manufactured by Medtex Swiss Ltd. (Bulgaria), compliant with CE, EN14683:2019+AC. It has high splash resistance, is not reusable, and should be disposed of after use.
- ✓
- Sample 5: Produced by Etropal® (Bulgaria) and certified under CE, ISO13485:2016, EN14683:2019+AC:2019 (E). It is designed to limit transmission of infectious agents during treatment and related procedures. This mask is also not reusable and must be disposed of after use.
- Respirators
- ✓
- Sample 6: Produced by Rosimask (Turkey), compliant with CE2841, EN149:2001+A1:2009. Not reusable, requires disposal after use.
- ✓
- Sample 7: Manufactured by Wenzhou Meiyi Medical Device Co., Ltd. (China), certified under CE1463, EN149:2001+A1:2009. Provides protection against dust, smoke, fog, and microorganisms, but is not suitable for gases, open flames, or underwater use. It is not reusable and should be stored at room temperature (RH < 80%), away from fire, moisture, and sunlight.
- ✓
- Sample 8: Produced in Jinjiang, China, compliant with GB2626-2006 KN95. Protects from pollen, dust, and mist, but is not suitable for industrial use or unventilated areas, and is not recommended for children or for use during sleep. It is not reusable and should be stored away from ignition sources.
- ✓
- Sample 9: Manufactured by Minedra-NTech (EU) and certified under EN14683:2019+AC:2019, CE20071048. It provides protection against bacteria, is not reusable, and should be stored in a cool, dry place away from vapour, heat, open flame, and sunlight.
The pictures of the samples, their type, protection level and purpose of use are summarised in Table 1. Table 2 presents the results from the experimental evaluation of the thickness, weight (mass per unit area) and bulk density of the samples, using the methods, presented in Section 2.2. The approximate facial area covered by the respective PPE is also indicated, assuming that it is equal to the determined area of the mask/respirator.

Table 1.
List of investigated PPE, type of protection and purpose of use.
Table 2.
Number of layers, geometric and mass characteristic of the investigated PPE.
2.2. Methods
Figure 1 presents the instruments used in the study. The electronic scale KERN ABJ-NM/ABS/N (Kern & Sohn, Balingen, Germany) (Figure 1a) was applied for the mass measurements. The overall thickness of each mask, a parameter strongly influencing transport phenomena through the material, was determined in accordance with EN ISO 5084:2002 [25] using a DD-200-T thickness gauge Hans Schmidt & Co GmbH, Waldkraiburg, Germany) (Figure 1b). Measurements were performed over a 20 mm2 area under a pressure of 1 kPa. For each mask type, five individual samples were tested. Each sample was measured at five locations (the four corners and the centre).
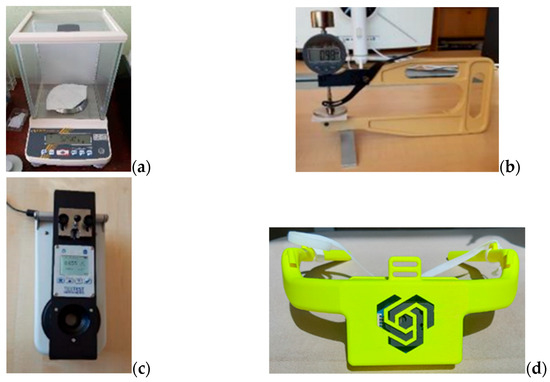
Figure 1.
Instruments used in the study: (a) electronic scale KERN ABJ-NM/ABS/N; (b) digital calliper DD-200-T; (c) air permeability and pressure drop meter FX-3340 MinAir; (d) measuring system Adafruit Bluefruit LE Feather.
The mass per unit area was calculated differently from the ISO 3801:1977 standard [26], as the ratio between the total mask or respirator mass and the approximate face cover area. The measurements were performed without disassembling the products, meaning that the reported values reflect the mask or respirator as a complete unit, rather than the conventional areal density of a single textile layer. This approach was chosen to provide an integrated measure of mass per surface, closer to real-use conditions. However, the results should not be directly compared with standardised values for mass per unit area of a textile fabric.
As a consequence, bulk density was derived as the product of this integrated mass per unit area and the measured thickness.
Air permeability was evaluated according to ISO 9237:1995 [27]. The FX-3340 MinAir device (Textest AG, Schwerzenbach, Switzerland) (Figure 1c) was used, applying a pressure differential of Δp = 100 Pa across each specimen. For every mask or respirator, five measurements were conducted on both sides, in two orientations: out–in (from the ambient environment to the face side) and in–out (from the face side to the ambient environment).
In practice, the test determines the air-permeability coefficient (Bp), which expresses the rate of airflow through a unit area under defined conditions (e.g., fixed Δp). It is formally defined as:
where Q is the volumetric flow rate [m3/s], A is the effective test area [m2], and V/Δt is the airflow per second.
Throughout this paper, the terms “air permeability” and “air-permeability coefficient (Bp)” are used interchangeably, since the measured quantity is in fact Bp.
The microenvironmental parameters: carbon dioxide concentration (CO2), temperature (T), and relative humidity (RH) under the masks and respirators were measured using a custom-built Adafruit Bluefruit LE Feather system. The device integrates an SCD30 sensor module (Sensirion AG, Stäfa, Switzerland), an Arduino Nano 33 IoT microcontroller, and a 3 V rechargeable battery, all enclosed in a 3D-printed polymer housing. Exhaled air was channelled to the sensor through side tubes equipped with hooks for mask and strap fixation. The system has been described in detail in [28] and is shown in Figure 1d.
The SCD30 sensor was intentionally positioned in the rear part of the housing, away from direct exhalation flow. The aim was to measure the average microenvironmental conditions beneath the mask, rather than short-term fluctuations near the nostrils or mouth. This setup allows for the assessment of cumulative CO2, temperature, and humidity build-up during wear. The internal sampling rate of the sensor is 2 s, with a response time of approximately 20 s. Factory calibration and built-in humidity/temperature compensation were enabled.
The study was carried out in a controlled room (10 × 8 × 6 m). Room temperature was monitored with a mercury thermometer and maintained at 22–23.5 °C using air conditioning. Prior to testing, the room was ventilated for 30 min, then sealed, with the air conditioning switched on. Measurements started at 9:30 a.m., once the temperature stabilised at 22 °C.
Air parameters—CO2 concentration, temperature, and relative humidity—were recorded both in the ambient environment and under the nine tested masks and respirators.
All samples were tested with one participant (44 years old). Coffee and smoking were prohibited; food intake was allowed up to 30 min before testing. Only the participant was present in the room, without entry or exit of other persons. Each mask or respirator was tested for 15 min. Testing with a single participant eliminates inter-individual variability, ensuring consistency across all measurements. This approach allows for better control of physiological and behavioural factors that may influence the results. It also simplifies data interpretation by reducing the number of confounding variables.
The workflow for operating the measuring system is presented in Figure 2.
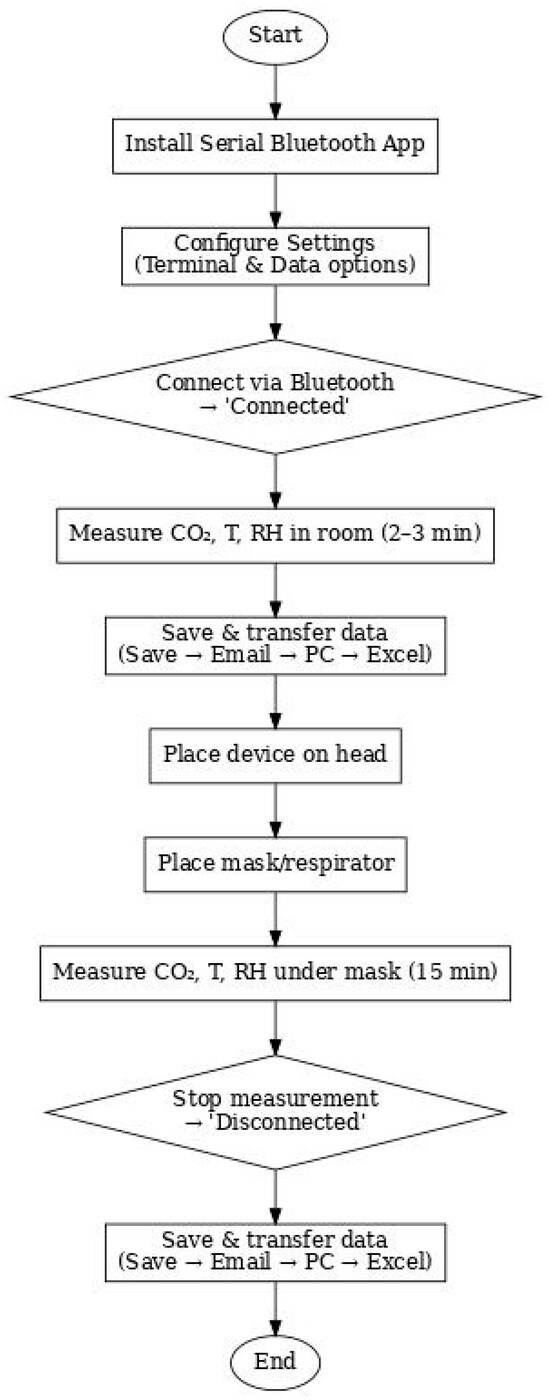
Figure 2.
Workflow of the measurement system.
After installing the Serial Bluetooth application on a smartphone, the system was connected via Bluetooth (Adafruit Bluefruit option in the Terminal → Devices menu) and the necessary settings were configured. Data logging was then enabled (Data → Log ON), establishing the communication between the smartphone and the measuring system. Environmental parameters (CO2 concentration, temperature, and relative humidity) were recorded in the room for 2–3 min, with data subsequently saved (Data → Save), transferred via e-mail to a computer, and processed in Excel.
The second stage focused on measurements under the masks and respirators. Following a brief reference test of the ambient environment, the device was positioned on the participant’s head and covered with the selected mask or respirator. Air parameters were recorded continuously for 15 min, after which the log was stopped (Disconnected), and the data were stored, transferred, and analysed in the same manner as for the environmental measurements. Between each mask trial, the room was briefly ventilated, and ambient conditions were re-measured to ensure stable baseline values. Figure 3 illustrates a moment from the under-mask testing procedure with the participant.
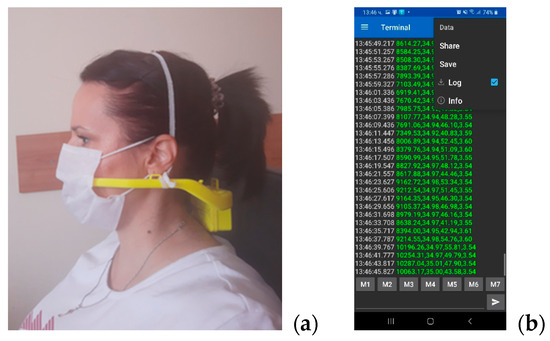
Figure 3.
A moment from the under-mask testing procedure: (a) with the participant; (b) the data recording.
3. Results
3.1. Air Permeability
Table 3 presents the average values and 95% confidence intervals of the air permeability of the tested samples, measured in both directions (Out–in and In–out). The results reveal clear differences between the samples.
Table 3.
Air permeability of the samples: average value and 95% confidence interval.
Samples 1, 3, and 5 demonstrate the highest air permeability, with values above 1.3 m/s in both directions, which indicates good breathability. In contrast, Samples 6, 7, 8, and 9 exhibit very low permeability, below 0.2 m/s in the Out-in direction, suggesting limited air exchange. Sample 2 shows moderate permeability, while Sample 4 is at the lower end of the range.
The comparison between directions (Out-in vs. In-out) shows generally consistent results, although for Sample 6 a notable difference is observed: very low permeability in the Out-in direction (0.084 m/s), but a significantly higher value in the In–out direction (0.508 m/s). This asymmetry could be attributed to structural features of the material layers or finishing treatments.
3.2. Microenvironment Under the Face Masks/Respirators
Table 4 presents the average values, standard deviations, and variation coefficients of CO2 concentration measured in the microenvironment between the samples and the human face. The results clearly show differences in the ability of the investigated PPE to allow gas exchange. Samples 3, 4, 6, 7, and 8 exhibit the highest CO2 accumulation, with average values exceeding 10,000 ppm. This indicates limited permeability and potential discomfort during prolonged wear. Sample 7 reaches the maximum value of 13,745 ppm, suggesting very restricted air circulation between the microenvironment and the surrounding air. In contrast, Samples 1, 2, 5, and 9 show significantly lower concentrations, between approximately 5200 and 7000 ppm, corresponding to better breathability.
Table 4.
Average values, standard deviations, and variation coefficients of CO2 concentration in the microenvironment between the samples and the human face.
The standard deviation values are higher for some samples (e.g., Sample 5 and Sample 6), reflecting larger measurement variability, while others (Sample 9) display stable results. The variation coefficient remains relatively low, indicating consistent measurements across all samples. Figure 4 complements these findings by including the environmental CO2 concentration as a reference. This baseline highlights the extent of accumulation inside the microenvironment, where values are 5–12 times higher than in the surrounding air. The contrast underlines the restrictive effect of some PPE (Samples 3, 4, 6, 7, and 8), while also emphasising that even the more breathable samples (1, 2, 5, and 9) still maintain significantly elevated levels compared to the environment.
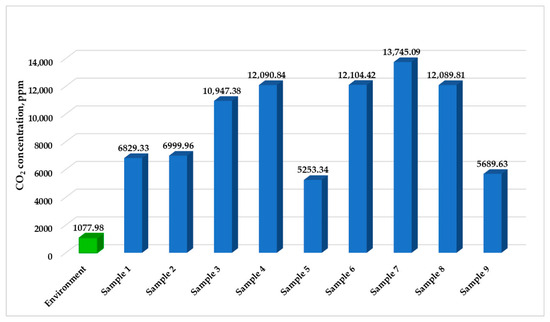
Figure 4.
Comparison of CO2 concentrations measured in the microenvironment across the tested samples, including the environmental baseline as reference.
Table 5 presents the average values, standard deviations, and variation coefficients of air temperature in the microenvironment under the different samples. Figure 5 complements the analysis by including the reference value of the ambient air temperature.
Table 5.
Average values, standard deviations, and variation coefficients of the temperature in the microenvironment between the samples and the human face.
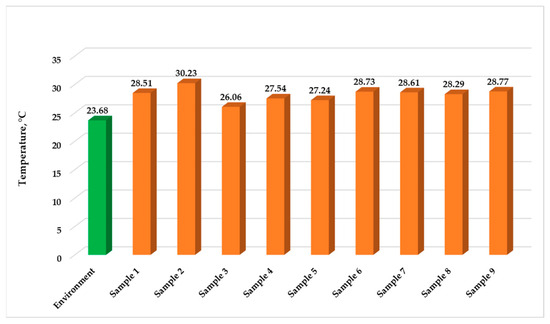
Figure 5.
Comparison of the temperature measured in the microenvironment across the tested samples, including the environmental baseline as reference.
An increase compared to the ambient environment (23.68 °C) is observed in the microenvironment under the PPE, with values ranging between 26.06 °C and 30.23 °C. The highest temperature is recorded for Sample 2, suggesting weaker ventilation and potential thermal discomfort during prolonged wear. Sample 3 shows the lowest value, close to the ambient air, which indicates better heat exchange.
The variation coefficients are extremely low, demonstrating the high stability and reproducibility of the measurements.
Table 6 and Figure 6 present the results for relative humidity in the microenvironment under the different samples, compared with the ambient reference value (27.28%). The data show a clear increase in humidity across all samples, ranging from 34.66% (Sample 5) to 46.77% (Sample 7). The highest values are observed for Samples 6–8, indicating more limited moisture exchange and the formation of a more humid microenvironment. The lowest value for Sample 5 is significantly closer to the ambient environment, suggesting better breathability.
Table 6.
Average values, standard deviations, and variation coefficients of the relative humidity in the microenvironment between the samples and the human face.
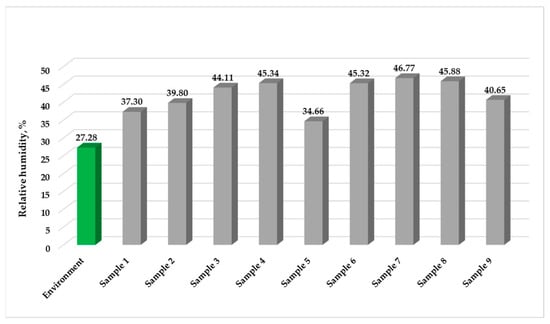
Figure 6.
Comparison of the relative humidity measured in the microenvironment across the tested samples, including the environmental baseline as reference.
The standard deviations and variation coefficients (Table 6) are moderate: some samples (Samples 3, 5, 8, and 9) show higher variability, indicating a certain degree of fluctuation in the measurements. Nevertheless, the overall trend is clear: all tested materials contribute to increased humidity in the zone between the face and the PPE compared to the surrounding conditions.
3.3. Effect of PPE Characteristics on the Microenvironment Under the Face Masks/Respirators
The results presented in this section show how the microenvironmental parameters under PPE depend on a number of structural and physical characteristics of the materials. Among these, thickness, mass per unit area, bulk density, the degree of facial coverage, as well as air permeability in both outward–inward and inward–outward directions play a key role.
The analysis of these dependencies is important, as they determine the extent to which a mask or respirator affects thermal comfort, moisture accumulation, and CO2 concentration in the zone between the face and the mask/respirator. Better air permeability, for example, can reduce overheating and condensation, while greater thickness and higher coverage increase the protective barrier but limit gas exchange. This highlights the balance between filtration efficiency and the physiological comfort of the wearer—a factor that is crucial for the prolonged and safe use of PPE.
Figure 7 presents the results for the relationship between CO2 concentration in the microenvironment and the main geometric and mass characteristics of masks and respirators. In the case of thickness (Figure 7a), no clear dependence is observed, with the very low R2 value (0.0011) indicating that this parameter by itself does not significantly affect CO2 accumulation. For the mass per unit area (Figure 7b), a very weak negative trend is recorded—higher values are associated with a slight decrease in CO2 concentration, although the effect remains minimal (R2 = 0.0285). A similar dependence is found for bulk density (Figure 7c), where a slight negative correlation is also observed, again with a very low R2 value (0.0285).
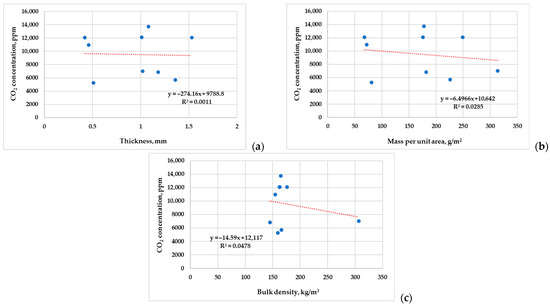
Figure 7.
Impact of the geometric and mass characteristics of masks/respirators on microenvironment’s CO2 concentration: (a) effect of thickness; (b) effect of mass per unit area; (c) effect of bulk density.
As a whole, none of the investigated geometric and mass characteristics of the samples have a substantial influence on CO2 concentration in the microenvironment, with the observed effects being very weak and statistically limited.
In Figure 8 the results are presented for the influence of geometric and mass characteristics on the temperature in the microenvironment under masks and respirators. For thickness (Figure 8a), a positive relationship is observed (R2 = 0.4077), suggesting that thicker materials are associated with a moderate increase in temperature. A stronger correlation is evident for the mass per unit area (Figure 8b), where the R2 value of 0.7768 indicates a pronounced dependency: heavier materials tend to retain more heat. A similar trend is seen in the case of bulk density (Figure 8c), with R2 = 0.4672, confirming that denser mask structures also contribute to higher temperatures in the microenvironment.
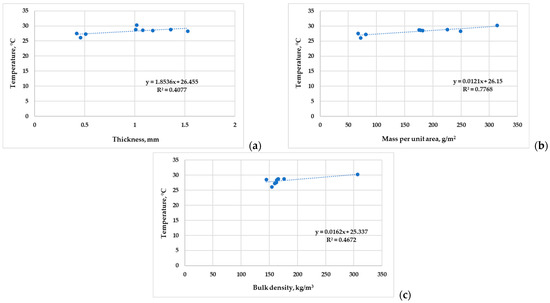
Figure 8.
Impact of the geometric and mass characteristics of masks/respirators on microenvironment’s temperature: (a) effect of thickness; (b) effect of mass per unit area; (c) effect of bulk density.
In summary, all three parameters—thickness, mass per unit area, and bulk density -exhibit a clear and consistent effect on the thermal environment under the masks. Unlike the results observed for CO2 concentration, the temperature increase is directly influenced by the geometric and mass characteristics, highlighting their role in heat retention and thermophysiological comfort.
Figure 9 presents the relationships between the geometric and mass characteristics of the samples and the relative humidity in the microenvironment under masks and respirators. For thickness (Figure 9a), a very weak positive trend is observed, with an extremely low R2 value (0.0152), suggesting minimal influence on humidity.
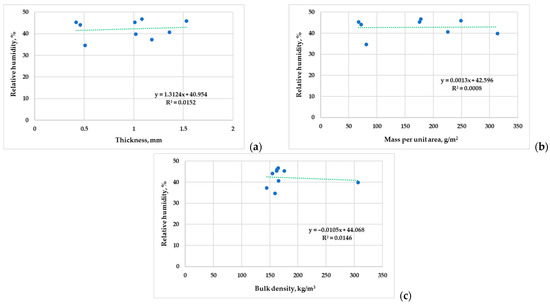
Figure 9.
Impact of the geometric and mass characteristics of masks/respirators on microenvironment’s relative humidity: (a) effect of thickness; (b) effect of mass per unit area; (c) effect of bulk density.
For mass per unit area (Figure 9b), the relationship is nearly zero (R2 = 0.0008), indicating no meaningful correlation. Similarly, bulk density (Figure 9c) shows a negligible negative trend (R2 = 0.0146), which also lacks statistical significance.
Overall, the extremely low R2 values across all three graphs confirm that these parameters do not have a significant effect on relative humidity in the microenvironment.
Figure 10 illustrates the influence of air permeability and face cover area on CO2 concentration in the microenvironment under masks and respirators. For air permeability, regardless of the measurement direction—from outside to inside (Figure 10a) or from inside to outside (Figure 10b)—a negative relationship is observed. Higher air permeability is generally associated with lower CO2 concentrations. The R2 values are 0.2844 (outside-inside) and 0.2246 (inside-outside), indicating weak but consistent correlations. Regarding the face cover area (Figure 10c), a very low R2 value of 0.0186 indicates that this parameter has little effect on CO2 retention under the mask or respirator. However, the slight positive trend suggests that masks or respirators with a larger face cover area may tend to accumulate slightly more CO2. In summary, while air permeability facilitates gas exchange and reduces CO2 accumulation, the face cover area shows minimal impact and cannot be considered a decisive factor in isolation.
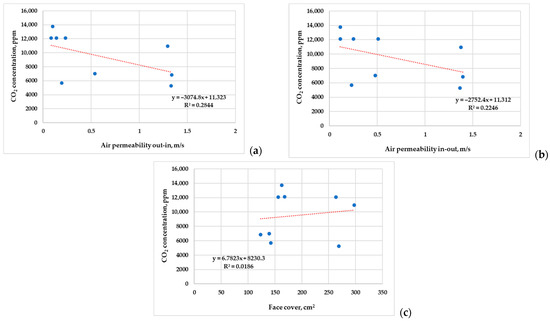
Figure 10.
CO2 concentration in the microenvironment under mask/respirators: (a) effect of air-permeability in Out-in direction; (b) effect of air-permeability in In-out direction; (c) effect of face cover area.
Figure 11 summarises the results for the influence of air permeability and face cover area on the temperature in the microenvironment under masks and respirators. With regard to air permeability, both from the outside in (Figure 11a) and from the inside out (Figure 11b), a weak negative correlation is observed with relatively low R2 values (0.2368 and 0.2563). This suggests that air permeability has only a limited effect on the microenvironmental temperature. In contrast, a strong negative correlation is recorded for the face cover area (Figure 11c), with an R2 value of 0.7421, indicating that larger face cover areas are associated with lower temperatures. Overall, unlike its effect on CO2 concentration, air permeability appears to play a minor role in thermal regulation, while the face cover area may be a more relevant factor. Nevertheless, the dominant parameters influencing heat retention remain thickness, mass per unit area, and bulk density, as previously shown in Figure 8.
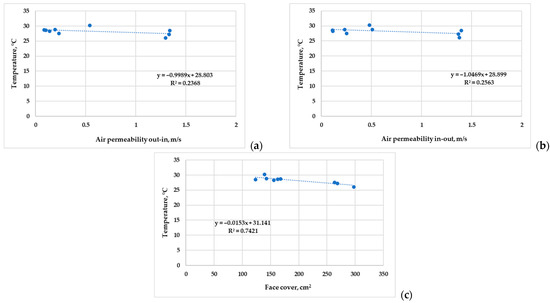
Figure 11.
Temperature of the microenvironment under mask/respirators: (a) effect of air-permeability in Out-in direction; (b) effect of air-permeability in In-out direction; (c) effect of face cover area.
Figure 12 shows the results for the influence of air permeability and face cover area on relative humidity in the microenvironment under masks and respirators. For air permeability (Figure 12a,b), a clear negative relationship is observed—higher permeability is associated with lower humidity. The R2 ≈ 0.5 indicates a moderately high value, showing a strong correlation: 0.4983 for the direction from outside to inside (Figure 12a) and 0.4325 for the direction from inside to outside (Figure 12b). Regarding face coverage, Figure 12c shows that the face cover has almost no effect on relative humidity. However, the positive trend means that larger masks should retain more moisture in the microenvironment. These results indicate that the area covering the face is sufficiently large to emphasise the role of mask design and size in regulating relative humidity. Therefore, air permeability is a moderately important factor in limiting moisture accumulation, while increasing the surface area of the covering contributes very little to higher relative humidity.
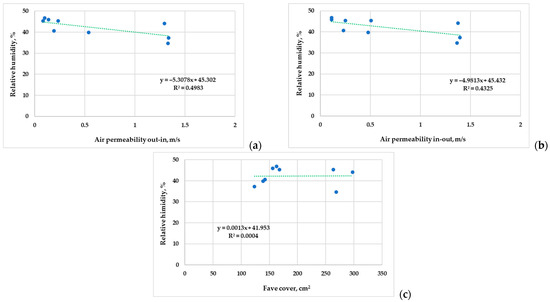
Figure 12.
Relative humidity of the microenvironment under mask/respirators: (a) effect of air-permeability in Out-in direction; (b) effect of air-permeability in In-out direction; (c) effect of face cover area.
4. Discussion
Тhe results from Figure 7, Figure 8, Figure 9, Figure 10, Figure 11 and Figure 12 show that the characteristics of masks and respirators influence the microenvironment in different ways, depending on whether CO2 concentration, temperature, or relative humidity is considered. These characteristics can be grouped into two categories: geometric and mass parameters (thickness, mass per unit area, bulk density) and structural parameters (air permeability and face cover area).
In the case of CO2 concentration, thickness, mass per unit area, and bulk density exhibit no significant relationship (evidenced by low R2 values). In contrast, air permeability shows a clear negative correlation: higher air permeability facilitates better air exchange and reduces CO2 retention in the microenvironment (Figure 10a,b). The face cover area also demonstrates a positive relationship with CO2 concentration, indicating that larger masks tend to trap more CO2, although the correlation is relatively weak (Figure 10c). Overall, structural characteristics, particularly air permeability, have a more noticeable impact on CO2 levels than mass or geometric properties.
For microenvironmental temperature, the dominant role is played by thickness, mass per unit area, and bulk density. All they show strong or clear positive correlations with increased temperature (Figure 8), suggesting that heavier and denser mask/respirators retain more heat. On the other hand, air permeability and face cover area demonstrate weak or minimal influence (Figure 11a,b). While face cover area still shows a stronger effect than air permeability (Figure 11c), it is geometric and mass parameters that should be prioritised when aiming to reduce heat build-up under masks/respirators.
Relative humidity is primarily affected by air permeability. The results show a moderate to strong negative correlation: more permeable materials allow moisture to escape more easily (Figure 12a,b). Geometric and mass parameters such as thickness, mass per unit area, and bulk density show no meaningful effect (Figure 9), which is consistent with the low R2 values. The face cover area exhibits a positive trend, though with very low correlation (Figure 12c), suggesting that larger masks may retain more humidity but not to a significant extent.
In summary, the comparative analysis confirms that no single parameter can optimise all aspects of the microenvironment. Temperature is primarily influenced by the mass and geometric properties of the materials, while CO2 concentration and relative humidity are mostly affected by structural characteristics, especially air permeability. The summary in Table 7 clearly illustrates these relationships and highlights the need for a balanced design approach that takes into account both protection and comfort. For effective design, materials should be selected not only for their filtration performance, but also for their impact on the microclimate between the face and the mask or respirator.
Table 7.
Summary of the influence of material and design characteristics on CO2 concentration, temperature, and relative humidity in the microenvironment.
The results of this study should be interpreted in light of several limitations. Measurements were performed with a single participant under controlled laboratory conditions, which ensured high reproducibility but limited the ability to generalise the findings across broader populations. Real-life factors such as speech, facial movement, or variations in breathing patterns were not included in the experimental setup and may further influence the microenvironment under masks and respirators.
Future work will extend the investigation to multiple participants with different physiological characteristics and activity levels, including dynamic conditions that better represent real-use scenarios. These studies will also explore the influence of prolonged wear and additional physiological indicators such as blood oxygen and CO2 saturation.
5. Conclusions
This study confirms that different types of mask and respirator characteristics influence the microenvironment in distinct ways. Geometric and mass parameters—such as thickness, mass per unit area, and bulk density—have a pronounced effect on temperature, with thicker and denser materials contributing to heat retention. However, their impact on CO2 concentration and relative humidity is negligible.
In contrast, structural characteristics—particularly air permeability and face cover area—have a significant influence on CO2 and moisture accumulation. Higher air permeability improves gas exchange and moisture evaporation, leading to lower CO2 concentrations and relative humidity. On the other hand, a larger face cover area is associated with increased CO2 and moisture retention, though with weaker correlations.
These findings highlight the importance of a multi-criteria approach when designing masks and respirators. To ensure both protection and comfort, material selection and structural design must be carefully balanced to control heat, CO2, and humidity buildup without compromising filtration performance.
Author Contributions
Conceptualization, R.A.A.; methodology, M.I., R.A.A. and D.S.; software D.S.; formal analysis, R.A.A.; investigation, M.I. and R.A.A.; resources, M.I. and R.A.A.; data curation, M.I. and D.S.; writing—original draft preparation, M.I.; writing—review and editing, R.A.A.; visualisation, M.I., R.A.A. and D.S.; supervision, R.A.A. and D.S.; project administration, R.A.A.; funding acquisition, R.A.A. All authors have read and agreed to the published version of the manuscript.
Funding
The research presented in this publication was funded by the Internal Competition of the Technical University of Sofia, 2024, contract number 242ПД0029-02.
Institutional Review Board Statement
Ethical review and approval were waived for this study as it did not involve clinical research, medical intervention, invasive procedures, or the collection of personal data. The study consisted only of short-term wearing of masks/respirators under conditions equivalent to daily use, with no risks beyond ordinary life activities.
Informed Consent Statement
Informed consent was obtained from all subjects involved in the study.
Data Availability Statement
The original contributions presented in this study are included in the article. Further inquiries can be directed to the corresponding author.
Conflicts of Interest
The authors declare no conflicts of interest.
References
- Zhai, P.; Ding, Y.; Wu, X.; Long, J.; Zhong, Y.; Li, Y. The epidemiology, diagnosis and treatment of COVID-19. Int. J. Antimicrob. Agents 2020, 55, 105955. [Google Scholar] [CrossRef] [PubMed]
- Bubbico, L.; Mastrangelo, G.; Larese-Filon, F.; Basso, P.; Rigoli, R.; Maurelli, M.; Ferlito, S.; Capelli, M.; Gisabella, C.; Javanbakht, M.; et al. Community use of face masks against the spread of COVID-19. Int. J. Environ. Res. Public Health 2021, 18, 3214. [Google Scholar] [CrossRef] [PubMed]
- Gericke, A.; Militký, J.; Venkataraman, M.; Steyn, H.; Vermaas, J. The effect of mask style and fabric selection on the comfort properties of fabric masks. Materials 2022, 15, 2559. [Google Scholar] [CrossRef] [PubMed]
- Otrisal, P.; Bungau, C.; Obsel, V.; Melicharik, Z.; Tont, G. Selected respiratory protective devices: Respirators and significance of some markings. Sustainability 2021, 13, 4988. [Google Scholar] [CrossRef]
- Solano, T.; Ni, C.; Mittal, R.; Shoele, K. Perimeter leakage of face masks and its effect on the mask’s efficacy. Phys. Fluids 2022, 34, 051902. [Google Scholar] [CrossRef]
- Yousefinejad, S.; Jahangiri, M.; Dehghani, F. Material perspectives for respiratory protection revolution: Application of nanomaterials. In Designing Advanced Respiratory Protective Devices for Pandemics; Elsevier Science Ltd.: Amsterdam, The Netherlands, 2025; pp. 265–287. [Google Scholar]
- Kunstler, B.; Newton, S.; Hill, H.; Ferguson, J.; Hore, P.; Mitchell, B.G.; Dempsey, K.; Stewardson, A.J.; Friedman, D.; Cole, K.; et al. P2/N95 respirators & surgical masks to prevent SARS-CoV-2 infection: Effectiveness & adverse effects. Infect. Dis. Health 2022, 27, 81–95. [Google Scholar] [PubMed]
- Matuschek, C.; Moll, F.; Fangerau, H.; Fischer, J.C.; Zänker, K.; van Griensven, M.; Schneider, M.; Kindgen-Milles, D.; Knoefel, W.T.; Lichtenberg, A.; et al. Face masks: Benefits and risks during the COVID-19 crisis. Eur. J. Med. Res. 2020, 25, 32. [Google Scholar] [CrossRef] [PubMed]
- Angelova, R.A.; Ivanova, M.; Sofronova, D. Testing Methodology for Measuring Carbon Dioxide Concentration, Temperature, and Humidity Under Surgical Face Masks. In Proceedings of the 2024 XXXIV International Scientific Symposium Metrology and Metrology Assurance (MMA), Sozopol, Bulgaria, 7–11 September 2024; IEEE: New York, NY, USA, 2024; pp. 1–5. [Google Scholar]
- Sofronova, D.; Sofronov, Y.; Angelova, R.A. Design of a Device for Measuring the Parameters of the Microenvironment under Protective Face Masks. In Proceedings of the 2021 6th International Symposium on Environment-Friendly Energies and Applications (EFEA), Sofia, Bulgaria, 24–26 March 2021; IEEE: New York, NY, USA, 2021; pp. 1–4. [Google Scholar]
- Wang, A.B.; Zhang, X.; Gao, L.J.; Zhang, T.; Xu, H.J.; Bi, Y.J. A review of filtration performance of protective masks. Int. J. Environ. Res. Public Health 2023, 20, 2346. [Google Scholar] [CrossRef] [PubMed]
- Persily, A.; de Jonge, L. Carbon dioxide generation rates for building occupants. Indoor Air 2017, 27, 868–879. [Google Scholar] [CrossRef] [PubMed]
- Satish, U.; Mendell, M.J.; Shekhar, K.; Hotchi, T.; Sullivan, D.; Streufert, S.; Fisk, W.J. Is CO2 an indoor pollutant? Direct effects of low-to-moderate CO2 concentrations on human decision-making performance. Environ. Health Perspect. 2012, 120, 1671–1677. [Google Scholar] [CrossRef] [PubMed]
- Occupational Safety and Health Administration. Carbon Dioxide. United States Department of Labor. 2023. Available online: https://www.osha.gov/chemicaldata/183 (accessed on 8 October 2025).
- Ahirwar, R.K.; Meena, A.K. Applied Physiology; Academic Guru Publishing House: Bhopal, India, 2025. [Google Scholar]
- Liu, W.; Zhong, W.; Wargocki, P. Performance, acute health symptoms and physiological responses during exposure to high air temperature and carbon dioxide concentration. Build. Environ. 2017, 114, 96–105. [Google Scholar] [CrossRef]
- Law, J.; Van Baalen, M.; Foy, M.; Mason, S.S.; Mendez, C.; Wear, M.L.; Meyers, V.E.; Alexander, D. Relationship between carbon dioxide levels and reported headaches on the international space station. J. Occup. Environ. Med. 2014, 56, 477–483. [Google Scholar] [CrossRef] [PubMed]
- Straub, F. Toxic carbon dioxide exposures: The unacceptable risk. Prof. Saf. 2021, 66, 24–34. [Google Scholar]
- Ramírez, M.E.; Ron, M.; Mago, G.; Hernandez–Runque, E.; Martínez, M.D.C.; Escalona, E. Proposal for an epidemiological surveillance program for the prevention of occupational accidents and diseases in workers exposed to carbon dioxide (CO2) at a Venezuelan brewing company. Data Metadata 2023, 2, 55. [Google Scholar] [CrossRef]
- Gurrieri, S.; Di Martino, R.M.R.; Camarda, M.; Francofonte, V. Monitoring CO2 hazards of volcanic origin: A case study at the island of Vulcano (Italy) during 2021–2022. Geosciences 2023, 13, 266. [Google Scholar] [CrossRef]
- Gupta, D. Living with in-mask micro-climate. Med. Hypotheses 2020, 144, 110010. [Google Scholar] [CrossRef] [PubMed]
- Salman, N.; Khan, M.W.; Lim, M.; Khan, A.; Kemp, A.H.; Noakes, C.J. Use of multiple low cost carbon dioxide sensors to measure exhaled breath distribution with face mask type and wearing behaviour. Sensors 2021, 21, 6204. [Google Scholar] [CrossRef] [PubMed]
- Gładyszewska-Fiedoruk, K.; Teleszewski, T.J. Experimental studies of carbon dioxide concentration in the space under the face mask protecting against COVID-19–Pilot studies. J. Environ. Health Sci. Eng. 2022, 20, 1111–1119. [Google Scholar] [CrossRef] [PubMed]
- Ruffa, F.; Lugarà, M.; Fulco, G.; De Capua, C. An IoT measurement system for a tailored monitoring of CO2 and total volatile organic compounds inside face masks. Acta IMEKO 2023, 12, 1–8. [Google Scholar] [CrossRef]
- ISO 5084:19962; Textiles—Determination of Thickness of Textiles and Textile Products. International Organization for Standardization: Geneva, Switzerland, 1996.
- ISO 3801:1977; Textiles—Woven Fabrics—Determination of Mass per Unit Length and Mass per Unit Area. International Organization for Standardization: Geneva, Switzerland, 1977.
- ISO 9237:1995; Textiles—Determination of the Permeability of Fabrics to Air. International Organization for Standardization (ISO): Geneva, Switzerland, 1995.
- Sofronova, D.; Angelova, R.; Sofronov, Y. Measuring the carbon dioxide concentration under protective face masks with a sensor system. Appl. Ecol. Environ. Res. 2023, 21, 2775–2796. [Google Scholar] [CrossRef]


Disclaimer/Publisher’s Note: The statements, opinions and data contained in all publications are solely those of the individual author(s) and contributor(s) and not of MDPI and/or the editor(s). MDPI and/or the editor(s) disclaim responsibility for any injury to people or property resulting from any ideas, methods, instructions or products referred to in the content. |
© 2025 by the authors. Licensee MDPI, Basel, Switzerland. This article is an open access article distributed under the terms and conditions of the Creative Commons Attribution (CC BY) license (https://creativecommons.org/licenses/by/4.0/).