Article

Application of Water-Sensitive Paper for Spray Performance Evaluation in Aeroponics via a Segmentation-Based Algorithm

1
Department of Biosystems Engineering, College of Agriculture & Life Sciences, Gyeongsang National University, Jinju 52828, Republic of Korea
2
Department of Bio-Industrial Machinery Engineering, College of Agriculture & Life Sciences, Gyeongsang National University, Jinju 52828, Republic of Korea
3
Department of Agricultural Engineering, Gyeongsang National University, Jinju 52828, Republic of Korea
*
Authors to whom correspondence should be addressed.
These authors contributed equally to this work and shared corresponding authorship.
Appl. Sci. 2025, 15(20), 10928; https://doi.org/10.3390/app152010928
Submission received: 9 September 2025 / Revised: 8 October 2025 / Accepted: 9 October 2025 / Published: 11 October 2025

Abstract

Continued population growth demands a significant increase in agricultural production to ensure food security. However, agricultural output is limited by environmental crises and the negative impacts of open-field farm practices. As an alternative, vertical farming techniques, such as aeroponics, can be utilized to optimize the use of resources. However, the uneven size and distribution of spray droplets in aeroponics, issues that affect root development and nutrient delivery, continue to be problematic in spray performance analysis. In aeroponics, nutrient solutions are delivered to plant roots through pressurized nozzles, and the effectiveness of this delivery depends on the spray characteristics. Variations in flow rates directly affect droplet size, density, and coverage, which in turn influence nutrient uptake and crop growth. In this study, the flow rate was adjusted (3, 4.5, and 6 L/min) to quantitatively analyze spray performance using water-sensitive paper (WSP) as a deposit collector via a quick assessment method. Subsequently, image-processing techniques such as threshold segmentation and morphological operations were applied to isolate individual spray droplets on the WSP images. This technique enabled the quantification of the droplet’s coverage area, size, density, and uniformity to effectively evaluate spray performance. One-way ANOVA indicated that all the spray parameters varied significantly with respect to the flow rate (p < 0.05): For example, the average diameters of the droplets increased from 0.73 mm at 3 L/min to 1.29 mm at 6 L/min. The droplets’ densities decreased from 85.53 drops/cm2 to 30.00 drops/cm2 across the same flow range. The average uniformity index improved from 30.53 to 15.95 as the flow rate increased. These results indicate that the application of WSP is an effective and scalable approach for analyzing spray performance in aeroponics, as WSP can be rapidly digitized with simple tools, such as a cell phone camera, avoiding the limitations of flatbed scanners or specialized imaging systems.

1. Introduction

The current global population exceeds 8 billion and is projected to reach approximately 9.2 billion by 2050 [1,2]. Additionally, conventional farming is hampered by issues such as soil degradation, water shortages, fertilizer loss, and the effects of climate change. Although the water supply is declining due to climate change, excessive irrigation, and groundwater depletion, traditional soil-based farming is becoming progressively unsustainable even while agriculture now consumes 70% of freshwater resources globally [3,4]. In recent years, researchers have developed innovative alternative approaches, such as aeroponic systems, which offer viable strategies for conserving water and increasing agricultural yields. Aeroponics is an innovative soilless farming approach that uses substantially less water than conventional agricultural practices [5,6]. According to research conducted by the National Aeronautics and Space Administration, aeroponics can decrease the use of fertilizer by 60%, water by 98%, and pesticides by 100%. Furthermore, this approach enables crop yields to be enhanced by 45–75% compared with conventional farming, while requiring less manual labor [7]. In aeroponic systems, plant roots are suspended in the air within a growing chamber, where they receive nutrient droplets directly. To ensure proper development, the roots are kept completely in the dark within a controlled environment. Aeroponic systems utilize artificial lighting and precise environmental control, which enable year-round cultivation independent of external conditions [8].
Although the concept of aeroponics was introduced many years ago, implementation has still not reached its full potential due to inadequate standardization and optimization guidelines for farmers and researchers. The lack of precise control and standardization in aeroponic systems causes variability in nutrient delivery, root growth, and crop yields. The primary issue is the size of the nutrient droplets, as relatively large droplets may limit the availability of oxygen to the root systems. Furthermore, low oxygen concentrations can affect nutrient absorption and root respiration, as the availability of oxygen in the root is a significant factor for plant growth [9]. Conversely, overly small nutrient solution droplets could produce many root hairs, which may prevent the roots from forming a lateral root system, impeding further growth. An appropriate spray coverage area ensures that each root receives the same amount of nutrients, which prevents both over-irrigation and under-irrigation. A sufficient density of droplets ensures that moisture and air are balanced and distributed uniformly to all plant roots, considering that adequately uniform droplets help minimize variations in the plant’s growth and yield. Spray performance is related to the droplet size, coverage area, density, and uniformity index. These parameters depend on the flow rate, nozzle shape, and arrangement of nozzles in aeroponic trays [10].
A previous study investigated spray atomization in multiphase flows, with a particular emphasis on the atomization of tank mixes containing agricultural products. Their findings highlighted the importance of fluid parameters, nozzle design, and operating conditions in affecting spray characteristics such as droplet size, coverage, and drift potential. They made great progress in understanding spray behavior for agricultural applications by investigating fluid-phase interactions. However, their research concentrated on tank mix delivery rather than the specifics of aeroponic nutrient delivery, where fine mist atomization and droplet size distribution management are crucial for optimal plant nutrient uptake [11]. Another study examined the droplet sizes generated by an aeroponic atomizer using a laser particle size analyzer (model Winner318B, Jinan Winner Particle Instruments, Jinan, China). This device analyzed and recorded the size distribution of the nutrient solution droplets produced via each atomizer type. The measurements were conducted indoors at room temperature (20–25 °C), maintaining constant operating pressures and water flow rates for each atomizer during the experiments [12]. The laser particle size analysis technique is costly; to overcome this challenge, water-sensitive paper (WSP) can be applied in aeroponic systems to analyze spray performance more economically and efficiently.
Water-sensitive paper (WSP) has been widely used as an artificial target for assessing agricultural spray performance for over 30 years [13]. WSP comprises paper coated with a yellow surface that turns dark blue upon making contact with aqueous droplets. This color change is due to the reaction of the water with the bromophenol-blue indicator contained in the coating, which changes to blue in the pH range from 2.8 to 4.6 [14]. Numerous studies have demonstrated that WSP is a useful tool for assessing spray performance in both aerial and ground spray applications [15,16,17,18]. WSP can be effectively utilized as a diagnostic tool within aeroponic systems due to the sufficient distance between the nozzles and growing pots where the WSP is positioned. Although our aeroponic system is not a standard model, it has features similar to those of most commercial aeroponic systems, such as the specific nozzle design and the use of growing pots. In a previous study, WSP was used to assess spray performance, and it was used as a sampler for collecting pesticide droplets, after which the image-processing software Deposit Scan (developed by the United States Department of Agriculture, Agricultural Research Service laboratory) was used to compute the droplet coverage area on the top layer of wheat in order to determine the proportional distribution of droplets that reached the lower layer. Traditional methods, including visual inspection of the spray, are limited in terms of their accuracy and are not easily scalable to the analysis of larger systems [19]. On the other hand, image-processing techniques provide a reliable and quantitative tool for analyzing spray performance [20,21].
Previous studies have demonstrated the effectiveness of image-processing techniques for evaluating spray quality using water-sensitive paper (WSP). For instance, a prior study found that image processing can reliably assess the spray coverage area and droplet size on WSP, with mean absolute errors of 6.7% for droplet densities and <3% for coverage areas [22]. A similar study was conducted by developing a distinct algorithm for WSP that improved spray performance by separating intricately linked droplets. In this study, image processing enabled droplet coverage detection with a relative error as low as 0.88% while effectively identifying small droplets and accurately separating closely positioned droplets by distinguishing their independent contours [23]. Subsequently, the problem of overlapping droplets was then addressed with a dual-method framework that combined YOLOv8 deep learning with classical computer vision. When compared to conventional methods, this method improved precision and scalability by showcasing the efficacy of synthetic datasets for model training and presenting a smartphone application that can evaluate spray quality in real time [24]. These findings demonstrate the strong potential of image-based analysis as a quantitative and scalable tool for evaluating spray performance in aeroponics.
While previous research has provided valuable insights into spray performance in aeroponic systems through laser particle size analysis, this technique often requires specialized equipment and can be costly and complex to implement. In contrast, this study introduces an image-processing-based approach using water-sensitive paper (WSP) that enables a practical, cost-effective, and scalable evaluation of droplet coverage, size, density, and uniformity. This method facilitates consistent assessments of spray performance with minimal resource investment, rendering it accessible for both research and commercial aeroponic operations. By systematically analyzing spray characteristics under regulated flow conditions, this study contributes a novel, simplified, yet effective tool to optimize nutrient delivery in aeroponic cultivation, thereby advancing the reproducibility and scalability of performance evaluation in aeroponic systems. Although WSP and image-processing methods are established in agricultural spray analysis, their targeted application to nutrient mist evaluation in closed aeroponic systems remains limited. This study adapts these techniques to quantify droplet characteristics under controlled aeroponic conditions, providing a cost-effective and reproducible framework for optimizing spray performance. The objectives of this study are as follows:
1
To demonstrate the application of water-sensitive paper (WSP) as a practical tool for evaluating spray performance within an aeroponic system.
2
To investigate the influence of different flow rates on spray performance parameters, including droplet coverage area, size, density, and uniformity index under manually controlled aeroponic conditions.

2. Materials and Methods

2.1. Experimental Site and Structure

The experiment was conducted in an aeroponic cultivation room constructed in the laboratory of Gyeongsang National University, South Korea (35.15° N and 128.09° E). The aeroponic chamber consisted of three levels (A, B, and C), each containing three growing trays. The dimensions of the chamber and trays were 189 × 127 cm and 77 × 39 cm, respectively (Figure 1). Each tray was fitted with a Styrofoam sheet containing 21 planting holes, of which 12 were used for evaluating spray performance (Figure 2). The nutrient solution was delivered from the reservoir to each tray via black tubes, which functioned as inlet flow lines. In contrast, white tubes served as outlet flow lines, returning excess nutrient solutions to the reservoir. Mist nozzles were installed in all trays to ensure a consistent spray pattern throughout the system. Fourteen mist nozzles were uniformly placed across every tray, and they were arranged in two parallel rows along the longer sides of the tray, with each nozzle spaced approximately 10 cm apart to ensure uniform spray distributions. Each mist nozzle was installed at a fixed angle of 45° relative to the water-sensitive paper’s (WSP) surface to ensure optimal spray coverage and droplet deposition. The vertical distance between each nozzle and the WSP was maintained at 30 cm throughout all experiments using a fixed mounting system (Figure 2). Consistent water flow to the mist spraying nozzles was maintained using a diaphragm booster pump.
Flow was monitored using a YF-S402B flow sensor (Sea Technology Co., Ltd., Foshan, China). This sensor can measure flow rates ranging from 0.3 to 6 L per minute, and it requires a voltage supply of 3.5 to 24 V DC for operation. For constant readings, each sensor was connected with and powered by a regulated DC voltage supply within the designated range. The sensor is also designed to manage pressure values up to 0.8 MPa, meaning that it is able to meet system requirements. Six flow sensors were positioned in the system to monitor the flow rates at the inlet and outlet of every level (Figure 1). To eliminate measurement errors, the sensors were positioned in-line at the inlet and outlet on each level. A Wemos D1 microcontroller, to which each flow sensor was connected, was used to gather information. The digital pulse signal from each YF-S402B flow sensor was processed using pulse counting over fixed 1 s intervals. An interrupt service routine counted pulses on each falling edge of the sensor output, and every second, the accumulated pulse count was converted into volumetric flow rates (L/min) based on the sensor’s calibration, where 7.5 pulses correspond to one liter of liquid flow. The calculation used was as follows:
Flow   Rate   ( L / min )   =   Pulse   Count 7.5
The pulse count was reset for each subsequent measurement period. The flow rate data were then transmitted using a microcontroller to a computer via a Flask web server (version 3.0.3) for further analysis. Flow rates for the treatments were manually adjusted using valves, while real-time data from the flow sensors were transmitted via a Wemos D1 microcontroller to a laptop. Adjustments continued until each flow rate matched the target value before starting measurements. The average recorded flow rate for each treatment was used for analysis.
Three flow rate treatments (3, 4.5, and 6 L/min) were evaluated. For each treatment, a single trial was conducted, during which 36 pieces of water-sensitive paper (WSP) were placed on the trays to capture droplet deposition. Replication was performed at the level of individual WSP samples rather than repeated treatment runs, resulting in 36 measurements per flow rate. In total, 108 WSP samples were collected and analyzed for statistical comparison across all treatments. To ensure accurate droplet measurements, all images were captured using a fixed stand to maintain a consistent camera-to-target distance of 12 cm under controlled and uniform lighting conditions, minimizing variability across images [25].
An image-processing technique was used to analyze the visual data and enabled both quantitative and qualitative information to be retrieved from the images. In this study, segmentation and thresholding methods were employed to examine the WSP images to enable a systematic visual evaluation of spray performance. Threshold segmentation, a fundamental step in image processing and pattern recognition, is based on an algorithm that categorizes images based on their grayscale values, color attributes, and other characteristics [26]. In this study, the images were first converted to grayscale, with intensity values represented as 8-bit unsigned integers ranging from 0 to 255. A fixed binary threshold of 128 (~50% intensity) was then applied: Pixels with intensity values above 128 were classified as background, whereas those with lower values were identified as droplets. This produced an image in which droplets were clearly distinguishable for further analysis. A morphological operation was applied to the binary image to minimize noise and enhance feature detection. The binary image was segmented using the connected components labeling approach to identify individual droplets [27]. Each droplet was considered as a distinct object, and its morphological properties, such as the droplet’s coverage area, size, density, and uniformity index, were analyzed to assess the overall spray performance pattern (Figure 3).
Based on the resolution of the captured image and the physical dimensions of the water-sensitive paper, the number of pixels occupied by each detected droplet was transformed into physical area units (mm2) for the determination of the droplet area. Then, the average area of the droplets was calculated using the following formula:
A avg   =   1 N i = 1 n A i
where N is the total number of droplets detected, and Ai is the area of each droplet. The average droplet diameter was calculated based on the average droplet area using the equivalent circular diameter:
D avg   =   2   A a v g π
The coverage area percentage was computed using the following formula:
Coverage   area   ( % )   =   ( A d A t ) × 100
where ∑Ad is the total area of all droplets in mm2, and At is the total area of the paper. Droplet density (drops per cm2) was computed as follows:
Droplet   Density   ( drops / cm 2 )   =   N A t / 100
where N is the total number of droplets identified, and At is the total area of the paper. Finally, the uniformity index, which indicates the consistency of droplet distributions, was calculated based on the coefficient of variation.
Uniformity   Index = 100 ( σ μ × 100 )
Here, µ is the mean, and σ is the standard deviation of the droplet areas.

2.2. Testing the Image-Processing Technique

Droplets were manually placed on the WSP using a micropipette (Socorex Isba SA, Ecublens, Switzerland) to evaluate the effectiveness of the image-processing technique. For validation, droplets were intentionally placed sparsely to avoid overlaps, which enabled precise manual measurements of their diameters using a ruler scale as ground truth. These manually measured values were then compared with the results obtained from the image-processing algorithm, and both methods produced nearly identical droplet size measurements. The validation data showed a high level of accuracy, with an R2 value of 0.98, indicating a high degree of accuracy between the manual method and the algorithm-based droplet measurements. Figure 4a shows a WSP sample with manually placed droplets, whereas Figure 4b demonstrates the detection results of the applied algorithm, with red bounding boxes accurately identifying each droplet and measuring the average diameter. In addition to this controlled validation, the algorithm was further applied to experimental WSP images with higher droplet densities, broader size variabilities, and overlapping droplets, confirming its robustness under realistic spray conditions.

2.3. Statistical Analysis

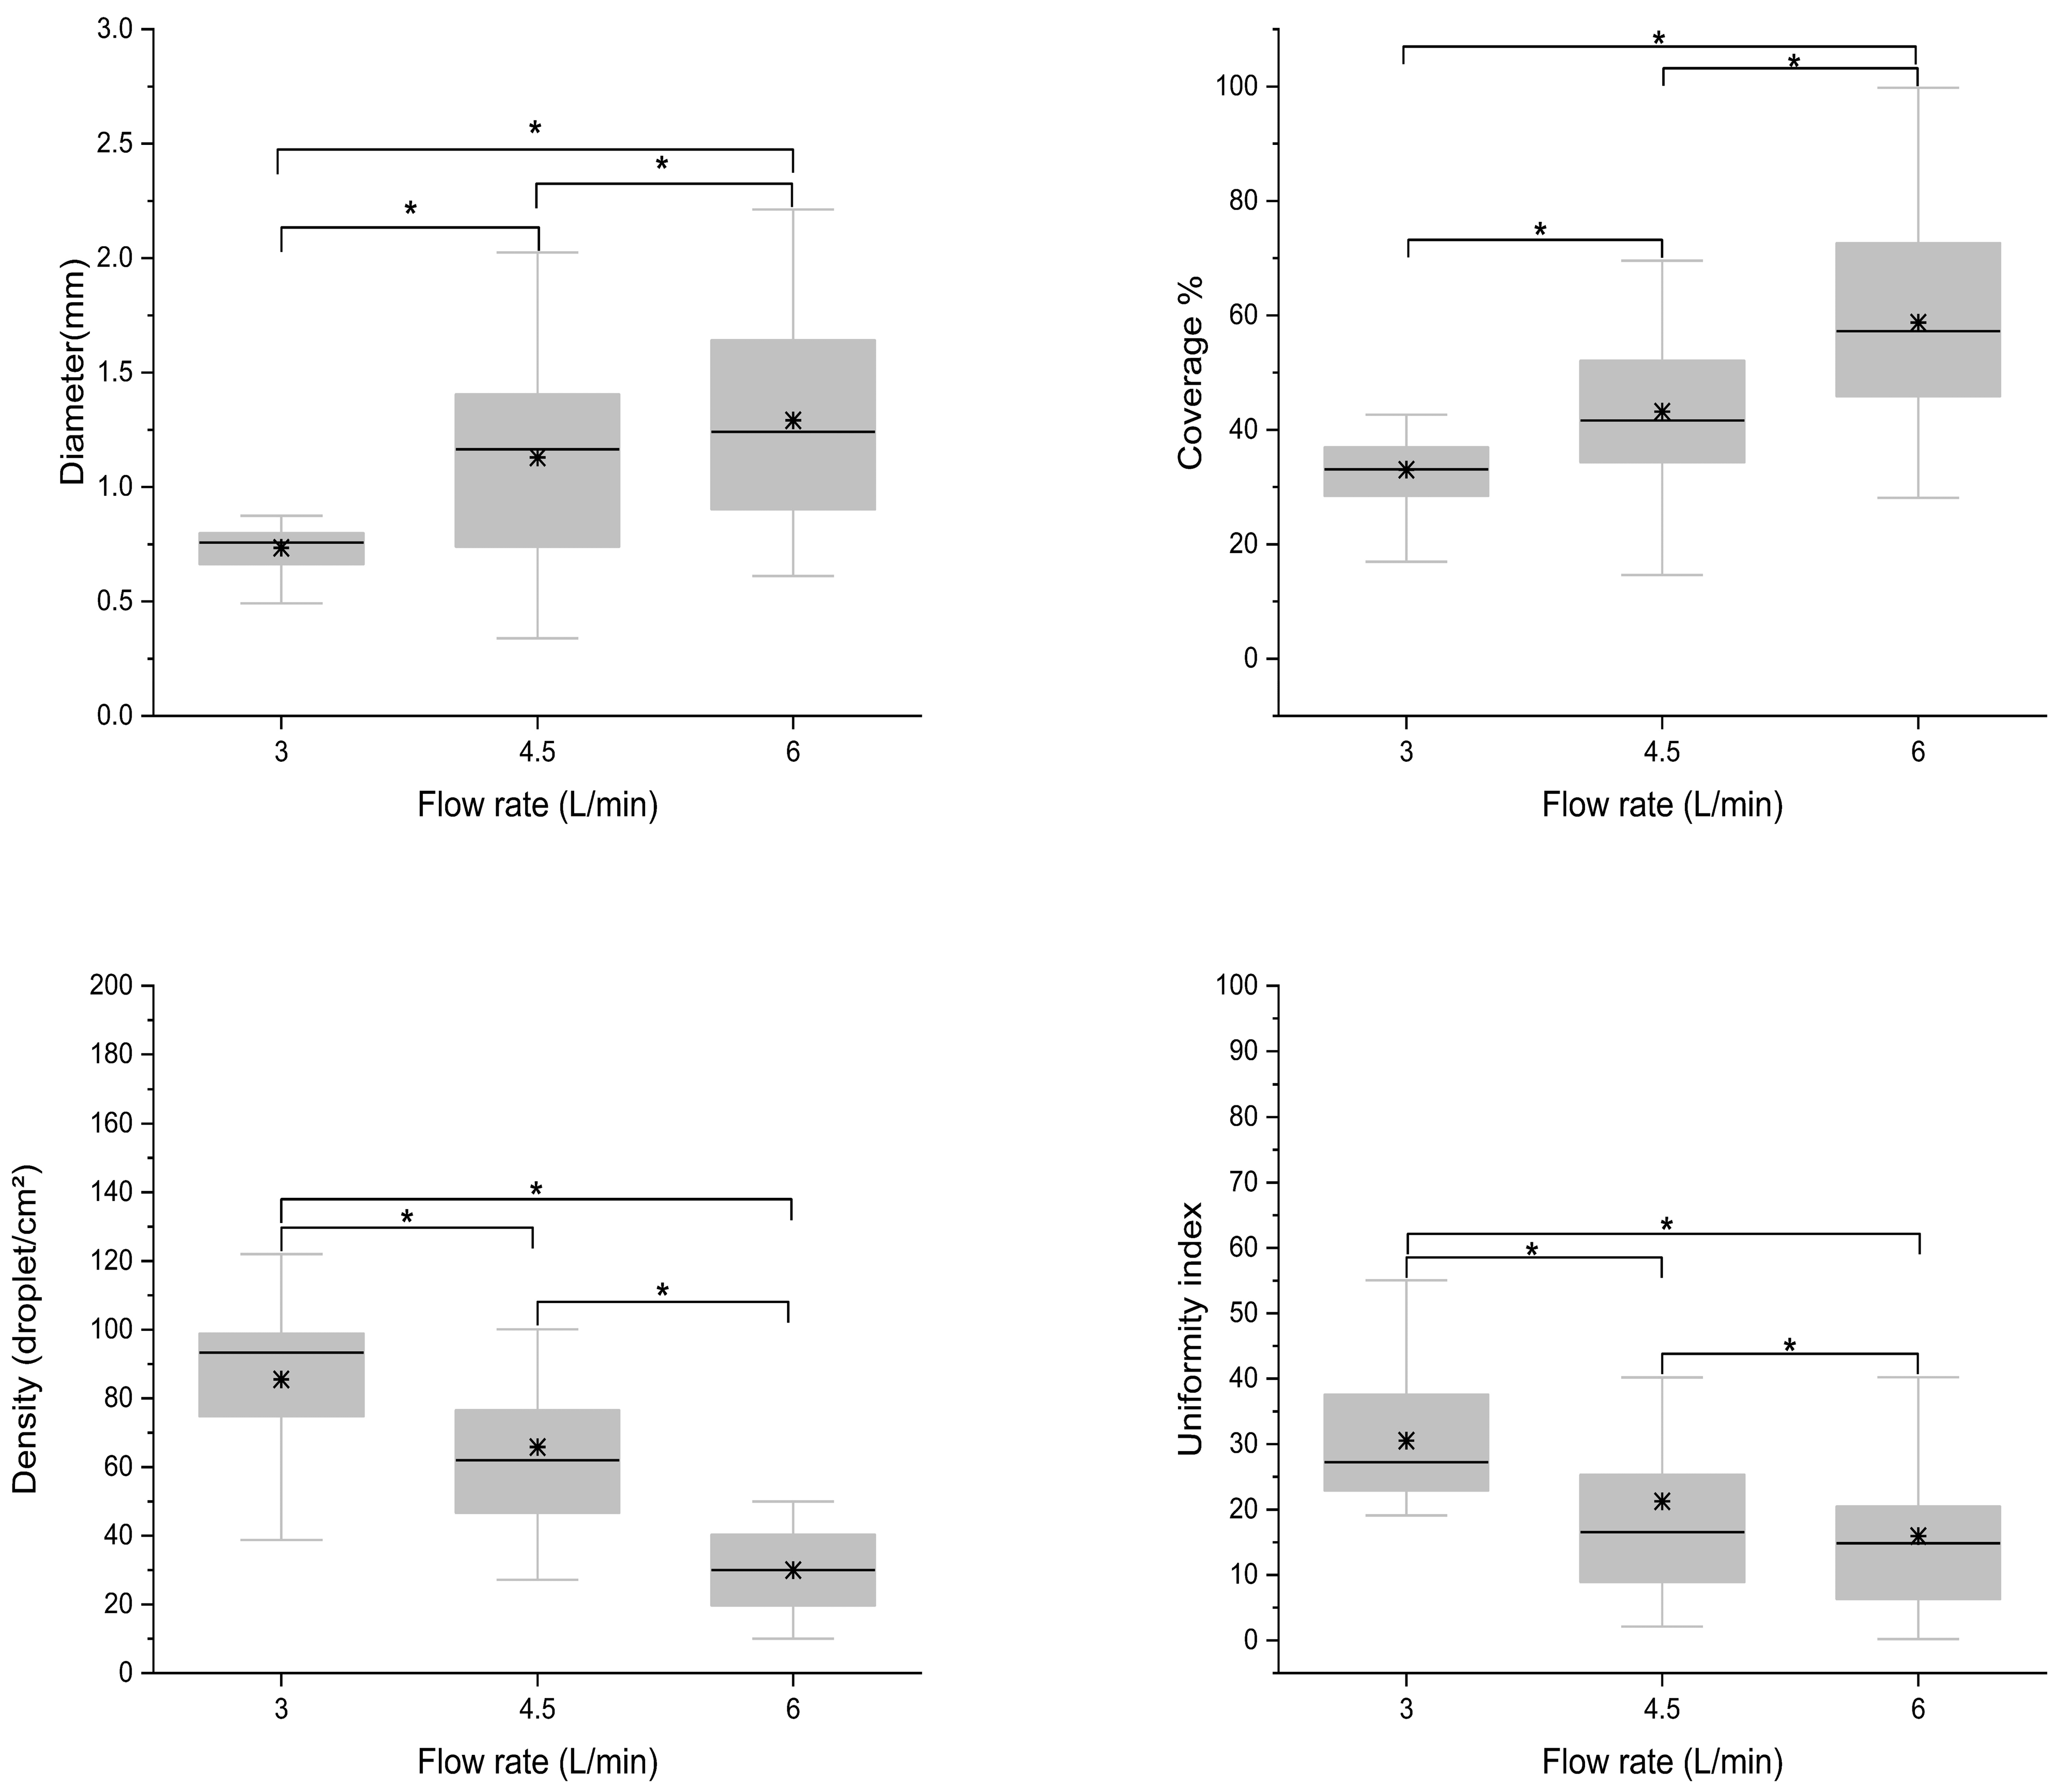
One-way ANOVA was performed using the statsmodels library in Python 3.7 to analyze the effect of varied flow rates on spray performance for each of the following parameters: coverage area, droplet diameter, density, and uniformity index. Before analysis, ANOVA assumptions were verified using the Shapiro–Wilk test for normality of residuals and Levene’s test for homogeneity of variances. Mean ± standard deviation (SD) values were calculated for each flow rate. The asterisks (*) indicate statistically significant differences between treatments based on Tukey’s HSD test (Table 1).

3. Results and Discussion

3.1. Validation of Image-Processing Technique for Spray Distribution on WSP

The spray patterns on the WSP were analyzed through the application of an image-processing technique. Numerous studies have validated the application of image processing for the quantitative assessment of spraying patterns on WSP in agriculture [26,28]. The image-processing technique has been reported to provide robust results over large datasets, even with extensive droplet overlap, enabling reliable spray performance assessment. Moreover, comparisons between commercial and experimental software have repeatedly shown that image-based analyses produce mean errors of less than 15 percent of those observed in manual methods, hence offering both precision and repeatability [22]. This technique was used to accurately quantify spray parameters, such as coverage area, droplet diameter, density, and uniformity index. One-way ANOVA results demonstrated that the flow rate significantly influences all these measured parameters. The statistically significant differences in the flow rate among treatments, indicated by a p-value that is significantly below 0.05, show that the analyzed parameters are quite sensitive to changes in flow rates (Table 1). These findings confirm that varying the flow rate has a strong impact on the spray performance parameters measured in this study. The ability to detect clear differences across treatments validates the technique as a reliable tool for spray performance analysis.

3.2. Comparative Evaluation of Spray Performance

The WSP samples were examined using the image-processing technique, and the droplet coverage area was discovered to vary notably with the flow rate. As the flow rate increased from 3 L/min to 6 L/min, the spray coverage area on the WSP samples increased. The surface was only 33% covered at a flow rate of 3 L/min, indicating limited surface wetting, which may lead to insufficient irrigation in the aeroponic system. At 4.5 L/min, 43% of the WSP samples were covered, while the highest flow rate resulted in nearly 59% coverage (Figure 5). The observed trend implies that higher flow rates deliver a larger amount of nutrient solution, allowing droplets to be distributed more widely across the WSP. A high percentage of droplet coverage in the aeroponic system helps maintain surrounding air moisture, enabling the plant to absorb the necessary nutrients.
The size of droplets that emerge from the atomizer to a substantial extent determines the degree to which oxygen and nutrients are effectively distributed to plants. The average droplet diameters observed by analyzing images of the WSP samples were 0.73 mm, 1.13 mm, and 1.29 mm with respect to the three different flow rates (Figure 5). This result indicates that the droplet size increases as the flow rate increases. The droplets rapidly impact the surface, where many merge to form larger droplets, resulting in an overestimation of droplet size in the image analysis. Due to overlapping, the image analysis technique still interprets a group of coalesced droplets as one large droplet. The droplets with an average size of 1.13 mm are beneficial for the aeroponic system. Because small droplets have a high surface area-to-volume ratio, the mist can effectively cover the entire root system, ensuring that the plants remain well hydrated and receive sufficient nutrients.
The image analysis results showed that the droplet density decreases at higher flow rates, with the average values calculated as 85.53 droplets/cm2 at an average flow rate of 3 L/min, 55.00 droplets/cm2 at an average flow rate of 4.5 L/min, and only 30 droplets/cm2 at the highest average flow rate of 6 L/min. This indicated that lower flow rates promote the accumulation of droplets on the WSP surface, resulting in the more frequent formation of tiny droplets. At higher liquid volumes, many droplets come into contact and merge in the same area, which lowers the total number of droplets needed to cover the same space (Figure 5). At high flow rates, uneven watering could occur, and in certain spots, plants could be flooded, which could result in harm. To ensure uniform moisture in the root system, the aeroponic system should be operated with a high droplet density. Consequently, ensuring appropriate droplet density is important for mist delivery in aeroponic systems.
The analysis of the WSP images revealed that the uniformity index decreased as the flow rate increased. The average uniformity indices were 30.53, 21.27, and 15.95 for the lowest, intermediate, and highest flow rates, respectively. This trend suggests that droplets were distributed more unevenly at high flow rates. These results suggest that increasing the flow rate while enhancing overall coverage simultaneously promotes droplet clustering due to a greater liquid volume per unit area, resulting in less uniform deposition across the surface. This clustering can create localized areas of excessive wetting and dry patches, potentially impairing uniform nutrient absorption and plant root hydration. The lowest uniformity index value at the highest flow rate pointed to a high occurrence of droplet accumulation, forming clusters on the surface (Figure 5). Because the roots do not receive uniform hydration via an even pattern, the plant may experience difficulties in properly absorbing nutrients. As a result, this trend corresponds to fewer areas being covered by droplets and confirms that higher flow rates cause droplets to be more densely packed in certain zones. Considering droplet diameter, spray coverage, density, and uniformity, a flow rate of 4.5 L/min provides the best overall performance for aeroponic systems. Figure 6 shows the effect of different flow rates on spray performance parameters. The graphs, created using OriginPro 2025b, include boxplots with whiskers that reflect variability in the measurements. Smaller ranges indicate less variation among the measurements for each treatment, reflecting greater consistency in the observed data.

4. Limitations and Future Directions

Flow rate was manually adjusted using a valve, which resulted in occasional fluctuations in the actual flow rate. At times, the flow exceeded or fell below the intended fixed value, resulting in variability in the spray conditions. A more accurate evaluation of the spray performance would necessitate an automated flow rate control system to maintain a consistent and stable flow throughout the experiment.
WSP samples were scanned using a smartphone, which does not necessarily produce images of standard quality. This inconsistency can affect the precision of measurements related to the droplet stain characteristics and ultimately compromise the accuracy of the spray analysis. In the future, it would be necessary to overcome this limitation by using controlled lighting and dedicated scanners to enhance the quality of WSP images, ensuring that they are produced according to the same specifications [29].
When the spray coverage on WSP becomes too high, many droplets are positioned very close to each other or even overlap. This makes it difficult for the algorithm to identify and separate individual droplets correctly. As a result, the algorithm may fail to detect all droplets or incorrectly estimate their size and position. Solving this problem would require further data, such as the initial droplet coordinates and the direction of the nozzles. This issue could be addressed by applying deep learning-based methods such as Mask R-CNN or YOLO to improve the detection and separation of overlapping droplets. These approaches have accomplished similar image segmentation tasks with high accuracy under dense and occluded conditions [30].

5. Conclusions

This study demonstrated the effectiveness of using water-sensitive paper (WSP) in quantitatively analyzing spray performance in aeroponics at different flow rates. The use of image processing and statistical analysis revealed significant differences in spray parameters, including droplet coverage area, size, density, and uniformity, across the various flow rates evaluated (3, 4.5, and 6 L/min). The results conclusively indicated that as flow rates increase, the average diameter and coverage area increase, while droplet density declines. These variations directly influence the uniformity and effectiveness of the supply of nutrients to plant roots, suggesting that optimizing spray parameters is a crucial aspect of aeroponic cultivation. Overall, 4.5 L/min is recommended as the optimal flow rate, balancing coverage, droplet size, density, and uniformity for efficient aeroponic operations. The use of WSP, combined with image processing, provides an accurate and scalable approach for measuring and optimizing spray distributions. Our findings provide a solid basis for enhancing the homogeneity of root zone hydration and nutrient distribution, factors that contribute to overall system efficiency and support sustainable, high-yield vertical farming.

Author Contributions

Conceptualization, M.A.; methodology, M.A.; formal analysis, M.A.; writing—original draft preparation, M.A.; review and editing, Y.-H.S. and J.-M.P.; supervision, W.-J.C. and U.-H.Y.; project administration, W.-J.C. and U.-H.Y. All authors have read and agreed to the published version of the manuscript.

Funding

This study and the APC were funded by the International Cooperative Export-Oriented Agriculture Competitiveness Enhancement Technology Development Program, Ministry of Agriculture, Food and Rural Affairs, grant number RS-2025-02313370.

Data Availability Statement

The original contributions presented in this study are included in the article. Further inquiries can be directed to the corresponding authors.

Acknowledgments

The authors are grateful to the Department of Biosystems Engineering, Gyeongsang National University, for providing research facilities and support.

Conflicts of Interest

The authors declare no conflicts of interest.

References

  1. Wanapat, M.; Suriyapha, C.; Dagaew, G.; Matra, M.; Phupaboon, S.; Sommai, S.; Pongsub, S.; Muslykhah, U. Sustainable livestock production systems are key to ensuring food security resilience in response to climate change. Agric. Nat. Resour. 2024, 58, 537–546. [Google Scholar] [CrossRef]
  2. Alexandratos, N.; Bruinsma, J. World Agriculture Towards 2030/2050: The 2012 Revision; FAO: Rome, Italy, 2012. [Google Scholar]
  3. Qureshi, W.A.; Gao, J.; Elsherbiny, O.; Mosha, A.H.; Tunio, M.H.; Qureshi, J.A. Boosting Aeroponic System Development with Plasma and High-Efficiency Tools: AI and IoT—A Review. Agronomy 2025, 15, 546. [Google Scholar] [CrossRef]
  4. Shin, S.; Aziz, D.; El-Sayed, M.E.; Hazman, M.; Almas, L.; McFarland, M.; El Din, A.S.; Burian, S.J. Systems thinking for planning sustainable desert agriculture systems with saline groundwater irrigation: A review. Water 2022, 14, 3343. [Google Scholar] [CrossRef]
  5. Amjad, M.; Arulmozhi, E.; Shin, Y.-H.; Kang, M.-K.; Cho, W.-J. A Review of IoT and Machine Learning for Environmental Optimization in Aeroponics. Agronomy 2025, 15, 1627. [Google Scholar] [CrossRef]
  6. Kumar, P.; Jaisuriyan, K.; Gopika, B.; Subhash, B. Aeroponics: A Modern Agriculture Technology Under Controlled Environment. In Hydroponics: The Future of Sustainable Farming; Springer: Berlin/Heidelberg, Germany, 2024; pp. 263–294. [Google Scholar]
  7. NASA Spinoff. Progressive plant growing has business blooming. In Environmental and Agricultural Resources; NASA Spinoff: New York, NY, USA, 2006; pp. 64–77. [Google Scholar]
  8. Ramu, M.; Priya, R.M.; Priya, R.S. Aeroponics System and Its Methods. In Utilizing Aeroponics Techniques for Improved Farming; IGI Global Scientific Publishing: Hershey, PA, USA, 2025; pp. 1–28. [Google Scholar]
  9. Johnson, T.J. Aeroponic System Optimization for Butterhead Lettuce Growth and Future Sustainability Using Flow Blurring Atomization: An Overview. Beyond Undergrad. Res. J. 2025, 8, 11. [Google Scholar]
  10. Tang, L.; Syed, A.-u.-A.; Otho, A.R.; Junejo, A.R.; Tunio, M.H.; Hao, L.; Asghar Ali, M.N.H.; Brohi, S.A.; Otho, S.A.; Channa, J.A. Intelligent Rapid Asexual Propagation Technology—A Novel Aeroponics Propagation Approach. Agronomy 2024, 14, 2289. [Google Scholar] [CrossRef]
  11. Krishnan, G.; Cryer, S.A.; Turner, J.E.; Rajan, N.S. Spray atomisation in multiphase flows with reference to tank mixes of agricultural products. Biosyst. Eng. 2022, 223, 232–248. [Google Scholar] [CrossRef]
  12. Lakhiar, I.A.; Gao, J.; Xu, X.; Syed, T.N.; Chandio, F.A.; Jing, Z.; Buttar, N.A. Effects of Various Aeroponic Atomizers (Droplet Sizes) on Growth, Polyphenol Content, and Antioxidant Activity of Leaf Lettuce (Lactuca sativa L.). Trans. ASABE 2019, 62, 1475–1487. [Google Scholar] [CrossRef]
  13. Privitera, S.; Manetto, G.; Pascuzzi, S.; Pessina, D.; Cerruto, E. Drop size measurement techniques for agricultural sprays: A state-of-the-art review. Agronomy 2023, 13, 678. [Google Scholar] [CrossRef]
  14. Al-Mamury, M. Smart Electrostatic Crop Spraying Using Remote Sensing Technology; Brunel University London: Uxbridge, UK, 2015. [Google Scholar]
  15. Sassu, A.; Psiroukis, V.; Bettucci, F.; Ghiani, L.; Fountas, S.; Gambella, F. Unmanned aerial system plant protection products spraying performance evaluation on a vineyard. Precis. Agric. 2024, 25, 2082–2112. [Google Scholar] [CrossRef]
  16. Semenišin, M.; Steponavičius, D.; Kemzūraitė, A.; Savickas, D. Optimizing UAV spraying for sustainability: Different system spray drift control and adjuvant performance. Sustainability 2025, 17, 2083. [Google Scholar] [CrossRef]
  17. Lan, Y. Study on Aerial Spraying Control Effect and Efficacy. In Precision Agricultural Aviation Application Technology; Springer: Berlin/Heidelberg, Germany, 2025; pp. 393–445. [Google Scholar]
  18. Sies, M.; Madzlan, N.; Asmuin, N.; Sadikin, A.; Zakaria, H. Determine spray droplets on water sensitive paper (WSP) for low pressure deflector nozzle using image J. IOP Conf. Ser. Mater. Sci. Eng. 2017, 243, 012047. [Google Scholar]
  19. Qin, W.; Xue, X.; Zhang, S.; Gu, W.; Wang, B. Droplet deposition and efficiency of fungicides sprayed with small UAV against wheat powdery mildew. Int. J. Agric. Biol. Eng. 2018, 11, 27–32. [Google Scholar] [CrossRef]
  20. Chen, H.; Lan, Y.; Fritz, B.K.; Hoffmann, W.C.; Liu, S. Review of agricultural spraying technologies for plant protection using unmanned aerial vehicle (UAV). Int. J. Agric. Biol. Eng. 2021, 14, 38–49. [Google Scholar] [CrossRef]
  21. Prakash, D.C.; Narayanan, R.; Ganesh, N.; Ramachandran, M.; Chinnasami, S.; Rajeshwari, R. A study on image processing with data analysis. AIP Conf. Proc. 2022, 2393, 020225. [Google Scholar]
  22. Cunha, M.; Carvalho, C.; Marcal, A.R. Assessing the ability of image processing software to analyse spray quality on water-sensitive papers used as artificial targets. Biosyst. Eng. 2012, 111, 11–23. [Google Scholar] [CrossRef]
  23. Meng, Y.; Liu, X.; Chen, W.; Du, X.; Zhang, Y.; Sun, R.; Han, Y. Evaluation of droplet deposition parameters based on the Genetic-Otsu algorithm. PeerJ 2024, 12, e18036. [Google Scholar] [CrossRef] [PubMed]
  24. Simões, I.; Sousa, A.J.; Baltazar, A.; Santos, F. Spray quality assessment on water-sensitive paper comparing AI and classical computer vision methods. Agriculture 2025, 15, 261. [Google Scholar] [CrossRef]
  25. Özlüoymak, Ö.B.; Bolat, A. Development and assessment of a novel imaging software for optimizing the spray parameters on water-sensitive papers. Comput. Electron. Agric. 2020, 168, 105104. [Google Scholar] [CrossRef]
  26. Marçal, A.; Cunha, M. Image processing of artificial targets for automatic evaluation of spray quality. Trans. ASABE 2008, 51, 811–821. [Google Scholar] [CrossRef]
  27. Cerruto, E.; Manetto, G.; Privitera, S.; Papa, R.; Longo, D. Effect of image segmentation thresholding on droplet size measurement. Agronomy 2022, 12, 1677. [Google Scholar] [CrossRef]
  28. Yan, F.; Zhang, Y.; Zhu, Y.; Wang, Y.; Niu, Z.; Abdukamolovich, J.A. An Image Processing Based Approach to Assess the Quality of Pesticide Spray. Smart Agric. Technol. 2024, 8, 100460. [Google Scholar] [CrossRef]
  29. Wu, C.-L.; Yang, C.-K.; Lin, J.-Y. Water-sensitive paper detection and spray analysis. Multimed. Tools Appl. 2025, 84, 38797–38851. [Google Scholar] [CrossRef]
  30. Shengde, C.; Junyu, L.; Xiaojie, X.; Jianzhou, G.; Shiyun, H.; Zhiyan, Z.; Yubin, L. Detection and tracking of agricultural spray droplets using GSConv-enhanced YOLOv5s and DeepSORT. Comput. Electron. Agric. 2025, 235, 110353. [Google Scholar] [CrossRef]
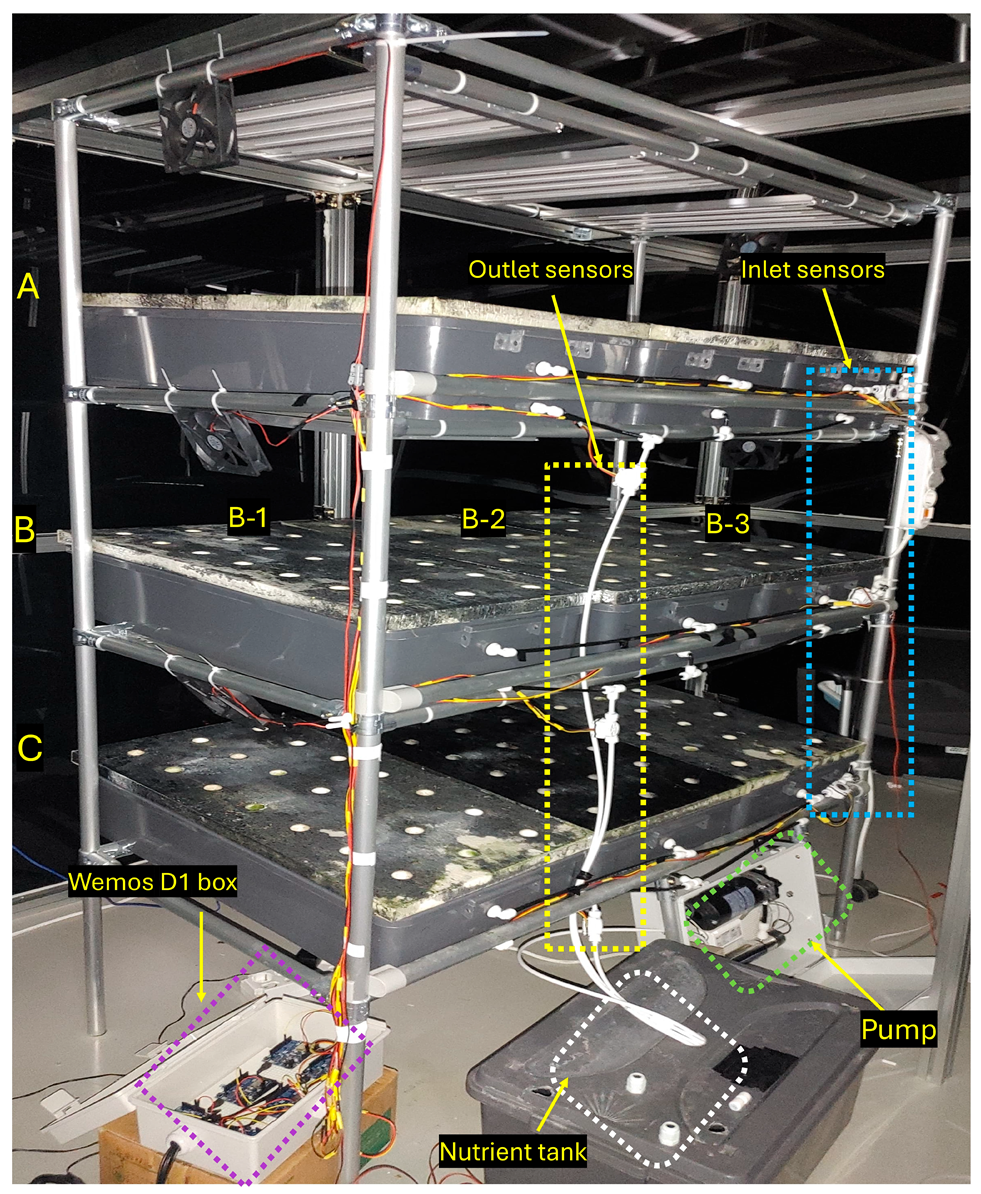
Figure 1. Experimental setup for aeroponic measurements. The system consisted of three levels: A, B, and C, representing the upper, middle, and lower trays of the aeroponic chamber, respectively. On the middle level (B), three trays were designated as B-1, B-2, and B-3 for individual measurements.
Applsci 15 10928 g001
Figure 2. Schematic diagram of aeroponic spray evaluation using water-sensitive paper, showing nozzle layout, nutrient mist, and planting holes. Numbers 1–21 indicate the planting holes on the growing tray (B-1), where 12 selected positions were used for WSP placement during droplet measurement.
Applsci 15 10928 g002
Figure 3. Flow chart of the image processing and analysis process.
Applsci 15 10928 g003
Figure 4. Validation of the image-processing technique for droplet detection on water-sensitive paper. (a) Original image of spray droplets on water-sensitive paper, (b) Processed image showing detected droplets outlined by bounding boxes.
Applsci 15 10928 g004
Figure 5. Binary segmented water-sensitive paper images showing spray patterns at flow rates of 3, 4.5, and 6 L/min. Each row presents representative images with summarized average droplet diameter, coverage area, density, and uniformity index, illustrating variations in spray performance with flow rate.
Applsci 15 10928 g005
Figure 6. Boxplot analysis of spray performance parameters at the different flow rates (3, 4.5, and 6 L/min). The central horizontal line in the boxplots is the median, the box represents the interquartile range, the whiskers indicate the minimum and maximum values, and the cross symbol (×) is the mean. The asterisks (*) indicate statistically significant differences between treatments (* p < 0.05).
Applsci 15 10928 g006
Table 1. ANOVA results for determining the effect of the flow rate on spray parameters. (*) indicates significant differences.
Dependent VariableFlow Rate (L/min)Mean ± SDF-Valuep-ValueSignificance
Coverage Area (cm2)333.02 ± 8.8327.07<0.05*
4.543.17 ± 15.61
658.71 ± 18.59
Droplet Diameter (mm)30.73 ± 0.1323.20<0.05*
4.51.12 ± 0.41
61.29 ± 0.44
Droplet Density (drops/cm2)385.53 ± 20.3136.71<0.05*
4.555.03 ± 41.44
630.00 ± 12.04
Uniformity Index330.53 ± 9.4111.71<0.05*
4.521.27 ± 16.77
615.95 ± 11.50
Disclaimer/Publisher’s Note: The statements, opinions and data contained in all publications are solely those of the individual author(s) and contributor(s) and not of MDPI and/or the editor(s). MDPI and/or the editor(s) disclaim responsibility for any injury to people or property resulting from any ideas, methods, instructions or products referred to in the content.