Article

Low-Carbon Economic Collaborative Scheduling Strategy for Aluminum Electrolysis Loads with a High Proportion of Renewable Energy Integration

School of Electric Power, Inner Mongolia University of Technology, Hohhot 010080, China
*
Authors to whom correspondence should be addressed.
Appl. Sci. 2025, 15(20), 10919; https://doi.org/10.3390/app152010919
Submission received: 5 September 2025 / Revised: 3 October 2025 / Accepted: 9 October 2025 / Published: 11 October 2025

Abstract

In response to the challenges faced by high-energy-consuming enterprises in utilizing renewable energy and implementing low-carbon operations, this paper proposes a multi-objective optimization strategy based on source–storage–load collaborative scheduling. The strategy establishes a refined model of aluminum electrolysis load, thoroughly considering the coupling relationship between temperature, production output, and power consumption. Additionally, it develops a dynamic coupling model between multi-functional crane loads and aluminum electrolysis production to reveal the influence mechanism of auxiliary equipment on the main production process. Based on this foundation, this paper constructs a multi-objective optimization model that targets the minimization of operating costs, the minimization of carbon emissions, and the maximization of the renewable energy consumption rate. An improved heuristic intelligent optimization algorithm is employed to solve the model. The simulation results demonstrate that, under a renewable energy penetration of 67.8%, the proposed multi-objective optimization strategy achieves a maximum reduction in carbon emissions of 1677.35 t and an increase in renewable energy consumption rate of 12.11%, compared to the conventional single-objective economic optimization approach, while ensuring the stability of aluminum electrolysis production. Furthermore, when the renewable energy penetration is increased to 76.2%, the maximum reduction in carbon emissions reaches 8260.97 t, and the renewable energy consumption rate is improved by 18.86%.

1. Introduction

According to the International Energy Agency (IEA) report [1], renewable energy generation accounted for over 32% of global electricity production in 2024. In China, as the world’s largest energy consumer, solar photovoltaic and wind power contributed nearly 20% of total power generation. However, wind and solar curtailment issues persist. Energy-intensive industries consumed more than 2 trillion kWh of electricity, accounting for approximately 20% of the country’s total industrial electricity consumption [2]. These challenges have prompted the “14th Five-Year Plan for Renewable Energy Development” [3] to propose the construction of dedicated power supply lines and self-supplied power stations in industrial parks and other areas [4], promoting the replacement of coal-fired power plants with green electricity. However, the contradiction between rigid electricity demand and fluctuating supply has exacerbated the power supply–demand imbalance in remote areas, constraining both clean energy development and the efficiency of energy-intensive enterprises, necessitating urgent exploration of effective solutions for synergistic optimization between these two aspects [5].
In recent years, research on wind and solar energy integration in industrial parks has evolved from fundamental principles to system-level integration. The authors of Ref. [6] systematically analyzed the spatiotemporal characteristics of wind–solar complementarity, laying a theoretical foundation for subsequent modeling. The authors of Ref. [7] integrated advanced independent models from wind and photovoltaic fields, significantly enhancing the accuracy and applicability of wind–solar hybrid power station generation modeling. The authors of Ref. [8] introduced energy storage systems and, using LEAP and NEMO models, verified the comprehensive advantages of energy storage under new policy scenarios and high wind–solar capacity scenarios in terms of storage efficiency, carbon reduction, and cost savings. The authors of Ref. [9] developed a wind–solar–hydrogen energy system model, thereby optimizing system economy and renewable energy utilization rates. However, these strategies primarily focus on source-side analysis, with insufficient attention to load-side adjustability.
Domestically and internationally, studies on adjustable loads participating in wind–solar energy integration have been conducted [10]. As a typical high-energy-consumption industrial load, the aluminum electrolysis sector accounts for approximately 7% of China’s total industrial electricity consumption [11]. Recent studies indicate that, under the premise of ensuring production stability, aluminum electrolysis loads exhibit certain frequency regulation potential [12]. Empirical research [13] demonstrates that electrolysis cells show significant load flexibility, adjustable upward by 5–10% and downward by 25–30% from the rated operating point. The authors of Ref. [14] construct scheduling models that incorporate aluminum electrolysis loads as key subjects, proposing day-ahead and intra-day joint economic scheduling methods to reduce power system operation costs. The authors of Ref. [13] establish a layered optimization model for aluminum electrolysis loads combined with peak regulation and deep thermal power regulation, aiming to minimize system wind curtailment and operating costs. The authors of Refs. [15,16,17] propose a source–load collaborative optimization configuration model considering aluminum electrolysis load demand response, with the goal of minimizing the construction costs of renewable energy stations and the operating costs of industrial park power systems.
However, existing research has significant limitations, failing to fully balance multi-dimensional constraints, especially in high-proportion renewable energy scenarios, which may result in insufficient energy absorption rates and carbon emission rebounds. At the same time, the advanced nature of three-objective algorithms has been widely recognized; for example, the authors of Ref. [18] introduce the NSGA-III algorithm in bridge network maintenance, compared with NSGA-II, to construct an optimization model that balances performance, cost, and low carbon; the authors of Ref. [19] proposed a three-level energy management system based on a multi-objective grey wolf optimization algorithm for optimizing AC/DC hybrid microgrids with renewable energy and hydrogen equipment, aiming to achieve optimal balance among cost, renewable energy utilization rate, and carbon emissions; the authors of Ref. [20] propose a three-objective smart grid optimization model integrating hybrid demand response, renewable energy, and energy storage, solved using algorithms such as NSGA-II, and demonstrating superior performance compared to other algorithms.
In the aluminum electrolysis industrial parks in western remote regions, these parks are adjacent to abundant hydropower, wind, and photovoltaic resources, presenting opportunities for renewable energy utilization while bearing the responsibility for promoting regional energy transition. In these areas, constructing an optimization framework that integrates coordinated scheduling of main and auxiliary equipment and balances the three-dimensional objectives of economy, environment, and renewable energy absorption rates not only pertains to enterprise sustainable development but also supports regional energy structure optimization and ecological civilization construction.
This paper aims to address the aforementioned limitations through three key innovations:
(1)
Focusing on the power regulation capability of aluminum electrolysis, a refined coupling model of aluminum electrolysis load considering operational stability constraints was constructed, a dynamic constraint system for the aluminum electrolysis production process was established, and the stability boundaries under different regulation depths, rates, and durations were quantified.
(2)
This research proposes the dynamic response relationship between electrolytic cell power regulation and multi-functional overhead crane operating characteristics, establishes a dynamic coupling model between electrolytic cells and multi-functional crane operating characteristics, and achieves coordinated scheduling optimization of primary and auxiliary equipment.
(3)
Based on three key perspectives—the adjustable load characteristics of aluminum electrolysis, abundant renewable energy resources, and national energy transition strategy—this research develops a three-objective optimization strategy for source–storage–load coordinated scheduling in aluminum electrolysis parks under different renewable energy penetration rates.
In summary, the multi-objective collaborative optimization strategy proposed in this study not only helps improve renewable energy utilization in remote areas and reduce “wind and solar curtailment” ratios but also enhances the economic benefits and environmental performance of high-energy-consuming enterprises.

2. Adjustable Characteristics of Aluminum Electrolysis Loads

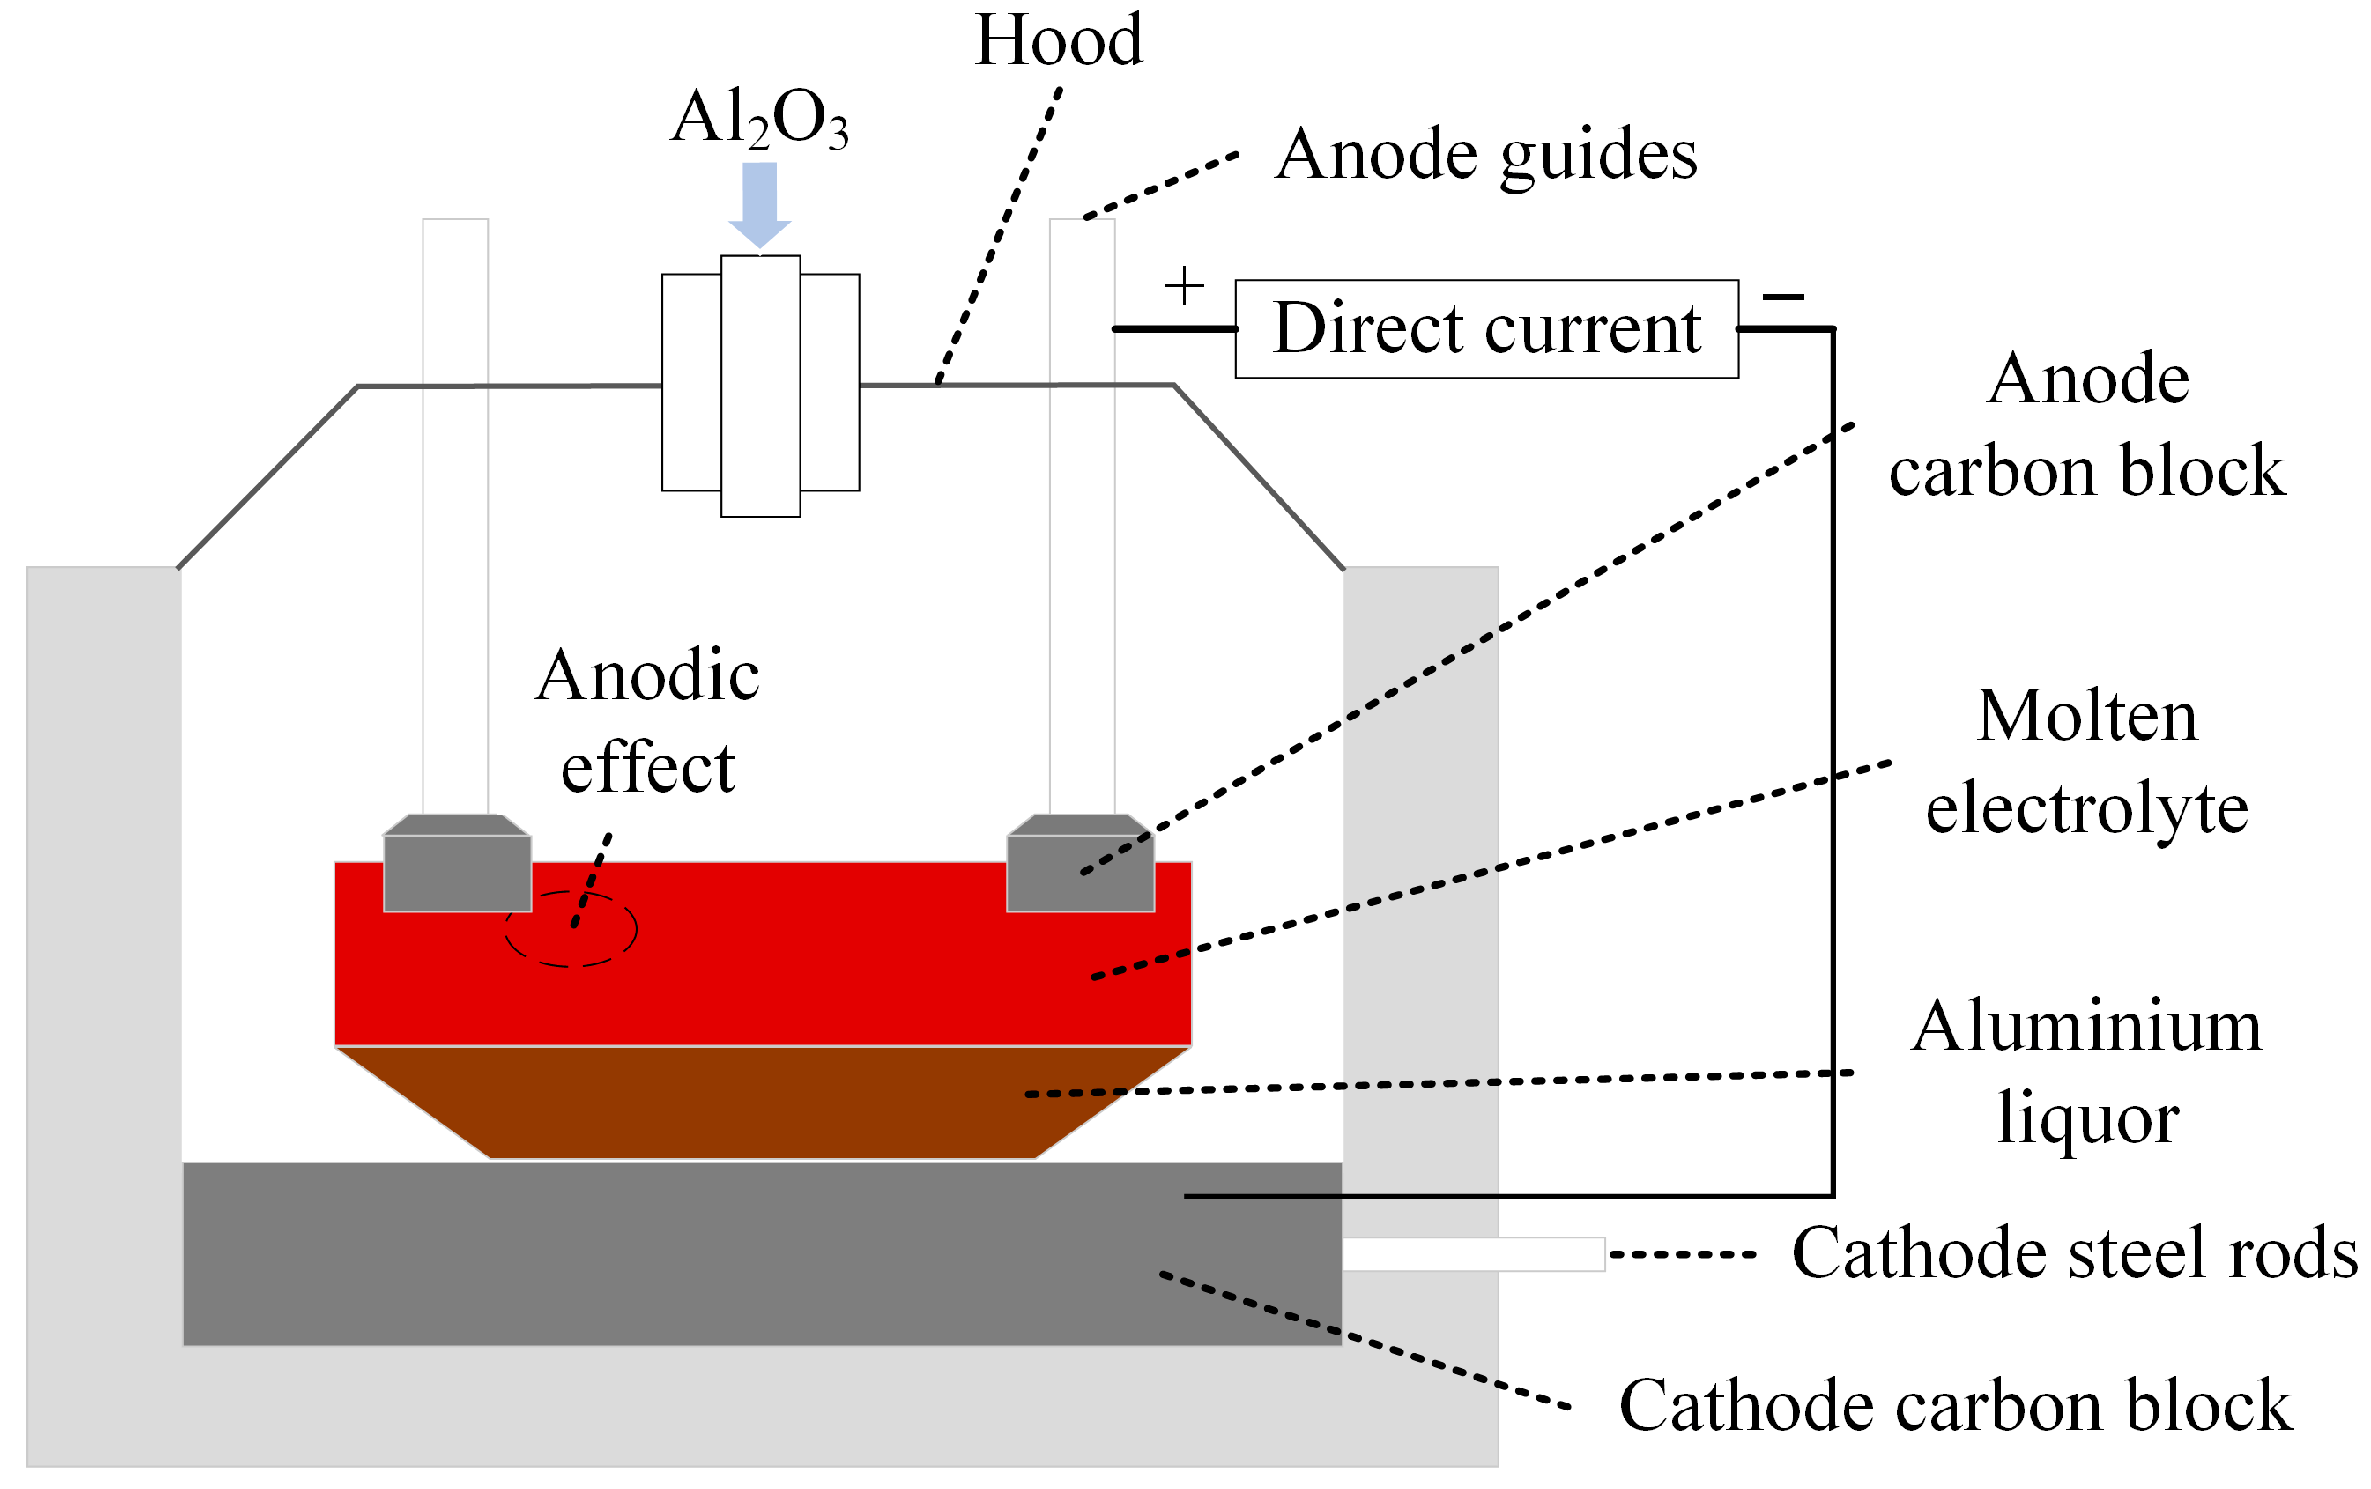
Aluminum electrolysis production [21] is a high-energy-consuming industry that employs the cryolite–alumina molten salt electrolysis method. This process primarily involves converting bauxite into alumina, which is then used to produce primary aluminum through high-temperature molten salt electrolysis. Throughout the production process, alumina serves as the electrolyte raw material, while cryolite functions as the solvent. Various raw and auxiliary materials, including alumina and fluoride salts, are fed into the electrolytic cell [22]. Alumina dissolves in the molten cryolite to form a homogeneous melt with excellent electrical conductivity. The production process utilizes carbon materials for both the cathode and anode. When direct current is applied, electrochemical reactions occur at both electrodes. At the anode, anode gases are produced, containing CO2, CO, and small amounts of fluorides, which require treatment through a dry purification system (using alumina to adsorb fluorides) to prevent environmental pollution. At the cathode, liquid aluminum is deposited at the bottom of the electrolytic cell and is periodically extracted using vacuum ladles, then sent to the casting plant to produce aluminum ingots for remelting. The specific production process is illustrated in Figure 1, and the aluminum electrolytic cell model is shown in Figure 2.
During aluminum electrolysis production, auxiliary equipment load fluctuations exhibit significant correlation with electrolysis series loads, with multi-functional overhead cranes demonstrating particularly pronounced coupling characteristics. As critical material handling equipment in the electrolysis workshop, crane operational loads present a high positive correlation with electrolysis series loads. When the series current undergoes adjustment, the crane’s operational parameters—including frequency, runtime, and transportation intensity—correspondingly transform, primarily manifesting in raw material transportation, anode replacement, and product logistics. Research substantiates that when electrolysis cell loads fluctuate within the 5–30% range [13], multi-functional crane loads dynamically adjust within a corresponding interval, with load variation curves demonstrating near-synchronous alignment with electrolysis series load variations. This auxiliary equipment load coupling characteristic unveils the systemic nature of aluminum electrolysis production systems, providing novel perspectives and methodological entry points for subsequent load regulation model research.
(1)
Power Constraints
To ensure the safety and stability of aluminum electrolysis production, power adjustments of aluminum electrolysis loads must remain within specified limits [23]:
P j , t , min al P j , t al P j , t , max al
I min I l , t I max
P j , t al = U l I l , t
where P j , t al represents the power of aluminum electrolysis load j at time t ; P j , t , max al and P j , t , min al represent the maximum and minimum values of aluminum electrolysis power, respectively; I max and I min are the upper and lower limits of current allowed to pass through the electrolytic cell; U l is the series voltage of the electrolytic cell; and I l , t represents the current intensity passing through the electrolytic cell series l at time t .
(2)
Temperature and Power Coupling Constraints
A certain magnitude of power variation will not cause serious damage to the thermal balance of aluminum electrolysis loads. When the power of an aluminum electrolysis load changes Δ P j , t al , the temperature also changes accordingly. The relationship between temperature change and power change can be expressed by the following formula [15]:
T j , t al T j , t 1 al = P j , t al P j , t 1 al Δ t c al m al
T min al T j , t al T max al
where c al and m al represent the specific heat capacity coefficient and mass of the electrolyte, respectively; Δ T al is the temperature change of the electrolytic cell; T j , t al represents the production temperature of the aluminum electrolysis load j ; and T min al and T max al are the upper and lower temperature limits of the aluminum electrolysis load, generally set at 970 °C and 940 °C [24], respectively.
(3)
Adjustable Time Constraints
In the production adjustment process of aluminum electrolysis loads, there are three states: power holding state, power up-regulation state, and power down-regulation state. It is assumed that within a day, the power of the electrolytic cell fluctuates around a reference power. The adjustable time for aluminum electrolysis loads can be expressed as follows [16]:
t adj , up i c al m al T max a l T j , rated P j , t al P j , rated al
t adj , down k c al m al T j , rated T min a l P j , rated al P j , t al
where t adj , up i is the time for the i-th upward adjustment of the power of the aluminum electrolysis load; t adj , down k is the time for the k-th downward adjustment of the power of the aluminum electrolysis load; T j , rated is the rated temperature of the aluminum electrolysis load; and P j , rated al is the rated power of the aluminum electrolysis load.
The constraints for the upward and downward adjustment times over the entire cycle can be expressed as follows [16]:
t = 1 T t adj , up i T up max
t = 1 T t adj , down k T down max
where T up max is the maximum allowable time for upward power adjustments and T down max is the maximum allowable time for downward power adjustments.
(4)
Operational State Constraints
In the different operational phases of the aluminum electrolysis load, there must be a certain time interval between transitions [13]. For a series of electrolytic cells, the various adjustment phases, aside from normal operation, cannot switch continuously without a defined delay.
γ j , t 1 adj + γ j , t adj = 1
γ j , t adj + γ j , t keep = 1
where γ j , t adj represents the adjustable state (0/1), and γ j , t keep represents the rated state (0/1), where a value of 1 indicates “yes” and a value of 0 indicates “no.” Therefore, there is a unique state constraint at time t .
(5)
Temperature and Efficiency Constraints
During normal operation, aluminum electrolysis loads have a rated current efficiency of approximately 94%. However, when the aluminum electrolysis load participates in system peak shaving optimization, power adjustments lead to temperature changes, which directly affect the current efficiency of the electrolytic cell. Relevant studies have confirmed that for every 10 °C decrease in the temperature of the electrolytic cell, the current efficiency increases by 1% to 1.5% [25]. Therefore, the production efficiency can be expressed as follows:
η j , t al = η j , N al k i T j , t al T j , N al
where η j , t al represents the rated current efficiency of the aluminum electrolysis load j ; T j , N al is the rated temperature for the production of aluminum electrolysis load j ; and k i is the ratio of current efficiency variation with temperature.
(6)
Coupling Between Current Efficiency of Aluminum Electrolytic Cells and Alumi-num Production
An aluminum electrolysis production series consists of dozens to hundreds of electrolytic cells connected in series, and the total production is the sum of the outputs from each cell. The production constraint is as follows [16]:
M j , t al = n j , al K al I j , t al η j , t al Δ t
M j , N al = t = 1 T M j , t al
where M j , N al represents the total rated aluminum production of aluminum electrolysis load j within the scheduling period T ; n j , al is the number of electrolytic cells for aluminum electrolysis load j ; and K al is the electrochemical equivalent of aluminum, measured in g/(A·h), and is generally taken to be 0.3356.
(7)
Coupling Constraints between Multi-functional Gantry Crane Load and Aluminum Production
The multifunctional crane is the core production service equipment that integrates six functions: “shell breaking, material feeding, anode changing, aluminum extraction, slag removal, and lifting.” When considering only the electrolysis process, the multifunctional crane [26], as a representative adjustable auxiliary device, accounts for 5% of the total electricity load. By directly linking the power changes of the multifunctional crane to aluminum production, the model can more accurately reflect the dynamic changes in energy consumption during the actual production process, rather than simplifying the auxiliary equipment. Within the aluminum electrolysis plant, the formula for the material handling tasks of the multifunctional crane is as follows [27]:
M Al 2 O 3 ( t ) = M j , t al k Al 2 O 3 ξ Al 2 O 3 ( t )
M anode ( t ) = M j , t al k anode ξ anode ( t )
M metal ( t ) = M j , t al ξ metal ( t )
M spent ( t ) = M anode ( t τ anode ) ξ spent ( t )
where M Al 2 O 3 ( t ) represents the amount of alumina transported per unit time, M anode ( t ) is the amount of anode replaced per unit time; M metal ( t ) is the amount of aluminum liquid extracted from the cell per unit time; M spent ( t ) is the amount of residual pole transport per unit time; k i is the basic consumption coefficient for material i ; ξ i ( t ) is the consumption correction coefficient for material i during power changes; and τ a n o d e is the anode usage cycle (typically 28–30 days).
Based on the previous analysis, the power demand of the multifunctional crane mainly comes from two components: the no-load power demand (the power required for the crane’s movement) and the load power demand (the additional power required for lifting and transporting materials). The power calculation formula for the multifunctional crane is as follows [28]:
P crane ( t ) = P idle + t = 1 T i γ i M i ( t ) f i ( t )
where P idle represents the no-load power of the multifunctional crane, γ i is the unit handling power coefficient for material i , M i ( t ) is the weight of material i transported per unit time, and f i ( t ) is the function representing the handling frequency of material i per unit time.

3. Coordinated Optimization Model for the Source–Load of Aluminum Electrolysis Load

3.1. System Architecture

This study focuses on industrial parks characterized by aluminum electrolysis enterprises, where electricity mainly comes from self-owned power plants, wind farms, and photovoltaic stations, as well as interconnection lines established between the park and the external power grid. The load side comprises aluminum electrolysis loads, multi-functional crane loads, and other auxiliary loads. To enhance renewable energy absorption and reduce operational costs, the industrial park has developed a multi-tiered electricity demand response regulation mechanism: aluminum electrolysis loads are dynamically adjusted according to wind and solar output fluctuation intervals, with captive power plants prioritizing output reduction or shutdown when renewable generation meets load demands under stable operating conditions. Energy storage systems perform flexible regulation, providing support when load demands cannot be immediately met by wind, solar, or thermal generation, and charging during excess renewable energy generation. The external grid serves as a backup power source during insufficient renewable and storage generation, with the potential for electricity sales when renewable generation is abundant and energy storage is fully charged. The source–storage–load coordinated dispatch architecture for aluminum electrolysis industrial parks is illustrated in Figure 3.

3.2. Objective Function

3.2.1. Objective Function 1

The total cost, which consists of the operating costs of the self-owned power plants, wind turbines, photovoltaics, and energy storage devices of the aluminum electrolysis enterprise, as well as the adjustment costs for scheduling loads and the interaction costs with the higher-level power grid, is minimized as Objective Function 1.
min f 1 = C op , re + C op , the + C op , al + C op , crane + C op , storage + C op , ex
where C op , re represents the operating cost of renewable energy units, C op , the is the operating cost of thermal power units, C op , al is the adjustment cost for aluminum electrolysis loads, C op , crane is the adjustment cost for the multifunctional crane, C op , storage is the operating cost of energy storage, and C op , ex is the cost of power exchange with the grid.
(1)
Operating Cost of Renewable Energy Units
C op , re = t = 1 T c op pv P pv t + c op wt P wt t
where c op pv , c op wt represent the operating costs of photovoltaic and wind power units, respectively, while P pv t and P wt t denote the grid-connected power of the photovoltaic station and wind farm during time period t .
(2)
Operating Costs of Thermal Power Units
The operating cost of the self-owned power plant in the aluminum electrolysis park, which consists of thermal power units, is made up of the coal consumption cost and the startup and shutdown costs of the thermal power units.
C op , the = t = 1 T k Ω the [ a k ( P the , k t ) 2 + b k P the , k t + c k ] + t = 1 T k Ω the q = 1 n the , k [ ζ the , k , q t ( 1 ζ the , k , q t 1 ) C k start + ζ the , k , q t ( 1 ζ the , k , q t 1 ) C k stop ]
where a k , b k , and c k are the operating cost coefficients for the k-th type (referred to as type k ) of thermal power units; C k start and C k stop represent the startup and shutdown costs for the k-th type of thermal power unit, respectively; P the , k t is the total output of the k-th type of thermal power unit during time period t ; ζ the , k , q t is a binary variable indicating the operational status of the thermal power unit, where ζ the , k , q t = 1 indicates that the unit of type k is in operation during time period t , and ζ the , k , q t = 0 indicates that it is shut down; n the , k is the number of units of type k ; and Ω the is the set of thermal power unit types.
(3)
Adjustment Cost of Aluminum Electrolysis Load
C op , al = t = 1 T c al Δ P j , t al
where c al represents the adjustment cost of the aluminum electrolysis load, and Δ P j , t al is the adjustable capacity per unit time.
(4)
Adjustment Cost of Multifunctional Overhead Crane Load
C op , crane = t = 1 T c crane Δ P j , t crane
where c crane represents the adjustment cost of the aluminum electrolysis load, and Δ P j , t crane is the adjustable capacity per unit time.
(5)
Operating Cost of Energy Storage
C op , storage = t = 1 T c storage P charge t + P discharge t
where c storage represents the operating cost coefficient of energy storage, P charge t is the amount of energy charged to the storage system per unit time, and P discharge t is the amount of energy discharged from the storage system per unit time.
(6)
Cost of Power Exchange with the Grid
C op , ex = t = 1 T c buy P buy t c sell P sell t
where c buy represents the electricity purchase price, P buy t is the amount of electricity purchased per unit time, c sell is the electricity selling price, and P sell t is the amount of electricity sold per unit time.

3.2.2. Objective Function 2

In response to low-carbon emission reduction policies, objective function 2 aims to minimize the total carbon emissions, which consists of several components: carbon dioxide released during the consumption of prebaked carbon anodes as reducing agents in the aluminum electrolysis process; carbon emissions (perfluorocarbons) caused by anode effects during aluminum electrolysis [29]; carbon emissions from wind and solar power generation; and carbon emissions from coal consumption in both self-owned power plants and purchased electricity.
min f 2 = T ce , anode + T ce , anode   effect + T ce , re + T ce , the + T ce , ex
where T ce , anode represents carbon emissions from the consumption of carbon anodes as raw materials; T ce , anode   effect denotes carbon emissions (perfluorocarbons) caused by anode effects during production; T ce , re indicates carbon emissions from renewable energy units; T ce , the represents carbon emissions from thermal power units; and T ce , ex refers to carbon emissions from net purchased electricity from the power grid.
(1)
Carbon Emissions from Carbon Anodes
CO2 emissions primarily originate from fuel combustion, petroleum coke burning losses, and anode baking processes. The carbon emissions from carbon anode consumption as raw materials can be calculated using the following formula: Carbon Emissions from Carbon Anodes.
T ce , anode = M j , t al B anode 1 C anode D anode E m o l . w t E a m u
where B anode represents the net consumption of carbon anodes per ton of aluminum; C anode represents the average sulfur content of carbon anodes at 1%; D anode represents the average ash content of carbon anodes at 1%; E m o l . w t represents the molecular weight of CO2; and E a m u represents the atomic weight of carbon.
(2)
Carbon Emissions from Anode Effects
The carbon emissions (perfluorocarbons) caused by anode effects during the production process can be calculated using the following formula:
T ce , anode   effect = M j , t al B effect D effect C effect E effect 1000
where B effect represents the emission factor of CF4 from anode effects; C effect represents the emission factor of C2F6 from anode effects; D effect represents the Global Warming Potential (GWP) of CF4; and E effect represents the Global Warming Potential (GWP) of C2F6.
(3)
Carbon Emissions from Renewable Energy Units
T ce , re = t = 1 T λ pv , factor P pv t + t = 1 T λ wt , factor P wt t
where λ pv , factor represents the carbon emission coefficient of photovoltaic power generation; P pv t represents the photovoltaic power generation per unit time; λ wt , factor represents the carbon emission coefficient of wind power generation; and P wt t represents the wind power generation per unit time.
(4)
Carbon Emissions from Thermal Power Units
T ce , the = t = 1 T k Ω the λ the , factor P the , k t
where λ the , factor represents the carbon emission coefficient of thermal power units and P the , k t represents the power generation of a specific thermal power unit per unit time.
(5)
Carbon Emissions from Grid Power Exchange
T ce , ex = λ ex , factor t = 1 T P buy t
where λ ex , factor represents the carbon emission coefficient of grid electricity and P buy t represents the amount of electricity purchased from the grid per unit time.

3.2.3. Objective Function 3

To maximize the utilization of renewable energy sources such as wind and solar power, the objective function 3 aims to maximize the consumption of wind and photovoltaic power during aluminum electrolysis production, i.e., to maximize the renewable energy consumption rate:
max f 3 = t = 1 T P res , used t t = 1 T P res , predictable t
where P res , used t represents the renewable energy output utilized per unit time and P res , predictable t represents the predicted renewable energy output per unit time.

3.3. Variable Constraints

(1)
Renewable Energy Constraints
0 P pv t P pv t , max
0 P wt t P wt t , max
where P pv t , max represents the maximum photovoltaic power output and P wt t , max represents the maximum wind power output.
(2)
Thermal Power Unit Output Constraints
P the , min P the t P the , max
where P the , min represents the minimum output of thermal power units and P the , max represents the maximum output of thermal power units.
(3)
Thermal Power Unit Ramp Rate Constraints
P the , k t P the , k t 1 P the , k , up
P the , k t 1 P the , k t P the , k , down
where P the , k t 1 represents the active power output of conventional units during period t 1 and P the , k , up and P the , k , down represent the up and down ramp rates of thermal power units, respectively.
(4)
Aluminum Electrolysis Load Regulation Constraints, refer to Equations (1)–(19).
(5)
Grid Power Exchange Constraints
0 P buy t P buy t , max
0 P sell t P sell t , max
where P buy t , max represents the maximum allowable power purchase and P sell t , max represents the minimum allowable power purchase.

4. Model Solution

A multi-objective optimization model for collaborative dispatch in aluminum electrolysis industrial parks encompasses complex objectives. This optimization problem is further complicated by multidimensional nonlinear constraints, such as aluminum electrolysis regulation limitations, auxiliary equipment constraints that follow production variations, and operational constraints of wind–solar–thermal power units and energy storage charging/discharging processes. Traditional linear programming and deterministic optimization methods struggle to effectively solve such complex problems [30,31]. Consequently, intelligent algorithms—including improved particle swarm optimization and genetic algorithms—have emerged as viable alternatives. These approaches leverage their global search capabilities and advantages in handling high-dimensional nonlinear problems to simulate the complex dynamic evolution of the system. Among numerous multi-objective optimization algorithms, MOGWO combines the simplicity and efficiency of GWO with the powerful capabilities of multi-objective optimization. It can precisely simulate the load regulation characteristics of the aluminum electrolysis process and optimize the synergistic mechanism between renewable energy and the aluminum electrolysis system, making it an ideal choice for addressing complex engineering optimization problems (such as aluminum electrolysis load scheduling).
The source–storage–load coordinated scheduling optimization problem in aluminum electrolysis parks is a nonlinear multi-constraint problem. When solving with the original MOGWO algorithm, multiple constraints increase the computational time. To address this issue, a cosine convergence factor is introduced [32], significantly improving the algorithm’s convergence speed. The multi-period cosine convergence factor enables more refined local search in later stages, enhancing global optimization capability and improving the quality of the Pareto front. The introduction of an elite selection strategy reduces the sparsity of solution sets [33], resulting in a more uniform distribution, particularly in displaying complete Pareto front profiles, and reducing optimization time.
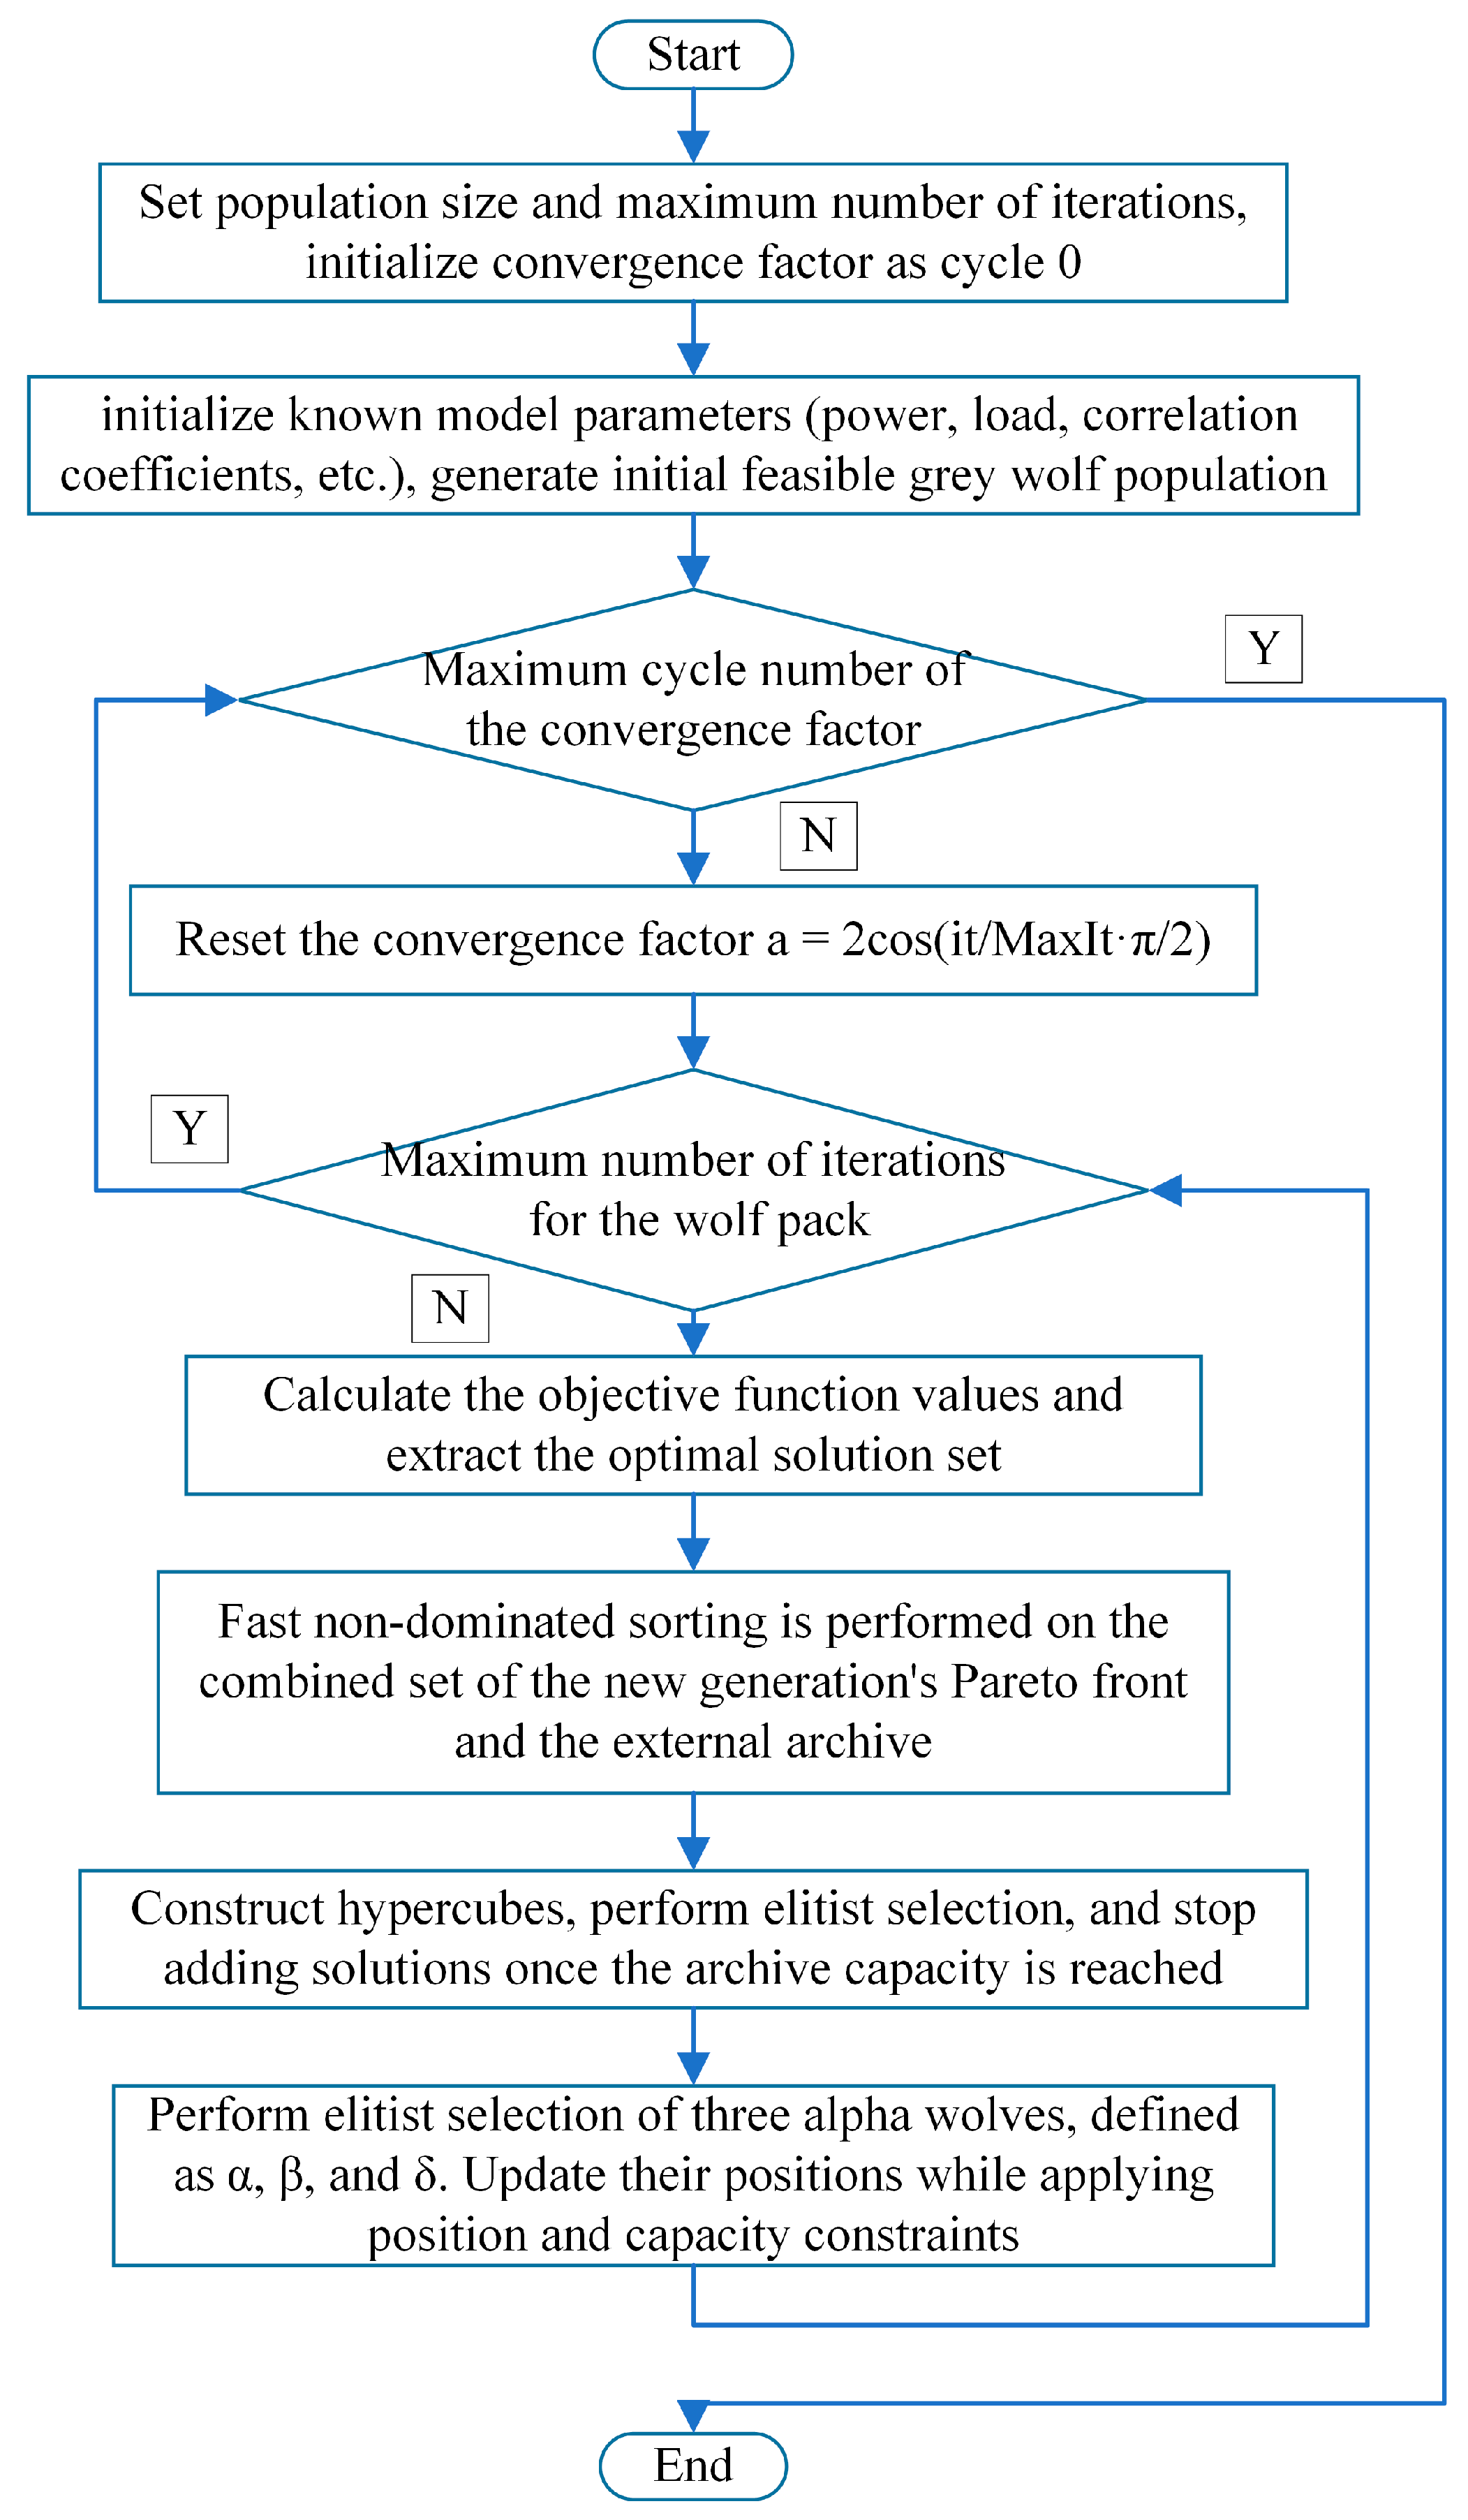
Based on the above analysis, an improved multi-objective grey wolf optimization algorithm is adopted to solve the proposed multi-objective optimization dispatch model for source–load–storage coordination. The solution flowchart is shown in Figure 4.
The main steps of the IMOGWO algorithm are as follows:
(1)
Step 1: Initialize grey wolf algorithm, set population size and maximum iterations, import known model parameters (power, load, correlation coefficients, etc.), initialize population matrix arrangement as position, fitness function value, Pareto rank, crowding distance, and initialize convergence factor as cycle 0.
(2)
Step 2: Reset current iteration count for single convergence factor cycle wolf pack, and reset convergence factor as a = 2cos(it/MaxItpi/2), control search range, prepare for next iteration round.
(3)
Step 3: Calculate objective function values: operating cost, carbon emissions, renewable energy consumption rate; perform non-dominated sorting on population, determine each wolf’s superiority, establish Archive population, perform crowding distance sorting on Archive population, retain optimal and uniformly distributed solutions before entering the iteration process.
(4)
Step 4: Construct a hypercube, place particles into the hypercube, then perform elite selection based on particle crowding degree, and stop adding when the accumulated storage capacity is reached.
(5)
Step 5: Select three representative alpha wolves (Alpha, Beta, and Delta) from the repository, representing the current best, second-best, and third-best solutions. Update all grey wolves’ positions based on alpha wolves’ positions, process boundary violations of new positions to ensure variables remain within a reasonable range, proceed to the next round of objective function calculation and sorting.
(6)
Step 6: Check if the current single cycle maximum iterations reached (inner loop), check if the maximum number of cycles reached (outer loop).
(7)
Step 7: If the maximum number of cycles is reached, the algorithm terminates, output optimal solution set (Pareto front) for subsequent decision analysis.

5. Case Study

This section presents the simulation results, with the core algorithm (IMOGWO) implemented through custom functions. It should be noted that these simulations were conducted on a personal computer equipped with a 13th Gen Intel(R) Core(TM) i9-13900H (2.60 GHz) processor (Intel, Hohhot, Inner Mongolia Autonomous Region, China), 64 GB RAM, and 1 TB internal storage, using MATLAB 2022 software.

5.1. Case Introduction

To verify the effectiveness of the proposed model, based on actual operational data from an aluminum electrolysis park in Northeast China. The park contains 3 electrolytic cell series with rated powers of 210, 315, and 709.8 MW respectively, a multi-functional crane load of 77.175 MW, and other loads of 231.525 MW, totaling 1543.5 MW rated load. For renewable energy generation units, photovoltaic array parameters are detailed in reference [16], and wind turbines use MYSE7.5-193 units. The existing connected photovoltaic station capacity is 1120 MW, the wind farm capacity is 1200 MW, and their 24 h typical daily output data is shown in Figure A1. Fire power unit types and related equipment parameters are listed in Table A1. The tie line rated power is 800 MW, with an electricity purchase price of 0.485 yuan/kWh and a selling price of 0.28 yuan/kWh. Energy storage parameters are listed in Table A2, and carbon emission coefficients are listed in Table A3.
To verify the effectiveness and feasibility of the proposed model and algorithm, highlight the potential of aluminum electrolysis loads in grid regulation, and demonstrate the balance of multi-objective optimization in source–storage–load coordination and sustainability of green low-carbon transformation, comparative analyses are designed in the following aspects:
(1)
Setting a basic scenario with economic benefits as the core objective, allowing daily production to fluctuate within 90–110% of rated production, which is significant for verifying the daily adjustability of aluminum electrolysis loads.
(2)
In fixed-production scenario analysis, the study is divided into two directions: conventional economic optimization without considering adjustable characteristics, focusing on traditional cost-effectiveness; and three-objective collaborative optimization considering economics, carbon emissions, and renewable energy consumption rate.
(3)
In fixed-production multi-objective scenario analysis, the three-objective optimization study focusing on economics, carbon emissions, and renewable energy consumption rate is further deepened by expanding the renewable energy integration scale.
(4)
Based on the different emphasis of three-objective optimization analysis, pairwise analysis of economics, carbon emissions, and renewable energy consumption rate reveals the inherent correlations and trade-off characteristics between objectives.
(5)
To verify the effectiveness and advancement of the proposed model and algorithm, comparisons with benchmark models highlight the superiority of the proposed model in application. Subsequently, IMOGWO is compared with mainstream algorithms such as NSGA-II and MOGWO.

5.2. Results Analysis

5.2.1. Analysis of Aluminum Electrolysis Load Regulation

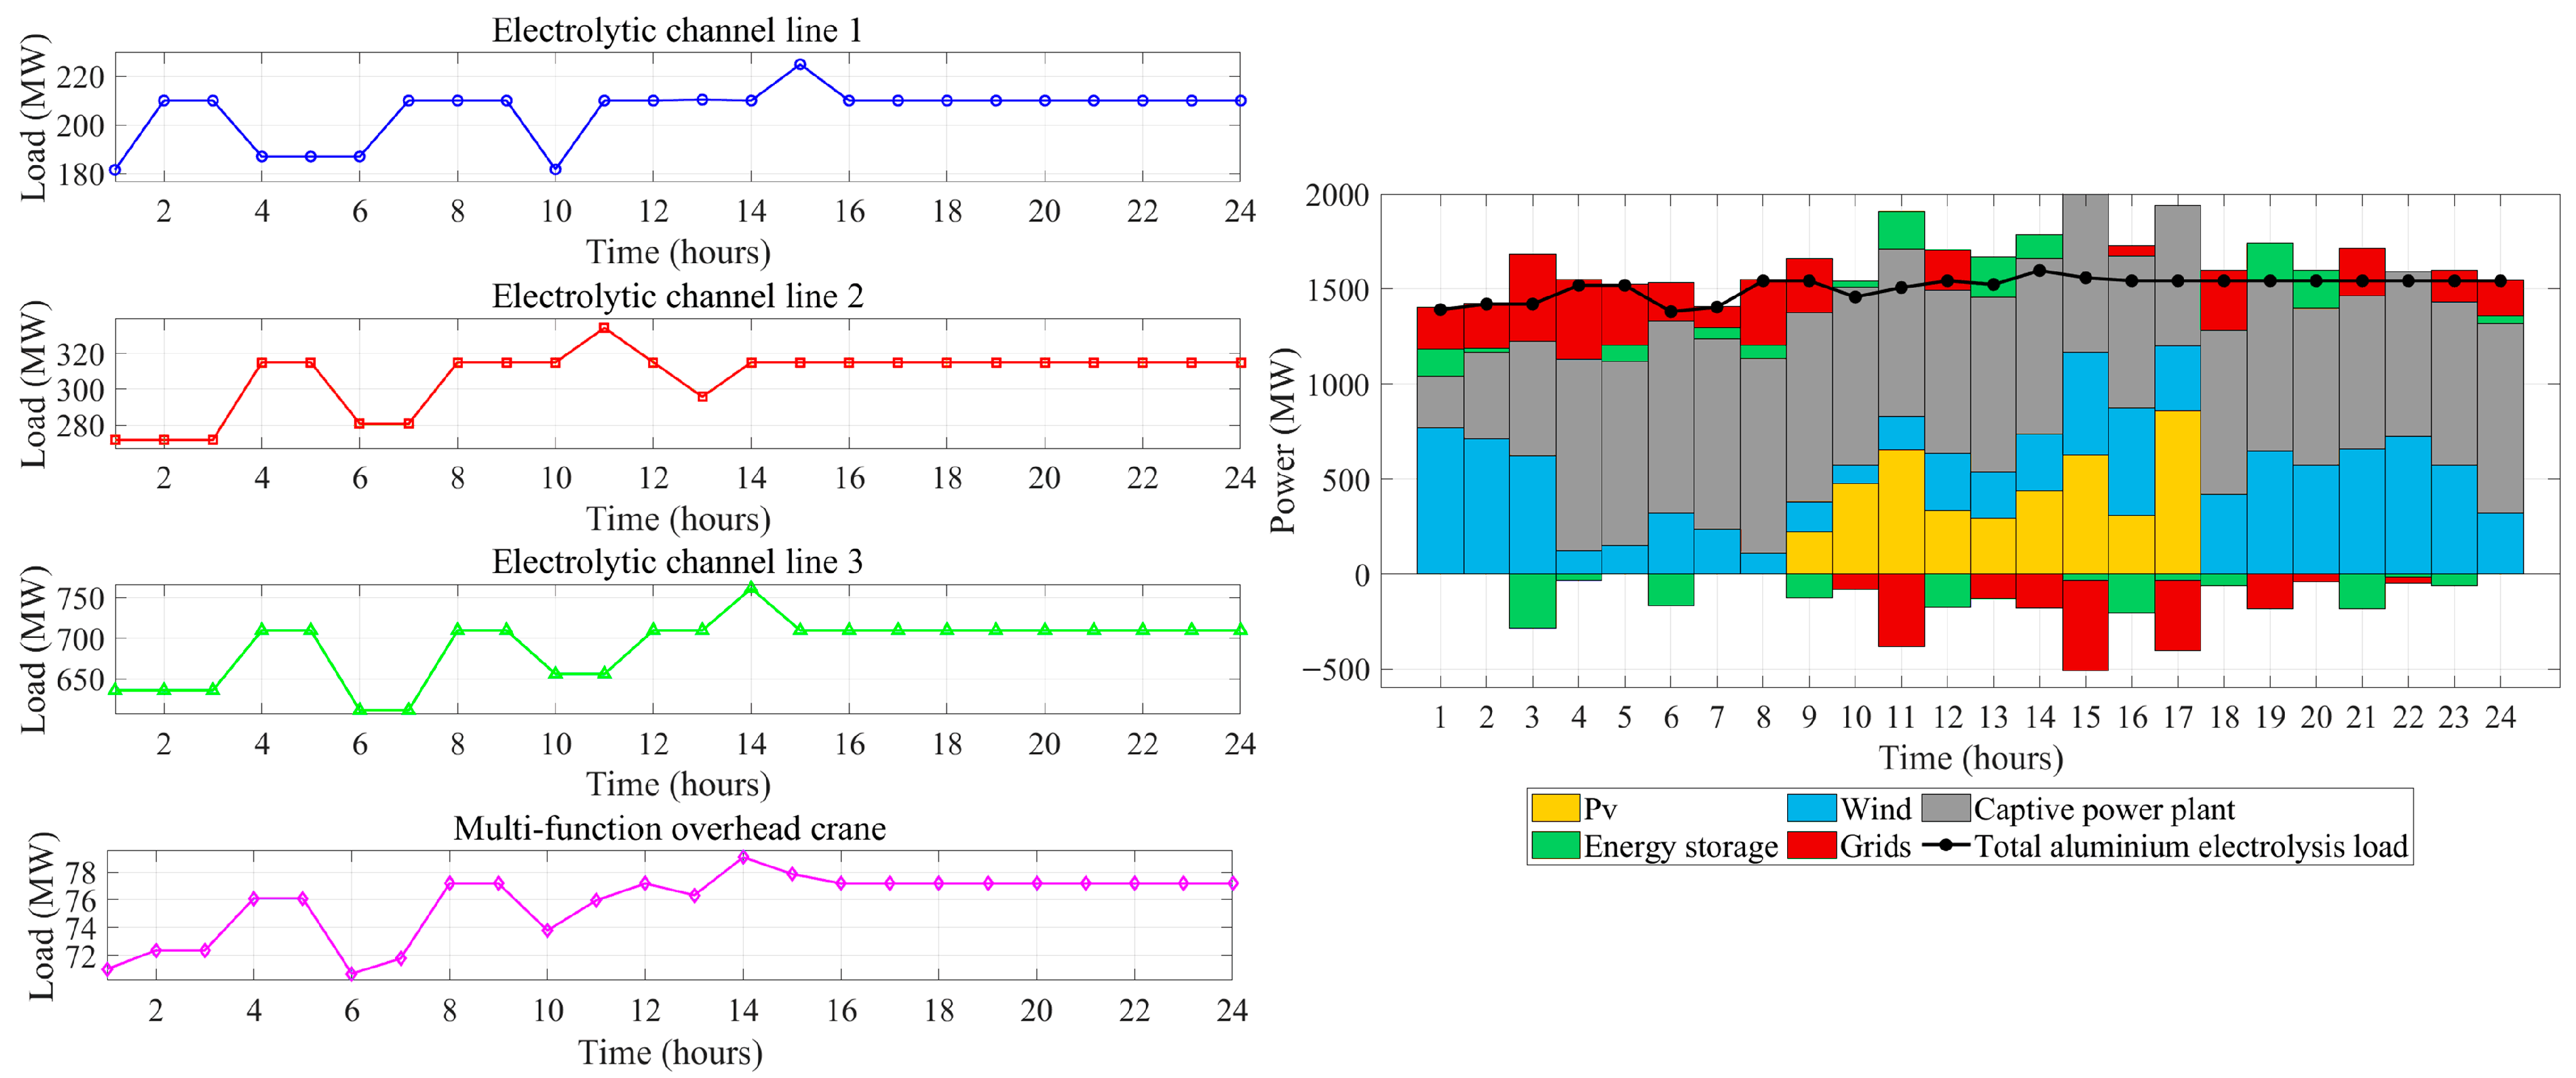
Considering the adjustability of aluminum electrolysis loads and assuming that aluminum enterprises have product storage capability, daily aluminum production can be adjusted as needed, with daily production allowed to fluctuate between 90–110%. The load regulation and system output are shown in Figure 5.
According to Figure 5, the total adjustable capacity over 24 h is 995.024 MW·h, with the electrolytic cell load contributing 957.28 MW·h and the multi-functional crane load contributing 37.750 MW·h. This demonstrates the substantial regulation potential of aluminum electrolysis loads and auxiliary equipment, providing critical support for high-penetration renewable energy integration and grid peak shaving, while also laying the foundation for subsequent multi-objective optimization strategy analysis.

5.2.2. Multi-Objective Optimization Dispatch Study of Aluminum Electrolysis Load

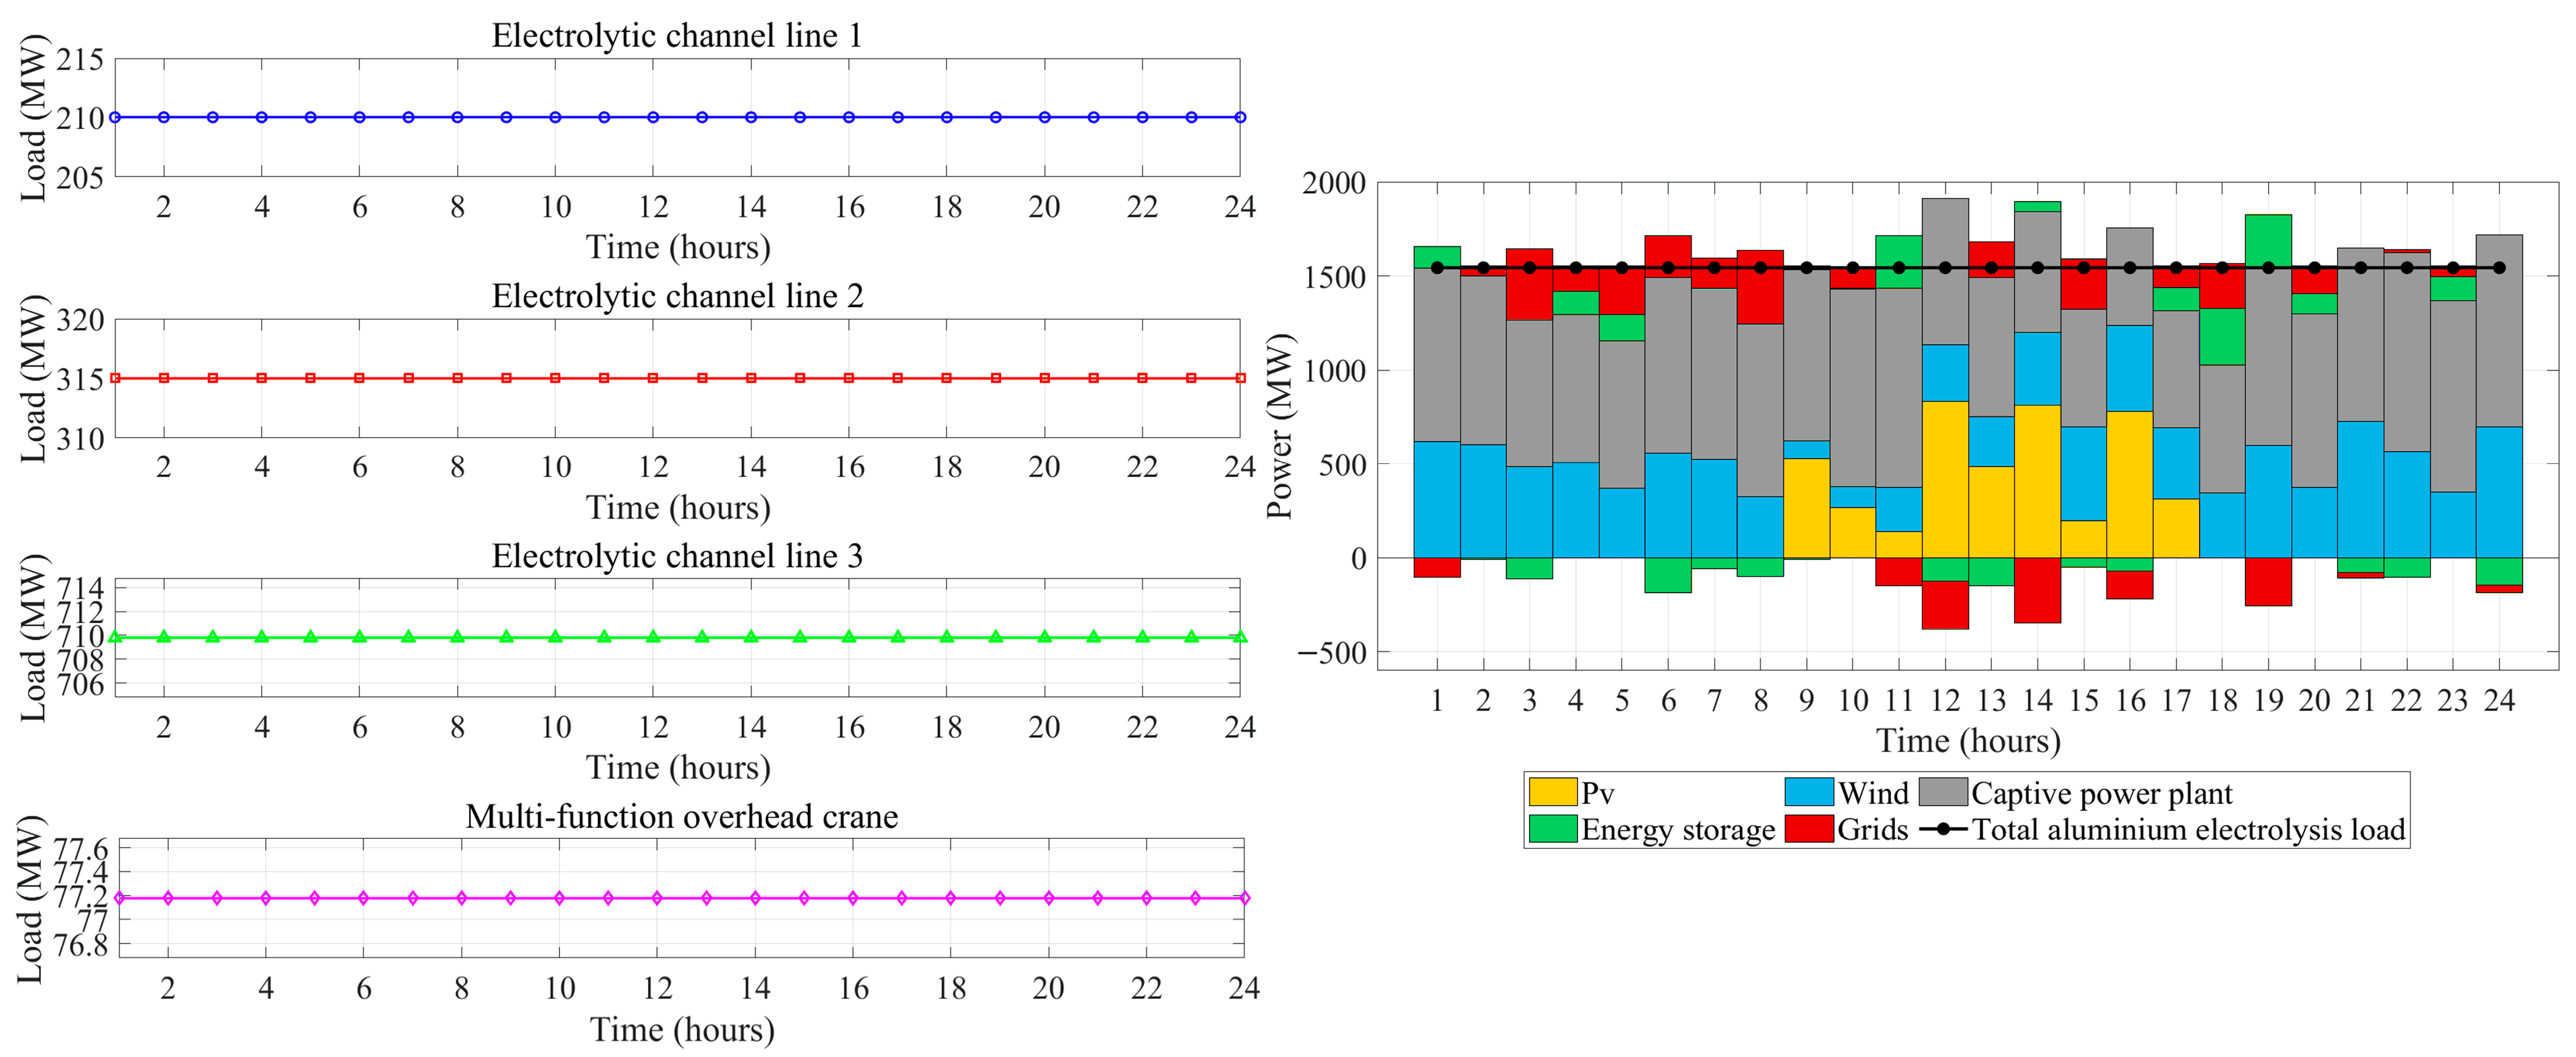
Currently, the majority of aluminum electrolysis plants operate at constant power levels during their production processes. Consequently, in the fixed production scenario, the adjustability of aluminum electrolysis loads is not considered, with focus solely placed on traditional economic optimization as a single baseline scenario (Scenario 2). The load regulation and system output are shown in Figure 6.
When considering only economic optimization as a single objective, the cost is 9.5343 million yuan, carbon emissions are 24,314.04 t, and the renewable energy consumption rate is 65.71%.
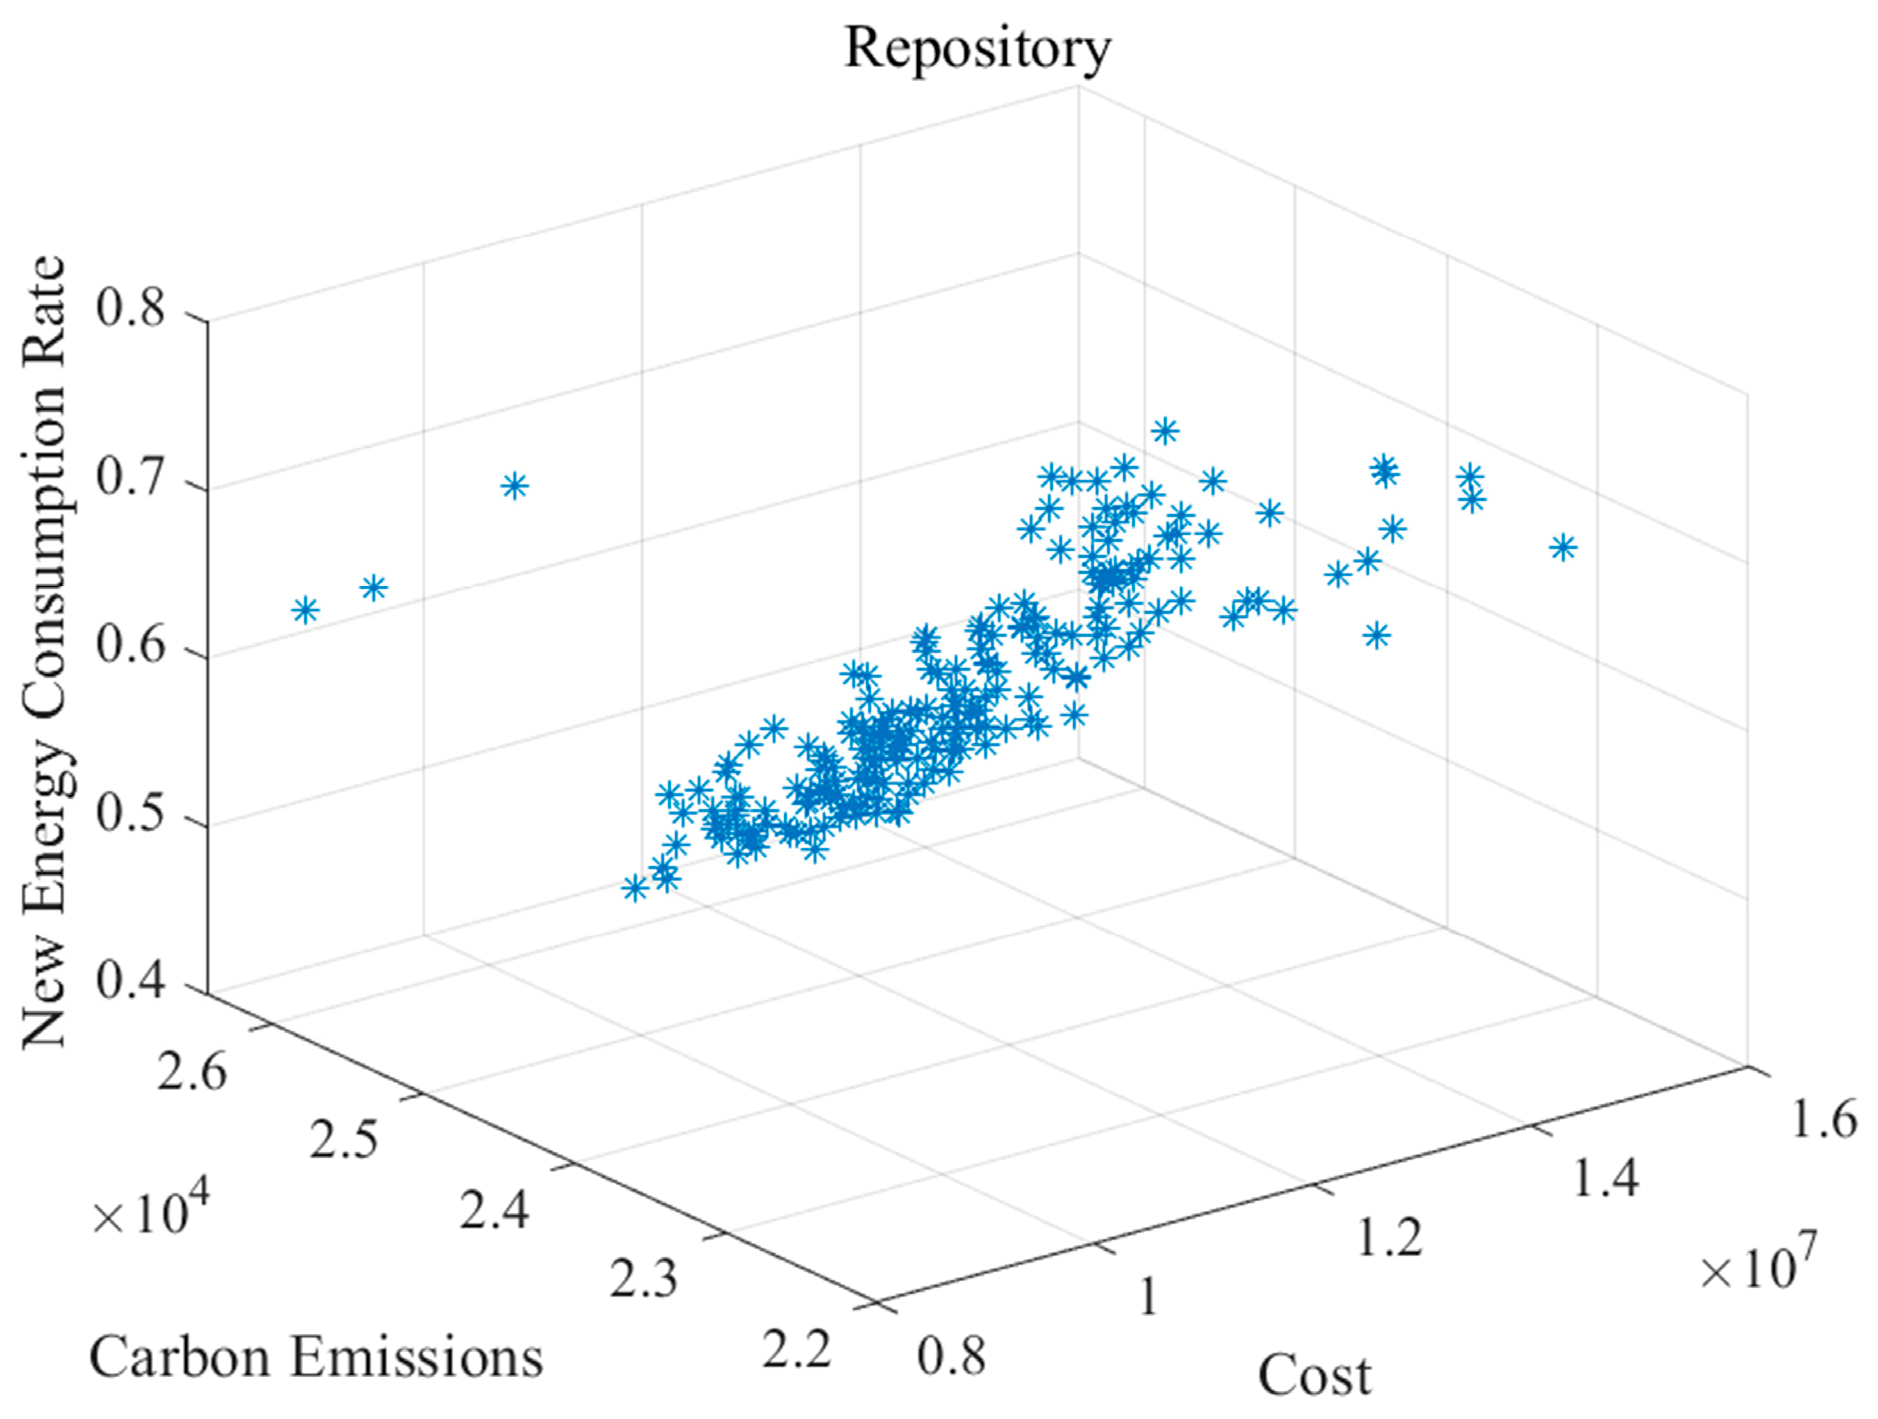
Three-objective optimization provides a broader decision space compared to single economic optimization, better balancing enterprise development and social responsibility, offering more comprehensive solutions for the sustainable development of the aluminum electrolysis industry. Although the adjustable characteristics of aluminum electrolysis loads are restricted under fixed production conditions, multi-objective optimization methods can address environmental benefits and energy transition demands while ensuring economic benefits. In the algorithm settings, when the population size is set to 1000 with 100 iterations, the simulation output results achieve stability. The distribution of the Pareto solution set for three-objective optimization in the objective function space is shown in Figure 7.
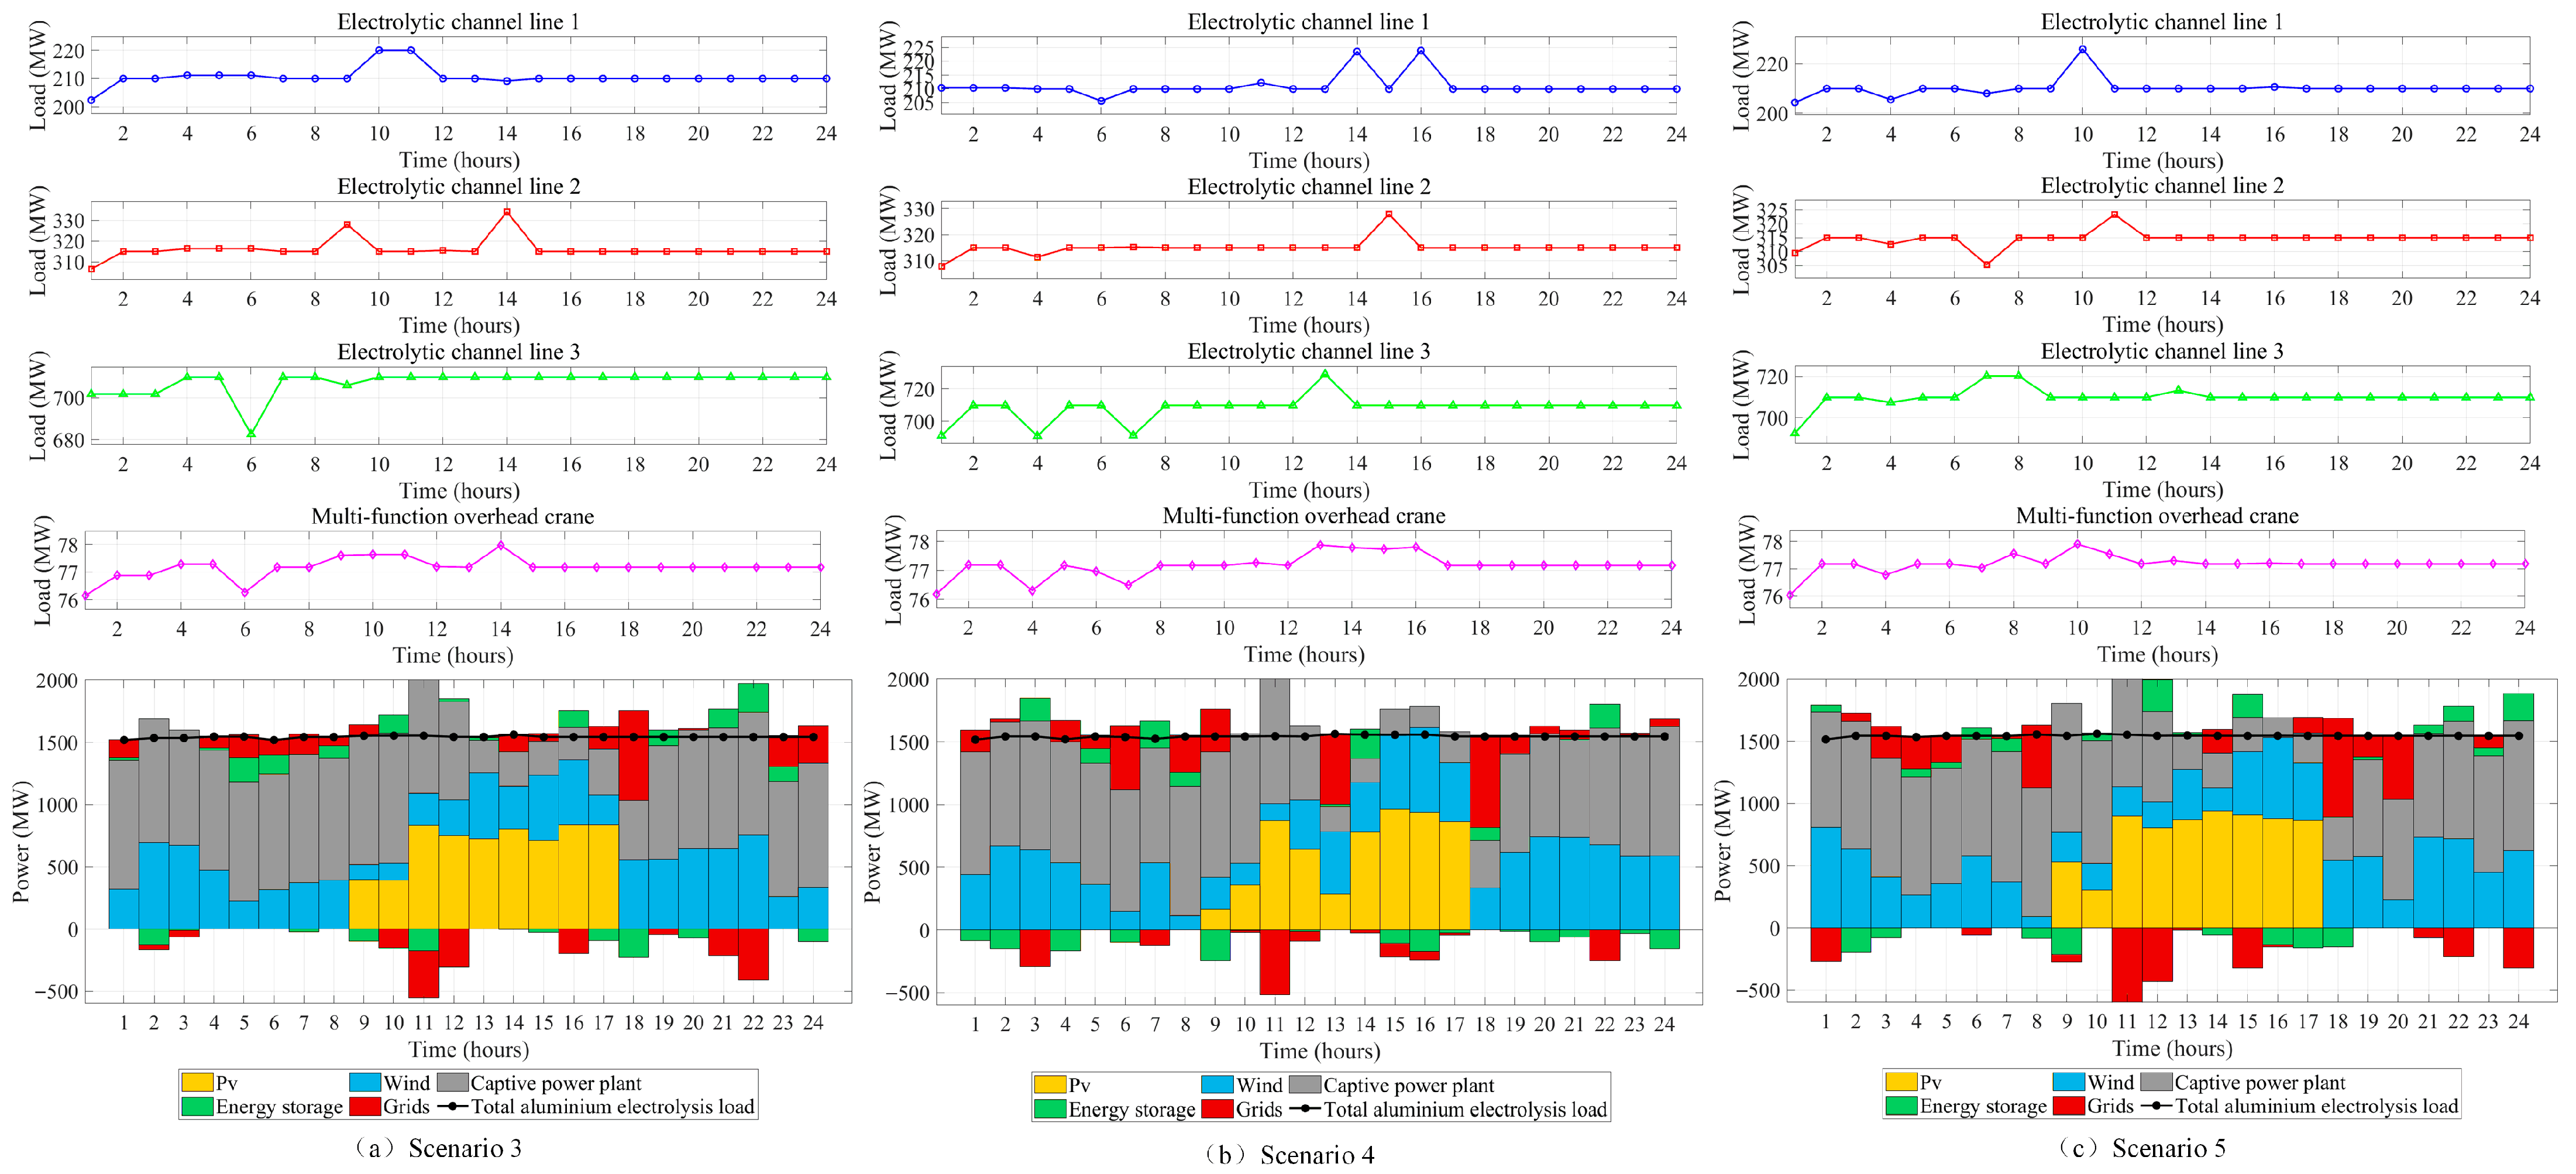
To achieve a win-win-win situation for economic benefits, environmental protection, and energy transition, a series of optimization scheduling schemes with different emphases are provided. To prioritize economic factors, the aluminum electrolysis park sets cost minimization as the primary objective (40% weight), establishing Scenarios 3/6. This indicates that the park emphasizes short-term profitability or budget control in decision-making. For low-carbon considerations, the park prioritizes carbon emissions as the primary objective (40% weight), establishing Scenarios 4/7. This indicates that the park tends to prefer scheduling schemes with lower system carbon emissions in decision-making. When considering green corporate development, the park prioritizes renewable energy consumption as the primary objective (40% weight), establishing Scenarios 5/8. This indicates that the park tends to prefer scheduling schemes with higher renewable energy consumption rates in decision-making. The weight distributions are shown in Table 1.
From the load variation graph, the following can be concluded: In scenario 3, the adjustable load of three electrolytic cell lines is 134.239 MW·h, the multi-functional crane adjustable load is 3.336 MW·h, and the overall regulation capacity is 101.635 MW·h. In scenario 4, the adjustable load of three electrolytic cell lines is 132.276 MW·h, the multi-functional crane adjustable load is 4.941 MWh, and the overall regulation capacity is 137.217 MW·h. In scenario 5, the adjustable load of three electrolytic cell lines is 98.299 MW·h, the multi-functional crane adjustable load is 3.336 MW·h, and the overall regulation capacity is 101.635 MW·h. By comparing the output conditions shown in Figure 6 and Figure 8, it can be observed that the utilization rate of wind and solar power significantly increases in scenarios 3, 4, and 5.
Analyzing the data from scenario 2 and scenarios 3, 4, and 5 in Table 2, from an economic perspective, scenario 2, which only considers economic optimization, performs best. However, compared to the other three scenarios, it lacks consideration of carbon emissions and the renewable energy consumption rate. In the three-objective optimization, scenario 4, which emphasizes carbon emissions, shows a reduction of 1677.35 t in carbon emissions compared to scenario 2. Scenario 5, which emphasizes the renewable energy consumption rate, demonstrates a 12.11% increase in the renewable energy consumption rate.
Through scenario comparison, the superiority of multi-objective optimization in source–load coordinated optimization mode is verified in terms of comprehensive benefits: improving system economics, reducing carbon emissions, and promoting renewable energy consumption rate.

5.2.3. Multi-Objective Optimization Dispatch Analysis with a Higher Proportion of Renewable Energy Integration

A scenario with a higher proportion of renewable energy integration is established by adding 1200 MW of wind power to the existing 1200 MW wind power and 1120 MW photovoltaic capacity. Through reasonable adjustment of aluminum electrolysis load to match renewable energy output, this further explores the application of high proportion wind and solar power in energy-intensive parks, facilitating enterprises’ green and low-carbon transformation.
From the load variation graph, the following can be concluded: In scenario 6, the adjustable load of three electrolytic cell lines is 131.684 MW·h, the multi-functional crane adjustable load is 5.556 MW·h, and the overall regulation capacity is 137.24 MW·h. In scenario 7, the adjustable load of three electrolytic cell lines is 232.746 MW·h, the multi-functional crane adjustable load is 9.2 MWh, and the overall regulation capacity is 241.946 MW·h. In scenario 8, the adjustable load of three electrolytic cell lines is 81.53 MW·h, the multi-functional crane adjustable load is 3.202 MW·h, and the overall regulation capacity is 84.732 MW·h. By comparing the output conditions shown in Figure 8 and Figure 9, it can be observed that wind and solar power output in scenarios 6, 7, and 8 have replaced most of the output from captive thermal power units.
Analyzing the results data from scenarios 6, 7, and 8 in Table 3 and scenarios 3, 4, and 5 in Table 2, significant improvements can be observed in all three aspects. From an economic perspective, scenario 6 saves 2.0807 million yuan compared to scenario 3; regarding carbon emissions, scenario 7 reduces emissions by 6583.62 t compared to scenario 4; in terms of renewable energy consumption rate, scenario 8 shows a 6.75% increase compared to scenario 5.
Through comparative analysis of optimization effects under different renewable energy integration scales, the significant advantages of multi-objective optimization under large-scale renewable energy integration conditions are highlighted. This optimization strategy not only achieves higher clean energy consumption rates but also reduces comprehensive energy costs through economies of scale while significantly decreasing carbon emissions. It provides a feasible pathway for the aluminum electrolysis industry’s green and low-carbon transformation, and offers an important reference for production optimization in future scenarios with higher proportions of renewable energy integration.

5.2.4. Correlation Analysis Between Multiple Objectives

To identify the synergistic effects and conflicts among objectives, this analysis examines the mutual influences between different variables, thereby providing a reference for making appropriate adjustments to specific variables.
As shown in Figure 10a, there is a significant negative correlation between economic cost and carbon emissions objectives [34]. The fundamental reason is that low-carbon dispatching strategies, while reducing carbon emissions, incur two types of additional costs: first, increased start–stop and peak regulation costs of thermal power units to smooth renewable energy fluctuations; second, high-cost external power purchase expenses in specific periods due to reduced self-owned thermal power generation.
As shown in Figure 10b, economic cost and renewable energy consumption rate show a negative correlation. Pursuing extreme consumption rates significantly increases system costs, as it requires expensive flexibility resources (such as unit start–stop operations) to handle renewable energy fluctuations. Therefore, in certain periods, actively curtailing wind and solar power to avoid high regulation costs may exceed their power generation value, becoming a more economically optimal choice.
As shown in Figure 10c, carbon emissions and renewable energy consumption rate demonstrate a significant negative correlation, confirming that increasing renewable energy consumption is key to low-carbon transformation. This relationship essentially reflects the system’s flexibility level: lower flexibility leads to greater dependence on thermal power for system balance, resulting in “high carbon emissions, low consumption”; conversely, higher flexibility enables a virtuous cycle of “low carbon emissions, high consumption”.

5.2.5. Validation of Model and Algorithm Effectiveness

Model 1 represents the refined modeling considering multi-functional crane loads, while Model 2 represents modeling without considering multi-functional crane loads. To validate model effectiveness, both models were run in MATLAB 2022 software using an improved multi-objective grey wolf algorithm. The comparison of Pareto frontiers, along with algorithm solution time and efficiency comparisons, is shown in Figure 11.
According to Figure 11, when solving multi-objective problems, Model 1 produces 20 more solution sets than Model 2, but requires 13.041 s longer solving time, averaging 0.04 s slower per solution. While the solving efficiency between the two models is similar, Model 1’s refined modeling, which considers the coupling relationship between multi-functional crane loads and production loads, discovers more feasible solution sets. This brings significant advantages in scheduling precision and resource allocation, providing strong support for the efficient operation of aluminum electrolysis enterprises.
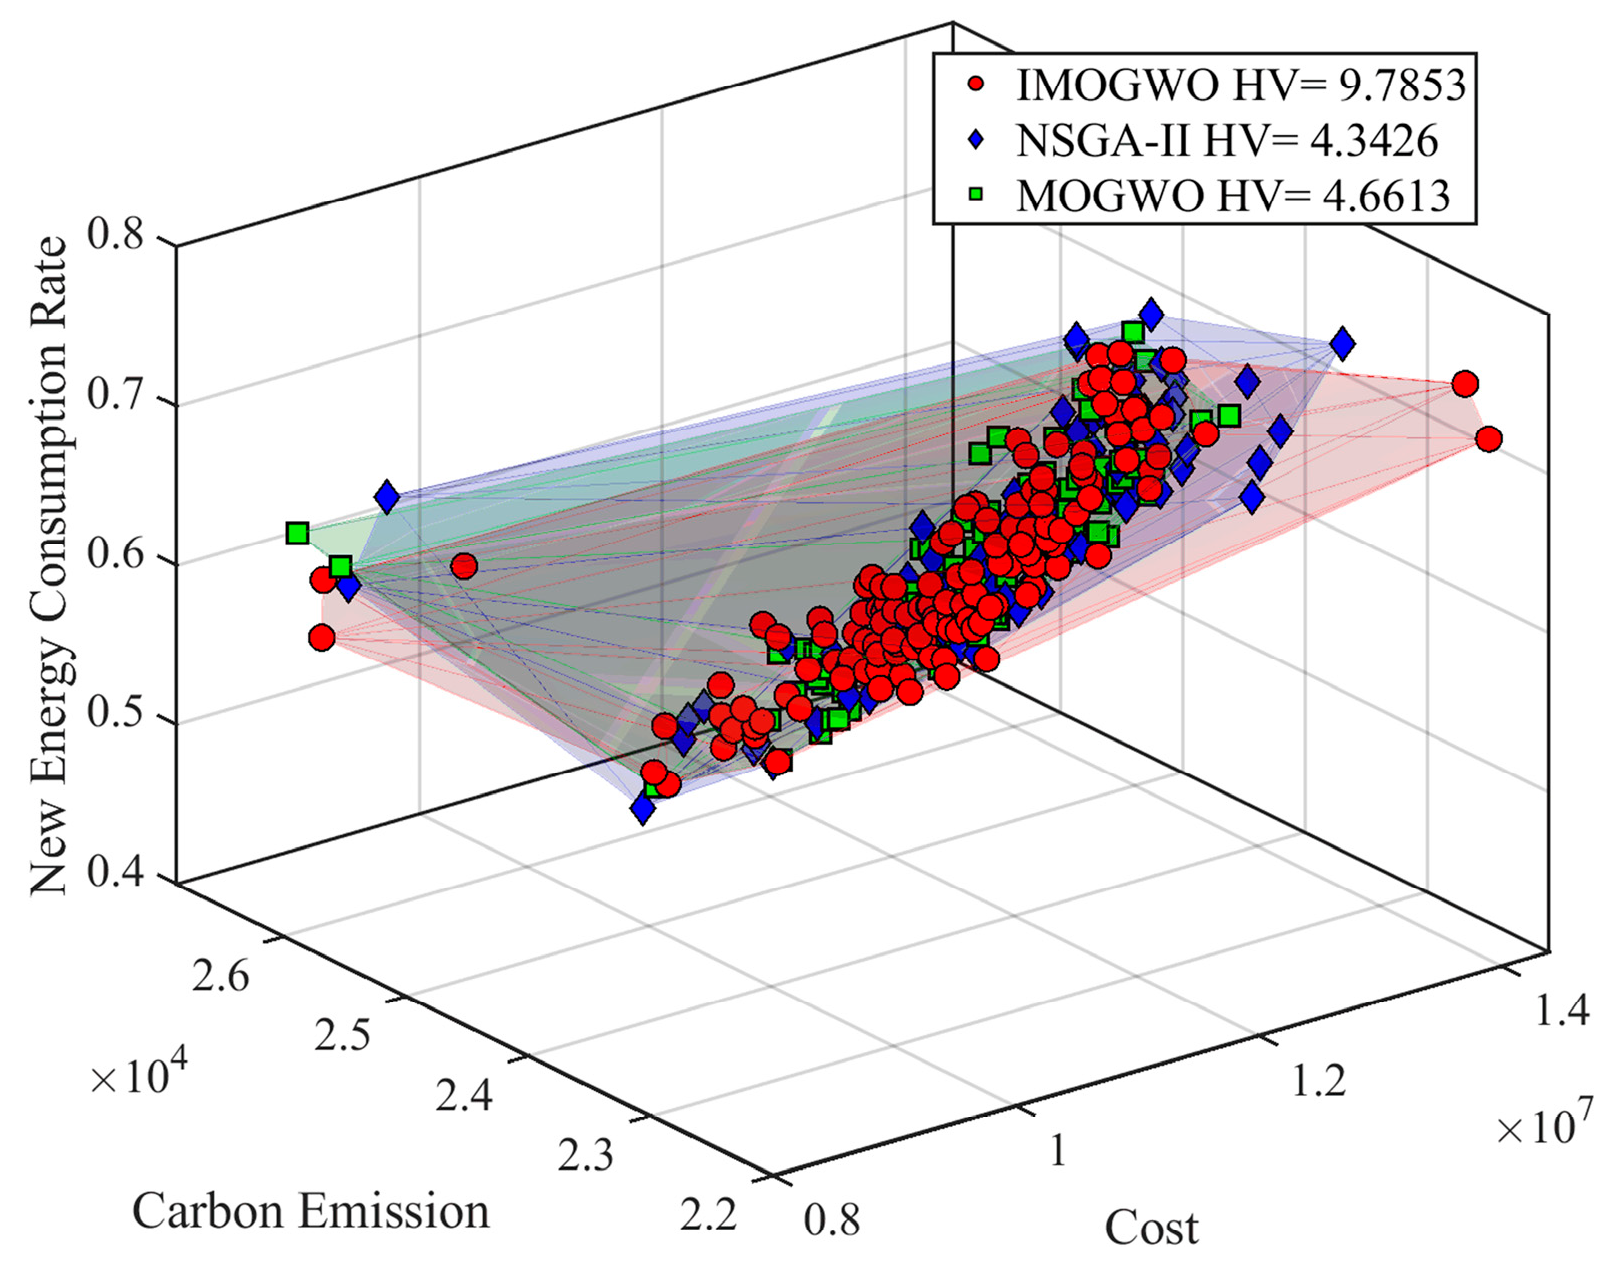
To validate algorithm effectiveness, Model 1 was implemented in MATLAB 2022 software using three solving algorithms: multi-objective genetic algorithm, multi-objective grey wolf algorithm, and improved multi-objective grey wolf algorithm. The Pareto frontiers were obtained and compared in a three-dimensional graph showing the Pareto frontier sets of three objective functions. The parameter settings for the three algorithms are shown in Table 4, and the comparison of Pareto solution sets is shown in Figure 12.
According to Figure 12 and Table 5, when solving the multi-objective problem involving economics, carbon emissions, and renewable energy consumption rate for aluminum electrolysis enterprises, the improved multi-objective grey wolf algorithm demonstrates wider solution coverage across all three objective functions compared to the multi-objective genetic algorithm and the multi-objective grey wolf algorithm. Furthermore, the improved algorithm achieves the shortest solving time and generates the largest number of solution sets. Additionally, its highest HV value indicates better convergence and diversity of solutions, reflecting superior distribution range and uniformity in the objective space.
This indicates that the improved grey wolf algorithm demonstrates strong adaptability and solving efficiency for the source–storage–load coordinated scheduling multi-objective optimization model proposed in this paper.

6. Conclusions

This paper treats the aluminum electrolysis park as a load-side flexibility resource for system regulation, constructs a source–storage–load coordinated dispatch model. With objectives of minimizing economic cost and carbon emissions while maximizing renewable energy consumption rate, an improved multi-objective grey wolf optimization algorithm is applied to simulate the multi-objective optimization model based on source–storage–load coordination. The following conclusions can be drawn:
  • Including operational characteristics of auxiliary equipment (multi-functional cranes) in aluminum electrolysis load modeling has significant practical implications. Considering the impact of multi-functional crane loads on overall system energy consumption reflects the dynamic load characteristics of the entire production system, enabling a more comprehensive evaluation of aluminum electrolysis enterprises’ regulation capability.
  • The multi-objective optimization strategy in the proposed source–storage–load coordinated optimization mode can systematically coordinate operating costs, overall carbon emissions, and renewable energy consumption of the aluminum electrolysis park, yielding decision solutions that balance overall economic and low-carbon objectives.
  • The significant advantages of multi-objective optimization under large-scale renewable energy integration conditions are explored. This not only provides an effective pathway for the current green transformation of the aluminum electrolysis industry but also offers valuable reference for the sustainable development of other energy-intensive industries.

Author Contributions

Conceptualization, J.L. and Y.C.; methodology, J.L. and G.L.; software, Y.C.; validation, J.L. and Y.C.; formal analysis, Y.C. and R.H.; investigation, Y.C.; resources, Y.C.; data curation, J.L.; writing—original draft preparation, Y.C.; writing—review and editing, G.L., J.L. and Y.C.; visualization, J.L.; supervision, J.L., Y.C. and R.H.; project administration, J.L. and Y.C.; funding acquisition, J.L. All authors have read and agreed to the published version of the manuscript.

Funding

This research was funded by the Inner Mongolia Autonomous Region Science and Technology Breakthrough Project (2024KJTW0017), the National Key Research and Development Plan “Energy Storage and Smart Grid Technology” Project (2024YFB2408400), and the Inner Mongolia Natural Science Foundation under Grant (2025MS05012).

Institutional Review Board Statement

Not applicable.

Informed Consent Statement

Not applicable.

Data Availability Statement

All data are contained within the article. Additional data are available from the corresponding author upon reasonable request.

Conflicts of Interest

The authors declare no conflicts of interest.

Appendix A

Table A1. Parameters of thermal power units.
Unit Model NumberNumber of UnitsMaximum Output (MW)Minimum Output (MW)Start–Stop Cost (CNY)Cost Parameters a/b/c (CNY/MW2) (CNY/MW)(CNY)Minimum Up/Down Time (h)Maximum Ramp Rate (MW/h)CO2 Emission Intensity (N.m3CO2/kWh)
13854018200.00553/193.9/33603/380/800.46
231306539200.01477/115.5/47905/5100/1000.46
31455230350000.00217/121.1/67905/5200/2000.46
Table A2. Energy storage system parameters.
Values
Charging efficiency0.92
Discharging efficiency0.92
Maximum charge/discharge power (MW)300
Maximum capacity (MWh)1200
Initial capacity (MWh)360
Minimum state of charge0.1 × 1200
Maximum state of charge0.9 × 1200
Operation and maintenance cost (CNY/kWh)0.025
Table A3. Carbon emission coefficients of different equipment.
Energy TypeCarbon Emission Coefficient g/(kW·h)
Self-owned power plantCalculated based on thermal power unit carbon emission intensity
Power grid0.5703
Wind power generation0.02362
Solar power generation0.04191
Energy storage0
Figure A1. Predicted power output of wind and solar power in a typical day in the region.
Applsci 15 10919 g0a1

References

  1. Tregnago, G. Fifty years of change in the energy sector. Nat. Energy 2025, 10, 3–5. [Google Scholar] [CrossRef]
  2. National Security Emergency Preparedness (NSEP) Network. Electricity Consumption Growth Ranking by Industry in China 2023. Available online: https://news.bjx.com.cn/html/20240223/1362664.shtml (accessed on 24 September 2025).
  3. Hepburn, C.; Qi, Y.; Stern, N.; Ward, B.; Xie, C.; Zenghelis, D. Towards carbon neutrality and China’s 14th Five-Year Plan: Clean energy transition, sustainable urban development, and investment priorities. Environ. Sci. Ecotechnol. 2021, 8, 100130. [Google Scholar] [CrossRef]
  4. Chen, L.; Wang, C.; Wu, Z. Reinforcement Learning-Based Time of Use Pricing Design Toward Distributed Energy Integration in Low Carbon Power System. IEEE Trans. Netw. Sci. Eng. 2025, 12, 997–1010. [Google Scholar] [CrossRef]
  5. Chen, Z.; Wu, Z.; Wei, L.; Yang, L.; Yuan, B.; Zhou, M. Understanding the synergy of energy storage and renewables in decarbonization via random forest-based explainable AI. Appl. Energy 2025, 390, 125891. [Google Scholar] [CrossRef]
  6. Harrison-Atlas, D.; Murphy, C.; Schleifer, A.; Grue, N. Temporal complementarity and value of wind-PV hybrid systems across the United States. Renew. Energy 2022, 201, 111–123. [Google Scholar] [CrossRef]
  7. Lindberg, O.; Arnqvist, J.; Munkhammar, J.; Lingfors, D. Review on power-production modeling of hybrid wind and PV power parks. J. Renew. Sustain. Energy 2021, 13, 042702. [Google Scholar] [CrossRef]
  8. Xiao, Y.; Yang, C.; Chen, T.; Lei, M.; Wattana, S.; Wattana, B. Strategies of a Wind–Solar–Storage System in Jiangxi Province Using the LEAP–NEMO Framework for Achieving Carbon Peaking Goals. Energies 2025, 18, 1135. [Google Scholar] [CrossRef]
  9. Xie, J.; Zhang, Y.; Zhang, Y.; Xiang, M. Optimized Configuration Method of Park-level Hydrogen Energy System for Coordinated Operation of Hybrid Electrolyzers. Dianwang Jishu/Power Syst. Technol. 2025, 49, 3256–3265. [Google Scholar] [CrossRef]
  10. Li, C.; Li, R.; Wang, W.; Tang, Q.; Zhu, Y. Configuration optimization of distributed PV-storage system in industrial park considering load management. J. Renew. Sustain. Energy 2025, 17, 034102. [Google Scholar] [CrossRef]
  11. Sun, H.; Chen, F. The impact of green finance on China’s regional energy consumption structure based on system GMM. Resour. Policy 2022, 76, 102588. [Google Scholar] [CrossRef]
  12. Li, S.W.; Hui, H.Y.; Bao, M.L. Quantified Adjustability of Aluminum Smelter Loads and Their Participation in Coordinated Scheduling of Power System. Proc. CSU-EPSA 2024, 36, 70–80. [Google Scholar] [CrossRef]
  13. Yue, X.; Liao, S.; Fu, L.; Xu, J.; Ke, D.; Wang, H.; Li, L.; He, X. Hierarchical Optimization Strategy of High-penetration Wind Power System Considering Electrolytic Aluminum Energy-intensive Load Regulation and Deep Peak Shaving of Thermal Power. Dianwang Jishu/Power Syst. Technol. 2024, 48, 3186–3196. [Google Scholar] [CrossRef]
  14. Zheng, W.; Yu, P.; Xu, Z.; Fan, T.; Liu, H.; Yu, M.; Zhang, J.; Li, J. Day-ahead Intra-day Economic Dispatch Methodology Accounting for the Participation of Electrolytic Aluminum Loads and Energy Storage in Power System Peaking. In Proceedings of the 2nd IEEE International Conference on Power Science and Technology, ICPST 2024, Dali, China, 9–11 May 2024; pp. 2201–2206. [Google Scholar] [CrossRef]
  15. Ding, X.; Xu, J.; Sun, Y.; Liao, S. Source-load coordinated control strategy for smoothing wind power fluctuation in grid-connected high energy consuming electrolytic aluminum industrial power grid. Dianli Zidonghua Shebei/Electr. Power Autom. Equip. 2022, 42, 47–55. [Google Scholar] [CrossRef]
  16. Wang, Y.; Xie, H.; Zhu, H. Source-load coordinated optimal planning method of electrolytic aluminum industrial park. Dianli Zidonghua Shebei/Electr. Power Autom. Equip. 2024, 44, 132–140. [Google Scholar] [CrossRef]
  17. Yue, X.; Fu, L.; Liao, S.; Xu, J.; Ke, D.; Wang, H.; Feng, S.; Yang, J.; He, X. A source-load collaborative stochastic optimization method considering the electricity price uncertainty and industrial load peak regulation compensation benefit. Int. J. Electr. Power Energy Syst. 2025, 167, 110630. [Google Scholar] [CrossRef]
  18. Dai, L.; Kang, Z.; Chen, R.; Wang, L. Study on multi-objective maintenance decision optimization for bridge networks based on NSGA-III. Tumu Gongcheng Xuebao/China Civ. Eng. J. 2024, 57, 41–52. [Google Scholar] [CrossRef]
  19. El Qouarti, O.; Nasser, T.; Essadki, A.; Akarne, Y. AC/DC hybrid microgrid energy management optimization as a decisive factor towards De-Carbonization and rational integration of electrical self-generating units using three-objective grey wolf optimization algorithm-power to X and renewable energies solutions. Int. J. Hydrogen Energy 2025, 138, 1116–1130. [Google Scholar] [CrossRef]
  20. Ullah, K.; Hafeez, G.; Khan, I.; Ullah, S.; Alghamdi, B.; Alsafran, A.S.; Kraiem, H. Energy optimization using hybrid demand response, renewable energy, and storage battery: A tri-objective optimization approach. Sustain. Cities Soc. 2025, 122, 106145. [Google Scholar] [CrossRef]
  21. Haarberg, G.M. Electrowinning of Aluminum—Challenges and Possibilities for Reducing the Carbon Footprint. Electrochemistry 2024, 92, 043002. [Google Scholar] [CrossRef]
  22. Zhang, X.; Hu, X.; Zhao, J.; Chen, C.; He, G.; Zhang, L. The study of thermal-electrical coupling numerical simulation of aluminum electrolytic cell anode assembly and parameter optimization of steel claws. Results Eng. 2025, 26, 104738. [Google Scholar] [CrossRef]
  23. Xu, J.; Liao, S.; Sun, Y.; Ma, X.Y.; Gao, W.; Li, X.; Gu, J.; Dong, J.; Zhou, M. An Isolated Industrial Power System Driven by Wind-Coal Power for Aluminum Productions: A Case Study of Frequency Control. IEEE Trans. Power Syst. 2015, 30, 471–483. [Google Scholar] [CrossRef]
  24. Gao, B.; Niu, H.; Guan, Y.; Wang, Z.; Liu, J.; Taylor, M.P.; Chen, J.J.J. Visualization of Anode Effect in Aluminum Electrolysis. J. Electrochem. Soc. 2022, 169, 013505. [Google Scholar] [CrossRef]
  25. Morishige, T.; Haarberg, G.M.; Gudbrandsen, H.; Skybakmoen, E.; Solheim, A.; Takenaka, T. Effects of Composition and Temperature on Current Efficiency for Aluminium Electrolysis from Cryolite-Based Molten Alumina Electrolytes. ECS Trans. 2017, 77, 997. [Google Scholar] [CrossRef]
  26. Tang, F.; Liu, B. The crane development of furnace tending assembly based on virtual design. Light Met. 2010, 5, 39–41. [Google Scholar] [CrossRef]
  27. Lian, X.; Gao, H.; Shen, L.; Yu, Y.; Wang, Y.; Peng, Z. Life Cycle Assessment of Primary Aluminum Production. Processes 2025, 13, 419. [Google Scholar] [CrossRef]
  28. Liu, Z.; Xie, J.; Liu, Y.; Gong, F. Demand-Side Flexibility Series: Overview of Flexibility Potential in Aluminum Electrolysis Industry. Available online: https://rmi.org.cn/insights/industrial-dsf/ (accessed on 15 September 2023).
  29. Sun, K.; Li, J.; Zhang, H.; Li, T.; Li, J. First-Principles Study on the Mechanism of Greenhouse Gas Generation in Aluminum Electrolysis. Metals 2021, 11, 1118. [Google Scholar] [CrossRef]
  30. Liu, T.; Wu, Y.; Xu, H. Multi-task assisted multi-objective optimization algorithm for autonomous underwater vehicle path planning. Memetic Comput. 2025, 17, 8. [Google Scholar] [CrossRef]
  31. Chen, L.; Cao, L.; Wen, Y.; Chen, H.; Jiang, S.-L. A knowledge-based NSGA-II algorithm for multi-objective hot rolling production scheduling under flexible time-of-use electricity pricing. J. Manuf. Syst. 2023, 69, 255–270. [Google Scholar] [CrossRef]
  32. Liu, J.; Liu, Z.; Wu, Y.; Li, K. MBB-MOGWO: Modified Boltzmann-Based Multi-Objective Grey Wolf Optimizer. Sensors 2024, 24, 1502. [Google Scholar] [CrossRef]
  33. Shao, X.; Fan, Y. An Improved Beetle Antennae Search Algorithm Based on the Elite Selection Mechanism and the Neighbor Mobility Strategy for Global Optimization Problems. IEEE Access 2021, 9, 137524–137542. [Google Scholar] [CrossRef]
  34. Maduka, A.C.; Ogwu, S.O.; Ekesiobi, C.S. Assessing the moderating effect of institutional quality on economic growth—Carbon emission nexus in Nigeria. Environ. Sci. Pollut. Res. 2022, 29, 64924–64938. [Google Scholar] [CrossRef] [PubMed]
Figure 1. Process flow of aluminum electrolysis.
Applsci 15 10919 g001
Figure 2. Model of an aluminum electrolysis cell.
Applsci 15 10919 g002
Figure 3. Coordinated Dispatch Architecture for Source–Storage–Load Integration in Aluminum Electrolysis Industrial Parks.
Applsci 15 10919 g003
Figure 4. Solution process of the objective function.
Applsci 15 10919 g004
Figure 5. The 24 h variation curve of adjustable load and related power output in scenario 1.
Applsci 15 10919 g005
Figure 6. The 24 h curve of non-adjustable load and related power output in scenario 2.
Applsci 15 10919 g006
Figure 7. Distribution of Pareto optimal solution set.
Applsci 15 10919 g007
Figure 8. The 24 h variation curves of adjustable loads and related power outputs in scenarios 3, 4, and 5.
Applsci 15 10919 g008
Figure 9. 24-h variation curves of adjustable loads and power outputs in scenarios 6, 7, and 8.
Applsci 15 10919 g009
Figure 10. Correlation analysis between objectives.
Applsci 15 10919 g010
Figure 11. Model performance comparison.
Applsci 15 10919 g011
Figure 12. Comparison of Pareto frontiers.
Applsci 15 10919 g012
Table 1. Weight distribution.
Algorithm η 1 η 2 η 3
Scenario 3 vs. 60.40.30.3
Scenario 4 vs. 70.30.40.3
Scenario 5 vs. 80.30.30.4
Table 2. Calculation results of scenarios 3, 4, and 5.
Renewable Energy Penetration Rate Cost (10,000 CNY)Carbon Emissions (t)RE Consumption Rate
67.8% (1200 MW Wind +
1120 MW Solar)
Scenario 31199.6323,283.5873.36%
Scenario 41292.6022,636.6976.74%
Scenario 51260.2622,873.1477.82%
Table 3. Calculation results of scenarios 6, 7, and 8.
Renewable Energy Penetration Rate Cost (10,000 CNY)Carbon Emissions (t)RE Consumption Rate
76.2% (2400 MW Wind +
1120 MW Solar)
Scenario 6991.5618,126.1883.63%
Scenario 71270.7216,053.0783.47%
Scenario 81146.5417,385.3784.57%
Table 4. Algorithm parameter settings.
AlgorithmPopulationIterationsSpecific Parameters
NSGA-II500100pMutation = 0.4; pCrossover = 0.7
MOGWO500100alpha = 0.1; nGrid = 10;
beta = 4; gamma = 2;
IMOGWO500100alpha = 0.1; nGrid = 10;
beta = 4; gamma = 2;
Table 5. Comparison of algorithm performance.
AlgorithmNumber of Solution SetsHV (Mean ± Std)Runtime (s)
NSGA-II974.34261653.38
MOGWO984.6613239.25
IMOGWO1359.78396.7543
Disclaimer/Publisher’s Note: The statements, opinions and data contained in all publications are solely those of the individual author(s) and contributor(s) and not of MDPI and/or the editor(s). MDPI and/or the editor(s) disclaim responsibility for any injury to people or property resulting from any ideas, methods, instructions or products referred to in the content.