Article

Resilience Assessment of Cascading Failures in Dual-Layer International Railway Freight Networks Based on Coupled Map Lattice

1
School of Transportation and Logistics, Southwest Jiaotong University, Chengdu 611756, China
2
National United Engineering Laboratory of Integrated and Intelligent Transportation, Southwest Jiaotong University, Chengdu 611756, China
*
Author to whom correspondence should be addressed.
Appl. Sci. 2025, 15(20), 10899; https://doi.org/10.3390/app152010899
Submission received: 13 September 2025 / Revised: 8 October 2025 / Accepted: 9 October 2025 / Published: 10 October 2025

Abstract

The China Railway Express (China-Europe container railway freight transport) is pivotal to Eurasian freight, yet its transcontinental railway faces escalating cascading risks. We develop a coupled map lattice (CML) model representing the physical infrastructure layer and the operational traffic layer concurrently to quantify and mitigate cascading failures. Twenty critical stations are identified by integrating TOPSIS entropy weighting with grey relational analysis in dual-layer networks. The enhanced CML embeds node-degree, edge-betweenness, and freight-flow coupling coefficients, and introduces two adaptive cargo-redistribution rules—distance-based and load-based for real-time rerouting. Extensive simulations reveal that network resilience peaks when the coupling coefficient equals 0.4. Under targeted attacks, cascading failures propagate within three to four iterations and reduce network efficiency by more than 50%, indicating the vital function of higher importance nodes. Distance-based redistribution outperforms load-based redistribution after node failures, whereas the opposite occurs after edge failures. These findings attract our attention that redundant border corridors and intelligent monitoring should be deployed, while redistribution rules and multi-tier emergency response systems should be employed according to different scenarios. The proposed methodology provides a dual-layer analytical framework for addressing cascading risks of transcontinental networks, offering actionable guidance for intelligent transportation management of international intermodal freight networks.

1. Introduction

With the advancement of global economic integration, international railway freight transportation is undergoing unprecedented growth [1]. Driven by China’s Belt and Road Initiative, cross-border railway transport services, exemplified by the China Railway Express (China-Europe container railway freight transport), have rapidly become a vital link between Europe and Asia [2]. The China Railway Express has developed three main corridors—northern, central, and southern—serving 229 cities across 26 European countries and over 100 cities across 11 Asian countries. As of 15 November 2024, the China Railway Express has operated a total of 100,000 trains, with 11 million TEUs of cargo transported with a value of over 420 billion USD. Due to its efficiency and reliability, the China Railway Express has not only facilitated regional trade but also emerged as a key pillar supporting international economic cooperation.
However, as the network expands and operational environments become more complex, international railway intermodal networks are increasingly vulnerable to sudden disruptions [3]. Cascading failure [4,5] means a phenomenon where the failure of one or more nodes/edges can trigger failures in other nodes/edges through their interactions, leading to the redistribution of flow. This network spanning multiple countries and regions plays a crucial role in international trade. A failure in any node or edge can severely disrupt railway transportation in countries along the route, obstructing trade and business flow. Factors such as fluctuations in freight volumes, extreme weather [6], and policy changes can trigger node or edge failures, causing cargo congestion and delays, and thus reducing the efficiency of scheduled services. Furthermore, unexpected events like the COVID-19 pandemic (2020–2023) and wars have increased the risk of network failures [7]. For example, cargo congestion caused by equipment malfunctions or natural disasters can disrupt transportation services [8,9]. Disruptions from security incidents or misinformation attacks in transport networks can have an even greater impact on overall operations [10]. In this context, studying network structures and their robustness to failures is essential for ensuring operational safety [11]. Additionally, historical, economic, and international factors influencing railway and yard construction in each country limit the transport capacity of basic networks. That makes nodes or connections in international freight networks more prone to failure. Changes in the state of nodes across various dimensions and levels result in disparities in global network efficiency. For instance, in June 2020, floods in Mongolia destroyed part of the railway, delaying international freight trains by 3 days and causing severe congestion at border ports. In August 2020, insufficient capacity in the Kazakhstan section caused nearly 50 trains to queue at the border port. Congestion incidents in the international railway freight network are frequent, significantly disrupting normal transportation. Practices of the China Railway Express indicate that operational failures caused by congestion and delays lead to low transportation efficiency [12]. Existing research has examined various types of disruptions that occurred and actual freight flow is taken into account to assess vulnerability under multiple disruption scenarios [13]. Therefore, conducting in-depth research on the vulnerability of international railway networks and accurately identifying key nodes and regions is vital for improving the stability of international railway transport.
However, most of research focuses on domestic networks but overlooks attention on cross-border networks. Additionally, they rarely consider the interaction between network structure, capacity, and its impact on node status. Building on the context above, this study aims to answer the following research questions: (1) How can a bi-level coupled network model, tailored to the characteristics of international railway intermodal transport, be developed to quantify the mechanisms of cascade failure propagation? (2) What is the vulnerability of international railway freight networks and critical nodes during cascade failure events? (3) How can key vulnerable nodes and edges be identified, and what multi-level optimization strategies can be designed to enhance network robustness?
This study focuses on the vulnerability analysis of international railway intermodal networks, employing the TOPSIS entropy weighting method and gray correlation analysis to identify key nodes. An improved Coupled Map Lattices (CML) method is used to develop a node state model. Based on this model, two cargo redistribution rules are proposed to mitigate potential transportation disruptions. The model’s validity is verified through an example study of the China Railway Express freight network.
The innovations and main contributions of the present study are in the following:
(1)
Topological models of the basic route network and transport service network are constructed based on the operational characteristics of the international railway freight network, providing a foundation for subsequent cascade failure research.
(2)
A set of multi-dimensional vulnerability assessment indicators is selected, including the maximum connected graph, network efficiency, transportation performance, and affected cargo flow rate, from both topological and transportation service perspectives. A vulnerability assessment system is established by combining the TOPSIS entropy weighting method and gray correlation analysis, effectively identifying key vulnerable nodes in the international railway freight network.
(3)
A dynamic node state evolution model, based on the improved Coupled Map Lattices (CML) method, is presented. Two cargo redistribution rules are designed: one based on node distance and the other on node load. These rules reveal changes in network efficiency under different attack strategies (random and targeted), offering new tools for dynamic vulnerability analysis.
(4)
Simulation experiments are used to quantify the impact of cascade failures. Multi-level optimization measures are proposed, including strengthening border railway connections, regularly evaluating and optimizing the operational capacity of key nodes and routes, improving cargo redistribution rules, and formulating emergency response plans for unforeseen events. These measures offer decision-making support and new methods for ensuring the stability and efficiency of international railway intermodal networks.
The remainder of this paper is organized as follows: Section 2 presents the related work on railway network characteristics and cascade failures. Section 3 analyzes the composition of the international railway freight network, introduces indicators for network assessment, presents methods for identifying key nodes, and discusses the development of the improved CML model. Section 4 presents an example study of the China Railway Express. Section 5 summarizes the research conclusions and suggests directions for future research. The research framework is demonstrated in Figure 1.

2. Related Work

As the transportation volume of international railway freight trains increases, scholars have examined various aspects of the international railway freight network from different viewpoints. Network construction serves as the foundation of fundamental research on international railway freight networks. Geographic Information System (GIS) technology has been applied to expand the transcontinental freight network and build international freight networks [14]. The rules for complex network generation and evolution have been established, leading to the formation of the topological network for railway freight [15].
In recent years, a rising number of scholars have been interested in the structure and function of transport networks, investigating network characteristics and vulnerabilities. Dong et al. [16] constructed dual-layer network models that consisting both physical infrastructure and service operations are integrated to identify critical vulnerabilities and evaluate the efficacy of various recovery strategies through different disturbances. Xu et al. [17] proposed a multilayer MPTN model using an extended L-space framework combined with coupled map lattices. Guo et al. [18] constructed a metro-bus double-layer network that accounting for the varying load of each node, whose aim was to analyze the evolution process under different load fluctuation. They simulated its cascading robustness and analyzed the results, revealing variations in network topology and disturbance thresholds.
As transportation efficiency improves, the heterogeneity and “scale-free” characteristics of the international railway freight network have increasingly revealed the risk of cascading failures. Scholars have analyzed the impact of node, edge, and line failures on passenger travel in urban rail transit networks [19] and proposed a vulnerability assessment model for transportation networks, which incorporates external factors like logistics costs and supply delays [20]. Ma et al. [21] proposed a cascading failure model according to train delay propagation from a multi-layer network viewpoint. Additionally, the coupling performance of multimodal public transport networks under cascading failure conditions has been studied, offering a new perspective for network-wide cascading reliability testing based on complex networks [22]. Song et al. [23] proposed a cascading failure model combining betweenness and power-law degree bias, which is applied to extreme fluctuations in load that follow a Poisson distribution.
Cascading collapse in railway freight networks, triggered by node and edge failures through load redistribution, has attracted significant attention. Research on node failures highlights that the failure of high-connectivity hubs may paralyze the entire network. In this context, assessing node importance becomes a core issue. Traditional topological indicators overlook factors such as freight volume and economic radiative capacity. Consequently, scholars have proposed using multi-attribute decision-making frameworks [24], with the TOPSIS model being widely applied for its multi-dimensional compatibility and dynamic sensitivity. Ippolito and Cats [25] ranked nodes in the European railway freight network using distance-weighted centrality and the TOPSIS model. Guo et al. [26] proposed a weighted TOPSIS method that significantly improved the accuracy of node importance identification by introducing a 1% node cascading impact factor. In this study, the TOPSIS model based on complex network theory is used to evaluate nodes and identify the optimal integration center.
Additionally, edge failures are equally significant, particularly in cross-border railway transportation, where the failure of border port edges may lead to significant transportation delays and cargo congestion. Li et al. [3] proposed a four-stage framework based on Bayesian networks to identify key disruptive factors affecting operational resilience in cross-border freight railway systems. Shi and Li [27] also explored the impact of dynamic demand and capacity at border ports on international freight train operation planning, proposing a heuristic method based on NSGA-II to optimize operations and mitigate transportation delays caused by edge failures. Wang et al. [28] developed a new edge-load based cascading failure model, incorporating both intra-layer network structure and inter-layer functional and geographical interdependencies, whose results demonstrate the vital support of parent-dependency in networks.
Scholars have extensively discussed the modeling of cascading failures. It is highly complex owing to topological heterogeneity and the dynamic redistribution of cross-border freight flows. Several models have been applied to address cascading failures in interdependent networks, such as load redistribution models [29], percolation theory [30], and Coupled Map Lattice (CML) models [31]. The load redistribution model simulates emergency rerouting behavior but neglects the scale-free characteristics of hub nodes, whereas the percolation theory model effectively evaluates random failures but struggles to quantify institutional risks, such as policy changes. In contrast, the CML model quantifies cascading propagation paths through topological and flow coupling coefficients, making it particularly suitable for analyzing complex dynamic propagation processes in railway freight networks. Therefore, this study utilizes an improved CML framework to construct a cascading propagation model. Lu et al. [32] addressed the evolution of cascading failures in rail transit networks by using an improved CML model, further revealing the impact of station resilience, geographical location, and neighboring node types on cascading propagation paths. Zhang et al. [33] developed an improved CML model, comprehensively considering the nonlinear geographical dependencies and initial state sensitivity between metro and bus networks to accurately simulate the dynamic evolution of cascading failures in multimodal transport systems. Chen et al. [34] proposed an improved CML model embedded with spatial and functional interdependence to accurately capture the dynamic characteristics of intermodal and intramodal nodes.
Although significant progress has been made in transportation network vulnerability and cascading failure modeling, notable gaps remain in research related to international railway freight networks that need to be addressed: (1) Limited focus on cross-border networks: Most existing studies focus on domestic networks, with relatively few addressing cross-border transportation networks. For example, based on complex network theory, existing studies have assessed the vulnerability of urban rail transit networks, analyzing the influence of network topology on system stability meanwhile [35]. Other studies focus on regional high-speed rail networks, examining their resilience under extreme weather conditions such as typhoons [36]. However, as international railway freight networks connect different countries and regions, their structural and functional vulnerabilities remain insufficiently studied. (2) Inadequate analysis of cargo redistribution: In cascading failure research, cargo redistribution plays a critical role, but existing studies have not adequately revealed the rules of cargo redistribution in international railway freight networks. For instance, some studies have established mathematical models to simulate traffic flow distribution and cascading failure processes within transportation networks [37], but fewer have conducted in-depth analyses considering the specificities and complexities of international railway freight networks. Moreover, existing research rarely considers the interaction between network structure, capacity, and its impact on node status.
These gaps highlight the need for more comprehensive studies to address the unique challenges and interdependencies of international railway freight networks, particularly regarding cascading failures and the dynamics of cargo redistribution. Therefore, this paper will examine both the network structure and cargo redistribution rules to study the changes in node status, using the China Railway Express freight network as an example study. Future research should further refine node importance assessment methods, considering the degree of coupling between the basic infrastructure network and the transportation network, to make them more suitable for the practical operation and management of international railway freight.

3. Materials and Methods

3.1. Composition of the Eurasian Railway Freight Network

International railway intermodal transport spans multiple countries and encompasses a vast array of transportation corridors. This paper defines the international railway intermodal network as a composite system, comprising both the basic infrastructure network and the transportation service network. The scope of international railway transportation in our country is in Eurasia, so the Eurasian freight network is getting attention in the following.

3.1.1. Basic Line Network

The basic line network serves as the foundation of the Eurasian railway freight network. Based on the characteristics of international railway transport, this paper defines the basic line network as the physical infrastructure, comprising railway stations, facilities, and tracks that connect the stations, and which determines the train operation routes and stops.
The 13 Asia-Europe intermodal railway transport corridors and the 11 freight corridors in Europe planned by the International Organization of Railways are used as the basic line network in the Eurasian Railway Freight Network.
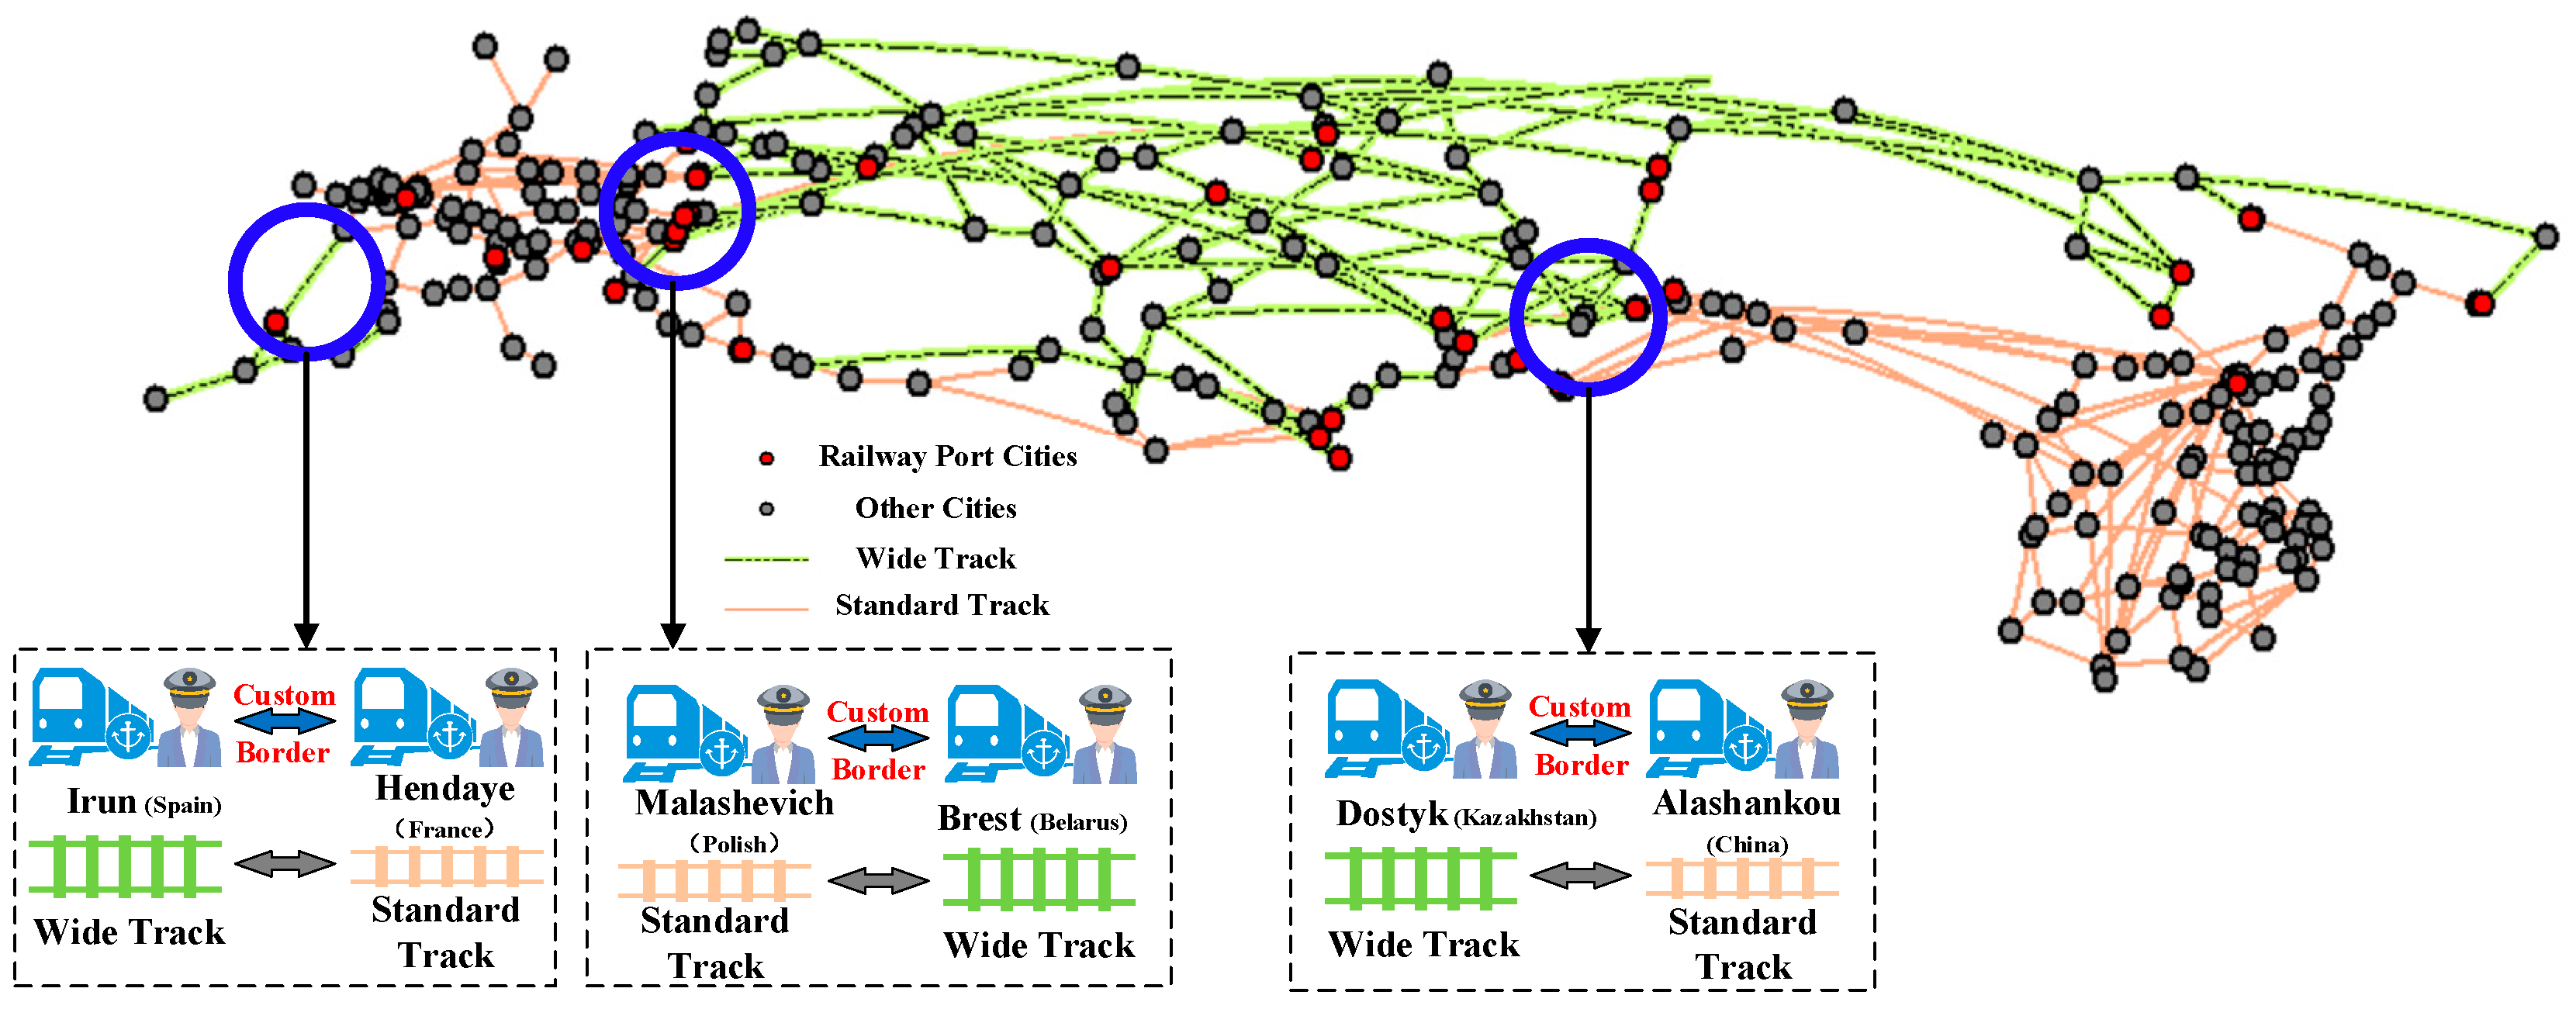
The Eurasian railway freight network involves specific operations, such as border inspections and track changeovers. For example, most current trains, including the China Railway Express, require two track changes, while the China Railway Express (Yiwu–Madrid) undergoes a third track change in Irun. The schematic diagram of the basic line network is illustrated in Figure 2.

3.1.2. Transportation Service Network

The basic line network forms the foundation of the transportation service network, consisting of railway stations and the trains passing between them, determining the routes and stops of the trains (Figure 3). The transportation service network facilitates the circulation of cargo by providing transport services and operates a specified number of trains based on transport demand.
At present, the China Railway Express and other brand lines provide transportation services for Eurasian railway freight, they can be used as the transportation service network in the Eurasian railway freight network.

3.1.3. Relationship Between Basic Line Network and Transportation Service Network

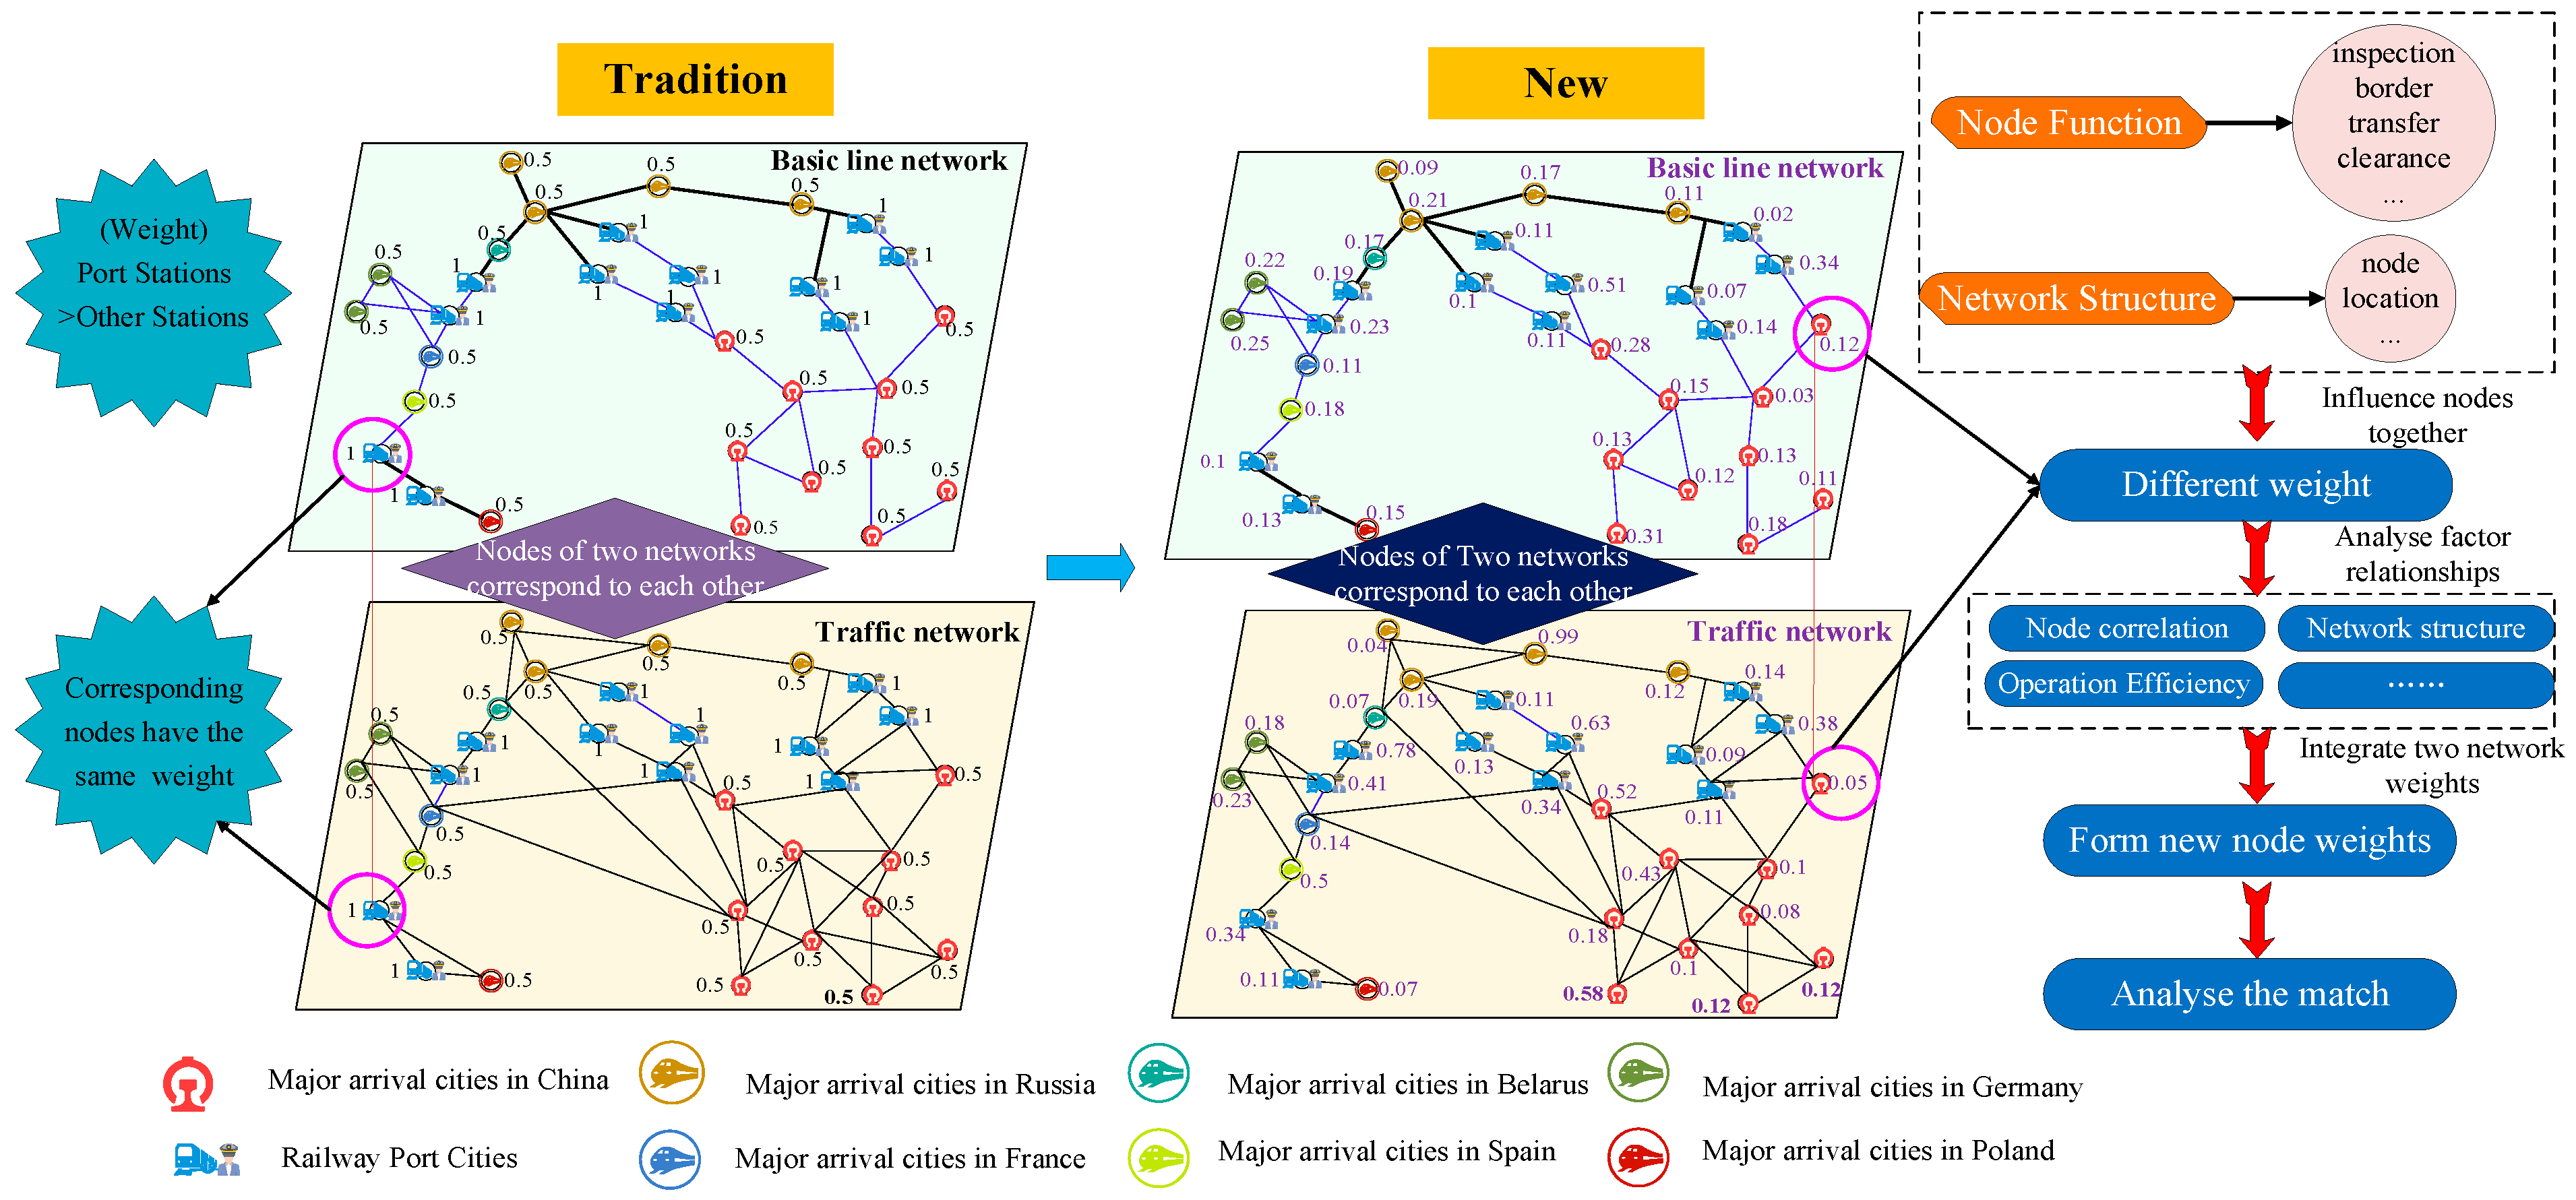
International railway freight transport focuses on aligning the transportation service network with the basic line network. Network stability levels may differ significantly due to variations in node functions and supply–demand relationships, even when spatial structures and network organizations are identical. The difference in node weights across networks is ignored in traditional research. In reality, the importance of nodes in the basic line and transportation service networks varies depending on their function and the overall network structure.
In terms of node functions, there are origin stations, terminal stations, hub stations, railway port stations, and other types in the networks. For instance, railway port stations are responsible for border inspection, transshipment and other operations. It is evident that the trains are required to pass these nodes and stay for a long time, making them rank top in the networks. For the basic line network and transportation service network, the weight values are equal if the node functions are identical.
As for network structure, individual nodes within the network are connected to varying numbers of neighboring nodes, which results in differences in their structural status. Specifically, the more adjacent nodes they are, the higher the importance of nodes. Given the structural disparities of the basic line network and the transportation service network, the weight of the same node is different in these two systems.
Node weights in both the basic line and t transportation service networks are influenced by node function and network structure, leading to different node weight values between sub-networks. This makes the international railway freight network more realistic and intricate. Unlike traditional research, we derive the matching relationship graph between the basic line network and the transportation service network, shown in Figure 4.

3.2. Vulnerability Assessment of International Railway Freight Network

In railway freight transport networks, when the station or line is attacked and fails, the station or line is unable to provide normal transport services, which leads to a reduction in network performance. Therefore, the vulnerability of the international railway freight network is defined as the degradation degree of network performance (connectivity and transport service function) after some nodes or edges fail, when the international railway freight network is subjected to external disruptions (natural disasters, terrorist attacks, capacity constraints). The following section outlines the vulnerability assessment indicators, which include topological vulnerabilities and functional vulnerabilities. You can find the lists of symbols in Supplementary Material A Table S1).

3.2.1. Topological Vulnerability Indicators

  • The Maximum Effective Graph
If any two nodes are reachable in a real network, it is a connected network. The connected network may be fragmented into several sub-networks when some nodes are attacked. The maximum effective graph [38] refers to the sub-network with the most nodes, which reflects the local characteristics of the network.
S = N i R N
where N i R is the number of nodes in the maximum effective graph after cascading failures and N is the number of nodes in the initial network. S ranges [0, 1]. It is the initial network when the value is 1, and all nodes in the network are independent when the value is 0.
2.
The Network Efficiency
Network efficiency [39] describes the connectivity level of the whole network which is defined as follows:
E ( G ) = 1 N ( N 1 ) i i 1 d i j
where E ( G ) shows the global connectivity of the network and d i j is the shortest path length between node i and j . As the global efficiency increases, the global connectivity becomes better.

3.2.2. Functional Vulnerability Indicators

  • Transportation Performance
The international railway freight network is a weighted network about cargo flow, so freight traffic of nodes is introduced, which is described as follows:
F s u m ( G ) = i G F i ( V i )
When node i fails, the cargo of node i will be redistributed to its neighbouring nodes according to certain rules. The transport performance [40] is defined as follows:
T P = F s u m ( N ( t ) ) F s u m ( G )
where F s u m N t is the cargo flow of the maximum effective graph and F s u m ( G ) is the original cargo flow.
2.
Affected Cargo Flow Rate
We define the affected cargo flow rate [41] as the ratio of the amount of cargo at the failed node to the total amount of cargo in the initial network:
F a f f e c t = i V F i j V F j
where F a f f e c t is the affected cargo flow rate, F i is the cargo amount of node i , V is the set of failure nodes and V is the set of initial nodes.

3.3. Key Nodes Identification for Multi-Layer Complex Networks

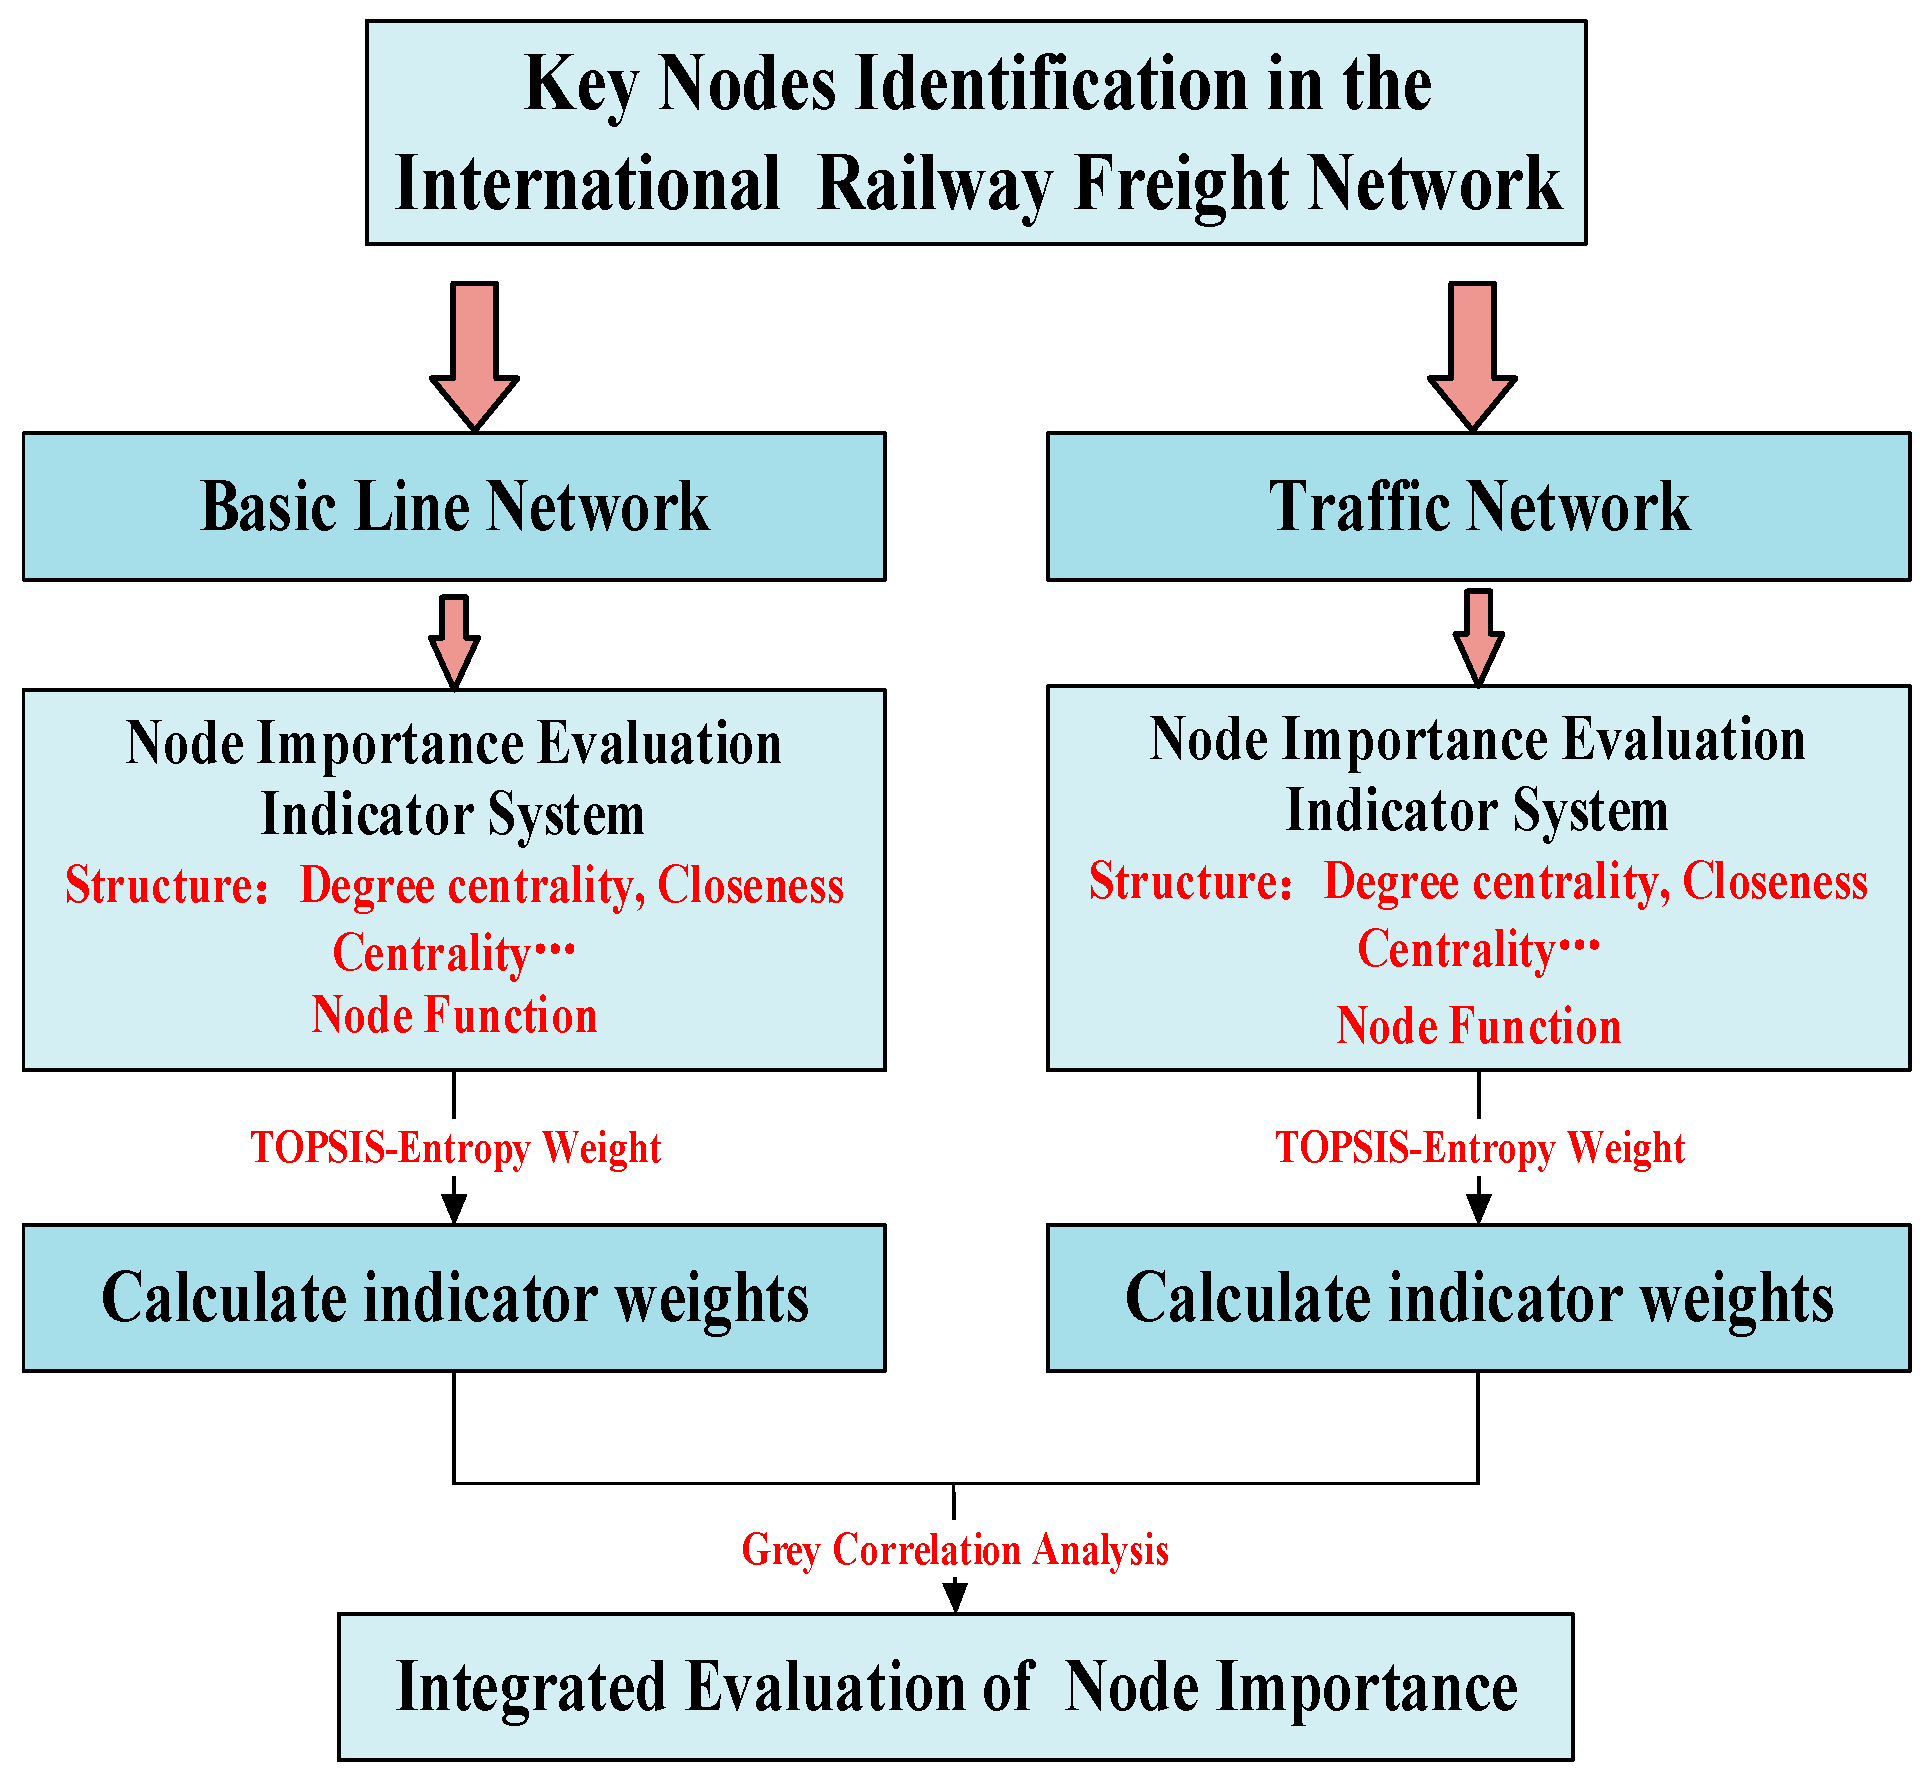
This study evaluates the importance of each node in the international railway freight network by analyzing the network’s topological structure and selecting several multi-dimensional evaluation indicators, such as degree centrality and betweenness centrality. A node ranking method for a single network is developed, and a fusion algorithm is applied to integrate the evaluation results of both the basic line network and the transportation service network. This approach enables the identification of critical nodes within the international railway freight network. The process of identifying critical nodes is illustrated in Figure 5.

3.3.1. Node Importance Evaluation Indicator System

1.
Degree Distribution
The number of edges connecting to node i is represented by the node degree k i , which reflects the local connectivity of the international railway freight network.
k i = j N a i j
where N is the number of nodes and a i j indicates whether there is an edge between node i and node j .
2.
Betweenness
Betweenness reflects the global characteristics of the network, including node betweenness B i and edge betweenness B i j . They are given as follows:
B i = n m d m n ( V i ) d m n
B i j = n m d m n ( a i j ) d m n
where d m n is the number of shortest paths from node m to n , d m n ( V i ) is the number of shortest paths from node m to n through node i , and d m n ( a i j ) is the number of shortest paths from node m through edge a i j to node n .
3.
Degree Centrality
Degree centrality D C i means the ratio of the degree value of node i to the number of edges that node i is connected to all other nodes, which is described as follows:
D C i = k i N 1
where k i is the degree of node i .
4.
Closeness Centrality
Closeness degree is defined as the inverse of the sum of the distances from node i to all other nodes, while closeness centrality C C i is the inverse of closeness degree.
d i = 1 N 1 j = 1 N d i j
C C i = 1 d i
where d i denotes the average distance from node i to each of the remaining nodes.
5.
Betweenness Centrality
Betweenness centrality refers to the sum of betweenness of all other nodes to node i , which is shown as follows:
B C i = s i t n s t i g s t
where n s t i denotes the number of paths passing through node i in the shortest path between node s and node t and g s t denotes the number of shortest paths connecting node s and node t .
6.
Eigenvector Centrality
Eigenvector centrality E C i is expressed as the importance of node i in all networks, and is calculated as follows:
E C i = x i = c j = 1 N a i j x j = c A x
where x i is the importance of node i , c is a constant of proportionality, A is the neighbourhood matrix of the network.
7.
Node Efficiency
Node Efficiency [42] measures the efficiency of communication between the first neighbouring node of node i when node i fails.
E i = 1 N 1 j 1 , j i N 1 d i j

3.3.2. Node Importance Evaluation Based on TOPSIS Entropy Weight Method and Grey Relational Analysis

In this study, node importance is evaluated using the TOPSIS method, where the entropy weight method determines the weight of each indicator. Subsequently, gray correlation analysis is applied to each subsystem to clarify the numerical relationships between them. The maximum importance evaluation value from each single-layer complex network is combined as the reference object, and the gray correlation between other nodes and this reference object is calculated. This produces the final comprehensive evaluation value for each node.
1.
TOPSIS Entropy Weight Method
Step 1: Construct the Original Decision Matrix.
Let N denote the number of nodes in a single network, and M denote the number of node importance evaluation indicators. The indicator values for each node in the network are denoted as x i j ( i = 1,2 , 3 , , N ; j = 1,2 , 3 , , M ) , resulting in the original decision matrix A , as follows:
A = x i j N × M = x 11 x 12 x 1 M x 21 x 22 x 2 M x N 1 x N 2 x N M
Step 2: Positive Normalization Processing.
For convenience in subsequent calculations, all indicators are converted to the maximization type. The formula for converting interval-type indicators to maximization-type indicators is as follows:
c = max a min x i , max x i b
x ~ i = 1 a x c , x < a 1 , a x b 1 x b c , x > b
Step 3: Standardization.
The normalized matrix is standardized to eliminate the impact of different dimensions. The standardized matrix is denoted as Z , and the calculation formula is as follows:
z i j = x i j i = 1 n x i j 2 ( i = 1,2 , 3 , , n ; j = 1,2 , 3 , , m )
Step 4: Calculate the Probability Matrix.
It involves determining the weight of the j node under the i indicator.
p i j = z i j i = 1 n z i j
Step 5: Determining Weights Using the Entropy Weight Method.
The information entropy and utility value of each indicator are calculated, and their entropy weights are determined through normalization. The formulas for calculating the information entropy e j and the utility value d j of the j indicator are given below:
e j = 1 ln n i = 1 n p i j ln ( p i j )
d j = 1 e j
The normalized information utility values are used to determine the weight of each indicator:
w j = d j j = 1 m d j
Step 6: Determining the Positive Ideal Solution R + and Negative Ideal Solution R .
The weight matrix w = w 1 , w 2 , , w m is multiplied by the standardized decision matrix Z to produce the weighted decision matrix R = r i j n × m . R + and R are determined from the maximum and minimum values in the weighted decision matrix, as shown below:
R + = max ( r i j ) = r 1 + , r 2 + , , r m +
R = min ( r i j ) = r 1 , r 2 , , r m
Step 7: Calculate the distance of each evaluation indicator from R + and R , as follows:
D i + = j = 1 m w j r j + r i j 2
D i = j = 1 m w j r j r i j 2
Step 8: Calculation of the overall importance evaluation value.
The proximity of each solution to the positive ideal solution is calculated, and the importance evaluation value of the i node is determined using the formula below:
S i = D i D i + + D i
2.
Gray Relational Analysis
Step 1: Construct the sample matrix and normalize the data.
In the China Railway Express freight network, the number of nodes is the same in both the basic line network and the transportation service network. Therefore, it is assumed that the China Railway Express freight network consists of G networks, each containing H nodes. Based on the importance evaluation values, a sample matrix B is constructed as follows:
B = b i j G × H = b 11 b 1 H b G 1 b G H
The new matrix B is normalized by B to minimize the fluctuation range of importance values across different nodes within the same network layer. The normalization formula is given as follows:
b i j = b i j min ( b j ) max ( b j ) min ( b j )
Step 2: Determining the Reference and Evaluation Objects.
The largest element in each row of the matrix B is selected as the reference object, forming the reference sequence Y , as shown in the following equation. The importance evaluation values of the nodes in both the basic railway network and the transportation service network are used as the evaluation objects for grey relational analysis, represented by the matrix B .
Y = y 1 y G
Here, y G = max ( b G j ) , j = 1,2 , , H .
Step 3: Calculating the Grey Relational Degree.
The grey relational degree of each node in the network relative to the reference object is calculated using the grey relational degree formula. This value is then used as the comprehensive importance evaluation value for the nodes in the combined network.
e i j = m i n i = 1,2 , , G m i n j = 1,2 , , H y i b i j + ρ m a x i = 1,2 , , G m a x j = 1,2 , , H y i b i j y i b i j + ρ m a x i = 1,2 , , G m a x j = 1,2 , , H y i b i j
r j = i = 1 G e i j G
Here, e i j is the grey relational coefficient between the evaluation object and the reference object; ρ is the grey analysis coefficient, ranging from 0 to 1, typically set at 0.5; and r j represents the degree of association between the evaluation object and the reference object, reflecting the importance of each node. The value of e i j is influenced by the grey analysis coefficient ρ , which is used to reduce the effect of the maximum difference value m a x i = 1,2 , , G m a x j = 1,2 , , H y i b i j and improve the significance of the difference between the correlation coefficients. The smaller ρ is, the smaller ρ m a x i = 1,2 , , G m a x j = 1,2 , , H y i b i j is, and the greater the y i b i j is. It indicates the greater the degree of discrimination, and the more obvious the difference in the correlation coefficients of different nodes.

3.4. Network Vulnerability Assessment Model Based on Cascading Failures

In this paper, cascading failure is defined as the failure of one or more nodes/edges leading to the failure of other nodes/edges through their relationships and the redistribution of flow. This results in a chain reaction, ultimately causing some or all nodes/edges in the network to fail. Cascading failure occurs when a node or edge in the international railway freight network is disturbed (due to natural disasters, terrorist attacks, or capacity limitations), preventing cargo from passing through that node or edge. Consequently, the cargo must be redistributed to other nodes, potentially causing their capacities to exceed limitations and resulting in failure. This section introduces the improved Coupled Mapping Lattice (CML) model and discusses the flow redistribution rules, which include two cargo reallocation strategies: one based on the load at adjacent nodes, and the other based on the distance between adjacent nodes.

3.4.1. Node State Model Based on Improved CML

(1)
Node State Model Under Normal Conditions
In international railway freight networks, node states are influenced by both structural properties and cargo flow distribution. Therefore, this study incorporates both the structural coupling coefficient and the cargo flow coupling coefficient. The improved node state model is developed by considering factors such as node degree, betweenness, and cargo flow. The corresponding model equations are as follows:
x i ( t + 1 ) = 1 e 1 e 2 e 3 f x i t + e 1 j = 1 , j i n a i j f x j t k i + e 2 j = 1 , j i n a i j B i j f x j t 2 B i + ( N 1 ) + e 3 j = 1 , j i n a i j F i j f x j t S i
f x = 4 x 1 x
where x i ( t + 1 ) denotes the state of node i at time t + 1 , a i j represents the connection weight between node i and node j , and B i j indicates the freight-flow coupling coefficient between node i and node j . F refers to the freight flow at node i . The parameters e 1 , e 2 , and e 3 denote the coupling coefficients of node degree, edge betweenness, and freight flow, respectively. Based on previous studies [43,44,45], the coupling coefficients are defined by the constraint e 1 + e 2 + e 3 1 , while satisfying the normalization constraint e 1 , e 2 , e 3 ( 0,1 ) which can be optimized via grid search to determine the optimal coupling coefficient combination e 1 , e 2 , e 3 . Under the constraint e 1 + e 2 + e 3 = 1 , the parameter space is traversed with a step size of 0.1 to generate all feasible combinations. The optimization objective is to minimize the network efficiency degradation rate, and the loss function is defined as L ( e 1 , e 2 , e 3 ) = 1 T t = 1 T 1 E ( t ) E ( 0 ) . Here, E ( t ) represents the network efficiency after the t round of cascading, and T denotes the total number of simulation rounds. Finally, the coefficient combination that minimizes L ( e 1 , e 2 , e 3 ) is selected through simulation experiments. In comparison with the traditional CML model (which uses a single coupling coefficient e ), this paper introduces the parameters e 1 , e 2 , e 3 , thereby increasing the model’s complexity. However, the computational burden is controlled via the constraint e 1 + e 2 + e 3 1 . Traffic flow exhibits chaotic characteristics, which can be modeled using chaotic logistic mapping. Therefore, this paper selects f x as the chaotic logistic mapping, where 0 x 1 and   0 f x 1 , defined f x = 4 x 1 x simulates the nonlinear evolution of node states, representing the evolution of node capacity constraints.
(2)
Node State Model Under External Disturbances
If the state of all nodes in the international railway freight network lies within the range (0, 1), it indicates that these nodes can provide stable and efficient transportation services, free from interference such as abnormal loads, equipment failures, or congestion; in other words, they are operating normally. If external interference R ( R 1 ) is used to node i at time m + 1 , node i will fail. Therefore, the node state under external interference R can be described as follows:
x i ( m + 1 ) = 1 e 1 e 2 e 3 f x i m + e 1 j = 1 , j i n a i j f x j m k i + e 2 j = 1 , j i n a i j B i j f x j m 2 B i + ( N 1 ) + e 3 j = 1 , j i n a i j F i j f x j m S i + R
When node i is unable to operate normally at time m + 1 due to equipment failure, overload, or other abnormal situations, its state x i ( m + 1 ) = 0 will be affected. As a result, the states of its neighboring nodes will also be influenced. Therefore, at time m + 1 , the network state will be recalculated. If the state of a neighboring node exceeds 1, the neighboring node will fail as well and be removed from the network.

3.4.2. Flow Redistribution Rule

In the case of cascading failures, when a station fails to provide adequate transportation services, shippers will opt for alternative transport routes, resulting in the redistribution of goods. According to Motter and Lai’s model [46], node capacity and the initial node load are positively correlated, as shown below:
C i = 1 + a L i 0
where C i is the capacity of node i and L i 0 is initial load of node i . The constant a 0 , which is the capacity limiting factor.
1.
Cargo redistribution rules based on neighbouring node loads
The load of a failed node is proportionally redistributed among its neighboring nodes according to their remaining available capacity, which is defined as the difference between total capacity and current load. Specifically, nodes with greater remaining available capacity, owing to their higher carrying potential, will take on a larger share of the failed node’s load. The load increment Δ L j t transferred from the failed node i to its neighboring node j is calculated using the following formula:
L _ r e s t j t = C j L j 0
Δ L i j t = L i t L _ r e s t j t m A L _ r e s t m t
where L _ r e s t j t is the residual load of node j at time t and A is the set of neighbouring nodes of failed node i . Therefore, the increased load of node j is:
Δ L j t = i A Δ L i j t
where A is the set of neighbouring nodes of failed node j at moment t .
2.
Cargo redistribution rules based on neighbouring node distance
Neighboring nodes in closer proximity to the failed node receive a larger portion of the redistributed load. Therefore, the load increment Δ L j t transferred from the failed node i to its neighboring node j is determined using the following formula:
Δ L i j t = L i t 1 d i j m A 1 d i m
where d i j is the actual distance between node i and node j . The load of node j at moment t + 1 is:
L j t + 1 = L j t + Δ L j t

4. Results and Discussion

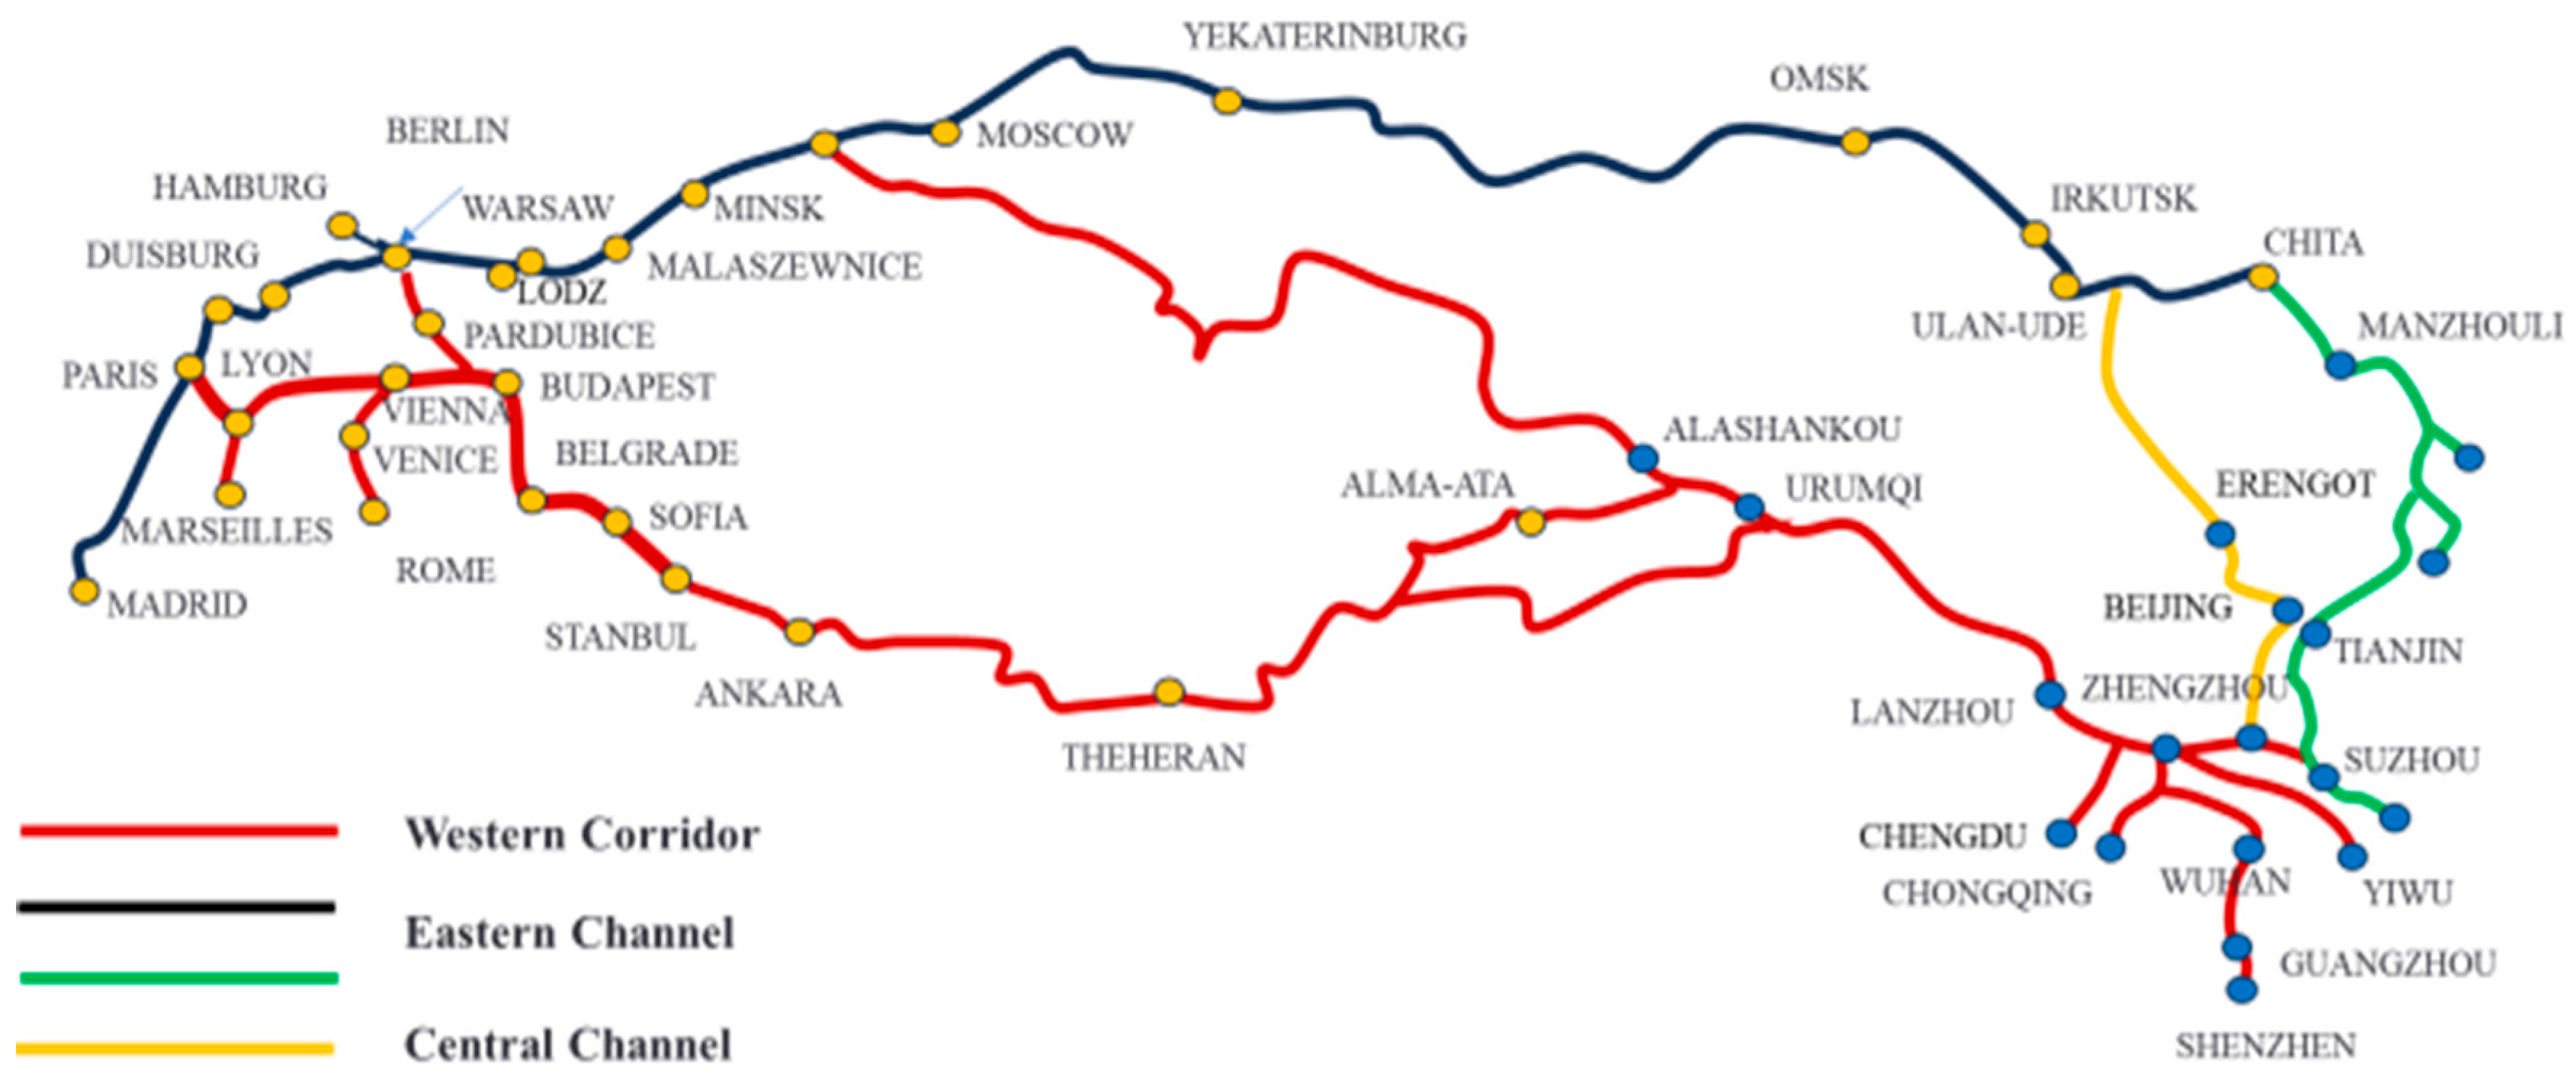
The China Railway Express freight network is a crucial component of the international railway freight network, which spans 26 European countries, presenting significant transportation risks (Figure 6). The freight volume of the China Railway Express network has steadily increased over the past decade. It is characterized by a complex transportation environment, intricate operational procedures (requiring at least two track changes), and strong representativeness of the international railway freight network. Therefore, we taken the China Railway Express as an example to study the reliability of the international railway freight network.
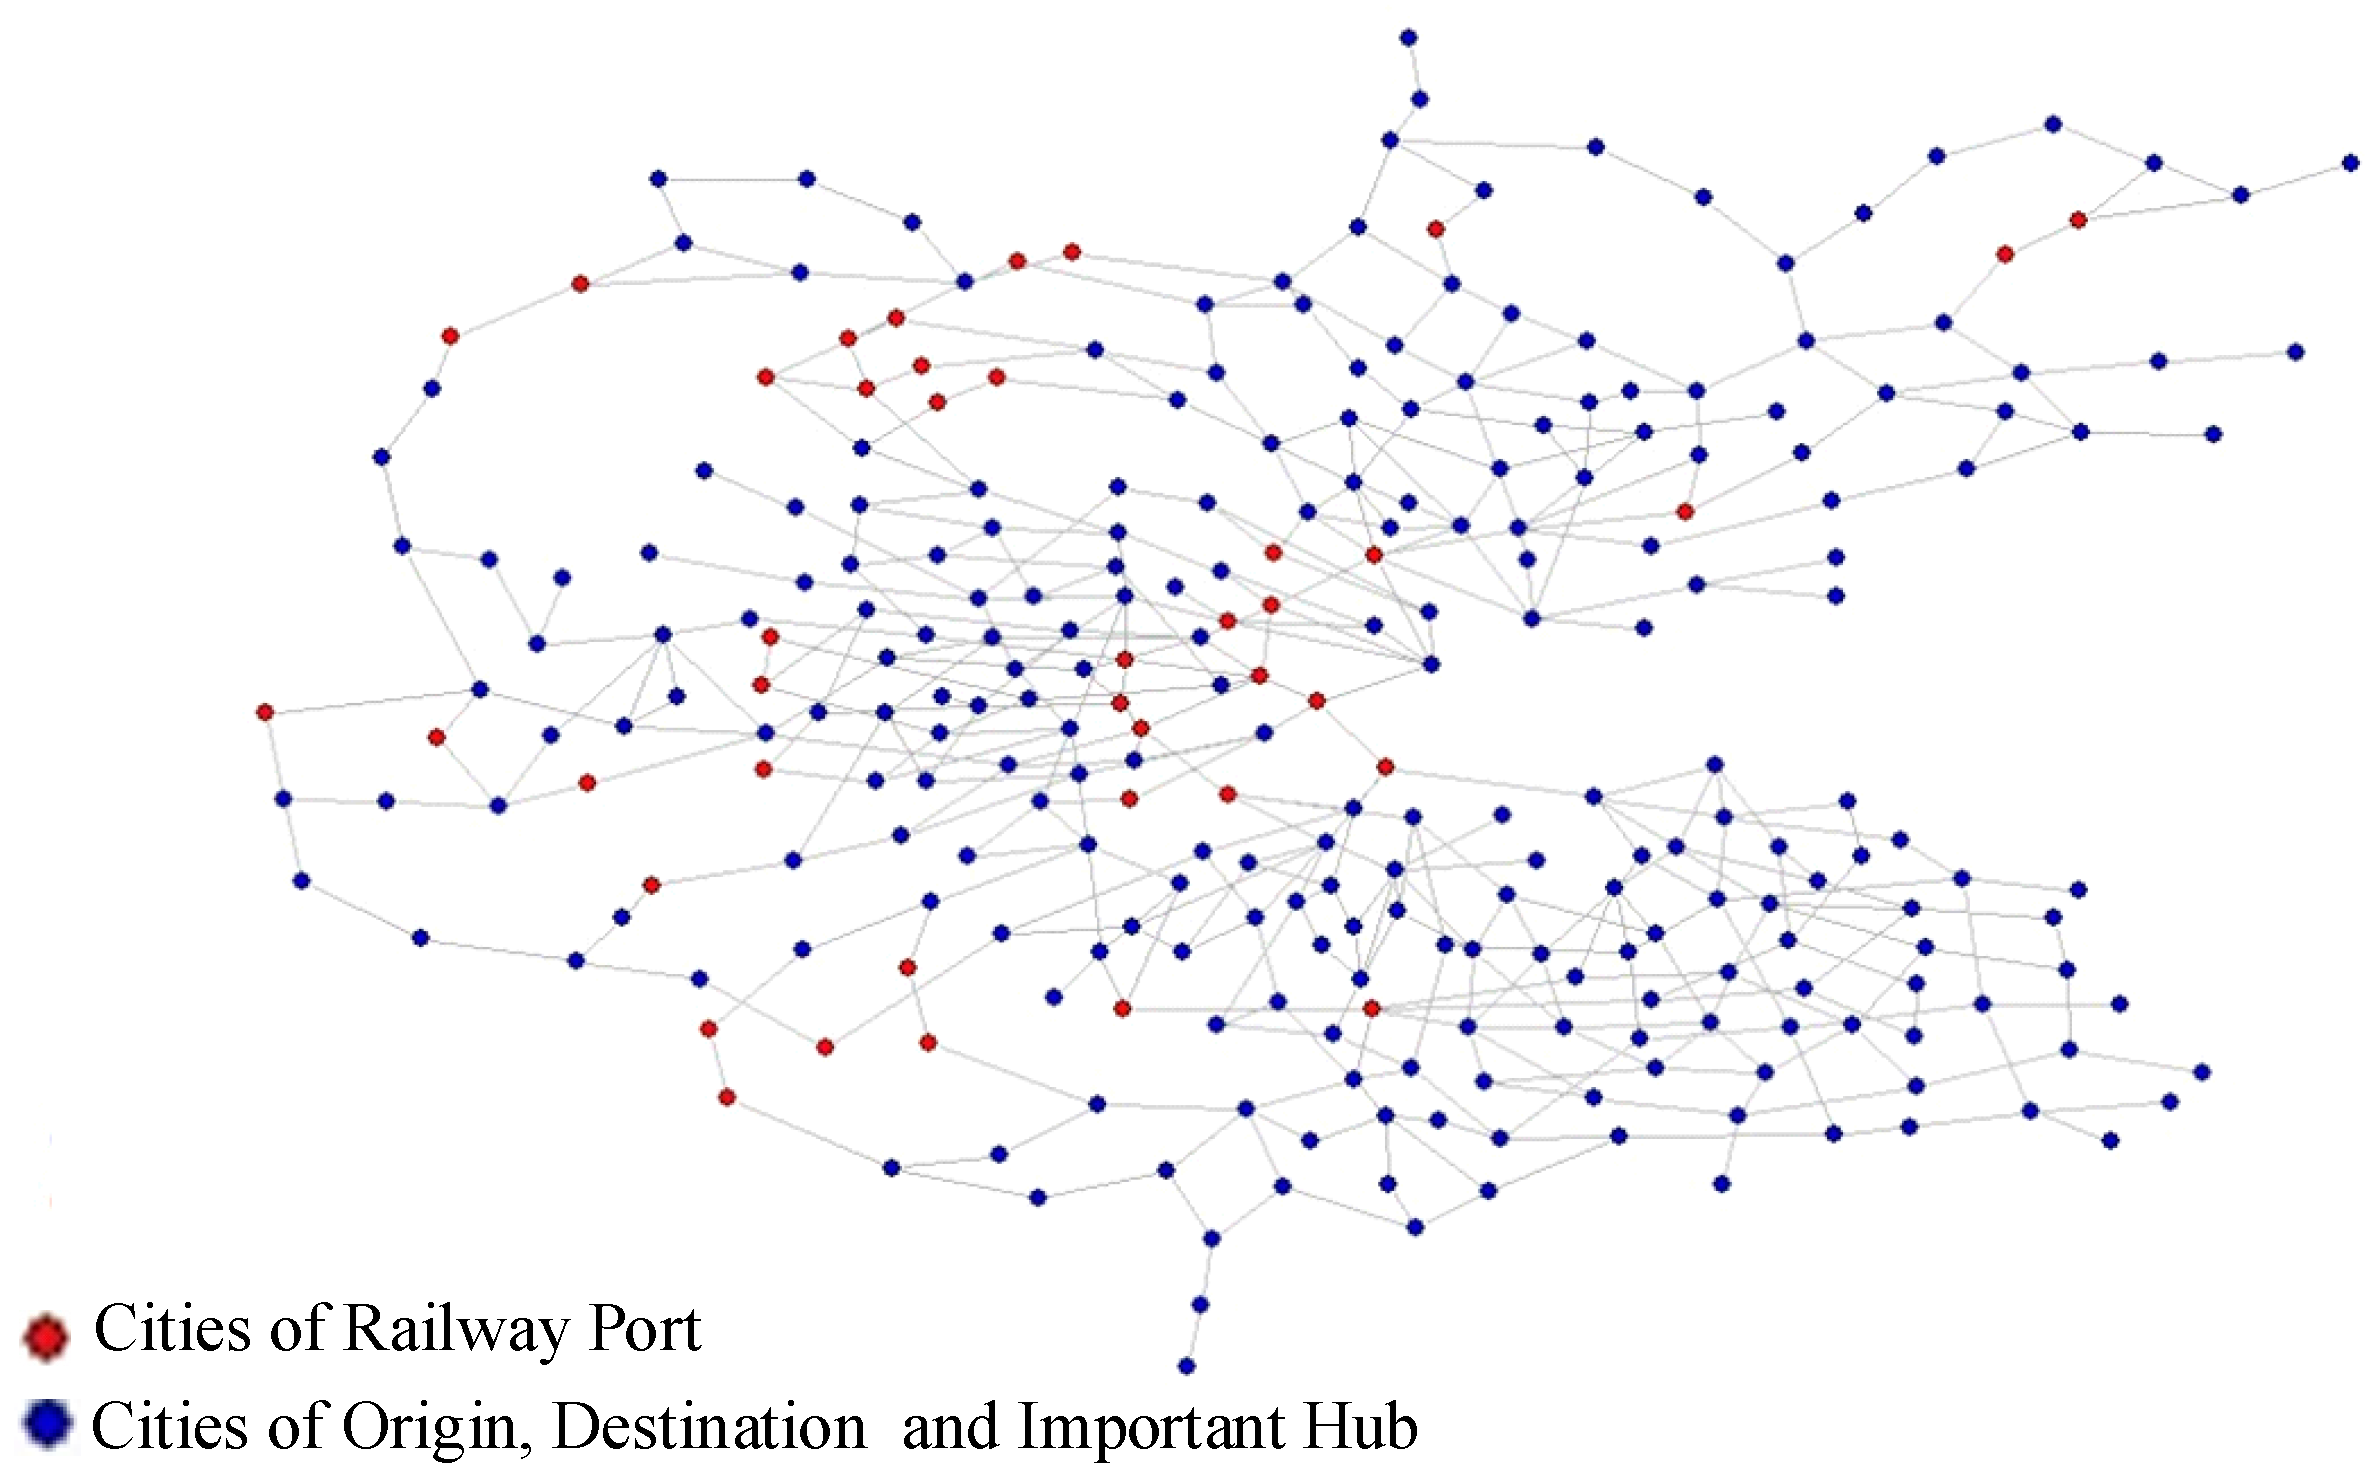
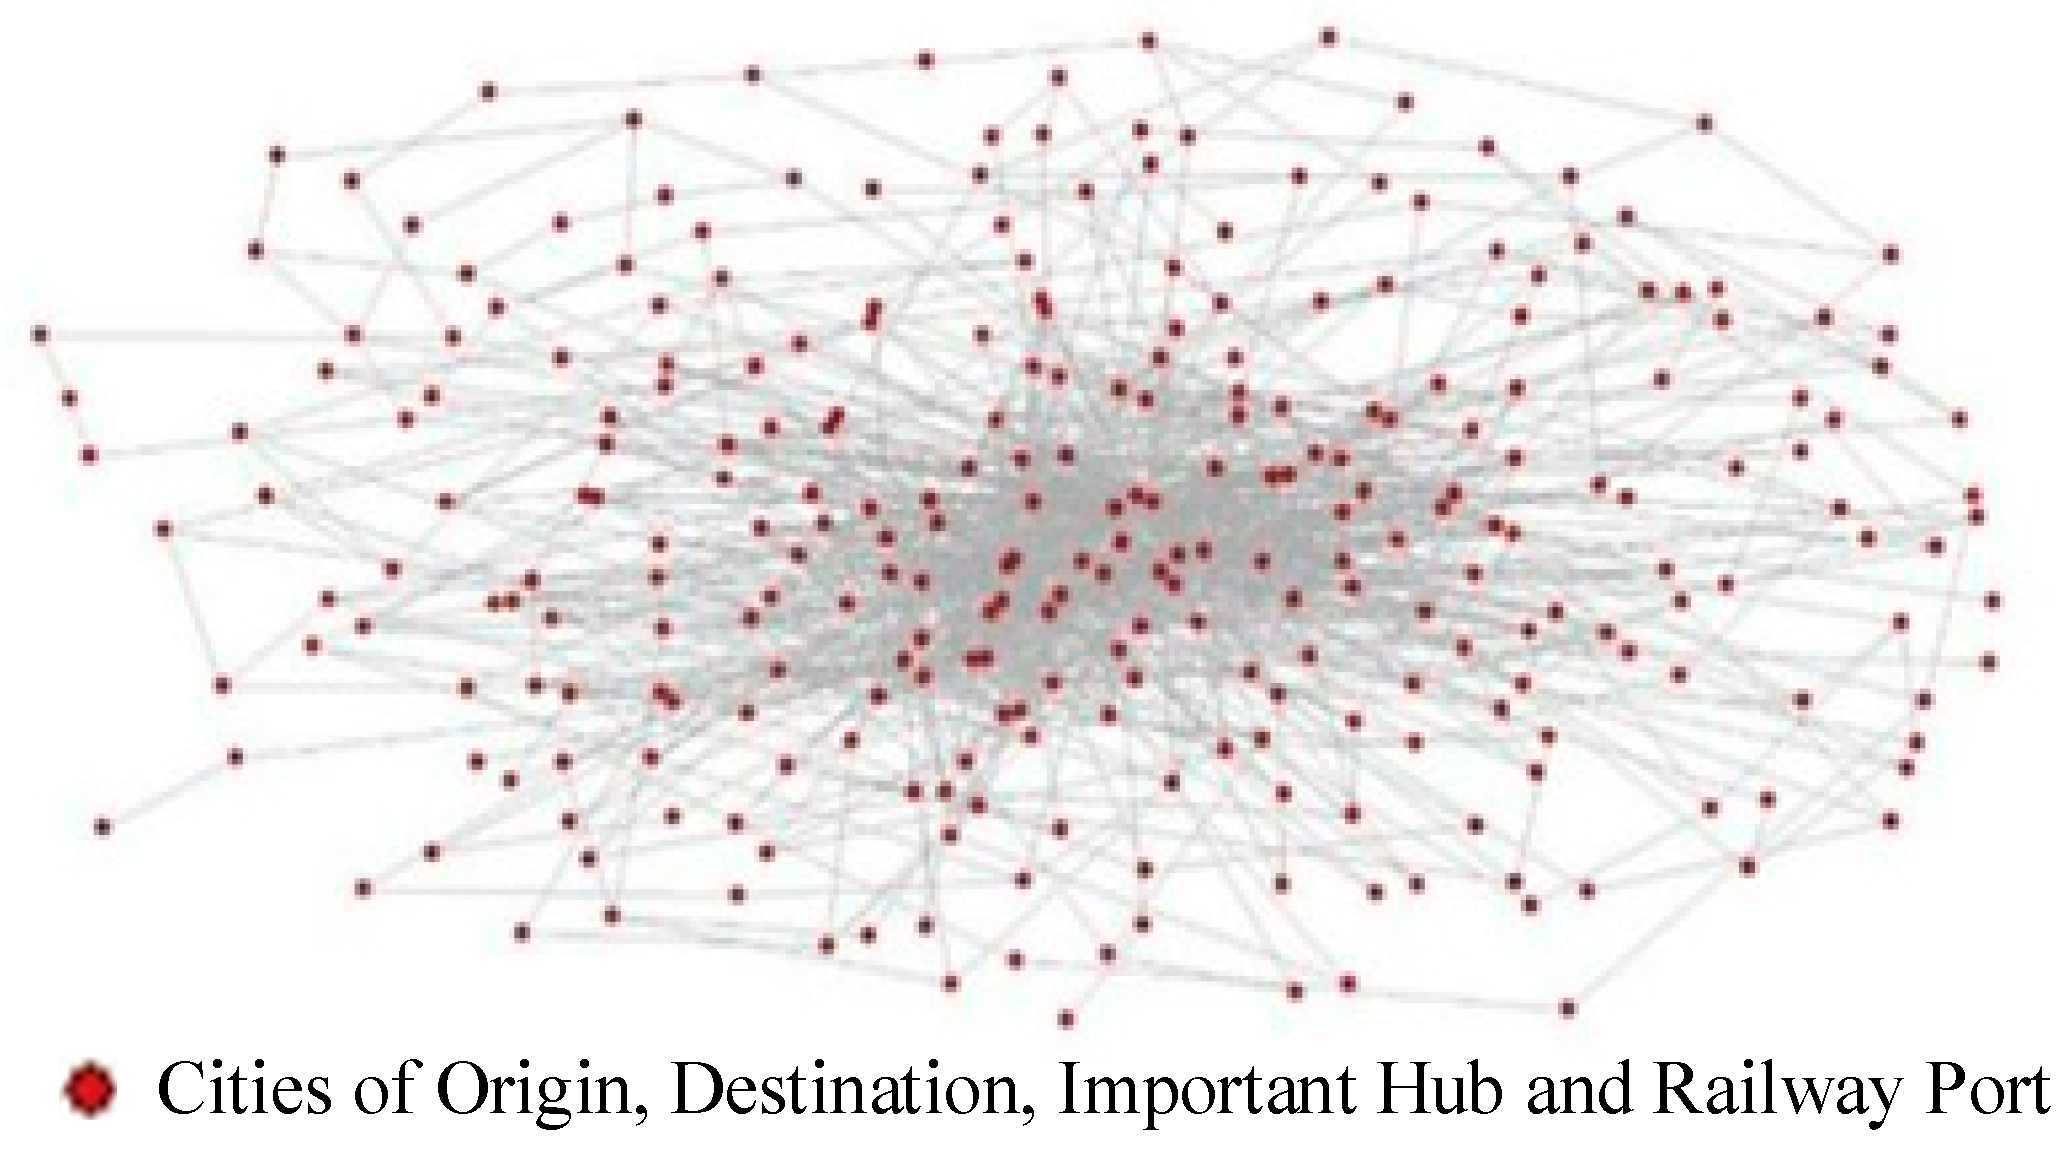
This study defines cities and key border ports that host China Railway Express freight network nodes as network nodes, reflecting the physical connectivity and functional characteristics of the international railway freight network. We constructed a basic line network topology model with 280 nodes and 439 edges, and a traffic flow network topology model with 280 nodes and 1181 edges (Supplementary Material B Table S2), as shown in Figure 7 and Figure 8. Additionally, the details of the network structure are shown in Supplementary Material H.
Based on the analysis in Section 3, Table 1 presents the top 20 nodes in the China Railway Express freight network.
Table 1 shows that Chinese cities constitute 55% of the top 20 node cities, including Xi’an, Yiwu, Alashankou, Zhengzhou, Chengdu, Erlianhot, Wuhan, Urumqi, Manchuria, and Lanzhou. These cities primarily serve as hubs, ports, or locations of railway port stations. Overseas node cities make up 45%, distributed across Poland (15%), Russia (5%), Belarus (10%), Kazakhstan (5%), and Germany (10%). Malaszewicz serves as a key transit port to European cities, while Moscow is a major terminal city connecting several critical nodes in Russia.
The data for the importance evaluation indicators of nodes in the basic railway network and the transportation service network were input into Python 3.12 software based on (15)–(27). The weight coefficients for each indicator are as follows: in the basic railway network, the coefficients for degree centrality, closeness centrality, betweenness centrality, eigenvector centrality, node efficiency, and initial weight are 0.1881, 0.1906, 0.1623, 0.1429, 0.1906, and 0.1256, respectively; and those in the transportation service network are 0.1734, 0.1920, 0.1519, 0.1644, 0.1918, and 0.1265, respectively. The differences in the weight coefficients between the two networks are relatively small, with the highest weights assigned to closeness centrality and node efficiency, which have the greatest influence.

4.1. Transportation Problems Analysis

Due to a series of unpredictable events, there have been many congestions and blockage of port stations, stations and lines in international railway intermodal transport over the years, which has rendered problems related to time efficiency, safety and operating costs of the international railway freight network increasingly prominent. Therefore, this paper divides failure scenarios into network congestion and interruption.
In the network congestion scenario, international railway intermodal trains may encounter local delays or large-scale delays, and the congestion may spread to the entire network leading to paralysis if the response is not implemented promptly. In the network interruption scenario, some nodes fail and trains cannot pass, consequently, alternative transportation routes will be selected to continue transporting cargo.
The cascade failure process of the international railway intermodal transport network studied in this paper corresponds to the congestion and interruption situations in reality, revealing the influence of the propagation mechanism of freight flow between nodes in the network. It can be seen that there are two most important factors affecting the cascade failure process: (1) the interconnection relationship between nodes; (2) Cargo flow propagation mechanism. Accordingly, the subsequent simulation is designed from the above two factors.

4.2. Vulnerability Simulation Based on Coupling Coefficients

This section analyzes the changes in network vulnerability due to variations in node coupling coefficients, using a node distance-based cargo redistribution rule as an example, while keeping the redistribution rule unchanged. The analysis is conducted using two attack strategies: random and deliberate attacks. The goal is to investigate the relationship between node coupling coefficients and network vulnerability.
(1)
Random Attacks
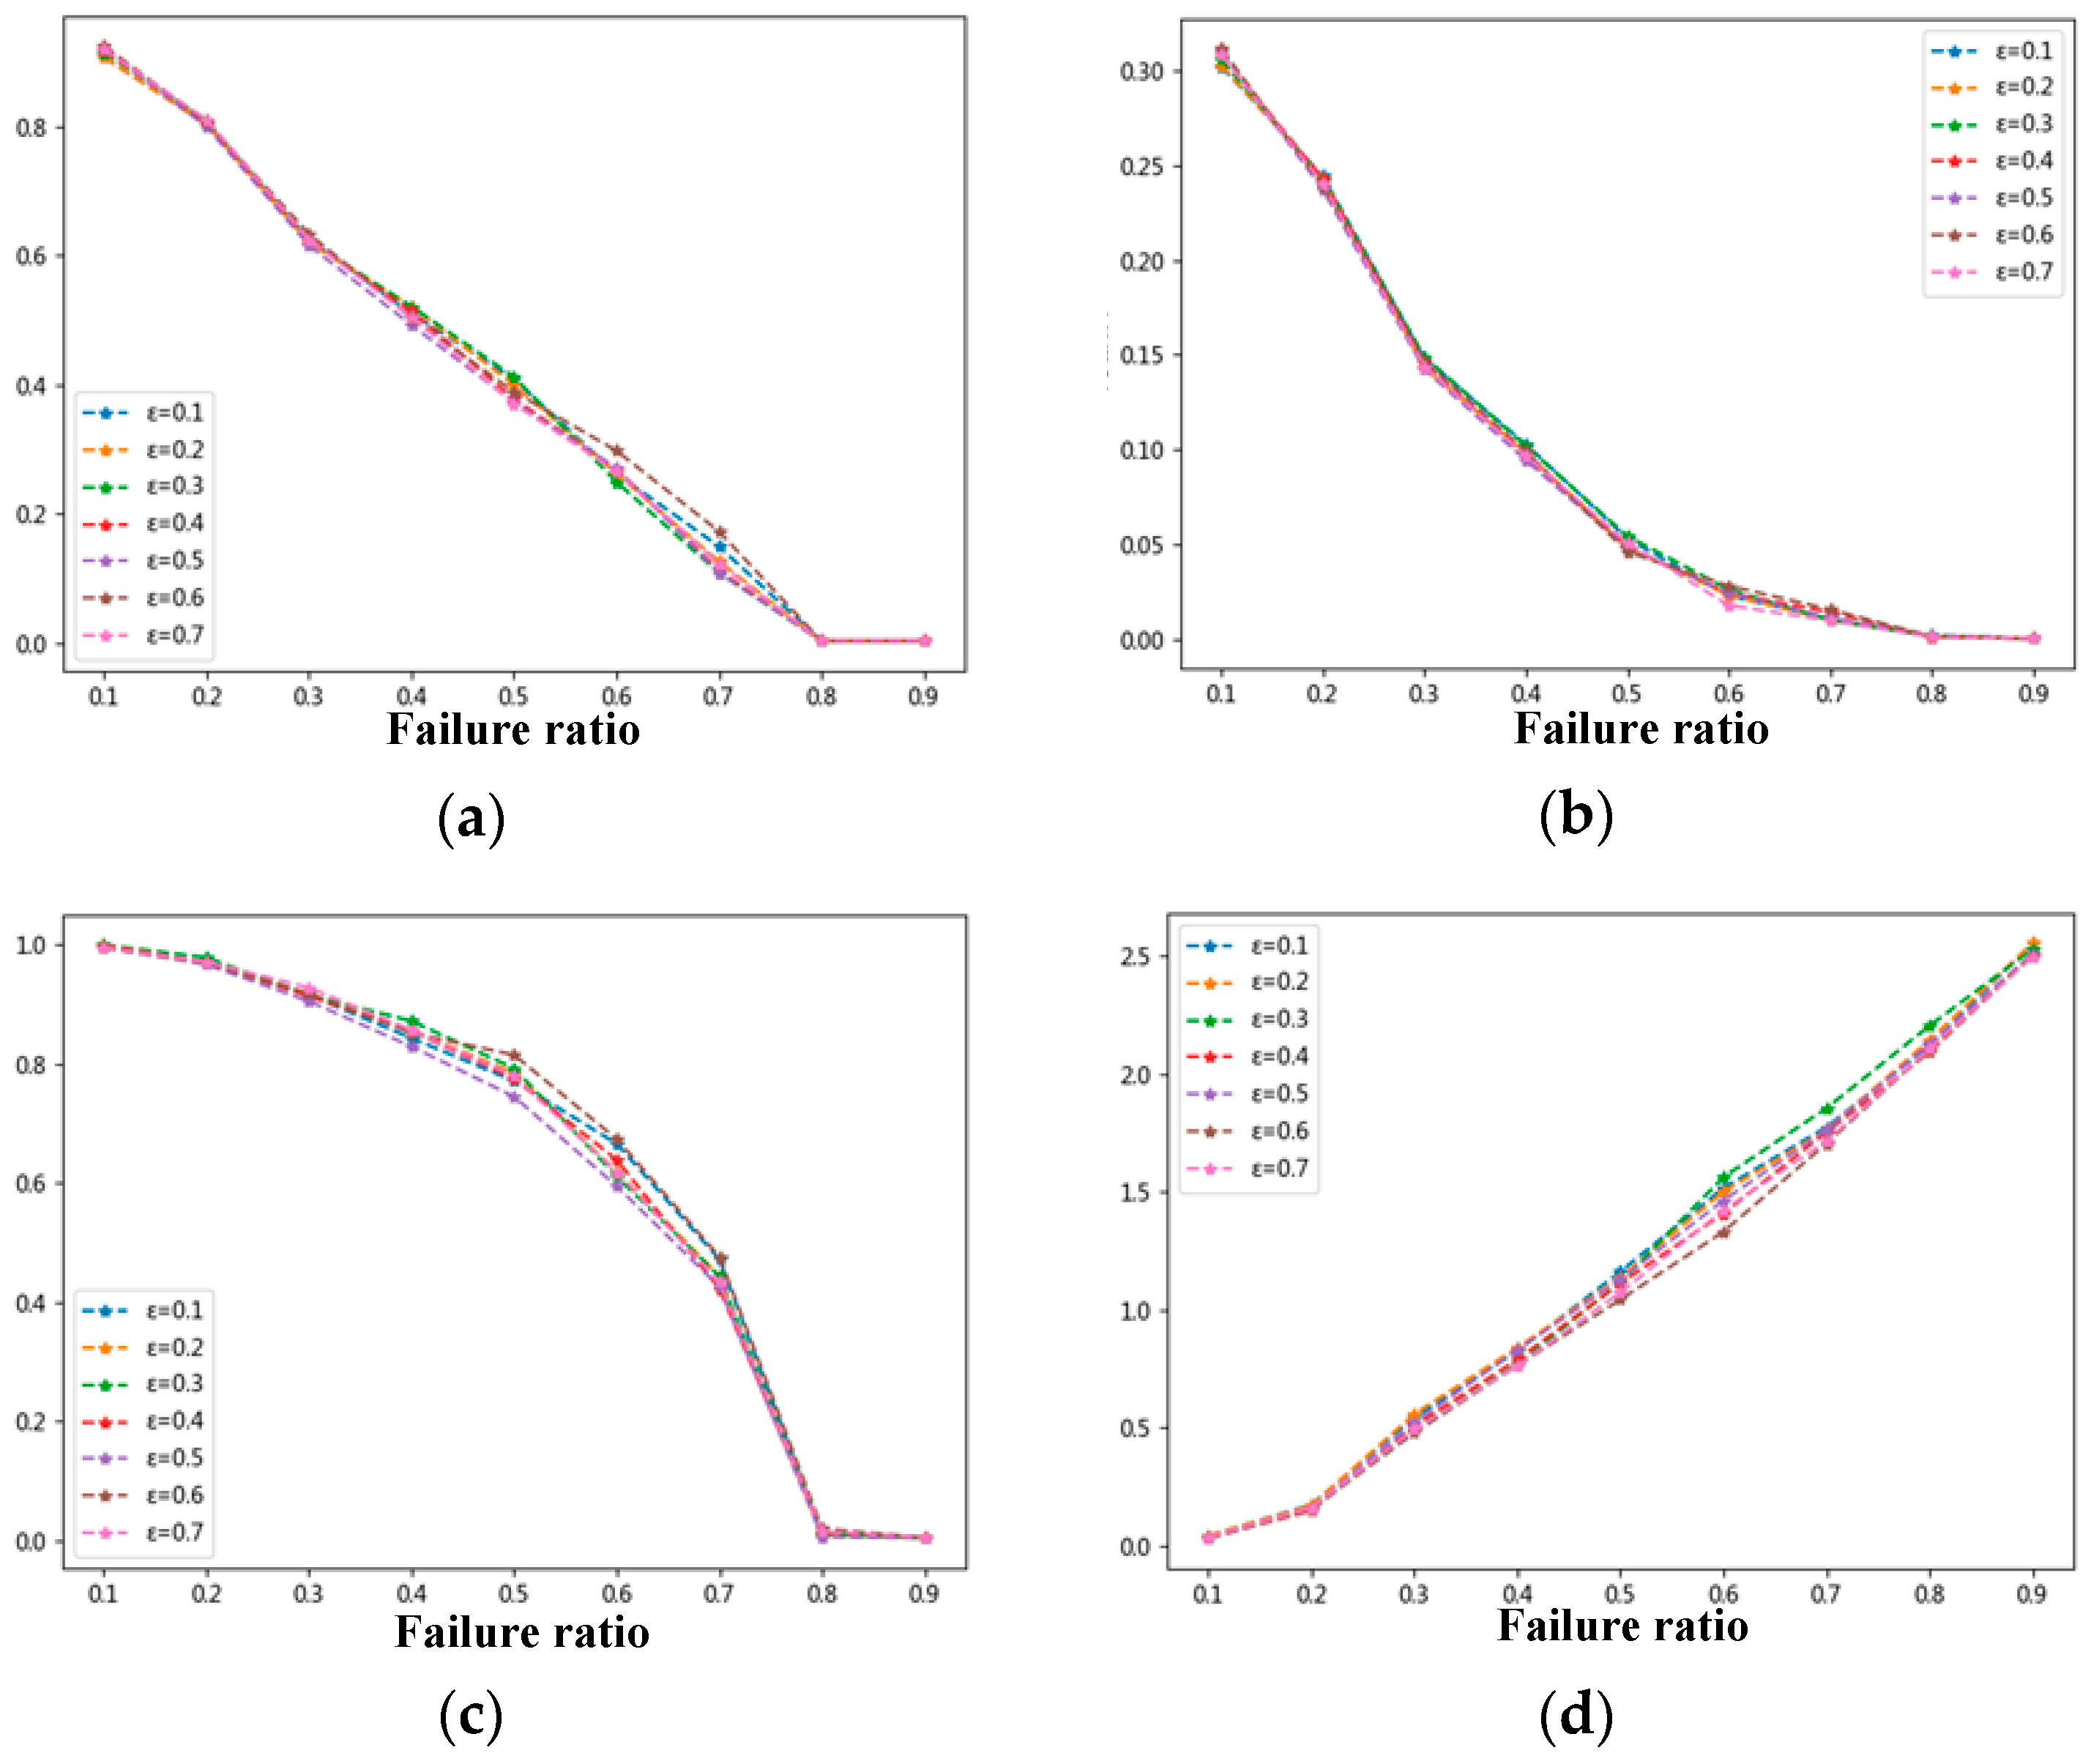
Different node coupling coefficients are set within the range of 0.1 to 0.7. The median value from 50 simulations is taken as the vulnerability index. The simulations of the maximum effective graph, network efficiency, transportation performance, and affected cargo flow under random attacks are presented in Figure 9.
The simulation results indicate that as the proportion of failed nodes increases, network performance declines significantly. The largest connected component is used to reflect the network’s connectivity, and its variation under different node coupling coefficients follows a generally similar pattern. When the proportion of failed nodes reaches 30%, the largest connected component decreases by approximately 40%. As the proportion becomes 80%, the network nears collapse. Network efficiency reflects the overall connectivity of the system. In most cases, when the proportion of failed nodes reaches 30%, it decreases by more than 50%, with similar variation patterns observed under different node coupling coefficients. Initially, the transportation performance is 1. As nodes in the network fail, the decline in transportation performance becomes more pronounced once the failure rate exceeds 40%, with the rate of decline accelerating. This indicates that the network’s service function has been significantly impacted. The affected cargo flow rate starts at 0 and increases as the proportion of failed nodes increases. Furthermore, a higher node coupling coefficient results in a higher affected cargo flow rate. However, when the node coupling coefficient is 0.4, the affected cargo flow rate remains relatively low, and the network’s vulnerability is minimized.
From above, it is evident that changes in node coupling coefficients under random attack strategies have little impact on network vulnerability. However, when the failed nodes exceeds 20–30%, the network’s vulnerability gets more pronounced.
(2)
Deliberate Attack
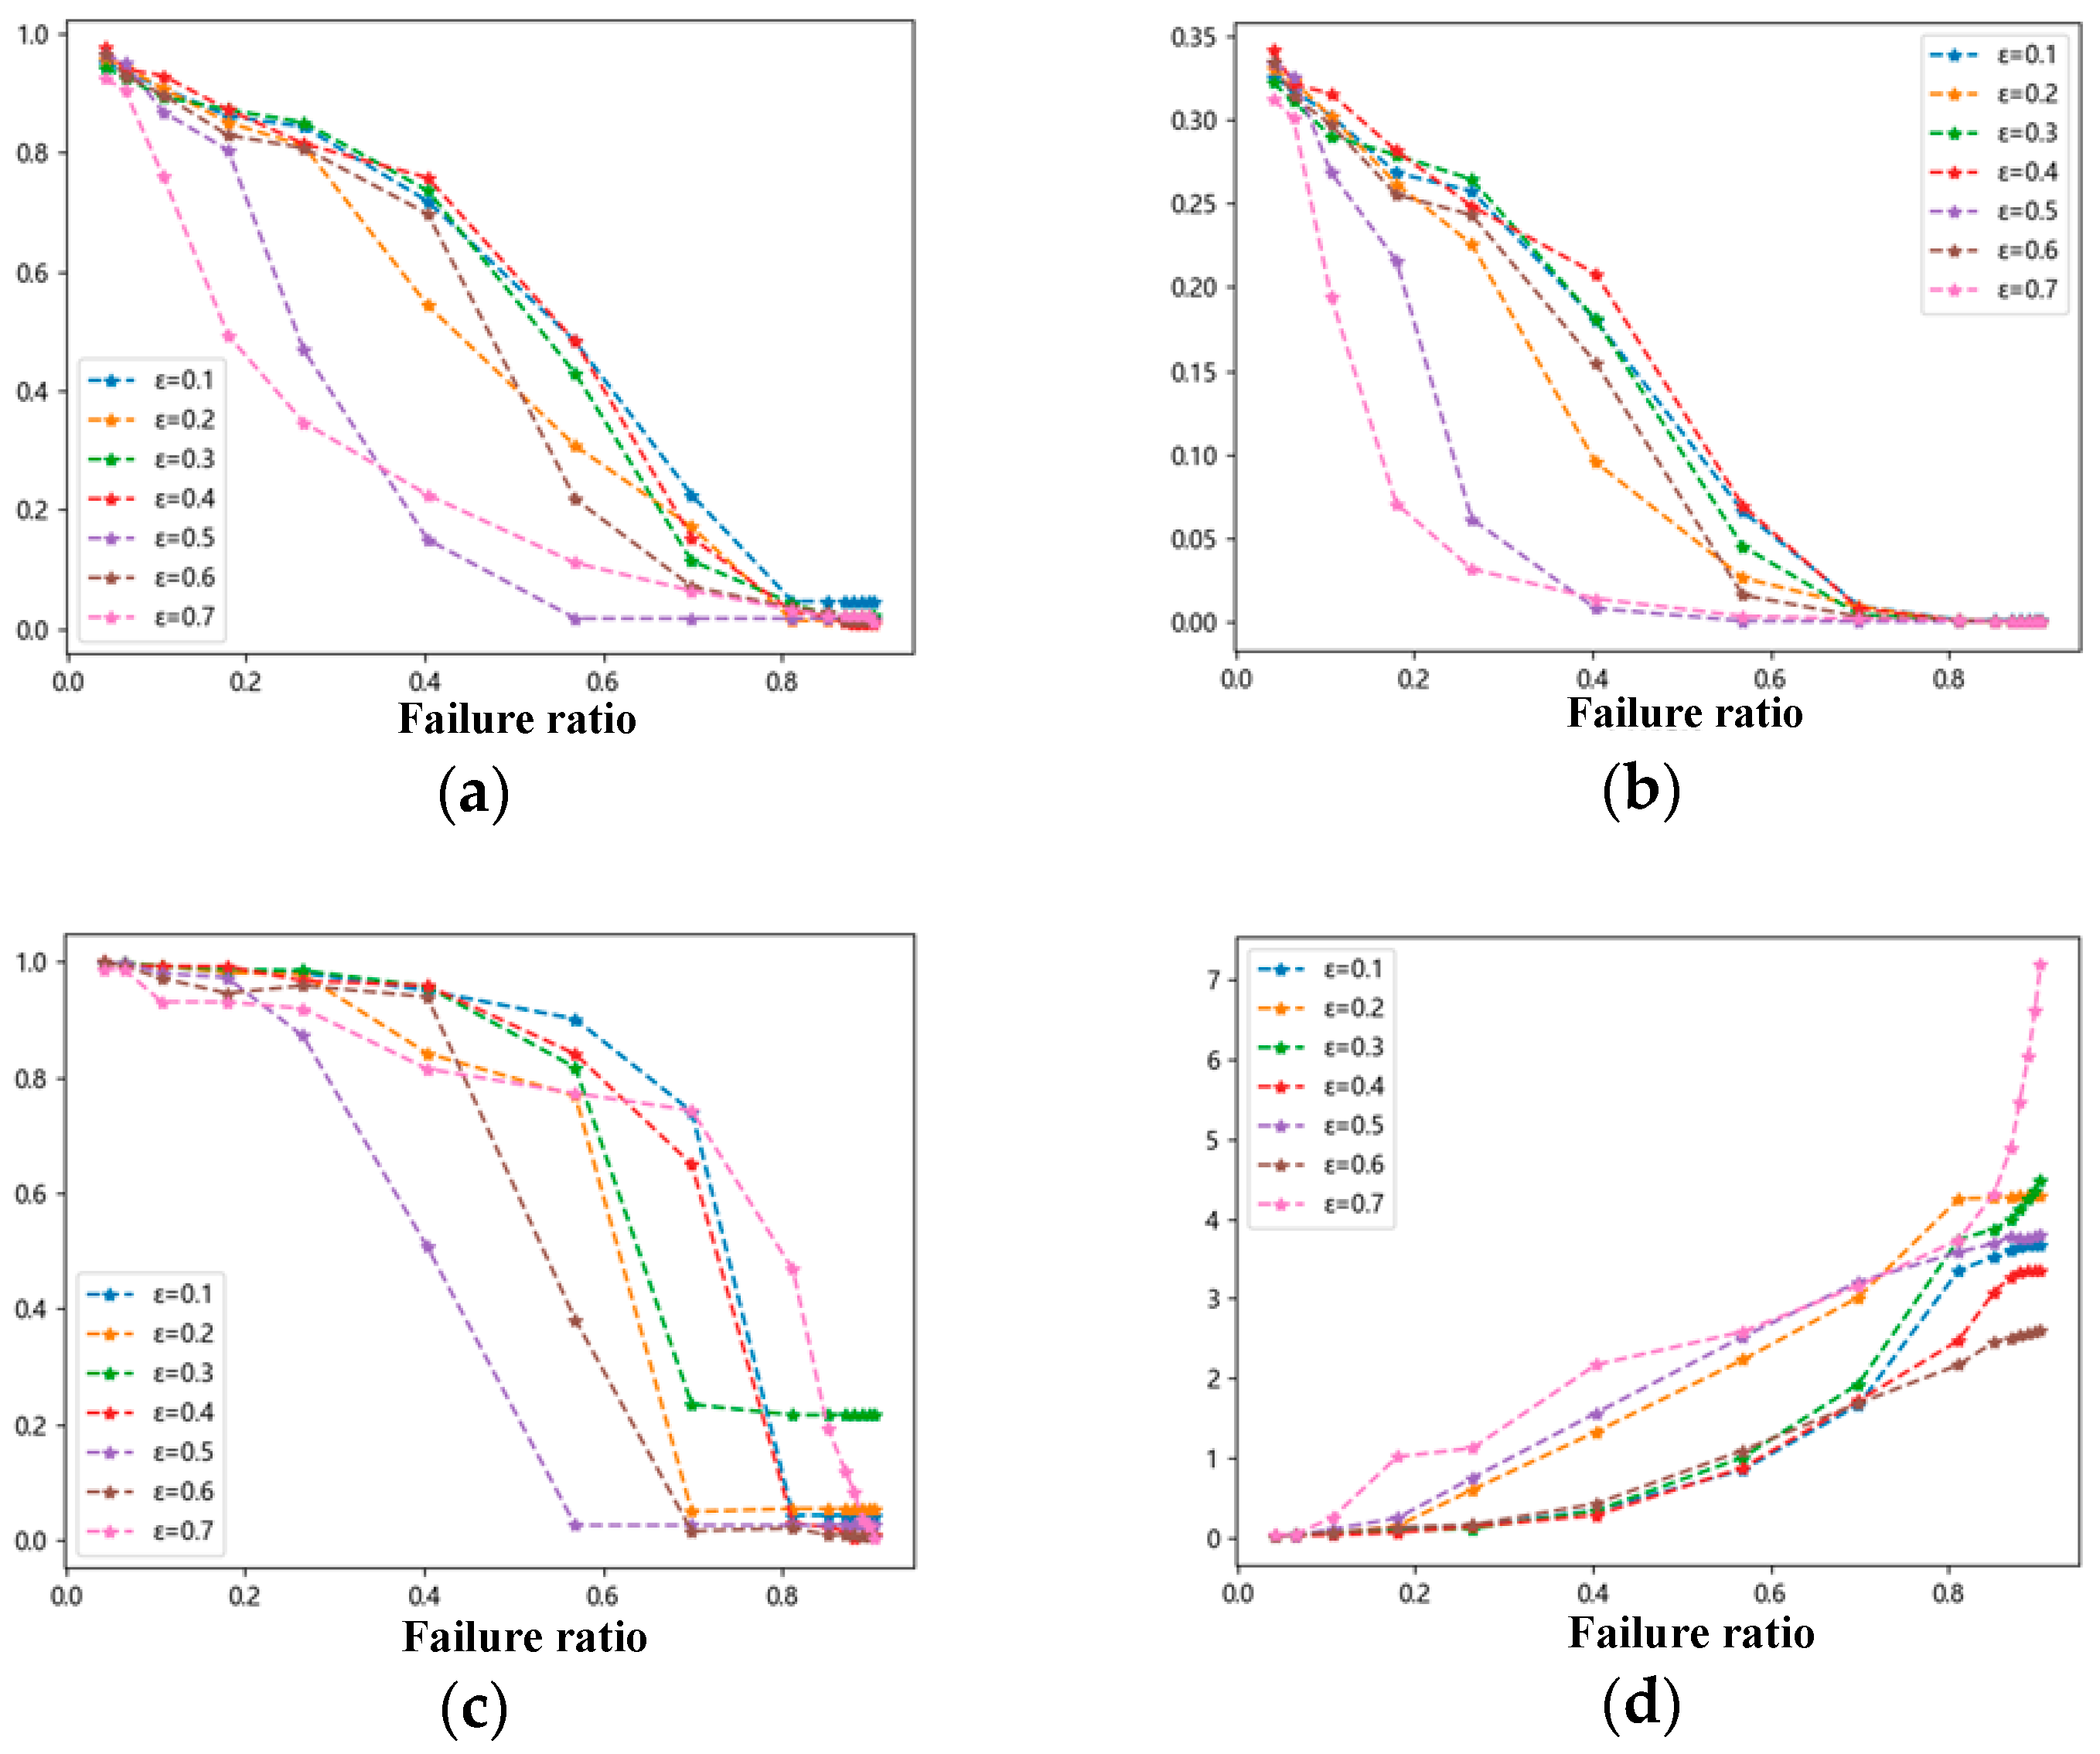
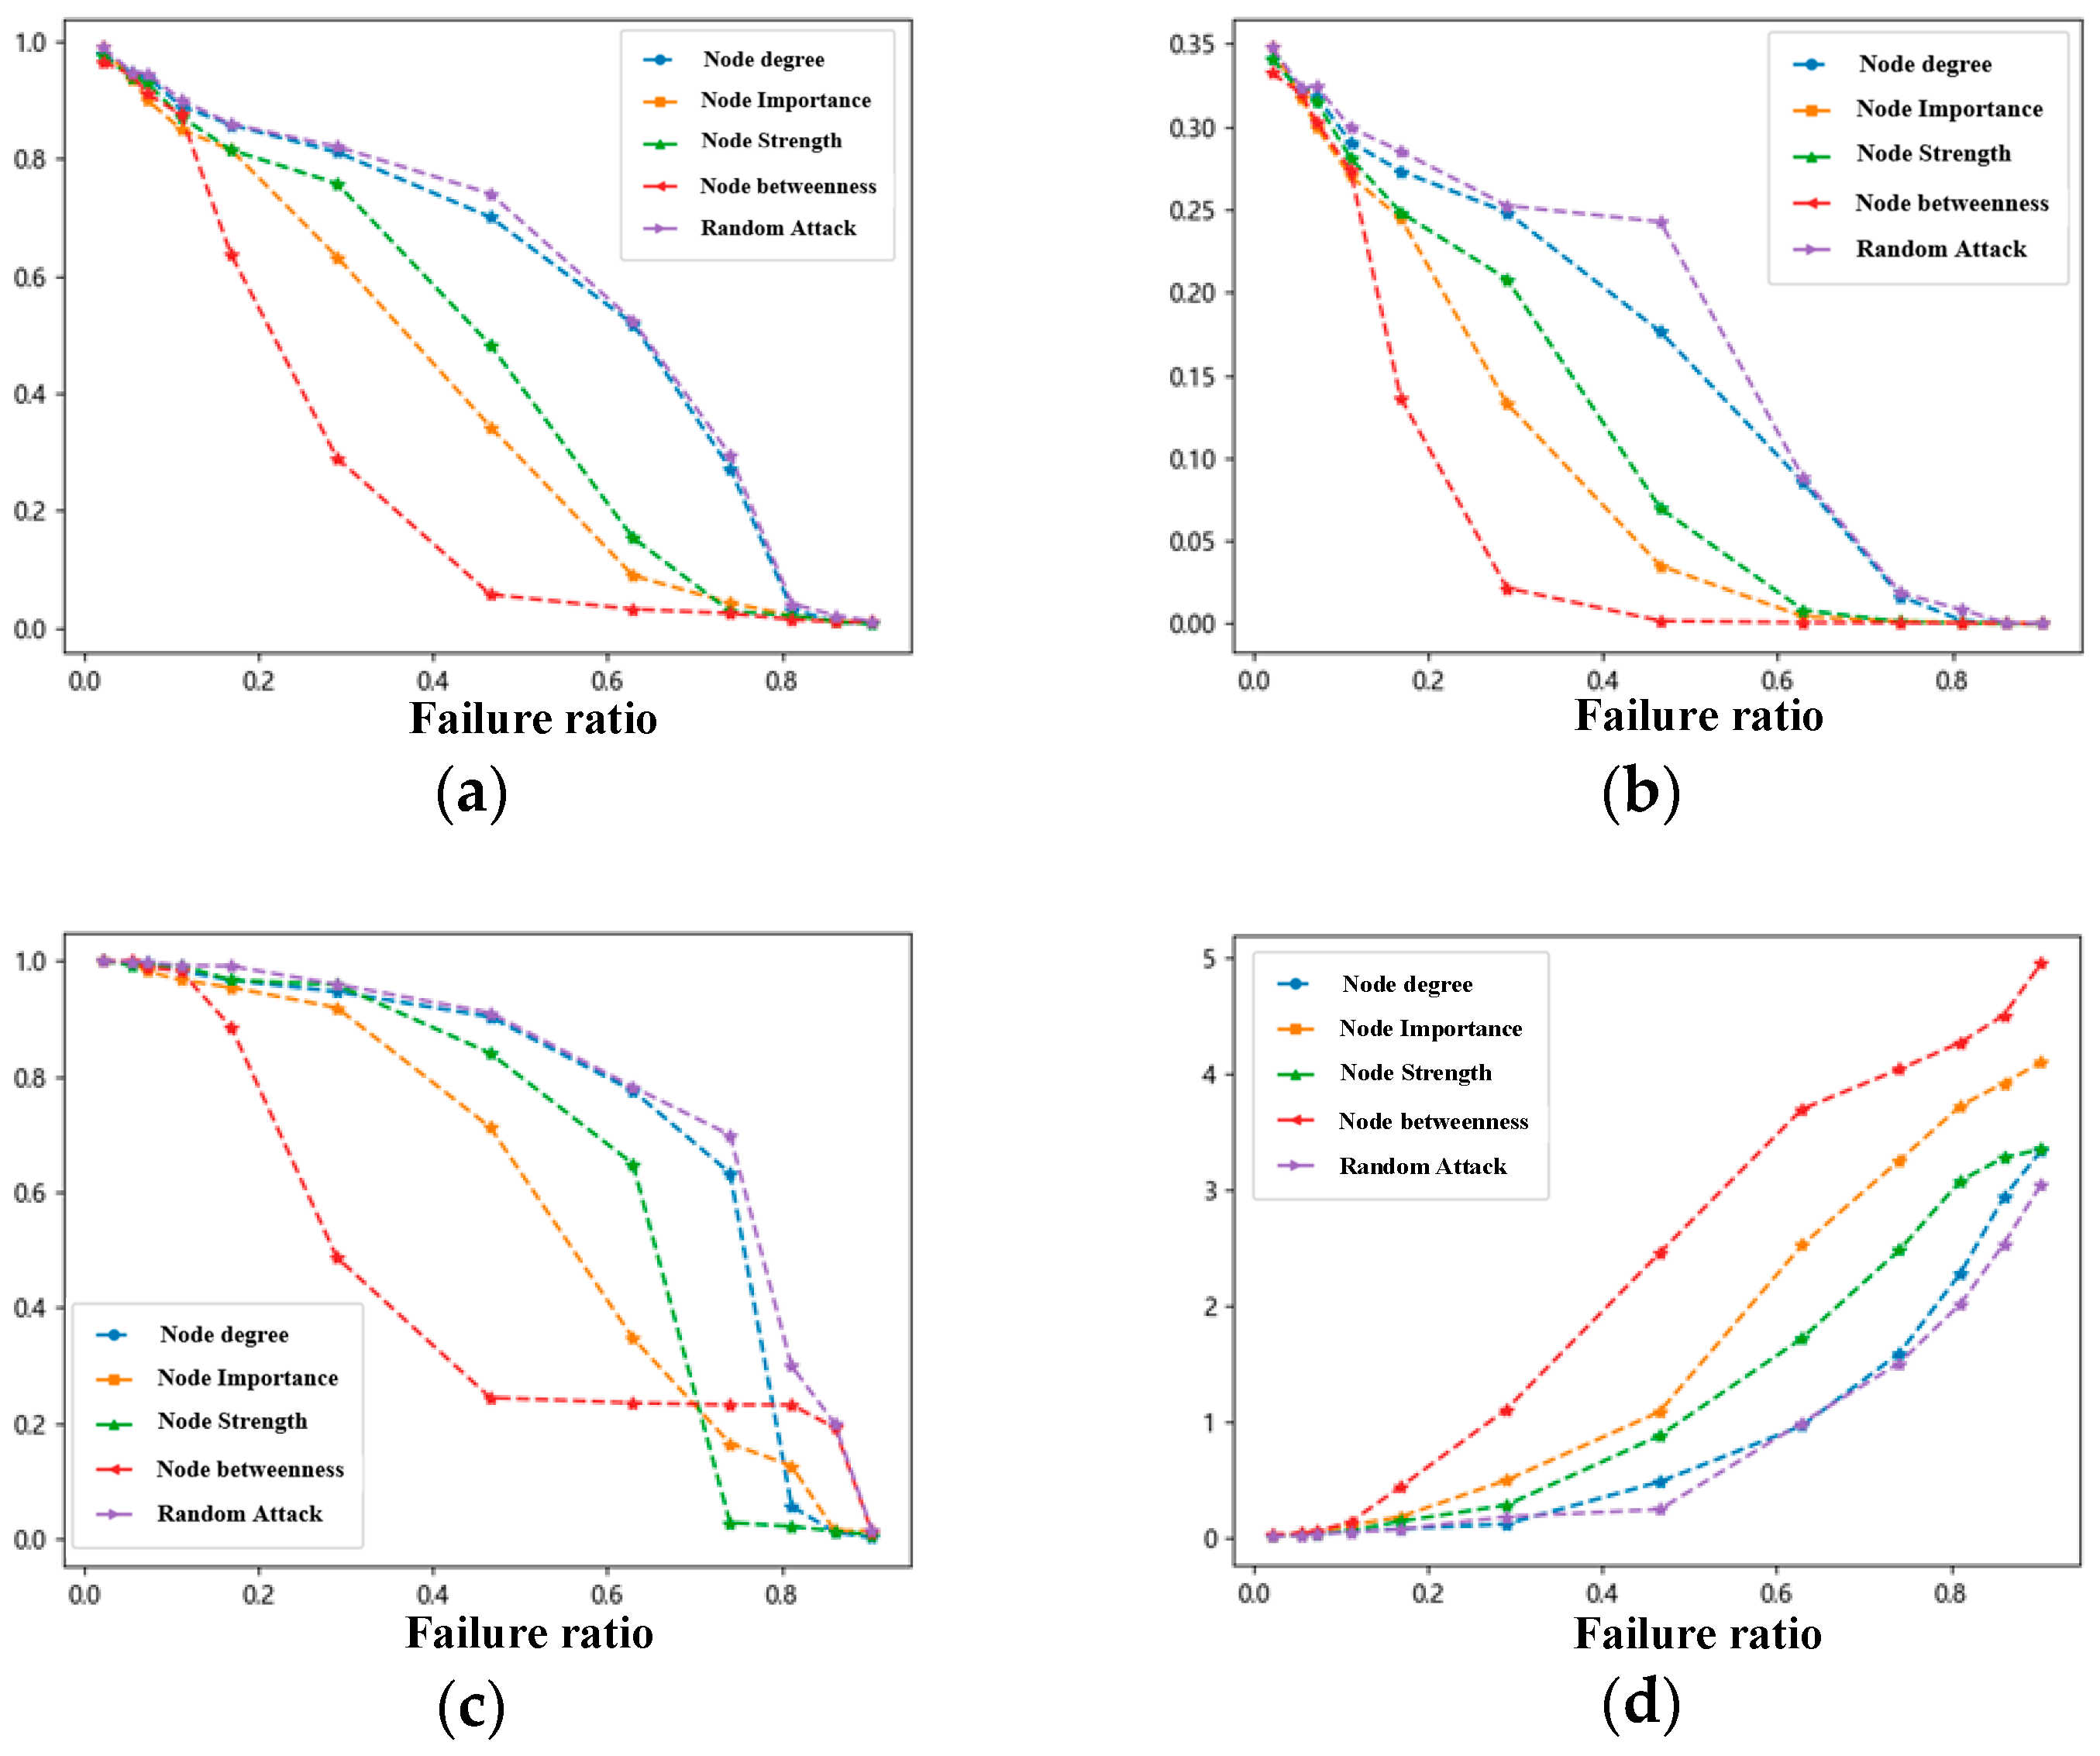
Different attack targets are set to target nodes with high degree (Supplementary Material C Table S3), high betweenness (Supplementary Material D Table S4), high strength (Supplementary Material E Table S5), and high importance (Supplementary Material F Table S6), respectively. Nodes with high importance significantly reflect network changes; therefore, we analyze the results based on these nodes, as shown in Figure 10.
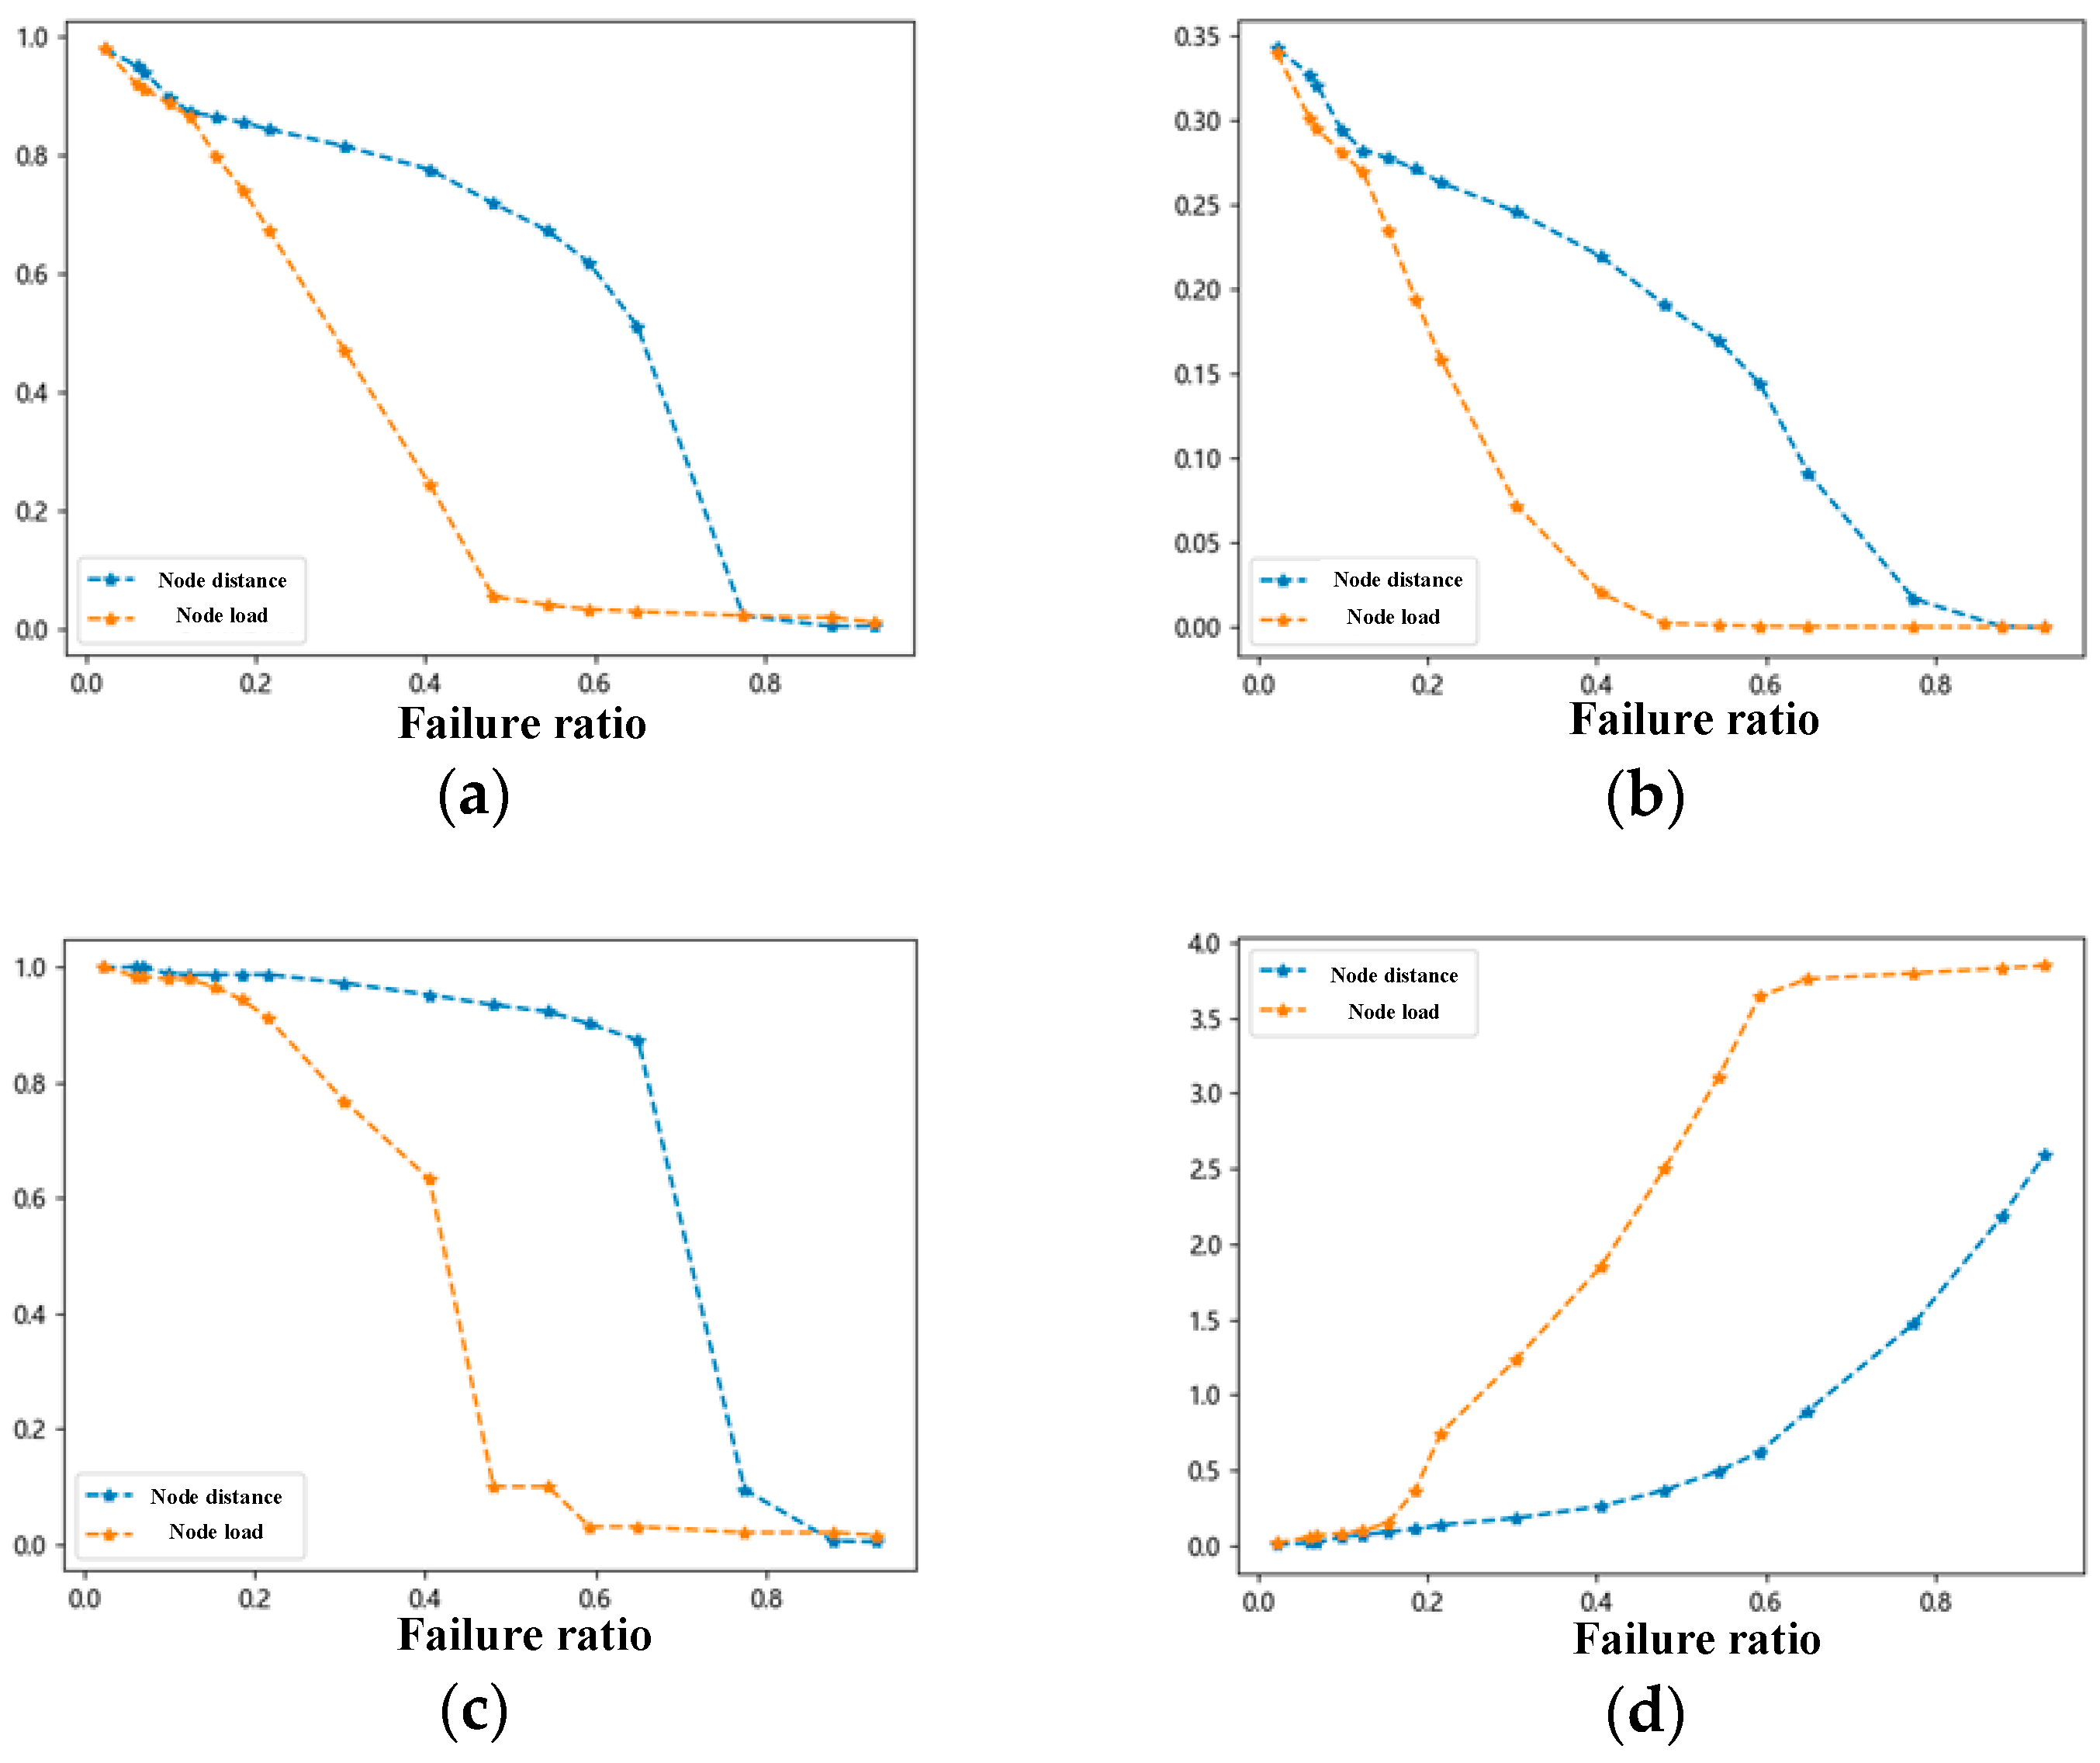
From Figure 10, it is evident that under the deliberate attack strategy, the network exhibits the smallest vulnerability when the node coupling coefficient is 0.4. Therefore, we select a coupling coefficient of 0.4 for further analysis to explore the network’s response to different attack targets. The random attack strategy is also considered, and the results are presented in Figure 11.
Figure 11 shows vulnerability indicators occurs at a relatively slow pace. When the proportion of failed nodes reaches approximately 40%, each vulnerability indicator decreases by about 20%. However, under the deliberate attack strategy, the vulnerability indicators show a pronounced declining trend. For example, when 20% of the high-importance nodes are attacked, each vulnerability indicator decreases by approximately 40%. In summary, the network exhibits lower vulnerability under the random attack strategy, while showing greater vulnerability under the deliberate attack strategy. Furthermore, when nodes with high degree centrality are attacked, the network stability is strongest, while attacking nodes with high importance weakens network stability the most. This indicates that nodes with higher importance play a crucial role in the network. Once these nodes are prioritized for attack during a deliberate strike, the overall network efficiency will be significantly impacted. Therefore, when optimizing network strategies, priority should be given to the protection and optimization of nodes with higher importance values.

4.3. Vulnerability Simulation Based on Cargo Redistribution Rules

The network stability is optimal when the node coupling coefficient is 0.4; therefore, this section examines the changes in network vulnerability under different cargo redistribution rules with a node coupling coefficient of 0.4.

4.3.1. Node Attacks

(1)
Random Attacks
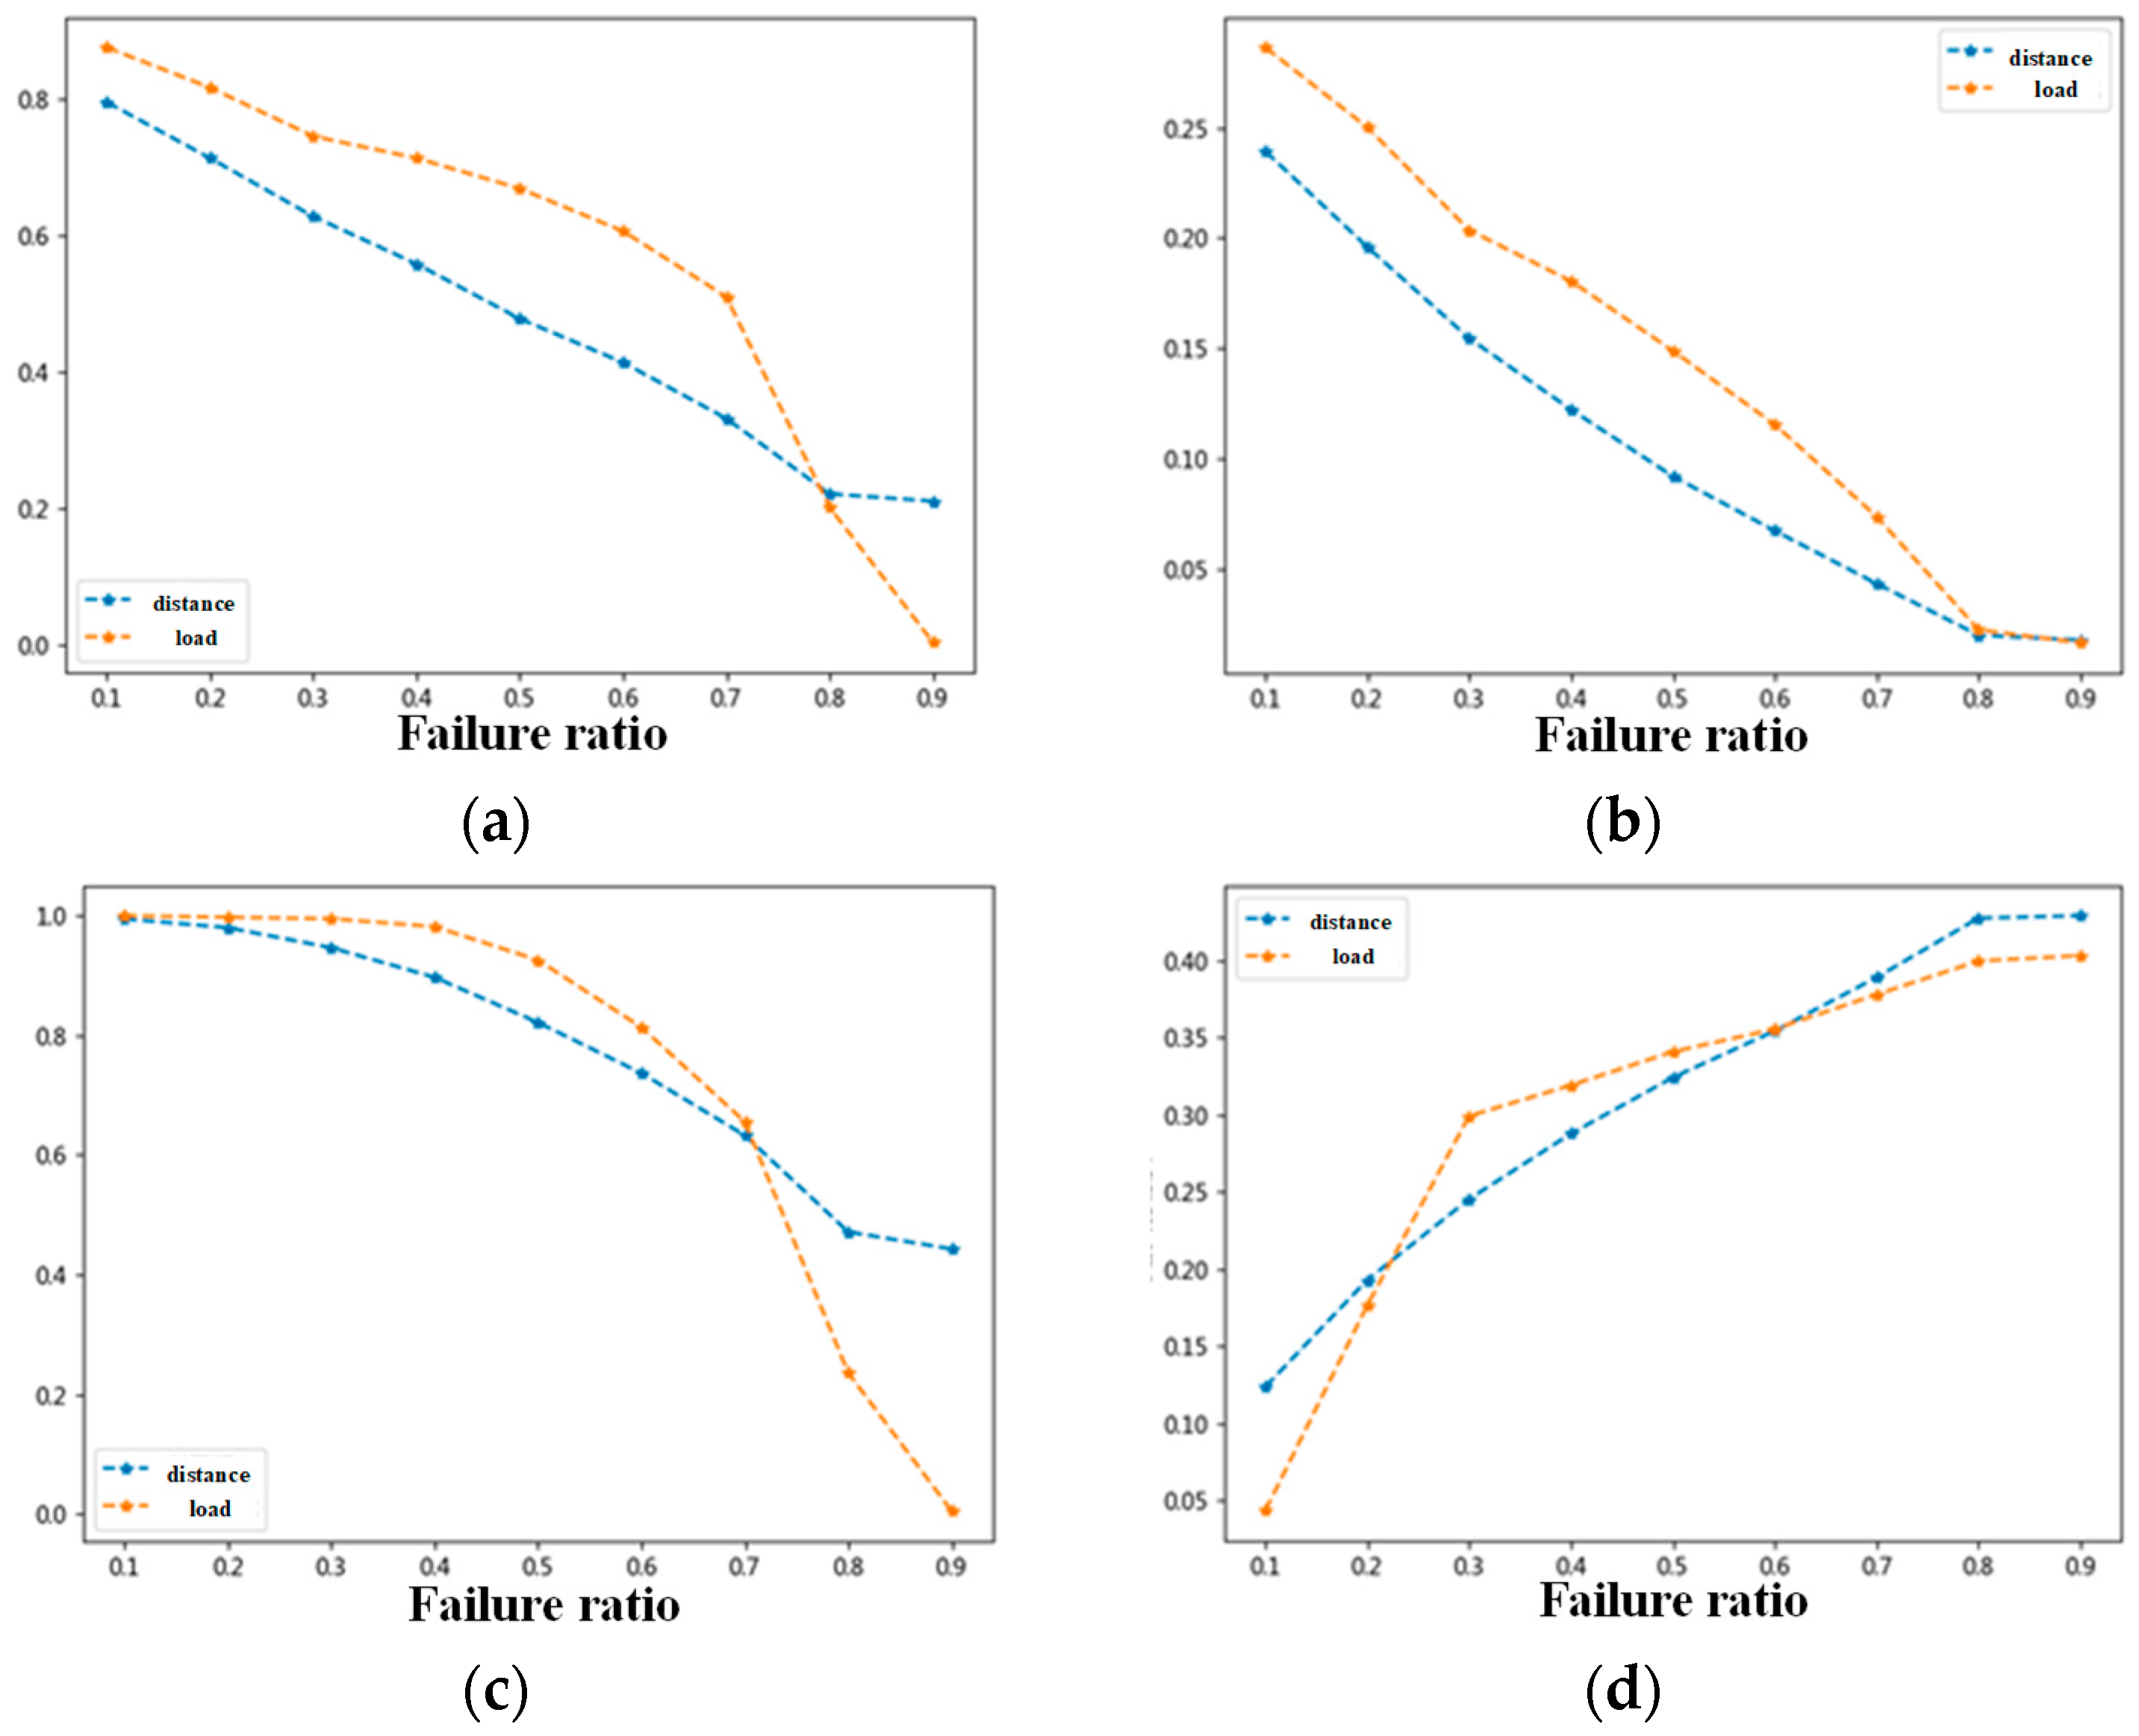
The variation in network vulnerability based on node load and node distance is obtained through simulation, as shown in Figure 12.
Figure 12 shows significant differences in network vulnerability under different redistribution rules. Under the node distance-based cargo redistribution rule, the vulnerability index shows a relatively smooth trend, while under the node load-based rule, the vulnerability index decreases more noticeably. Therefore, selecting the node distance-based cargo redistribution rule is more effective in maintaining network stability and delaying increased vulnerability.
(2)
Deliberate Attack
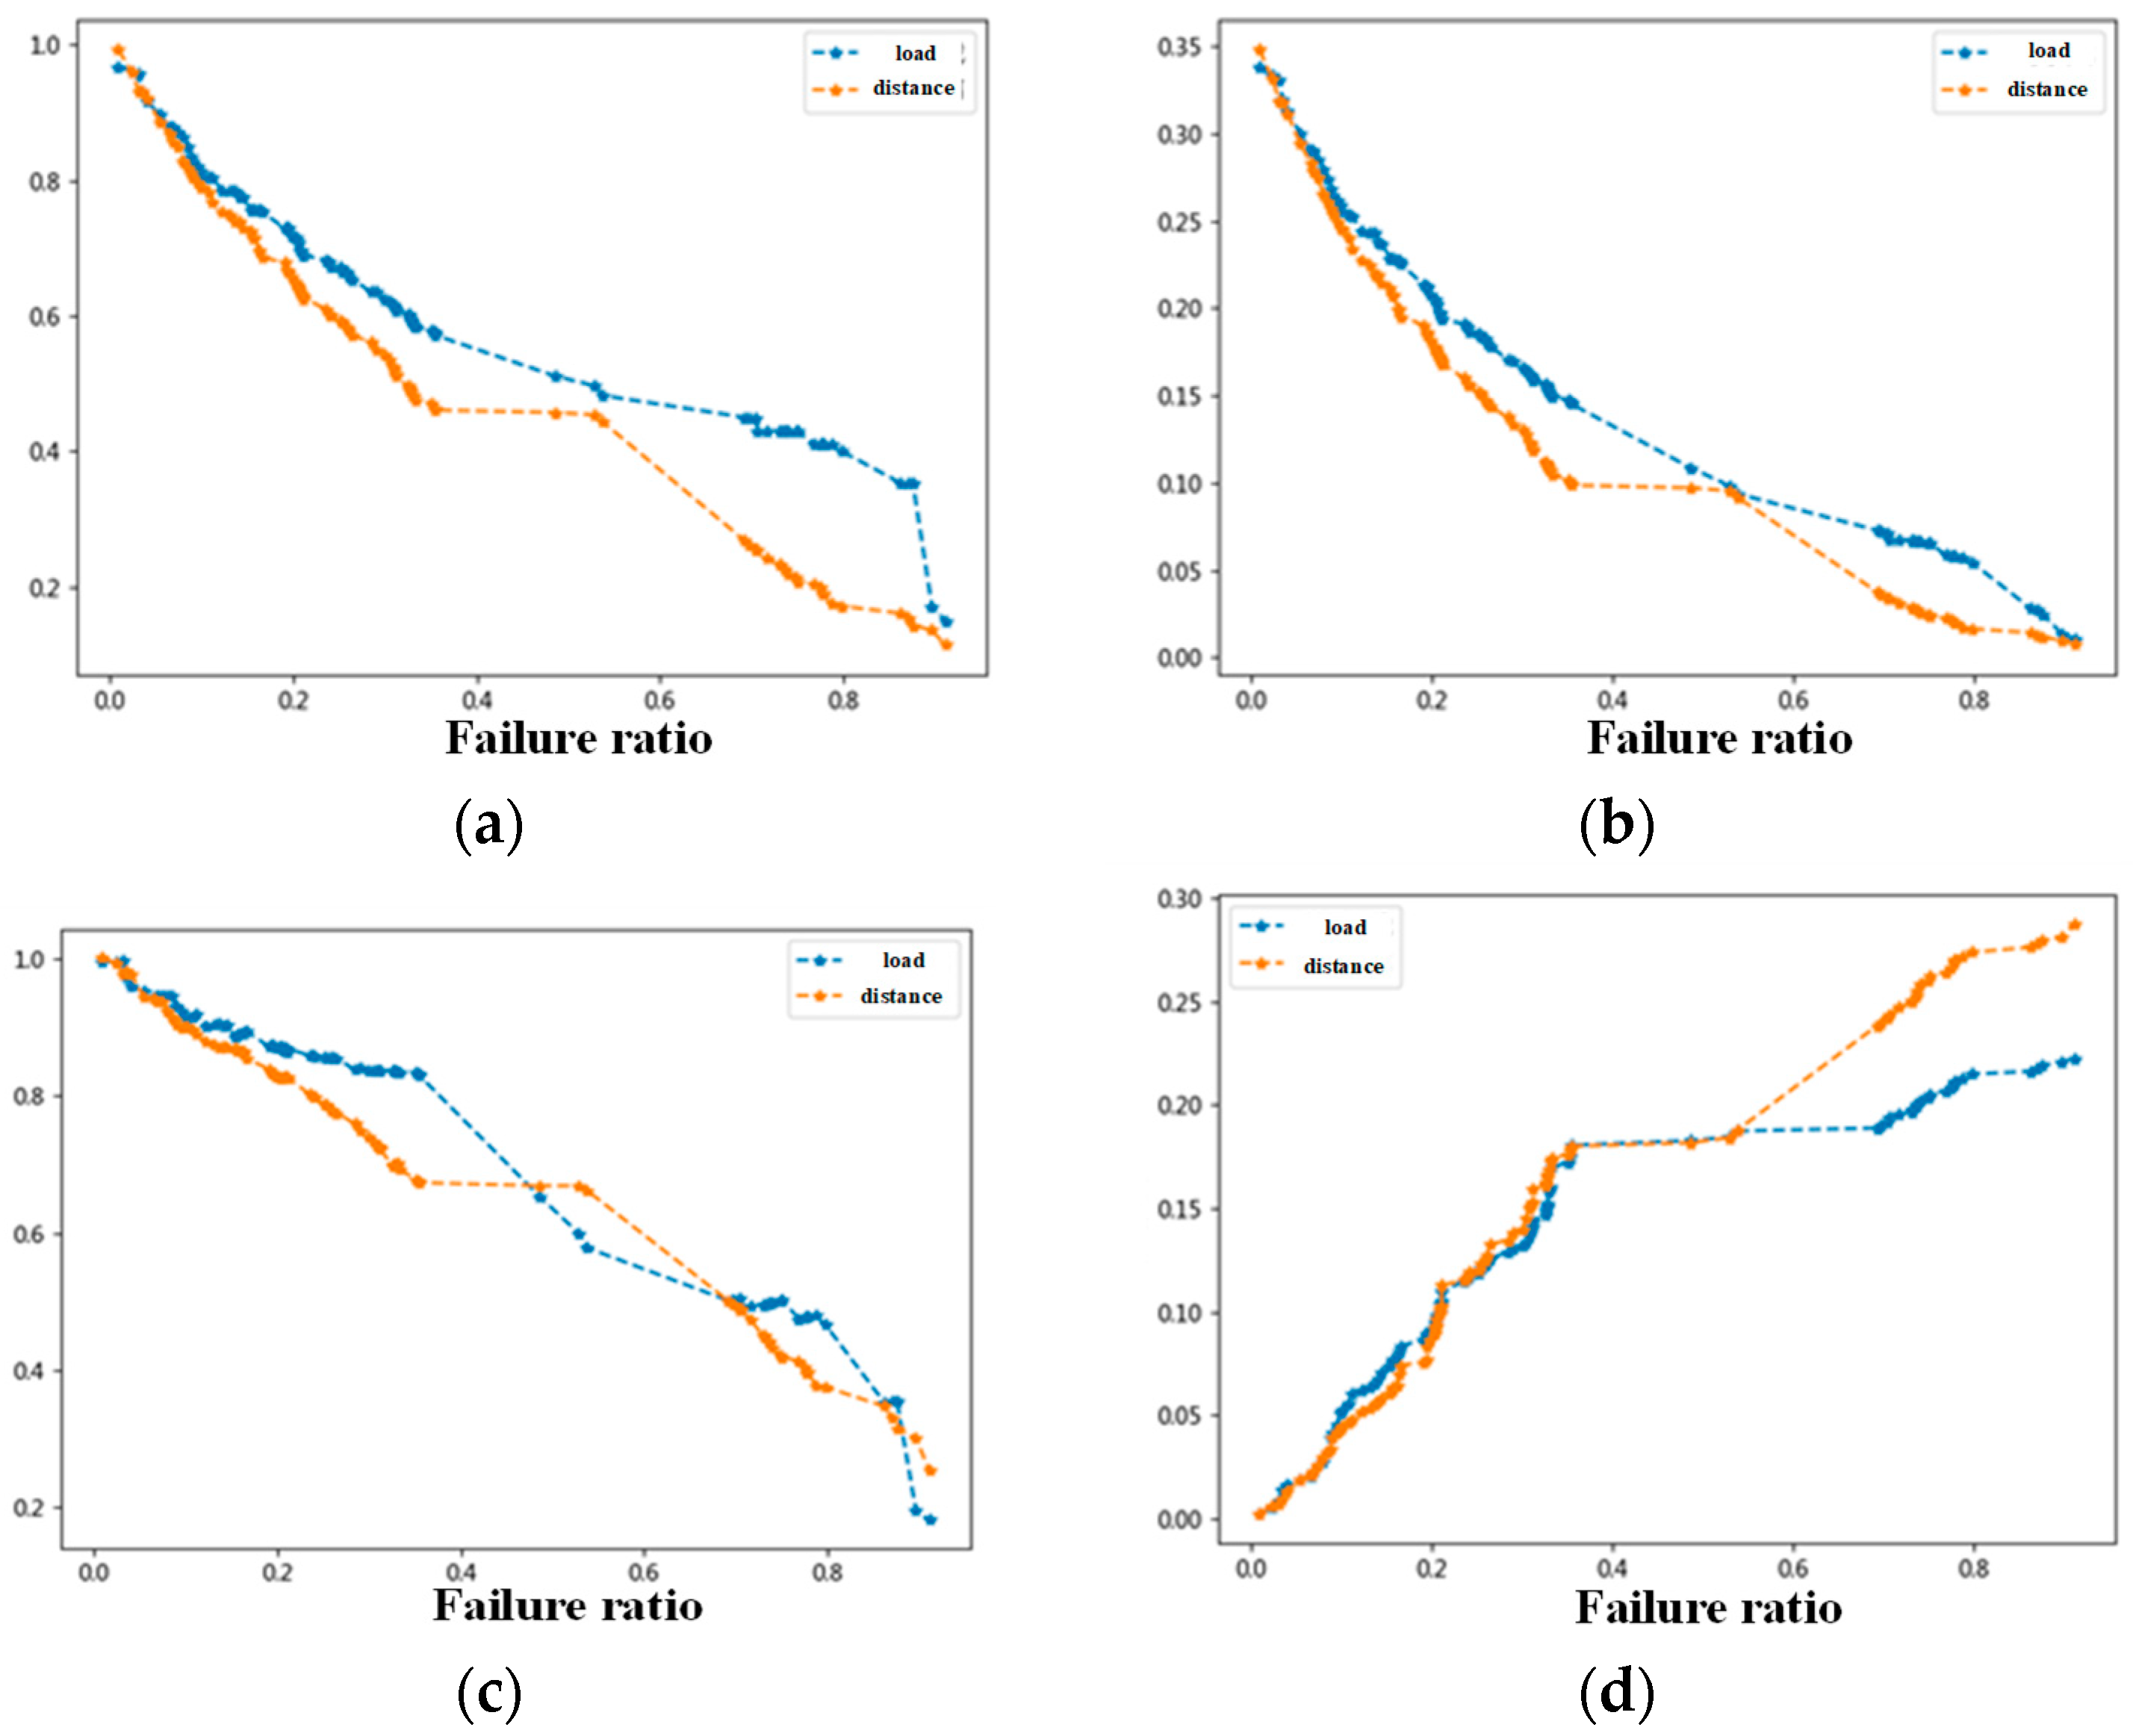
Under the node distance-based cargo redistribution rule, the network exhibits stronger resistance to attacks and is less vulnerable, so this rule is selected for further analysis. The random attack strategy will also be considered, and the results are presented in Figure 13.
Figure 13 shows that the downward trends of various vulnerability indicators are similar under both random and deliberate attack strategies. However, under random attacks, vulnerability indicators decline gradually, decreasing by approximately 10% when the proportion of failed nodes reaches 20%. In contrast, under deliberate attacks, the decline is significantly steeper. For example, when high-degree nodes are attacked, vulnerability indicators drop by approximately 20% when 20% of nodes fail.
Furthermore, the network is most vulnerable when attacks target nodes with both high degree and high importance. This underscores the critical role of these nodes in maintaining network stability. Therefore, contingency plans for unexpected disruptions should prioritize the optimization and protection of these key nodes.

4.3.2. Edge Attacks

(1)
Random Attack
For each of the two cargo redistribution rules, 50 simulations are conducted, and the median of the results is taken, as shown in Figure 14.
Figure 14 shows that under random attacks, the trends of vulnerability indicators are similar. However, the network is less vulnerable when the cargo redistribution rule based on node load is applied. For example, in the maximum connectivity graph, when 30% of nodes fail, the indicator value drops by about 20%, whereas under the alternative scheme, it decreases by nearly 40%.
(2)
Deliberate Attack
For edge attacks, network vulnerability is analyzed by targeting edges with high betweenness (Table S4).
Figure 15 indicates that the network exhibits greater stability under cargo redistribution rules based on node load. When 20% of edges fail, each vulnerability indicator changes by approximately 20%. When 50% of edges fail, the indicators decrease by nearly 60%. Further sustained attacks significantly reduce network stability, making its vulnerability evident.
In summary, when node attacks occur, the China Railway Express freight network demonstrates the lowest vulnerability at a node coupling coefficient of 0.4. The highest network stability is attained by applying a cargo redistribution rule based on node distance. For edge attacks, a cargo redistribution rule based on node load is more effective in mitigating network failures. It is crucial to first identify the failure type when unexpected disruptions occur. If a node failure occurs, a cargo redistribution rule based on node distance should be applied, whereas for an edge failure, a rule based on node load should be implemented. Furthermore, the China Railway Express freight network exhibits substantially greater vulnerability under intentional attacks compared to random attack strategies. Intentional attacks trigger failures of critical nodes or edges, causing cargo flow redistribution and shifting loads to other nodes and edges. Congestion propagates rapidly through the network; within only 3–4 iterations, the failure rate approaches 30%, and network performance deteriorates by over 50%. This suggests that the network faces severe operational challenges, underscoring its extreme vulnerability to cascading failures. Moreover, the code of cascading failures targeted attack is demonstrated in Supplementary Material G.

4.4. Robustness and Uncertainty Analysis

4.4.1. Robustness Analysis

TOPSIS measures importance by calculating their distances from the positive and negative ideal solutions. The weights determine the relative importance of different evaluation criteria. A higher weight implies a greater influence of the corresponding criterion in the final ranking. Therefore, using the entropy method to calculate indicators weights enhances the objectivity of the model and effectively improves its robustness.
In grey relational analysis, the grey analysis coefficient adjusts the discrimination ability of the relational grades. If it is too small, minor data fluctuations may cause significant changes in the relational grades, while it is too large, the relational grades of all sequences become similar, leading to the failure of the model. Hence, setting it to 0.5 is effective, as it ensures stable ranking results and strong model robustness.
In the CML model, the coupling coefficient represents the degree of interaction among nodes. If the coupling coefficient is too small or too large, the model cannot simultaneously achieve robustness and effectiveness. Therefore, this study comprehensively considers three different coupling coefficient values.

4.4.2. Uncertainty Analysis

The international railway network is highly dynamic; however, data acquisition often suffers from time lags. The use of static or delayed data in the model may fail to reflect the network’s true resilience at present, leading to assessment results that deviate from reality.
Although CML model has advantages in simulating complex network dynamics, it assumes that node state evolution follows deterministic nonlinear equations, whereas real-world railway operations exhibit inherent randomness and multi-scale characteristics. Furthermore, institutional coordination and policy environments play a critical role in the operation of international rail services. These soft factors are difficult to quantify and incorporate into the CML framework, thereby increasing the overall uncertainty of the model.

4.5. Optimization Strategies for the International Railway Intermodal Network

Based on cascading-failure simulations of the China Railway Express, we propose four systemic enhancements:
  • Network Structure and Cross-Border Coordination: To reduce single-route dependency, establish parallel tracks at key corridors such as Alashankou–Dostyk. Enhance information sharing and collaborative planning between China and European partners. Upgrade or build key terminals to boost the coupling coefficient to approximately 0.4, thereby mitigating large-scale cascade risks at the source.
  • Enhancement of Resilience for Critical Nodes and Routes: Targeted attacks on high-degree or high-betweenness hubs lead to an approximate 20% drop in efficiency. Prioritize intelligent monitoring and early-warning systems at major hubs such as Xi’an and Zhengzhou. For overseas nodes, optimize wide- to standard-gauge transitions to maintain stable throughput during peak loads.
  • Optimization of Cargo Redistribution Rules: Simulations show that node failures result in network efficiency of 0.15 with distance-based redistribution versus 0.05 with load-based redistribution. Edge failures reverse this pattern. Therefore, use distance-based rerouting for node failures and load-based redistribution for edge failures, quickly redirecting cargo to the nearest stations to maintain critical services.
  • Contingency Plan and Construction of Multi-tier Emergency Response System: Develop tiered contingency plans for each failure type: deploy backup equipment or suspend and repair operations for machinery faults; coordinate stations to delay departures or reroute trains for infrastructure damage; reschedule with neighboring stations during overloads; adjust schedules and routes in real time for extreme weather; and flexibly modify or suspend services based on threat level during security incidents to ensure rapid restoration of transport functionality.

5. Conclusions

This paper examines the international railway freight network from the viewpoints of complex networks and coupling grid images, focusing on network composition, key nodes identification, and cascading failure simulation. Vulnerability indicators are selected based on topological structure and transmission service functions where the dual-layer networks are constructed, and key nodes are identified using methods such as TOPSIS entropy weight and gray correlation analysis. Finally, an improved CML model is proposed to assess the vulnerability of the international railway freight network under cascading failures. The main contribution of the proposed method is the integration of network structural characteristics and cargo flow distribution, along with the design of a dynamic node state model that incorporates indicators such as coupling coefficients. This model accurately characterizes the diffusion mechanism of cascading failures in the international railway freight network, simulates dynamic changes in nodes under external disturbances, and quantifies the impact of failures. It also reveals variations in network efficiency under different attack strategies. This approach conquers the limitations of traditional single-indicator assessments and provides new theoretical and technical methods for detecting and mitigating cascading failures in international railway freight networks.
The conclusions of this study offer valuable insights in international freight networks managements. Specifically, the international railway freight network demonstrates significant vulnerability when subjected to cascading failures. This vulnerability is closely related to network structure and influenced by traffic flow and cargo redistribution rules. The China Railway Express freight network exhibits external vulnerabilities in cascading failure scenarios. When the node coupling coefficient reaches 0.4, the network vulnerability is minimized. This indicates that special attention should be paid to the degree of coupling between nodes to reduce the potential risk of cascading failures in freight networks. Additionally, in the event of node failures, the cargo redistribution rule based on node distance should be used, while for edge failures, the rule based on node load should be selected.
In terms of network structure, active communication and coordination with departments like railways and customs along the routes is essential to strengthen border railway connections. If necessary, the number of railway lines connecting border stations should be increased. For key nodes and lines, regular assessments of station operational capacity should be conducted, and station operating processes should be optimized. Additionally, support should be provided to countries with outdated infrastructure to upgrade their equipment and routes. In terms of cargo distribution, during cascading failures, operators should prioritize transporting goods from failed stations to nearby stations for rapid re-routing, aiming to complete all transportation tasks before network failures occur. Furthermore, emergency response plans should be developed, and a multi-tiered emergency response system should be established to handle unforeseen events.
However, with the rapid development of international railway intermodal transport, its network is updating constantly and the volume of cargo has grown substantially. In the identification of key nodes, only the difference between railway port station cities and general node cities is considered. The next research can further subdivide the node types, such as transshipment stations, transfer stations and so on to improve the accuracy of key node identification. It is inevitable to encounter the situation of sea–rail intermodal transportation; however, this paper only focuses on railway transportation. Future research can integrate transshipment methods into the CML-based node state model to better simulate realistic network node dynamics.

Supplementary Materials

The following supporting information can be downloaded at: https://www.mdpi.com/article/10.3390/app152010899/s1, Supplementary Material A (Table S1), Supplementary Material B (Table S2), Supplementary Material C (Table S3), Supplementary Material D (Table S4), Supplementary Material E (Table S5), Supplementary Material F (Table S6), Supplementary Material G (Code), and Supplementary Material H (Figures S1–S4, Tables S7 and S8).

Author Contributions

Conceptualization, S.C. and Z.L.; methodology, S.C. and Q.Z.; software, Z.L. and Q.Z.; validation, Z.L. and Q.Z.; formal analysis, S.C.; investigation, S.C.; resources, Y.T.; data curation, S.C.; writing—original draft preparation, Q.Z.; writing—review and editing, Z.L.; supervision, S.C. and Y.T.; project administration, Y.T.; funding acquisition, Y.T. All authors have read and agreed to the published version of the manuscript.

Funding

This research was funded by the Natural Science Foundation of Sichuan Province, China [No. 2025NSFSC1936], the China State Railway Group Co., Ltd. Science and Technology Research and Development Program [No. N2024X018(JB)], and the China Railway Beijing Group Co., Ltd. Science and Technology Research and Development Program [No. 2025AZ03].

Institutional Review Board Statement

Not applicable.

Informed Consent Statement

Not applicable.

Data Availability Statement

The data presented in this study are available on request from the corresponding author.

Conflicts of Interest

The authors declare that this study received funding from the Natural Science Foundation of Sichuan Province, China, the China State Railway Group Co., Ltd., and the China Railway Beijing Group Co., Ltd. The funder had the following involvement with the study: providing financial support through research grants for data collection and analysis.

References

  1. Kundu, T.; Sheu, J.-B. Analysing the effect of government policy intervention on cross-border freight transportation flows: The belt and road perspective. Transp. A Transp. Sci. 2019, 15, 1360–1381. [Google Scholar] [CrossRef]
  2. Zhang, Y.; Zhang, A.; Wang, K.; Zheng, S.; Yang, H.; Hong, J. Impact of CR express and intermodal freight transport competition on China-europe route: Emission and welfare implications. Transp. Res. Part A Policy Pract. 2023, 171, 103642. [Google Scholar] [CrossRef]
  3. Li, H.; Qi, L.; Wang, M.; Liu, J. Operational resilience modeling of cross-border freight railway systems: A study of strategies to improve proactive and reactive capabilities. Reliab. Eng. Syst. Saf. 2025, 257, 110856. [Google Scholar] [CrossRef]
  4. Xiao, F.; Li, J.; Wei, B. Cascading failure analysis and critical node identification in complex networks. Phys. A Stat. Mech. Its Appl. 2022, 596, 127117. [Google Scholar] [CrossRef]
  5. Wang, J.; He, R.; Sun, H.; He, H. Cascading dynamics on coupled networks with load-capacity interplay and concurrent recovery-failure. Phys. A Stat. Mech. Its Appl. 2025, 661, 130373. [Google Scholar] [CrossRef]
  6. Touloumidis, D.; Madas, M.; Zeimpekis, V.; Ayfantopoulou, G. Weather-Related Disruptions in Transportation and Logistics: A Systematic Literature Review and a Policy Implementation Roadmap. Logistics 2025, 9, 32. [Google Scholar] [CrossRef]
  7. Yuan, H.; Yang, B. System dynamics approach for evaluating the interconnection performance of cross-border transport infrastructure. J. Manag. Eng. 2022, 38, 04022008. [Google Scholar] [CrossRef]
  8. Verschuur, J.; Koks, E.E.; Hall, J.W. Port disruptions due to natural disasters: Insights into port and logistics resilience. Transp. Res. Part D Transp. Environ. 2020, 85, 102393. [Google Scholar] [CrossRef]
  9. Jenelius, E.; Petersen, T.; Mattsson, L.-G. Importance and exposure in road network vulnerability analysis. Transp. Res. Part A Policy Pract. 2006, 40, 537–560. [Google Scholar] [CrossRef]
  10. Vivek, S.; Conner, H. Urban road network vulnerability and resilience to large-scale attacks. Saf. Sci. 2022, 147, 105575. [Google Scholar] [CrossRef]
  11. Xin, Z.; Niu, F. Structure and robustness of China’s railway transport network. Transp. Lett. 2023, 15, 375–385. [Google Scholar] [CrossRef]
  12. Lyu, M.; Shuai, B.; Zhang, Q.; Li, L. Ripple effect in China–Europe Railway transport network: Ripple failure risk propagation and influence. Phys. A Stat. Mech. Its Appl. 2023, 620, 128739. [Google Scholar] [CrossRef]
  13. Jiang, Y.; Han, M.; Chen, C.; Han, Y.; Yu, F.; Mi, X. A vulnerability assessment with freight flow data of railway freight transportation network in Northeast China. J. Transp. Geogr. 2025, 129, 104416. [Google Scholar] [CrossRef]
  14. Southworth, F.; Peterson, B.E. Intermodal and international freight network modeling. Transp. Res. Part C Emerg. Technol. 2000, 8, 147–166. [Google Scholar] [CrossRef]
  15. Zhao, L.; Cheng, Z.; Li, H.; Hu, Q. Evolution of the China railway express consolidation network and optimization of consolidation routes. J. Adv. Transport. 2019, 2019, 1–16. [Google Scholar] [CrossRef]
  16. Dong, T.; Li, Y.; Sun, K.; Chen, J. Research on the resilience of a railway network based on a complex structure analysis of physical and service networks. Appl. Sci. 2025, 15, 5135. [Google Scholar] [CrossRef]
  17. Xu, X.; Huang, A.; Shalaby, A.; Feng, Q.; Chen, M.; Qi, G. Exploring cascading failure processes of interdependent multi-modal public transit networks. Phys. A Stat. Mech. Its Appl. 2024, 638, 129576. [Google Scholar] [CrossRef]
  18. Guo, X.; Du, Q.; Li, Y.; Zong, X.; Bai, L. Cascading failure and recovery propagation of metro-bus double-layer network under time-varying passengers. Transp. Res. Part D Transp. Environ. 2025, 139, 104571. [Google Scholar] [CrossRef]
  19. Yin, D.; Huang, W.; Shuai, B.; Liu, H.; Zhang, Y. Structural characteristics analysis and cascading failure impact analysis of urban rail transit network: From the perspective of multi-layer network. Reliab. Eng. Syst. Saf. 2022, 218, 108161. [Google Scholar] [CrossRef]
  20. Zhang, L.; Wen, H.; Lu, J.; Lei, D.; Li, S.; Ukkusuri, S.V. Exploring cascading reliability of multi-modal public transit network based on complex networks. Reliab. Eng. Syst. Saf. 2022, 221, 108367. [Google Scholar] [CrossRef]
  21. Ma, J.; Ma, S.; Xie, X.; Gui, W. Robustness analysis of high-speed railway networks against cascading failures: From a multi-layer network perspective. IEEE Trans. Netw. Sci. Eng. 2024, 11, 6522–6534. [Google Scholar] [CrossRef]
  22. Guo, X.; Du, Q.; Li, Y.; Zhou, Y.; Wang, Y.; Huang, Y.; Martinez-Pastor, B. Cascading failure and recovery of metro–bus double-layer network considering recovery propagation. Transp. Res. Part D Transp. Environ. 2023, 122, 103861. [Google Scholar] [CrossRef]
  23. Song, X.; Zhao, P.; Yin, R.; Zu, Y.; Zhang, Y. Cascading failure model and resilience-based sequential recovery strategy for complex networks. Reliab. Eng. Syst. Saf. 2025, 253, 110488. [Google Scholar] [CrossRef]
  24. Zhang, X.; Zhang, W.; Lee, P.T.-W. Importance rankings of nodes in the China railway express network under the belt and road initiative. Transp. Res. Part A Policy Pract. 2020, 139, 134–147. [Google Scholar] [CrossRef]
  25. Ippolito, N.; Cats, O. Multi-modal and multi-layer robustness analysis of the european rail and air networks. Sci. Rep. 2024, 14, 26950. [Google Scholar] [CrossRef] [PubMed]
  26. Guo, Q.; Yi, M.-H.; Liu, J.-G. Identifying node importance for networked systems in terms of the cascading model. Phys. Lett. A 2024, 527, 129996. [Google Scholar] [CrossRef]
  27. Shi, J.; Li, H. Operational planning of international freight trains considering the dynamic demands and capacities of border ports. Comput. Ind. Eng. 2023, 185, 109658. [Google Scholar] [CrossRef]
  28. Wang, J.; Huang, Y. An edge load cascading failure model and vulnerability analysis of coupled critical infrastructure networks: Considering functional and geographical interdependency. Reliab. Eng. Syst. Saf. 2026, 266, 111719. [Google Scholar] [CrossRef]
  29. Zhu, C.; Zhu, X. Vulnerability analysis of China-europe railway express network based on improved nonlinear load-capacity model. J. Adv. Transport. 2024, 2024, 5910244. [Google Scholar] [CrossRef]
  30. Zhu, T.; Yang, X.; Wang, H.; Wu, J. A performance assessment method for urban rail transit last train network based on percolation theory. J. Supercomput. 2024, 80, 11474–11490. [Google Scholar] [CrossRef]
  31. Zhang, J.; Wang, Z.; Wang, S.; Shao, W.; Zhao, X.; Liu, W. Vulnerability assessments of weighted urban rail transit networks with integrated coupled map lattices. Reliab. Eng. Syst. Saf. 2021, 214, 107707. [Google Scholar] [CrossRef]
  32. Lu, Q.-C.; Zhang, L.; Xu, P.-C.; Cui, X.; Li, J. Modeling network vulnerability of urban rail transit under cascading failures: A coupled map lattices approach. Reliab. Eng. Syst. Saf. 2022, 221, 108320. [Google Scholar] [CrossRef]
  33. Zhang, L.; Xu, M.; Wang, S. Quantifying bus route service disruptions under interdependent cascading failures of a multimodal public transit system based on an improved coupled map lattice model. Reliab. Eng. Syst. Saf. 2023, 235, 109250. [Google Scholar] [CrossRef]
  34. Chen, B.; Wu, J.; Chen, Y.; Lee, D.-H.; He, Z. Cascading failures in interdependent transportation networks: A generalized coupled map lattice model with intermodal dynamics. Phys. A Stat. Mech. Its Appl. 2025, 675, 130836. [Google Scholar] [CrossRef]
  35. Yin, R.-R.; Yuan, H.; Wang, J.; Zhao, N.; Liu, L. Modeling and analyzing cascading dynamics of the urban road traffic network. Phys. A Stat. Mech. Its Appl. 2021, 566, 125600. [Google Scholar] [CrossRef]
  36. Xiao, Y.; Li, Y.; Liu, W.; Wang, Z.; Chen, J.; Wang, W. Resilience assessment of high-speed railway networks from the spatio-temporal perspective: A case study in jiangsu province, China. Reliab. Eng. Syst. Saf. 2025, 259, 110900. [Google Scholar] [CrossRef]
  37. Dui, H.; Chen, S.; Zhou, Y.; Wu, S. Maintenance analysis of transportation networks by the traffic transfer principle considering node idle capacity. Reliab. Eng. Syst. Saf. 2022, 221, 108386. [Google Scholar] [CrossRef]
  38. Zhou, X.; Zhang, F.; Zhou, W.-P.; Zou, W.; Yang, F. Evaluating complex network functional robustness by node efficiency. Acta Phys. Sin. 2012, 61, 190201. [Google Scholar] [CrossRef]
  39. Chen, Z.; Yang, C.; Qian, J.-H.; Han, D.; Ma, Y.-G. Recursive traffic percolation on urban transportation systems. Chaos 2023, 33, 033132. [Google Scholar] [CrossRef]
  40. Nagurney, A.; Qiang, Q. A network efficiency measure for congested networks. Eur. Lett. 2007, 79, 38005. [Google Scholar] [CrossRef]
  41. Hussein, M.; Karam, A.; Eltoukhy, A.E.E.; Darko, A.; Zayed, T. Optimized multimodal logistics planning of modular integrated construction using hybrid multi-agent and metamodeling. Autom. Construct. 2023, 145, 104637. [Google Scholar] [CrossRef]
  42. He, Z.; Navneet, K.; Van Dam, W.; Van Mieghem, P. Robustness assessment of multimodal freight transport networks. Reliab. Eng. Syst. Saf. 2021, 207, 107315. [Google Scholar] [CrossRef]
  43. Yang, X.; Liu, L. Research on traffic flow prediction based on chaotic time series. IAENG Int. J. Appl. Math. 2023, 53, 1007. [Google Scholar]
  44. Qian, Y.; Wang, B.; Xue, Y.; Zeng, J.; Wang, N. A simulation of the cascading failure of a complex network model by considering the characteristics of road traffic conditions. Nonlinear Dyn. 2015, 80, 413–420. [Google Scholar] [CrossRef]
  45. Ma, Q.; Huang, G.H.; Ullah, S. A multi-parameter chaotic fusion approach for traffic flow forecasting. IEEE Access 2020, 8, 222774–222781. [Google Scholar] [CrossRef]
  46. Motter, A.E.; Lai, Y.-C. Cascade-based attacks on complex networks. Phys. Rev. E 2002, 66, 065102. [Google Scholar] [CrossRef] [PubMed]
Figure 1. Research Framework.
Applsci 15 10899 g001
Figure 2. The Basic Line Network.
Applsci 15 10899 g002
Figure 3. The Transportation Service Network.
Applsci 15 10899 g003
Figure 4. Integration Relationship Diagram.
Applsci 15 10899 g004
Figure 5. Key Nodes Identification Flowchart.
Applsci 15 10899 g005
Figure 6. The Main Channels and Coverage of the China Railway Express Freight Network.
Applsci 15 10899 g006
Figure 7. Basic Line Network.
Applsci 15 10899 g007
Figure 8. Transportation Service Network.
Applsci 15 10899 g008
Figure 9. Indicators Change Under Random Attacks: (a) Maximum Effective Graph, (b) Network Efficiency, (c) Transportation Performance, (d) Affected Cargo Flow Rate.
Applsci 15 10899 g009
Figure 10. Indicators Change Under Deliberate Attacks: (a) Maximum Effective Graph, (b) Network Efficiency, (c) Transportation Performance, (d) Affected Cargo Flow Rate.
Applsci 15 10899 g010
Figure 11. Indicators Change Under Different Attack Strategies ( ε 1 = 0.4): (a) Maximum Effective Graph, (b) Network Efficiency, (c) Transportation Performance, (d) Affected Cargo Flow Rate.
Applsci 15 10899 g011
Figure 12. Indicators Change Under Random Attacks (Node Attack): (a) Maximum Effective Graph, (b) Network Efficiency, (c) Transportation Performance, (d) Affected Cargo Flow Rate.
Applsci 15 10899 g012
Figure 13. Indicators Change Under Deliberate Attacks (Node Attack): (a) Maximum Effective Graph, (b) Network Efficiency, (c) Transportation Performance, (d) Affected Cargo Flow Rate.
Applsci 15 10899 g013
Figure 14. Indicators Change Under Random Attacks (Edge Attack): (a) Maximum Effective Graph, (b) Network Efficiency, (c) Transportation Performance, (d) Affected Cargo Flow Rate.
Applsci 15 10899 g014
Figure 15. Indicators Change Under Deliberate Attacks (Edge Attack): (a) Maximum Effective Graph, (b) Network Efficiency, (c) Transportation Performance, (d) Affected Cargo Flow Rate.
Applsci 15 10899 g015
Table 1. The Top 20 nodes of the China Railway Express freight network.
No.NodesGrey CorrelationNo.NodesGrey Correlation
1Malashevich0.854011Erlianhot0.4984
2Moscow0.720012Dostyk0.4827
3Xi’an0.655313Wuhan0.4743
4Yiwu0.609314Hamburg0.4695
5Alashankou0.600715Brest0.4651
6Minsk0.589816Warsaw0.4597
7Zhenghou0.582117Urumqi0.4590
8Chengdu0.565418Manchuria0.4569
9Duisburg0.552919Lanzhou0.4502
10Horgos
(Border Port Node)
0.531820Lodz0.4479
Disclaimer/Publisher’s Note: The statements, opinions and data contained in all publications are solely those of the individual author(s) and contributor(s) and not of MDPI and/or the editor(s). MDPI and/or the editor(s) disclaim responsibility for any injury to people or property resulting from any ideas, methods, instructions or products referred to in the content.