Article

Research on Indoor 3D Semantic Mapping Based on ORB-SLAM2 and Multi-Object Tracking

1
Institute of Space Optoelectronic Technology, Changchun University of Science and Technology, Changchun 130022, China
2
OPPO Artificial Intelligence Center, Beijing 100026, China
*
Author to whom correspondence should be addressed.
Appl. Sci. 2025, 15(20), 10881; https://doi.org/10.3390/app152010881
Submission received: 28 August 2025 / Revised: 16 September 2025 / Accepted: 8 October 2025 / Published: 10 October 2025

Abstract

The integration of semantic simultaneous localization and mapping (SLAM) with 3D object detection in indoor scenes is a significant challenge in the field of robot perception. Existing methods typically rely on expensive sensors and lack robustness and accuracy in complex environments. To address this, this paper proposes a novel 3D semantic SLAM framework that integrates Oriented FAST and Rotated BRIEF-SLAM2 (ORB-SLAM2), 3D object detection, and multi-object tracking (MOT) techniques to achieve efficient and robust semantic environment modeling. Specifically, we employ an improved 3D object detection network to extract semantic information and enhance detection accuracy through category balancing strategies and optimized loss functions. Additionally, we introduce MOT algorithms to filter and track 3D bounding boxes, enhancing stability in dynamic scenes. Finally, we deeply integrate 3D semantic information into the SLAM system, achieving high-precision 3D semantic map construction. Experiments were conducted on the public dataset SUNRGBD and two self-collected datasets (robot navigation and XR glasses scenes). The results show that, compared with the current state-of-the-art methods, our method demonstrates significant advantages in detection accuracy, localization accuracy, and system robustness, providing an effective solution for low-cost, high-precision indoor semantic SLAM.

1. Introduction

The approaches to semantic mapping for indoor and outdoor environments differ markedly, primarily due to inherent differences in environmental conditions and task objectives. Indoor settings are highly structured, compact, and enclosed, emphasizing precise geometric and functional understanding of static elements like rooms and furniture. They often rely on RGB cameras, RGB-D cameras, and LiDAR. In contrast, outdoor environments are large-scale, open, and dynamically complex. They require handling weather, lighting variations, and fast-moving vehicles and pedestrians, placing greater emphasis on semantic classification of objects like roads and buildings and their navigational relationships. This typically relies on Global Positioning Systems (GPSs), Inertial Measurement Units (IMUs), and onboard multi-sensor fusion. Consequently, algorithms face distinct challenges in perception accuracy, computational efficiency, dynamic processing, and data correlation, necessitating fundamentally different technical approaches.
In recent years, indoor simultaneous localization and mapping (SLAM) has attracted increasing attention from both academia and industry [1,2,3]. Visual 3D object detection and tracking are crucial to indoor SLAM because they provide the geometric structure of the scene and the absolute proportions of objects. This information forms the basis for numerous subsequent applications, including positioning systems, path planning, map updating, and indoor navigation. While high-precision 3D object recognition can be achieved using lidar or multiple sets of surround-view cameras, monocular camera vision sensors, as a more practical solution for applications such as commercial robots and extended reality (XR) smart glasses, have gained significant attention [4,5]. In the realm of visual semantic SLAM, current systems predominantly rely on the assumption of a static environment and exhibit limited capability to handle common dynamic indoor objects (e.g., walking pedestrians and moving furniture). This often leads to pose estimation drift and map distortion [6,7]. Moreover, although the integration of semantic information has improved scene understanding, misidentification of semantic labels can corrupt the map. Additionally, the lack of efficient global semantic association and reasoning mechanisms impedes the construction of a hierarchical and practically useful semantic map [8].
To achieve visual 3D object detection, 2D object detection is usually involved as a subtask. FCOS3D [9] represents 3D object using 9-dimensional features. It implements multitask learning based on FCOS [10] 2D object detection to predict 3D feature descriptions, demonstrating excellent experimental performance. DD3D [11] expresses 3D targets using 12-dimensional features and incorporates three detection heads based on FPN [12] to achieve end-to-end 3D detection frame prediction, including depth estimation. However, due to limitations of the training datasets, these methods are primarily suitable for outdoor environments and are not ideal for indoor 3D object detection. Methods presented in [13,14,15,16,17,18] have demonstrated that depth prediction is effective in enhancing 3D object detection accuracy, which has inspired our approach. The 3D object detection methods based on monocular vision are significantly limited by the accuracy of depth estimation. In indoor scenarios, objects exhibit diverse scales and complex occlusions, which introduce substantial uncertainty into monocular depth estimation. Consequently, it becomes challenging to achieve the required accuracy in both the size and position of detection bounding boxes—a critical requirement for high-precision SLAM [19]. Furthermore, most of the aforementioned state-of-the-art models (e.g., FCOS3D, DD3D) are primarily trained on outdoor datasets (e.g., KITTI). However, the target sizes and category distributions in outdoor datasets differ remarkably from those in indoor environments. This discrepancy gives rise to prominent domain adaptation issues, resulting in limited performance when these models are directly applied to indoor 3D object detection tasks [20].
Multi-object tracking (MOT) has been shown to significantly reduce jitter and increase smoothness of 3D object boxes. It can be mainly divided into traditional methods and deep learning methods. The traditional methods [21,22,23] utilize Kalman filtering (KF) to predict the state of the detection objects, thereby smoothing their motion trajectories. The traditional KF tends to lose track of targets when there are abrupt changes in an object’s motion pattern or during prolonged occlusions. Additionally, it faces challenges in initializing new targets [24]. The deep learning methods [25,26,27] leverage extensive data associations to facilitate model training, thereby enhancing its feature extraction capabilities. While deep learning-based data association methods exhibit superior performance, they demand substantial computational resources. This poses challenges for achieving real-time inference on embedded platforms with limited computing capabilities—such as robots and XR devices [28,29]. More critically, most current MOT and SLAM systems adopt a loosely coupled design, where errors from the tracking module are directly propagated to the SLAM backend. Notably, there remains a lack of a unified optimization framework that can jointly optimize geometry, semantics, and motion trajectories [30,31].
In [32], the author discusses classic principles of data visualization and graphic design. Although the author primarily focuses on 2D planes, concepts such as the “Data-Ink Ratio,” “Chartjunk,” and “Small Multiples” can inspire us to consider how to more effectively design and present 3D semantic information. This approach helps avoid visual clutter while maximizing information density and clarity. The authors of [33] established the scientific basis for how human visual perception processes information. We leverage this theoretical framework to inform our design decisions regarding the selection of specific colors, shapes, and icons for representing distinct semantic categories (e.g., chairs, tables, and humans), thereby ensuring that these mappings align with human cognitive patterns.
SLAM systems are frequently employed as the foundational framework for semantic mapping. The semantic mapping methods [34,35,36,37,38] utilized are commonly based on the ORB-SLAM2 system for object positioning and mapping, offering a valuable reference for our solution.
In three-dimensional object detection tasks, dataset construction typically relies on specialized equipment and extensive manual annotation, resulting in high costs and limited efficiency. Furthermore, due to the impact of scale degradation effects, mapping features from two-dimensional images to three-dimensional space presents significant challenges. Simultaneously, the instability of 3D detection bounding boxes during image sequence transmission further constrains detection performance. To address these issues, this paper proposes a high-precision 3D object SLAM framework based on a monocular camera, introducing a novel “spatial information mapping” paradigm suitable for dynamic indoor environments. This solution integrates the traditional ORB-SLAM2 system with a 3D object detection module and a MOT module to enhance perception capabilities and system robustness in complex scenes.
The main contributions of this paper are summarized as follows:
(1)
We demonstrate that the 3D object detection algorithm, which generates 3D detection boxes and their semantic categories, is effective. In addition, we perform an analysis on the publicly available SUNRGBD dataset and investigate the dataset imbalance problem.
(2)
We show that MOT algorithms such as KF can track and filter 3D object detection results smoothly and accurately.
(3)
To the best of our knowledge, this is the first work of integrating 3D object detection and MOT into the visual SLAM system to achieve 3D object mapping.
The remaining portion of this paper is structured as follows. Section 2 reviews related work, including recent advancements in visual semantic SLAM, 3D object detection, and MOT. Section 3 details the proposed integrated approach, covering data preprocessing, 3D object detection, and the fusion mechanism for multi-object tracking and visual SLAM modules. Section 4 presents evaluation experiments and provides a comprehensive summary of the results. Finally, Section 5 concludes the paper and outlines future research directions.

2. Related Works

2.1. Vision Semantic SLAM

VINS [38], ORB-SLAM [39,40,41], LSD-SLAM [42], and VDO-SLAM [43] are commonly used visual SLAM frameworks known for achieving precise localization and mapping. Integrating a 2D object detection or segmentation module with these SLAM frameworks has been demonstrated as an effective approach to achieve semantic mapping. For instance, some methods [44,45,46] employ CNNs for single-frame depth estimation and semantic segmentation within the LSD-SLAM [42] framework to enable semantic SLAM. Inspired by [34,35,36,37,47,48,49], we have selected ORB-SLAM2 due to its superior performance. Unlike previous approaches [40], we optimize the back-end loop detection module to reduce loop detection bias. Compared with ORB-SLAM3, ORB-SLAM2 features a more clearly structured codebase and simpler application scenarios, ensuring no tracking loss will occur. Moreover, it does not demand ultra-high precision or an IMU, rendering it a more lightweight option that can be better suited for hardware platforms with constrained computational resources.

2.2. 3D Object Detection

Currently, the most popular methods for indoor visual 3D object detection are ImvoxelNet [50] and ImVoteNet [51]. ImVoteNet proposed 3D detection for RGBD images based on VoteNet [52]. It maintains two independent branches: one for 2D detection of RGB images and the other for point cloud feature extraction using PointNet on depth images, which are fused to generate 3D information. ImvoxelNet [50] employs 3D convolution networks to generate 3D object detection boxes. However, the process of 3D spatial feature conversion experiences scale degradation, resulting in significant jitter in the final 3D detection boxes.

2.3. MOT

3D object detection traditionally processes single-frame data, but incorporating KF or MOT modules can significantly mitigate the jitter in 3D detection boxes. KF [53,54] and AB3DMOT [55] are traditional filtering approaches frequently used in SLAM systems for their high efficiency and accuracy. Additionally, refs. [25,26,27] are deep learning-based MOT methods. PF-Track [25] employs cross-attention for the past reasoning module, and predicts future trajectories. SMILEtrack [26] introduces a similarity learning module and a target matching module. Ref. [27] proposes homography loss to enforce the consistency of the features. In our system, we have incorporated traditional filtering methods [55] to improve accuracy.

3. Proposed Approach

In this work, we propose a 3D object SLAM method for indoor scenes using a monocular camera. Our pipeline consists of four main components, as illustrated in Figure 1.
(1)
Dataset preprocessing. To improve training accuracy, we analyze the data distribution and propose a data processing method.
(2)
3D object detection. We map an association feature from 2D to 3D space. Subsequently, we use a 3D convolutional neural network to predict the 3D object boxes and categories.
(3)
MOT. We apply traditional filtering methods to track the detection results, addressing the significant jitter of the 3D object boxes across consecutive frames.
(4)
Visual SLAM. We integrate the aforementioned 3D object detection and MOT modules with the ORB-SLAM2 framework to realize monocular 3D object semantic SLAM. This proposed framework enhances the capabilities of traditional visual SLAM, providing a comprehensive solution for indoor scene understanding and applications.

3.1. Dataset Preprocessing

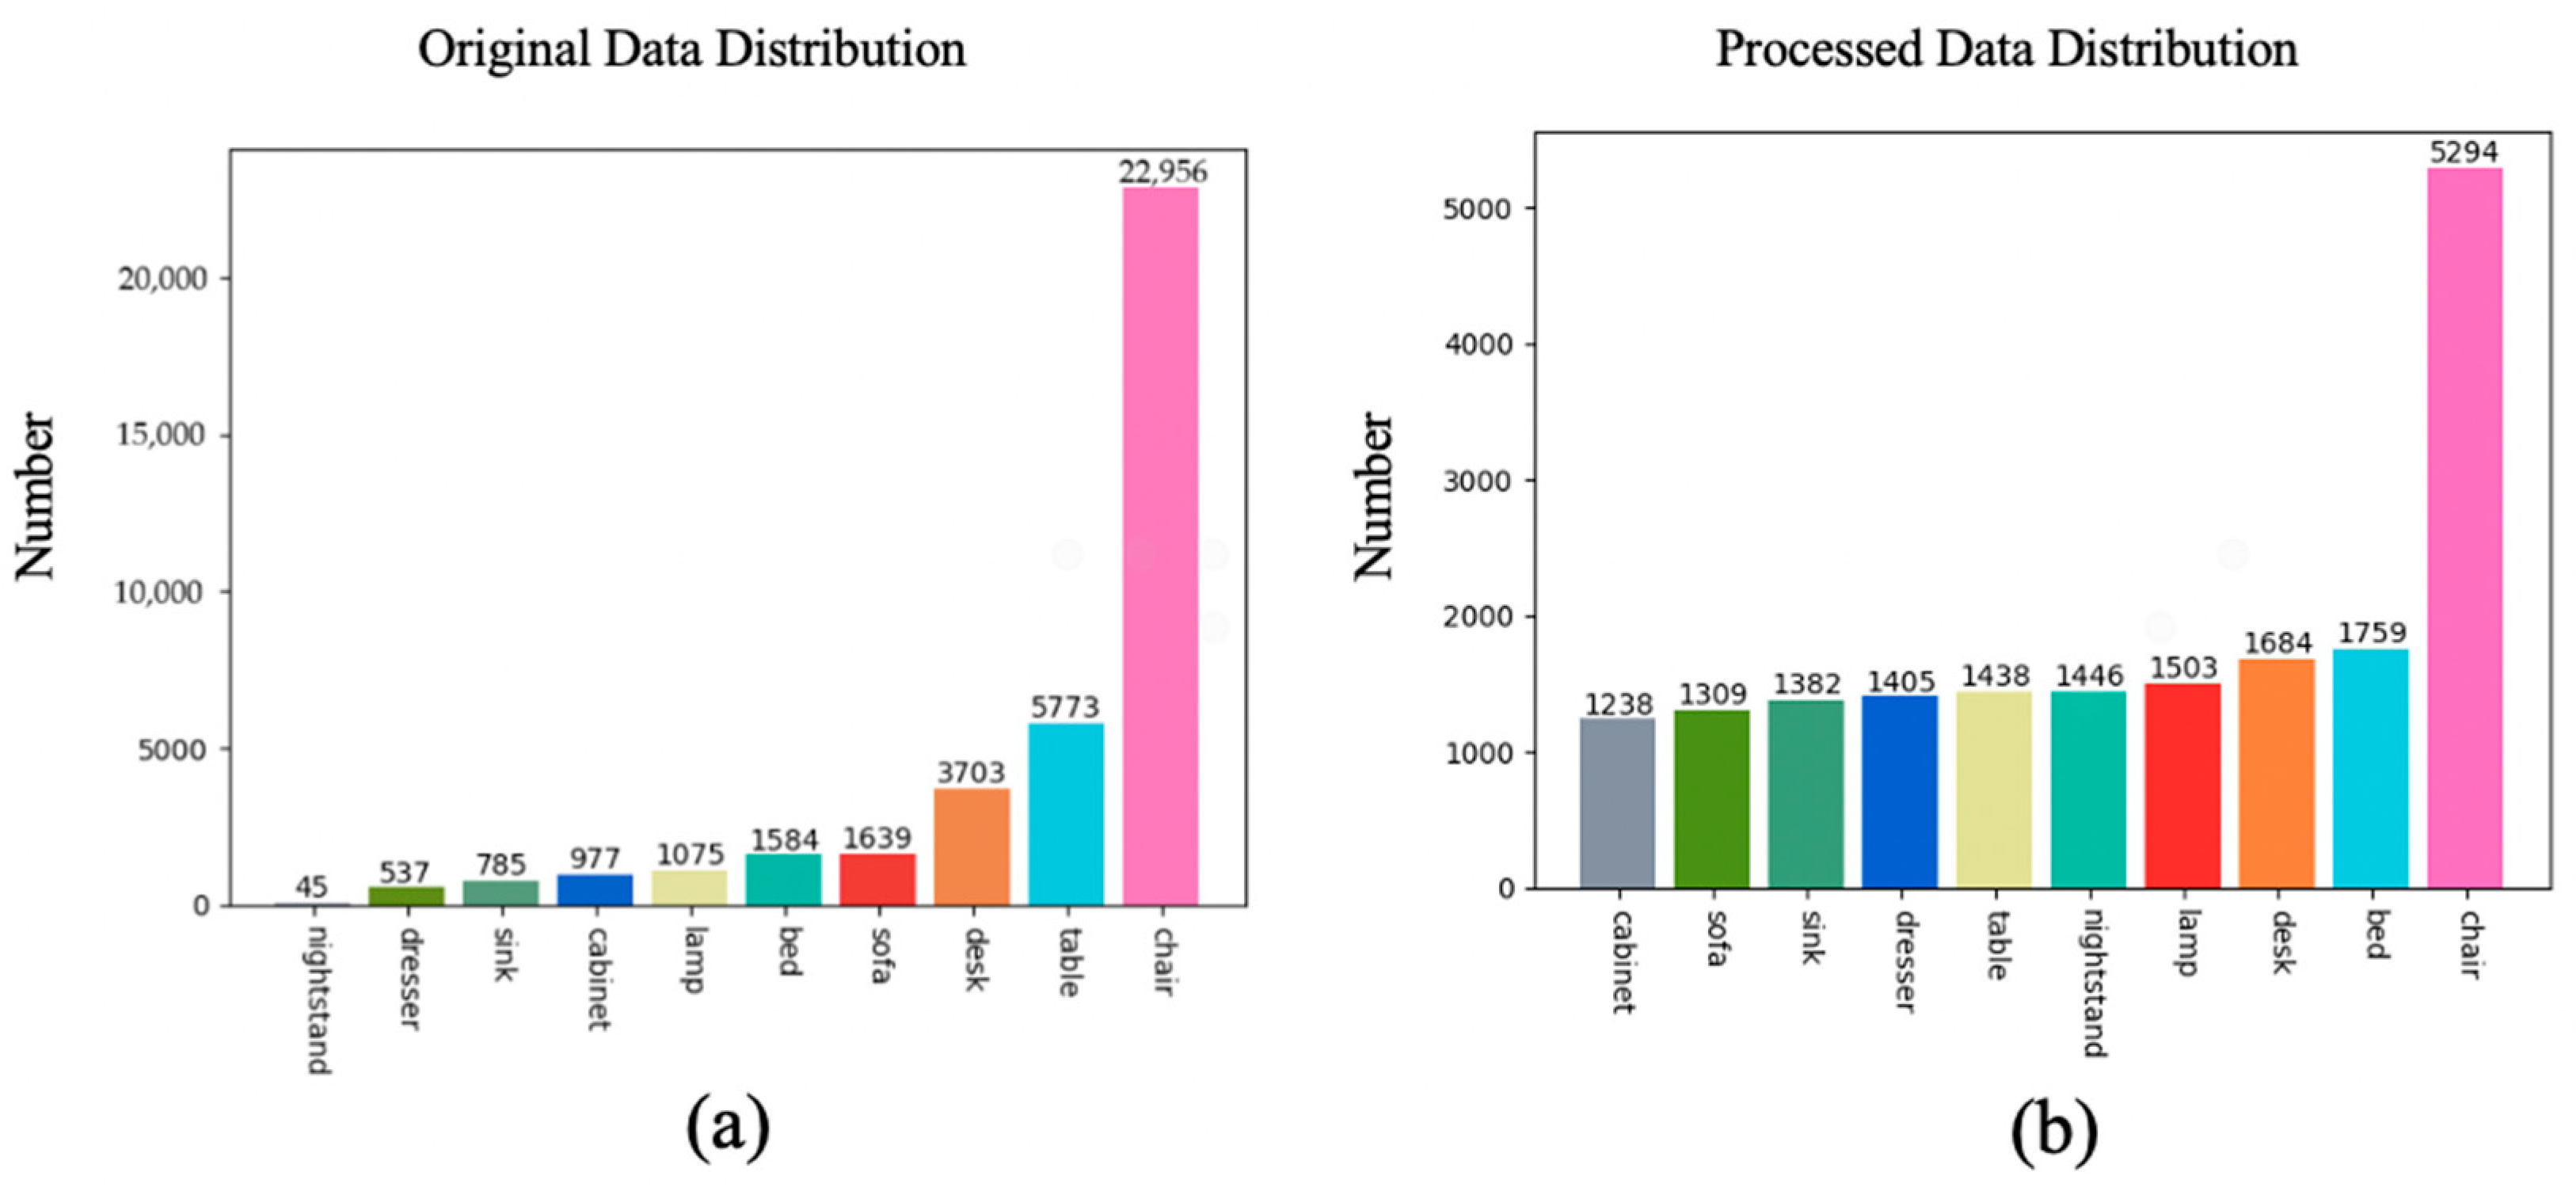
The primary dataset we study is SUNRGBD [56], which serves as the training dataset for 3D object detection. To improve the training accuracy, we first analyze and preprocess the SUNRGBD dataset. Initially, we examined the original SUNRGBD dataset using MATLAB R2023b. This dataset contains 10,335 RGBD images along with annotation information in both 2D and 3D spaces, covering 47 scenes and including 1145 annotated object labels. Studies such [50,51,52,57] have utilized the dataset. Specifically, refs. [50,51] used 10-category labels, while refs. [52,57] employed 37-category labels. We then analyzed the distribution diagrams showing the number of images corresponding to the 10-category and 37-category labels. The results revealed an uneven distribution in PPptheir training datasets, which could significantly impact detection accuracy. Considering the indoor scenes relevant to our application, we performed several data preprocessing steps: data distribution statistics, category filtering, checking for empty annotations, and upsampling to enhance the dataset. The distributions of original data and processed data are shown in Figure 2.

3.2. 3D Object Detection

We build upon ImvoxelNet [50] to implement 3D object detection, including 2D feature extraction, 2D to 3D mapping, 3D feature extraction, and 3D loss functions models.
(1)
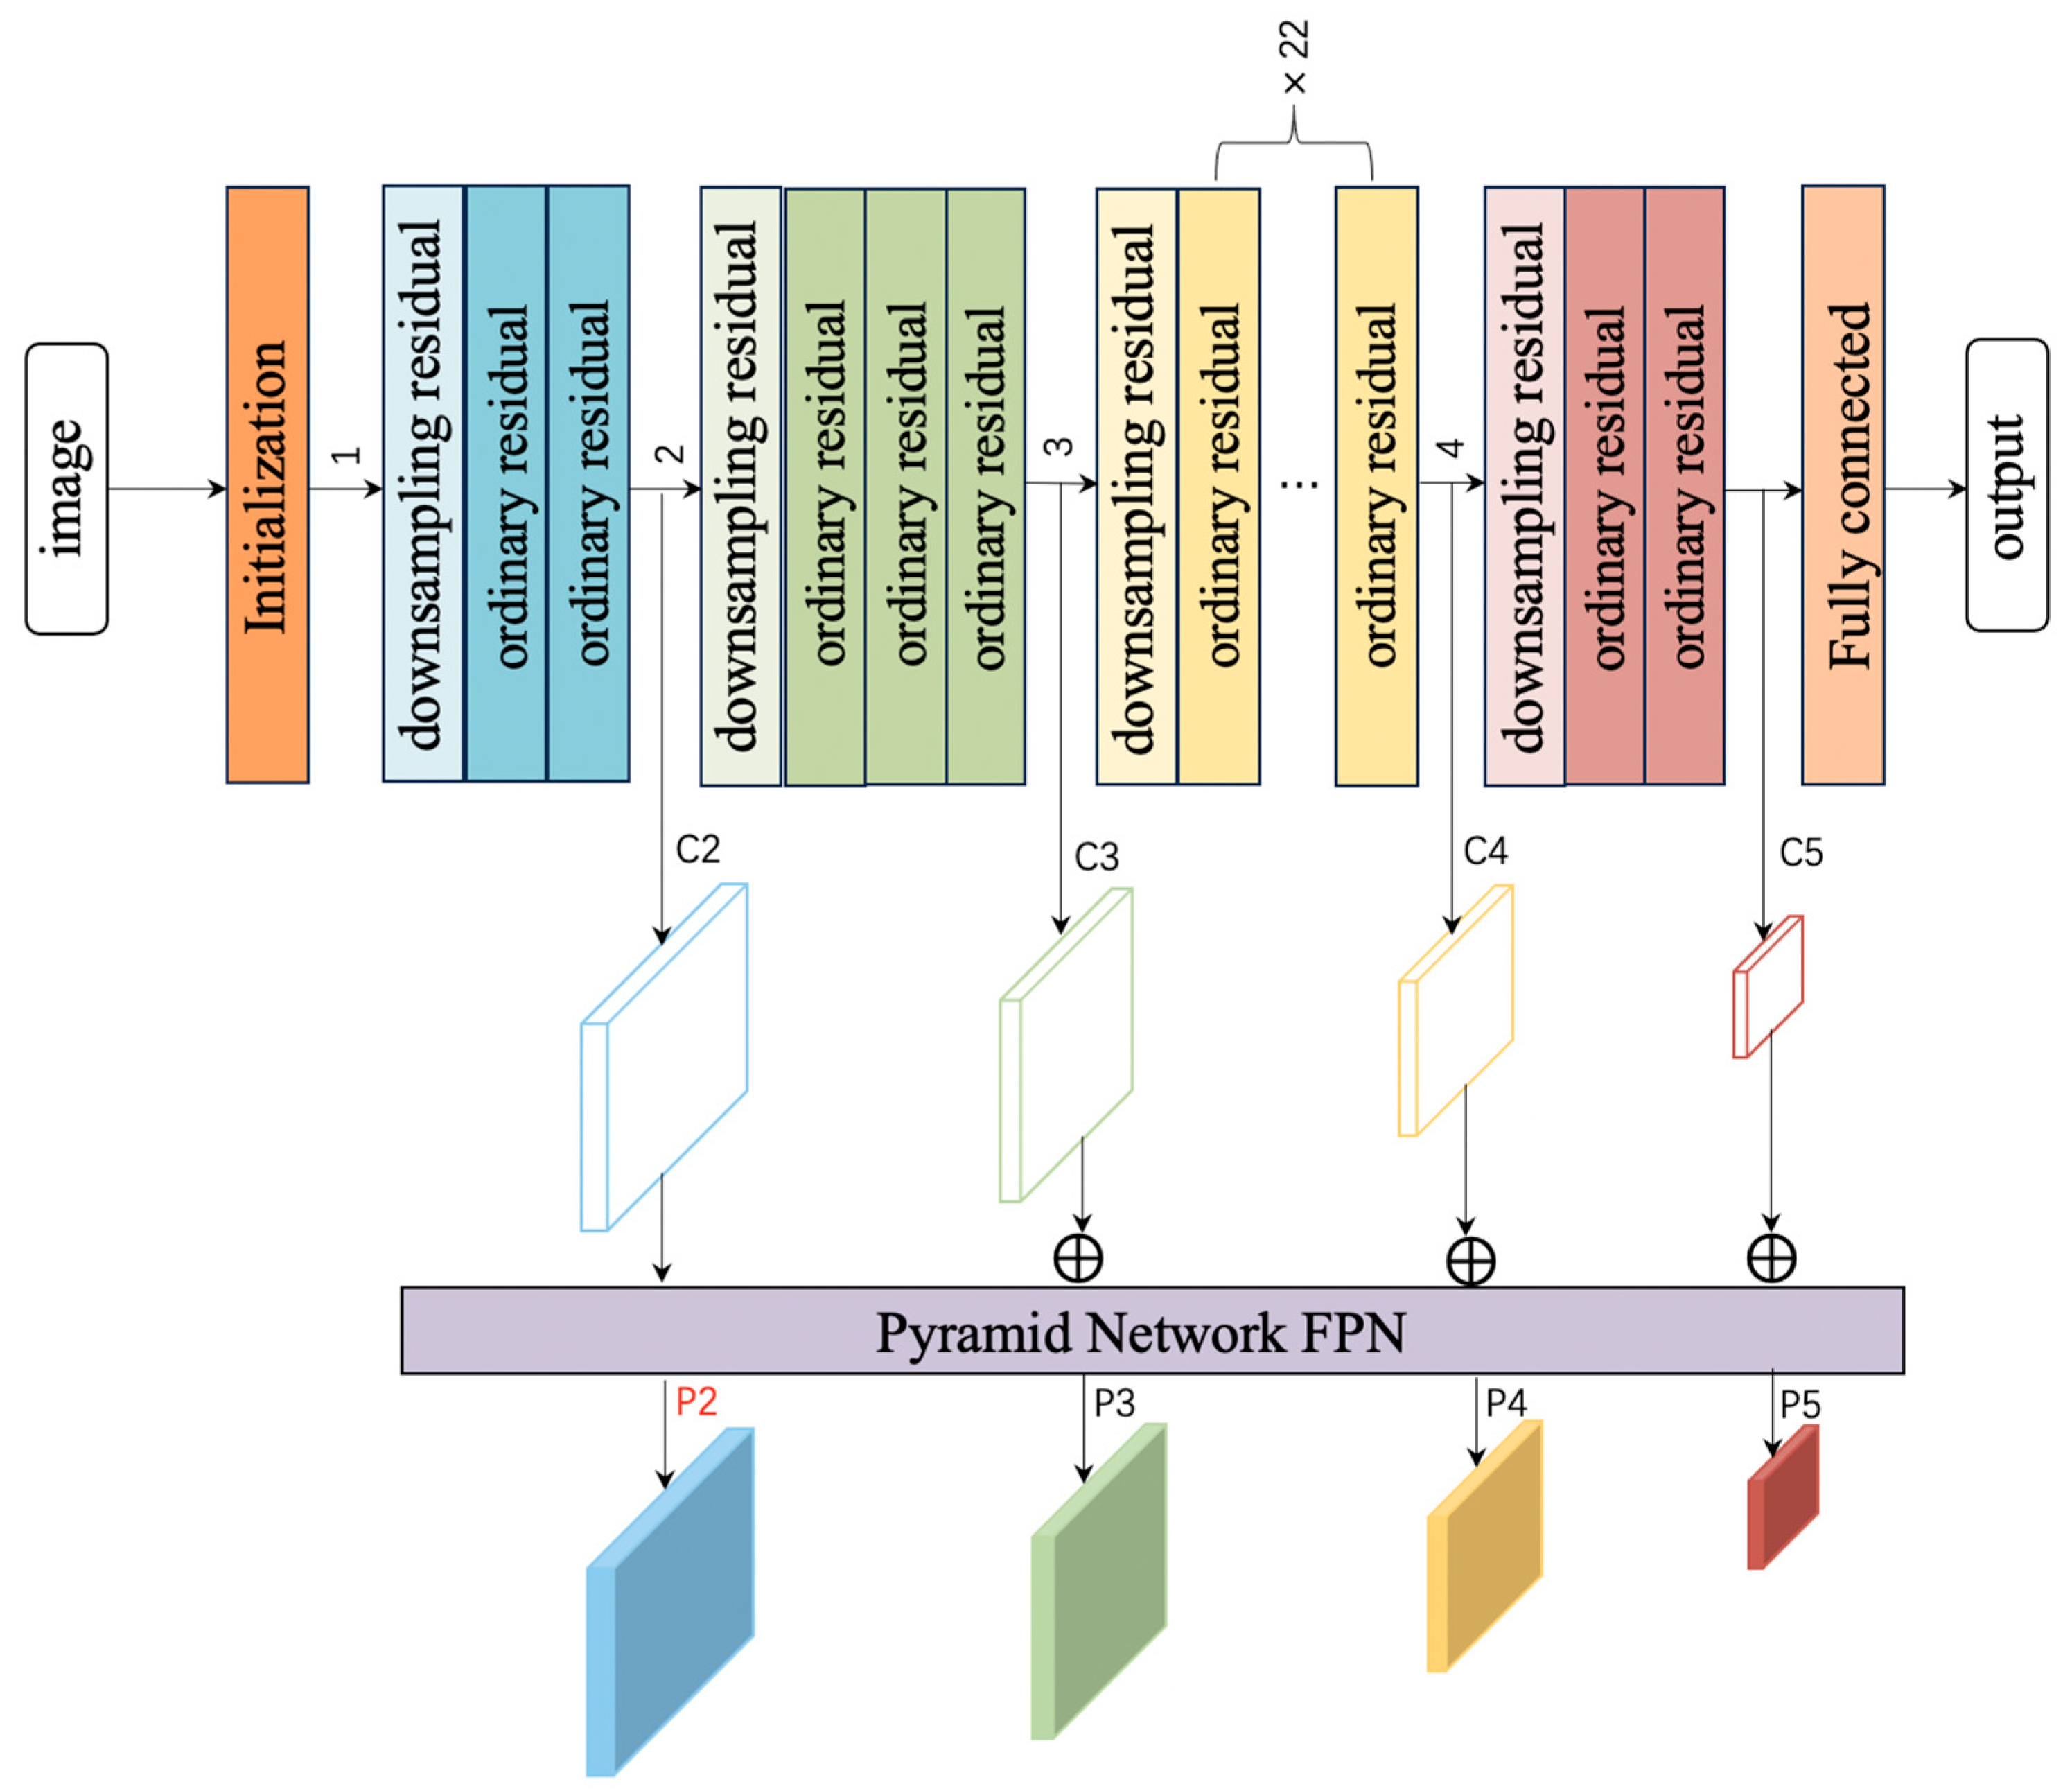
2D feature extraction. ResNet101 [58], which is based on the residual learning principle, is adopted as the backbone network to extract 2D features from the input monocular RGB images. To enhance the model’s ability to perceive features of objects with varying sizes, an FPN is integrated into the feature extraction network, enabling multi-scale feature fusion across the multiple feature maps generated by the backbone. Ultimately, a feature map with richer semantic information is output. ResNet101 is a deep residual network consisting of 101 layers; its core characteristic lies in the introduction of “residual learning.” This design effectively mitigates the gradient vanishing and gradient explosion issues in deep neural networks while extracting abundant semantic information. In contrast, FPN does not participate in feature extraction by the backbone network. Instead, it performs multi-scale feature fusion on the feature maps extracted from the input image by the backbone, thereby constructing a feature pyramid with high-level semantic information. Specifically, FPN leverages feature maps from different levels of the feature extraction network to build the pyramid, where each level corresponds to a distinct scale: lower-level feature maps exhibit higher spatial resolution but relatively low semantic information, whereas higher-level feature maps possess more robust semantic information.
The ResNet101 network employed in this work comprises four residual blocks, and its backbone architecture is illustrated in Figure 3.
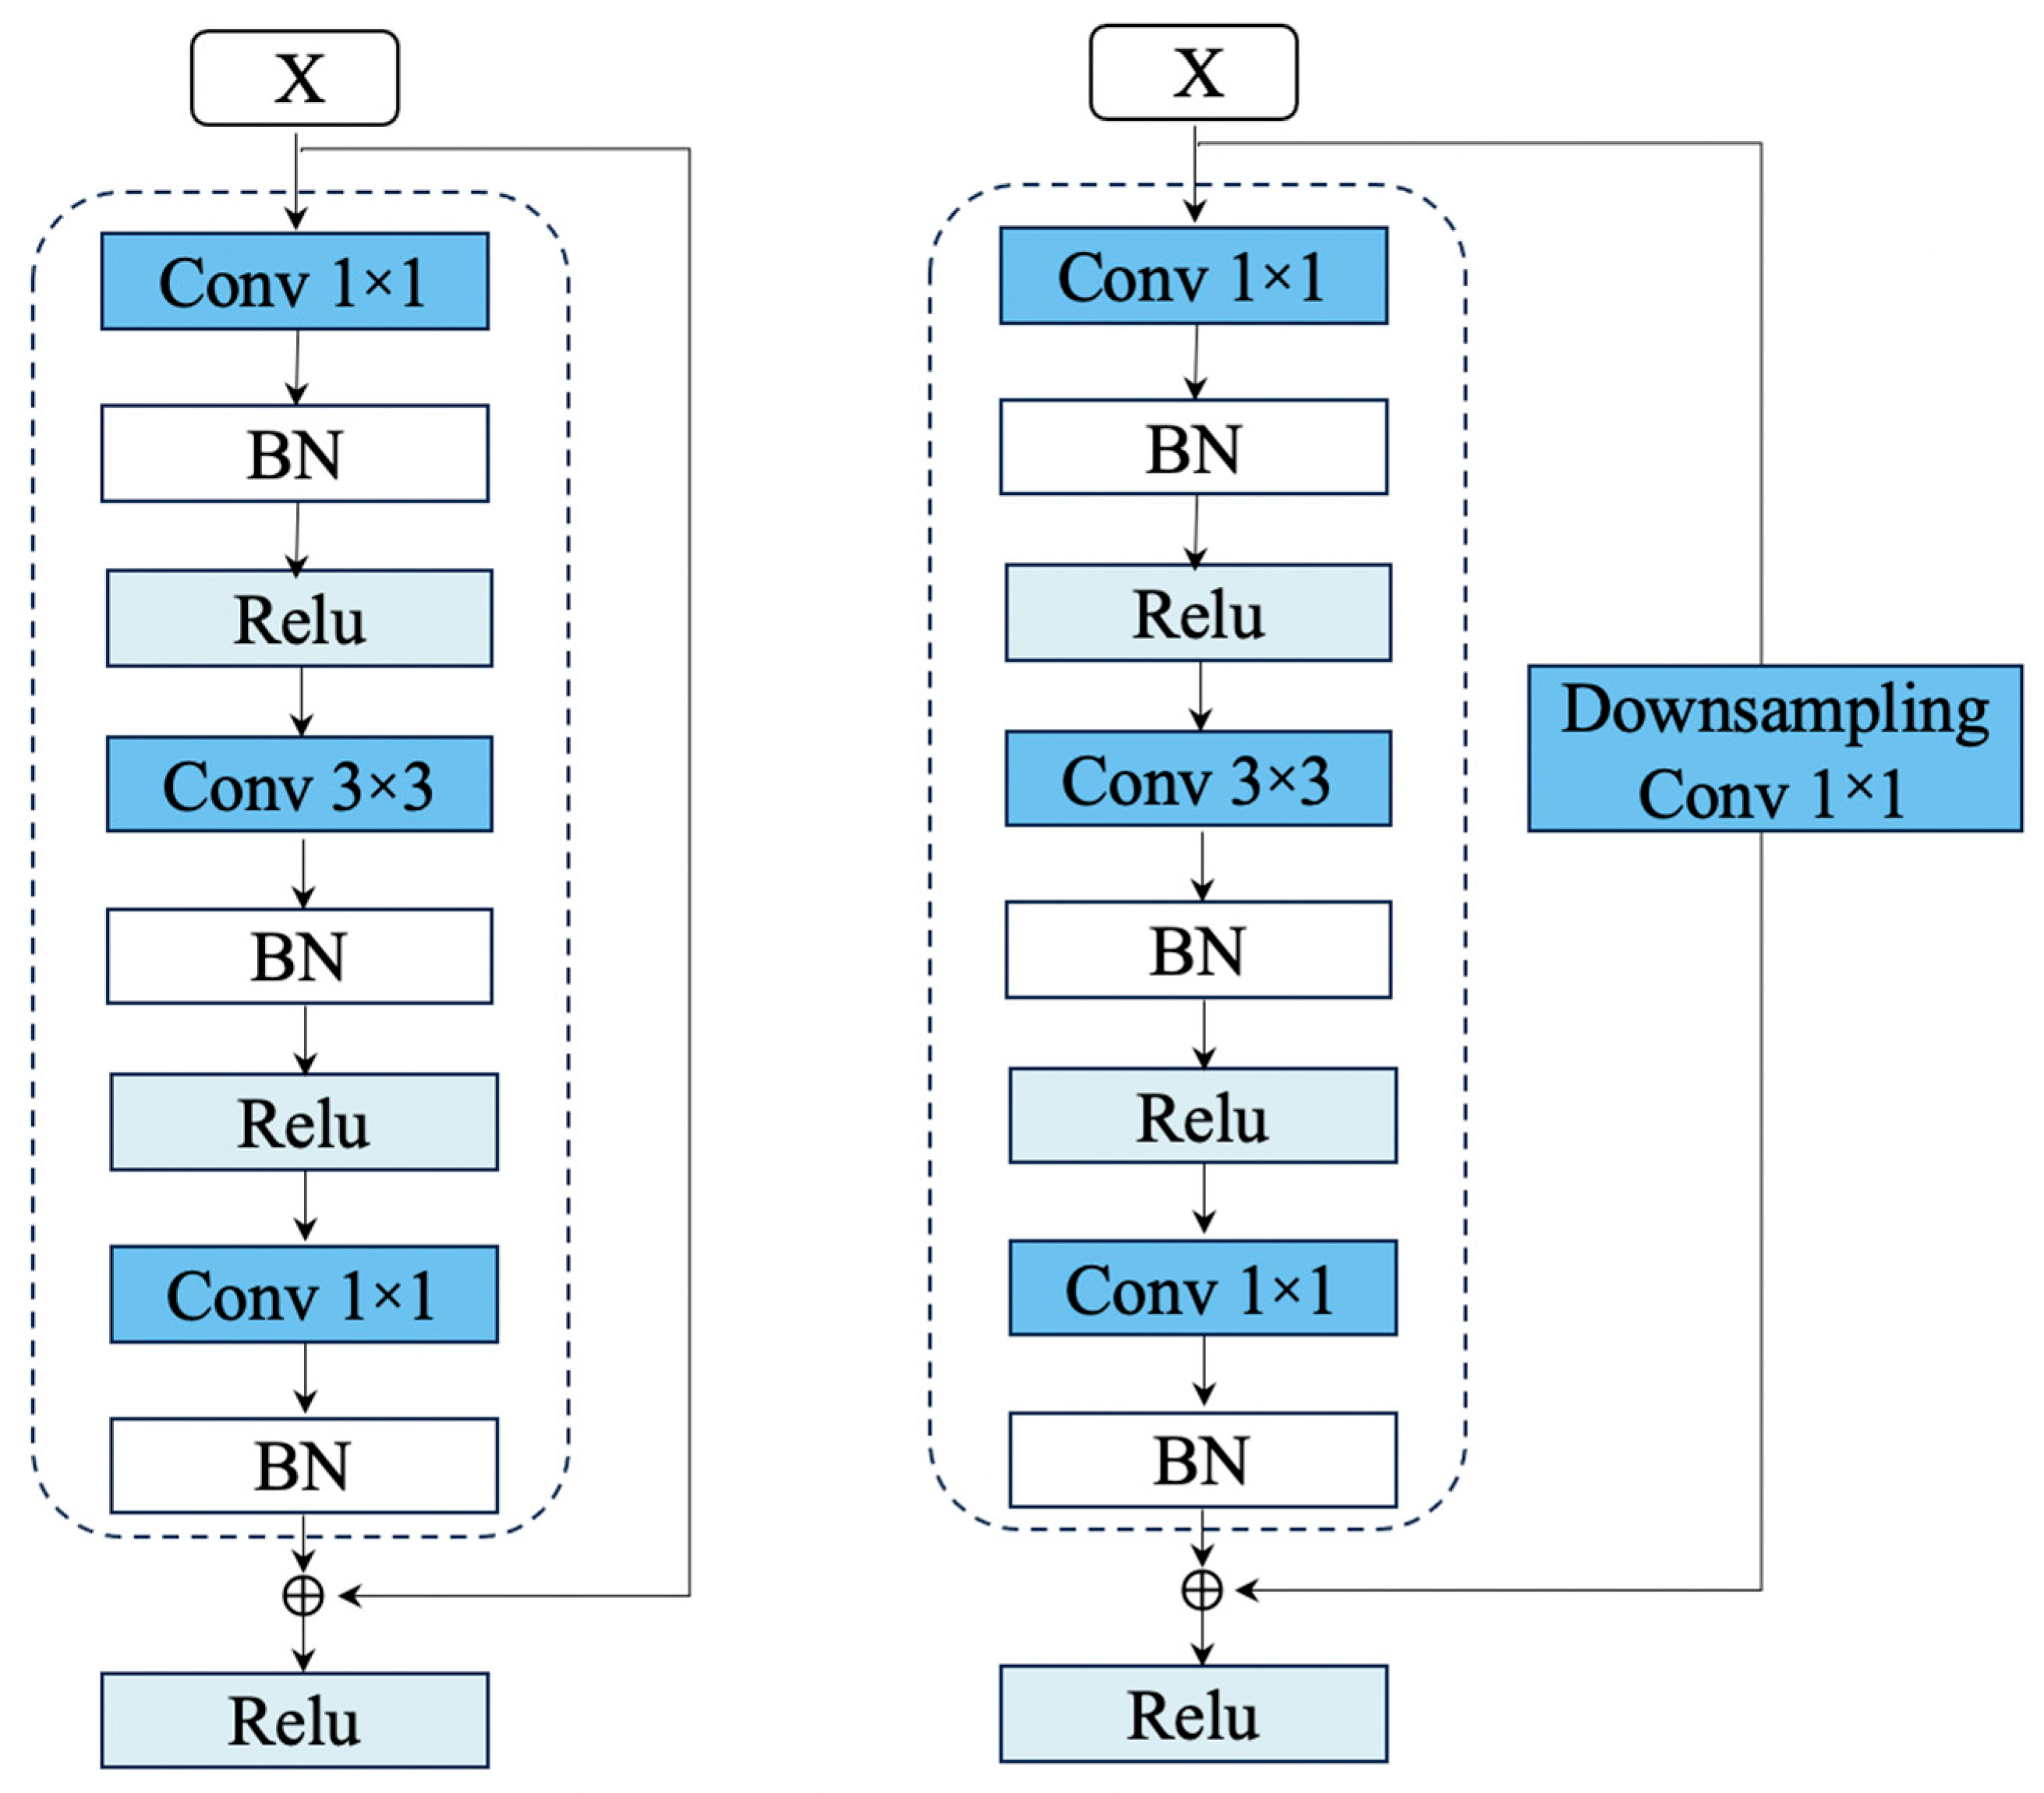
Specifically, each residual block consists of one downsampling residual unit and multiple ordinary residual units, whose network structure is presented in Figure 4. For the downsampling residual unit, the second 3 × 3 convolutional layer is a downsampling convolution with a stride of 2, which halves the spatial size of the output feature map and doubles the number of channels. In contrast, no downsampling convolution is used in the ordinary residual unit. Each convolutional layer is followed by a batch normalization layer and a ReLU activation function. A “skip connection” is incorporated into the network propagation of each residual block, as depicted in Figure 5. The principle of the skip connection in residual blocks is described by Equation (1).
y = F ( x ) + x
where x denotes the input, y denotes the output, and F(x) represents the residual mapping to be learned.
The FPN adopts a top-down path for feature fusion, as illustrated in Figure 6. Specifically, high-level feature maps are gradually upsampled and fused with low-level feature maps—with channel dimensions aligned (via channel reduction) to integrate features across different layers. This fusion strategy enables the combination of high-level semantic information from deep layers with high-resolution detail information from shallow layers. Consequently, the FPN generates a series of multi-scale feature maps with varying resolutions, which are well-suited for detecting objects of different sizes while avoiding an excessive computational burden.
(2)
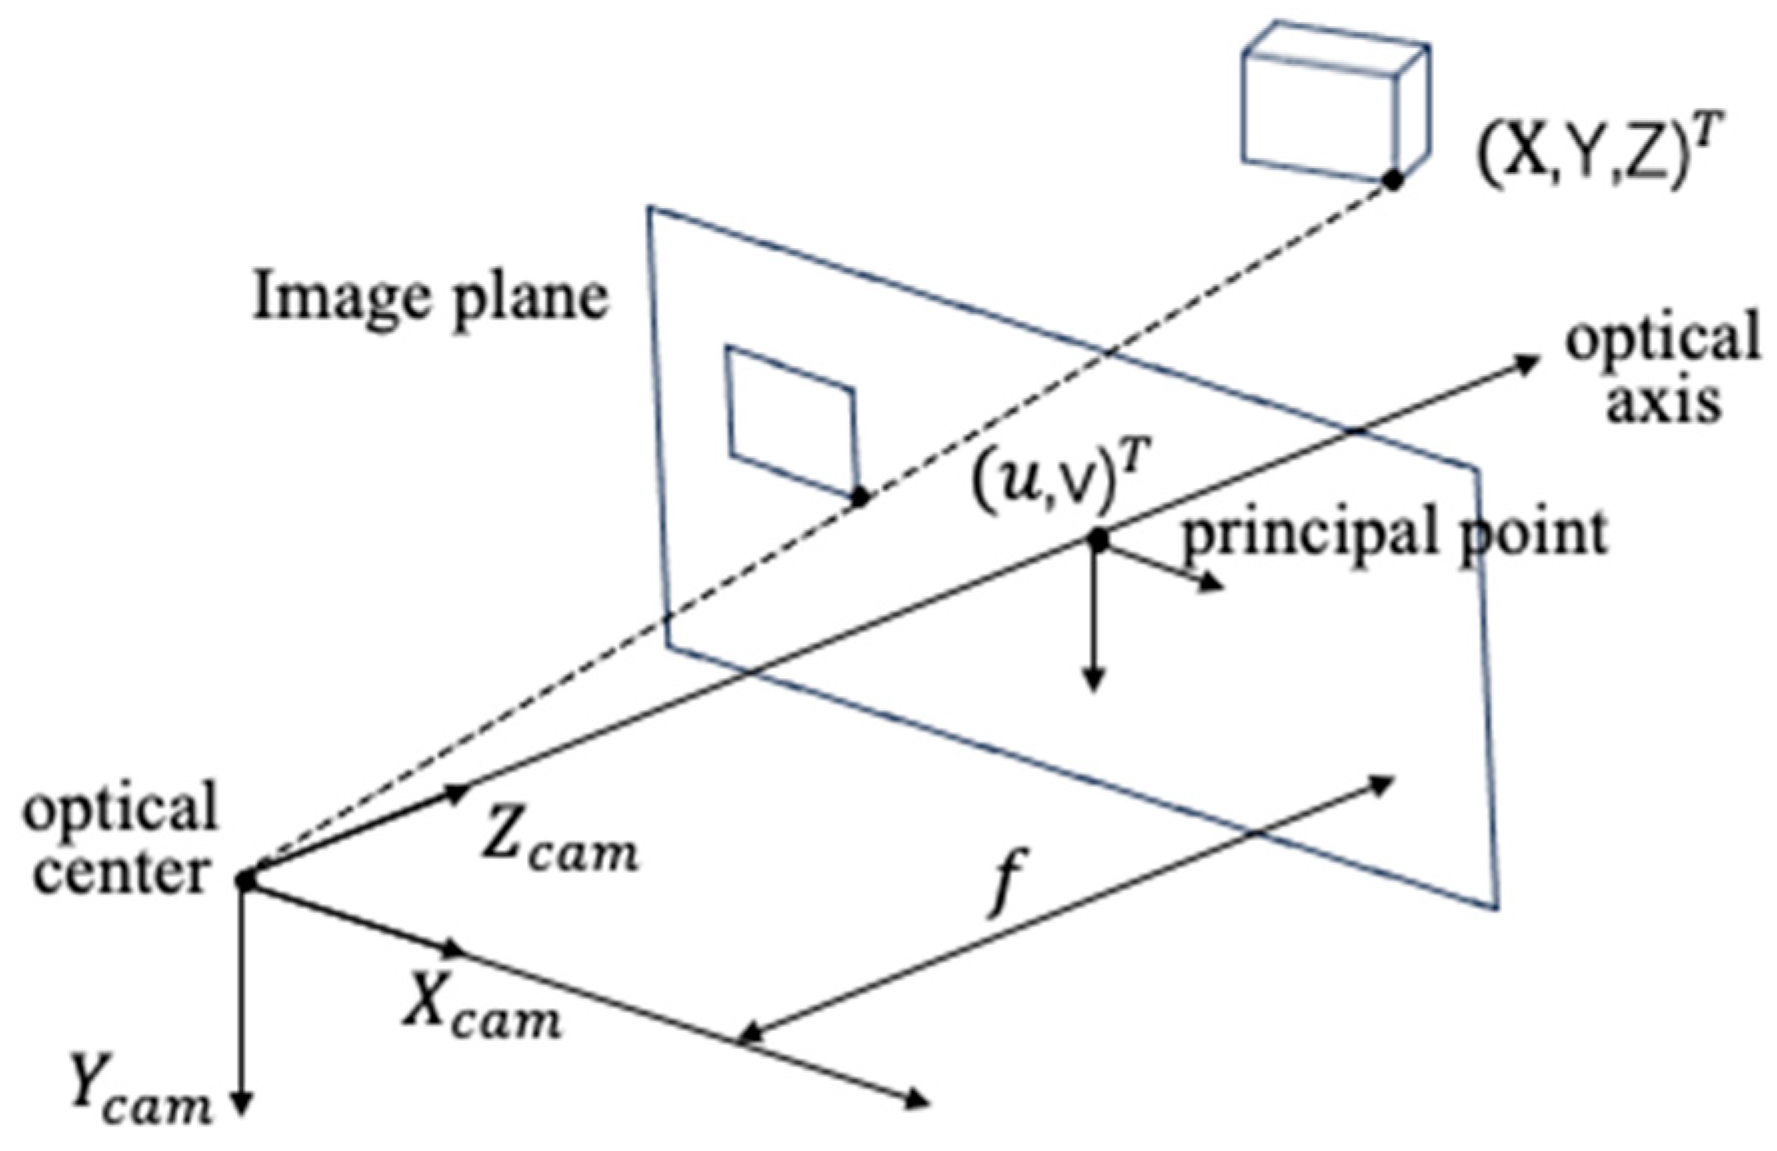
2D to 3D mapping. The size [D, H, W] of the above 2D feature extraction represents the number of anchor points distributed along the axes. We generate three-dimensional anchor points (xc, yc, zc) and restrict the range according to the field of view of the camera, as shown in Equation (2). The total number of point clouds given by N = D × H × W. Taking the camera optical center O as the origin, establish the camera coordinate system O-XYZ as shown in Figure 7.
X ( x min , x max ) , x min = 4 , x max = 4 ; Y ( y min , y max ) , y min = 1.8 , y max = 1.8 ; Z ( z min , z max ) , z min = 0.3 , z max = 6 ;
where xmin and xmax, ymin and ymax, zmin and zmax represent the length, width, and height of a room. In actual experiments, these dimensions must be modified to match the real-world measurements.
The schematic diagram is shown in Figure 8a. The 3D point clouds are projected back onto the camera plane using the intrinsic camera parameter matrix. This step aligns the 2D image features with the 3D point cloud to generate 3D feature maps, as illustrated in Figure 8b.
(3)
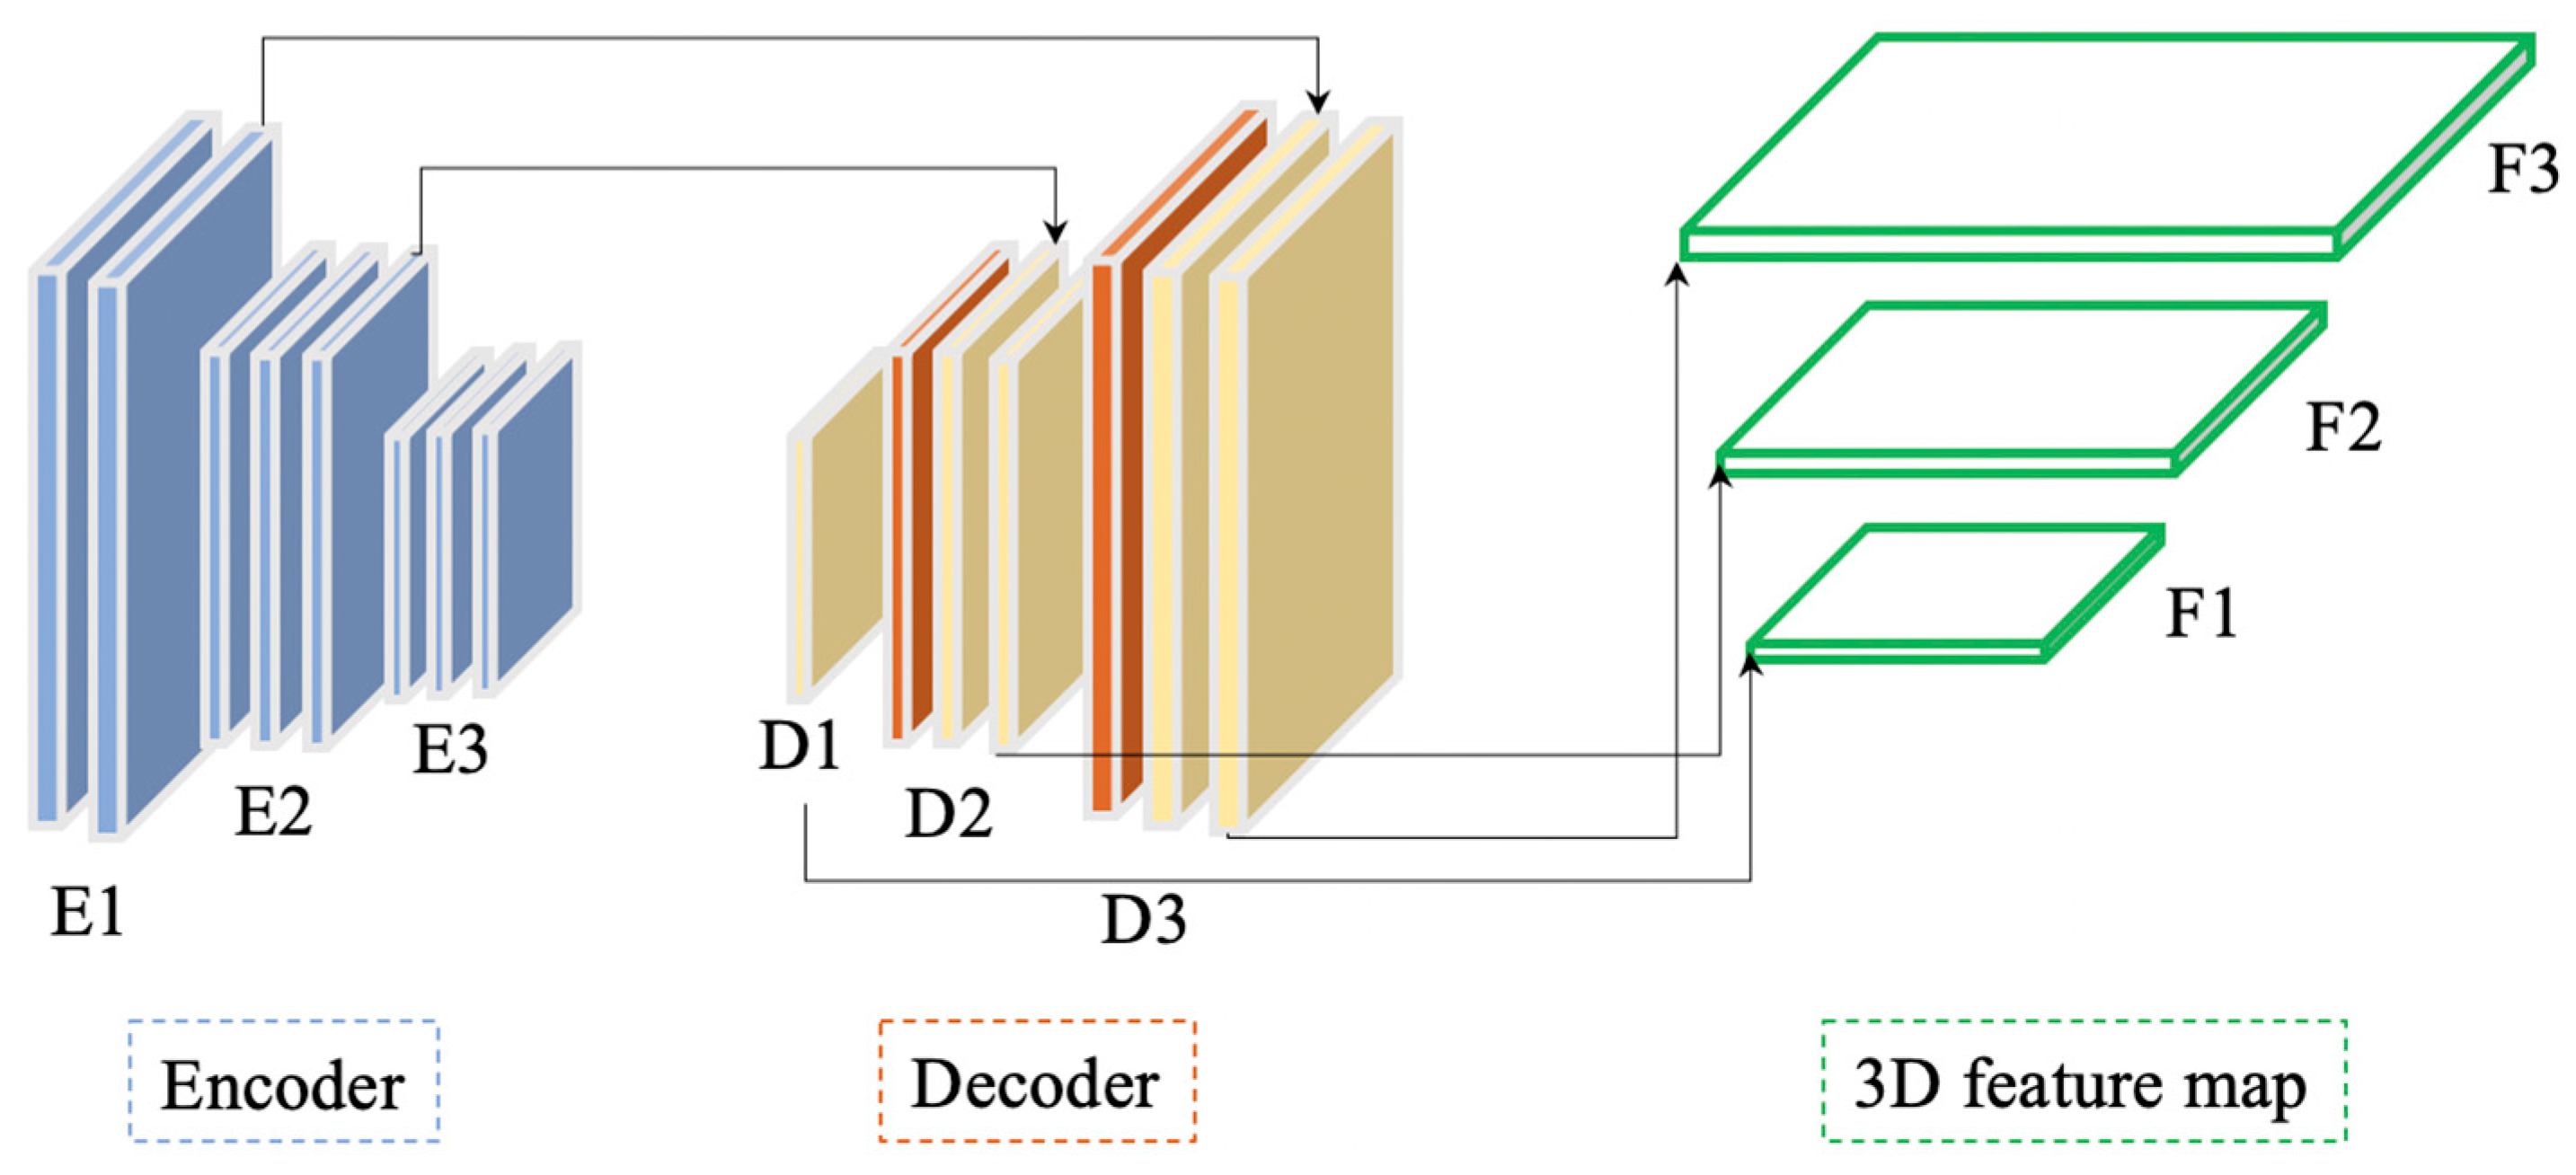
3D feature extraction. The 3D feature extraction model adopts an encoder–decoder structure. The schematic of the main network is shown in Figure 9. Three layers of 3D feature maps F1, F2, F3 can be obtained from different levels of the encoder–decoder. The encoder and decoder each consist of three modules. The encoder primarily uses a residual block based on standard 3D convolution. The decoder’s residual block utilizes both transposed 3D convolution and standard 3D convolution. To mitigate issues like gradient vanishing and explosion due to an increasing number of model layers, a skip connection operation is incorporated in the structure.
(4)
3D loss functions. The 3D object detection network takes 3D feature maps as input and predicts three prediction outcomes: object category, object center point, and object detection box. The main framework is depicted in Figure 10. These three parallel outputs are fed into the classification loss function FL, the center point loss function Lc, and the 3D detection box loss function Lbox [59]. The overall training loss is represented in Equation (3).
L = n ( α L c + F L + L b o x ) , α = 0.7
where n is the number of detection boxes, and α is a scalar.

3.3. Multi-Object Tracking

We utilize the KF method to achieve object tracking and address the issue of 3D detection box jitter. The KF assumes that the center of the 3D detection box follows a Gaussian distribution, and both the motion and observation models are linear. This method can be expressed through the following five Equations (4)–(8).
x ( t / t 1 ) = F x ( t 1 ) + G u ( t 1 )
P ( t / t 1 ) = F P ( t 1 ) F T + Q
K t = P ( t / t 1 ) H T ( H P t / t 1 H T + R ) 1
x t = x t / t 1 + K t ( z t + H x t / t 1 ) 1
P t = ( I K t H ) P t / t 1
Among them, x t and x t / t 1 represent the state estimation vector and the one-step prediction value of the state, respectively. F, G and H denote the state transition matrix, the control matrix and the observation matrix, respectively. u and z represent the control vector and the observation vector. Pt represents the state estimation covariance matrix. Q and R represent the system process noise covariance matrix and the observation noise covariance matrix, respectively. Kt represents the filter gain.
The algorithm process of our MOT is as follows: Firstly, we associate the information output from 3D object detection so it can be linked to the corresponding 3D detection box and category through center point coordinates. Secondly, we use the 3-dimensional state vector x (the center point coordinates of the 3D detection box) to perform Kalman filter, assuming uniform motion. Finally, update the 3D object detection results (category, center point, and 3D detection box).

3.4. Visual SLAM

We integrate the above 3D object detection and MOT modules with the ORB-SLAM2 [40] system to achieve 3D object semantic SLAM.
The algorithm process of our visual SLAM is as follows: Firstly, we extract 2D features from the input monocular RGB images, triangulate the world 3D point cloud, and calculate the camera pose. Secondly, we associate the 3D point cloud with the 3D object detection semantic information to obtain the 3D information of the object. Finally, nonlinear optimization is performed to build a 3D object map.
In this module, we focus on optimizing the data association of 3D point cloud and 3D object detection semantic information, as well as loop detection.
(1)
Data association: Based on each image frame, we map the 3D point cloud to the 2D image using the projection relationship. The data association is completed by checking whether a point on the 2D image falls within the boundaries of the 3D detection box.
(2)
Loop detection: Using the g2o graph optimization library, we add the center points of the 3D boxes and overlap volume constraints between adjacent frames to reduce ghosting and improve mapping accuracy.

4. Experimental Evaluation

4.1. Datasets

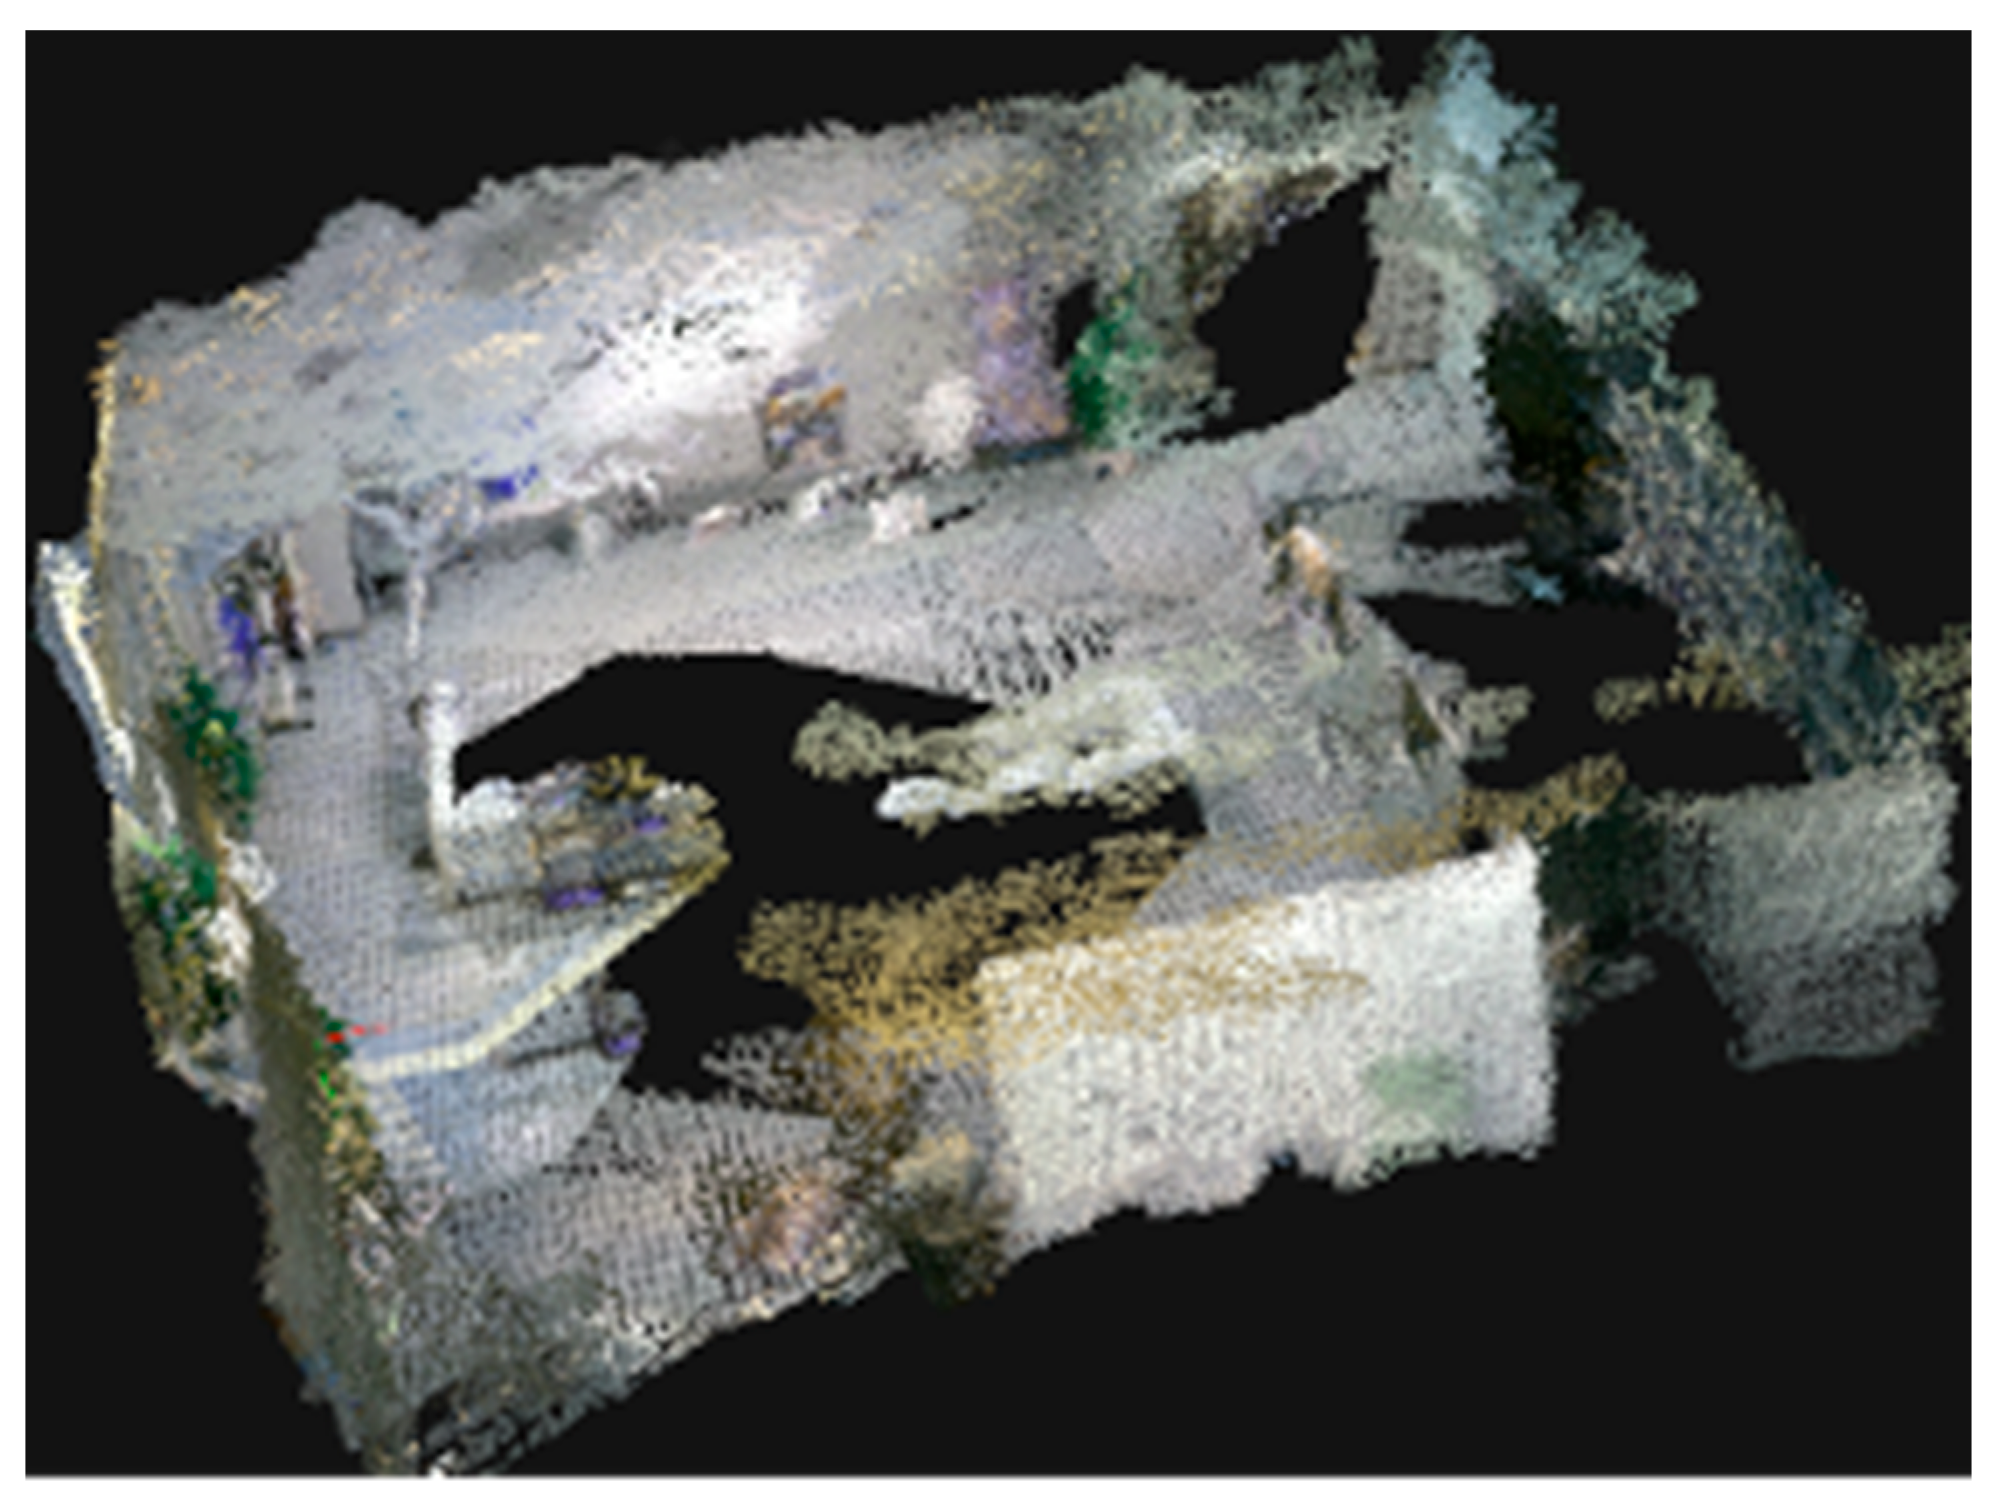
We conducted precise analysis and preprocessing on the public SUNGBD [56] datasets, performing training on datasets with 10, 12, and 14 category labels. Additionally, we recorded a dataset covering a 100-square-meter laboratory using an RGBD camera. We applied ORB-SLAM2 to achieve dense mapping of this space. Figure 11 illustrates the SLAM dense map of the selected area for comparison purposes.
The data in this study were collected in two laboratories with areas of 100 m2 and 20 m2, respectively. The data acquisition equipment included RGB cameras (intel RealSense D435) mounted on robots and XR glasses (PICO). During data collection, an “8-shaped” walking trajectory and a closed-loop walking trajectory were adopted to facilitate loop closure detection and pose correction. For data utilization, only RGB images were used; for the binocular XR glasses, either the left-eye or right-eye view was selected for mapping. This ensured that our input was exclusively RGB images—a key distinction from other methods that leverage depth images (e.g., ImVoxelNet) or laser point clouds (e.g., ImVoteNet). Notably, our 3D object semantic mapping task was particularly challenging, as it relied solely on a limited data source (i.e., monocular RGB images).

4.2. 3D Object Detection

(1)
Training. The training environment involves a GPU and PyTorch 2.0.0 over 12 rounds, using AdamW as the optimizer. The batch size during training is batchsize = 32. The images are resized to 640 × 480. And enhancement operations such as flipping and scaling are used to improve detection capabilities for difficult objects.
(2)
Results. We used the evaluation method of the SUNRGBD dataset to evaluate the accuracy of our algorithm. Table 1 and Table 2 show the AP and AR values corresponding to 3D IOU thresholds 0.25 and 0.5 for 12 and 14 objects in the SUNRGBD datasets, respectively. Notably, mAP@0.25 is 50.13 and 57.2, respectively. We also evaluated the average translation error (ATE) and average orientation error (AOE), as shown in Table 3.
Our method was compared with the other monocular indoor 3D object detection methods [50,51,60,61,62]. Table 4 shows that, while the previous algorithms achieved slight advantages on individual categories with simple structures, our algorithm demonstrated optimal performance, with the mean Average Precision (mAP) exceeding 19%. Table 5 compares our method with other point cloud-based 3D object detection methods [51,52,63,64]. Despite these comparisons favoring point cloud methods, our algorithm showed accuracy close to point cloud-based methods. In contrast to [51], our approach completes 3D object detection using only a monocular RGB camera, eliminating the need to generate point clouds. Our method performs better in the categories of desk, dresser, and night stand. Compared to [50], our algorithm performs well in the categories of bed, sofa, desk, dresser, night stand, sink, cabinet, and lamp, particularly in the bed category, where it achieves an AP@0.15 of up to 87.83%.
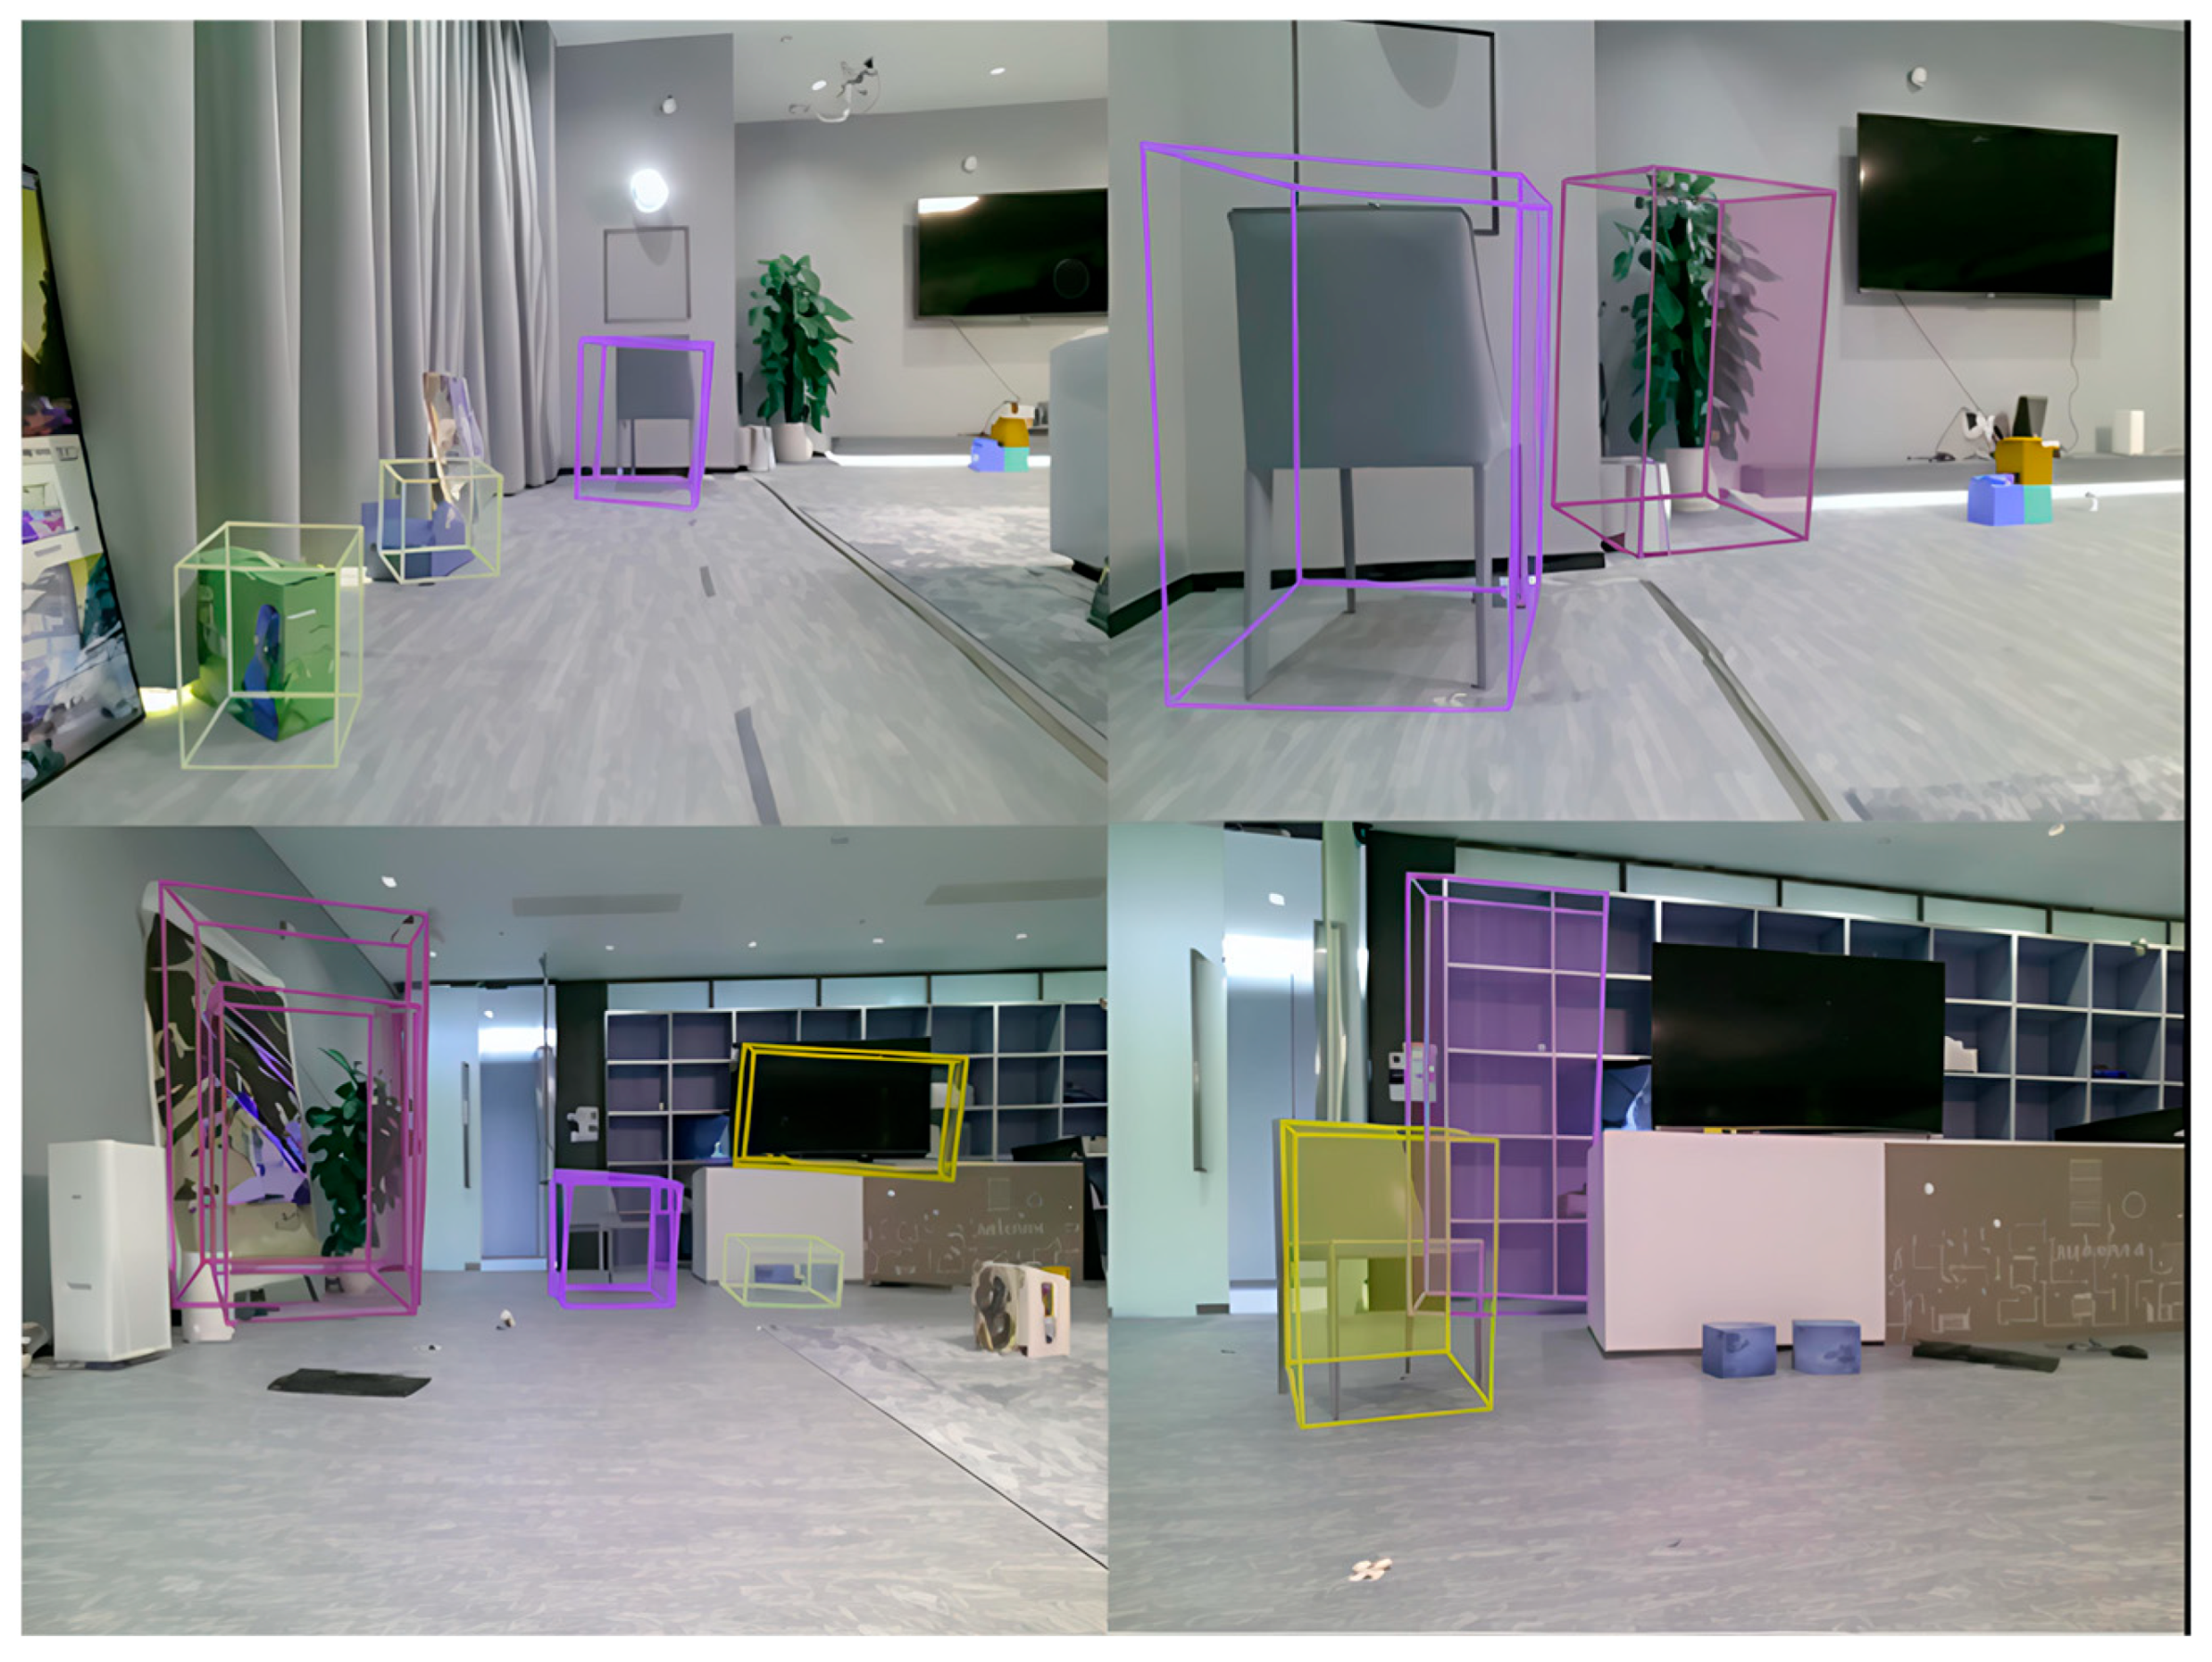
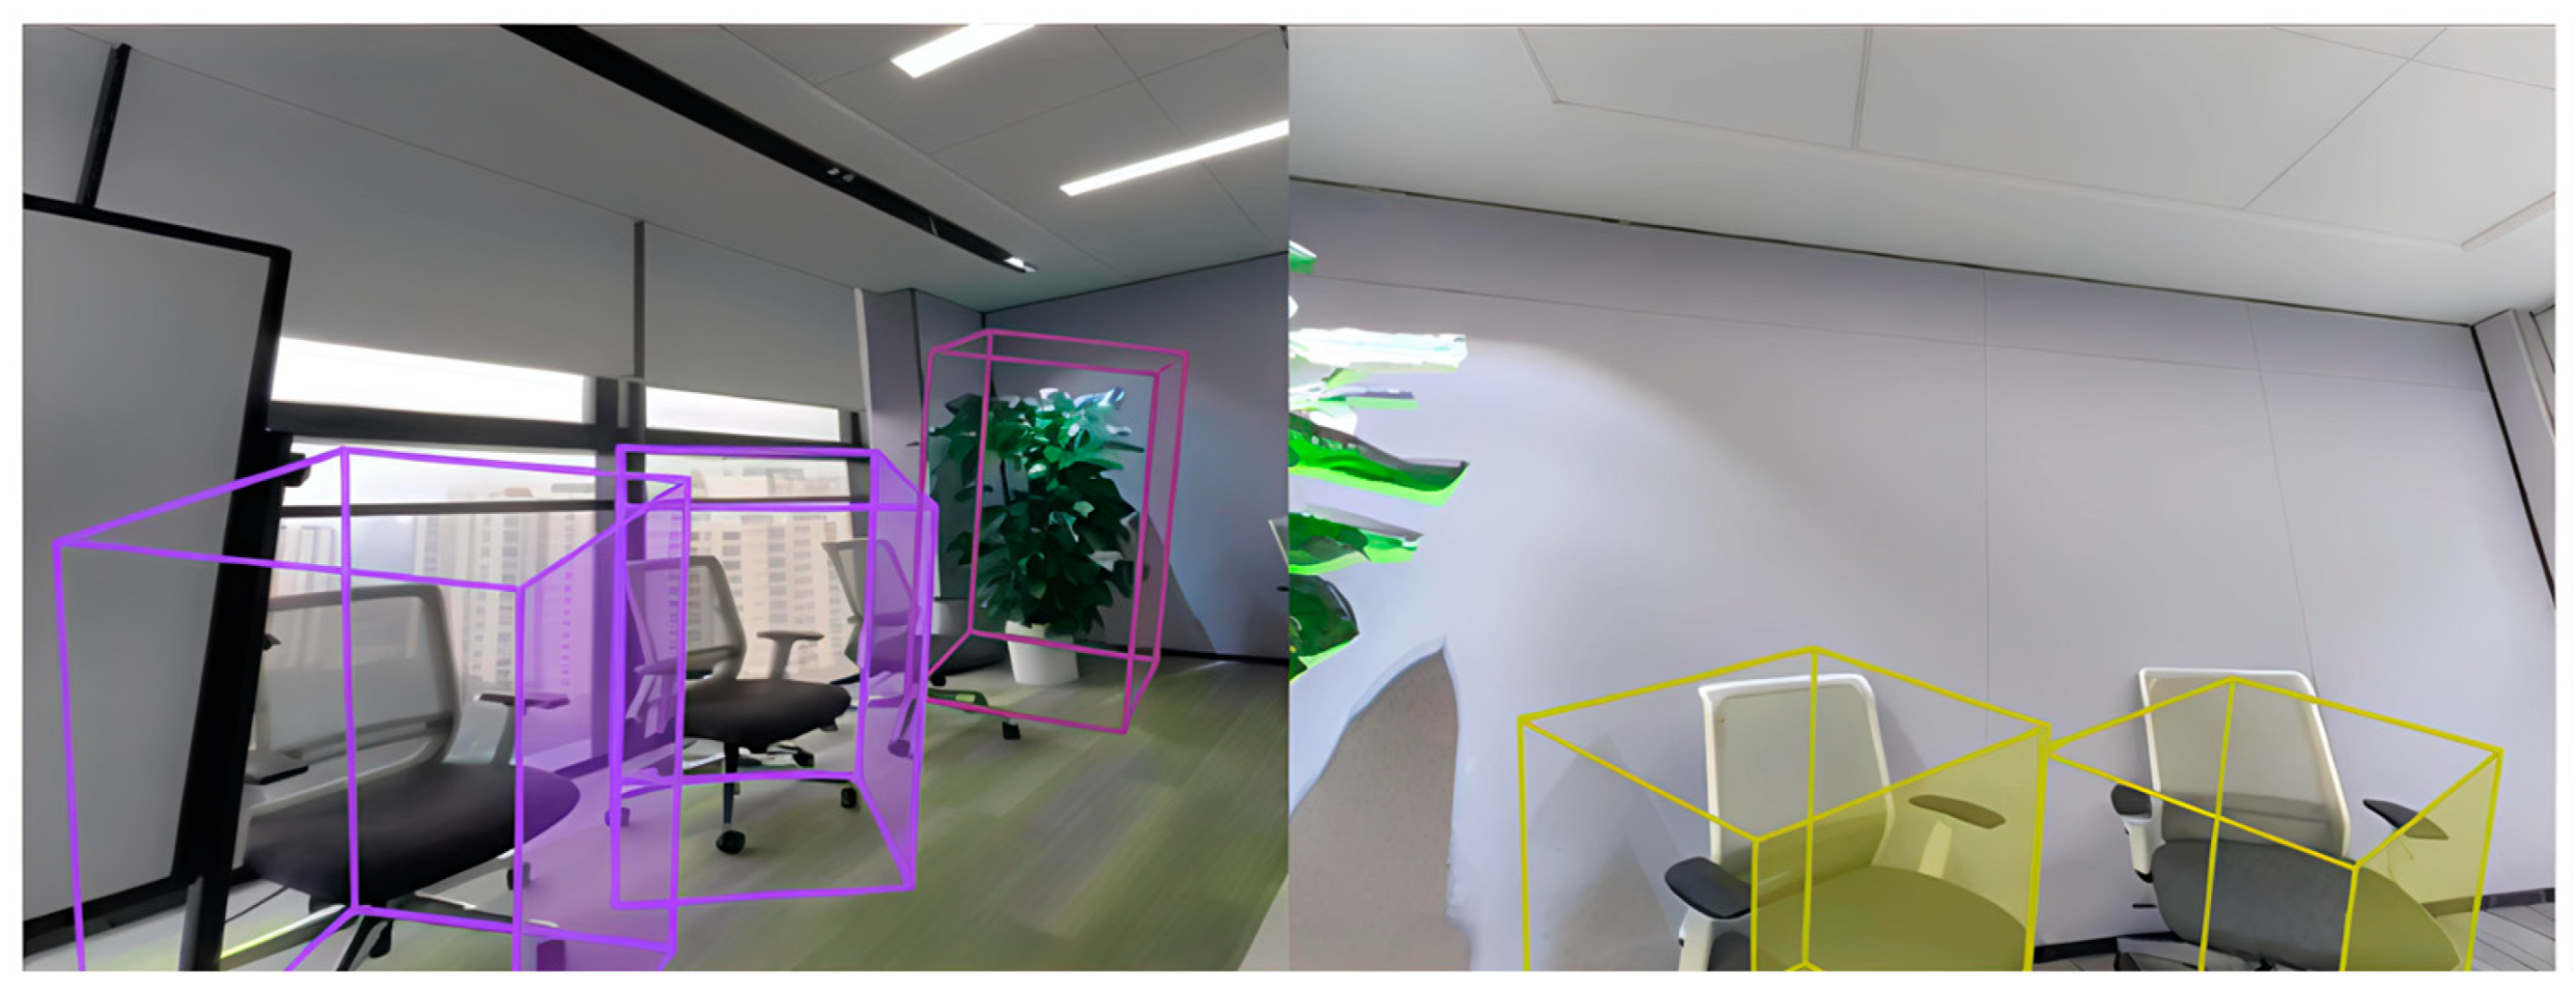
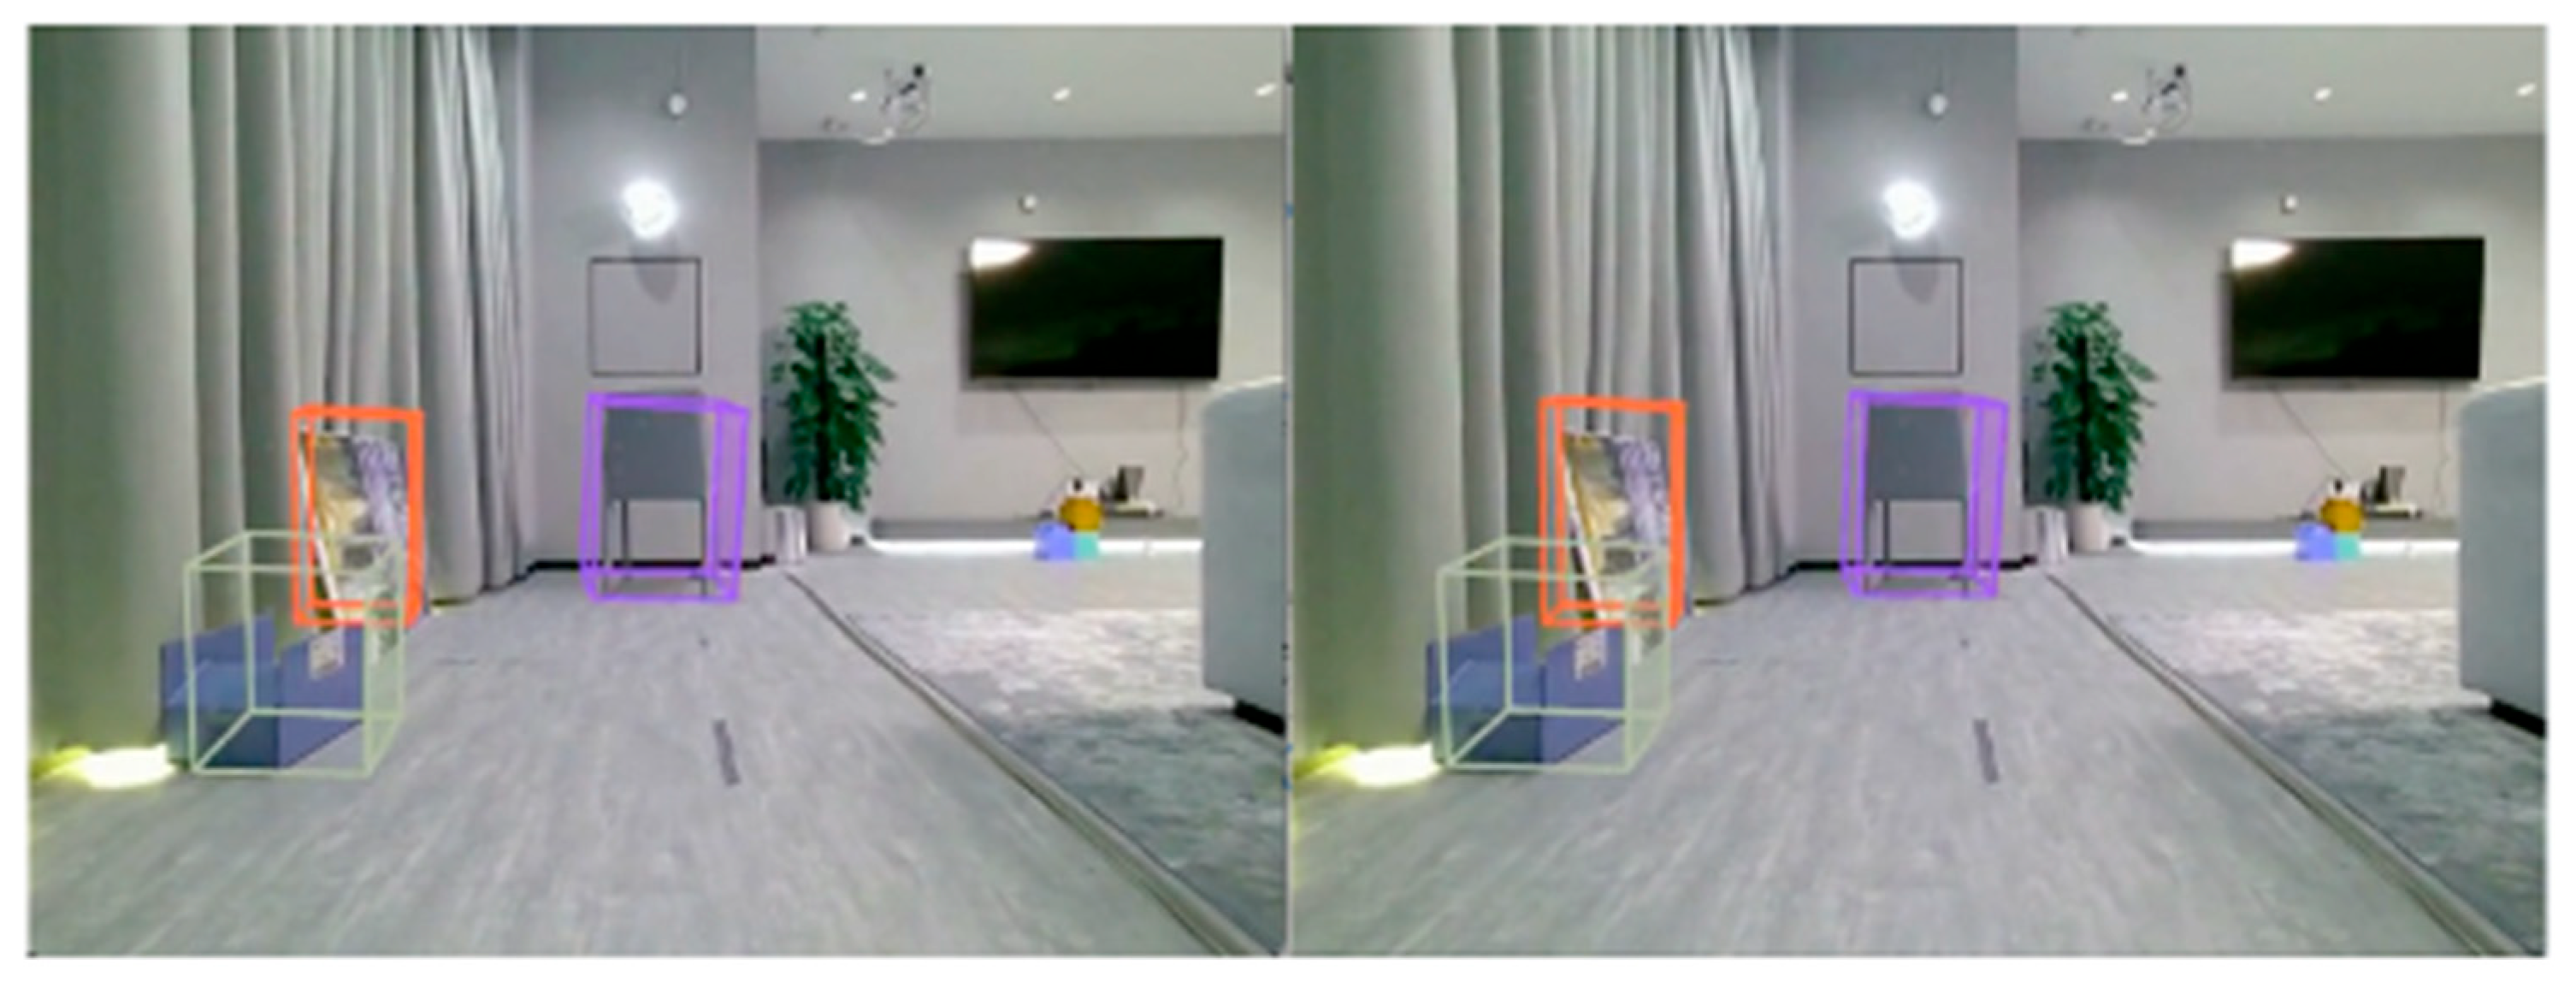
Figure 12 is our inference results on the SUNRGBD monocular datasets. Figure 13 is our inference result on the RGB monocular dataset collected by the mobile robot in the research laboratory. Note that the height of the collection equipment here is only 60 cm, but the height of the collection equipment of SUNRGBD datasets exceeds 1 m. Its lower height increases the inference Difficulty. Figure 14 is the inference result of the RGB monocular datasets we collected based on XR glasses in an office conference room. From the figure above, it is clear that the object is aligned with the 3D detection boxes.

4.3. MOT

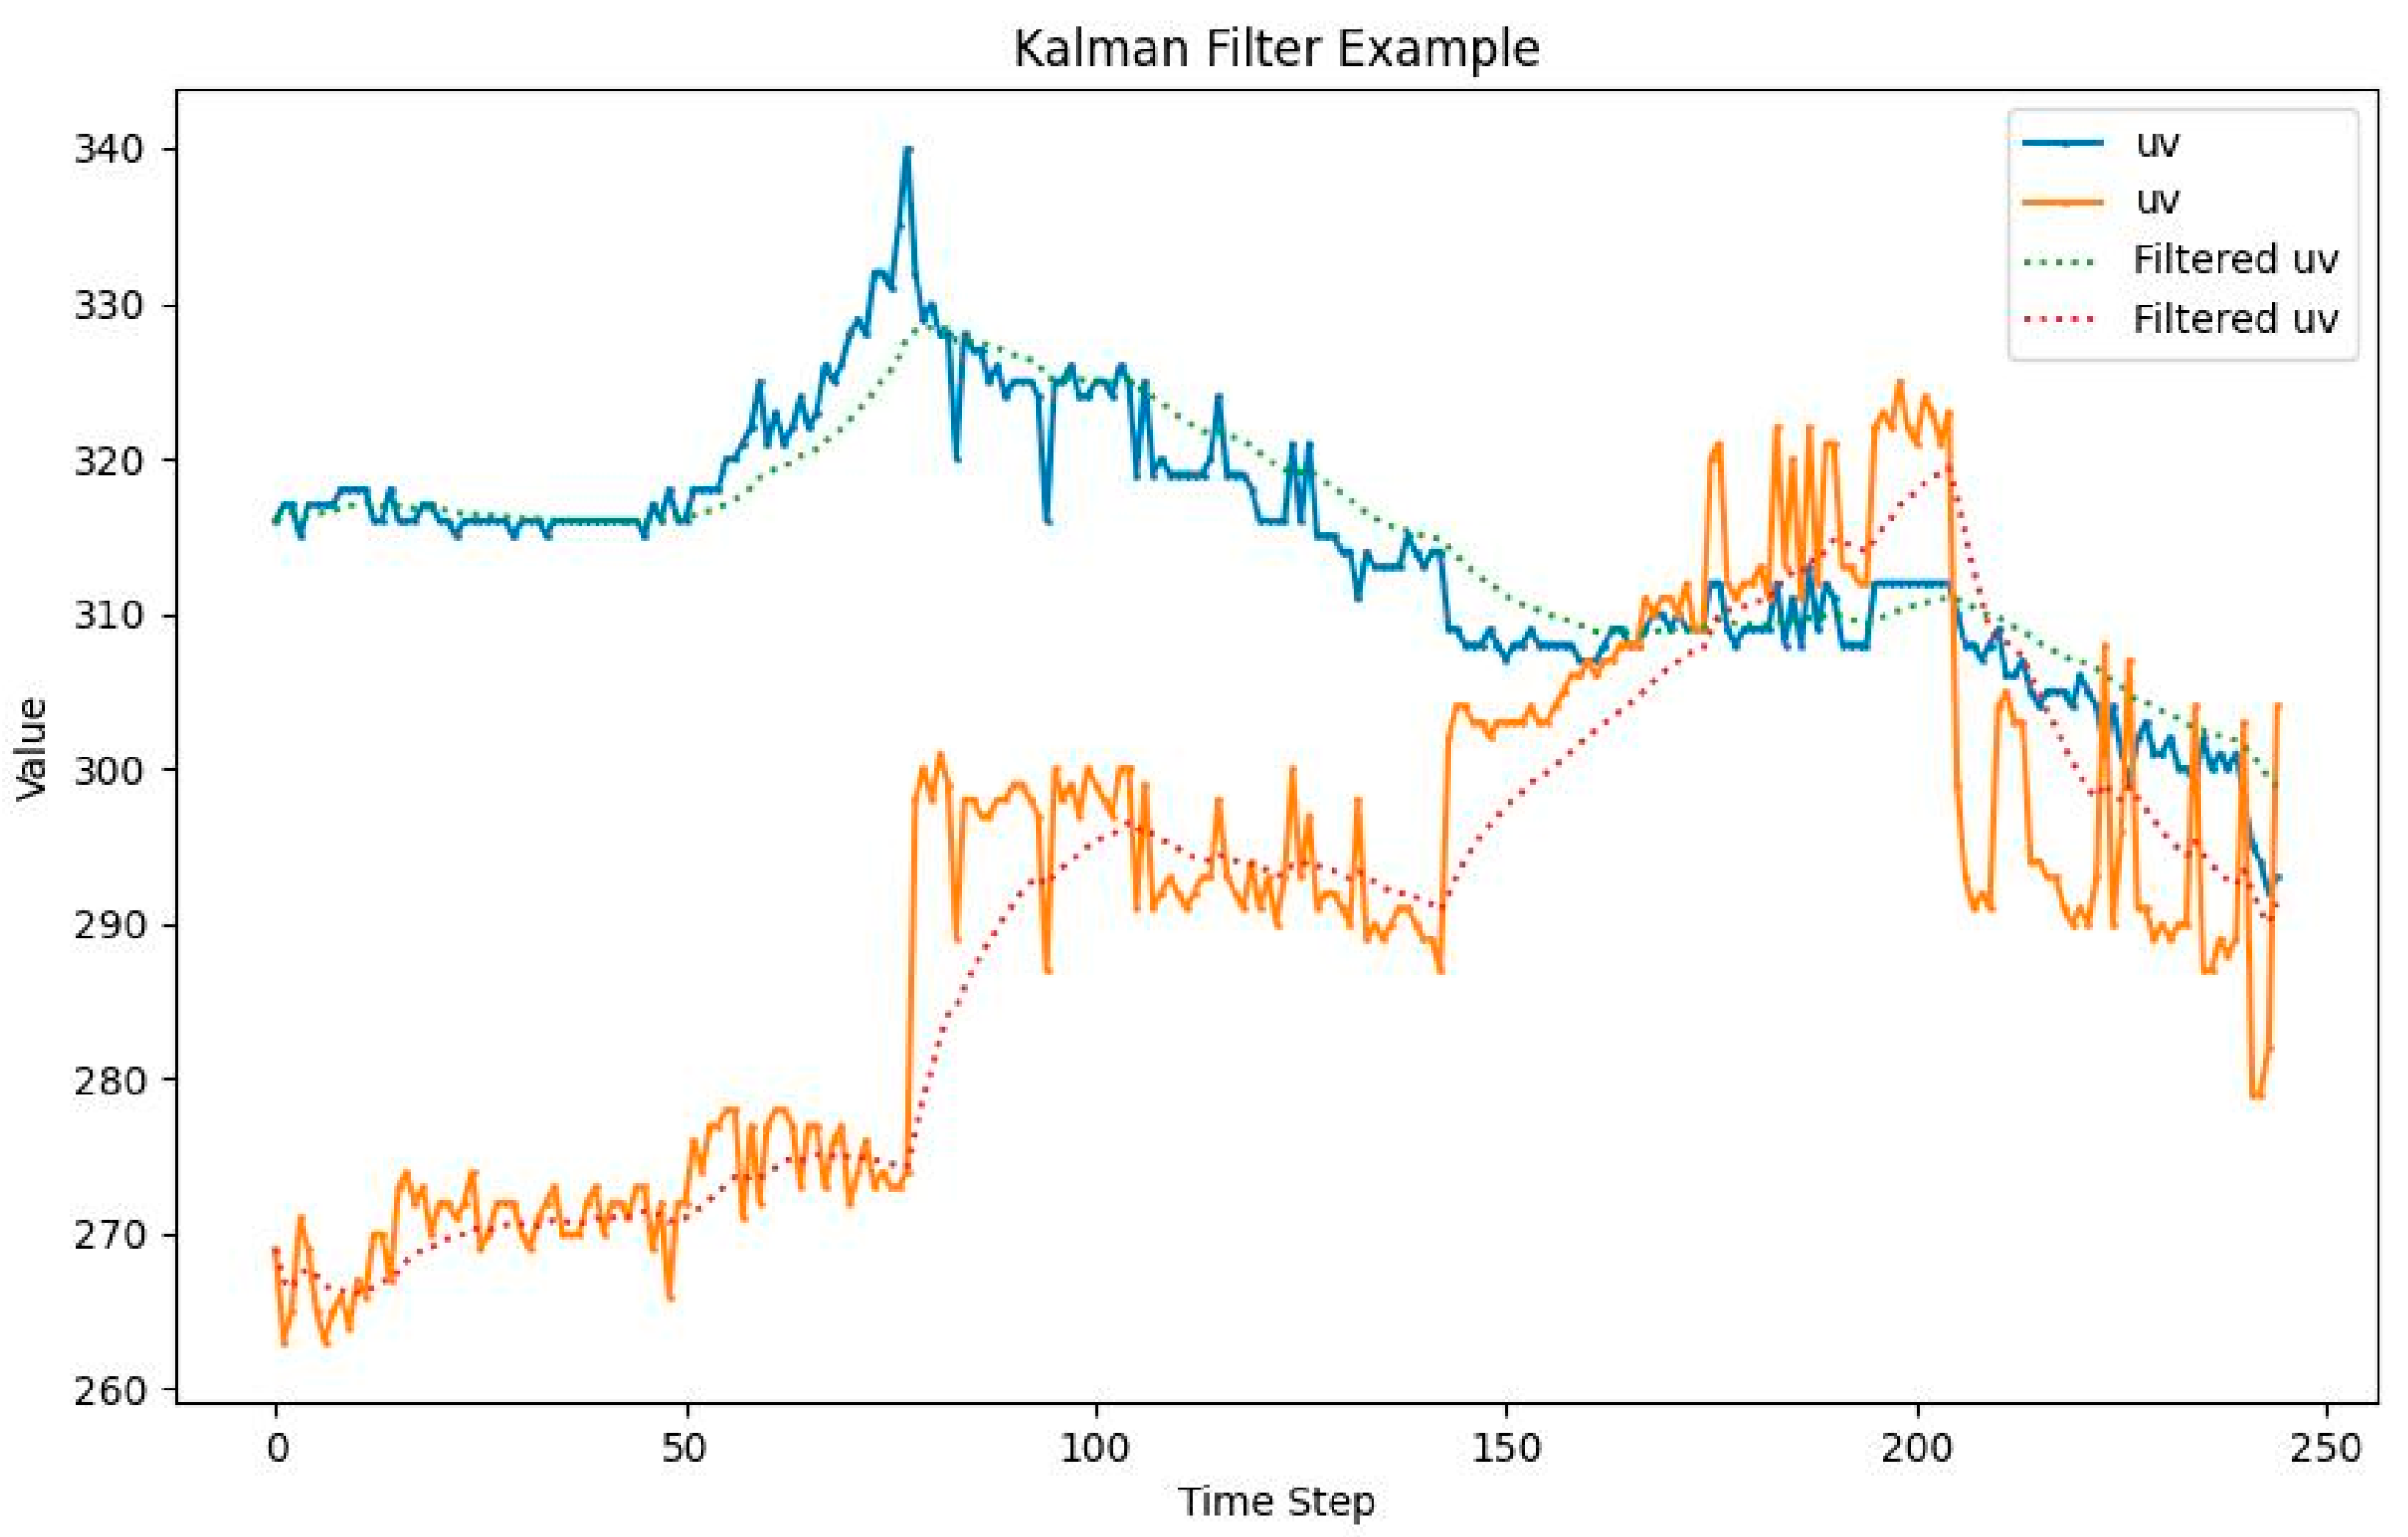
We introduce MOT to 3D object detection to address continuous image frame detection boxes’ jitter. Results on the RGB monocular datasets collected by the mobile robot in the research laboratory are shown in Figure 15. For easier observation, the filtered bottom center point motion curve is visualized in Figure 16. The blue solid line and orange solid line trajectories represent the projected pixel coordinates of the bottom center point of the 3D detection box in the 2D image. The dotted lines represent the filtered coordinates. The figure shows that, after MOT module, the jitter of the 3D detection boxes is significantly reduced, resulting in a smoother output.

4.4. Visual SLAM

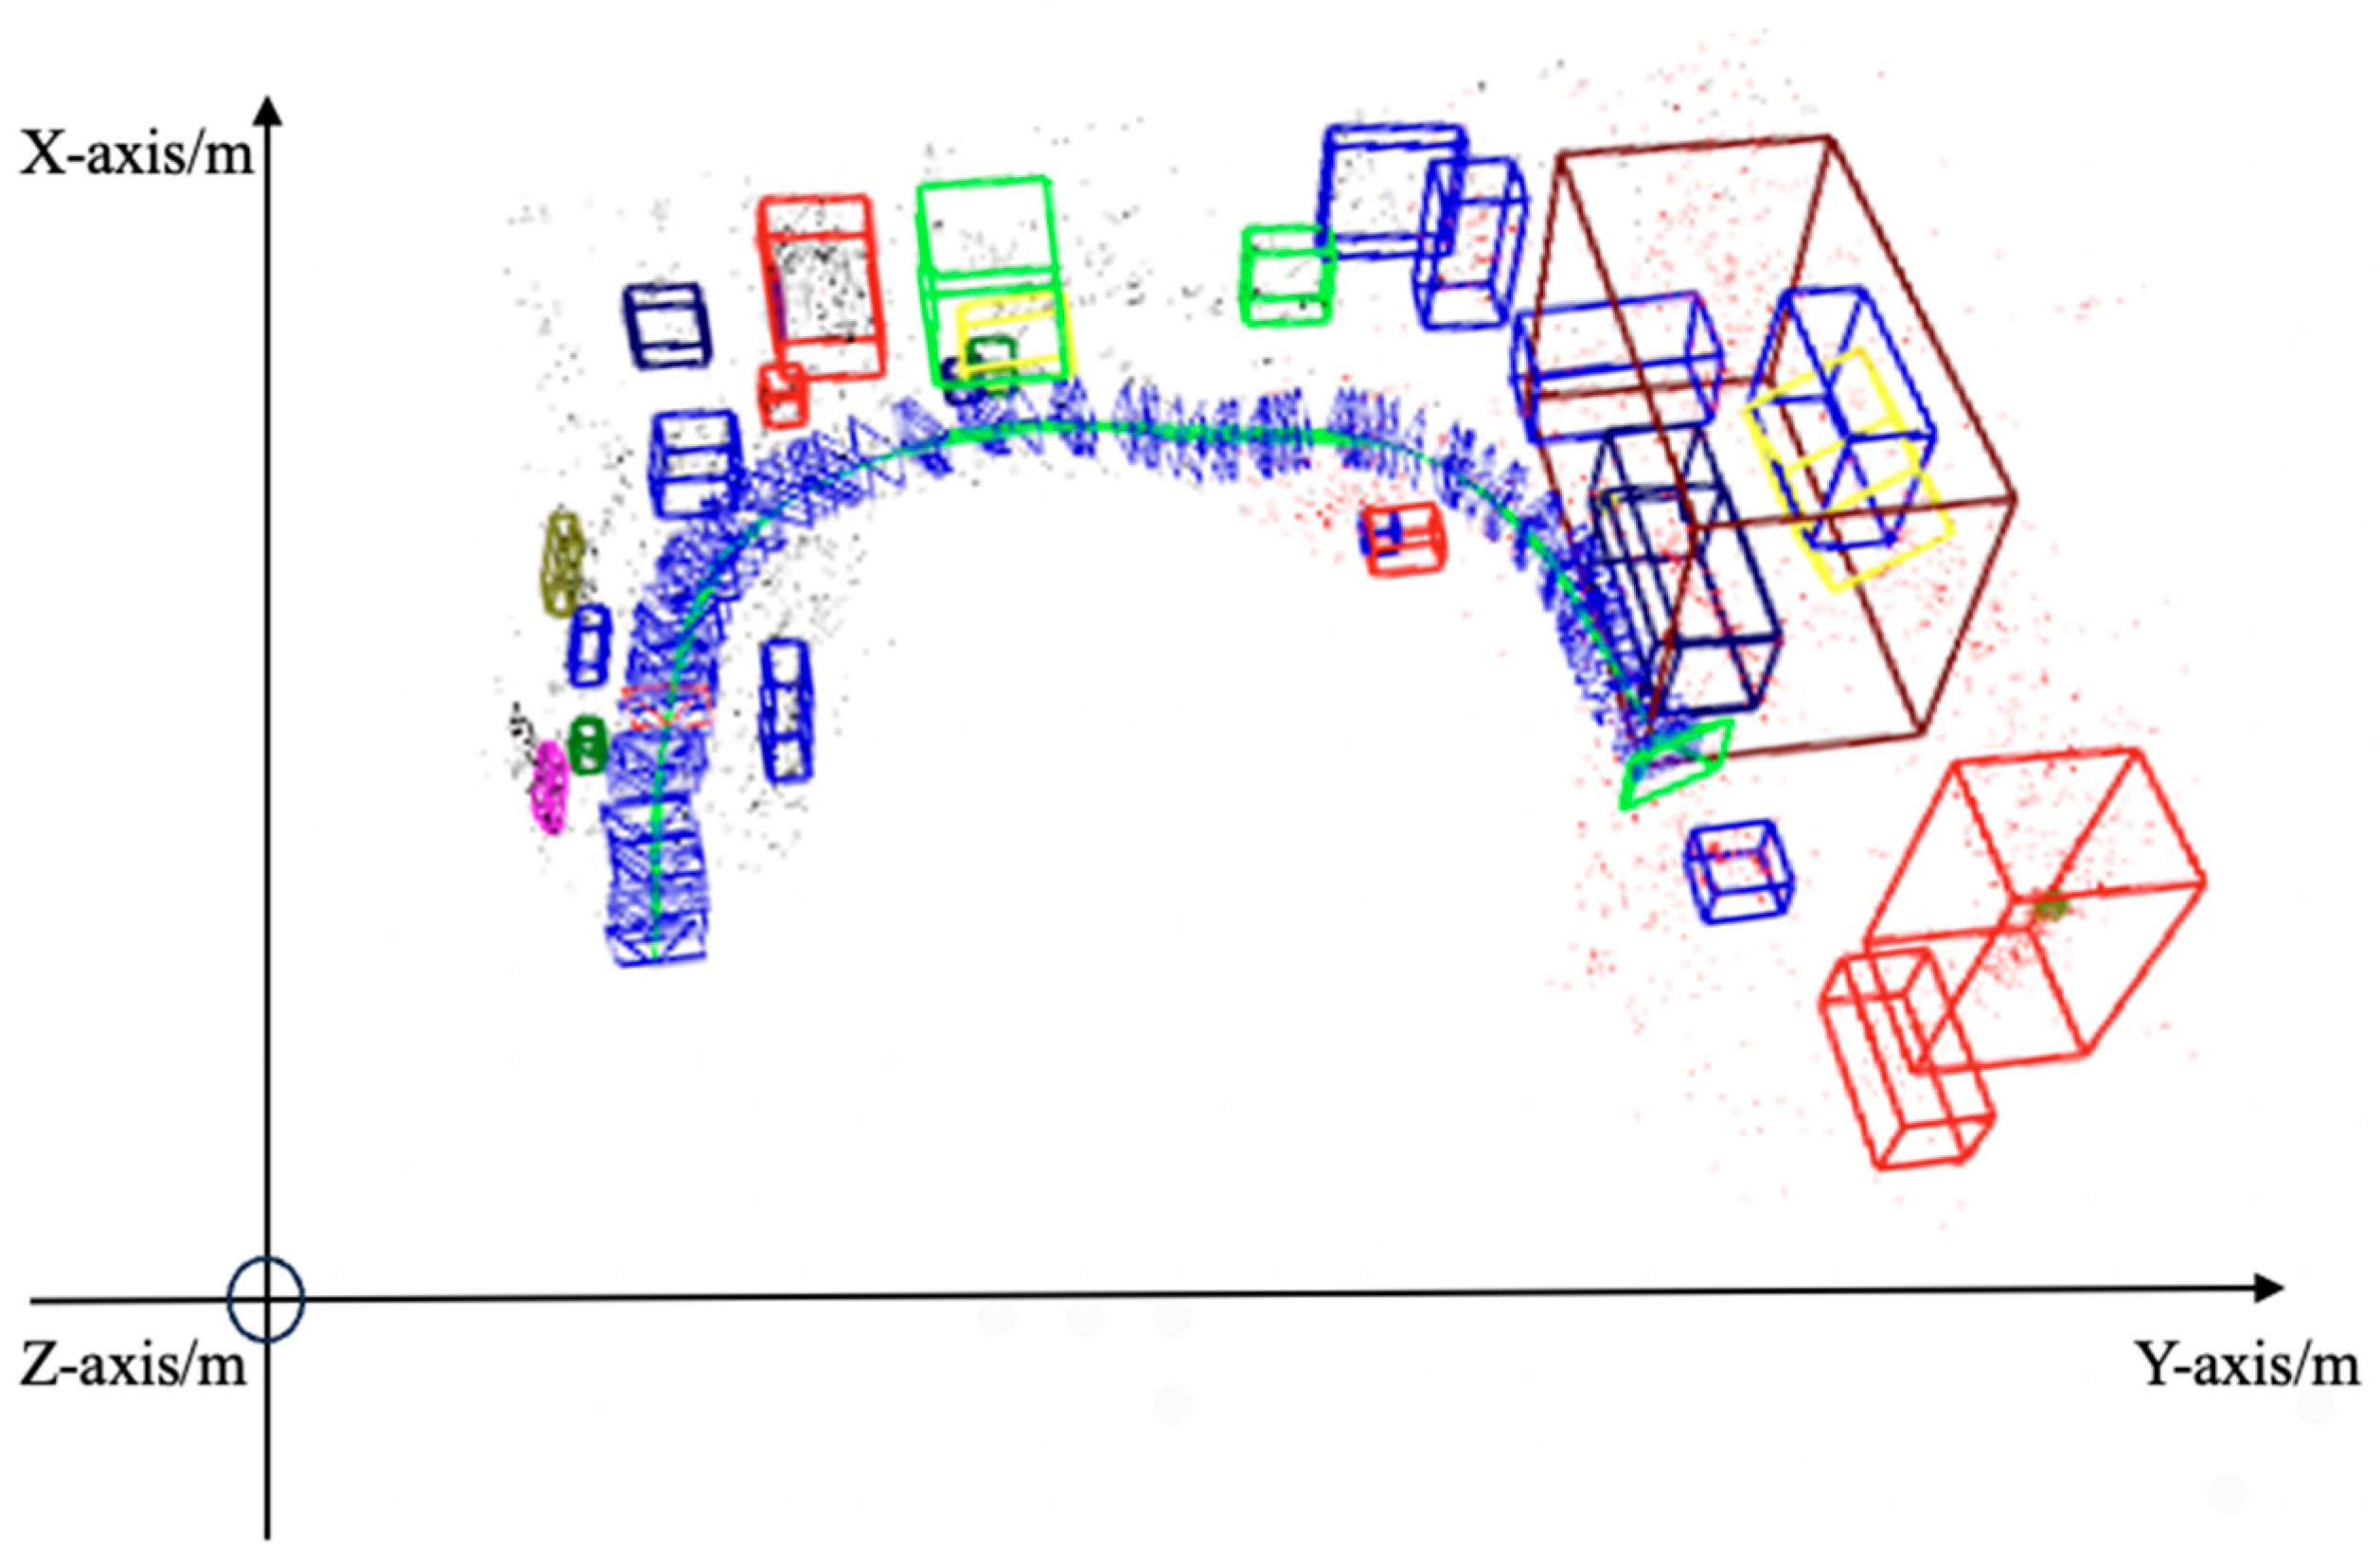
We integrate 3D object detection, MOT and ORB-SLAM2 to achieve 3D object semantic SLAM, with results shown in Figure 17. We found that, in the final global coordinate system, the original size and category attributes of the object are retained.

4.5. Experimental Summary

Our entire experiment demonstrates that our method exhibits excellent performance on both publicly available datasets captured by RGB-D cameras and our self-collected datasets. Given that our visual SLAM system incorporates 3D object detection and MOT sub-modules, we have enhanced the capabilities of each sub-module, thereby ensuring outstanding overall system performance.
3D object detection performance is comprehensively evaluated in Table 1, Table 2 and Table 3. We computed the mAP, mean Average Translation Error (mATE), and mean Average Orientation Error (mAOE) for various common categories on the public SUNRGBD dataset to validate the feasibility of our approach. As shown in Table 4, our method achieves a nearly 20% higher mAP compared to the most relevant work, ImVoxelNet. Although we slightly underperform in individual categories such as chair and table, our AP@0.15 value for the lamp category is approximately 53% higher. These results strongly demonstrate the effectiveness of our method. Furthermore, Table 5 indicates that, when using only RGB images as input, our mAP under the AP@0.25 metric surpasses that of ImVoxelNet by nearly 14%. Even when compared to ImVoteNet, which incorporates LiDAR point cloud data, our approach trails by only 9% in overall mAP while still outperforming it in four specific categories, further attesting to the robustness of our method.
The MOT performance is illustrated in Figure 15 and Figure 16. This module effectively reduces jitter across consecutive image frames and smooths motion trajectories, thereby mitigating abrupt movement artifacts.
Thanks to the enhancements introduced by these two modules, our proposed indoor 3D object-aware semantic visual SLAM framework exhibits significantly improved robustness and overall effectiveness.

5. Conclusions

In this paper, we propose a 3D object semantic SLAM system based on a monocular indoor scene, featuring categories including chair, bed, sofa, etc. We preprocess training datasets for uniform distribution, conduct 3D object detection training, introduce MOT to solve continuous frame detection box jitter, and integrate 3D object detection, MOT and SLAM systems to achieve 3D object semantic SLAM. Validation on various devices and challenging indoor scenarios shows our method achieves better detection accuracy than the baseline. In future work, we will focus on integrating low-cost sensors like IMU, GPS, etc., to expand applicability in complex indoor scenes. Current frameworks based on visual features (ORB) and deep learning detectors exhibit significant performance limitations under challenging conditions such as drastic lighting changes, dim environments, or overexposure. For instance, in poorly lit corridors, the number of ORB features extracted decreases substantially, which can easily cause SLAM tracking failures. Visual 3D detectors also exhibit higher false positive and false negative rates due to degraded image quality. Although MOT algorithms enhance robustness to some extent, they do not fundamentally resolve these issues. Furthermore, risks stem from the failure modes of individual submodules and their complex dependencies. Encountering categories or scenarios not covered in training data—such as missing visual features, rapid motion, severe occlusion, or high object density—can trigger errors like false positives, false negatives, tracking loss, or motion-object confusion, ultimately causing significant degradation in semantic map quality.
Therefore, in high-risk scenarios like service robotics or autonomous driving, any of the aforementioned errors could result in property damage or personal injury. Consequently, our system requires extremely rigorous validation and redundancy design before direct deployment in such environments. In medium-to-low-risk applications like XR gaming or interior design, the primary consequence of errors is diminished user experience rather than physical safety threats. In these domains, our approach may be closer to direct implementation.
In subsequent work, we will explore uncertainty estimation methods to quantify the confidence level for each semantic element in the map, enabling downstream tasks to make safer decisions based on confidence metrics. Concurrently, we will focus on integrating low-cost sensors such as IMU and GPS to expand the system’s applicability in complex indoor environments.

Author Contributions

Conceptualization, W.W. and R.W.; methodology, W.W.; software, W.W.; validation, W.W.; formal analysis, R.W.; investigation, W.W. and R.W.; resources, H.J.; data curation, W.W.; writing—original draft preparation, W.W.; writing—review and editing, W.W.; visualization, Y.D.; supervision, R.W. and Y.D.; project administration, Y.D.; funding acquisition, H.J. All authors have read and agreed to the published version of the manuscript.

Funding

This work was funded by the National Key R&D Program of China (2022YFB2803205).

Institutional Review Board Statement

Not applicable.

Informed Consent Statement

Not applicable.

Data Availability Statement

The original contributions presented in this study are included in the article. Further inquiries can be directed to the corresponding author.

Acknowledgments

We would like to extend our sincere gratitude towards Changchun University of Science and Technology, OPPO Artificial Intelligence Center, and the National Key R&D Program of China for their support.

Conflicts of Interest

Author Ruoxi Wu was employed by the company OPPO Artificial Intelligence Center. The remaining authors declare that the research was conducted in the absence of any commercial or financial relationships that could be construed as a potential conflict of interest.

References

  1. Wu, H.; Liu, Y.; Wang, C.; Wei, Y. An Effective 3D Instance Map Reconstruction Method Based on RGBD Images for Indoor Scene. Remote Sens. 2025, 17, 139. [Google Scholar] [CrossRef]
  2. Perfetti, L.; Fassi, F.; Vassena, G. Ant3D—A Fisheye Multi-Camera System to Survey Narrow Spaces. Sensors 2024, 24, 4177. [Google Scholar] [CrossRef] [PubMed]
  3. Bedkowski, J. Open Source, Open Hardware Hand-Held Mobile Mapping System for Large Scale Surveys. SoftwareX 2024, 25, 101618. [Google Scholar] [CrossRef]
  4. Gao, X.; Yang, R.; Chen, X.; Tan, J.; Liu, Y.; Wang, Z.; Tan, J.; Liu, H. A New Framework for Generating Indoor 3D Digital Models from Point Clouds. Remote Sens. 2024, 16, 3462. [Google Scholar] [CrossRef]
  5. Huang, Y.; Xie, F.; Zhao, J.; Gao, Z.; Chen, J.; Zhao, F.; Liu, X. ULG-SLAM: A Novel Unsupervised Learning and Geometric Feature-Based Visual SLAM Algorithm for Robot Localizability Estimation. Remote Sens. 2024, 16, 1968. [Google Scholar] [CrossRef]
  6. Cheng, S.; Sun, C.; Zhang, S.; Zhang, D. SG-SLAM: A Real-Time RGB-D Visual SLAM Toward Dynamic Scenes with Semantic and Geometric Information. IEEE Trans. Instrum. Meas. 2023, 72, 7501012. [Google Scholar] [CrossRef]
  7. Ji, T.; Wang, C.; Xie, L. Towards Real-time Semantic RGB-D SLAM in Dynamic Environments. In Proceedings of the 2021 IEEE International Conference on Robotics and Automation (ICRA), Xi’an, China, 30 May–5 June 2021; pp. 11175–11181. [Google Scholar]
  8. Hu, X. Multi-level map construction for dynamic scenes. arXiv 2023, arXiv:2308.04000. [Google Scholar] [CrossRef]
  9. Wang, T.; Zhu, X.; Pang, J.; Lin, D. Fcos3d: Fully convolutional one-stage monocular 3d object detection. In Proceedings of the IEEE/CVF International Conference on Computer Vision, Online, 11–17 October 2021; pp. 913–922. [Google Scholar]
  10. Tian, Z.; Shen, C.; Chen, H.; Chen, H. Fcos: Fully convolutional one-stage object detection. In Proceedings of the IEEE/CVF International Conference on Computer Vision, Seoul, Republic of Korea, 27 October–2 November 2019; pp. 9627–9636. [Google Scholar]
  11. Park, D.; Ambrus, R.; Guizilini, V.; Li, J.; Gaidon, A. Is pseudo-lidar needed for monocular 3d object detection? In Proceedings of the IEEE/CVF International Conference on Computer Vision, Online, 11–17 October 2021; pp. 3142–3152. [Google Scholar]
  12. Lin, T.Y.; Dollár, P.; Girshick, R.; He, K.; Hariharan, B.; Belongie, S. Feature pyramid networks for object detection. In Proceedings of the IEEE Conference on Computer Vision and Pattern Recognition, Honolulu, HI, USA, 21–26 July 2017; pp. 2117–2125. [Google Scholar]
  13. Philion, J.; Fidler, S. Lift, splat, shoot: Encoding images from arbitrary camera rigs by implicitly unprojecting to 3d. In Proceedings of the European Conference on Computer Vision, Glasgow, UK, 23–28 August 2020; Springer International Publishing: Cham, Switzerland, 2020; pp. 194–210. [Google Scholar]
  14. Reading, C.; Harakeh, A.; Chae, J.; Waslander, S.L. Categorical depth distribution network for monocular 3d object detection. In Proceedings of the IEEE/CVF Conference on Computer Vision and Pattern Recognition, Online, 19–25 June 2021; pp. 8555–8564. [Google Scholar]
  15. Huang, J.; Huang, G.; Zhu, Z.; Ye, Y.; Du, D. Bevdet: High-performance multi-camera 3d object detection in bird-eye-view. arXiv 2021, arXiv:2112.11790. [Google Scholar]
  16. Zhang, R.; Qiu, H.; Wang, T.; Guo, Z.; Cui, Z.; Qiao, Y.; Li, H.; Gao, P. MonoDETR: Depth-guided transformer for monocular 3D object detection. In Proceedings of the IEEE/CVF International Conference on Computer Vision, Paris, France, 2–6 October 2023; pp. 9155–9166. [Google Scholar]
  17. Yin, Z.; Wen, H.; Nie, W.; Zhou, M. Localization of Mobile Robots Based on Depth Camera. Remote Sens. 2023, 15, 4016. [Google Scholar] [CrossRef]
  18. Wang, T.; Lian, Q.; Zhu, C.; Zhu, X.; Zhang, W. Mv-fcos3d++: Multi-view camera-only 4d object detection with pretrained monocular backbones. arXiv 2022, arXiv:2207.12716. [Google Scholar]
  19. Yan, L.; Yan, P.; Xiong, S.; Xiang, X.; Tan, Y. Monocd: Monocular 3d object detection with complementary depths. In Proceedings of the IEEE/CVF Conference on Computer Vision and Pattern Recognition, Seattle, WA, USA, 17–21 June 2024; pp. 10248–10257. [Google Scholar]
  20. Li, Z.; Xu, X.; Lim, S.; Zhao, H. Unimode: Unified monocular 3d object detection. In Proceedings of the IEEE/CVF Conference on Computer Vision and Pattern Recognition, Seattle, WA, USA, 17–21 June 2024; pp. 16561–16570. [Google Scholar]
  21. Barreiros, M.O.; Dantas, D.O.; Silva, L.C.O.; Ribeiro, S.; Barros, A.K. Zebrafish tracking using YOLOv2 and Kalman filter. Sci. Rep. 2021, 11, 3219. [Google Scholar] [CrossRef] [PubMed]
  22. Jayawickrama, N.; Ojala, R.; Tammi, K. Using Scene-Flow to Improve Predictions of Road Users in Motion with Respect to an Ego-Vehicle. IET Intell. Transp. Syst. 2025, 19, e70010. [Google Scholar] [CrossRef]
  23. Guo, G.; Zhao, S. 3D multi-object tracking with adaptive cubature Kalman filter for autonomous driving. IEEE Trans. Intell. Veh. 2022, 8, 512–519. [Google Scholar] [CrossRef]
  24. Abdelkader, M.; Gabr, K.; Jarraya, I.; AlMusalami, A.; Koubaa, A. SMART-TRACK: A Novel Kalman Filter-Guided Sensor Fusion for Robust UAV Object Tracking in Dynamic Environments. IEEE Sens. J. 2025, 25, 3086–3097. [Google Scholar] [CrossRef]
  25. Pang, Z.; Li, J.; Tokmakov, P.; Chen, D.; Zagoruyko, S.; Wang, Y.-X. Standing between past and future: Spatio-temporal modeling for multi-camera 3d multi-object tracking. In Proceedings of the IEEE/CVF Conference on Computer Vision and Pattern Recognition, Nashville, TN, USA, 11–15 June 2023; pp. 17928–17938. [Google Scholar]
  26. Wang, Y.H. Smiletrack: Similarity learning for multiple object tracking. arXiv 2022, arXiv:2211.08824. [Google Scholar]
  27. Gu, J.; Wu, B.; Fan, L.; Huang, J.; Cao, S.; Xiang, Z.; Hua, X.S. Homography loss for monocular 3d object detection. In Proceedings of the IEEE/CVF Conference on Computer Vision and Pattern Recognition, New Orleans, LA, USA, 29–24 June 2022; pp. 1080–1089. [Google Scholar]
  28. Luo, X.; Liu, D.; Kong, H.; Huai, S.; Chen, H.; Xiong, G.; Liu, W. Efficient deep learning infrastructures for embedded computing systems: A comprehensive survey and future envision. ACM Trans. Embed. Comput. Syst. 2024, 24, 1–100. [Google Scholar] [CrossRef]
  29. Wu, J.; Wang, L.; Jin, Q.; Liu, F. Graft: Efficient Inference Serving for Hybrid Deep Learning with SLO Guarantees via DNN Re-Alignment. IEEE Trans. Parallel Distrib. Syst. 2024, 35, 280–296. [Google Scholar] [CrossRef]
  30. Tian, P.; Li, H. Visual SLAMMOT Considering Multiple Motion Models. arXiv 2024, arXiv:2411.19134. [Google Scholar] [CrossRef]
  31. Krishna, G.S.; Supriya, K.; Baidya, S. 3ds-slam: A 3d object detection based semantic slam towards dynamic indoor environments. arXiv 2023, arXiv:2310.06385. [Google Scholar] [CrossRef]
  32. Tufte, E.R.; Graves-Morris, P.R. The Visual Display of Quantitative Information; Graphics Press: Cheshire, CT, USA, 1983. [Google Scholar]
  33. Ware, C. Information Visualization: Perception for Design; Morgan Kaufmann: Burlington, MA, USA, 2019. [Google Scholar]
  34. Cui, L.; Ma, C. SOF-SLAM: A semantic visual SLAM for dynamic environments. IEEE Access 2019, 7, 166528–166539. [Google Scholar] [CrossRef]
  35. Cui, X.; Lu, C.; Wang, J. 3D semantic map construction using improved ORB-SLAM2 for mobile robot in edge computing environment. IEEE Access 2020, 8, 67179–67191. [Google Scholar] [CrossRef]
  36. Han, S.; Xi, Z. Dynamic scene semantics SLAM based on semantic segmentation. IEEE Access 2020, 8, 43563–43570. [Google Scholar] [CrossRef]
  37. Yuan, X.; Chen, S. Sad-slam: A visual slam based on semantic and depth information. In Proceedings of the 2020 IEEE/RSJ International Conference on Intelligent Robots and Systems (IROS), Las Vegas, NV, USA, 24 October 2020–24 January 2021; pp. 4930–4935. [Google Scholar]
  38. Qin, T.; Li, P.; Shen, S. Vins-mono: A robust and versatile monocular visual-inertial state estimator. IEEE Trans. Robot. 2018, 34, 1004–1020. [Google Scholar] [CrossRef]
  39. Mur-Artal, R.; Montiel, J.M.M.; Tardos, J.D. ORB-SLAM: A Versatile Accurate Monocular SLAM system. IEEE Trans. Robot. 2015, 31, 1147–1163. [Google Scholar] [CrossRef]
  40. Mur-Artal, R.; Tardós, J.D. Orb-slam2: An open-source slam system for monocular, stereo, and rgb-d cameras. IEEE Trans. Robot. 2017, 33, 1255–1262. [Google Scholar] [CrossRef]
  41. Campos, C.; Elvira, R.; Rodríguez, J.J.G.; Montiel, J.M.M.; Tardós, J.D. Orb-slam3: An accurate open-source library for visual, visual–inertial, and multimap slam. IEEE Trans. Robot. 2021, 37, 1874–1890. [Google Scholar] [CrossRef]
  42. Engel, J.; Schöps, T.; Cremers, D. LSD-SLAM: Large-scale direct monocular SLAM. In Proceedings of the European Conference on Computer Vision, Zurich, Switzerland, 6–12 September 2014; Springer International Publishing: Cham, Switzerland, 2014; pp. 834–849. [Google Scholar]
  43. Zhang, J.; Henein, M.; Mahony, R.; Ila, V. VDO-SLAM: A visual dynamic object-aware SLAM system. arXiv 2020, arXiv:2005.11052. [Google Scholar]
  44. Tateno, K.; Tombari, F.; Laina, I.; Navab, N. Cnn-slam: Real-time dense monocular slam with learned depth prediction. In Proceedings of the IEEE Conference on Computer Vision and Pattern Recognition, Honolulu, HI, USA, 21–26 July 2017; pp. 6243–6252. [Google Scholar]
  45. Li, X.; Belaroussi, R. Semi-dense 3d semantic mapping from monocular slam. arXiv 2016, arXiv:1611.04144. [Google Scholar] [CrossRef]
  46. Ran, Y.; Xu, X.; Luo, M.; Yang, J.; Chen, Z. Scene Classification Method Based on Multi-Scale Convolutional Neural Network with Long Short-Term Memory and Whale Optimization Algorithm. Remote Sens. 2024, 16, 174. [Google Scholar] [CrossRef]
  47. Bowman, S.L.; Atanasov, N.; Daniilidis, K.; Pappas, G.J. Probabilistic data association for semantic slam. In Proceedings of the 2017 IEEE International Conference on Robotics and Automation (ICRA), Singapore, 29 May–3 June 2017; pp. 1722–1729. [Google Scholar]
  48. Lianos, K.N.; Schonberger, J.L.; Pollefeys, M.; Sattler, T. Vso: Visual semantic odometry. In Proceedings of the European Conference on Computer Vision (ECCV), Munich, Germany, 8–14 September 2018; pp. 234–250. [Google Scholar]
  49. Civera, J.; Gálvez-López, D.; Riazuelo, L.; Tardos, J.D.; Montiel, J.M.M. Towards semantic SLAM using a monocular camera. In Proceedings of the 2011 IEEE/RSJ International Conference on Intelligent Robots and Systems, San Francisco, CA, USA, 25–30 September 2011; pp. 1277–1284. [Google Scholar]
  50. Rukhovich, D.; Vorontsova, A.; Konushin, A. Imvoxelnet: Image to voxels projection for monocular and multi-view general-purpose 3d object detection. In Proceedings of the IEEE/CVF Winter Conference on Applications of Computer Vision, Waikoloa, HI, USA, 4–8 January 2022; pp. 2397–2406. [Google Scholar]
  51. Qi, C.R.; Chen, X.; Litany, O.; Guibas, L.J. Imvotenet: Boosting 3d object detection in point clouds with image votes. In Proceedings of the IEEE/CVF Conference on Computer Vision and Pattern Recognition, Online, 14–19 June 2020; pp. 4404–4413. [Google Scholar]
  52. Ding, Z.; Han, X.; Niethammer, M. Votenet: A deep learning label fusion method for multi-atlas segmentation. In Proceedings of the International Conference on Medical Image Computing and Computer-Assisted Intervention, Shenzhen, China, 13–17 October 2019; Springer International Publishing: Cham, Switzerland, 2019; pp. 202–210. [Google Scholar]
  53. Wan, L.; Liu, Y.; Pi, Y. Comparing of target-tracking performances of EKF, UKF and PF. Radar Sci. Technol. 2007, 5, 13–16. [Google Scholar]
  54. Gupta, S.D.; Yu, J.Y.; Mallick, M.; Coates, M.; Morelande, M. Comparison of angle-only filtering algorithms in 3D using EKF, UKF, PF, PFF, and ensemble KF. In Proceedings of the 2015 18th International Conference on Information Fusion (Fusion), Washington, DC, USA, 6–9 July 2015; pp. 1649–1656. [Google Scholar]
  55. Weng, X.; Wang, J.; Held, D.; Kitani, K. Ab3dmot: A baseline for 3d multi-object tracking and new evaluation metrics. arXiv 2020, arXiv:2008.08063. [Google Scholar]
  56. Song, S.; Lichtenberg, S.P.; Xiao, J. Sun rgb-d: A rgb-d scene understanding benchmark suite. In Proceedings of the IEEE Conference on Computer Vision and Pattern Recognition, Boston, MA, USA, 8–10 June 2015; pp. 567–576. [Google Scholar]
  57. Wang, Y.; Ye, T.Q.; Cao, L.; Huang, W.; Sun, F.; He, F.; Tao, D. Bridged transformer for vision and point cloud 3d object detection. In Proceedings of the IEEE/CVF Conference on Computer Vision and Pattern Recognition, New Orleans, LA, USA, 19–24 June 2022; pp. 12114–12123. [Google Scholar]
  58. He, K.; Zhang, X.; Ren, S.; Sun, J. Deep residual learning for image recognition. In Proceedings of the IEEE Conference on Computer Vision and Pattern Recognition, Las Vegas, NV, USA, 26 June–1 July 2016; pp. 770–778. [Google Scholar]
  59. Redmon, J.; Divvala, S.; Girshick, R.; Farhadi, A. You only look once: Unified, real-time object detection. In Proceedings of the IEEE Conference on Computer Vision and Pattern Recognition, Las Vegas, NV, USA, 26 June–1 July 2016; pp. 779–788. [Google Scholar]
  60. Huang, S.; Qi, S.; Zhu, Y.; Xiao, Y.; Xu, Y.; Zhu, S.C. Holistic 3d scene parsing and reconstruction from a single rgb image. In Proceedings of the European Conference on Computer Vision (ECCV), Munich, Germany, 8–14 September 2018; pp. 187–203. [Google Scholar]
  61. Huang, S.; Qi, S.; Xiao, Y.; Zhu, Y.; Wu, Y.N.; Zhu, S.-C. Cooperative holistic scene understanding: Unifying 3d object, layout, and camera pose estimation. Adv. Neural Inf. Process. Syst. 2018, 31, 206–217. [Google Scholar]
  62. Nie, Y.; Han, X.; Guo, S.; Zheng, Y.; Zhang, J.J. Total3dunderstanding: Joint layout, object pose and mesh reconstruction for indoor scenes from a single image. In Proceedings of the IEEE/CVF Conference on Computer Vision and Pattern Recognition, Online, 14–19 June 2020; pp. 55–64. [Google Scholar]
  63. Qi, C.R.; Liu, W.; Wu, C.; Su, H.; Guibas, L.J. Frustum pointnets for 3d object detection from rgb-d data. In Proceedings of the IEEE Conference on Computer Vision and Pattern Recognition, Salt Lake City, UT, USA, 18–22 June 2018; pp. 918–927. [Google Scholar]
  64. Zhang, Z.; Sun, B.; Yang, H.; Huang, Q. H3dnet: 3d object detection using hybrid geometric primitives. In Proceedings of the European Conference on Computer Vision, Glasgow, UK, 23–28 August 2020; Springer International Publishing: Cham, Switzerland, 2020; pp. 311–329. [Google Scholar]
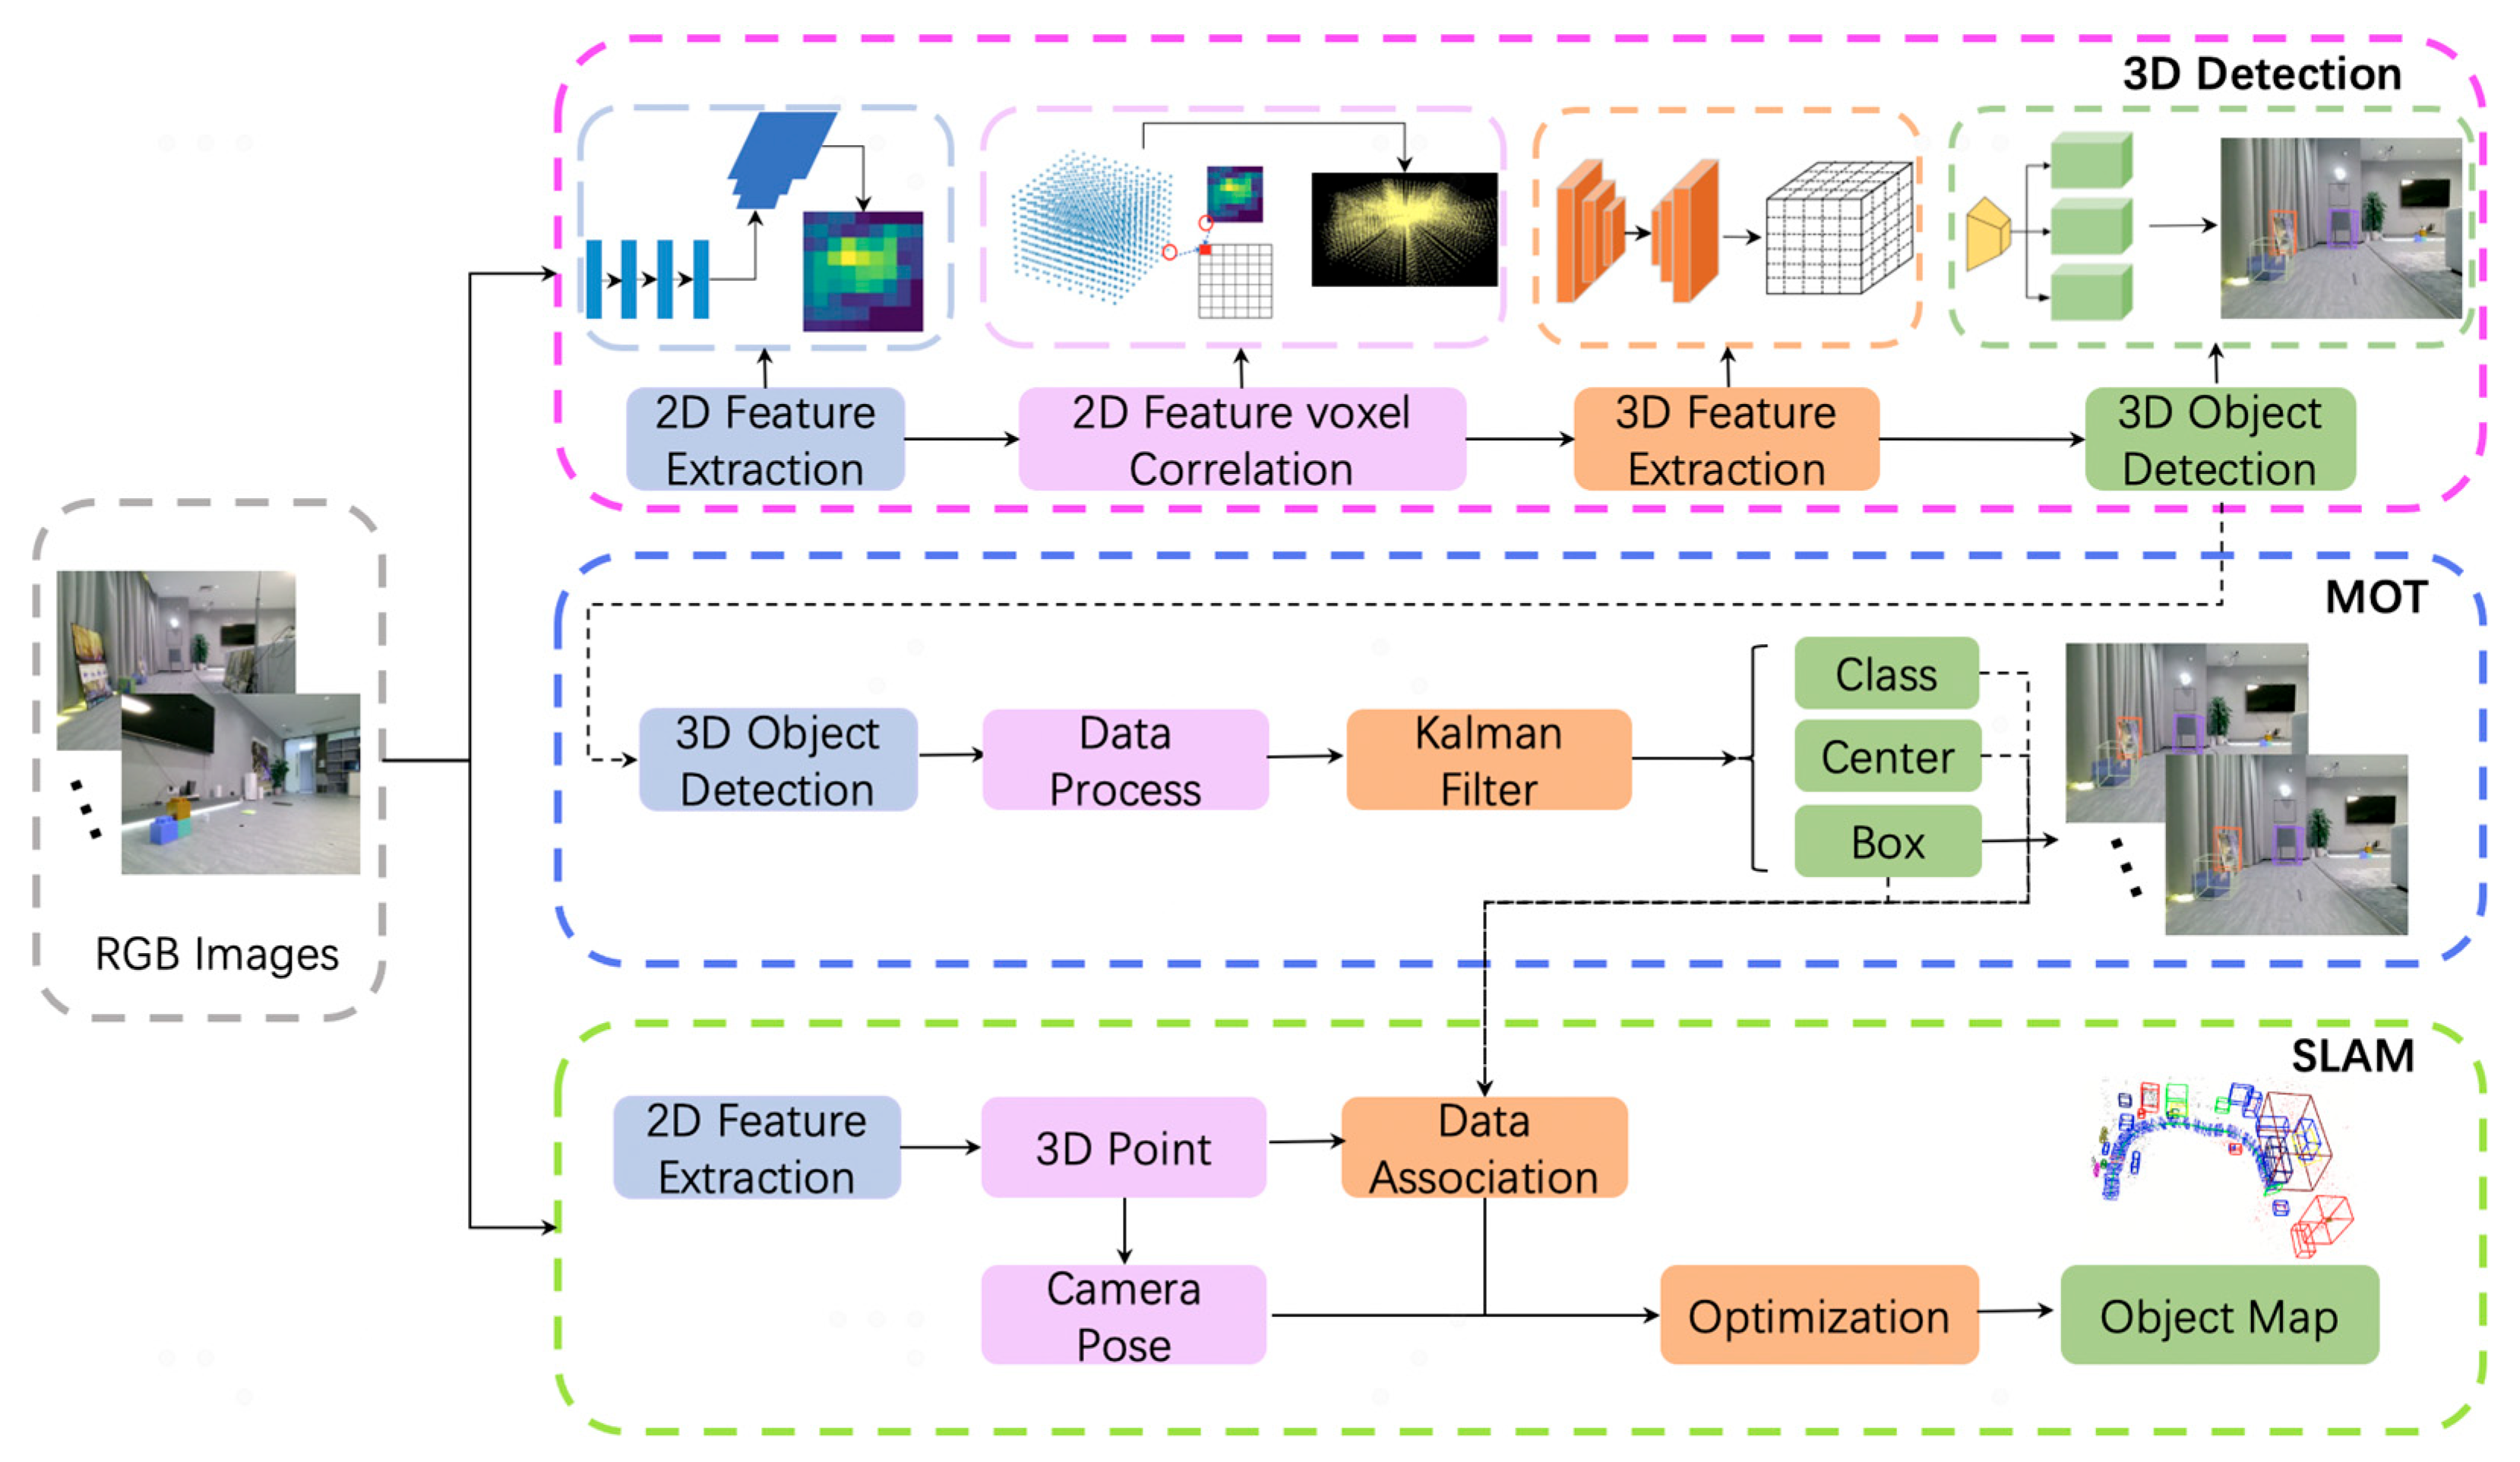
Figure 1. The pipeline of the proposed method. The upper part shows the construction of 3D object detection, the middle part is MOT, and the lower part is the visual SLAM process through monocular camera.
Applsci 15 10881 g001
Figure 2. Dataset distributions. (a) Original Data Distribution. (b) Processed Data Distribution.
Applsci 15 10881 g002
Figure 3. Backbone network structure diagram. This solution upsamples and horizontally connects 4 different feature maps C2, C3, C4, and C5 output by the 4 residual blocks of the ResNet101 network to transfer high-level semantic information to low-level high-resolution feature maps. As a result, rich semantic information is obtained at all scales. After these four feature maps are processed by FPN, the output feature maps that integrate multi-scale rich semantic information are P2, P3, P4, and P5. The feature map P2 with the highest resolution and the most feature information at different scales is selected as the final output.
Applsci 15 10881 g003
Figure 4. Residual unit network structure, the left picture is the ordinary residual unit, and the right picture is the downsampling residual unit.
Applsci 15 10881 g004
Figure 5. Schematic diagram of residual learning skip connection. Skip connections in each residual block allow the input to bypass these convolutional layers and connect directly to the output of the block, which helps mitigate the vanishing gradient problem.
Applsci 15 10881 g005
Figure 6. FPN network structure. The deepest feature map (i.e., the output of the last residual block of ResNet101) is progressively upsampled using bilinear interpolation or deconvolution. After each upsampling, the spatial size of the feature map is doubled. Each upsampled feature map is laterally connected with the ResNet101 feature map of the corresponding resolution through 1 × 1 convolution.
Applsci 15 10881 g006
Figure 7. Camera coordinate system. The Z-axis points in front of the camera plane. The X-axis is perpendicular to the Z-axis and parallel to the camera plane to the right. The Y-axis is perpendicular to the Z-axis and X-axis, parallel to the camera plane downward.
Applsci 15 10881 g007
Figure 8. (a) Anchor point three-dimensional point cloud in camera coordinate system, f corresponds to the feature map size W, w corresponds to the feature map size D, and x corresponds to the feature map size H. (b) The correlation effect diagram between the 2D feature map and the 3D point cloud.
Applsci 15 10881 g008
Figure 9. 3D feature extraction network. The blue module is the 3D convolution residual block. The orange module is the 3D transposed convolution block. The yellow module is the 3D convolution block. The green module is the 3D feature map.
Applsci 15 10881 g009
Figure 10. 3D object detection network. The 3D object detection network comprises the classification detection head Hclass, the center point regression detection head Hcenter and the 3D box regression detection head Hbox.
Applsci 15 10881 g010
Figure 11. Density map of the 100-square-meter laboratory.
Applsci 15 10881 g011
Figure 12. Visualization of object detection results for monocular images from the SUNRGBD datasets.
Applsci 15 10881 g012
Figure 13. Visualization of object detection results for monocular images from the RGB datasets.
Applsci 15 10881 g013
Figure 14. Visualization of object detection results for monocular images from the XR datasets.
Applsci 15 10881 g014
Figure 15. Visualization of object detection results for continuous image frames from the RGB dataset.
Applsci 15 10881 g015
Figure 16. Visualization of motion trajectory after filtering the bottom center point of the RGB dataset.
Applsci 15 10881 g016
Figure 17. Visualization of 3D object semantic SLAM for complete pipeline (including 3D object detection, MOT, ORB-SLAM2) from the RGB dataset.
Applsci 15 10881 g017
Table 1. AP@0.25, AR@0.25, AP@0.50 and AR@0.50 scores for 12 object categories from the SUNRGBD datasets. Among them, the categories are the abbreviation, and the full name are as follows: bookshelf, pillow, chair, kitchen_counter, tv, plant, box, printer, sofa, file_cabinet, painting, counter.
AP/ARBksfPilChairKcctTvPlantBoxPrinSofaFcabPaintCntrmAP
AP_0.2550.8537.3740.5669.9236.4053.7024.6459.1877.8769.3619.2162.4550.13
AR_0.2561.7649.2652.6980.6538.4663.3328.3871.4380.3976.6726.6782.1459.32
AP_0.5029.6920.1419.8437.8024.4533.6115.4242.7740.6552.335.6424.5828.91
AR_0.5035.2922.7929.6245.1626.9236.6717.5754.2945.1056.6711.1132.1434.44
Table 2. AP@0.25, AR@0.25, AP@0.50 and AR@0.50 scores for 14 object categories from the SUNRGBD datasets. Among them, the categories are the abbreviation, and the full name are as follows: bookshelf, pillow, chair, kitchen_counter, tv, counter, painting, plant, box, file_cabinet, end_table, sofa, coffee_table, printer.
AP/ARBksfPilChairKcctTvCntrPaintPlantBoxFcabEndtSofaCoftPrinmAP
AP_0.2563.136.150.865.344.357.839.365.222.257.575.568.581.274.657.2
AR_0.2565.140.455.473.348.270.441.467.624.463.279.274.285.480.062.0
AP_0.5060.724.338.846.037.028.818.956.119.233.866.552.472.149.543.2
AR_0.5062.826.942.850.037.033.322.459.520.539.566.757.075.660.046.7
Table 3. ATE and AOE scores for 10 object categories from the SUNRGBD datasets. The unit of ATE is meters, and the unit of AOE is radians.
IndicatorsBedChairSofaTableDeskDresserNight_StandSinkCabinetLampmATE/mAOE
ATE0.130.240.240.270.310.140.070.120.130.080.17
AOE0.530.280.40−0.13−0.020.32−0.19−0.26−0.01−0.070.08
Table 4. AP@0.15 scores for 10 object categories from the SUNRGBD datasets.
MethodBedChairSofaTableDeskDresserNight_StandSinkCabinetLampmAP
HoPR [60]58.2913.5628.3712.124.7913.718.802.180.482.4114.47
Coop [61]63.5817.1241.2226.219.554.286.345.342.631.7517.80
T3DU [62]59.0315.9843.9535.2823.6519.206.8714.4011.393.4623.32
ImVoxelNet [50]79.1763.0760.5951.1431.2035.4538.3845.1219.2413.2743.66
Ours87.8348.6766.0440.6844.9274.4387.1856.8660.8266.3163.37
Table 5. AP@0.25 scores for 10 object categories from the SUNRGBD datasets. All methods but ImVoxelNet and ours use point cloud (PC) as an input.
MethodRGBPCBathBedBookshelfChairDeskDresserNight_StandSofaTableToiletmAP
F-PointNet [63]yesyes43.381.133.364.224.732.058.161.151.190.954.0
VoteNet [52]noyes74.483.028.875.322.029.862.264.047.390.157.7
H3DNet [64]noyes73.885.631.076.729.633.465.566.550.888.260.1
ImVoteNet [51]yesyes75.987.641.376.728.741.469.970.751.190.563.4
ImVoxelNet [50]yesno71.769.65.753.721.921.234.651.539.176.840.7
Oursyesno82.129.933.531.361.078.765.141.466.654.4
Disclaimer/Publisher’s Note: The statements, opinions and data contained in all publications are solely those of the individual author(s) and contributor(s) and not of MDPI and/or the editor(s). MDPI and/or the editor(s) disclaim responsibility for any injury to people or property resulting from any ideas, methods, instructions or products referred to in the content.