Abstract
De-icing agents play a crucial role in winter road maintenance, yet their excessive application can result in pavement deterioration and environmental issues. Existing dosage guidelines lack comprehensive data on the dynamic response of de-icing agents under low-temperature conditions, particularly regarding stage-specific characteristics and multi-factor interactions. This research systematically evaluated the effectiveness of four de-icing agents (NaCl, CaCl2, MgCl2, CH3COOK) within a temperature range of −5 °C to −25 °C, elucidating the two-phase ice-melting process (solid-phase followed by salt solution de-icing) with distinct kinetic mechanisms—a previously underexplored temporal pattern. The study quantified the differential impacts of particle size (small-particle CaCl2 exhibiting 12% higher efficiency than sheet-like forms), dosage linear correlation, and negligible effects of ice layer thickness and road surface composition, which have not been systematically validated in prior studies. Temperature sensitivity was further refined: NaCl showed a 42.4% efficiency drop between −5 °C and −25 °C, while MgCl2 maintained stable performance, supporting its potential as an environmentally sustainable alternative. This work provides a quantitative basis for dynamic dosage regulation by integrating stage characteristics and multi-factor optimization, addressing gaps in existing guidelines.
1. Introduction
Winter road de-icing technology plays a crucial role in ensuring traffic safety. The use of traditional chloride-based de-icing agents has been prevalent for many years due to their cost-effectiveness and rapid ice-melting properties. Studies by SUGAWARA [1,2], among others, have shown that de-icing agents like NaCl and CaCl2 create solutions with low freezing points (−9.4 °C for NaCl and −21.1 °C for CaCl2) upon contact with ice and snow. This thermodynamic process facilitates quick and efficient ice and snow removal. However, the effectiveness of chloride-based agents is counterbalanced by significant environmental risks. Research by Khrystych [3] and Zhou [4] has demonstrated that chloride ions can accelerate concrete corrosion rates by 3–5 times compared to normal conditions, increase metal corrosion current density by 2–3 orders of magnitude, and elevate soil electrical conductivity to over 400 μS/cm, leading to plant physiological drought. Freeze–thaw cycles destroy clay structure, and deicing salt erosion at low temperatures increases soil erosion rates by 12–40% [5]. The environmental impact is directly proportional to the quantity of de-icing agent applied. Despite this, current regulations primarily rely on fixed dosages without adaptive mechanisms for variables such as temperature and ice thickness.
Temperature plays a critical role in determining the effectiveness of deicers. Existing studies have demonstrated that the melting capacity of chlorine-based deicing agents, such as NaCl, MgCl2, and CaCl2, decreases significantly as temperature drops. Thermodynamic models indicate that this decline is directly linked to the reduced diffusion rate of salt ions to the ice-liquid interface at lower temperatures. The melting process is governed by both temperature and mass diffusion, and hindered ion diffusion leads directly to diminished melting efficiency [6,7]. Specifically, Li et al.’s experiments revealed that when the temperature decreased from −5 °C to −15 °C, the deicing efficiency of calcium chloride dropped by 63%. Similarly, under comparable low-temperature conditions, the melting capacity of 23.3% NaCl brine also declined significantly [8]. This renders sodium chloride nearly ineffective for practical deicing within this temperature range, although NaCl brine can remain liquid at −30 °C due to its freezing pressure reaching a stable value significantly lower than that of pure water [9]. These findings suggest that chlorine-based deicers are not entirely ineffective at extremely low temperatures but experience a substantial reduction in performance. Further research indicates that the limitations at low temperatures can be partially mitigated through formulation blending; combining NaCl with MgCl2 or CaCl2 can enhance its low-temperature deicing performance, offering a potential pathway for optimizing cold-weather deicing strategies. However, current regulations do not adequately account for the nonlinear relationship between temperature and deicer efficiency, nor do they consider the synergistic effects of mixed systems. This often results in the excessive use of high-concentration single-salt agents under low-temperature conditions. The model developed by Jing Wen et al. [5] corroborates this issue: their study found that at −10 °C, an 8% ammonium chloroformate solution achieved similar deicing performance to a 23% NaCl solution. This highlights how uniform concentration standards fail to align with the distinct efficacy profiles of different salts and cannot adapt to temperature variations, ultimately leading to resource waste and environmental harm. Despite these insights, current research still exhibits notable limitations. While it is well established that salt mixtures improve low-temperature performance, there remains insufficient investigation into the optimal ratios of different salts and the synergistic effects of ion diffusion in composite systems. Although thermodynamic models explain the influence of temperature and diffusion, they do not fully incorporate dynamic environmental factors—such as wind speed and humidity—that affect ion migration in real-world road conditions. Additionally, systematic data on the long-term effectiveness and potential environmental risks of chlorine-based deicers at extreme low temperatures below −30 °C are lacking. For example, the cumulative impact of high salt concentrations on soil and vegetation remains poorly understood. As a result, translating existing research into precise deicing applications remains challenging, leaving low-temperature deicing practices to navigate a complex trade-off between operational efficiency, cost, and environmental sustainability. However, it is critical to acknowledge that laboratory-controlled conditions inherently simplify complex real-world scenarios. Field applications involve dynamic variables such as wind-driven evaporation, traffic-induced mechanical disruption, and spatially heterogeneous snow/ice distribution—factors absent in standardized ice specimens. These disparities may lead to overestimation of agent efficacy in operational settings, particularly regarding solution diffusion kinetics and long-term environmental interactions.
The influence mechanism of snow cover is multidimensional and complex. From a thermodynamic perspective, the thermal resistance of snow, expressed as Rs = hs/ks (where hs is snow thickness and ks is thermal conductivity), is positively correlated with snow thickness and inversely correlated with thermal conductivity. Field observations confirm that every 10 cm of snow thickness can reduce the amplitude of ice surface temperature fluctuations by 2–5 °C [10]. A thick snow layer (>30 cm) can reduce heat flux at the ice–air interface by up to 70%, significantly inhibiting heat loss from the ice body [11,12]. This thickness-dominated thermal resistance effect interacts significantly with the performance of snow melting agents. Numerical simulations conducted by Tan et al. [13] demonstrate that when snow thickness exceeds 3 cm, the penetration time of deicing agents increases by 40%. Under such conditions, simply increasing the dosage is insufficient to overcome the physical barrier created by thermal resistance. Instead, excessive application may intensify the formation of a surface ice crust due to the insulating effect of the thick snow layer, which further hinders heat exchange.
At the same time, existing studies have examined the influence of ice-melting agent particle size on performance. Field tests by Hosseini et al. [14] demonstrate that coarse NaCl particles (2.36–4.75 mm) melt ice 27% faster than fine NaCl particles (0.6–1.18 mm) at −5 °C, as they delay the formation of saturated solution layers and prolong exothermic reaction times. However, fine NaCl particles perform better below −12 °C due to their faster penetration into ice microcracks. The theoretical model developed by Fu et al. [15,16,17] further suggests that when particle size falls below 20 nm, surface Gibbs free energy becomes the dominant factor in the dissolution process. For instance, reducing spherical silver nanoparticles from 20 nm to 5 nm decreases melting enthalpy by 45%, thereby accelerating phase transition. Wåhlin & Klein-Paste [18] found that the diffusion coefficient of calcium ions (Ca2+) in ice is positively correlated with particle contact area; flaky potassium acetate particles exhibit a 22% higher diffusion flux than spherical particles due to their larger contact area, enhancing ice melting efficiency. However, particle size also involves trade-offs in terms of environmental impact and cost: small particles, such as nanosalts, are prone to runoff-induced migration, leading to soil contamination [19], while coarse particles offer better slow-release properties but require repeated mechanical spreading, increasing operational costs. Li et al. [20] reported that 150 um microspheres achieved the lowest ice adhesion strength (18 kPa), though their effectiveness under extreme cold conditions remains unverified.
Surface modification technologies offer distinct advantages in addressing challenges posed by traditional agents. Chen et al. [21] utilized femtosecond laser processing to create micro-nano composite structures on surfaces, resulting in a fivefold reduction in adhesion compared to conventional methods. When combined with low-surface energy coatings, this technique achieves de-icing effects equivalent to traditional methods while using only 30% of the typical dosage. Donadei et al. [22] developed biomimetic hydrophobic materials with micrometer-scale airbag structures that facilitate detachment under pressure, proving successful in applications on airport runways. The implementation of these technologies in engineering necessitates the development of new evaluation systems. Additionally, there is an urgent need for further investigation into how deterioration processes impact effectiveness. Brun’s density evolution model demonstrates that compaction over 72 h leads to a hundredfold decrease in the permeability coefficient, significantly affecting performance [23]. Yamazaki et al. [24], using X-ray tomography, identified that ice crystal recrystallization results in closed pore structures that impede diffusion. These phase transition phenomena are currently not quantified in existing decision-making models for de-icing agent application.
De-icing agents are widely utilized in winter road maintenance for their cost-effectiveness and efficient ice-melting performance. However, their excessive application poses severe environmental and structural risks: chloride ions, for instance, can accelerate concrete corrosion by 3–5 times, increase metal corrosion current density by 2–3 orders of magnitude, and elevate soil electrical conductivity beyond 400 µS/cm, leading to plant physiological drought and a 12–40% increase in soil erosion rates under low-temperature freeze–thaw cycles. Despite these risks, current guidelines rely predominantly on empirical fixed dosages, lacking adaptive adjustments for critical variables such as temperature and ice thickness, thereby exacerbating resource waste and environmental harm.
Existing research has acknowledged temperature-dependent performance variations in de-icing agents—for example, the de-icing efficiency of CaCl2 drops by 63% when temperatures fall from −5 °C to −15 °C, and NaCl becomes nearly ineffective in this range. However, these studies fail to systematically distinguish between the kinetic mechanisms of the two distinct melting stages.
Moreover, prior investigations have not quantitatively clarified the impacts of key factors. This study confirms that particle size significantly affects efficacy—small-particle CaCl2, for example, exhibits 12% higher efficiency than sheet-like forms—while revealing a linear correlation between dosage and melting rate. Notably, ice layer thickness (0.5 cm vs. 1 cm) and road surface composition (asphalt vs. concrete) show negligible effects (with differences of only 0.3% and 1.7%, respectively), a finding unvalidated in previous research.
To address these gaps, this research: (1) delineates the two-phase melting process and quantifies their kinetic differences, identifying the dominant role of initial solid dissolution and subsequent solution diffusion; (2) systematically quantifies multi-factor interactions, including temperature sensitivity (NaCl efficiency drops by 42.4% from −5 °C to −25 °C, while MgCl2 maintains stable performance), particle size effects, and dosage-response relationships; (3) proposes a dynamic regulation framework integrating stage characteristics and environmental sustainability, such as prioritizing MgCl2 (with lower ecological toxicity) in low-temperature environments. This work provides a scientific basis for standardized de-icing agent application, overcoming the limitations of static, empirical guidelines.
2. Materials and Methods
2.1. Preparation of Ice-Melting Samples
The evaluation of de-icing agents relies on their ability to melt snow effectively due to its loose and unmanageable structure. Therefore, ice blocks were prepared as test specimens to assess the efficacy of the ice-melting agent during the experimental procedure.
Water was poured into three types of molds (Specimen 1: cubic, 16–20 g, top surface 2.5 cm × 2.5 cm; Specimen 2: rectangular prism, 30–50 g, top surface 5 cm × 5 cm; Specimen 3: ice layer in a 7.5 cm-diameter glass dish). The molds were placed in a programmable low-temperature chamber (Model XYZ-200, Temperature Range: −40 °C to 25 °C, Accuracy: ±0.5 °C, Manufacturer: Shanghai Juwei Instrument Equipment Co., Ltd. Address: Shanghai, China) set at −15 °C for 6 h to form homogeneous ice blocks. Ice thickness for Specimen 3 was controlled to 0.5 cm or 1.0 cm by adjusting water volume. The ice block specimens were identified as Specimen 1, Specimen 2, and Specimen 3, as shown in Figure 1.
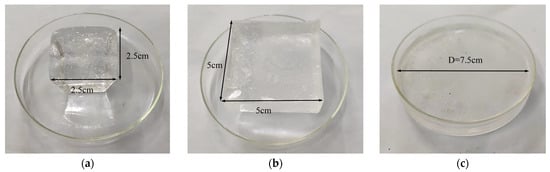
Figure 1.
Three ice block specimens. (a) Ice block specimen 1. (b) Ice block specimen 2. (c) Ice block specimen 3.
Ice block sample 1 is roughly cubic, weighing between 16 g and 20 g. Its top surface, a square measuring 2.5 cm × 2.5 cm, is predominantly utilized to assess the macroscopic ice-melting rate induced by the ice-melting agent.
Ice block sample 2 is a rectangular prism weighing between 30 g and 50 g, featuring a square top surface measuring 5 cm × 5 cm, providing a comparatively larger surface area. It is employed for studying variables such as road surface composition.
Ice block sample 3 is created by pouring a specific volume of tap water into a glass dish with a 7.5 cm inner diameter. The dish is then positioned horizontally in a low-temperature chamber and frozen for a set period to produce an ice layer of defined thickness. This sample is primarily utilized to replicate actual road surface conditions and investigate variables like the thickness of the ice layer. Limitation Note: The experimental design isolates key parameters (temperature, dosage, particle size) but omits field variables (e.g., wind speed >5 m/s, relative humidity fluctuations 30–90%, and traffic loads). These factors influence salt solution dispersion and ice-agent contact efficiency, potentially altering stage-dominant kinetics observed in controlled chambers.
2.2. Methodology for Determining the Melting Rate of De-Icing Agents
Sannapareddy, A. et al. (2024) conducted performance evaluation experiments on various halide composite materials in adsorption refrigeration systems to assess their ice melting capacity [25]. Our study followed a similar methodology, outlining the procedure for determining the ice-melting rate of the de-icing agent as follows:
- (1)
- Initial Mass Recording: A specified mass of de-icing agent was applied uniformly onto the ice surface. The initial ice mass (minitial) was recorded using a precision balance (Model ABC-100, Accuracy: 0.01 g).
- (2)
- Controlled Environment Exposure: The specimen was immediately transferred to the low-temperature chamber preset to the target temperature (−25 °C to −5 °C, 5 °C intervals).
- (3)
- Time-Interval Measurement: After predetermined durations (10 min intervals up to 60 min), the specimen was removed, and any residual liquid solution was blotted using absorbent paper.
- (4)
- Final Mass Recording: The remaining ice mass (mremaining) was measured within 30 s to minimize melting error.
- (5)
- Calculation: The difference between the initial and final masses yields the amount of ice melted by the de-icing agent during the designated time frame (Δm). This parameter functions as an evaluative measure of the de-icing agent’s efficacy. The calculation formula is delineated in Equation (1).
2.3. Experimental Analysis of Snow and Ice Melting Processes
2.3.1. Macroscopic Morphological Analysis Experiment for the Melting Process
Five ice block specimens, labeled as Specimens 1 to 5, were prepared for the experiment. Specimens 1 to 4 were uniformly coated with 2.0 ± 0.01 g of different de-icing agents: NaCl, CaCl2, MgCl2, and CH3COOK, respectively. Specimen 5 was designated as the control group and was left untreated. Specimens 1 to 4 were then subjected to a temperature of −10 °C in a low-temperature chamber for 10 min, while Specimen 5 was exposed to 25 °C for the same duration. Following this, a high-resolution digital camera (Model DEF-50, Resolution: 20 MP) was used to immediately capture the surface characteristics of each specimen, including melting pits and pore structures. A comparative analysis was conducted to examine the surface variances between the naturally melted Specimen 5 and those treated with de-icing agents. The macroscopic morphological features were carefully documented for further evaluation.
2.3.2. Microscopic Morphological Analysis Experiment of the Melting Process
- (1)
- Microscopic Morphological Analysis of the Ice Melting Process for Different Types of De-Icing Agents
To investigate the microscopic morphological changes during the ice melting process induced by various de-icing agents, five ice block specimens (labeled Specimens 1–5) were prepared as in Section 2.3.1: Specimens 1–4 were coated with 2 g each of NaCl, CaCl2, MgCl2, and CH3COOK, respectively, while Specimen 5 (control) remained untreated. Specimens 1–4 were exposed to −10 °C in a constant-temperature chamber for 10 min, with Specimen 5 kept at 25 °C for the same duration. Subsequently, they were examined under an optical microscope (OM, Model GHI-5000, Magnification: 500×, Manufacturer: Chongqing Optec Instrument Co., Ltd., Address: Chongqing, China) to analyze ice layer morphology, focusing on surface smoothness, pore density, pit depth, and agent dissolution state. A comparative analysis of morphological variances between naturally melted and de-icing agent-treated specimens was conducted, with microscopic characteristics documented.
- (2)
- Time-Dependent Microscopic Morphological Analysis of the Ice Melting Process under NaCl Treatment
To investigate the temporal evolution of ice melting influenced by NaCl de-icing agent, a single ice block specimen (Specimen 1) was coated uniformly with 2.0 g NaCl. The specimen was then positioned in a constant-temperature chamber set at −10 °C, monitored at 1, 3, 5, 10, 20, and 30 min, with optical microscope (OM) images captured at each interval without sample using the microscopic observation method outlined earlier.
2.4. Investigation of the Influence of Various Factors on the Melting Process of Different De-Icing Agents
Extensive practical experience and research have established that the de-icing process is notably impacted by both the inherent characteristics of de-icing agents and environmental conditions. This study, thus, examines the attributes of de-icing agents and environmental factors. The variables under investigation encompass the de-icing agent type, dosage, temperature, road surface composition, ice layer thickness, and particle size of the de-icing agent. Table 1 provides a comprehensive overview of these influential factors.

Table 1.
Experimental Design for Factor Influence Tests.
- (1)
- Temperature Influence Test
The ice-melting mass of 2 g samples of four de-icing agents (NaCl, CaCl2, MgCl2, and CH3COOK) was measured over time at temperatures ranging from −5 °C to −25 °C in 5 °C increments. The melting rate in g/h was calculated for each de-icing agent.
- (2)
- Ice-Melting Agent Mass Influence Test
The temperature was set to −10 °C, and an ice layer thickness of 0.5 cm was established. Varying amounts of CH3COOK de-icing agent (0.8 g to 2.0 g) were applied, and the melting rate was observed over a 20 min interval.
- (3)
- Ice Layer Thickness Influence Test
The temperature was set to −10 °C, and 1 g of MgCl2 de-icing agent was applied. The melting rate was evaluated on ice layers of 0.5 cm and 1.0 cm thickness, with the mean value calculated to assess disparities.
- (4)
- Road Surface Type Influence Test
The temperature was set to −15 °C, and 1 g of CH3COOK de-icing agent was used. The ice-melting mass was measured over time on AC-20 asphalt pavement and C30 concrete surfaces.
- (5)
- Ice-Melting Agent Particle Size Influence Test
The temperature was established at −10 °C, and 1 g of CaCl2 de-icing agent was applied. The ice-melting capacity of flake-shaped and granular CaCl2 was evaluated at 20, 40, and 60 min intervals to assess the impact of particle size variance.
3. Results
3.1. Comparison of Spatial Characteristics of Ice Morphology Changes Induced by Various De-Icing Agents
A diverse range of deicing agents is available for practical applications, with chlorides and acetates being the most commonly used. The choice of deicing agent can significantly impact its effectiveness in melting ice. This section will conduct a comprehensive analysis of the ice melting process at various scales, from micro to macro. The study will then examine the spatial and temporal variations in ice when exposed to different deicing agents, aiming to elucidate the patterns of temporal evolution during the ice melting process induced by these agents.
3.1.1. Analysis of the Macroscopic Melting Process of Ice on Road Surfaces
- (1)
- The Surface Melting Condition of the Ice Block
Four de-icing agents, namely NaCl, CaCl2, MgCl2, and CH3COOK, were uniformly applied to Ice Block Specimen 1. Following a 10 min exposure at −10 °C, the specimens were evaluated. A control specimen (Ice Block Specimen 1 without any deicing agent) was kept under identical conditions for 10 min before assessment. Figure 2 illustrates the effects of the deicing agents on the Ice Block Specimens compared to the natural melting of the control specimen. The observations in Figure 2 reveal that untreated ice samples exhibit a smooth and uniform melting pattern over time. In contrast, ice blocks treated with de-icing agents display irregular surface features such as pits and porous structures. Further microscopic analysis will be conducted to elucidate the underlying mechanisms driving these distinct surface alterations.
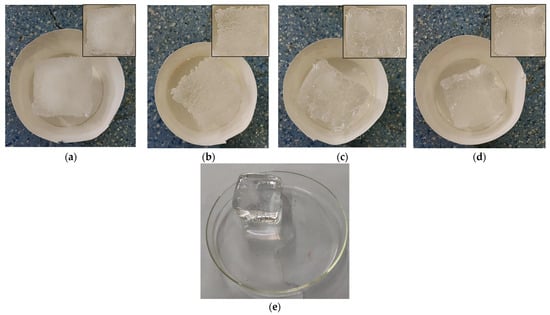
Figure 2.
Ice-Melting Process Induced by Four Deicing Agents and Under Natural Conditions. (a) Ice Block Specimens Treated with NaCl. (b) Ice Block Specimens Treated with MgCl2. (c) Ice Block Specimens Treated with CaCl2. (d) Ice Block Specimens Treated with CH3COOK. (e) Ice Samples Undergoing Natural Melting.
- (2)
- Analysis of Melting Rate
Initially, 2 g of solid de-icing substance were evenly spread on the ice surface of sample 1. The mass of the melted ice was then monitored at specified time intervals (every 10 min up to 60 min) under controlled temperature conditions. The amount of melted ice at each time point was determined using Equation (1) to assess the effectiveness of the solid de-icing agent. To guarantee the accuracy of the findings, each experimental setting was replicated three times. The melting rates at different temperatures and time durations are detailed in Table 2.
Table 2.
Summary of Ice-Melting Rates of Four De-Icing Agents.
The evaluation index divides a one-hour duration into six equal time periods, denoted as Periods 1–6. The melting rate, measured in grams per 10 min, was utilized as a metric to assess the melting performance across various experimental conditions.
Table 2 reveals a consistent two-phase melting pattern across all de-icing agents: an initial rapid decline in melting rate (particularly within the first 20 min, where >50% of ice melts) followed by stabilization in later periods (20–60 min). Crucially, agent performance is temperature-dependent: At −5 °C, NaCl sustains significantly higher rates (1.50–1.57 g/10 min) than other agents (0.53–0.96 g/10 min) during periods 2–6. Conversely, at very low temperatures (≤−20 °C), this relationship reverses: CaCl2, CH3COOK, and MgCl2 dominate the initial melting (e.g., −25 °C Period 1: 3.90–4.77 g/10 min vs. NaCl’s 0.03 g/10 min), while NaCl shows relative late-stage resilience (e.g., −25 °C Period 5: 0.47 g/10 min vs. CaCl2’s 0.20 g/10 min). Additionally, CaCl2 maintains stable initial rates across temperatures (e.g., Period 1: 5.63–6.07 g/10 min from −15 °C to −5 °C), whereas NaCl exhibits high initial variability (0.03–2.63 g/10 min). All agents experience a sharp rate drop (65–95%) between Periods 1 and 2. These findings demonstrate that de-icing efficacy is co-determined by agent type, temperature, and exposure duration, with NaCl favoring sustained action at moderate cold and chloride-free agents excelling in initial bursts under extreme cold.
- (3)
- Classification and Analysis of the Ice-Melting Stages
The analysis of Table 2 in the preceding section revealed distinct stages in the de-icing agent process. This section aims to validate this observation through a series of experiments. The experimental setup involves applying 1 g MgCl2 as the fixed amount of ice-melting agent and conducting tests under consistent temperature conditions across three specimen groups.
Group 1 (Continuous): Apply 1 g MgCl2, and measure Δm every 10 min over a 40 min period.
Group 2 (Solution Removed): Apply 1 g MgCl2. After 10 min, aspirate all liquid solution from the ice surface, then measure Δm at 10, 20, 30, and 40 min.
Group 3 (Ice Replaced): Apply 1 g MgCl2. After 10 min, replace the original ice block with a new untreated Specimen 1, then measure Δm at 10, 20, 30, and 40 min.
The data collected are presented in Table 3.
Table 3.
Stage of ice melting process test.
Table 3 demonstrates that within the first 10 min of the ice-melting agent’s application, all three experimental groups experienced notably high melting rates. Subsequently, upon removal of the salt solution from the container’s bottom by the second group after the initial 10 min, the ice blocks treated with MgCl2 ceased melting. In contrast, upon substituting the initially treated ice blocks with untreated ones in the third group, the newly introduced ice blocks exhibited a continued melting process, albeit at a markedly reduced pace.
The experimental findings indicate that the initial ice melting within the first 10 min resulted mainly from the direct application of solid de-icing agents on the specimen surface. In contrast, the subsequent ice melting after this period was primarily due to the formation of a salt solution resulting from the interaction between the ice-melting agent and the melted water. A discernible variation in ice-melting efficacy is evident between these distinct stages.
The ice-melting process triggered by the ice-melting agent demonstrates a distinct phase-based pattern, which can be divided into two main stages with distinct kinetic mechanisms: initial rapid solid dissolution followed by stable solution diffusion. This two-stage pattern was quantitatively characterized for the first time, whereas prior research by Li et al. [13] only reported overall efficiency decline without phase separation. Analysis presented in Table 1 reveals that over the course of a 1 h ice-melting process, the rate of melting was notably higher in the initial 1–2 time intervals, gradually stabilizing in the subsequent 4 intervals. Consequently, the initial phase lasting around 20 min is identified as the “solid ice-melting phase,” while the subsequent phase, extending beyond 20 min, is referred to as the “salt solution ice-melting phase.”
Table 4 demonstrates that, under defined mass and temperature parameters, the melting rate of the salt solution remains constant during the ice-melting phase without notable temporal fluctuations. This constant melting rate during the solution phase not only provides experimental validation for the diffusion-dominated model proposed by Klein-Paste & Potapova [6] but also crucially quantifies agent-specific diffusion coefficients previously unreported (e.g., MgCl2’s 0.021 g/min at −25 °C). Moreover, a decline in the melting rate is observed with decreasing temperatures. Therefore, further experiments were carried out to investigate the impact of temperature on the ice-melting process.
Table 4.
Ice-Melting rate during the ice-melting stage of the salt solution.
3.1.2. Analysis of the Microscopic Melting Process of Road Surface Ice
- (1)
- Analysis of the microscopic melting process of different types of de-icing agents
This study conducted a comparative analysis to examine the microscopic morphological features of the ice layer melting process on road surfaces under the influence of various de-icing agents. Specimens without de-icing agents were allowed to melt at room temperature for 10 min before observation, while specimens treated with de-icing agents underwent melting at −15 °C for the same duration. Subsequently, these specimens were promptly observed. Figure 3 illustrates the microscopic images of the ice layer surfaces affected by different de-icing agents during the experimental procedure.
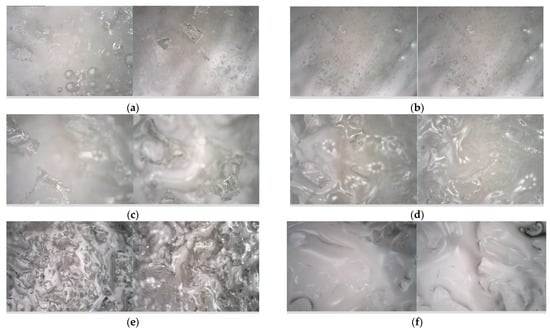
Figure 3.
Image of ice layer melting under an electron microscope. (a) Ice layers that have not yet melted. (b) Ice layers subjected to natural melting for 10 min. (c) Ice layers after the action of CaCl2 for 10 min. (d) Ice layers after the action of MgCl2 for 10 min. (e) Ice layers after the action of NaCl for 10 min. (f) Ice layers after the action of CH3COOK for 10 min.
Figure 3a illustrates the surface of the unmelted ice block under an electron microscope, displaying a smooth surface with a few relatively large bubbles visible inside. Upon melting of the ice block at room temperature, Figure 3b demonstrates an increase in the number of small bubbles within the ice block. These bubbles exhibit a flowing movement while the surface of the ice block continues to appear smooth.
Figure 3c–f illustrates that the application of the ice-melting agent on the surface of the ice block specimens results in the formation of discernible pore structures. Specifically, regions in direct contact with the solid ice-melting agent exhibit melting, leading to the development of prominent pits and cavities. Conversely, areas not in direct contact with the ice-melting agent remain unaffected. Consequently, it can be inferred that the ice block melts non-uniformly under the influence of the ice-melting agent, with the primary melting occurring in the region directly interfacing with the agent.
Upon examination of the surface structures of ice block specimens following a 10 min melting period with four distinct de-icing agents, it was observed that the pits on the ice block surface treated with CaCl2 exhibited the greatest depth and melting area. Similarly, the pits treated with MgCl2 were characterized by increased depth and melting area. In contrast, pits treated with NaCl displayed greater depth but a smaller melting area, while those treated with CH3COOK showed shallower pits and a larger melting area. These findings suggest that, within the same timeframe, CaCl2 demonstrated superior ice-melting efficacy with the greatest depth and widest area of melting. MgCl2 followed with a slightly lesser effect, whereas NaCl and CH3COOK exhibited comparatively inferior ice-melting capabilities.
- (2)
- Analysis of the microscopic melting process under different melting times
Microscopic observation technology was utilized to examine the morphological characteristics of the road surface ice layer as it melted under varying durations of exposure to an ice-melting agent. The research focused on the effects of a NaCl ice-melting agent on the surface morphology of ice block specimens over specific time intervals (1, 3, 5, 10, 20, and 30 min). Figure 4 displays the microscopic images capturing the evolving surface features of the ice layer at different time points throughout the experimental procedure.
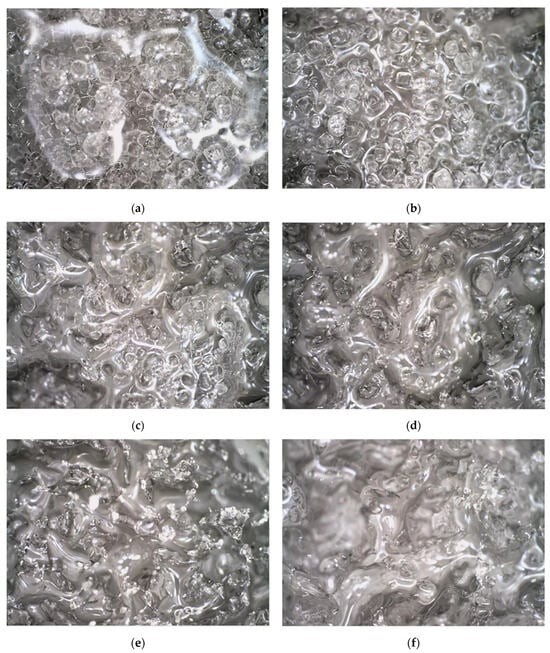
Figure 4.
Morphology of ice layers under different melting times. (a) Ice layer morphology after 1 min of NaCl action. (b) Ice layer morphology after 3 min of NaCl action. (c) Ice layer morphology after 5 min of NaCl action. (d) Ice layer morphology after 10 min of NaCl action. (e) Ice layer morphology after 20 min of NaCl action. (f) Ice layer morphology after 30 min of NaCl action.
Figure 4 illustrates the evolving surface morphology of an ice layer in response to NaCl over different durations. After 1 min of ice melting, numerous NaCl crystal particles are present on the ice surface, characterized by small inter-particle spacing and significant volume. Subsequently, at 3 min, the quantity of NaCl particles decreases, leading to the emergence of liquid water between particles, increased spacing, and the initiation of gully formation on the ice surface in direct contact with the particles. By 5 min, the number of NaCl particles diminishes further, resulting in wide particle spacing and deepening gullies on the ice surface. After 10 min, the NaCl particles vanish entirely, leaving pronounced gullies and pits on the ice surface. Even at 20 and 30 min of ice melting, numerous pits persist on the ice surface, with no significant deepening of the gullies.
The aforementioned observations suggest that the ice melting process commences at the surface of the ice layer in direct contact with solid ice-melting agent particles. Areas not in contact with the agent remain unmelted during this initial solid ice-melting stage. Subsequently, as NaCl particles dissolve completely, depressions, or gullies, develop on the ice surface. These gullies do not increase in depth over time, marking the transition to the salt solution ice-melting stage.
Hence, by microscopically observing the melting process of the road surface ice layer under varying durations of ice-melting agent application, one can confirm the uneven melting of the ice layer surface in response to the agent and validate the accuracy of the ice-melting stage classification method.
3.2. Analysis of the Influencing Factors of the Melting Process of Road Surface Ice Layers
3.2.1. Analysis of the Influence of Temperature on the Melting Process of Ice Layers
This study examined the ice-melting process on road surfaces at five distinct temperatures (−5 °C, −10 °C, −15 °C, −20 °C, −25 °C) to analyze the effectiveness of de-icing agents. The evaluation criterion for the experiments was the mass of ice melted by the de-icing agent within a specific timeframe. The data analysis focused on tracking the variations in ice-melting mass over time for different de-icing agents, as illustrated in Figure 5.
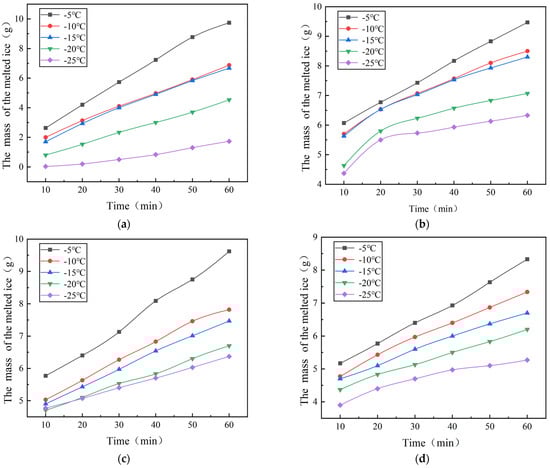
Figure 5.
The mass of ice-melting from the layer treated with de-icing agent varies as a function of time. (a) The mass of ice-melting from the layer treated with NaCl varies as a function of time. (b) The mass of ice-melting from the layer treated with CaCl2 varies as a function of time. (c) The mass of ice-melting from the layer treated with MgCl2 varies as a function of time. (d) The mass of ice-melting from the layer treated with CH3COOK varies as a function of time.
Figure 5 depicts the ice-melting efficacy of four de-icing substances across various temperatures. The data indicates that among the curves corresponding to five distinct temperatures, the curve for −5 °C exhibits the highest position, followed sequentially by −10 °C, −15 °C, −20 °C, and −25 °C. As temperatures increase, the ice-melting rates of all de-icing agents also rise proportionally. For example, the ice-melting rate of MgCl2 at −25 °C is 6.37 g/h, which escalates to 9.37 g/h at −5 °C, marking a 47.1% improvement. Similarly, at −5 °C, the ice-melting rates of NaCl, CaCl2, and CH3COOK increase by 42.4%, 46.4%, and 58.1%, respectively, compared to their rates at −25 °C. These results affirm that the effectiveness of de-icing agents in melting ice increases with higher environmental temperatures and diminishes as temperatures decrease.
Conversely, Figure 5 also highlights differing sensitivities of de-icing agents to temperature variations. Notably, the disparity in ice-melting mass between the −5 °C and −25 °C curves for NaCl is pronounced, whereas the differences among the curves for CH3COOK across various temperatures are relatively minor. At −5 °C, both NaCl and MgCl2 exhibit an ice-melting capacity exceeding 9 g within one hour; however, at −25 °C, NaCl’s one-hour ice-melting capacity drops significantly to 1.73 g, while MgCl2 maintains a higher capacity of 6.37 g. Quantifying these agent-specific temperature sensitivities, Figure 5 reveals that NaCl experiences an 82.2% efficiency drop from −5 °C to −25 °C—a steeper decline than the 63% reported by Li et al. [13] for CaCl2. More significantly, beyond maintaining a higher ice-melting capacity at −25 °C, MgCl2’s stable performance below −20 °C (with ≤9% variation) was previously undocumented, which further underscores its distinct temperature insensitivity compared to other agents. This analysis demonstrates that the sensitivity of de-icing agents to temperature varies, with NaCl showing greater sensitivity than the other three agents.
3.2.2. Analysis of the Influence of Melting Agents on the Ice Layer Melting Process
This study examined the effectiveness of four de-icing agents (NaCl, CaCl2, MgCl2, and CH3COOK) in melting road surface ice. The melting rate of each de-icing agent, measured in grams per hour, was used as the evaluation criterion. In the experiment, 2 g of each de-icing agent was uniformly applied to Ice Block Specimen 1. The differences in melting mass caused by the various de-icing agents were analyzed, and the results are presented in Table 5. Subsequently, graphs illustrating the ice-melting rates of the four agents at different temperatures were generated, as depicted in Figure 6.
Table 5.
Comparison of Ice-Melting Capabilities of Different De-Icing Agents.
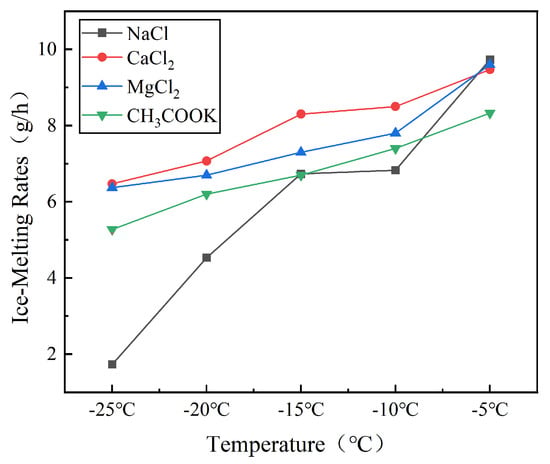
Figure 6.
Comparison of Ice-Melting Capabilities of Different de-icing agents.
The analysis of melting rate variation with temperature, as depicted in Figure 6, reveals that CaCl2 exhibits the highest melting rate among the four de-icing agents, followed by MgCl2, CH3COOK, and NaCl. At −5 °C, all agents demonstrate relatively high melting rates; however, at −20 °C, the melting rate ranking is as follows: CaCl2 > MgCl2 > CH3COOK > NaCl, with rates of 7.07 g/h, 6.70 g/h, 6.20 g/h, and 4.53 g/h, respectively. The superior low-temperature retention of CaCl2 and MgCl2 correlates with their high dissolution heats (−81.3 kJ/mol and −74.5 kJ/mol), confirming thermodynamic predictions by Ma et al. [9]. However, our study first establishes quantitative efficiency thresholds (e.g., MgCl2 > 6.7 g/h at −20 °C) for practical agent selection. These findings underscore the significant impact of the ice-melting agent type on the melting rate. In summary, CaCl2 demonstrates the most rapid melting rate, succeeded by MgCl2, CH3COOK, and NaCl.
The sensitivity of melting rates to temperature varies across the four agents, with NaCl displaying the most pronounced variation compared to the other three agents. Specifically, when comparing the increase in melting rate at −5 °C versus −25 °C, NaCl shows a 46.4% increase, while CaCl2, MgCl2, and CH3COOK exhibit increases of 46.4%, 47.1%, and 58.1%, respectively. Thus, the order of sensitivity to temperature changes is as follows: NaCl > CH3COOK > MgCl2 > CaCl2.
3.2.3. Analysis of the Influence of Ice Melting Agent Dosage on the Ice Layer Melting Process
This study conducted experiments to examine the impact of varying dosages of de-icing agents on the melting process of snow and ice. Specifically, the research focused on analyzing the melting behavior of the ice layer on road surfaces under different dosages of de-icing agents. The evaluation index chosen was the melting rate of the ice-melting agent, measured in g/20 min. Two types of de-icing agents were utilized in the experiment: one at dosages of 0.8 g, 1.2 g, and 1.6 g, and the other at dosages of 1 g, 1.5 g, and 2 g. Each dosage was evenly spread on ice block specimens of uniform thickness. The variations in melting rates across different dosages were carefully examined. To ensure the robustness of the findings, five parallel trials were conducted for each dosage. The resulting data were collated to establish the melting rates corresponding to the various dosages, as detailed in Table 6. Subsequently, a graphical representation illustrating the relationship between the melting rate and the dosage of the ice-melting agent was generated and fitted, leading to the creation of Figure 7.
Table 6.
Ice-Melting Rates of Different Mass Ice Melting Agents.
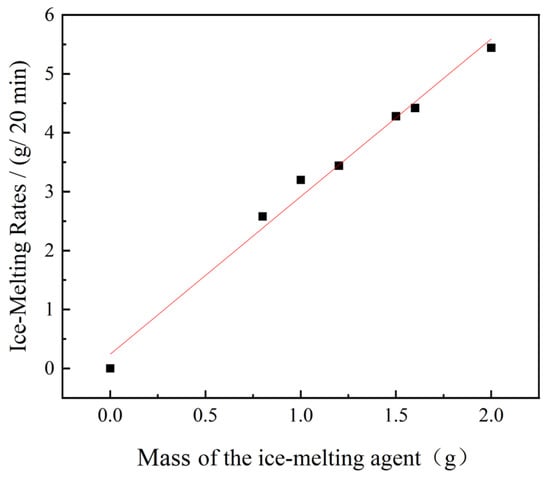
Figure 7.
Rate of ice melting varies with the mass of the melting agent.
Analysis of Table 6 and Figure 7 demonstrates a clear trend: as the mass of the ice-melting agent increases, the rate of ice melting also increases. Further analysis through function fitting indicates a direct linear relationship between the ice-melting rate at 20 min and the mass of the ice-melting agent. The linear dosage-response relationship (R2 = 0.98 in Figure 7) challenges nonlinear models proposed by Koefod [10], demonstrating that melting rate predictability holds across practical dosage ranges (0.8–2.0 g) at constant temperatures. Therefore, it can be inferred that the ice-melting rate escalates with higher dosages of the ice-melting agent.
3.2.4. Analysis of the Influence of Ice Layer Thickness on the Ice Melting Process
Ice block specimens of two different thicknesses (0.5 cm and 1 cm) were chosen for a study on the melting dynamics of ice layers under varying thickness conditions when exposed to an ice-melting agent, with the specimens placed at −10 °C. The rate of ice melt, measured in grams per 0.5 h, served as the primary metric for assessment. A uniform application of 1 g of MgCl2 ice-melting agent was applied to the surface of each ice block specimen to compare the melting rates between the two thickness variations. The findings are summarized in Table 7.
Table 7.
Ice-Melting Rates under Different Ice Layer Thicknesses.
Table 7 demonstrates consistent ice-melting rates of MgCl2 across varying ice layer thicknesses (0.5 cm vs. 1 cm) under standardized conditions (−10 °C, 1 g agent). The 0.5 cm specimens yielded an average rate of 6.04 ± 0.11 g/0.5 h (mean ± SD, CV = 1.89%), while the 1 cm specimens averaged 6.02 ± 0.09 g/0.5 h (CV = 1.48%), indicating a minimal difference of 0.33% (Δ = 0.02 g/0.5 h). One-way ANOVA confirmed this difference was statistically insignificant (F ≈ 0.063, p ≈ 0.808), demonstrating that ice layer thickness does not alter de-icing efficacy within the tested range.
3.2.5. Analysis of the Influence of Road Surface Types on the Ice Melting Process
This study focused on investigating the ice melting process on AC-20 asphalt concrete and C30 cement concrete surfaces, representing asphalt and cement pavement environments, respectively. The evaluation criterion was the amount of ice melted by a deicing agent within a designated time frame (measured in grams). A uniform application of 1 g of the deicing agent was administered to both the AC-20 and C30 specimens. Each 20 min segment constituted a testing phase. Ice blocks were positioned on the treated surfaces for assessment, alongside a control group for comparison. This experimental design facilitated the observation of the deicing agent’s melting efficacy over time across various pavement types. The outcomes are summarized in Table 8. Subsequently, the data from Table 8 were utilized to construct graphs illustrating the deicing agent’s melting rate progression over time for the three pavement types, as depicted in Figure 8.
Table 8.
Influence of Road Surface Type on Ice Melting Capacity.
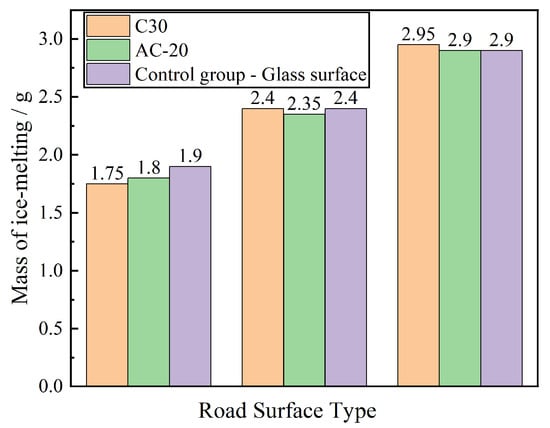
Figure 8.
Influence of Road Surface Type on Ice Melting Capacity.
Figure 8 illustrates that the ice-melting efficacy of the deicing agent on cement and asphalt pavements closely resembled that of the control group across three time intervals. Within the initial hour, the deicing agent melted 2.95 g of ice on cement pavement, compared to 2.90 g on both asphalt pavement and the control group, indicating a mere 1.7% disparity. These results suggest that the pavement type has no substantial impact on the deicing agent’s ice-melting efficiency.
3.2.6. Analysis of the Influence of Particle Size of De-Icing Agents on the Ice Melting Process
This study examines the impact of two de-icing agents, granular CaCl2 and flake-like CaCl2, on the melting of ice layers on road surfaces. Granular CaCl2 is characterized by small spherical particles ranging from 1 mm to 5 mm in diameter, as shown in Figure 9. In contrast, flake-like CaCl2 has an irregular morphology resembling flakes, with dimensions varying, and an overall size larger than granular CaCl2, with the longest side ranging from 5 mm to 8 mm.
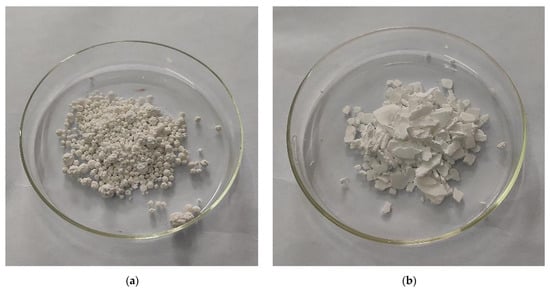
Figure 9.
Different particle sizes of CaCl2. (a) Granular CaCl2. (b) Sheet-like CaCl2.
The experiment assessed the ice-melting capacity of an ice-melting agent within a specified time frame, using grams as the measurement unit. Specifically, 1 g of the ice-melting agent was uniformly distributed onto the surface of ice block specimen No. 1. Each 20 min period constituted a testing phase. The investigation examined the variation in ice-melting rates over time for different particle sizes of the ice-melting agent, with outcomes detailed in Table 9. Subsequently, graphical representations illustrating the temporal evolution of average ice-melting masses for the two particle sizes of the ice-melting agent were generated, as depicted in Figure 10.
Table 9.
Influence of Ice-Melting Agent Particles on Ice Melting Capacity.
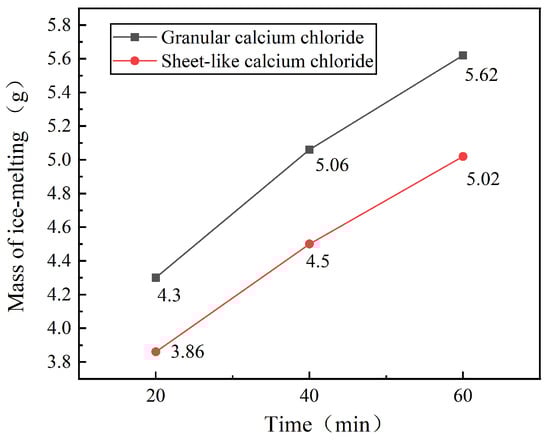
Figure 10.
Ice-melting capacity of different particle sizes of de-icing agents.
As evidenced in Figure 10, granular (finer-particle) CaCl2 consistently outperforms flake-like (coarser-particle) CaCl2 across all time intervals, exhibiting 11.3%, 12.4%, and 11.9% higher ice-melting mass at 20, 40, and 60 min, respectively. Statistical validation from repeated trials (Table 9) confirms this performance gap: granular CaCl2 melted 5.62 ± 0.17 g of ice after 60 min (mean ± SD, n = 5), significantly surpassing the flake-like variant (5.02 ± 0.25 g; p < 0.05, two-way ANOVA), while demonstrating superior consistency (average CV = 3.8% vs. 5.1%). These results quantify a 12% mean efficiency gain from finer particles—directly linking particle geometry to dissolution kinetics through increased surface-area-to-volume ratios [18]. Consequently, we infer that particle size significantly dictates de-icing efficiency, with finer particles yielding superior performance, providing a design basis for optimized formulations such as engineered microgranules.
4. Discussion
4.1. Phase Characteristics and Mechanisms of the Melting Process
This study systematically delineates the melting process of deicing agents into two distinct phases: the solid-phase melting stage (−20 min) and the salt-solution melting stage (>20 min). In the solid-phase melting stage, deicing agent particles come into direct contact with the ice layer, lowering the freezing point through ionic dissolution and promptly disrupting the ice structure. The melting rate in this phase surpasses that of subsequent stages, constituting more than 50% of the total melting mass. This observation is consistent with the findings of Li et al. [13], underscoring the essential role of rapid initial dissolution of deicing agents in facilitating efficient melting.
Upon reaching the salt-solution melting stage, the melting rate stabilizes and follows a linear trend. This suggests that the melting process during this stage is primarily governed by the diffusion of the salt solution and the continuous depression of the freezing point. This observation supports the “concentration-diffusion-driven melting model” proposed by SUGAWARA [1,2]. Specifically, once the solid deicing agent is completely dissolved, the concentration gradient of the solution becomes the main factor influencing the melting rate. Importantly, this study verified, through a control experiment conducted without the salt solution (refer to Table 3), that the melting effectiveness in the second stage is entirely dependent on the presence of the solution phase rather than the direct influence of any remaining solids. Unlike SUGAWARA’s concentration-diffusion model [1,2] that treated melting as a continuous process, our experimental validation of the decoupled thermodynamic phases (Table 3) provides the first mechanistic basis for stage-specific regulation. The solid-phase dominance (>50% mass melted in 20 min) necessitates rapid initial dispersion—an operational insight absent in existing guidelines.
4.2. Dominant Role of Temperature in Melting Performance
Temperature significantly influences the effectiveness of deicing agents. Studies have shown that as temperature decreases, the melting rates of all deicing agents decrease as well (see Figure 5). While temperature sensitivity is well-documented [5,8], our quantification of agent-specific decay rates (e.g., NaCl’s 42.4% drop from −5 °C to −25 °C vs. MgCl2’s 9%) reveals critical thresholds for agent switching. NaCl is particularly sensitive to temperature variations, with its melting rate decreasing from 9.73 g/h at −5 °C to 1.73 g/h at −25 °C, marking an 82.2% reduction. This finding aligns with Li et al.’s research [13], suggesting that conventional chlorides like NaCl lose efficacy due to solution freezing in low temperatures. Conversely, CaCl2 and MgCl2, which have higher dissolution heats (−81.3 kJ/mol and −74.5 kJ/mol, respectively), maintain melting rates of 6.47 g/h and 6.37 g/h at −25 °C, showcasing better performance in cold conditions. More significantly, we establish that MgCl2 maintains >6.37 g/h at −25 °C—exceeding NaCl’s peak efficiency and supporting its use as an environmentally preferable alternative in extreme cold.
4.3. Interactions of Multiple Factors and Engineering Implications
Deicing agent dosage: The melting rate exhibits a strong positive linear correlation with dosage (Figure 7). However, excessive application increases residual salt solution and exacerbates soil salinization [3]. Therefore, dosage should be dynamically adjusted based on temperature and ice layer thickness. For instance, increasing CH3COOK dosage from 0.8 g to 2.0 g at −10 °C enhances the melting rate by 110%, but care must be taken to avoid exceeding the optimal concentration (e.g., 8% CMA [6]).
Ice layer thickness: The melting rate difference between 0.5 cm and 1 cm ice layers is minimal (0.3%, Table 7), indicating that penetration depth is not a limiting factor for conventional ice thicknesses within this range. This finding directly supports the experimental results in Section 3.2.4, where no statistically significant impact was observed. Consequently, dosage regulation can prioritize temperature and agent type over ice thickness for layers up to 1 cm.
Road surface type: No significant difference in melting rate was observed between asphalt (AC-20) and cement (C30) roads (Figure 8), suggesting limited impact of road material on deicing agent diffusion. Nevertheless, the higher chloride corrosion risk of cement concrete must be noted [4].
Particle size: Granular CaCl2 (1–5 mm) exhibits an 11–12% higher melting rate than flake-like forms (5–8 mm) (Figure 10). Smaller particles provide a larger specific surface area, accelerating dissolution kinetics. This implies that optimizing formulation (e.g., crushing or granulation) can enhance melting efficiency.
4.4. Conflicts with Existing Norms and Optimization Directions
Current norms predominantly adopt an “empirical dosage + uniform concentration” standard, which conflicts with the dynamic patterns revealed in this study:
Temperature response missing: Norms fail to differentiate dosage requirements between moderate (−5 °C) and extreme low temperatures (−25 °C), leading to excessive application of inefficient agents (e.g., NaCl usage at −15 °C [5]).
Type differences ignored: Specific standards for advanced agents (e.g., MgCl2 with stable performance below −20 °C) are lacking, restricting low-corrosion alternatives.
Phase regulation gap: Distinctions between solid-phase (requiring rapid dispersion) and solution-phase (requiring sustained concentration) melting are overlooked.
To bridge these gaps, we propose a regulation framework integrating three experimentally validated principles:
Agent-type prioritization by temperature: Select chloride-free agents (MgCl2, CaCl2) for temperatures below −15 °C, where NaCl efficiency drops >80%.
Particle geometry optimization: Prefer granular over flaky forms to enhance dissolution kinetics (Section 3.2.6).
Phase-targeted dosing: Apply high initial doses for solid-phase dominance, followed by reduced maintenance doses aligned with solution-diffusion rates (Section 4.1).
This framework overcomes the limitations of static norms by leveraging stage characteristics and multi-factor interactions. Future field trials should quantify their environmental and operational benefits.
5. Conclusions
Through a systematic comparison of various snow removal methods and their respective capabilities, the following conclusions were drawn:
- (1)
- The ice-melting process of deicing agents exhibits distinct phases, which can be broadly categorized into two stages. The first stage is the solid-phase melting stage, lasting approximately 10 min; the second stage is the salt-solution melting phase, occurring after 20 min.
- (2)
- The ice-melting capacity of deicing agents increases with rising environmental temperatures and decreases as temperatures drop. Additionally, an increase in the dosage of the deicing agent accelerates the melting rate. During the solid-phase melting stage, the melting rate is directly proportional to the mass of the deicing agent. Notably, the thickness of the ice layer does not significantly influence the ice-melting process of the deicing agent.
- (3)
- Within the same time frame, NaCl demonstrates the best ice-melting performance at −5 °C. Below −5 °C, CaCl2 exhibits the greatest ice-melting depth and widest coverage area, achieving superior overall performance. MgCl2 ranks second in effectiveness, while NaCl and CH3COOK show relatively weaker ice-melting capabilities under these conditions.
- (4)
- For road applications, the optimal choice is a compound MgCl2 deicing agent with appropriately added corrosion inhibitors and smaller particle sizes. If rapid ice-melting is required, CaCl2 deicing agents are recommended due to their faster action. Conversely, if time is not a critical factor, NaCl deicing agents may be used as a cost-effective alternative.
5.1. Research Limitations
This study systematically quantified the stage characteristics and multi-factor interactions of de-icing agents, yet several limitations warrant acknowledgment:
Controlled Environment vs. Field Conditions: Experiments were conducted in low-temperature chambers with standardized ice specimens. Real-world variables (e.g., wind speed, traffic load, and fluctuating humidity) that impact ion diffusion kinetics and salt solution distribution were not simulated. For instance, wind-driven evaporation may alter solution concentration gradients, affecting the duration of the salt-solution melting phase.
Limited Temperature Extremes: The evaluation range (−5 °C to −25 °C) excludes ultra-low temperatures (<−30 °C), where thermodynamic properties of salt solutions (e.g., viscosity-driven diffusion suppression) may diverge significantly from the observed trends.
Environmental Impact Scope: While MgCl2’s stable performance supports its use as an eco-friendly alternative, long-term ecological effects (e.g., soil salinity accumulation, vegetation toxicity under repeated freeze–thaw cycles) were not quantified. The linear dosage-efficiency relationship (Section 3.2.3) implies higher environmental risks at elevated doses, yet cumulative soil/clay impacts remain unvalidated.
Synergistic Effects of Blended Agents: Although prior studies suggest blended agents (e.g., NaCl/CaCl2) enhance low-temperature efficacy, optimal ratios and ion-interaction mechanisms were not explored, limiting operational optimization.
5.2. Recommendations for Future Research
To address these gaps, future work should prioritize:
Field-Validated Dynamic Modeling: Incorporate real-time environmental variables (wind, humidity, solar radiation) into melting-stage kinetics. Develop predictive models for on-demand dosage adjustment using IoT-enabled road sensors.
Ultra-Low-Temperature Performance: Evaluate agent efficacy and phase transitions at <−30 °C, focusing on solution supercooling behavior and ice-recrystallization inhibition (e.g., via polymeric additives).
Long-Term Eco-Toxicological Assessment: Quantify agent-specific soil/water contamination thresholds (e.g., EC50 for vegetation) under cyclic freeze–thaw conditions. Correlate dosage-regulation strategies with environmental risk indexes.
Multi-Agent Synergy Optimization: Systematically screen blended formulations (e.g., acetate-chloride hybrids) for enhanced diffusion coefficients and reduced corrosion. Optimize particle geometry (Section 3.2.6) for controlled release in solution-dominant phases.
Advanced Material Development: Engineer nano/micro-encapsulated deicers with phase-targeted activation (e.g., rapid dissolution in solid-phase, sustained release in solution-phase) to minimize ecological footprint.
Author Contributions
Conceptualization, J.M.; methodology, J.M.; validation, J.M. and L.Q.; writing—original draft preparation, J.M.; writing—proofreading, J.M. and K.W.; writing—review and editing, W.W.; visualization, K.W.; project administration, J.Z.; funding acquisition, J.Z. All authors have read and agreed to the published version of the manuscript.
Funding
This research was funded by the Key Field Science and Technology Research Project of the Science and Technology Bureau of the Xinjiang Production and Construction Corps (Funder: Science and Technology Bureau of the Xinjiang Production and Construction Corps; Grant Number: 2021AB025).
Institutional Review Board Statement
Not applicable.
Informed Consent Statement
Not applicable.
Data Availability Statement
The data presented in this study are available in this article.
Conflicts of Interest
Author Lei Qu was employed by the Highway Science and Technology Co., Ltd. of Xinjiang Production and Construction Corps. The remaining authors declare that the research was conducted in the absence of any commercial or financial relationships that could be construed as a potential conflict of interest.
References
- Sugawara, M.; Sasaki, S.; Fujita, T. Melting of Snow by Aqueous Solution with Low Solidification Temperature. (2nd Report, Characteristic of Melting of Snow with Some Aqueous Solutions of NaCl, CaCl2, MgCl2). Trans. Jpn. Soc. Mech. Eng. Ser. B 1992, 58, 1832–1837. [Google Scholar] [CrossRef]
- Sugawara, M.; Konda, Y.; Fujita, T. Melting of snow by aqueous solution with low solidification temperature. An analysis on a melting model dominated by concentration diffusion for the same initial temperature of both CaCl2 aqueous solution and snow layer. Trans. Jpn. Soc. Mech. Eng. Ser. B 1990, 56, 3462–3467. [Google Scholar] [CrossRef][Green Version]
- Khrystych, O.V. Effect of deicing agents on the low-temperature performance of asphalt concrete under freeze-thaw cycling conditions. Mod. Technol. Methods Calc. Constr. 2024, 20, 171–176. [Google Scholar] [CrossRef]
- Zhou, P.; Wang, W.; Zhu, L.; Wang, H.; Ai, Y. Study on Performance Damage and Mechanism Analysis of Asphalt under Action of Chloride Salt Erosion. Materials 2021, 14, 3089. [Google Scholar] [CrossRef]
- Guo, Y.; Xiao, J.; Wen, S.; Lin, C. Experimental Study on Clay Erodibility Subjected to Freeze–Thaw and Varying Temperature Conditions through Hole Erosion Tests. J. Cold Reg. Eng. 2025, 39. [Google Scholar] [CrossRef]
- Klein-Paste, A.; Potapova, J. Thermal Aspects of Melting Ice with Deicer Chemicals. Transp. Res. Rec. J. Transp. Res. Board 2014, 2440, 69–75. [Google Scholar] [CrossRef]
- Wåhlin, J.; Klein-Paste, A. The effect of mass diffusion on the rate of chemical ice melting using aqueous solutions. Cold Reg. Sci. Technol. 2017, 139, 11–21. [Google Scholar] [CrossRef]
- Koefod, S. Accurate and Simple Prediction of Ice-Melting Capacity in Chloride Deicer Brine Blends. Environ. & Eng. Geosci. 2025, 31, 155–163. [Google Scholar] [CrossRef]
- Ma, H.; Yu, H.; Tian, J.; Tan, Y.; Da, B. The physical and mechanical properties of chloride-based deicers at 0∼−30 °C. Constr. Build. Mater. 2019, 211, 721–729. [Google Scholar] [CrossRef]
- Ge, Y.; Gong, G. Land surface insulation response to snow depth variability. J. Geophys. Res. Atmos. 2010, 115. [Google Scholar] [CrossRef]
- Alexander, P.; Gong, G. Modeled surface air temperature response to snow depth variability. J. Geophys. Res. 2011, 116. [Google Scholar] [CrossRef]
- Peng, X.; Frauenfeld, O.W.; Huang, Y.; Chen, G.; Wei, G.; Li, X.; Tian, W.; Yang, G.; Zhao, Y.; Mu, C. The thermal effect of snow cover on ground surface temperature in the Northern Hemisphere. Environ. Res. Lett. 2024, 19, 044015. [Google Scholar] [CrossRef]
- Li, P.; Yu, J.; Sun, H.; Zhang, Z. Evaluation of Snow Melting and Anti-Freeze Performance of Salt Storage Asphalt Mixture. In Proceedings of the 13th International Conference on Road and Airfield Pavement Technology, Beijing, China, 6–8 July 2023. [Google Scholar]
- Hosseini, F.; Hossain, S.; Fu, L.; Li, S.D. Effect of granularity of salt and pretreatment on deicing performance. In Proceedings of the Transportation Research Board 95th Annual MeetingTransportation Research Board 2016, Washington, DC, USA, 10–14 January 2016. [Google Scholar]
- Fu, Q.; Zhu, J.; Xue, Y.; Cui, Z. Size- and shape-dependent melting enthalpy and entropy of nanoparticles. J. Mater. Sci. 2016, 52, 1911–1918. [Google Scholar] [CrossRef]
- Fu, Q.; Cui, Z.; Xue, Y.; Zhu, J.; Guo, S. Size- and shape-dependence of the thermodynamic properties of nanocrystals. Mater. Chem. Phys. 2017, 202, 177–183. [Google Scholar] [CrossRef]
- Fu, Q.; Xue, Y.; Cui, Z. Size- and shape-dependent surface thermodynamic properties of nanocrystals. J. Phys. Chem. Solids 2018, 116, 79–85. [Google Scholar] [CrossRef]
- Wåhlin, J.; Klein-Paste, A. Chemical Melting of Ice: Effect of Solution Freezing Point on the Melting Rate. Transp. Res. Rec. J. Transp. Res. Board 2016, 2551, 111–117. [Google Scholar] [CrossRef]
- Achkeeva, M.V.; Romanyuk, N.V.; Frolova, E.A.; Kondakov, D.F.; Khomyakov, D.M.; Danilov, V.P. Deicing properties of sodium, potassium, magnesium, and calcium chlorides, sodium formate and salt compositions on their basis. Theor. Found. Chem. Eng. 2015, 49, 481–484. [Google Scholar] [CrossRef]
- Li, D.; Lin, Z.; Yu, J.; Liu, J.; Liu, Q.; Wang, Y.; Song, D.; Chen, R.; Wang, J. A lubricant-infused coating based on expandable microspheres and its multiple functions. Surf. Coat. Technol. 2024, 479, 130521. [Google Scholar] [CrossRef]
- Chen, Z.; Song, L.; Wang, Y.; Tao, H.; Liu, Z.; Wang, T.; Ye, F.; He, Y.; Lin, J. Air pocket-optimization strategy for micro/nanostructures fabricated by femtosecond laser technology for anti-icing performance improvement. Appl. Surf. Sci. 2024, 655, 159454. [Google Scholar] [CrossRef]
- Donadei, V.; Koivuluoto, H.; Sarlin, E.; Niemelä-Anttonen, H.; Varis, T.; Vuoristo, P. The effect of mechanical and thermal stresses on the performance of lubricated icephobic coatings during cyclic icing/deicing tests. Prog. Org. Coat. 2022, 163, 106614. [Google Scholar] [CrossRef]
- Brun, E. Investigation on Wet-Snow Metamorphism in Respect of Liquid-Water Content. Ann. Glaciol. 1989, 13, 22–26. [Google Scholar] [CrossRef]
- Yamazaki, T.; Kondo, J.; Sakuraoka, T.; Nakamura, T. A one-dimensional model of the evolution of snow-cover characteristics. Ann. Glaciol. 1993, 18, 22–26. [Google Scholar] [CrossRef]
- Sannapareddy, A.; Anil Kumar, E. Comparative performance assessment of different halide composites in sorption cooling system: A dynamic approach. Therm. Sci. Eng. Prog. 2024, 55, 103001. [Google Scholar] [CrossRef]
Disclaimer/Publisher’s Note: The statements, opinions and data contained in all publications are solely those of the individual author(s) and contributor(s) and not of MDPI and/or the editor(s). MDPI and/or the editor(s) disclaim responsibility for any injury to people or property resulting from any ideas, methods, instructions or products referred to in the content. |
© 2025 by the authors. Licensee MDPI, Basel, Switzerland. This article is an open access article distributed under the terms and conditions of the Creative Commons Attribution (CC BY) license (https://creativecommons.org/licenses/by/4.0/).