Abstract
Demand electrification is creating new operating conditions in distribution networks—such as congestion, overloads, and voltage issues—that have traditionally been addressed through network expansion planning (NEP). As an alternative, this work proposes the use of non-wire alternatives (NWAs) based on hybrid photovoltaic–storage (ESS) plants and analyzes their siting and sizing under uncertainty conditions. To this end, a MINLP model with a DistFlow representation is formulated to determine generation and storage locations and capacities, minimizing investment while satisfying current and voltage limits. Different uncertainty management methodologies are compared: robust optimization, equivalent probabilistic profile, weighted multi-scenario, and multi-scenario with penalty. The results on the CIGRE MV network show that the robust approach guarantees feasibility in the worst case, albeit with a high investment cost. In contrast, methods based on averages or simple weightings fail to adequately capture adverse conditions, while the multi-scenario optimization with expected penalty emerges as the most effective option, balancing investment and overload reduction. In conclusion, the explicit consideration of uncertainty in NWA planning is essential to obtaining realistic and adaptable solutions, with the expected penalty formulation standing out as the most efficient alternative for network operators.
1. Introduction
In current electrical systems, the growth of demand electrification [1], driven by the increase in electric vehicles, climate control systems, and data centers [2], is creating new operational conditions on the grid. This is leading to the emergence of novel challenges that were not anticipated during the original design of the electrical infrastructure, such as line congestion, transformer overloads, and voltage issues.
Traditionally, issues related to grid congestion, increasing electricity demand, and the need to enhance supply reliability have been addressed through network expansion planning (NEP) [3,4]. These plans typically involve conventional infrastructure solutions such as the construction of new transmission lines, the development of additional substations, or the reinforcement of existing assets. In this context, the most recent studies address multistage planning to upgrade and expand the network, as in [5], where reliability assessment is also incorporated. The N-1 security criterion is applied in [6] to develop the expansion plan. In the work presented in [7], current relevant issues such as energy storage systems (ESSs) and electric vehicle (EV) charging stations are considered for network expansion planning. Similarly, as shown in [8], ESSs are used in the expansion plan to support the integration of generation.
Although NEPs have proven effective over the years in solving grid-related problems and ensuring the reliable operation of the power system, such solutions often entail high investment costs for the Distribution System Operator (DSO), long implementation timelines, and potentially significant environmental and social impacts in the construction of new transmission lines. In response to these challenges, new approaches have emerged within the concept of non-wire alternatives (NWAs) [9], which encompass technologies and operational strategies aimed at avoiding, deferring, or reducing the need for physical grid expansion. The two main categories of strategies involve the deployment of distributed resources [10] and the implementation of demand-side management techniques [11].
There is an emerging field in NWAs related to mobile resources. In [12], by coordinating the flexibility of building HVAC systems and electric buses, it is possible to address localized issues in the network. In [13], the use of mobile energy storage systems (MESSs) is proposed to enhance the resilience of distribution networks against extreme events through their deployment. As described in [14], MESSs enhance the resilience of distribution networks against extreme events and support rapid supply restoration. In [15], mobile batteries were used to reduce energy losses and minimize voltage deviations. The work developed in [16] proposes a collaborative electric vehicle charging approach that reduces network congestion, flattens the load curve, and minimizes the total energy cost for users.
Focusing on the area of NWAs that utilize DERs strategically located in the network to help solve grid issues, two main approaches can be identified: the DSO perspective and the objective of investors. In [17], the use of energy storage systems (ESSs) owned by the Distribution System Operator (DSO) is studied to address network problems, identifying relevant applications and evaluating battery performance. The objective is to quantify the economic benefits for the operator. Similarly, aligned with the DSO’s interests, the study in [18] shows that hybrid solar generation and storage plants can lead to reduced investment costs in NWAs. In [19], a bilevel optimization approach is proposed to evaluate distributed resources as NWAs, ensuring an economic return for investors while minimizing operational costs for the DSO. In [20], the economic perspective is also considered to determine the optimal placement and integration of resources into the network.
One of the most relevant aspects in power system planning, whether for NWAs or expansion plans, is the uncertainty associated with demand growth and renewable resource variability since the viability of the proposed solutions largely depends on it [21,22]. In this context, different analytical approaches are applied, among which robust optimization and stochastic optimization are the most prominent. In robust optimization, decisions are made based on the worst-case scenario, which is taken as the reference [23,24]. Conversely, stochastic optimization relies on a set of possible scenarios, with decisions driven by their respective probabilities of occurrence [25,26].
Despite the relevance of this topic, there are few methods in the state of the art that incorporate stochastic models, highlighting a gap in the literature that remains to be addressed. The most notable study in this area is [27], which evaluates the value of ESSs under long-term demand uncertainty conditions to address issues arising in the grid. In [28], the authors focus on the combination of photovoltaic (PV) generation and demand response (DR) as NWAs in various uncertainty scenarios, highlighting the importance of appropriately selecting the NWA mix based on the evolution of different load scenarios. The absence of methodologies that implicitly incorporate uncertainty in the study of NWAs highlights the need to adopt approaches capable of addressing the variable conditions of real-world scenarios to solve network problems. Techniques such as stochastic and robust optimization enable the development of more realistic solutions applicable to uncertain situations, making it important to promote their use in the analysis of NWAs.
This work presents a review of methods for addressing uncertainty in the deployment of non-wire alternatives (NWAs), which involve fixed costs in uncertain scenarios. Building on this, it develops a planning model for NWAs based on the integration of hybrid photovoltaic–storage plants, formulated as a MINLP problem with a DistFlow representation to realistically capture network constraints. On this basis, a systematic comparison of optimization methodologies under uncertainty conditions was conducted to evaluate their implications in terms of investment—mainly driven by fixed costs (CAPEX)—technical feasibility, and computational time. The main contributions can be summarized as follows:
- A detailed assessment of robust, probabilistic, weighted multi-scenario, and multi-scenario with penalty approaches was carried out for a fixed sizing and location, an aspect that has been little explored in the literature.
- The formulation of multi-scenario optimization with expected penalty is introduced, balancing investment and risk while demonstrating improved technical and economic performance in the case study.
- The validation on the CIGRE MV European network demonstrates the practical applicability and comparability of the results, facilitating their extrapolation to other distribution networks.
The structure of the article is organized as follows. Section 2 presents the general formulation for the siting and sizing of hybrid plants combining photovoltaic generation and storage, based on problematic demand profiles, photovoltaic resource availability, and technology costs. Section 3 reviews the main methodologies used to address uncertainty in this type of problem. Section 4 describes the case study, and Section 5 presents the results obtained from applying the uncertainty-handling methodologies to the proposed case. Finally, Section 6 outlines the main conclusions of this work.
2. Hybrid NWA Planning Model
This section presents a general model [18] for the siting and sizing of hybrid photovoltaic generation resources with integrated storage, intended to function as non-wire alternatives (NWAs). The problem is formulated as a Mixed-Integer Nonlinear Programming (MINLP) model since a nonlinear network representation is necessary to accurately capture line congestion effects. In addition, binary variables are required to support decision-making regarding the selection and placement of generation and storage assets. Table 1 summarizes the parameters and variables used in the formulation of the optimization problem.

Table 1.
Nomenclature.
The input data required for the NWA planning model are divided into two categories. First, the topological information and electrical parameters of the network under study (, ) must be specified. Additionally, the admissible current limits on the lines () and the voltage limits at the nodes () are required as violations of these constraints define the network issues to be addressed. The model also requires the photovoltaic generation availability profile () and the demand profiles at the nodes (), which represent the main sources of uncertainty. In contrast, the installation costs of generation and ESSs are assumed to be deterministic as these prices are typically known with sufficient accuracy at the time of project execution.
Based on this data, the optimization model determines the optimal location and combination of photovoltaic generation as the primary resource, together with ESSs to address network issues through power injections. The objective is to minimize the total investment cost required to resolve these issues. The outputs of the method include the location of the resources (), the required installed capacities (, ), and the corresponding operational strategy of the assets.
Thus, the objective function, which aims to minimize the total cost of the solution, is defined as
where the main decision variables are the size and location () of the PV generation and the size and configuration of the ESS (,) in the hybrid plant.
The DistFlow model [29] is used to represent the electrical network. This formulation provides an accurate representation of power flows in radial distribution networks, capturing the nonlinear relationships between voltage, power, and current. Equations incorporate the variables associated with non-wire alternatives.
The active and reactive power balance at each node are represented by Equations (2) and (3), which include the injections from the hybrid plant. Equations (4) and (5) define the voltage and current through the lines, respectively. Finally, constraints (6) and (7) define the voltage and current limits.
The equations associated with PV generation are described below. The minimum and maximum generation capacity that can be installed are constrained by Equation (8). The active power output is defined based on resource availability, as expressed in Equation (9).
To form hybrid plants with storage and a generation source, binary decision variables are used, as defined in Equation (10). The installation of the storage system is only possible if the generation source has been previously installed.
The active and reactive power at the point of interconnection (POI) between the hybrid plants (or generation units) and the network are defined by Equations (11) and (13). The total active power, , is calculated as the net balance between generation, battery charging, and discharging. This variable is constrained to be non-negative as the battery can only be charged using energy from the generation source, not from the grid, as described by Equation (12). The total reactive power, , is determined as a function of the total active power injected at the POI.
The size of the ESS is related to the installed photovoltaic capacity according to Equation (14), limiting the maximum power to that of the associated resource. The constraints for defining the power and energy capacity of the ESS are expressed in Equations (15) and (16), respectively. The maximum charging and discharging power are modeled in Equations (17) and (18), and the constraint to prevent simultaneous charging and discharging is defined in Equation (19). The state of charge update is given in Equation (20), and Equation (21) sets the minimum and maximum state of charge limits to ensure safe battery operation.
3. Uncertainty in NWA Planning
Investment planning in generation resources or hybrid plants conceived as NWAs focuses on fixed costs (CAPEX). Addressing uncertainty in this type of problem involves specific challenges. Since operating costs are almost negligible (except in cases of demand response or controllable generation). For a case such as the one described, the objective is to obtain a single set of asset location and sizing decisions (, , ), regardless of the scenarios considered or the range of uncertainty.
As a result, all decisions must be taken in advance under incomplete information conditions. Once executed, these decisions are difficult to reverse, which makes it essential to ensure robustness against a wide range of possible future scenarios. In this context, optimization methodologies under uncertainty conditions become crucial, providing a structured way to evaluate and manage risk while enabling more reliable and resilient investment decisions in uncertain environments. The main optimization techniques under uncertain conditions applicable to this type of problem are described below.
3.1. Robust Optimization
Robust optimization [30,31,32] ensures decision feasibility against any realization of uncertain parameters within a predefined range, without relying on scenario definition or probability assignment. By explicitly addressing the worst case within the uncertainty set, it provides resilient planning that guarantees technical constraints even under extreme conditions.
From an economic perspective, robust optimization generally leads to more conservative decisions, which often translates into higher initial CAPEX, due to the need to guarantee feasibility under worst-case conditions, regardless of the probability of such a worst case occurring.
Formulation
The formulation of robust optimization is based on defining an uncertainty set , which represents all possible realizations of the uncertain parameters that directly affect the model decisions. Thus, the adapted objective function is defined as
The uncertainty set is constructed from the lower and upper bounds established for the uncertain parameters of the system. This approach allows for a realistic representation of the temporal and spatial variability of demand without the need to assume probabilistic distributions. The constraint equations are modeled as
where represents the parameters that define the constraints and that depend on the uncertainty of the parameters. The vector groups the decision variables that may be influenced by uncertainty, such as the sizes of the generation or storage facilities for the model described in Section 2, while contains the independent terms of the constraint equations.
For the analysis of resources such as NWAs, robust optimization can be formulated for the worst-case scenario of network demand parameters and the worst-case scenario of generation. This identifies the most critical issues in the network (since higher demand usually leads to greater problems) that must be addressed for the least favorable generation availability.
3.2. Deterministic Optimization in Probabilistic Scenarios
Deterministic optimization in probabilistic scenarios is formulated as an approach in which uncertainty is not explicitly modeled through multiple scenarios but instead synthesized into a single representative scenario. This scenario is constructed by weighting the different possible demand (or generation) profiles according to their probabilities of occurrence, thereby generating an average or expected projection of system behavior. In this way, the optimization problem is formulated deterministically, simplifying its resolution and reducing computational complexity while still incorporating relevant information about demand variability. This approach is particularly useful when the objective is to obtain an efficient and practical solution that reflects the most likely operating conditions of the system, without the need to explicitly model the full set of scenarios.
3.3. Formulation
The formulation of deterministic optimization in probabilistic scenarios is based on the construction of an equivalent scenario that aggregates variability from all possible realizations:
where denotes the uncertain profile in period t corresponding to scenario s, with representing its probability of occurrence. The equivalent deterministic demand profile is thus obtained as the probability-weighted average.
3.4. Multi-Scenario Optimization
A conceptually close alternative to robust optimization, but one that can lead to different decisions in terms of investment, sizing, and siting, is the multi-scenario approach [33,34,35,36]. This type of model is suitable when a finite set of scenarios is available, each representing a possible realization of uncertain variables such as demand or generation. No probabilities are assigned to the scenarios, and all of them are treated with equal importance. The objective is to find a single investment solution that remains valid and feasible across all defined scenarios. Thus, it is possible to capture the worst-case scenario when multiple scenarios are available, rather than a range where the parameters vary with uncertainty.
Formulation
The multi-scenario formulation uses the same objective function as the one defined in (1) to minimize the total cost of the NWA solutions since a single sizing is applied across all the considered scenarios. The constraints of the model, including those of the DistFlow network model, are replicated for each available scenario to capture the influence of uncertainty. Mathematically, this adaptation is expressed as
where represents the parameter matrix that defines the structure of the constraints for each scenario s. This includes equations such as power balance, voltage definition at the nodes, and sizing of generation and storage. In turn, represents the independent terms in the constraint equations for each scenario s, and is defined as the decision variable vector, which includes the variables listed in Table 1 but replicated for the entire set of stochastic scenarios considered. Thus, each variable will take a different value depending on the scenario being solved.
The multi-scenario approach provides a practical framework to address uncertainty in system planning by enforcing a single solution that remains feasible across all predefined scenarios. While it does not rely on probabilistic modeling, it offers a flexible compromise between robust performance and economic efficiency. Crucially, the degree of conservatism in the final solution is directly influenced by the choice and severity of the included scenarios.
3.5. Weighted Multi-Scenario Optimization
In this approach, the objective is to obtain an average sizing based on the available scenarios S and their associated probabilities . This is based on the use of probabilities to weight the operating costs of different scenarios but applied to sizing [37,38,39,40]. The optimization problem is formulated independently for each scenario, allowing the sizing of generation and storage resources to adapt to the specific conditions of each case. All technical constraints are imposed on a scenario-by-scenario basis. Once the optimal solutions for the set of scenarios are obtained, the resulting investments are evaluated through a weighted sum, where the contribution of each scenario is scaled according to its probability of occurrence.
This formulation does not enforce a common design across scenarios but provides insight into the sizing and expected cost under uncertainty conditions. It serves as a useful reference for analyzing how different levels of uncertainty affect infrastructure needs and investment strategies. For this uncertainty-based optimization model, it is necessary to assume that the installation locations are the same across all scenarios. This constraint ensures that the installed capacities, although sized independently per scenario, are comparable and can be meaningfully aggregated or weighted according to scenario probabilities
Formulation
The formulation of weighted multi-scenario optimization is based on considering the set of scenarios S, which represents all possible realizations of the uncertain parameters that directly affect the model decisions. Thus, the adapted objective function is defined as
where the expected investment cost is minimized according to the probability of each scenario. This method relies on the cost of the solution for two main reasons: first, because minimizing investment in NWAs is the primary objective, and second, due to the impossibility of computing an average installation directly as different types of assets are involved. The average sizing must therefore be calculated after obtaining the results of the optimization. The constraints are modeled as in (25), complemented by an additional constraint that enforces installation at the same locations (and associated storage) across all scenarios:
This model does not impose common decisions across scenarios, allowing the optimal behavior of each scenario to be analyzed individually and enabling the calculation of a weighted expected sizing. The average size is calculated once the solution has been obtained since a single overall sizing must be determined. The calculation of the average generation and storage sizes is performed according to the following set of equations:
3.6. Multi-Scenario-Based Optimization with Expected Penalty
In this approach, the objective is to determine a single sizing solution by considering the set of available scenarios S and their associated probabilities . Unlike approaches that compute an average sizing across scenarios, here the probabilities are used to weight the expected cost of failing to resolve network overloads. The optimization problem is formulated by enforcing all technical constraints on a scenario-by-scenario basis and introducing slack variables to capture possible violations. These violations are penalized in the objective function according to their magnitude and probability of occurrence, such that the investment in generation and storage balances the capital expenditures (CAPEX) with the expected risk of overloads in the distribution network.
Formulation
The formulation of the multi-scenario optimization with penalties is based on considering the set of scenarios S and incorporating penalties associated with the violations that may arise in the resolution of overloads. In this way, a single sizing solution is obtained that balances the investment required to eliminate all violations with the expected cost derived from allowing certain violations in specific scenarios. The objective function is expressed as
where w represents the equivalent cost of the overload, defined as the total investment required to resolve all overloads divided by their total value:
In the optimization problem, constraint (6) is modified and specified as follows for each scenario:
where the slack variable is incorporated into the current limits to allow them to be exceeded if necessary. In addition, an additional Equation (37) can be introduced to restrict the maximum amount by which the current limits can be exceeded ().
The inclusion of slack variables and their probability-weighted penalization makes it possible to quantify the expected cost of violating operational limits, providing flexibility to the model and allowing the capture of low-probability situations without excessively conditioning the investment decision.
3.7. Chance-Constrained Optimization
The chance-constrained approach [41,42,43] is conceptually related to the multi-scenario formulation. If the scenarios are associated with a probability of occurrence, the model allows for the adoption of a partial coverage criterion: instead of requiring the solution to be feasible in all considered scenarios, a minimum threshold of cumulative probability is defined. Thus, the scenarios that represent a predetermined coverage percentage are included. This allows the planner to decide how much uncertainty to accept as the maximum level of risk.
Formulation
The formulation is similar to the multi-scenario method, with the objective function and constraint equations replicated for each scenario, but it must satisfy the following condition:
where the probability of all selected scenarios is greater than or equal to a predetermined ratio . The selection of scenarios can be carried out either by the optimization model, penalizing certain scenarios, or by the operator, who manually analyzes the scenarios. This approach ensures that the solution remains valid under a significant portion of possible future conditions, without requiring the model to optimize scenario selection.
4. Test Case
To analyze and compare the performance of different techniques for handling uncertainty, the CIGRE medium-voltage (MV) distribution network benchmark, in its European configuration, is used as a case study, as shown in Figure 1. This schematic also illustrates the existing issues within the network. The minimum voltage limit is set at 0.90 pu, based on the IEC 60038 standard for medium-voltage systems. Information on the nominal power, location, and type of loads is provided in [44]. Initially, the network does not include any distributed generation resources. Table 2 presents the ampacity ratings of the distribution lines, while their resistance and reactance values can also be found in [44].
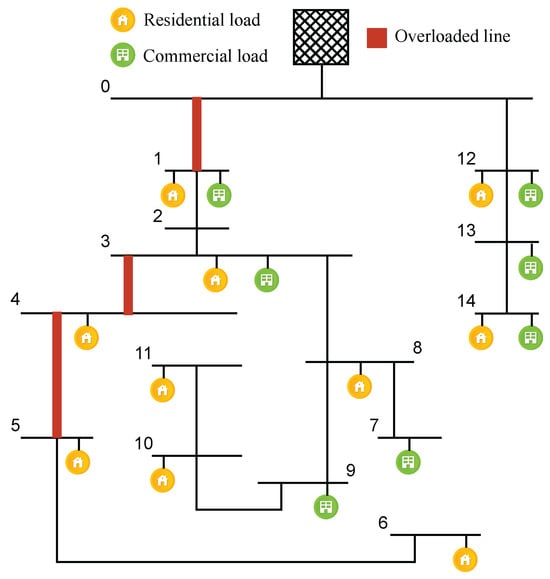
Figure 1.
European 15 node test CIGRE MV distribution system with the problems identified.
Table 2.
Line ampacity ratings.
The consumption profiles used are based on those described in [45], specifically for a winter period, which is the time of highest consumption and, therefore, when the most problems may arise. Figure 2 shows the profiles of residential and commercial use (a). The availability profile of photovoltaic generation considered for installation is also shown (b). A daily profile is presented, which is considered the typical generation pattern for winter and, for simplicity, is repeated cyclically throughout the entire analyzed period. These are the two uncertain parameters considered in this study. A total of five representative days are considered: three weekdays and two weekend days (Saturday and Sunday). The analysis is carried out with hourly resolution. In total, the analysis period is defined as the set , based on hourly data sampling.
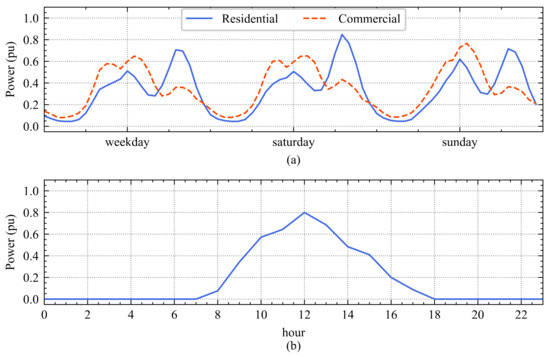
Figure 2.
Evolution profiles for each type of load per day (a) and hourly availability of PV resource (b).
To account for demand uncertainty, two demand evolution scenarios have been defined. Each scenario introduces additional network issues compared to the previous ones due to variations in demand levels. Scenario , with the highest probability of occurrence (90%), results in overloads on lines 0–1 and 3–4. Scenario , which increases the load by 6% compared to scenario and is associated with a 10% probability, causes overloads on lines 0–1, 3–4, and 4–5. The increase in demand results in higher overloads and the congestion of an additional line. Table 3 summarizes the issues identified in each scenario, indicating the time periods during which they occur and the magnitude of the overloads. For PV generation, two scenarios are considered: a base case, (Figure 2b), with a 90% probability (base case), and a second scenario () with a 10% probability. In scenario , resource availability is reduced by 10% compared to scenario to account for a significant deviation of the primary resource, which is essential for problem resolution. These scenarios are used for stochastic optimization and also serve to define the uncertainty bounds for robust optimization.
Table 3.
Value of currents (A) above the limit for each hour in overloaded lines.
The input data, such as electricity demand and the availability of renewable generation resources, are represented by independent scenarios with uncertainty, probability, and no correlation. Therefore, it is necessary to generate a combined set of scenarios. The combined set is defined as and includes all possible combinations. The joint probability of each combination is calculated as the product of the individual probabilities. Table 4 presents the possible combinations and their corresponding joint probabilities.
Table 4.
Combined demand and generation scenarios with joint probabilities.
The project analysis is conducted over a 25-year planning horizon, where the investment costs considered are 758,000 EUR/MW for photovoltaic generation and 258,000 EUR/MW and 242,000 EUR/MWh for the power and energy capacities of the ESSs, respectively [46,47]. The ESS cost is increased by 20% to cover degradation and mid-life refurbishment, ensuring it maintains capacity and reliability throughout the project horizon.
5. Results and Discussion
This section presents the main results obtained from the application of most relevant methods that account for location and sizing uncertainty in hybrid solar generation plants. The optimization problems were solved using the GAMS software package, with MINLP solvers such as KNITRO and DICOPT. All computations were performed on a PC equipped with an Intel i7-1065G7 processor running at 1.3 GHz, 8 GB of RAM, and the Windows 10 operating system.
5.1. Deterministic Optimization Results
In this section, the siting and sizing problem is solved deterministically, assuming that the demand profile with a probability of 90% and the generation profile with the same probability will occur. Therefore, the scenarios considered are those with the highest associated probability.
In Table 5, the economic and sizing results obtained are shown, resulting in a total investment in assets of EUR 3.54 million. Storage plays a fundamental role, with the same capacity being installed as generation, with a ratio of more than 2 h of energy.
Table 5.
Investment and total sizing results obtained in the deterministic optimization.
Table 6 shows the results of installed sizes at the nodes. The largest installation occurs at node 5, with 0.7 MW of generation and a storage system configured as 0.7 MW/1.47 MWh.
Table 6.
Results of sizing for deterministic optimization.
5.2. Robust Optimization Results
For the robust optimization case, coinciding with the multi-scenario analysis, the case of highest demand and lowest generation availability is chosen. These constitute the worst-case scenario that may occur.
The economic and sizing results obtained are shown in Table 7. To solve problems in the event that the worst-case scenario occurs, an investment of EUR 5.4 million is required, which represents EUR 1.8 million more compared to the deterministic scenario. This is due to an increase in the required sizes, with a generation of 3.19 MW and a storage configuration of 3.14 MW/6.89 MWh.
Table 7.
Investment and total sizing results obtained in the robust optimization.
The installation takes place at fewer nodes than in the previous case, but with larger sizes, with the largest installation located at node 5 together with the largest storage system associated with this generator. The second largest installation is located at node 10. This can be observed in Table 8.
Table 8.
Results of sizing for robust optimization.
5.3. Probabilistic Scenario Optimization Results
The results in this section are determined by the way demand and generation inputs are represented, modeled through two scenarios with different occurrence probabilities. From these, a unified probabilistic profile is constructed, enabling their analysis within a single equivalent scenario. This approach aims to obtain results based on a probabilistic profile of demand and generation, rather than relying solely on a purely deterministic or robust analysis.
The results presented in Table 9 show a slightly higher investment compared to the deterministic case, where the 90% probability profile was considered as secure. A significant increase in investment is observed with respect to the robust case, which accounted for the most unfavorable scenario with a 10% probability of occurrence.
Table 9.
Investment and total sizing results obtained in the probabilistic scenario optimization.
As shown in Table 10, intermediate sizes are obtained with respect to the deterministic and robust cases as a consequence of their probabilistic profile. The largest installation is located at node 5, consisting of a 1.19 MW generator and a storage system sized at 1.19 MW/2.46 MWh. This represents an increase in the power capacity of 70% compared to the deterministic case but a decrease of 20.67% compared to the robust case. In terms of investment, the increase compared to the deterministic case is 4.8% higher and 31.3% lower than in the robust case.
Table 10.
Results of sizing for probabilistic scenario optimization.
5.4. Weighted Multi-Scenario Optimization Results
The objective of this scenario is to determine a sizing weighted according to the scenarios and their associated probabilities. Instead of computing a single sizing solution valid for all scenarios, the asset sizes are calculated individually while keeping the same locations fixed. The aim is to obtain an average sizing that can perform reasonably well across all cases.
Table 11 presents the total investment results for each scenario individually. As expected, the most unfavorable scenarios, such as S2 and S3, require larger investments and asset sizes.
Table 11.
Investment and total sizing results obtained in the multi-scenario weighted optimization.
The sizes associated with each scenario, located at the common nodes, are shown in Table 12. These sizes are used to compute a weighted average according to the probability of occurrence of each scenario to obtain an average sizing. It can be observed once again that, in the most unfavorable scenarios, despite their low probability, the largest installations are carried out at the nodes.
Table 12.
Results of sizing DERs and ESSs for weighted multi-scenario optimization.
Using the previous sizes and averaging them with the information from Table 4, the resulting sizes are obtained as shown in Table 13. This corresponds to an investment of EUR 4.39 million, which represents 18.33% more than in the case of probabilistic profiles.
Table 13.
Results of DER and ESS sizing averaged by probability.
5.5. Multi-Scenario-Based Optimization with Expected Penalty
This section presents the results of applying the single-sizing technique with a penalty for overload violations across all possible scenarios. To define w, the equivalent cost of the overload, the total cost obtained from the robust method is considered together with the total amount of overloads for the most critical line, line 0–1. This makes it possible to decide whether it is preferable to install additional generation to resolve all issues or to allow certain overloads that reduce the total investment. As a constraint, it is also established that at most 25% of the initial overloads per scenario are allowed.
Table 14 presents the investment results obtained with this method and the total installed capacity of generation and storage assets. The total investment, EUR 4.56 M, is similar to the case of weighted multi-scenario optimization, which considers the same scenarios and probabilities but applies a different formulation.
Table 14.
Investment and total sizing results obtained in the multi-scenario-based optimization with expected penalty.
As shown in Table 15, the largest installation occurs at node 5, with 1.04 MW of generation and a storage configuration of 1.04 MW and 2.39 MWh. This node also hosts the largest capacity in both the robust case and the probabilistic profile case. The second largest installation is at node 11, with 0.73 MW of generation and storage of 0.73 MW and 2.26 MWh.
Table 15.
Results of sizing for multi-scenario-based optimization with expected penalty.
5.6. Comparison and Evaluation of Optimization Techniques Under Uncertainty Conditions
In this section, the different optimization techniques are compared across the various scenarios. First, the previously presented methods are evaluated in terms of how they address the problems in the worst-case scenario and their violation rates. The robust optimization meets the requirements without any issues. Figure 3 illustrates the evolution of the currents along the originally overloaded line 0–1 and how the problems are corrected according to each methodology.
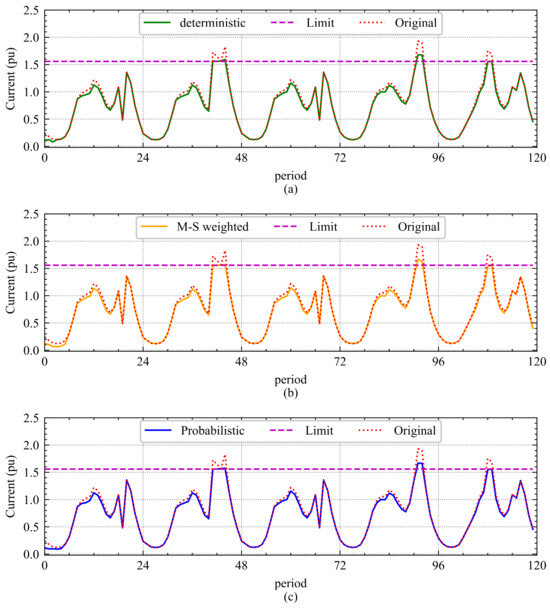
Figure 3.
Current evolution in line 0–1 for deterministic optimization (a), weighted multi-scenario optimization (b), and probabilistic profile optimization (c).
As can be observed, the model that performs worst in the most adverse scenario is the deterministic one. It exhibits overloads in 5 out of the 8 h of the analysis period, with a total deviation of 544.15 A, since it only considers the most likely demand and generation scenario. In contrast, when all scenarios are taken into account, the weighted multi-scenario optimization results in a deviation of 454.08 A, while the probabilistic scenario approach achieves a deviation of 413.63 A. Considering that the initial total overload on line 0–1 was estimated at 453.78 A for the entire period, only the probabilistic scenario approach is capable of mitigating some of the issues arising in the worst-case scenario, achieving a reduction of 8.84%.
Regarding the computation times for obtaining the optimal solutions, the deterministic case required 90.28 s, the multi-scenario case 1865.86 s, and the probabilistic profiles case 63.60 s. The major difference arises in the multi-scenario case, which requires a significantly longer solution time (almost 30 times more) to obtain a worse solution than that achieved with the probabilistic scenario approach.
By analyzing in detail the results obtained with the multi-scenario-based optimization with expected penalty, it can be observed in Figure 4 that this method provides the best correction in the worst-case scenario among all approaches (excluding the robust case). This is achieved by setting a maximum violation of 25% per scenario and considering the total cost obtained from the robust optimization result. By applying the probabilities of each scenario, the total deviation in amperes for line 0–1 amounts to 292.21 A, representing a 35.60% reduction. The solution time for this optimization is 668 s.
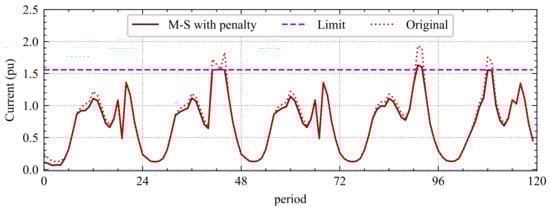
Figure 4.
Current evolution in line 0–1 for multi-scenario-based optimization with expected penalty.
In terms of performance, this option proves to be the most attractive, as confirmed by the obtained results, since it incorporates all scenarios with their respective probabilities and additionally assigns a cost to the non-fulfillment of overload mitigation, enabling a direct comparison with the investment.
Table 16 presents a summary of the different methods for considering uncertainty in the optimization model, comparing investment, solution time, and reduction rate of the maximum line current (negative value is considered an increase). The deterministic case is included to highlight the risk of addressing uncertainty problems solely through the most likely case.
Table 16.
Summary method comparison.
The results show that the way uncertainty is handled decisively affects investment, technical performance, and computation time. Multi-scenario optimization with expected penalty emerges as the most attractive compromise: it integrates all realizations with their associated probabilities, internalizes the cost of violations, and directs capacity to the locations with the greatest impact on mitigation, achieving significant reductions in overload with intermediate investment efforts and reasonable solution times.
6. Conclusions
The increasing need to reduce network reinforcement investments and efficiently integrate renewable resources highlights the role of distributed energy resources (DERs) as non-wire alternatives (NWAs) to alleviate overloads and operational issues in stressed distribution grids.
This paper proposes an MINLP-based methodology for the optimal siting and sizing of hybrid photovoltaic–storage plants, minimizing total investment while accounting for solar availability and battery flexibility in both power and energy. The framework integrates multiple optimization approaches under uncertainty conditions, including deterministic, robust, probabilistic, and multi-scenario formulations.
The results indicate that robust optimization guarantees feasibility under worst-case conditions but leads to significant oversizing and high investment costs. In contrast, deterministic and weighted average approaches reduce investment but may fail to prevent violations in adverse scenarios, potentially compromising network security.
The multi-scenario optimization with expected penalty emerges as the most balanced solution. By incorporating all scenarios with their probabilities and translating violations into expected costs, it achieves a single sizing solution that significantly mitigates critical overloads while maintaining intermediate investment levels and reasonable computational times. This approach offers a practical trade-off between robustness, economic efficiency, and computational feasibility.
A key conclusion is that appropriately sizing storage in both power and energy reduces the additional generation capacity required and moderates total investment compared to robust solutions, while ensuring network security.
Future research will focus on multi-year analyses according to N-1 security criteria and explore hybrid plant participation in electricity markets to enhance economic benefits and accelerate deployment.
Author Contributions
Conceptualization, all authors; methodology, C.G.-S.; software, C.G.-S.; validation, all authors; formal analysis, all authors; investigation, C.G.-S.; resources, J.L.M.-R. and A.M.-M.; data curation, C.G.-S.; writing—original draft preparation, C.G.-S.; writing—review and editing, J.L.M.-R. and A.M.-M.; visualization, all authors; supervision, J.L.M.-R. and A.M.-M.; project administration, J.L.M.-R. and A.M.-M.; funding acquisition, J.L.M.-R. and A.M.-M. All authors have read and agreed to the published version of the manuscript.
Funding
The authors would like to acknowledge the financial support of the Spanish State Research Agency under Grant No. PID2020-116433RB-I00 (PID2020-116433RB-I00/AEI/10.13039/501100011033) and by the “European Union NextGenerationEU/PRTR” under Grant No. TED2021-131724B-I00.
Data Availability Statement
The original contributions presented in this study are included in the article. Further inquiries can be directed to the corresponding authors.
Conflicts of Interest
The authors declare no conflicts of interest.
References
- IEA. Electricity 2025; IEA: Paris, France, 2025; Available online: https://www.iea.org/reports/electricity-2025 (accessed on 20 July 2025).
- American Clean Power Association. U.S. National Power Demand Study: Executive Summary, Commissioned by S&P Global Commodity Insights, 7 March 2025. Available online: https://cleanpower.org/resources/us-national-power-demand-study/ (accessed on 20 July 2025).
- Vahidinasab, V.; Tabarzadi, M.; Arasteh, H.; Alizadeh, M.I.; Beigi, M.M.; Sheikhzadeh, H.R.; Mehran, K.; Sepasian, M.S. Overview of Electric Energy Distribution Networks Expansion Planning. IEEE Access 2020, 8, 34750–34769. [Google Scholar] [CrossRef]
- Aschidamini, G.L.; da Cruz, G.A.; Resener, M.; Ramos, M.J.S.; Pereira, L.A.; Ferraz, B.P.; Haffner, S.; Pardalos, P.M. Expansion Planning of Power Distribution Systems Considering Reliability: A Comprehensive Review. Energies 2022, 15, 2275. [Google Scholar] [CrossRef]
- Jooshaki, M.; Abbaspour, A.; Fotuhi-Firuzabad, M.; Muñoz-Delgado, G.; Contreras, J.; Lehtonen, M.; Arroyo, J.M. An Enhanced MILP Model for Multistage Reliability-Constrained Distribution Network Expansion Planning. IEEE Trans. Power Syst. 2022, 37, 118–131. [Google Scholar] [CrossRef]
- Refaat, M.M.; Aleem, S.H.E.A.; Atia, Y.; Ali, Z.M.; Sayed, M.M. Multi-Stage Dynamic Transmission Network Expansion Planning Using LSHADE-SPACMA. Appl. Sci. 2021, 11, 2155. [Google Scholar] [CrossRef]
- de Quevedo, P.M.; Muñoz-Delgado, G.; Contreras, J. Impact of Electric Vehicles on the Expansion Planning of Distribution Systems Considering Renewable Energy, Storage, and Charging Stations. IEEE Trans. Smart Grid 2019, 10, 794–804. [Google Scholar] [CrossRef]
- Liang, Y.; Liu, H.; Zhou, H.; Meng, Z.; Liu, J.; Zhou, M. Multi-Stage Coordinated Planning for Transmission and Energy Storage Considering Large-Scale Renewable Energy Integration. Appl. Sci. 2024, 14, 6486. [Google Scholar] [CrossRef]
- EPRI. Guidance on DER as Non-Wires Alternatives (NWAs), Technical and Economic Considerations for Assessing NWA Projects; Technical Update; EPRI: Palo Alto, CA, USA, 2018. [Google Scholar]
- Contreras-Ocaña, J.E.; Chen, Y.; Siddiqi, U.; Zhang, B. Non-Wire Alternatives: An Additional Value Stream for Distributed Energy Resources. IEEE Trans. Sustain. Energy 2020, 11, 1287–1299. [Google Scholar] [CrossRef]
- Gu, C.; Yan, X.; Yan, Z.; Li, F. Dynamic pricing for responsive demand to increase distribution network efficiency. Appl. Energy 2017, 205, 236–243. [Google Scholar] [CrossRef]
- Li, Z.; Sun, H.; Xue, Y.; Li, Z.; Jin, X.; Wang, P. Resilience-Oriented Asynchronous Decentralized Restoration Considering Building and E-Bus Co-Response in Electricity-Transportation Networks. IEEE Trans. Transp. Electrif. 2025, 11, 11701–11713. [Google Scholar] [CrossRef]
- Wang, K.; Ma, Y.; Wei, F.; Lin, X.; Li, Z.; Dawoud, S.M. Resilient market bidding strategy for Mobile energy storage system considering transfer uncertainty. Appl. Energy 2025, 377, 124498. [Google Scholar] [CrossRef]
- Li, X.; Shi, Y.; Zhang, R.; Zhang, X.; Tang, R.; Yang, X.; Lai, J.; Zhang, Y. Research on the integration of mobile energy storage system for enhancing black start capability and resilience in distribution networks under extreme events. Sustain. Energy Grids Netw. 2025, 43, 101724. [Google Scholar] [CrossRef]
- Ji, Y.; Zhang, Y.; Chen, L.; Zuo, J.; Wang, W.; Xu, C. The Optimal Dispatch for a Flexible Distribution Network Equipped with Mobile Energy Storage Systems and Soft Open Points. Energies 2025, 18, 2701. [Google Scholar] [CrossRef]
- González-Garrido, A.; González-Pérez, M.; Asensio, F.J.; Cortes-Borray, A.F.; Santos-Mugica, M.; Vicente-Figueirido, I. Hierarchical control for collaborative electric vehicle charging to alleviate network congestion and enhance EV hosting in constrained distribution networks. Renew. Energy 2024, 230, 120823. [Google Scholar] [CrossRef]
- Wang, Y.; Johnson, A.; Markham, P.N.; Warchol, G.J.; Li, X.; Yao, W.; Ju, W.; Xu, Y. Value Stacking of a Customer-Sited BESS for Distribution Grid Support: A Utility Case. IEEE Trans. Power Syst. 2024, 39, 6795–6806. [Google Scholar] [CrossRef]
- García-Santacruz, C.; Marano-Marcolini, A.; Martínez-Ramos, J.L. Using hybrid distributed energy resources as non-wire alternatives to minimise investment costs. Sustain. Energy Grids Netw. 2024, 39, 101422. [Google Scholar] [CrossRef]
- Laws, A. Valuing distributed energy resources for non-wires alternatives. Electr. Power Syst. Res. 2024, 234, 110521. [Google Scholar] [CrossRef]
- García-Muñoz, F.; Díaz-González, F.; Corchero, C. A novel algorithm based on the combination of AC-OPF and GA for the optimal sizing and location of DERs into distribution networks. Sustain. Energy Grids Netw. 2021, 27, 100497. [Google Scholar] [CrossRef]
- Liao, H. Review on Distribution Network Optimization under Uncertainty. Energies 2019, 12, 3369. [Google Scholar] [CrossRef]
- Zheng, K.; Sun, Z.; Song, Y.; Zhang, C.; Zhang, C.; Chang, F.; Yang, D.; Fu, X. Stochastic Scenario Generation Methods for Uncertainty in Wind and Photovoltaic Power Outputs: A Comprehensive Review. Energies 2025, 18, 503. [Google Scholar] [CrossRef]
- Yazdani, D.; Omidvar, M.N.; Yazdani, D.; Branke, J.; Nguyen, T.T.; Gandomi, A.H.; Jin, Y.; Yao, X. Robust Optimization Over Time: A Critical Review. IEEE Trans. Evol. Comput. 2024, 28, 1265–1285. [Google Scholar] [CrossRef]
- Aghamohamadi, M.; Mahmoudi, A.; Haque, M.H. Two-Stage Robust Sizing and Operation Co-Optimization for Residential PV–Battery Systems Considering the Uncertainty of PV Generation and Load. IEEE Trans. Ind. Inform. 2021, 17, 1005–1017. [Google Scholar] [CrossRef]
- Giannelos, S.; Konstantelos, I.; Zhang, X.; Strbac, G. A stochastic optimization model for network expansion planning under exogenous and endogenous uncertainty. Electr. Power Syst. Res. 2025, 248, 111894. [Google Scholar] [CrossRef]
- Kizito, R.; Liu, Z.; Li, X.; Sun, K. Stochastic optimization of distributed generator location and sizing in an islanded utility microgrid during a large-scale grid disturbance. Sustain. Energy Grids Netw. 2021, 27, 100516. [Google Scholar] [CrossRef]
- Barbar, M.; Mallapragada, D.S.; Stoner, R. Decision making under uncertainty for deploying battery storage as a non-wire alternative in distribution networks. Energy Strategy Rev. 2022, 41, 100862. [Google Scholar] [CrossRef]
- Park, J.; Joo, S.-K. Techno-Economic Analysis of Non-Wire Alternative (NWA) Portfolios Integrating Energy Storage Systems (ESS) with Photovoltaics (PV) or Demand Response (DR) Resources Across Various Load Profiles. Energies 2025, 18, 3568. [Google Scholar] [CrossRef]
- Farivar, M.; Low, S.H. Branch Flow Model: Relaxations and Convexification—Part I. IEEE Trans. Power Syst. 2013, 28, 2554–2564. [Google Scholar] [CrossRef]
- Chowdhury, N.; Pilo, F.; Pisano, G. Optimal Energy Storage System Positioning and Sizing with Robust Optimization. Energies 2020, 13, 512. [Google Scholar] [CrossRef]
- Mohamed, A.A.R.; Best, R.J.; Liu, X.; Morrow, D.J. A Comprehensive Robust Techno-Economic Analysis and Sizing Tool for the Small-Scale PV and BESS. IEEE Trans. Energy Convers. 2022, 37, 560–572. [Google Scholar] [CrossRef]
- Gupta, S.; Kumar, N.; Srivastava, L.; Malik, H.; Anvari-Moghaddam, A.; García Márquez, F.P. A Robust Optimization Approach for Optimal Power Flow Solutions Using Rao Algorithms. Energies 2021, 14, 5449. [Google Scholar] [CrossRef]
- Shavazipour, B.; Kwakkel, J.H.; Miettinen, K. Multi-scenario multi-objective robust optimization under deep uncertainty: A posteriori approach. Environ. Model. Softw. 2021, 144, 105134. [Google Scholar] [CrossRef]
- Wang, J.; Lan, J.; Wang, L.; Lin, Y.; Hao, M.; Zhang, Y.; Xiang, Y.; Qin, L. Coordinated Multi-Scenario Optimization Strategy for Park Photovoltaic Storage Based on Master–Slave Game. Sensors 2024, 24, 5042. [Google Scholar] [CrossRef]
- Sannigrahi, S.; Ghatak, S.R.; Acharjee, P. Multi-Scenario Based Bi-Level Coordinated Planning of Active Distribution System Under Uncertain Environment. IEEE Trans. Ind. Appl. 2020, 56, 850–863. [Google Scholar] [CrossRef]
- Jiang, P.; Li, X.; Cui, S.; Chen, L. Multi-Scenario Stochastic Optimization for Advanced Adiabatic Compressed Air Energy Storage Capacity Planning. In Proceedings of the 2023 3rd Power System and Green Energy Conference (PSGEC), Shanghai, China, 24–26 August 2023; pp. 804–808. [Google Scholar] [CrossRef]
- Ye, J.; Xie, L.; Ma, L.; Bian, Y.; Cui, C. Multi-Scenario Stochastic Optimal Scheduling for Power Systems With Source-Load Matching Based on Pseudo-Inverse Laguerre Polynomials. IEEE Access 2023, 11, 133903–133920. [Google Scholar] [CrossRef]
- Wen, X.; Abbes, D.; Francois, B. Stochastic Optimization for Security-Constrained Day-Ahead Operational Planning Under PV Production Uncertainties: Reduction Analysis of Operating Economic Costs and Carbon Emissions. IEEE Access 2021, 9, 97039–97052. [Google Scholar] [CrossRef]
- Zhao, B.; Bukenberger, J.; Webster, M. Scenario Partitioning Methods for Two-Stage Stochastic Generation Expansion Under Multi-Scale Uncertainty. IEEE Trans. Power Syst. 2022, 37, 2371–2383. [Google Scholar] [CrossRef]
- Bagheri, F.; Dagdougui, H.; Gendreau, M. Stochastic optimization and scenario generation for peak load shaving in Smart District microgrid: Sizing and operation. Energy Build. 2022, 275, 112426. [Google Scholar] [CrossRef]
- Li, Y.; Wu, F.; Song, X.; Shi, L.; Lin, K.; Hong, F. Data-Driven Chance-Constrained Schedule Optimization of Cascaded Hydropower and Photovoltaic Complementary Generation Systems for Shaving Peak Loads. Sustainability 2023, 15, 16916. [Google Scholar] [CrossRef]
- Lee, D.; Han, C.; Kang, S.; Jang, G. Chance-constrained optimization for active distribution networks with virtual power lines. Electr. Power Syst. Res. 2023, 221, 109449. [Google Scholar] [CrossRef]
- Nezhad, A.E.; Nardelli, P.H.J.; Sahoo, S.; Ghanavati, F. Scheduling of Energy Hub Resources Using Robust Chance-Constrained Optimization. IEEE Access 2022, 10, 129738–129753. [Google Scholar] [CrossRef]
- CIGRÉ. Systems for Network Integration of Renewable and Distributed Energy Resources; Technical Brochure; CIGRÉ: Paris, France, 2014. [Google Scholar]
- Porsinger, T.; Janik, P.; Leonowicz, Z.; Gono, R. Modelling and Optimization in Microgrids. Energies 2017, 10, 523. [Google Scholar] [CrossRef]
- IRENA. Renewable Power Generation Costs in 2023; International Renewable Energy Agency: Abu Dhabi, United Arab Emirates, 2024; Available online: https://www.irena.org/Publications/2024/Sep/Renewable-Power-Generation-Costs-in-2023 (accessed on 20 July 2025).
- Mongird, K.; Fotedar, V.; Viswanathan, V.; Koritarov, V.; Balducci, P.; Hadjerioua, B.; Alam, J. Energy Storage Technology and Cost Characterization Report; Technical Report; PNNL: Richland, WA, USA, 2019. [Google Scholar]
Disclaimer/Publisher’s Note: The statements, opinions and data contained in all publications are solely those of the individual author(s) and contributor(s) and not of MDPI and/or the editor(s). MDPI and/or the editor(s) disclaim responsibility for any injury to people or property resulting from any ideas, methods, instructions or products referred to in the content. |
© 2025 by the authors. Licensee MDPI, Basel, Switzerland. This article is an open access article distributed under the terms and conditions of the Creative Commons Attribution (CC BY) license (https://creativecommons.org/licenses/by/4.0/).