1. Introduction
Urbanization is one of the most visible manifestations of global change. It is seen as a multidimensional manifestation of processes and phenomena that accelerate urban growth, increase urban population, increase population concentration in major cities, contribute to the expansion of urban areas and increase the importance of cities as business and administrative centers. Urbanization is gradually modifying the spatial structure of land use in both urban and rural areas. Suburbanization, i.e., residential development in the urban fringe zone, plays a very important role during the period of rapid urban growth. Suburban areas can be developed in parallel with existing urban structures, or they can form small and scattered housing developments on the outskirts of the city. In the literature, areas directly affected by urbanization pressures are referred to as the urban-rural transition zone [
1], the urban-rural continuum [
2] or the suburban zone [
3,
4]. Land use changes in the urban-rural fringe [
3,
4], which is the “green belt” around the city [
5,
6], as well as in areas referred to as “urban villages” [
7] are also analyzed. Research on suburbs focuses not only on the incorporation of new areas into the urban influence zone but also on changes in land use, infrastructure and the environmental impact of urbanization.
Urbanization significantly impacts the hydrology of urban areas, leading to increased surface runoff and a heightened risk of local flooding. This process involves sealing surfaces through the construction of roads, parking lots, and buildings, which limits the natural infiltration of rainwater into the soil [
8,
9]. As a result, surface runoff becomes more rapid and intense, potentially overloading drainage systems and contributing to local flooding events [
10]. Understanding these dynamics is crucial for effective flood risk management in rapidly urbanizing regions.
In recent years, research on the impact of urbanization on surface runoff and the risk of local flooding has focused on several key aspects:
1. Surface Runoff Modelling
Recent studies have utilized advanced Geographic Information System (GIS) tools and remote sensing data to model surface runoff more accurately. For example, a specialized geoportal was developed for sequential data collection and runoff modelling, allowing for the identification of high-risk flooding zones [
11]. Additionally, digital terrain models (DTMs) derived from airborne laser scanning (ALS) data provide detailed insights into terrain slopes and their influence on runoff patterns [
12].
2. Stormwater Management Strategies
Implementing blue-green infrastructure (BGI) solutions, such as rain gardens, green roofs, and permeable pavements, has been extensively analyzed in recent years. Research indicates that these measures effectively mitigate urban flood risks by increasing stormwater retention and improving water quality [
13]. Moreover, sustainable urban drainage systems (SUDS) have been increasingly adopted to manage runoff while reducing pressure on existing drainage networks [
14,
15].
3. Flood Hazard Mapping
The development of high-resolution flood hazard and risk maps is crucial for spatial planning and emergency response. In Poland, official flood risk maps provide essential data for assessing flood-prone areas and implementing preventive measures [
16]. These maps incorporate hydrological and topographical data to predict the potential extent of flooding under various scenarios [
17,
18].
4. Climate Change Impacts on Urban Flooding
Increasing precipitation intensity and frequency due to climate change further exacerbate the risk of urban flooding. The concept of “sponge cities” has gained traction as a nature-based solution for improving urban flood resilience [
19]. This approach integrates water-absorbent landscapes and decentralized water management systems to enhance urban adaptability to extreme weather events [
20].
5. Land use and land cover (LULC)
LULC play a fundamental role in many aspects of human life. Their significance is evident in environmental, economic, and social contexts [
21]. LULC influences water bodies [
22], affects the physical and chemical properties of soils, determines agricultural production potential and directly impacts property values [
23].
In a social context, LULC shapes the landscape, altering key perceptions such as identity, familiarity, access to recreation, and the aesthetic appeal of residential areas. Urbanization and related land use changes—especially those occurring intensively in suburban zones—can lead to social conflicts between new and long-term residents and increase the demand for infrastructure and public services [
1].
Understanding land use and land cover is crucial for implementing spatial policies aligned with sustainable development principles [
24]. Analyzing the dynamics of these transformations should serve as the foundation for the rational management of space.
Land cover and land use are also crucial factors influencing surface water runoff and flood risk [
25,
26]. Different types of land cover and land use determine how rainwater is retained by the land or runs off the surface, directly impacting flood risk.
Currently, land use changes are occurring at an increasingly rapid and often uncontrollable pace, which is quickly reflected in changes to land cover. These shifts are particularly pronounced in the agricultural sector, where they include the intensification of crops, changes in crop types, and the clearing of trees and shrubs on farmland [
26,
27].
The conversion of natural forests into pasture or arable land is a common example of land use change, often driven by the need to increase food production [
27]. In some cases, these processes are influenced by government policies, such as reforestation programs. However, one of the most significant drivers of land cover and land use change remains urbanization.
Rapid economic development and population growth often drive urban expansion, leading to the conversion of natural and agricultural areas into built-up zones [
28]. Uncontrolled urbanization can result in the loss of natural landscapes and increase vulnerability to flooding. The expansion of impervious surfaces—such as buildings, roads, and parking lots—prevents water from infiltrating the soil, leading to greater surface runoff [
29]. This accelerated runoff flows into drainage systems, such as storm sewers, at a faster rate [
30], causing quicker peak flows during rainfall and increasing the risk of flash floods [
31]. Ultimately, by reducing infiltration capacity and increasing runoff, urbanization also disrupts the natural hydrological cycle [
32].
Many areas affected by intense urbanization changes are undergoing rapid urbanization, which may increase surface runoff and the risk of local flooding. Land use changes, coupled with climatic variations, necessitate a detailed assessment of high-risk areas prone to surface runoff and potential flooding. This study aims to identify such areas using a combination of land use inventories, ALS-based DTM analysis, and hydrological data from the Global Land Data Assimilation System (GLDAS). The findings will support the development of effective stormwater management strategies and spatial planning measures to minimize the adverse effects of urbanization on local hydrology.
The main thesis of the study is to identify high-risk areas for surface runoff and local flooding in Tomaszkowo, Poland, by analyzing the effects of urbanization on hydrological processes. This will be carried out by using a combination of land use inventories, ALS-based digital terrain modelling, and hydrological data from GLDAS. Moreover, some aims will be undertaken during the research:
Changes in surface runoff patterns and their potential impact on local flood risk assessment—examining the influence of inclination, surface sealing and soil structure on the phenomenon of water escape and examining the level of influence of individual factors.
Soil surface and infiltration evaluation—what influence does the soil substrate have on a given tetrahedron, and does it explain the weakened infiltration in the study area?
Modifying the evapotranspiration pattern for the purpose of observing urbanization influences—whether the introduction of factors modifying evapotranspiration (degree of coverage with sealed material and slope of the terrain) will significantly explain the phenomena occurring in the studied area, and examining the degree of influence of these two factors.
Integrating geospatial analysis, digital terrain modelling, and hydrological data—whether the combination of three types of models makes it possible to create a resulting model that provides an answer to explain the phenomena occurring in Tomaszkowo.
Taking into account the above objectives, the following hypotheses can be formulated. First, an increase in impervious surface coverage leads to higher surface runoff in Tomaszkowo. Second, urbanization and the expansion of sealed surfaces reduce landscape-scale evapotranspiration. Third, soils with lower permeability exhibit reduced infiltration rates, contributing to more frequent positive water-budget anomalies. Fourth, terrain slope significantly influences surface runoff independently of soil type and degree of urbanization. Finally, integrating geospatial analyses, ALS-based digital terrain modeling, and hydrological data enables the identification of areas with a high risk of local flooding.
Taking into account P, EV and SRO, the water budget will be computed in the case study area. To enhance the research, the evapotranspiration parameter is going to be modified according to the terrain slope and covering with an impermeable surface. In the final analyzes, we will also introduce soil content analyses and its infiltration properties. Based on the research, we will be able to conclude the state of the environment in the studied area in terms of the balance between inflow and outflow from the system
The findings will contribute to developing effective stormwater management strategies and spatial planning measures to mitigate the adverse effects of urban expansion on water balance and flood hazards.
2. Materials and Methods
2.1. Research Area
The selected object for research is the area of Tomaszkowo, Olsztyn County, Poland. Tomaszkowo is a village situated south of the city of Olsztyn, with a population of 886 residents, according to data from the Stawiguda Municipality Office (as of 2025). Due to its location—being close to the regional capital—and its picturesque setting near Wulpińskie Lake, the village has been experiencing rapid development, attracting new residents. In the 21st century, the population has increased more than 2.5 times. This demographic growth has been accompanied by the expansion of built-up areas, primarily through single-family housing developments, along with the necessary technical and road infrastructure. The development of Tomaszkowo is a multifaceted process influenced by numerous factors. One of the main drivers of this process is the proximity to Olsztyn, the capital of the Warmian-Masurian Voivodeship, which makes Tomaszkowo an attractive place to live for people working in the town. In addition to good transportation links, including access to roads that facilitate travel to Olsztyn and other towns, various installations in the village or its vicinity have also been developed.
Although there are detailed local plans and municipal documents, such as the “Tomaszkowo Village Renewal Plan,” which outlines the directions for the town’s development, insufficient safeguards have been implemented to prevent excessive urbanization. There are no provisions in place to limit development intensity, which could prevent Tomaszkowo from being transformed into an area with the characteristics of dense urban development.
Social problems related to infrastructure are becoming more frequent. Often, the technical infrastructure does not meet safety requirements and is unable to accommodate the growing number of residents. This also applies to the increasingly frequent local floods that destroy private property and infrastructure.
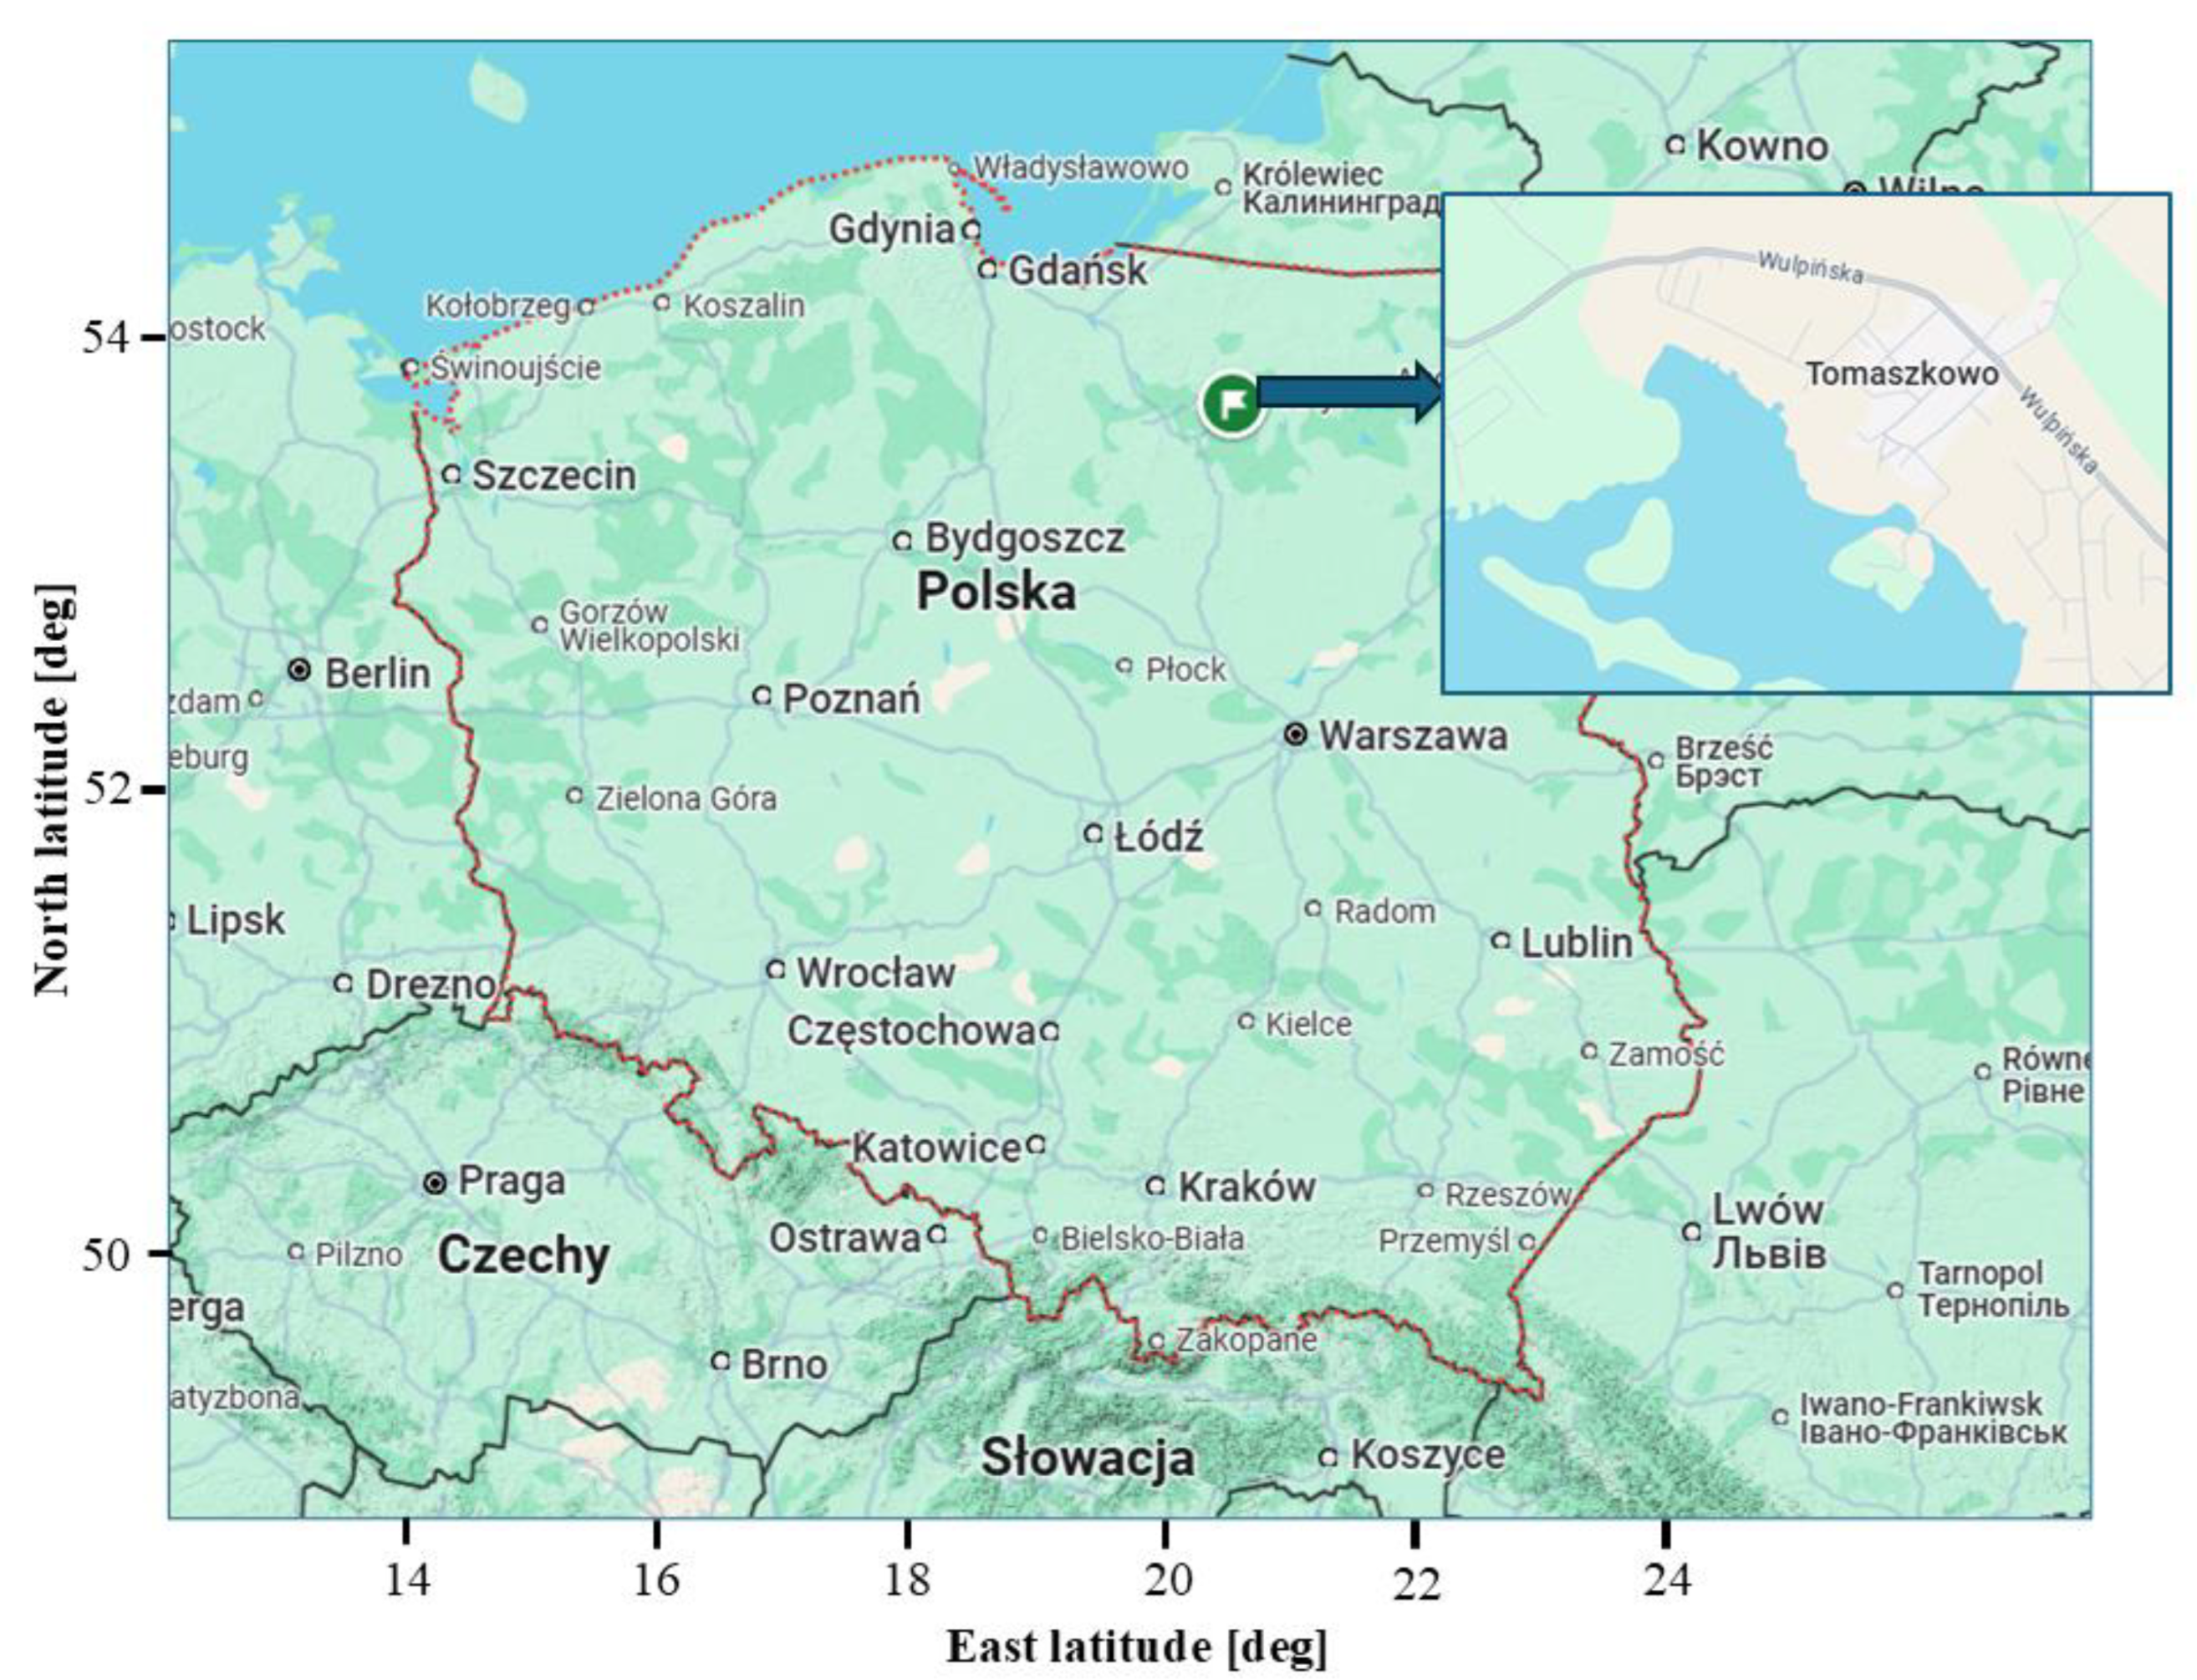
The location of Tomaszkowo is presented in
Figure 1 in the form of an illustrative drawing.
The study area was selected due to its unique geographical features, including diverse landscapes, proximity to natural water bodies, and significant ecological value. Additionally, the region provides various opportunities for studying environmental changes, land use, and the impact of human activities on the ecosystem. Most importantly, however, this area is particularly affected by local flooding, which prompted the research team to conduct this study.
Figure 2 presents photographs taken by village residents, illustrating the existing problem.
2.2. Data Collection
2.2.1. ALS Data
The ALS data were obtained from the website
https://pzgik.geoportal.gov.pl/imap/ (date of data download: 25 February 2025). The data were collected as part of the ISOK Project (IT system for protecting a country against extraordinary threats) from the aircraft platform. The datasets with a density of 4 p/m
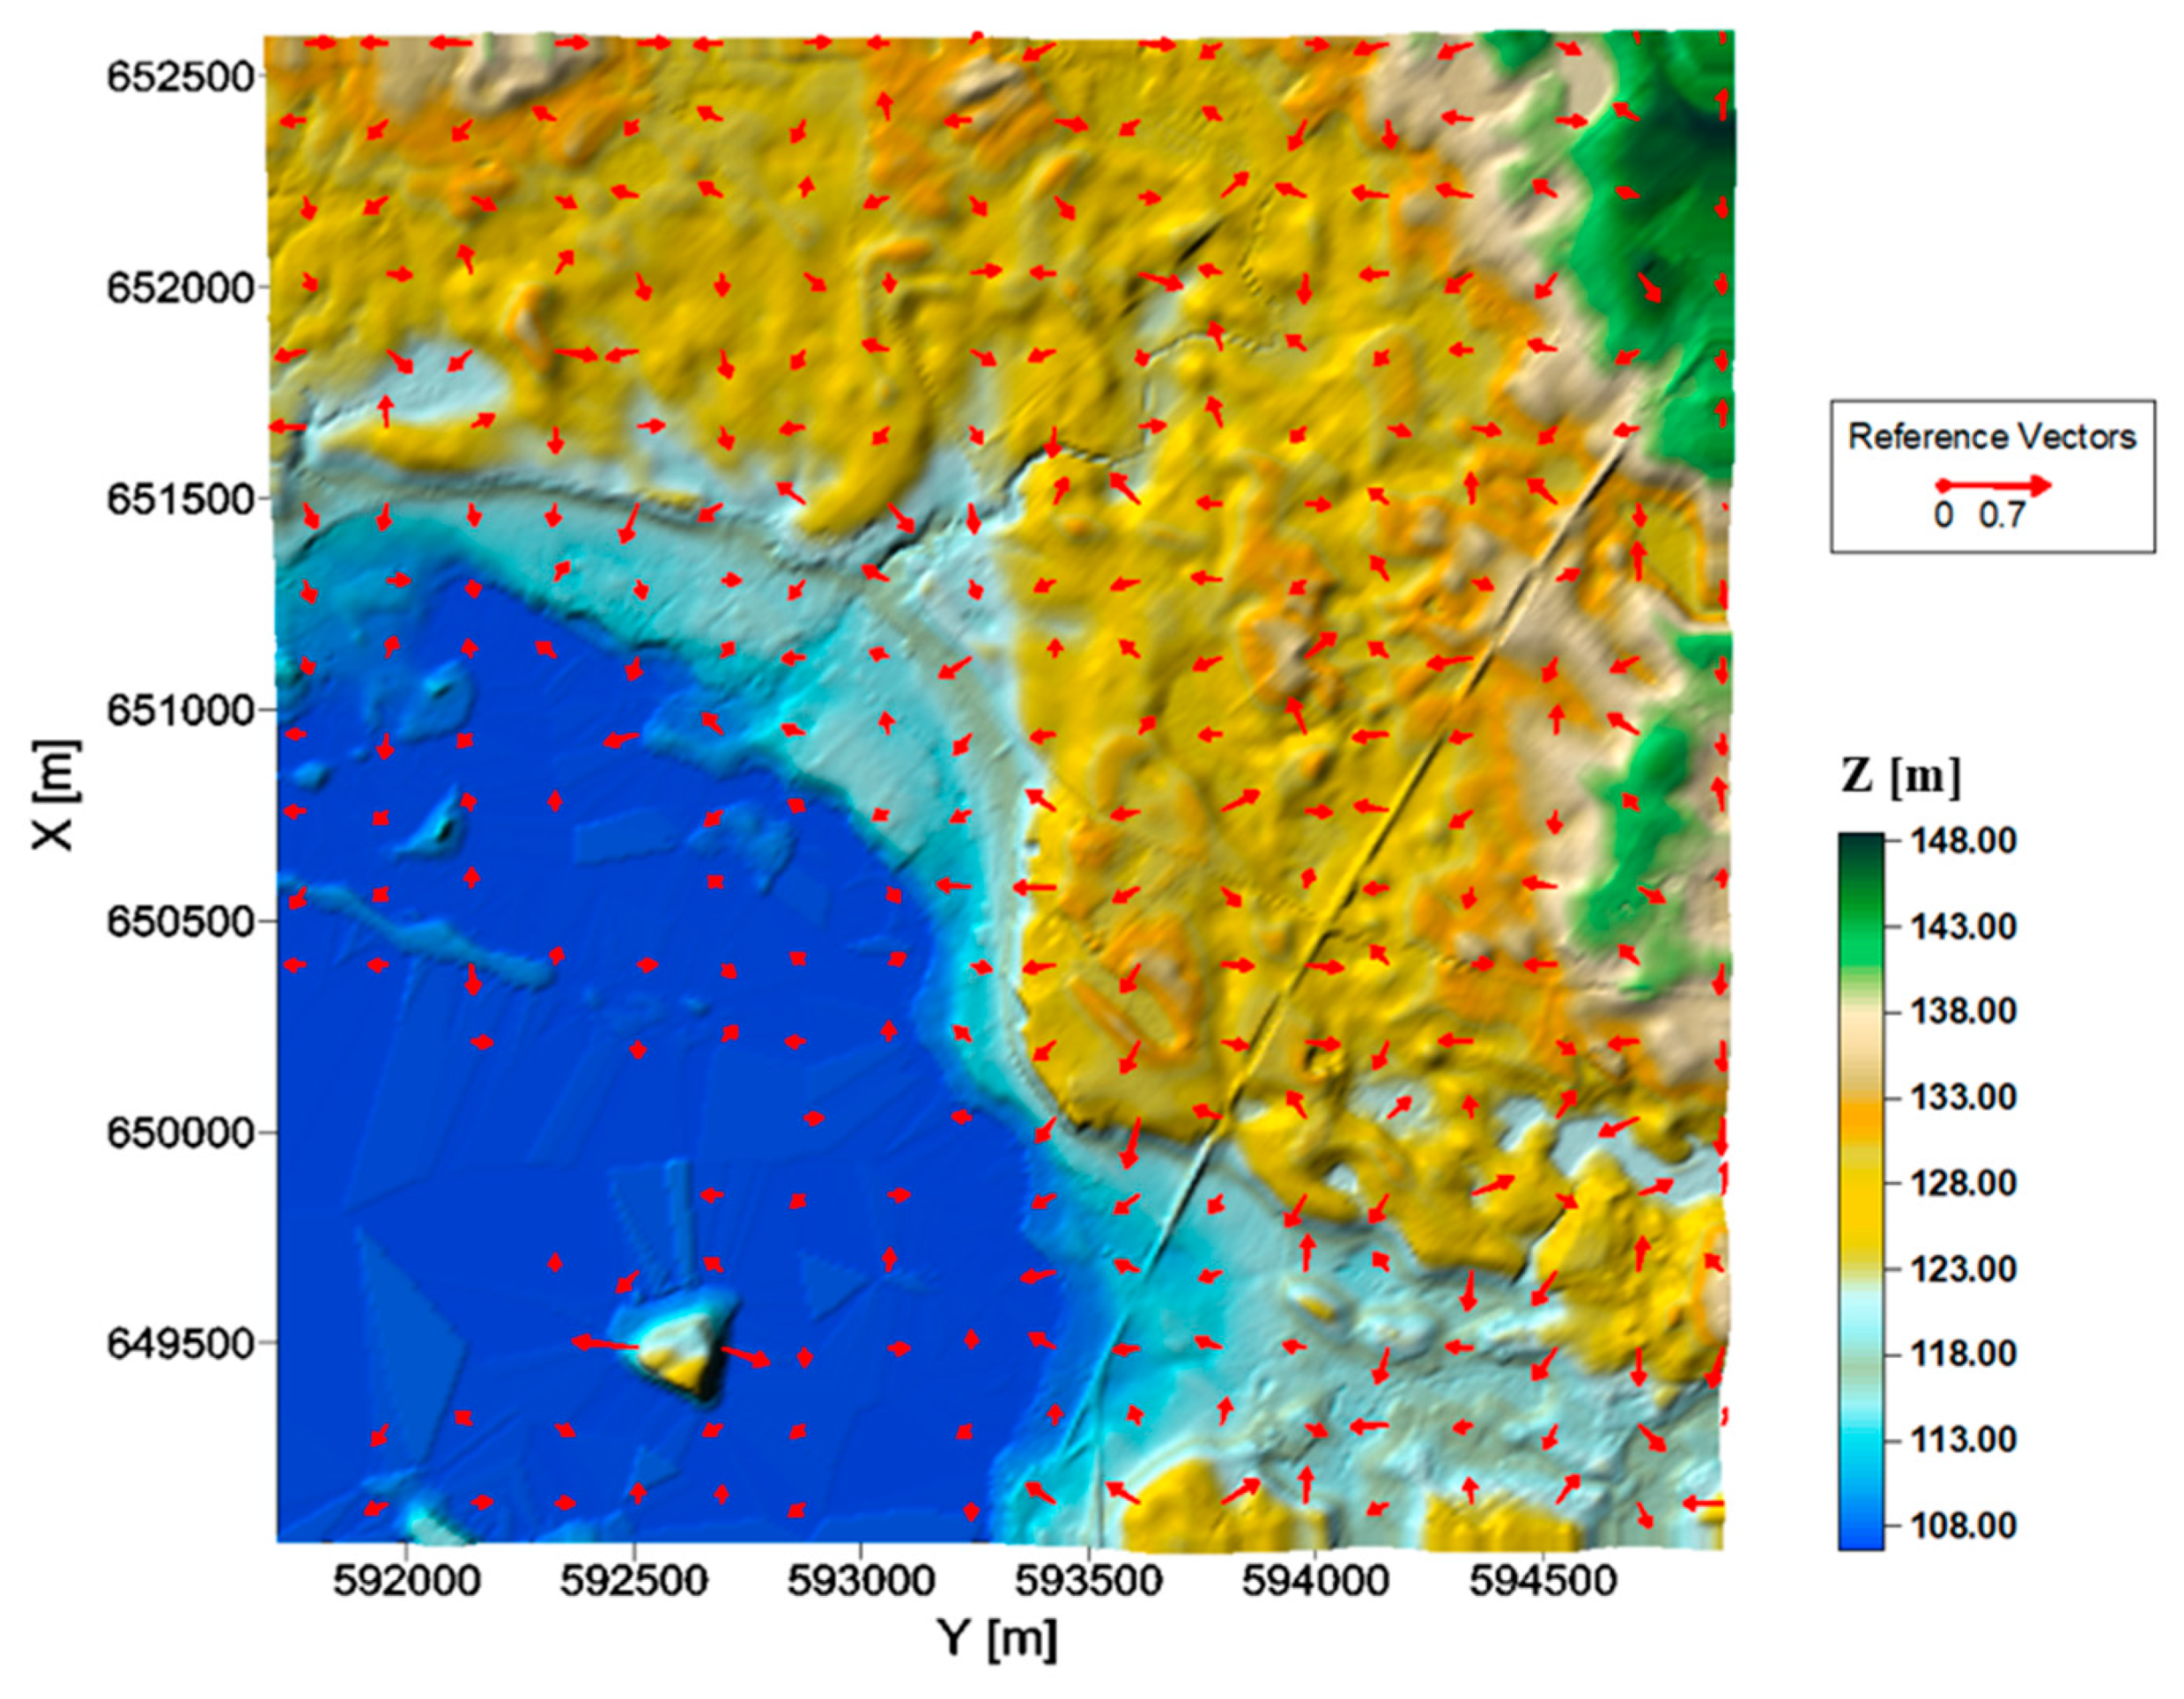
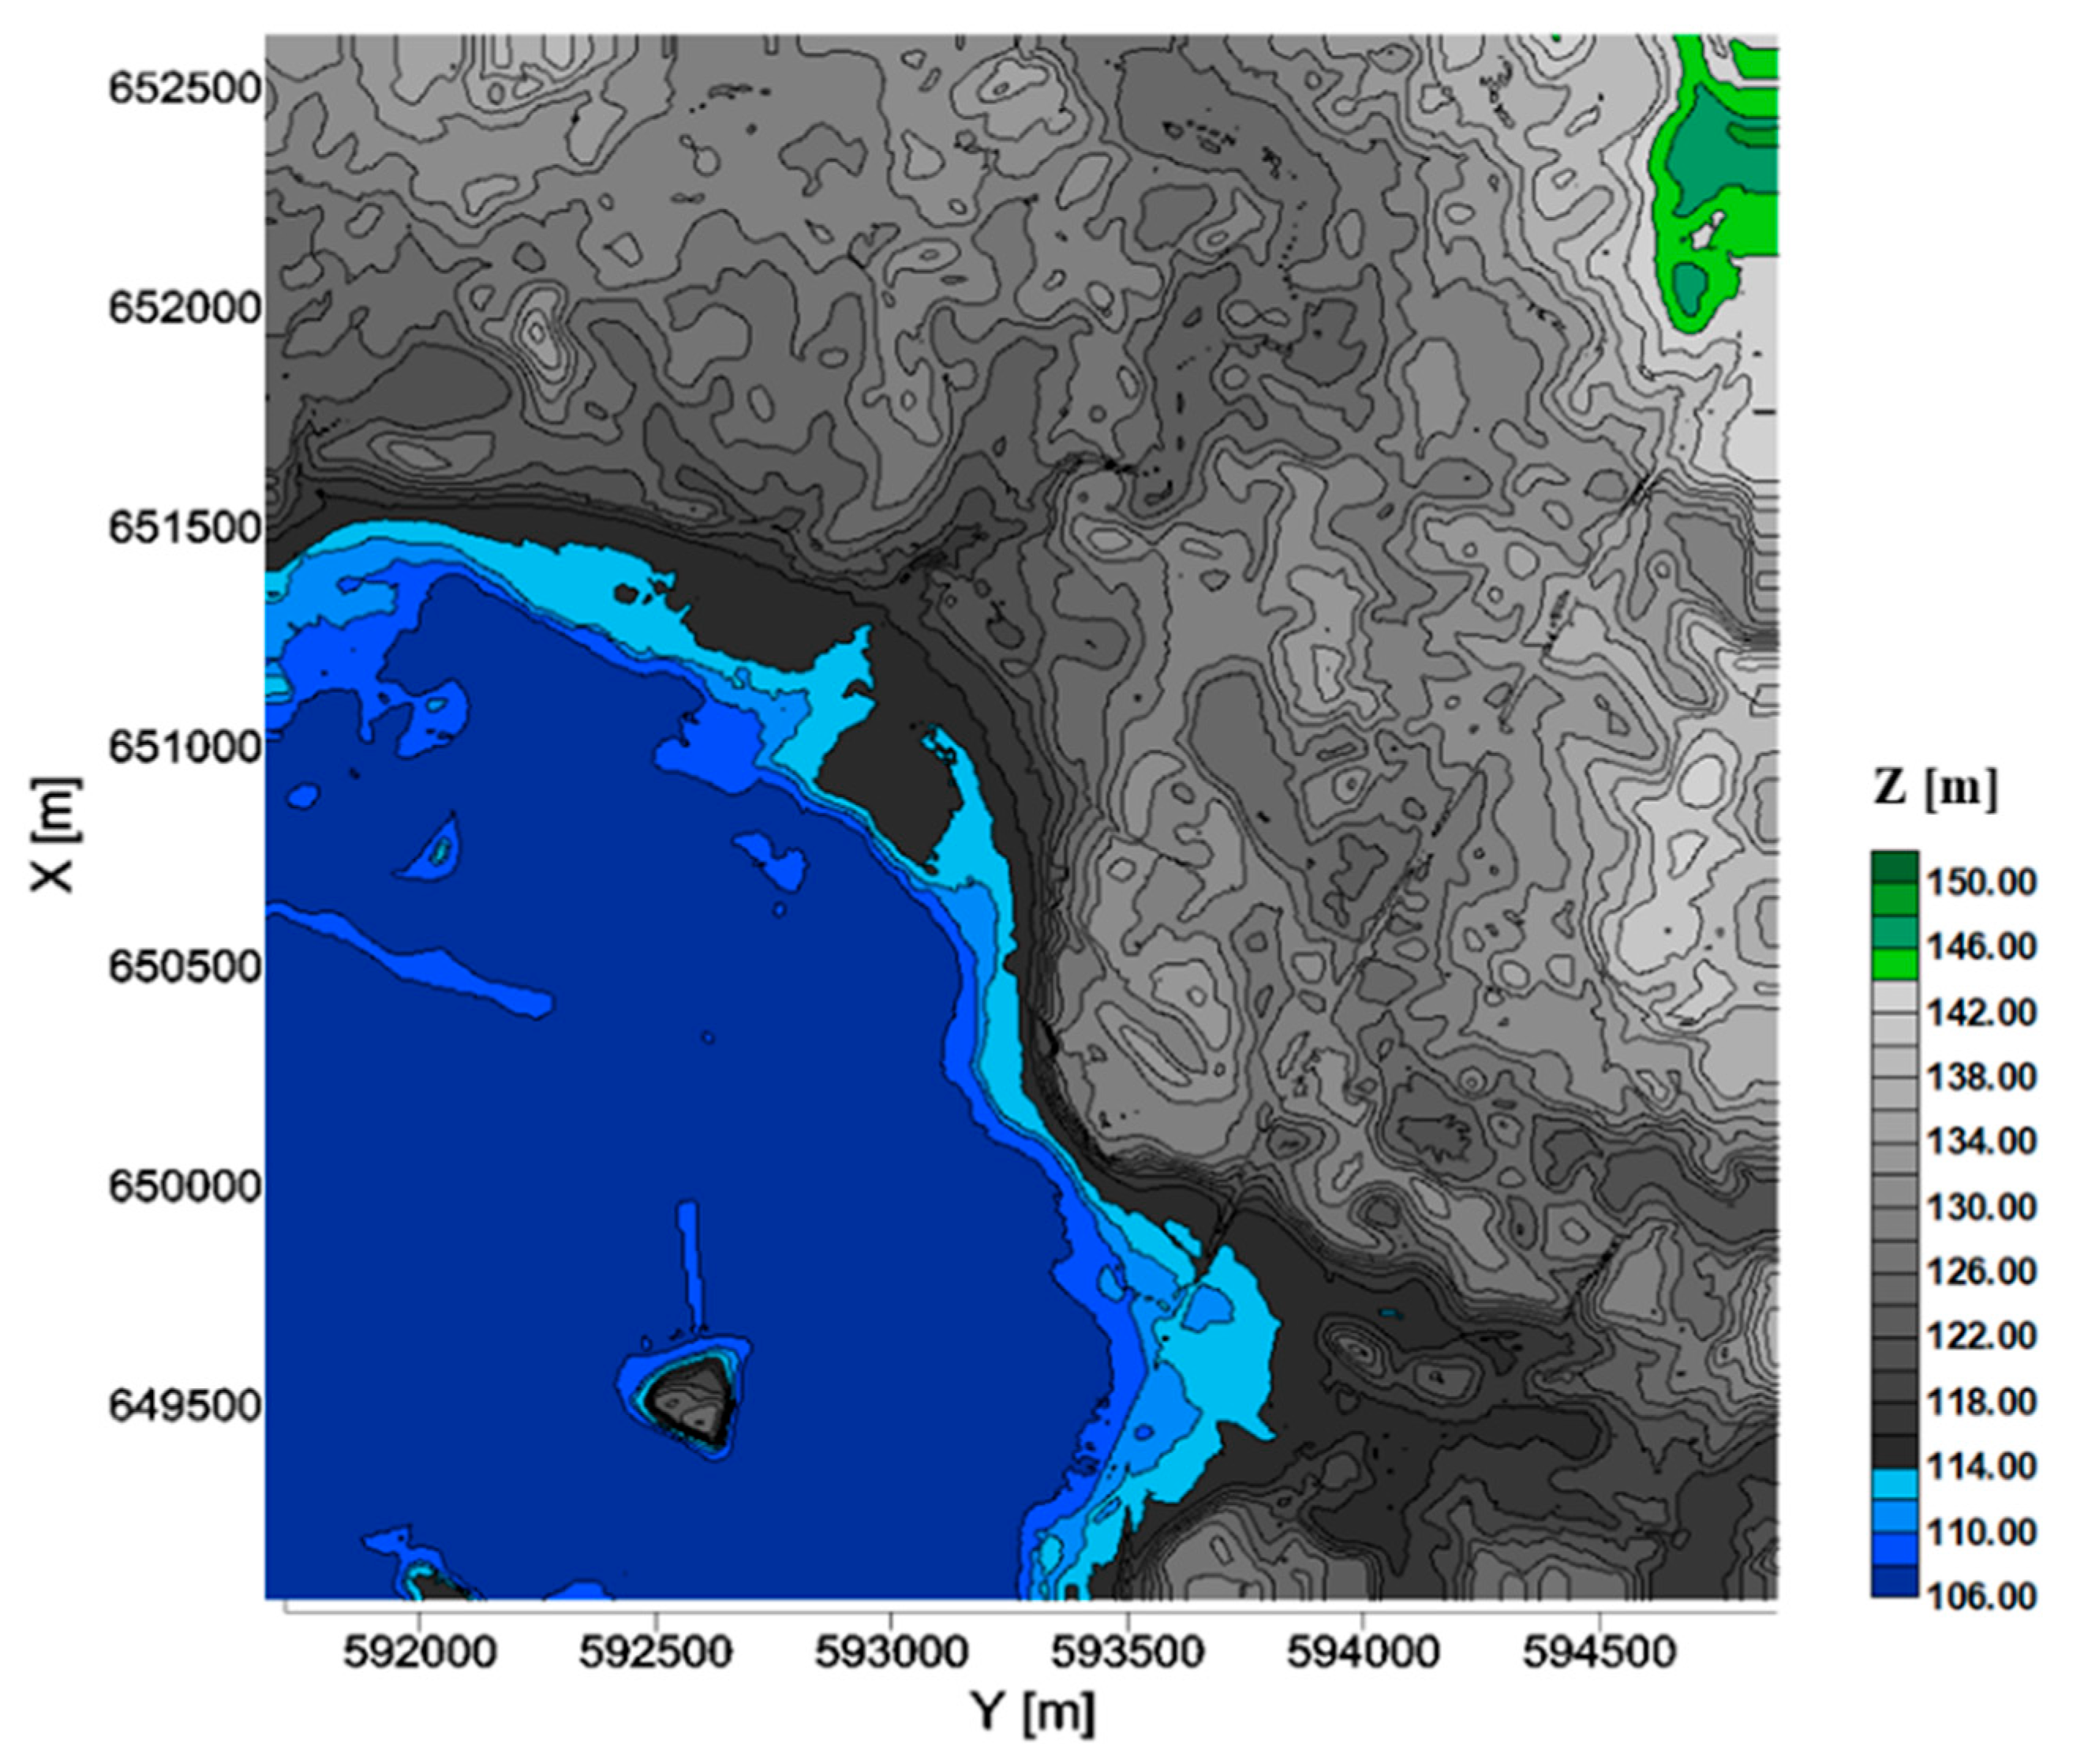
2 were obtained in .las format. From the .las file, point class No. 2, containing points representing the ground surface, was exported. These ground points will be used for generating the DTM. The analyzed area and ground points are presented in
Figure 3.
2.2.2. Data from the Land Use Inventory (LUI)
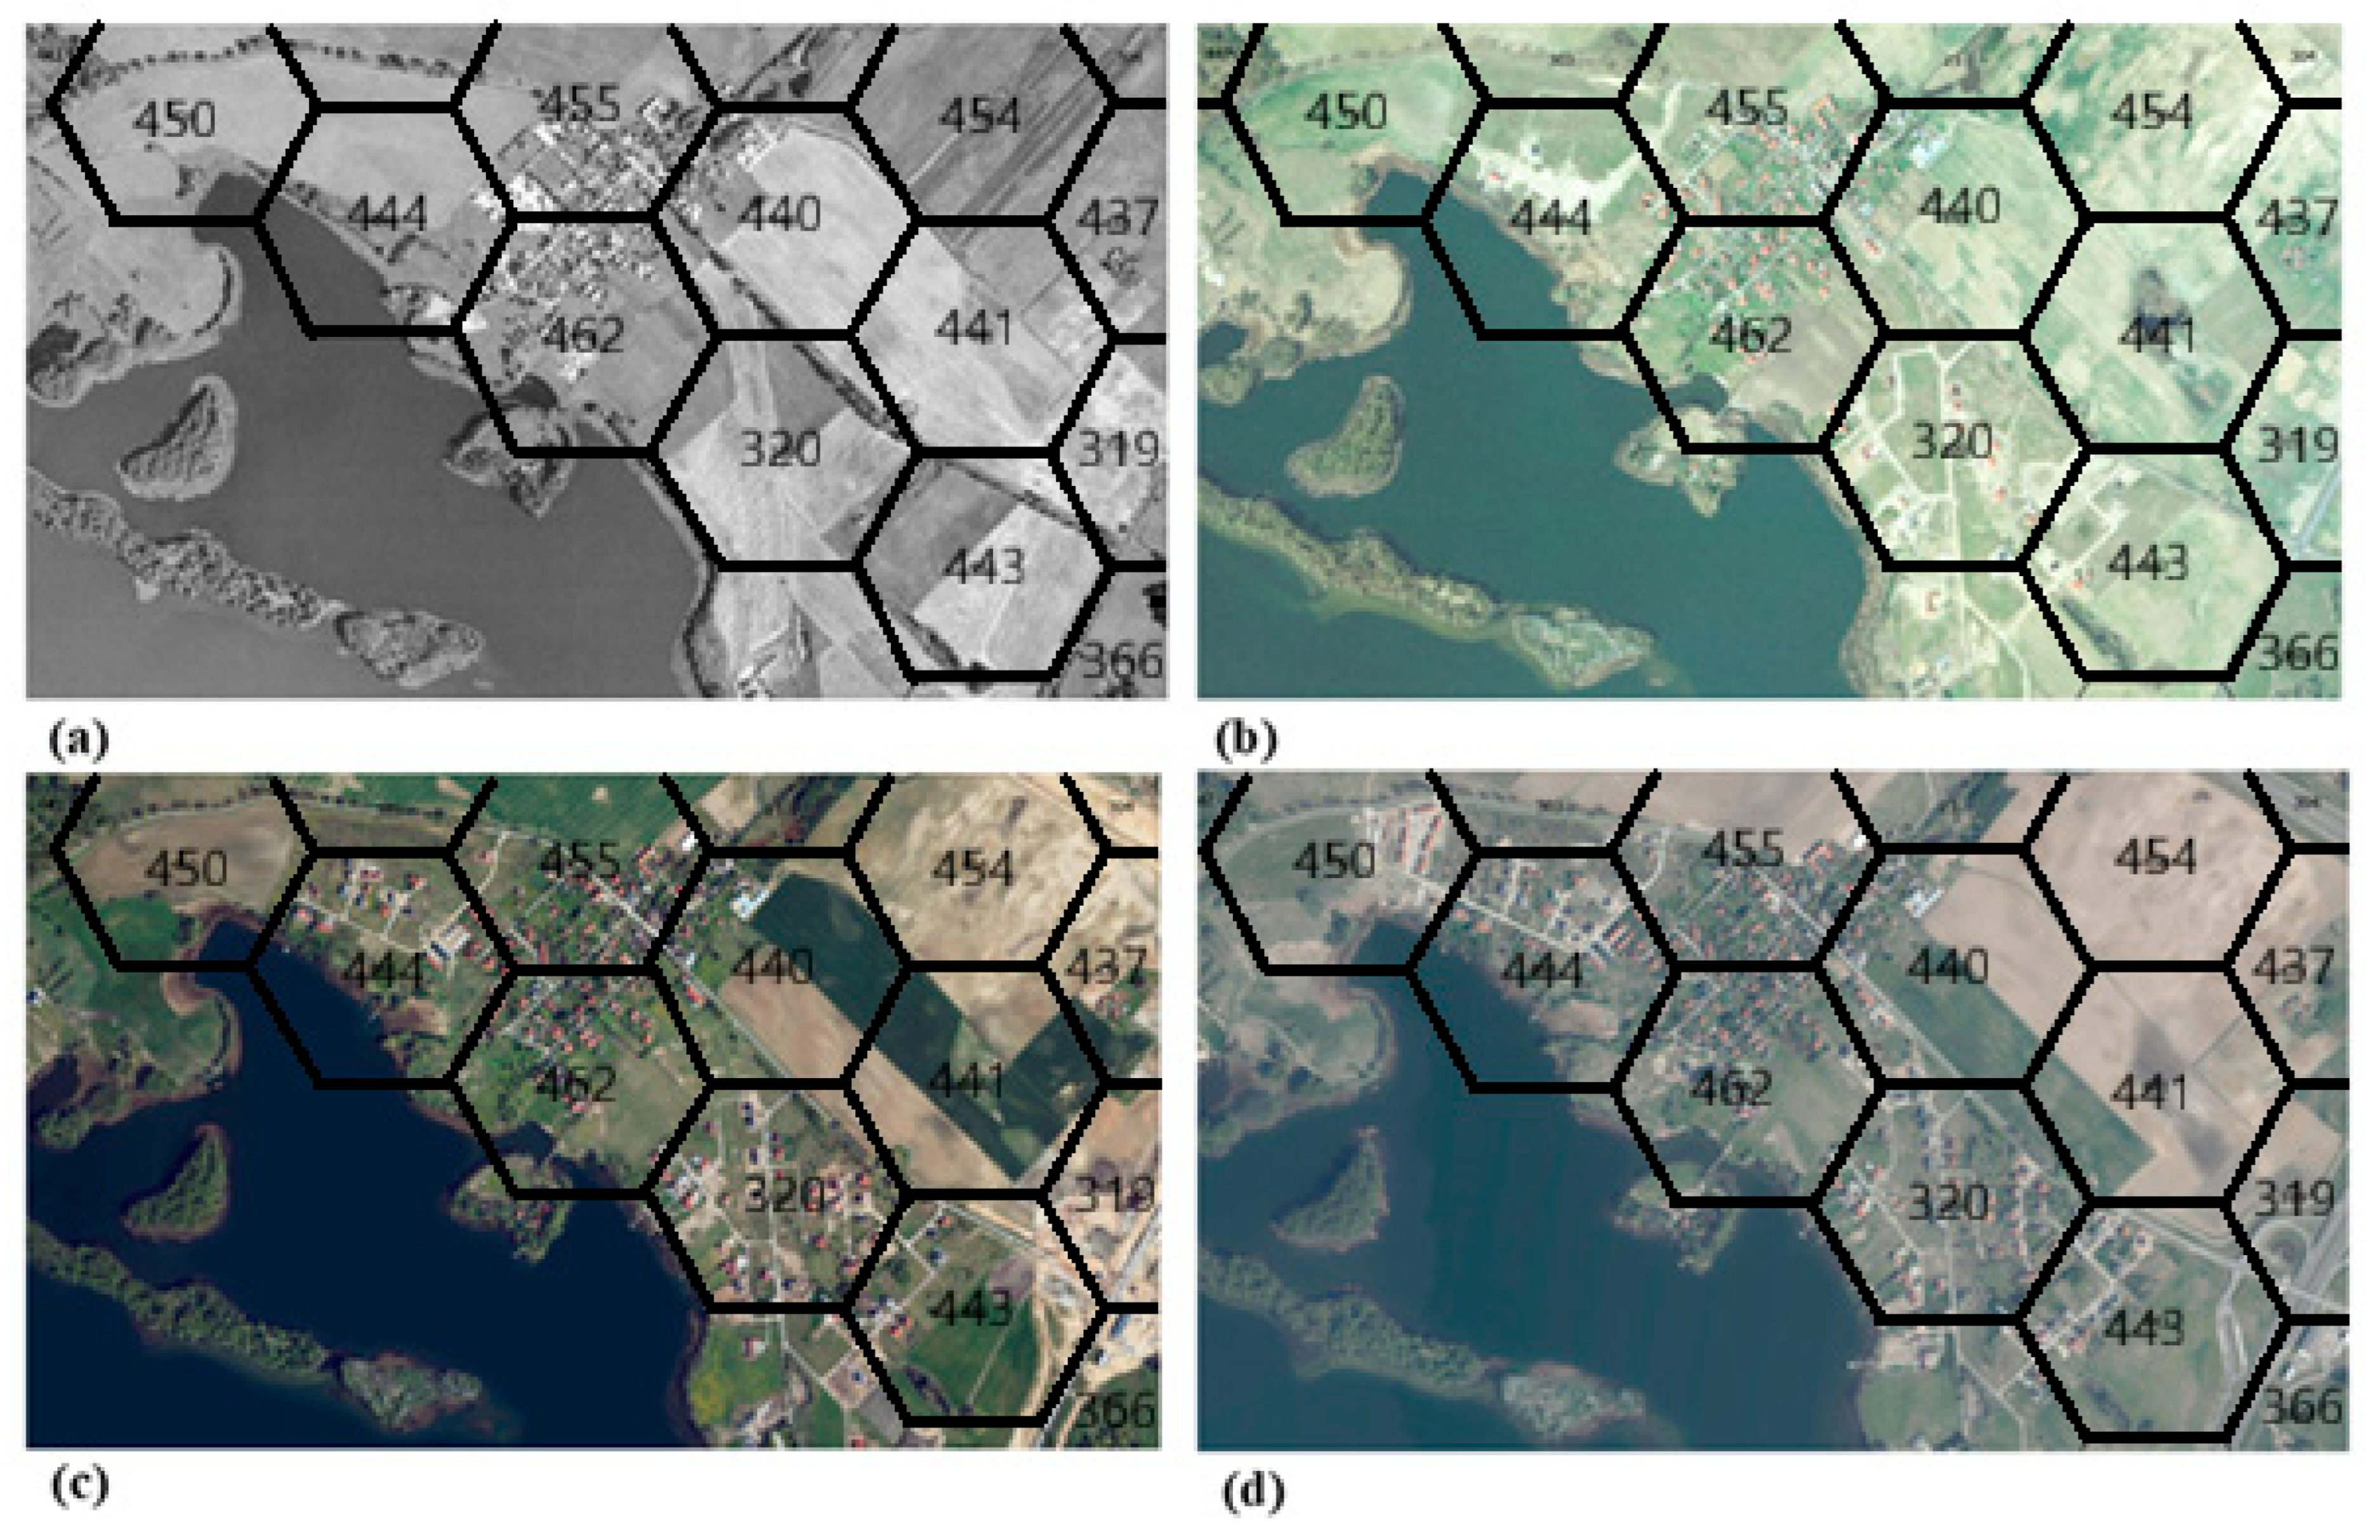
A study was conducted to identify areas of high risk for surface runoff and local flooding in the village of Tomaszkowo, located in the suburban zone of Olsztyn, covering an area of more than 200 hectares. In studies related to the evaluation of space, the best solution is the use of geometric fields. They allow the preparation of cartographic studies that present a complete picture of the research results, for example, through interpolation. The best solution is interpolation on objects whose points to be interpolated are equidistant from each other (isosceles triangles and hexagons, in which the centres of the base fields are the interpolation points). The size of the fields is related to the study area and evaluation features. The study used orthophotos from 2005, 2010, 2017, and 2022—
Figure 4, topographic maps (at a scale of 1:10,000), data from land and building records, and data from a site visit.
The study area was divided into hexagonal survey fields of 200,000 m2 each. Twenty-four types of use are usually used in the study: Single-family homes—MN, Multi-family housing—MW, Services—U, Sports and recreational areas—US, Commercial facilities with a sales area larger than 2000 m2—UC, Agricultural land—R, Orchards and horticulture farms—RS, Auxiliary services for farms, breeding centers, horticulture farms, forests and fish farms—RU, Farmstead buildings in crop, livestock and horticulture farms—RM, Industrial plants and warehouses—P, Mining areas—PG, Forests—ZL, Organized green spaces—ZP, Natural (unorganized) green spaces—ZN, Gardens—ZD, Cemeteries—ZC, Marine surface waters—WM, Inland surface waters—WS, Public roads—KD, Internal roads—KDW, Water transport routes—KW, Technical infrastructure—IT, Special areas—military, police—TS, Construction sites—B. In the studied area, we recognized five types of use: MN, RM, P, KD, 2B.
2.2.3. GLDAS Data
The GLDAS model is globally distributed and contains 28 different fields that are geophysical parameters. The model is published in the form of four submodels (land surface models)—VIC (Variable Infiltration Capacity Model), NOAH (National Centers for Environmental Prediction/Oregon State University/Air Force/Hydrologic Research Lab Model), MOSAIC and CLM (Common Land Surface Model). The purpose of the GLDAS model is to regularly publish grids containing land surface states (e.g., soil moisture and temperature) and flows (e.g., evapotranspiration) [
33].
Using the GLDAS model, time series of the water budget components were obtained from precipitation (P), evapotranspiration (EV), and surface runoff (SRO). Due to the fact that GLDAS model resolution is not suitable for local and small-area studies, all observations were subjected to the downscaling process using the machine learning algorithm prepared by the authors. The graph showing the distribution of these parameters over time is presented in
Figure 5.
2.3. Methodology
This study employs a multi-stage methodology to identify high-risk areas for surface runoff and local flooding in Tomaszkowo, Poland. The research integrates geospatial analysis, digital terrain modelling, and hydrological data assessment to evaluate the impact of urbanization on flood risks. The research methodology is presented in
Figure 6.
The first stage involves data collection from multiple sources. ALS data, obtained from the ISOK Project, provides elevation information. From the .las file, point class 2, which represents ground points, was extracted for further processing. These data serve as the basis for generating a DTM. Additionally, land use inventory (LUI) data from 2004, 2010, 2014, and 2022 were collected to analyze changes in land cover and urban expansion. Hydrological data from the GLDAS were also acquired, including parameters such as surface runoff, evapotranspiration, and overall water balance, to assess hydrological trends over time.
In the second stage, the DTM was developed using the extracted ground points from ALS data. The DTM was then used to calculate terrain slopes, which are crucial in surface runoff dynamics. The kslope coefficient, representing terrain inclination, was determined to assess areas prone to rapid surface runoff. This step provides critical insights into how topographical changes influence water flow patterns.
The third stage focuses on land use and urbanization analysis. GIS techniques, the study examines land use changes over time, identifying trends such as urban expansion and the reduction of permeable surfaces. Areas experiencing significant decreases in green spaces and increases in built-up infrastructure are mapped and analyzed to determine their impact on runoff intensification. At this stage, important parameters are determined: fsealed (share of sealed surface).
The fourth stage involves a hydrological assessment based on GLDAS data. The SRO, P and EV components are analyzed to understand variations over different time periods. EV is calculated equal to and taken into account fsealed parameter. These data are correlated with land use changes and topographical modifications to determine the extent to which urbanization influences the water budget.
The fifth stage integrates all acquired data and models to calculate water budget by combining land use changes, slope analysis, and hydrological modelling, spatial analysis techniques in GIS are used to map zones most susceptible to flooding. Model integration is carried out by using resultant models for the purpose of modifying evapotranspiration values. Parameter is modified according to introduction percentage of terrain covered by impermeable surface (calculated from the LUI model) and terrain slope from DTM. The weakest part of the study in terms of accuracy is the GLDAS model itself, whose available resolution does not allow for local studies. Therefore, the model was downscaled to the resolution of the study area. Due to the natural water flow in the environment, the GLDAS model’s accuracy was deemed sufficient for the conducted research.
The temporal integration of the models used depends on model availability. The LUC model is available for four periods: 2005, 2010, 2017, and 2022. Because the waterlogging problem has been recognized and documented recently, the ALS model was created for the final stage of the LUC model, 2022. GLDAS observations are continuous, and the time series were chosen to include studies just before and just after the first and last LUC model runs.
This comprehensive methodological approach ensures an in-depth assessment of the relationship between urbanization and local flood risks, offering valuable insights for future spatial planning and sustainable water management.
All data and models used in the research are freely and openly distributed via the internet:
4. Results
The water budget was determined using the formula:
The purpose of such balancing is to hydrologically assess the availability of water in a given ecosystem or region. If precipitation is greater than the sum of evapotranspiration and surface runoff, the water balance is positive, i.e., the soil or a given area accumulates water (surplus supply from water loss in the system). Conversely, the water balance is negative if precipitation is less than the water runoff from the system. Water budget is crucial in water management, in particular in calculating irrigation needs in agriculture, analyzing flood risks and assessing the impact of climate change on water resources. The water budget is computed for the model using Formula (2); moreover, compared with the energy budget (EB), using formula:
In
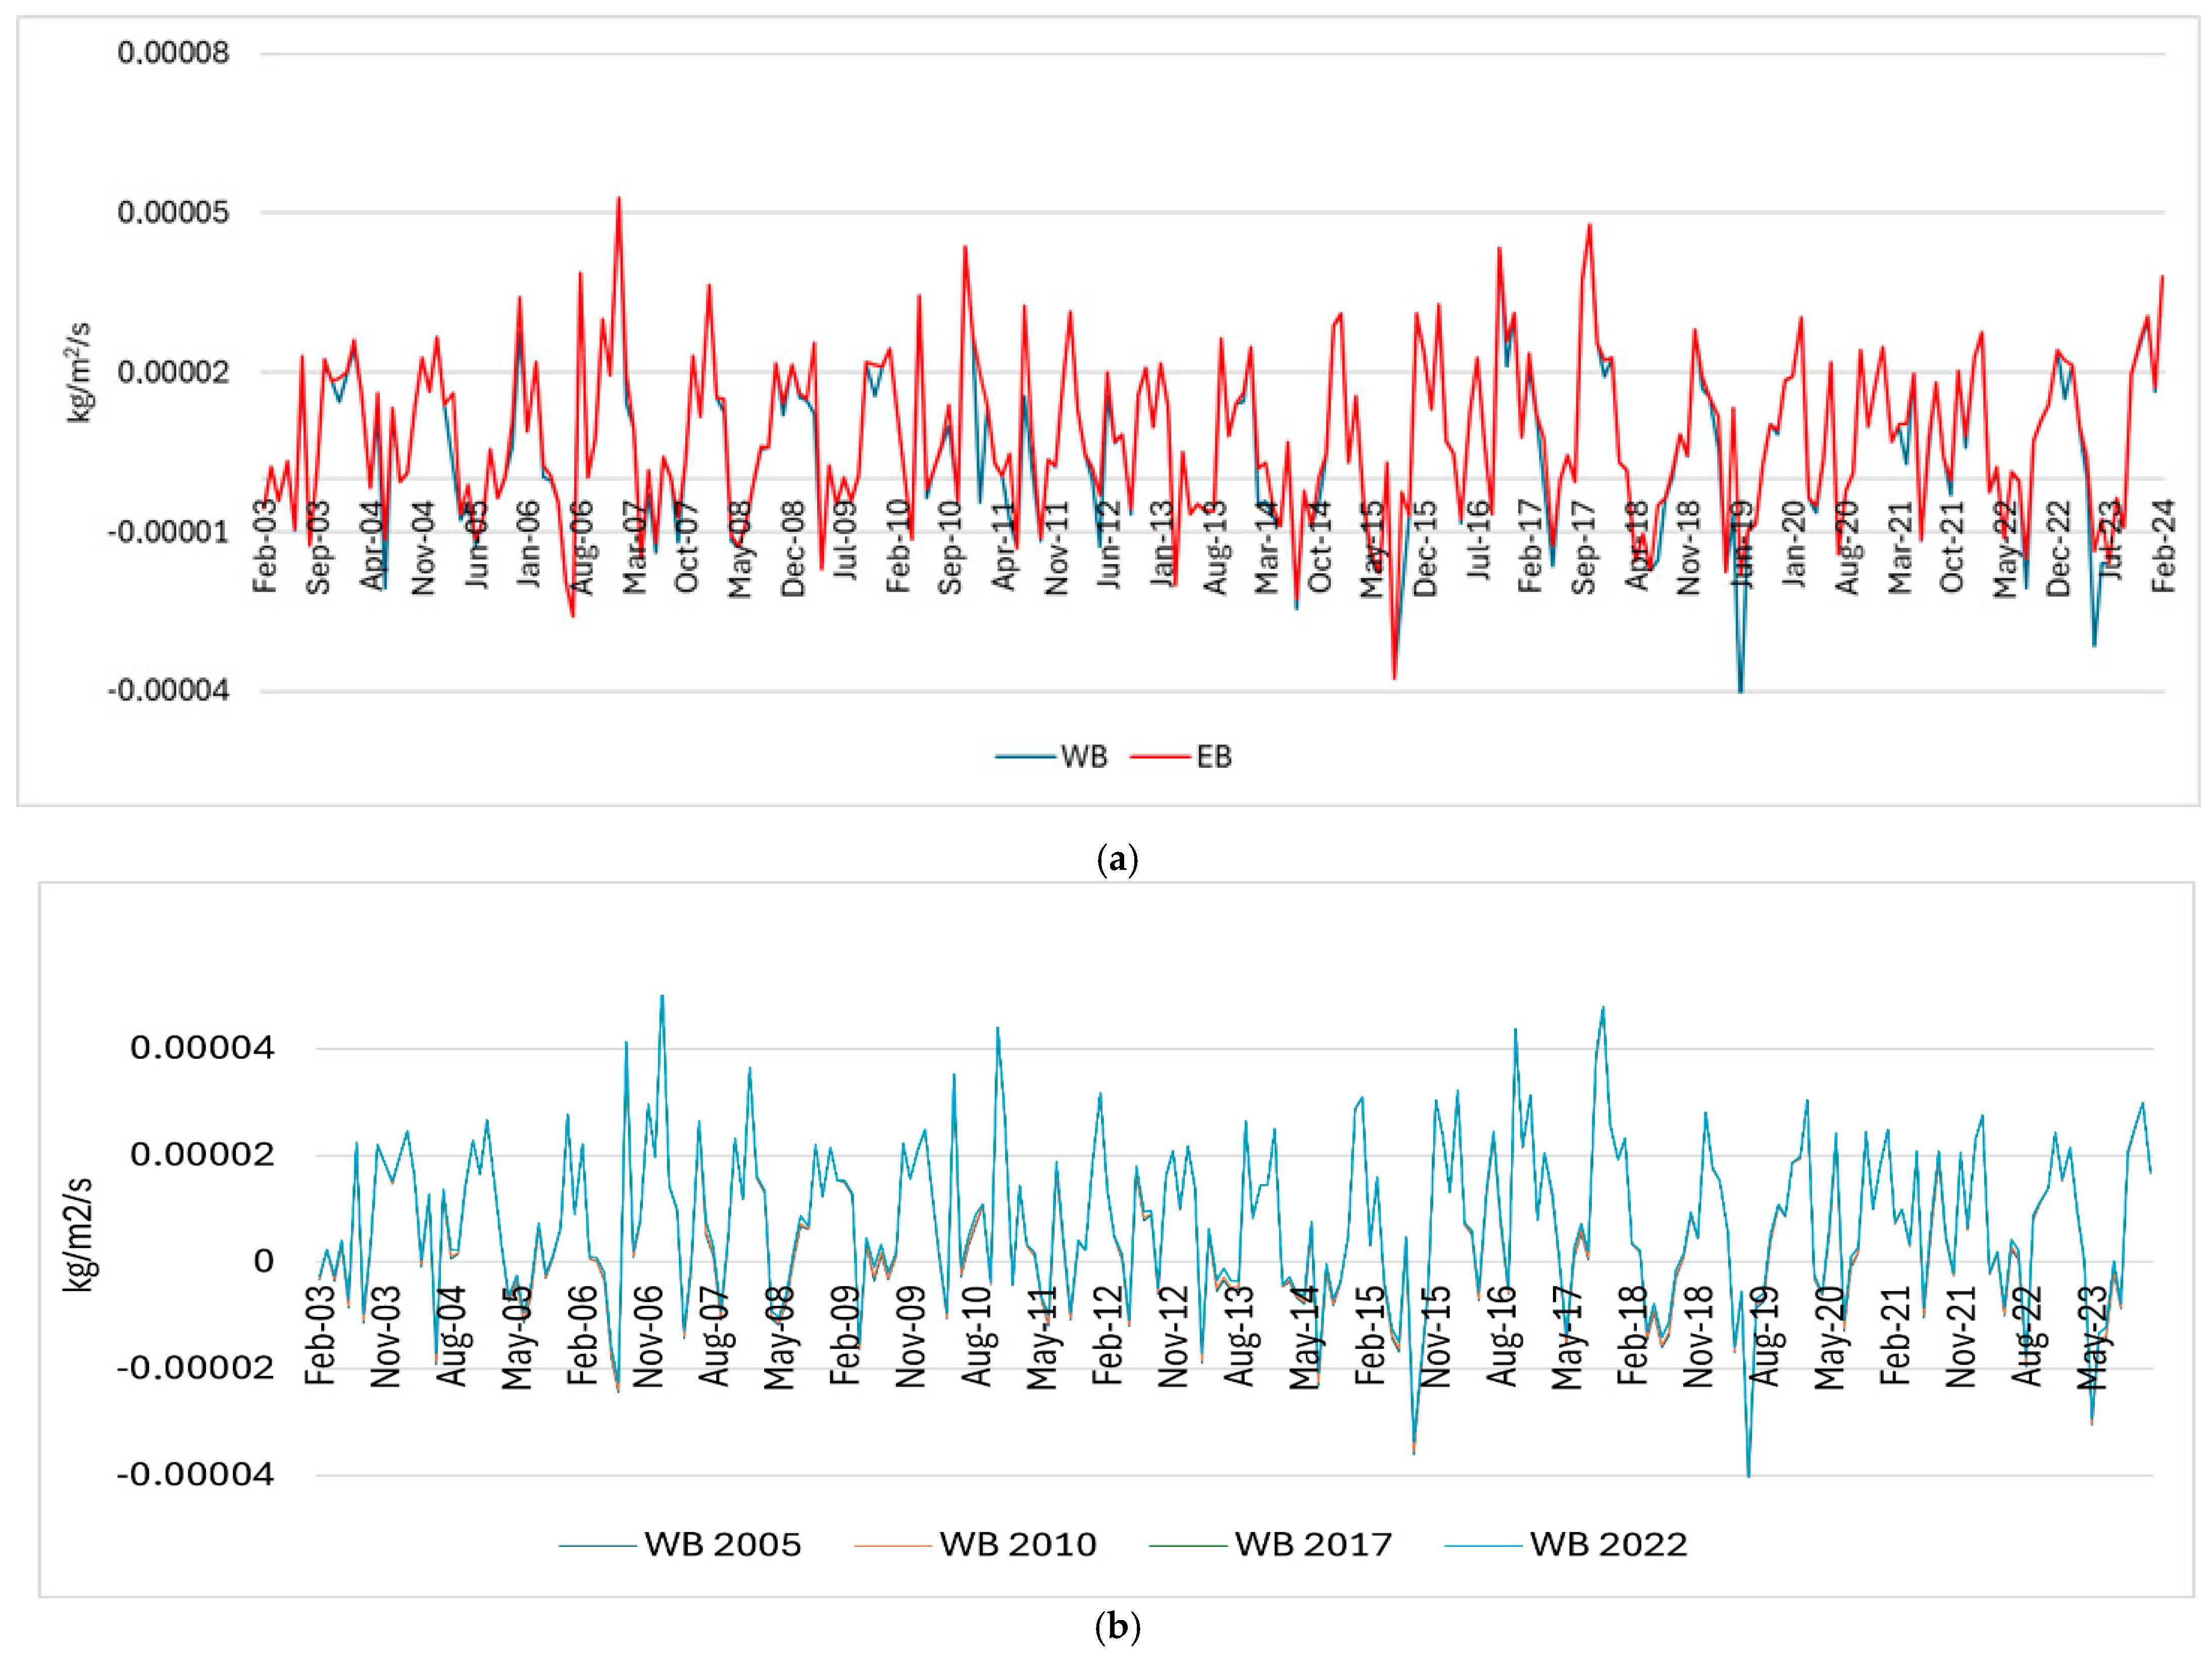
Figure 11a, the water and energy budgets are compared. The correlation between the time series was 0.96. It is noted here how important surface runoff is in some periods. For example, the periods January 2011, April 2012, or June 2019 show a very large share of surface runoff in the water budget. Interestingly, periods of such runoff do not occur either in periods of melting snow or in periods of the heaviest precipitation; they seem to be quite random cases. Such differences, but of lesser impact, appear from time to time in the course of the time series.
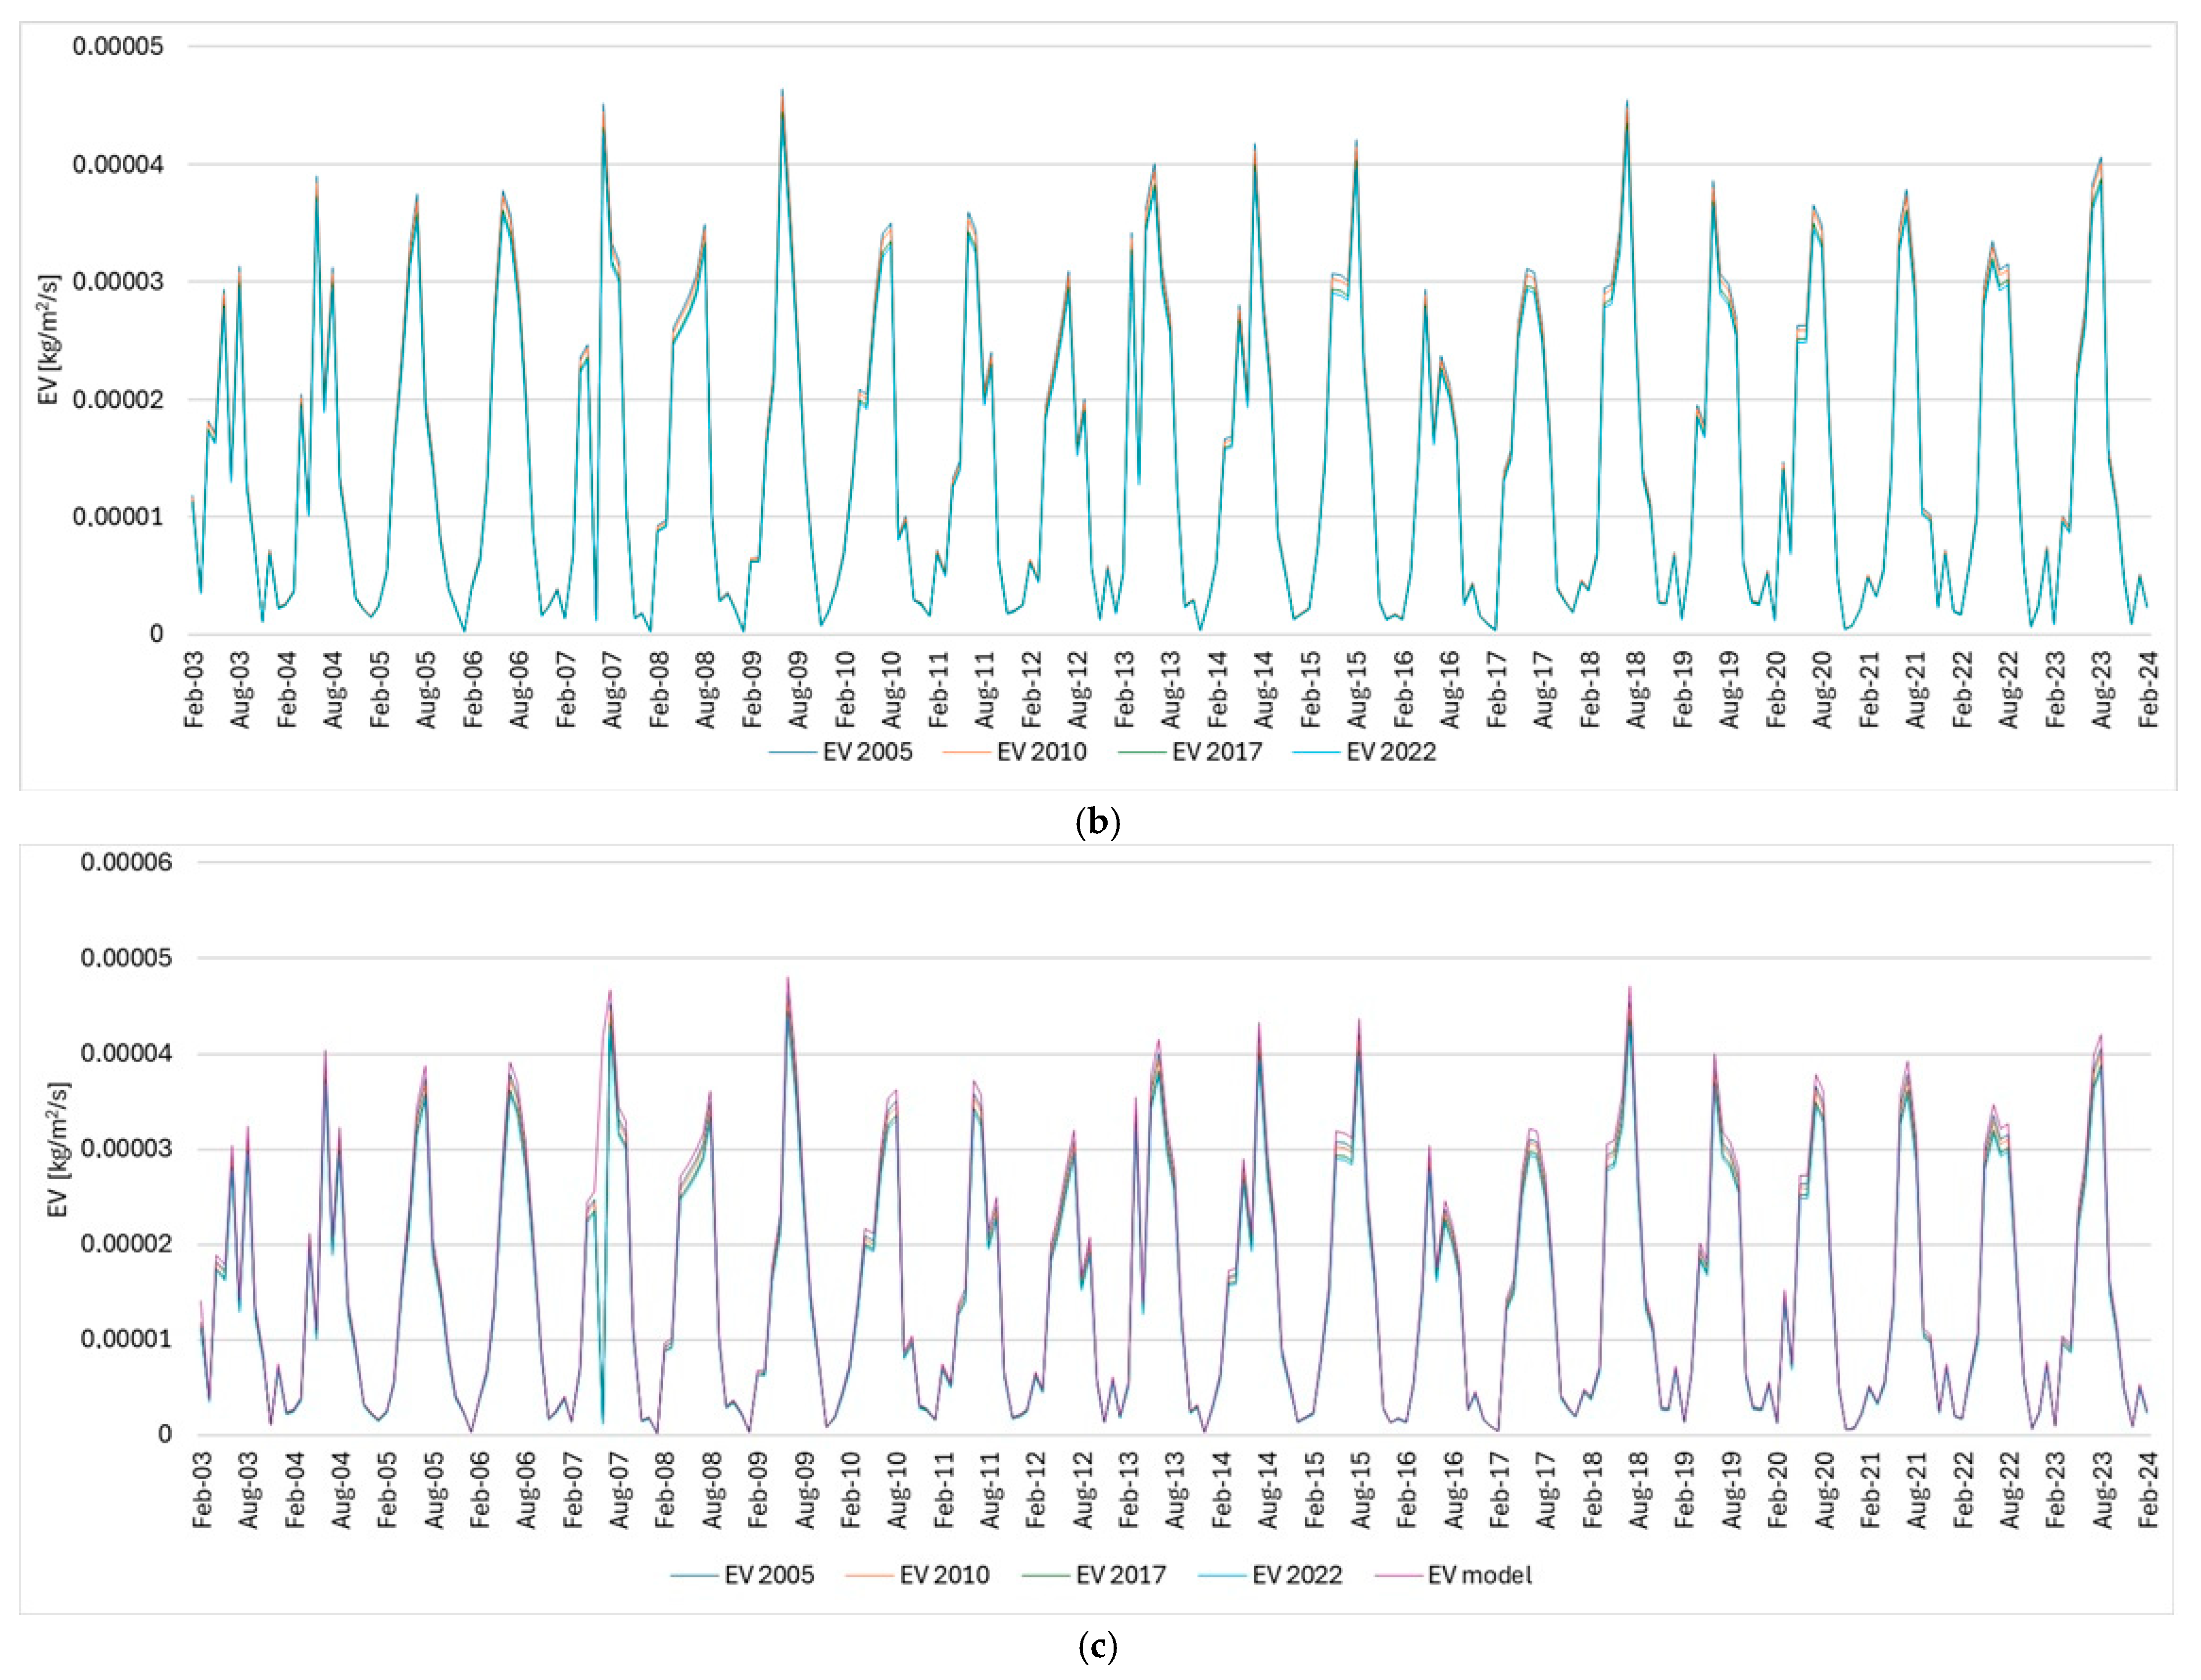
Figure 10b shows the water budget calculated using modified evapotranspiration. The correlation between the individual time series is 0.99. It can be concluded that the factors taken into account do not have a significant impact on the water budget.
It should be noted that the water budget in Tomaszkowo assumes ‘BELOW NORMAL’ values in summer periods, with the highest values in July. The remaining seasons are characterized by ‘ABOVE NORMAL’ values, which means a surplus of precipitation over the loss from the water system. Typically, the amplitude of water budget changes is 0.00004 kg/m2/s (from −0.00002 kg/m2/s to 0.00002 kg/m2/s). This occurs in the periods 2002–2005, 2008–2013, and 2019–2023. In the remaining periods, the amplitude is higher. Of particular note are the significant ‘BELOW NORMAL’ values in August 2005, August 2019, and May2023 reaching −0.00004 kg/m2/s, and the particularly high ‘ABOVE NORMAL’ values reaching 0.00005 kg/m2/s in December 2006, November 2010, October 2016, and December 2017.
It was shown, based on the research, that the slope of the terrain is small; therefore, there is no strong outflow of water towards the lake adjacent to the studied area (in areas with a slope of up to 3%, it is assumed that the terrain is flat). The area is regularly built up; therefore, the area with limited infiltration and evapotranspiration disorders is growing, but over the years these are not drastic changes. Surface runoff was found to be significant during the study. A particularly interesting phenomenon was observed since 2013, when precipitation significantly decreased, and surface runoff was the same or even greater. This must be influenced by surface development. Therefore, the next step was the analysis of the soil, because, as it was proved, soil content and structure can change the infiltration process and in Poland let be infiltrated about half of the water that should potentially be absorbed was infiltrated [
39].
The soil map for the study area was analyzed (
Appendix A,
Figure A1). The studied area is covered equally with brown soils (B) and brown podsolic luvisols (A), which are the most common soils in Poland, and their porosity is assessed as medium—the porosity coefficient was determined to be 0.42 [
39,
40]. Gleyic soils (G) were found at the lake border. Soil formations were also analyzed. Light clay sands predominate in the studied area, changing to silt at a depth of 50 cm and to light dusty clay at a depth of 100 cm; light clay sands changing to weakly clayey sand at a depth of 50 cm and to light clay at a depth of 100 cm; and loose clayey sand changing to silt at a depth of 50 cm and to light dusty clay at a depth of 100 cm. Light clayey sand changing to dusty clay at a depth of 50 cm is found closer to the lake. As can be seen, the studied area is dominated by clay or loamy soils, which are characterized by a constant granulometric fraction below 0.002 mm. In such formations, water movement, i.e., water movement in the soil, is characterized by the water permeability of soils at one of the lowest levels. Permeability determines the movement of water during the absorption of rainwater by the soil and percolation, i.e., filtration. Clay and dust formations have a filtration coefficient of 10
−6–10
−8 cm/s (for clays) and 10
−9–10
−10 cm/s (for silts). For comparison, fine gravel has a filtration coefficient of 10–10
−1 cm/s. It seems that the greatest influence on local basement flooding is mainly the ground. It, therefore, seems reasonable to carry out ground drainage [
41].
5. Discussion and Conclusions
A relevant study on DTM hydrology is of moderate interest to scientists. The paper [
42] discusses the frequency of floods and their increasing number due to increasing urbanization, but also extreme climate change. Huge benefits of using the LIDAR system in flood monitoring have been noticed. The author also noted the enormous potential of integrating LIDAR and remote sensing observations in DTM hydrology. The topic of GLDAS evapotranspiration modification and the influence of slope in different areas was discussed, for example, in [
43]. It was noted that precipitation has the greatest impact on the water budget, while evapotranspiration and surface runoff interpreted using DTM in the study areas play a lesser role, especially considering Poland’s strong seasonality and variable solar radiation. DTM hydrology was also described in [
44], but it examined the groundwater aspect. Hydrological research based on landform analysis allowed authors to research how the groundwater level influenced the attractiveness of the parcel. A significant influence of the slope of the terrain was observed on the level and fluctuations of groundwater.
It was noted in [
9] that floods are the main natural disaster in Poland, and the risk of their occurrence is significant. It is worth noting that rainfall floods are increasing in the changing climate, which is particularly noticeable in increasingly sealed urban areas. Flood risk management in Poland has been assessed as insufficient. Flood risk management plans were included in the first planning period, 2016–2021 and for the second planning period, 2022–2027. The document that outlines the state’s policy includes the Water Law [
45]. However, the cited document excludes flooding resulting from overloaded urban drainage and sewer systems. This is undoubtedly a threat that is becoming increasingly common across the country. It was also emphasized in [
46] that observations from 1966–2020 showed a significant response of precipitation to the changing climate. Strong and widespread upward trends in precipitation, and on the other hand, downward trends in snowfall, significantly increase the risk of pluvial floods, also in winter. Throughout the entire study area, the construction of single-family homes is legal and requires the issuance of an appropriate building permit. Construction restrictions are primarily related to soil classification (prohibiting construction on valuable, high-quality land and on organic soils), but these conditions are not met here. The local municipal plan does not include any plans to finance land use changes in the study area or implement measures to improve water runoff. Pursuant to the aforementioned Water Law, a fee for reducing natural land retention has been in force in Poland since 1 January 2018. Such a fee is payable in the event of construction works or structures permanently attached to the ground being carried out on properties exceeding 3500 m
2, which excludes more than 70% of the property’s surface from biologically active areas. However, the LUC analysis did not indicate that such an amount of biologically active area was excluded from the study area.
The study analyzed the water budget of the Tomaszkowo area, examining its components and factors influencing its fluctuations. The primary motivation was to identify the causes of water stagnation and assess the impact of urbanization on water balance. To achieve this, analyses were conducted on precipitation, evapotranspiration (modified due to terrain slope and concrete coverage), surface runoff, and soil structure over the period 2003–2023.
An important stage of the research was, above all, taking into account several sources of information: ALS, GLDAS and LUI, which made it possible to determine the parameters necessary for the correct interpretation of the existing problem of local flooding.
The findings indicate that:
The soil composition, predominantly consisting of clay and loam formations, plays a crucial role in water retention. These soil types have low permeability, making water absorption difficult. Continuous urban development may further exacerbate infiltration challenges.
A significant decrease in precipitation has been observed since 2014. Simultaneously, surface runoff has remained constant or even increased, indicating further limitations in water infiltration.
The water balance exhibits “BELOW NORMAL” values during summer, peaking in July, while other seasons are characterized by “ABOVE NORMAL” values.
Based on the research, it can be said that soil analysis confirms the presence of impermeable surfaces exacerbating factor on a pre-existing condition. The prevailing clay and loamy soils in the area contain a granulometric fraction below 0.002 mm, leading to very low water permeability and restricted soil water movement.
The research provides a comprehensive understanding of the current situation. Future urban expansion should prioritize maintaining permeable surfaces, such as green areas, to support water infiltration. Partial soil replacement is recommended, involving the removal of the top layer of low-permeability soil and its replacement with more permeable materials such as gravel or sand. Additionally, soil loosening techniques, including mechanical loosening or stabilization with sand, gravel, or cement, can be applied to enhance permeability and mitigate water stagnation.
It seems that the obstacles to implementing blue-green solutions include technical deficiencies and insufficient funding, which could alter the use pattern, or a lack of willingness and financial resources to implement infrastructure that prevents water accumulation. A solution would certainly be to change the definition of flooding in the Water Law, which would oblige local authorities to take action.
Further research should focus on the long-term effects of urbanization on the water budget, particularly concerning climate change and shifting precipitation patterns. Additionally, advanced hydrological modelling could be employed to predict future changes in surface runoff and infiltration rates. Investigating the effectiveness of different soil stabilization techniques in improving drainage efficiency would also be beneficial. Finally, exploring sustainable urban planning strategies, such as permeable pavements and green infrastructure, could provide valuable insights for mitigating water stagnation in developing areas.

