Thurstonian Scaling for Sensory Discrimination Methods
Abstract
1. Introduction
2. Materials and Methods
2.1. Estimating Values and Their Variances from Psychometric Functions of Some Basic Sensory Discrimination Methods
2.2. Statistical Testing for Test Sample vs. Control Sample Based on the Individual Estimator and Its Variance
2.2.1. Difference Test for Test Sample vs. Control Sample Based on Individual and Their Variance
2.2.2. Equivalence/Similarity Test for Test Sample vs. Control Sample Based on Individual and Its Variance
2.3. Statistical Testing for Multiple Test Samples Based on Multiple Values and Their Variances
2.3.1. Difference Test for Multiple Test Samples Based on Multiple Values and Their Variances
2.3.2. Multiple Comparisons for Multiple Test Samples Based on the Vector and Co-Variance Matrix
2.3.3. TOST Equivalence/Similarity Test for Two Test Samples Based on Two Values and Their Variances
3. Results
3.1. Estimated Values and Their Variances from Psychometric Functions of 10 Basic Sensory Discrimination Methods
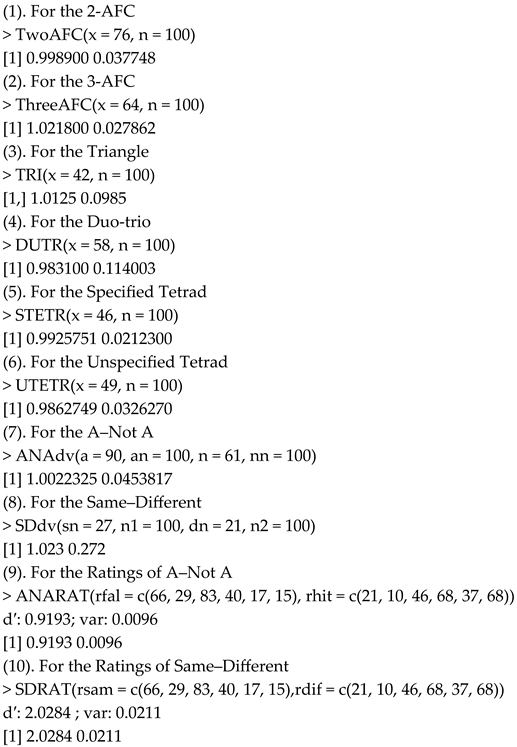

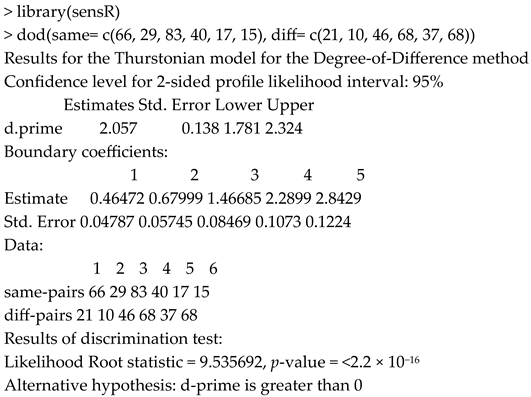
3.2. Statistical Testing for Test Sample vs. Control Sample Based on the Individual Estimator and Its Variance
3.2.1. Difference Test Based on the Individual and Their Variance
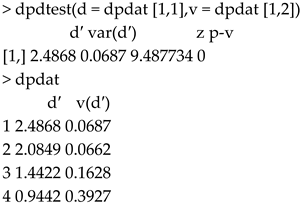
3.2.2. Equivalence/Similarity Test Based on the Individual and Its Variance

3.3. Statistical Testing for Multiple Test Samples Based on Multiple Values and Their Variances
3.3.1. Difference Test for Multiple Test Samples Based on Multiple Values and Their Variances

3.3.2. Multiple Comparisons for Multiple Test Samples Based on the Vector and Co-Variance Matrix
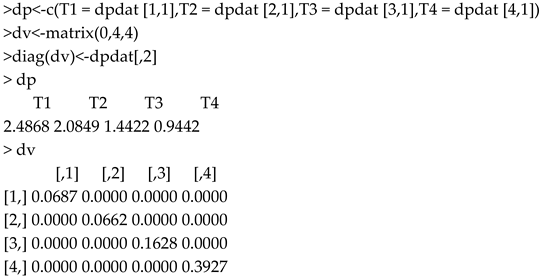

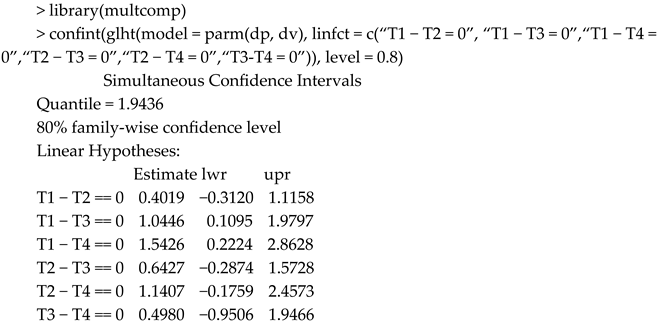
3.3.3. TOST Equivalence/Similarity Test Based on Two Values and Their Variances

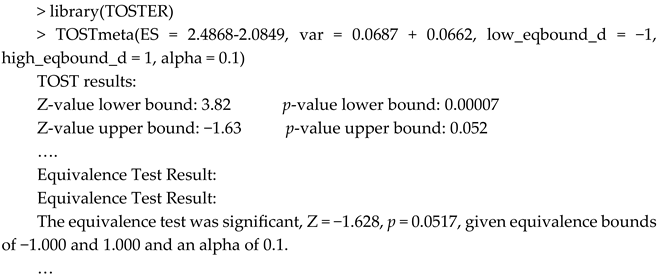
4. Discussion
4.1. Application of Sensory Discrimination Methods
- (1)
- Identification of subtle differences before becoming easily perceptible that might indicate spoilage (unpleasant smells, visual changes, taste off-flavors and unexpected texture changes) or foreign substances (chemical residues, cleaning agents, etc.) or contaminants from processing or packaging (metals, dirt, plastics, etc.);
- (2)
- Threshold testing to estimate the minimum level detectable to provide a measurable threshold when a product should be considered changed or unsafe;
- (3)
- For shelf life, quality control, and monitoring quality, an example being rancidity that can develop in fats and oils with age;
- (4)
- Detection of mold odors indicating potential mycotoxins or presence of fermentation or yeast activity in foods;
- (5)
- Contamination from off-flavors during processing due to improper equipment cleaning or cross-contact with other foods;
- (6)
- Determination if consumers can reliably differentiate standard (control) vs. contaminated or adulterated foods or changes in processing environment and the perceived associated consumer risk—how the perception of the sensory difference affects consumer acceptance to align safety margins with consumer expectations for safety and high quality;
- (7)
- For assessor training to increase reliability; and
- (8)
- Development of rapid sensory-based screening tools like electronic noses or tongues by quantifying how these devices mimic human sensory evaluations; Thurstonian models can validate instrumental data accuracy in detecting subtle contamination levels that might not yet be harmful but that could lead to consumer rejection.
4.2. Significance of Differences
- (1)
- No Perceptual Difference ( = 0): A d-prime of zero suggests that the two products are indistinguishable from one another by the assessors. Their sensory distributions completely overlap, meaning any difference perceived by the panel could be due to chance or noise.
- (2)
- Small Perceptual Difference ( between 0.5 and 1.0): A d-prime in this range indicates that there is a slight but perceptible difference between the two products. However, it might be subtle, and not all assessors will consistently detect the difference.
- (3)
- Moderate Perceptual Difference between 1.0 and 2.0): A d-prime in this range suggests a moderate difference that many assessors are likely to detect. It indicates that products are distinguishable based on their sensory characteristics.
- (4)
- Large Perceptual Difference above 2.0): A d-prime greater than 2.0 signals a strong perceptual difference, where most assessors can easily distinguish between the two products. The sensory profiles are clearly different, and these differences are unlikely to be ignored by consumers or trained assessors. In summary, a low indicates products are very similar or indistinguishable, a moderate suggests there is a noticeable difference between products and a high signifies products are highly distinct in sensory perception.
4.3. Advantages of Thurstonian discriminal distance ( or d′)
4.4. Application of Thurstonian Scaling for Food Quality and Safety
4.5. Government Organizations
4.6. Future Trends
5. Conclusions
Supplementary Materials
Author Contributions
Funding
Institutional Review Board Statement
Informed Consent Statement
Data Availability Statement
Conflicts of Interest
References
- Meilgaard, M.; Civille, G.; Carr, B. Sensory Evaluation Techniques; Taylor & Francis: Boca Raton, FL, USA, 2006. [Google Scholar]
- Lawless, H.T.; Heymann, H. Sensory Evaluation of Food: Principles and Practices, 2nd ed.; Springer: New York, NY, USA, 2010. [Google Scholar]
- Stone, H.; Bleibaum, R.; Thomas, H.A. Sensory Evaluation Practices; Academic Press: New York, NY, USA, 2020. [Google Scholar]
- Rogers, L. Discrimination Testing in Sensory Science: A Practical Handbook; Woodhead Publishing: Duxford, UK, 2017. [Google Scholar]
- Rogers, L.; Hort, J.; Kamp, S.E.; Hollowood, T. Discrimination Testing in Sensory Evaluation; Wiley: Hoboken, NJ, USA, 2024. [Google Scholar]
- ASTM. Annual Book of ASTM Standards; ASTM International: West Conshohocken, PA, USA, 2021; Volume 14. [Google Scholar]
- ASTM-E2262-03; Standard Practice for Estimating Thurstonian Discriminal Distances. ASTM International: West Conshohocken, PA, USA, 2021.
- ASTM-E1885-18; Test Method for Sensory Analysis—Triangle Test. ASTM International: West Conshohocken, PA, USA, 2018.
- ASTM-E3009-24; Standard Test Method for Sensory Analysis—Tetrad Test. ASTM International: West Conshohocken, PA, USA, 2024.
- ASTM-E2610-18; Test Method for Sensory Analysis—Duo-Trio Test. ASTM International: West Conshohocken, PA, USA, 2018.
- ASTM-E2139-05; Standard Test Method for Same-Different Test. ASTM International: West Conshohocken, PA, USA, 2018.
- ASTM-E2164-16; Standard Test Method for Directional Difference Test. ASTM International: West Conshohocken, PA, USA, 2016.
- ISO 4120:2021; Sensory Analysis—Methodology—Triangle Test. ISO: Geneva, Switzerland, 2021. Available online: https://www.iso.org/standard/76666.html (accessed on 17 January 2025).
- EN ISO 5495:2005/Amd 1:2016; Sensory Analysis—Methodology—Paired Comparison Test). ISO: Geneva, Switzerland, 2005. Available online: https://www.iso.org/standard/67425.html (accessed on 17 January 2025).
- ISO 6658:2017; Sensory Analysis—Methodology—General Guidance. ISO: Geneva, Switzerland, 2017. Available online: https://www.iso.org/standard/65519.html (accessed on 17 January 2025).
- ISO 8588:2017; Sensory Analysis—Methodology—“A”—“Not A” Test. ISO: Geneva, Switzerland, 2017. Available online: https://www.iso.org/standard/63403.html (accessed on 17 January 2025).
- ISO 10399:2017; Sensory Analysis—Methodology—Duo-Trio Test. ISO: Geneva, Switzerland, 2017. Available online: https://www.iso.org/standard/74219.html (accessed on 17 January 2025).
- Thurstone, L.L. A law of comparative judgement. Psychol. Rev. 1927, 34, 273–286. [Google Scholar] [CrossRef]
- Ura, S. Pair, triangle, and duo-trio test. Rep. Stat. Appl. Res. JUSE 1960, 7, 107–119. [Google Scholar]
- David, H.A.; Trivedi, M.C. Pair, Triangle, and Duo-Trio Tests; Tech. Rep. 54; Virginia Polytechnic Institute: Blacksburg, VA, USA, 1962. [Google Scholar]
- Bradley, R.A. Some relationship among sensory difference tests. Biometrics 1963, 19, 385–397. [Google Scholar] [CrossRef]
- Frijters, J.E.R. Variations of the triangular method and the relationship of its unidimensional probabilistic models to 3-altenative forced choice signal detection theory models. Br. J. Math. Stat. Psychol. 1979, 32, 229–242. [Google Scholar] [CrossRef]
- Frijters, J.E.R. Sensory difference testing and the measurement of sensory discriminability. In Sensory Analysis of Foods, 2nd ed.; Piggott, J.R., Ed.; Elsevier Applied Science Publishers: London, UK, 1988; pp. 117–140. [Google Scholar]
- Ennis, D.M.; Mullen, K.; Frijters, J.E.R. Variants of the method of triads: Unidimensional Thurstonian models. Br. J. Math. Stat. Psychol. 1988, 41, 25–36. [Google Scholar] [CrossRef]
- Ennis, D.M. The power of discrimination methods. J. Sens. Stud. 1993, 8, 353–370. [Google Scholar] [CrossRef]
- Ennis, D.M. Thurstonian Models: Categorical Decision Making in the Presence of Noise; The Institute for Perception: Richmond, VA, USA, 2016; ISBN 9780990644606/099064460X. [Google Scholar]
- Ennis, D.M.; Rousseau, B. A Thurstonian model for the degree of difference protocol. Food Qual. Prefer. 2015, 41, 159–162. [Google Scholar] [CrossRef]
- Bi, J.; Ennis, D.M.; O’Mahony, M. How to estimate and use the variance of d’ from difference tests. J. Sens. Stud. 1997, 12, 87–104. [Google Scholar] [CrossRef]
- Bi, J. Sensory Discrimination Tests and Measurements: Sensometrics in Sensory Evaluation, 2nd ed.; Wiley; Blackwell Publishing: Oxford, UK, 2015. [Google Scholar]
- Bi, J. Variance of d’ for the same-different method. Behav. Res. Methods Instrum. Comput. 2002, 34, 37–45. [Google Scholar] [CrossRef]
- Bi, J. The methods of Tetrads, Hexads, and Octads: A type of more powerful sensory discrimination methods. Food Qual. Prefer. 2023, 108, 104879. [Google Scholar] [CrossRef]
- Bi, J.; O’Mahony, M. Variance of d’ for the tetrad test and comparisons with other forced choice methods. J. Sens. Stud. 2013, 28, 91–101. [Google Scholar] [CrossRef]
- Bi, J.; Kuesten, C. Review and development of Thurstonian models for the triangle and duo-trio methods and paired versions of the methods. J. Sens. Stud. 2020, 35, e12569. [Google Scholar] [CrossRef]
- Bi, J.; Kuesten, C. Thurstonian models for the duo-trio and its variants. J. Sens. Stud. 2024, 39, e12949. [Google Scholar] [CrossRef]
- Bi, J.; Lee, H.S.; O’Mahony, M. Statistical analysis of ROC curves for the ratings of the A-Not A and the Same-Different methods. J. Sens. Stud. 2013, 28, 34–46. [Google Scholar] [CrossRef]
- Bi, J.; Lee, H.S.; O’Mahony, M. Estimation of Thurstonian models for various forced-choice sensory discrimination methods as a form of the ‘M+N’ test. J. Sens. Stud. 2014, 29, 325–338. [Google Scholar] [CrossRef]
- Bi, J.; Kuesten, C.; Lee, H.S.; O’Mahony, M. Paired versions of various sensory discrimination forced-choice methods and the same-different area theorem. Food Qual. Prefer. 2018, 63, 97–106. [Google Scholar] [CrossRef]
- Brockhoff, B.P.; Christensen, R.H.B. Thurstonian models for sensory discrimination tests as generalized linear models. Food Qual. Prefer. 2010, 21, 330–338. [Google Scholar] [CrossRef]
- Ennis, J.M. A Thurstonian analysis of the Two-Out-of-Five test. J. Sens. Stud. 2013, 28, 295–303. [Google Scholar] [CrossRef]
- Ennis, J.M.; Christensen, R. Thurstonian comparison of the Tetrad and Degree of Difference tests. J. Food Qual. Prefer. 2015, 40, 263–269. [Google Scholar] [CrossRef]
- Ennis, J.M.; Rousseau, B.; Ennis, D.M. Sensory difference tests as measurement instruments: A review of recent advances. J. Sens. Stud. 2014, 29, 89–102. [Google Scholar] [CrossRef]
- Rousseau, B.; O’Mahony, M. Sensory difference tests: Thurstonian and SSA predictions for vanilla flavored yogurts. J. Sens. Stud. 1997, 12, 127–146. [Google Scholar] [CrossRef]
- Rousseau, B.; Ennis, D.N. A Thurstonian model for the dual pair (4IAX) discrimination method. Percept. Psychophys. 2001, 63, 1083–1090. [Google Scholar] [CrossRef] [PubMed][Green Version]
- Green, D.M.; Swets, J.W. Signal Detection Theory and Psychophysics; Wiley: New York, NY, USA, 1966. [Google Scholar]
- Macmillan, N.A.; Creelman, C.D. Detection Theory: A User’s Guide, 2nd ed.; Lawrence Erlbaum Associates, Inc.: New York, NY, USA, 2004. [Google Scholar]
- Hautus, M.J.; Macmillan, N.A.; Creelman, C.D. Detection Theory: A User’s Guide, 3rd ed.; Taylor & Francis: New York, NY, USA, 2022. [Google Scholar]
- Christensen, R.H.B.; Brockhoff, B.P.; Kuznetsova, A.; Birot, S.; Stachlewska, K.A.; Rafacz, D. Package ‘sensR’. 2023. Available online: https://cran.r-project.org/web/packages/SensoMineR/index.html (accessed on 17 January 2025).
- Ennis, D.M.; Ennis, J.M. Analysis and Thurstonian scaling of applicability scores. J. Sens. Stud. 2013, 28, 188–193. [Google Scholar] [CrossRef]
- Warnock, A.R.; Shumaker, A.N.; Delwiche, J.F. Consideration of Thurstonian scaling of ratings data. Food Qual. Prefer. 2006, 17, 556–561. [Google Scholar] [CrossRef]
- R Core Team R: A Language and Environment for Statistical Computing; R Foundation for Statistical Computing: Vienna, Austria. 2023. Available online: https://www.R-project.org/ (accessed on 17 January 2025).
- Insightful. S-PLUS 6. In Guide to Statistics Vol.1. for Windows; Insightful Corporation: Seattle, WA, USA, 2001. [Google Scholar]
- Gilbert, P.; Varadhan, R. Accurate Numerical Derivatives, R Package “numDeriv”. 2019. Available online: https://cran.r-project.org/web/packages/numDeriv/index.html (accessed on 17 January 2025).
- Ennis, J.; Ennis, D.; Yip, D.; O’Mahony, M. Thurstonian models for variants of the method of tetrads. Brit. J. Math. Stat. Psychol. 1998, 51, 205–215. [Google Scholar] [CrossRef]
- Marascuilo, L.A. Large sample multiple comparisons. Psychol. Bull. 1966, 65, 280–290. [Google Scholar] [CrossRef] [PubMed]
- Marascuilo, L.A. Extension of the significance test for one-parameter signal detection hypotheses. Psychometrika 1970, 35, 237–243. [Google Scholar] [CrossRef]
- Hothorn, T.; Bretz, F.; Westfall, P.; Heiberger, R.M.; Schuetzenmeister, A.; Scheibe, S. R Package “multcomp”: Simultaneous Inference in General Parametric Models. 2023. Available online: https://cran.r-project.org/web/packages/multcomp/index.html (accessed on 17 January 2025).
- Westlake, W.J. Response to T.B.L. Kirkwood: Bioequivalence testing—A need to rethink. Biometrics 1981, 37, 589–594. [Google Scholar]
- Schuirmann, D.J. On hypothesis testing to determine if the mean of a normal distribution is contained in a known interval. Biometrics 1981, 37, 617. [Google Scholar]
- Schuirmann, D.J. A comparison of the two one-sided tests procedure and the power approach for assessing the equivalent of average bioavailability. J. Pharmacokinet. Biopharm. 1987, 15, 657–680. [Google Scholar] [CrossRef]
- Berger, R.L. Multiparameter hypothesis testing and acceptance sampling. Technometrics 1982, 24, 295–300. [Google Scholar] [CrossRef]
- Casella, G.; Berger, R.L. Statistical Reference; Wadsworth and Brooks/Cole: Pacific Grove, CA, USA, 1990. [Google Scholar]
- Berger, R.L.; Hsu, J.C. Bioequivalence trials, intersection union tests and equivalence confidence set. Stat. Sci. 1996, 11, 283–319. [Google Scholar] [CrossRef]
- Silvapulle, M.J.; Sen, P.K. Constrained Statistical Inference: Inequality, Order, and Shape Restrictions; Wiley: New York, NY, USA, 2004. [Google Scholar]
- Lakens, D.; Caldwell, A. R Package “TOSTER”: Two One-Sided Tests (TOST) Equivalence Testing. 2023. Available online: https://cran.r-project.org/web/packages/TOSTER/index.html (accessed on 17 January 2025).
- Swets, J.A. Measuring the accuracy of diagnostic systems. Science 1988, 240, 1285–1293. [Google Scholar] [CrossRef] [PubMed]
- O’Mahony, M. Understanding discrimination tests: A user-friendly treatment of response bias, rating and ranking R-Index tests and their relationship to signal detection. J. Sens. Stud. 1992, 7, 1–47. [Google Scholar] [CrossRef]
- Ennis, D.M.; Rousseau, B.; Ennis, J.M. Tools and Applications of Sensory and Consumer Science; The Institute for Perception: Richmond, VA, USA, 2017. [Google Scholar]
- Lee, H.-S.; Van Hout, D. Quantification of Sensory and Food Quality: The R-Index Analysis. J. Food Sci. 2009, 74, R57–R64. [Google Scholar] [CrossRef] [PubMed]
- Lee, H.-S.; O’Mahony, M. Sensory difference testing: Thurstonian models. Food Sci. Biotechnol. 2004, 13, 841–847. [Google Scholar]
- Lawless, H.T. Chapter 4 Thurstonian Models for Discrimination and Preference. In Quantitative Sensory Analysis Psychophysics, Models and Intelligent Design; John Wiley & Sons, Ltd., Wiley Blackwell: Hoboken, NJ, USA, 2013; pp. 71–123. [Google Scholar]
- Bi, J. Statistical models for the Degree of Difference method. J. Food Qual. Prefer. 2002, 13, 31–37. [Google Scholar] [CrossRef]
- Xia, T.; Gong, C.; Zeng, J. Publication review of Food Quality and Safety during 2017–2022. Food Qual. Saf. 2023, 7, fyad062. [Google Scholar] [CrossRef]
- Ray, S. Sensory Properties of Foods and Their Measurement Methods. In Techniques to Measure Food Safety and Quality; Khan, M.S., Shafiur Rahman, M., Eds.; Springer: Cham, Switzerland, 2021. [Google Scholar] [CrossRef]
- Kumar, A.; Castro, M.; Feller, J.-F. Review on Sensor Array-Based Analytical Technologies for Quality Control of Food and Beverages. Sensors 2023, 23, 4017. [Google Scholar] [CrossRef] [PubMed]
- Ma, M.; Yang, X.; Ying, X.; Shi, C.; Jia, Z.; Jia, B. Applications of Gas Sensing in Food Quality Detection: A Review. Foods 2023, 12, 3966. [Google Scholar] [CrossRef] [PubMed]
- Rodrigues, S.S.; Dias, L.G.; Telxeria, A. Emerging Methods for the Evaluation of Sensory Quality of Food: Technology at Service. Curr. Food Sci. Technol. Rep. 2024, 2, 77–90. [Google Scholar] [CrossRef]
- Sirangelo, T.M. Sensory Descriptive Evaluation of Food Products: A Review. J. Food Sci. Nutr. Res. 2019, 2, 354–363. [Google Scholar] [CrossRef]
- Perumal, A.B.; Li, X.; He, Y. Special Issue “Recent Advances in the Food Safety and Quality Management Techniques”. Foods 2024, 13, 4165. [Google Scholar] [CrossRef] [PubMed]
- Huang, Y.; Luo, C.; Xia, F.; Song, Y.; Jiang, L.; Li, F. Multi-analyte sensing strategies towards wearable and intelligent devices. Chem. Sci. 2022, 13, 12309–12325. [Google Scholar] [CrossRef]
- Liberty, J.T.; Sun, S.; Kucha, C.; Adedeji, A.A.; Agidi, G.; Ngadi, M.O. Augmented reality for food quality assessment: Bridging the physical and digital worlds. J. Food Eng. 2024, 367, 111893. [Google Scholar] [CrossRef]
- Cui, F.; Zheng, S.; Wang, D.; Tan, X.; Li, Q.; Li, J.; Li, T. Recent advances in shelf life prediction models for monitoring food quality. Compr. Rev. Food Sci. Food Saf. 2023, 22, 1257–1284. [Google Scholar] [CrossRef]
- Valdramidis, V.; Cummins, E.; Celayeta, J.M.F. Predictive Modelling of Food Quality and Safety Special Issue. Food Control 2013, 29, 289–470. [Google Scholar] [CrossRef]

| No. | Methods | Psychometric Functions | R-Codes |
|---|---|---|---|
| 1 | 2-AFC | TwoAFC(x,n) | |
| 2 | 3-AFC | ThreeAFC(x,n) | |
| 3 | Triangle | TRI(x,n) | |
| 4 | Duo-trio | DUTR(x,n) | |
| 5 | Specified Tetrad | STETR(x,n) | |
| 6 | Unspecified Tetrad | UTETR(x,n) | |
| 7 | A–Not A | ANAdv(a,an,n,nn) | |
| 8 | Same–Different | SDdv(sn,n1,dn,n2) | |
| 9 | Ratings of A–Not A | , | ANARAT(rfal,rhit) |
| 10 | Ratings of Same–Different | , | SDRAT(rsam,rdif) |
| No. | ||
|---|---|---|
| 1 | 2.4868 | 0.0687 |
| 2 | 2.0849 | 0.0662 |
| 3 | 1.4422 | 0.1628 |
| 4 | 0.9442 | 0.3927 |
Disclaimer/Publisher’s Note: The statements, opinions and data contained in all publications are solely those of the individual author(s) and contributor(s) and not of MDPI and/or the editor(s). MDPI and/or the editor(s) disclaim responsibility for any injury to people or property resulting from any ideas, methods, instructions or products referred to in the content. |
© 2025 by the authors. Licensee MDPI, Basel, Switzerland. This article is an open access article distributed under the terms and conditions of the Creative Commons Attribution (CC BY) license (https://creativecommons.org/licenses/by/4.0/).
Share and Cite
Bi, J.; Kuesten, C. Thurstonian Scaling for Sensory Discrimination Methods. Appl. Sci. 2025, 15, 991. https://doi.org/10.3390/app15020991
Bi J, Kuesten C. Thurstonian Scaling for Sensory Discrimination Methods. Applied Sciences. 2025; 15(2):991. https://doi.org/10.3390/app15020991
Chicago/Turabian StyleBi, Jian, and Carla Kuesten. 2025. "Thurstonian Scaling for Sensory Discrimination Methods" Applied Sciences 15, no. 2: 991. https://doi.org/10.3390/app15020991
APA StyleBi, J., & Kuesten, C. (2025). Thurstonian Scaling for Sensory Discrimination Methods. Applied Sciences, 15(2), 991. https://doi.org/10.3390/app15020991


