1. Introduction
Reading is a complex visuomotor task involving both a precise performance of the visual and oculomotor system when guiding the reader throughout the text, and a success in the principal components of reading, i.e., phonological awareness, phonics, vocabulary, fluency, and comprehension [
1]. During reading, the eyes perform continuous movements from word to word called saccades, as well as regressions that are backward saccades aimed to read a previously read part of the text and refixations that are small-amplitude saccades within the same word. In between saccades, a relatively stable eye position called fixation is acquired during which the visual information, i.e., letters and words in reading, is obtained. Fixations usually last about 200–300 ms, but can last longer depending on the text complexity and other parameters [
2].
The relation between saccadic eye movement programming and the higher information processes in reading has been widely discussed in the context of how the perceptual, cognitive, and motor systems interact during the reading process [
3,
4,
5]. Based on different models of eye movement control in reading, saccadic eye movement programming is considered to be driven either by the completion of the lexical processing of a certain word [
6,
7] or by a random timer that initiates saccadic programming independently from the lexical processing [
8,
9]. There are other models of saccadic eye movement programming during reading (e.g., SERIF); however, they are out of the scope of the current research.
Early reading development is associated with the executive cognitive functions, i.e., shifting attention, inhibition of dominant responses, working memory, and cognitive flexibility, all of which begin to develop in infancy [
10,
11,
12]. It has been demonstrated that executive function performance as early as in infancy can be related to reading performance developing later in life [
13,
14]. Reading acquisition has also been attributed to a stage-like process during which children learn visual discriminations of letters and words, grapheme-phoneme correspondences and identifying words (orthographic stage) [
15]. Different stages of reading development and performance have also been reflected in eye tracking studies, indicating that as reading proficiency increases, shorter fixations, larger-amplitude saccades and less regressions and refixations are observed [
16,
17]. Reading patterns in children are also subjected to the language and its orthographic complexity and predictability [
18].
Children with reading difficulties not only present with lower reading rates, accuracy, fluency, and reading comprehension [
19], but also demonstrate different performance in the objective measurement of eye movements during reading tasks, i.e., higher number of fixations, increased average fixation duration, reduced average saccadic duration, as well as increased total number of saccades and average number of fixations [
20,
21,
22,
23,
24,
25]. Rayner et al. [
26] suggested that the reduced eye movement performance in reading tasks might reflect the comprehension processes in reading. But, since reading is a complex cognitive task involving a precise coordination between the processes of visual perception, attention, phonological awareness and other cognitive processes [
27], as well as the oculomotor system guiding the fixation from a word to the next word, the analysis of reading eye movements does not reveal whether the differences in the eye movement performance are related to oculomotor dysfunction or if they serve as an indicator of the cognitive load.
Pavlidis [
28] proposed that patients with dyslexia present with more corrective saccades in sequential non-reading saccade tasks, and had troubles with maintaining a stable fixation comparing to the control group, therefore indicating that patients with dyslexia might also present with oculomotor dysfunction. Following the results of Pavlidis [
28], several other studies have also indicated reduced performance in different eye movement tasks in children with reading difficulties (including dyslexia). Biscaldi et al. [
29] demonstrated that children with dyslexia have lower performance in anti-saccade tasks. Fukushima demonstrated that children with learning difficulties (including reading and mathematical disorders) have longer latencies in memory-guided and anti-saccade tasks, as well as lower smooth pursuit gain than the control group. Eden et al. [
30] demonstrated that dyslexic children not only have more jerking movements in the smooth pursuit tasks, but also present with reduced fixation stability comparing to the control group. The study by Tiadi et al. [
31] also indicated on impaired fixation stability in children with dyslexia, demonstrating that children with dyslexia exhibit more saccadic eye movements during fixations compared to non-dyslexic children, suggesting potential deficits in cortical structures responsible for saccade suppression and fixation control, as well as attentional deficiencies in children with dyslexia. Caldani et al. [
32] found that pursuit performance significantly improved with age in non-dyslexic children, while the number of catch-up saccades during pursuit movements was higher in dyslexic children. Finally, a more recent study by Bilbao and Pinero [
33] also indicated lower saccadic eye movement performance (more hypometric saccades) in children with neurodevelopmental disorders (including dyslexia).
Significant differences in oculomotor performance in children with and without reading difficulties have also been demonstrated in the DEM test, which is an objective method designed to evaluate eye movements in horizontal and vertical directions, including reading-like conditions [
29,
34]. Children with reading difficulties demonstrate poorer results in all standard metrics of the horizontal DEM test (both horizontal and vertical), indicating on oculomotor deficiencies [
35,
36,
37].
The previously mentioned studies clearly demonstrate reduced oculomotor performance in children with dyslexia; however, the general take on whether children with reading difficulties of nonspecific cause present with oculomotor abnormalities is still under debate. A recent study by Vinuela-Navarro [
38] did not demonstrate any difference in saccadic main sequence parameters, nor in the number of saccadic eye movements during the fixation task between children with and without delayed reading skills. And as opposed to above, Black et al. [
39,
40] demonstrated that there are no significant differences in saccadic eye movement latency, accuracy, and velocity parameters, nor a difference in smooth pursuit parameters, in children with and without dyslexia.
It is clear that all of the above-mentioned studies have applied different research designs, including the selection of the eye movement parameters, for their analyses, different methodologies for data analysis, and have applied different criteria for subject selection, which is a crucial part of these studies. Could the observed differences in previous studies be attributed to different methods applied for determining reading dysfunctions and dyslexia? The current study aims to provide a comprehensive eye movement analysis in children with and without reading difficulties determined by the Acadience® Reading literacy assessment tool. Therefore, determining whether reduced oculomotor performance observed in children with dyslexia also applies to children with reading difficulties of nonspecific cause.
2. Method
2.1. Participants
Altogether, 379 children (6–13 years old; 183 boys and 196 girls) from four basic education schools of Latvia were voluntarily involved in the study. Since the number of participants who were 6 years old (n = 6) and 13 years old (n = 1) was low, only the data from 7–12-year-old children were involved in further data analysis, leading to 371 children (7–179 boys and 192 girls) as the final number of participants. The demographic statistics of the participant data are represented in
Table 1. All participants underwent general visual function evaluation, including visual acuity at near (65 cm) and eye dominance evaluation (Dolman test). Only the participants with the uncorrected binocular and monocular visual acuity of at least 0.6 decimal units (with or without contact lens correction) were involved in the eye tracking study. None of the children reported any previous eye diseases or other functional disorders that could affect eye movement parameters.
2.2. Reading Skills
Reading skills were determined with the Acadience
® Reading (formerly DIBELS Next) literacy assessment tool, which had been adapted and validated for Latvian language [
41,
42]. Reading performance was evaluated by professional speech therapists certified for the Acadience
® Reading test performance. Children with reading performance below the 20th percentile were regarded as with reading difficulties (RDs), and children whose performance was above the 20th percentile were regarded as the control group (CG). Of all participants, 97 children were included in the RD group and 275 children were included in the CG.
The research was carried out in accordance with the requirements of the Declaration of Helsinki. The study was approved by the Life and Medical Sciences Research Ethics Committee of the University of Latvia (No. 13.06.2022). Children were involved in the study on a voluntary basis, based on a written consent provided by their parents or their legal guardians. The children and the parents/legal guardians were informed about the aim and the full process of the study, the equipment, and their responsibilities and rights throughout the study.
2.3. Eye Tracking
Eye movements were recorded with Tobii Pro Fusion (120 or 250 Hz) video-oculograph (Tobii, Sweden) in dark pupil illumination mode. Sampling frequency of 120 Hz was applied in recordings of saccadic and smooth pursuit eye movements, while the 250 Hz sampling frequency was applied for fixation stability measurements. Stimuli were demonstrated on DELL P2419H 23.8” computer screen (52.7 × 29.6 cm; 1920 × 1080 px). Data recording for each participant was performed only once, and the approximate recording time was around 10 min. The participants were seated at a distance of 65 cm from the computer screen, the head position was fixed with chin and forehead rests, the height of the chair was adjusted so that the visual stimuli were at the participant’s eye level. The participants were instructed to keep their heads as still as possible and to change their gaze only with their eyes. All data were collected during a single session, and participants were allowed to take a break when necessary and continue the eye movement task afterwards.
2.4. Saccadic Eye Movement Evaluation
Saccadic eye movement evaluation started with the calibration (5 points) and validation (4 points) of the eye tracker. If the calibration accuracy did not reach 0.5 degrees, a repeated calibration and validation process was performed. The calibration and validation stimulus and background color settings were identical to the experimental settings—black stimuli (5 cd/m
2; RGB (0, 0, 0)) demonstrated on a light grey background (90 cd/m
2; RGB (179, 179, 179)) [
43].
After the calibration and validation, a fixation cross appeared at the center of the screen (3 s), after which the saccadic eye movement stimulus appeared in one of four positions (up, down, left, or right) relative to the central fixation object. Saccadic eye movement stimuli were either a circle or a star (depending on the task) 0.7 degrees in size. The distance from the center of the fixation cross to the center of the saccadic eye movement target was 11.3 degrees in the vertical positions and 14.0 degrees in the horizontal positions.
Two saccadic eye movement tasks were presented to the participants—(1) a reflexive saccade task and (2) an anti-saccade task (
Figure 1). In the reflexive saccade task, participants were instructed to shift their gaze (make a saccade) from the fixation cross to the stimulus (circle) presented in the periphery as soon as soon as the stimulus appeared in either of the positions (left, right, up or down from the fixation cross). After the saccadic stimulus disappeared (5 s), the participants were instructed to return to the fixation stimulus. Note that during the presentation of the saccadic eye movement stimulus, the fixation cross was no longer visible. In the anti-saccade task, the participants were instructed to make a gaze transfer (anti-saccade) in the opposite direction from the saccadic eye movement stimulus (star), but with the same amplitude as the distance of the presented stimulus. When the anti-saccade stimulus disappeared, the participants were instructed to return to the fixation stimulus.
Saccadic eye movement data were extracted and analyzed using Tobii Pro Lab software, working in accordance with the Tobii Pro Fusion eye tracker. Tobii I-VT and ClearView filters were applied to determine fixations, saccades, and blinks [
44]. Only monocular data for the dominant eye were used in further data analysis. The data for saccadic eye movement analysis included 352 (171 boys and 181 girls) participants who managed to record at least one saccade or more with the Tobii Pro Fusion device. Of all participants whose saccadic eye movements were analyzed, 90 had reading difficulties (RD), and 256 children were included in the control group (CD). In order to determine the minimum sample size required for the study, power analysis (G*Power version 3.1.9.7) was conducted (Faul et al., 2007 [
45]). The results of the power analysis indicated that the required sample size to achieve 80% power for detecting a medium effect (f = 0.25), at a significance criterion of α = 0.05, was N = 60 for ANOVA: repeated-measures within–between interaction. Thus, the obtained sample size of N = 346 is sufficient to test the study hypothesis. Data analysis was performed using the Microsoft Excel, RStudio, and SPSS programs.
To obtain information about the first saccade towards the target object, the Tobii Pro Lab function for AOI (Area of Interest) analysis was applied. The area of interest (an area invisible to the observer) was placed in the center of the screen, where the fixation stimulus was located before the presentation of saccadic eye movement stimulus. In order to obtain the necessary saccadic eye movement parameters, the peak velocity of the exit saccade (saccade from the AOI towards the target) was determined. The peak velocity of saccadic eye movements was determined using a single-parameter I-VT filter with a peak velocity threshold of 30°/s [
44].
The saccadic eye movement amplitude was calculated based on raw data analysis. The amplitude of saccadic eye movements was determined in Microsoft Excel using the following equation (Equation (1)):
where
x1 and
x2 are the horizontal gaze coordinates before and after the saccade, respectively (px), and
y1 and
y2 are the vertical gaze coordinates before and after the saccade, respectively (px).
In order to estimate saccadic eye movement accuracy, only the first saccade towards the saccadic target was taken into account. Saccadic eye movement accuracy was calculated in Microsoft Excel using the following equation (Equation (2)):
where
Se represents the landing error (cm) and
Te represents the distance between the gaze position after the saccade and the center of the saccadic target (cm).
Landing error
Se represents the vector size between the coordinates of the gaze direction after the saccade (
—the actual amplitude of saccadic eye movements) and the coordinates of the center of the saccadic target (
—representing the distance from the fixation point to the center of the target). Therefore, the magnitude of the landing error depends on the location of the saccadic target, including the direction and distance. The following equation based on the Euclidean distance was applied to calculate the landing error (Equation (3)):
where
a represents the distance between the center of the fixation point and the center of the target (px) and
b represents the amplitude of saccadic eye movements (px).
Since the experiment for each participant was performed only once (without replications), a portion of the data (saccades at specific directions) were not obtained due to blinking, distractions, or other factors. These data were referred as “
Unclassifide” or “
EyesNotFound” by Tobii Pro Fusion. In order to ensure a successful data analysis without excluding the already obtained results from children who had some of the data missing, missing data replacement was performed. In order to evaluate the amount and the possible source of missing data, a
missing value analysis was performed in SPSS. The results of the missing value analysis were not statistically significant (
p = 0.386), therefore enabling the substitution of missing values [
46]. Scheffer [
47] concluded that mean value or median substitution can be only applied if less than 10% of the data is missing, and if more than 10% is missing, the regression or ML algorithm should be applied. In order to include all of the children in the further data analysis, the K-Nearest Neighbors Algorithm (KNN) with k = 10 was applied for handling the missing data. KNN is a simple classification method or algorithm that determines the class of a target object based on the class most frequently found in its nearest neighbors [
48].
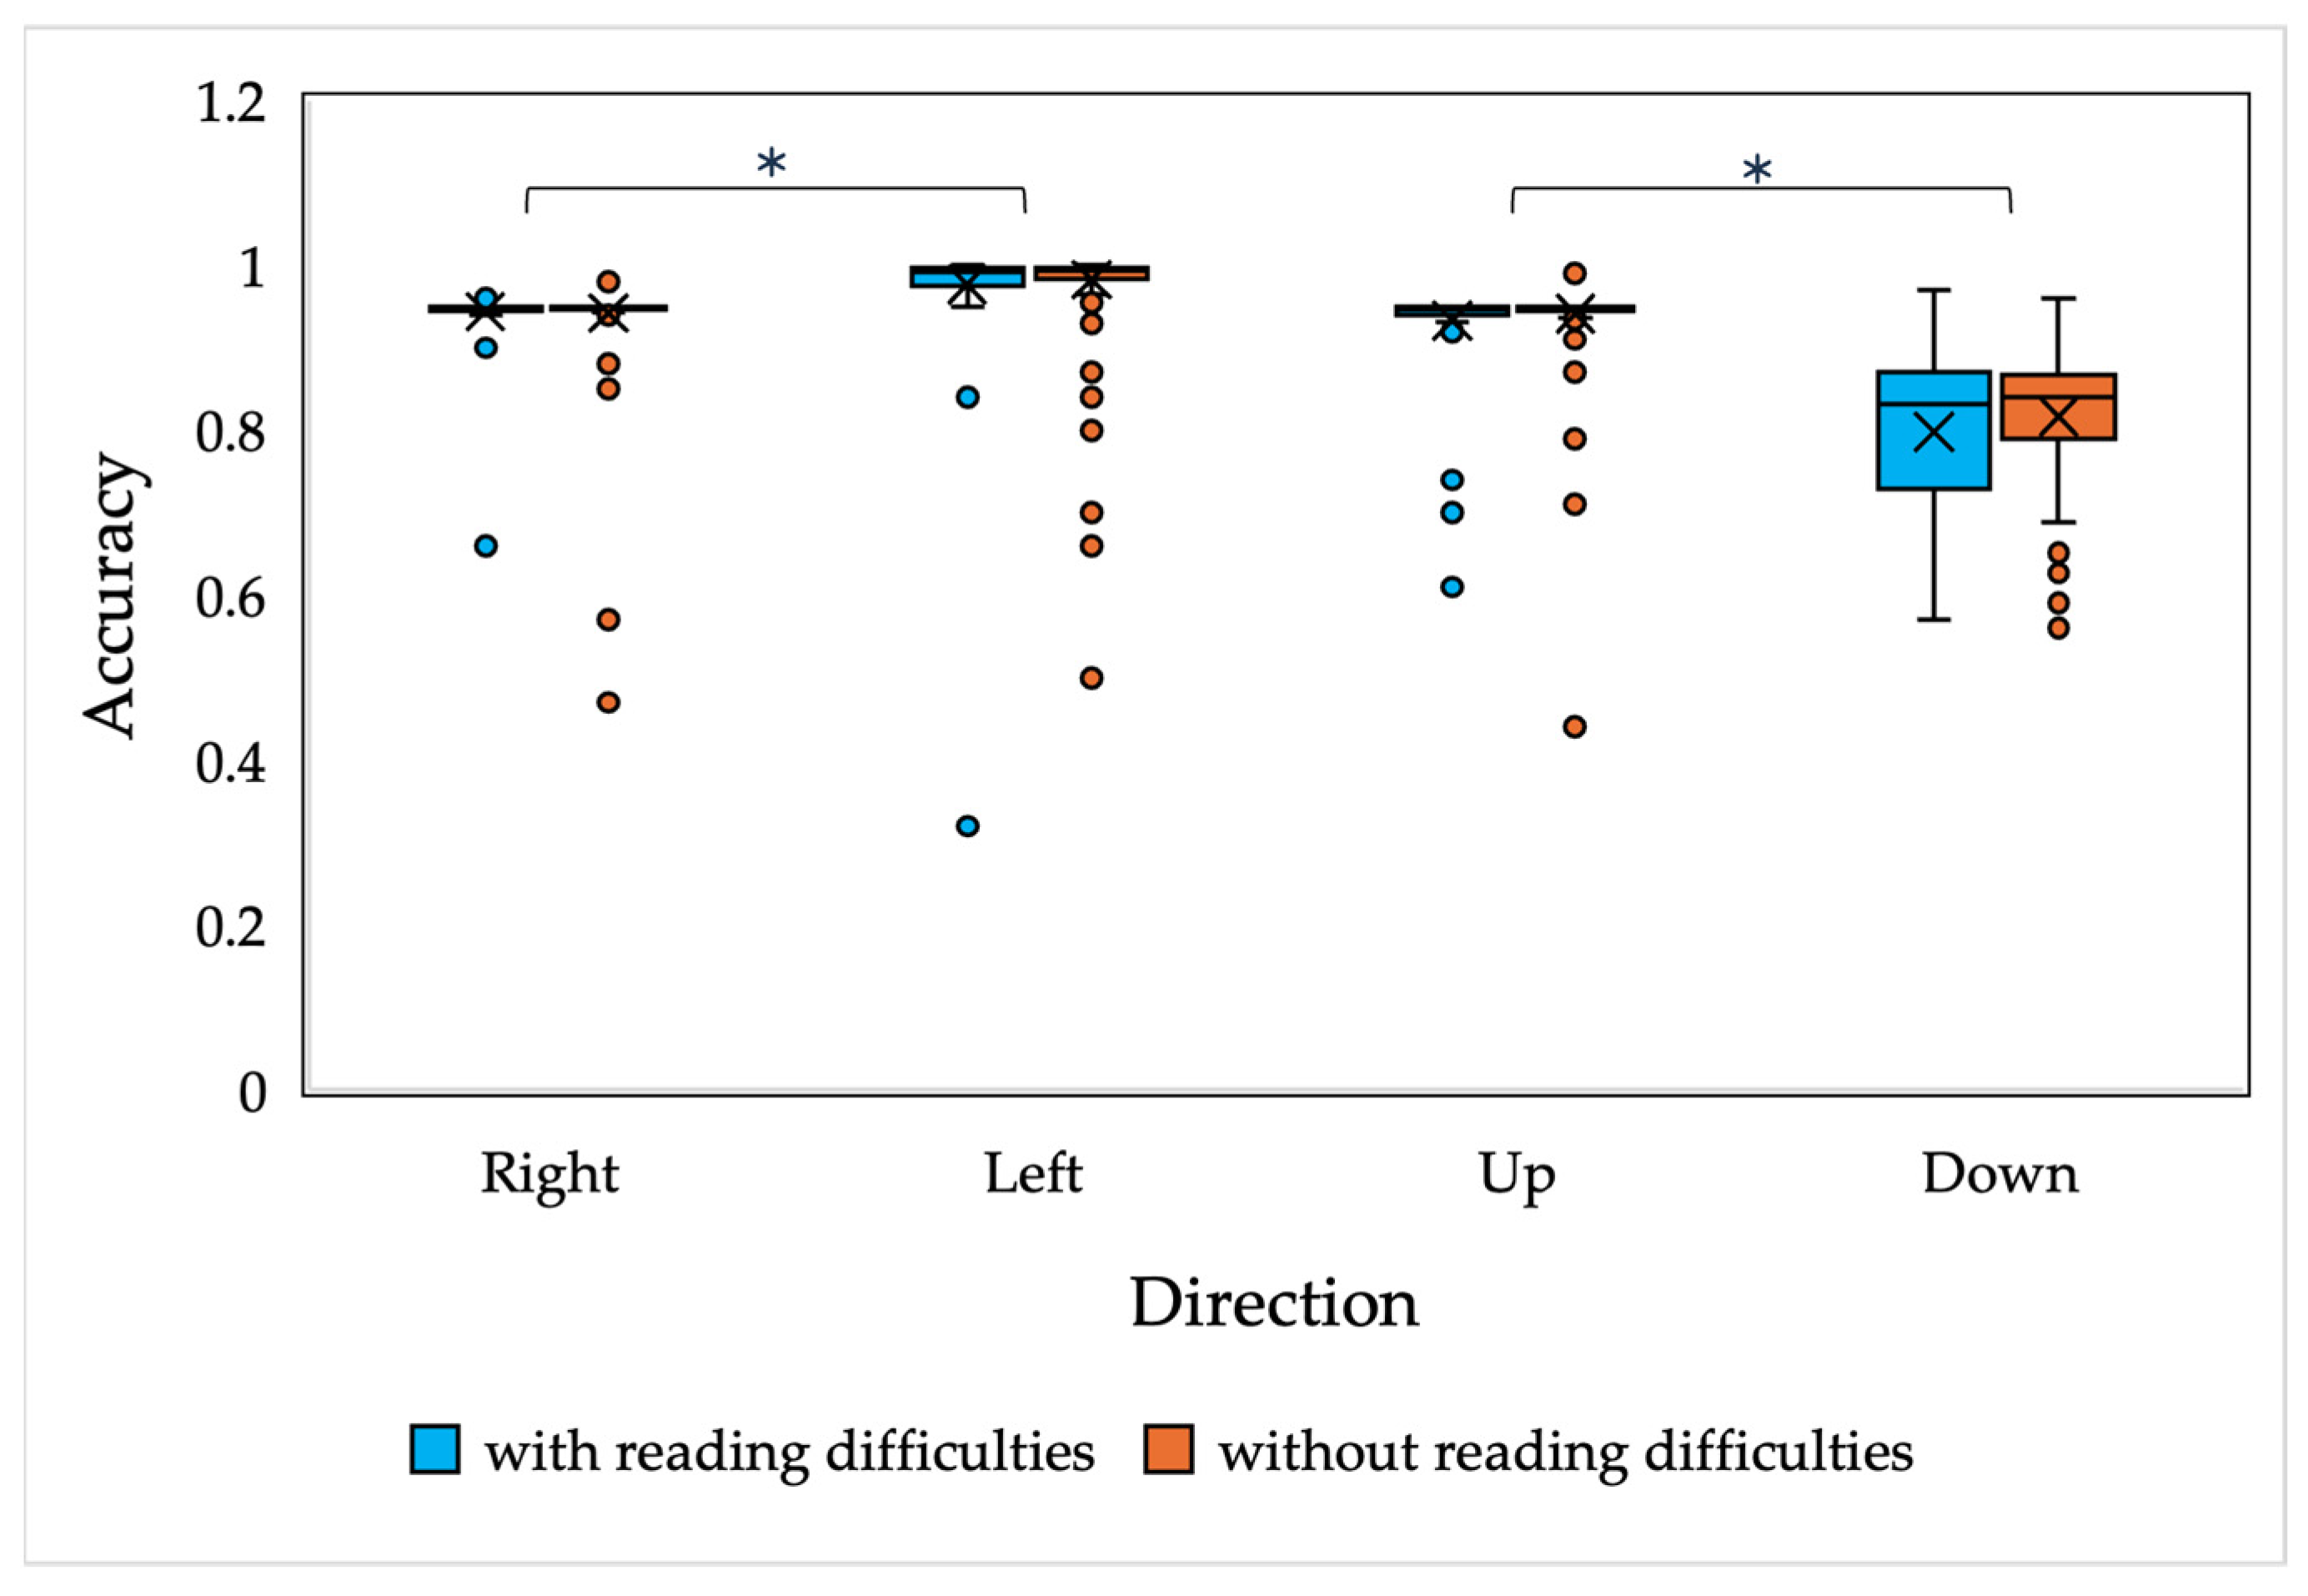
In order to compare the saccadic eye movement performance in children with and without reading difficulties, mixed-model ANOVA was performed. The study employed a between-subjects design with three factors—reading performance (two levels: with and without reading difficulties), age (six levels: 7, 8, 9, 10, 11 and 12 years), and direction—that was analyzed separately for horizontal directions (two levels: right and left) and vertical directions (with two levels: up and down). A Bonferroni post hoc analysis was applied for pairwise comparisons. Horizontal saccades were analyzed separately from the vertical saccades, since the distance between the fixation point and the saccade target was different.
2.5. Smooth Pursuit Evaluation
Prior to the smooth pursuit evaluation, repeated calibration (5 points) and validation (4 points) was performed. If the calibration accuracy did not reach 0.5 degrees, a repeated calibration and validation process was performed. The stimulus color remained black (5 cd/m2; RGB (0, 0, 0)), and the background color of the calibration and validation stimuli was grey (33 cd/m2; RGB (114, 114, 114)), adjusted to the experimental settings in smooth pursuit evaluation.
The experiment started with a fixation cross demonstrated at the center of the screen. After 3 s the fixation cross disappeared, and a black stimulus (circle, 0.7 degrees) was presented at the same position and started moving to the right at a speed of 6 degrees per second. Once the stimulus position reached 10.8 degrees from the initial position, the object motion reversed coming to 10.8 degrees to the left from the initial fixation and returned to the center of the screen. After completing three cycles of movement (moving to the right, left and returning to the initial position), the stimulus disappeared and a fixation cross was once again presented at the center of the screen. A similar procedure was performed in the vertical direction, with 3 cycles of movement up (10.8 degrees) and down (10.8 degrees) from the initial position.
Eye movement data were extracted and analyzed in Tobii Pro Lab software, working in accordance with the Tobii Pro Fusion eye tracker. The data for smooth pursuit eye movement analysis included 348 (horizontal movement) and 346 (vertical movement) children who managed to record at least one smooth pursuit movement in one direction with the Tobii Pro Fusion device. Of all participants whose smooth pursuit eye movements were analyzed, 92 (horizontal) and 91 (vertical) had reading difficulties (RD), and 256 (horizontal) and 255 (vertical) children were included in the control group (CD). In order to determine the minimum sample size required for the study, power analysis (G*Power version 3.1.9.7) was conducted (Faul et al., 2007 [
45]). The results of the power analysis indicated that the required sample size to achieve 80% power for detecting a medium effect (f = 0.25), at a significance criterion of α = 0.05, was N = 60 for ANOVA: repeated measures within–between interaction. Thus, the obtained sample size of N = 346 is sufficient to test the study hypothesis.
Data analysis was performed on Microsoft Excel and SPSS programs. Data analysis was performed based on the raw data file provided by Tobii Pro Lab. The following data were excluded from the data analysis: (1) the latency period and the first 100 ms of the smooth pursuit corresponding to the open-loop phase of smooth pursuit eye movements; (2) blinks detected by the Tobii Pro Fusion and classified as “EyesNotFound”; (3) saccades (eye movements reaching velocity > 100 degrees/second); and (4) fixations corresponding to a relative stable gaze position. From the filtered data, eye movement velocity (degrees/second) and velocity gain were calculated, and the number of saccades performed during the smooth pursuit task was recorded.
The smooth pursuit eye movement velocity was calculated based on raw data analysis in Microsoft Excel using the following equation (Equation (4)):
where
is eye tracking velocity (deg/s),
) are the difference of two adjacent
x-axis coordinates (px),
are the difference of two adjacent time (μs), and dpp represents degrees per pixel (deg/px).
Equation (4) represents the velocity calculations for horizontal smooth pursuit eye movements. Velocity in the vertical direction was calculated using the same equation by applying the vertical coordinates (y instead of x).
Smooth pursuit velocity gain refers to the ratio of eye velocity to the stimulus velocity. The gain of 1 represents an exact match of eye and stimulus velocity, a gain of less than 1 indicates that the eye velocity was slower than the stimulus velocity, and a gain that is larger than 1 indicates that the eye moved with a larger speed than the stimulus. Smooth pursuit velocity gain was calculated in Microsoft Excel using the following equation (Equation (5)):
where
veye is the eye movement velocity (deg/s) and
vstimulus is the stimulus velocity (deg/s) (6 deg/s).
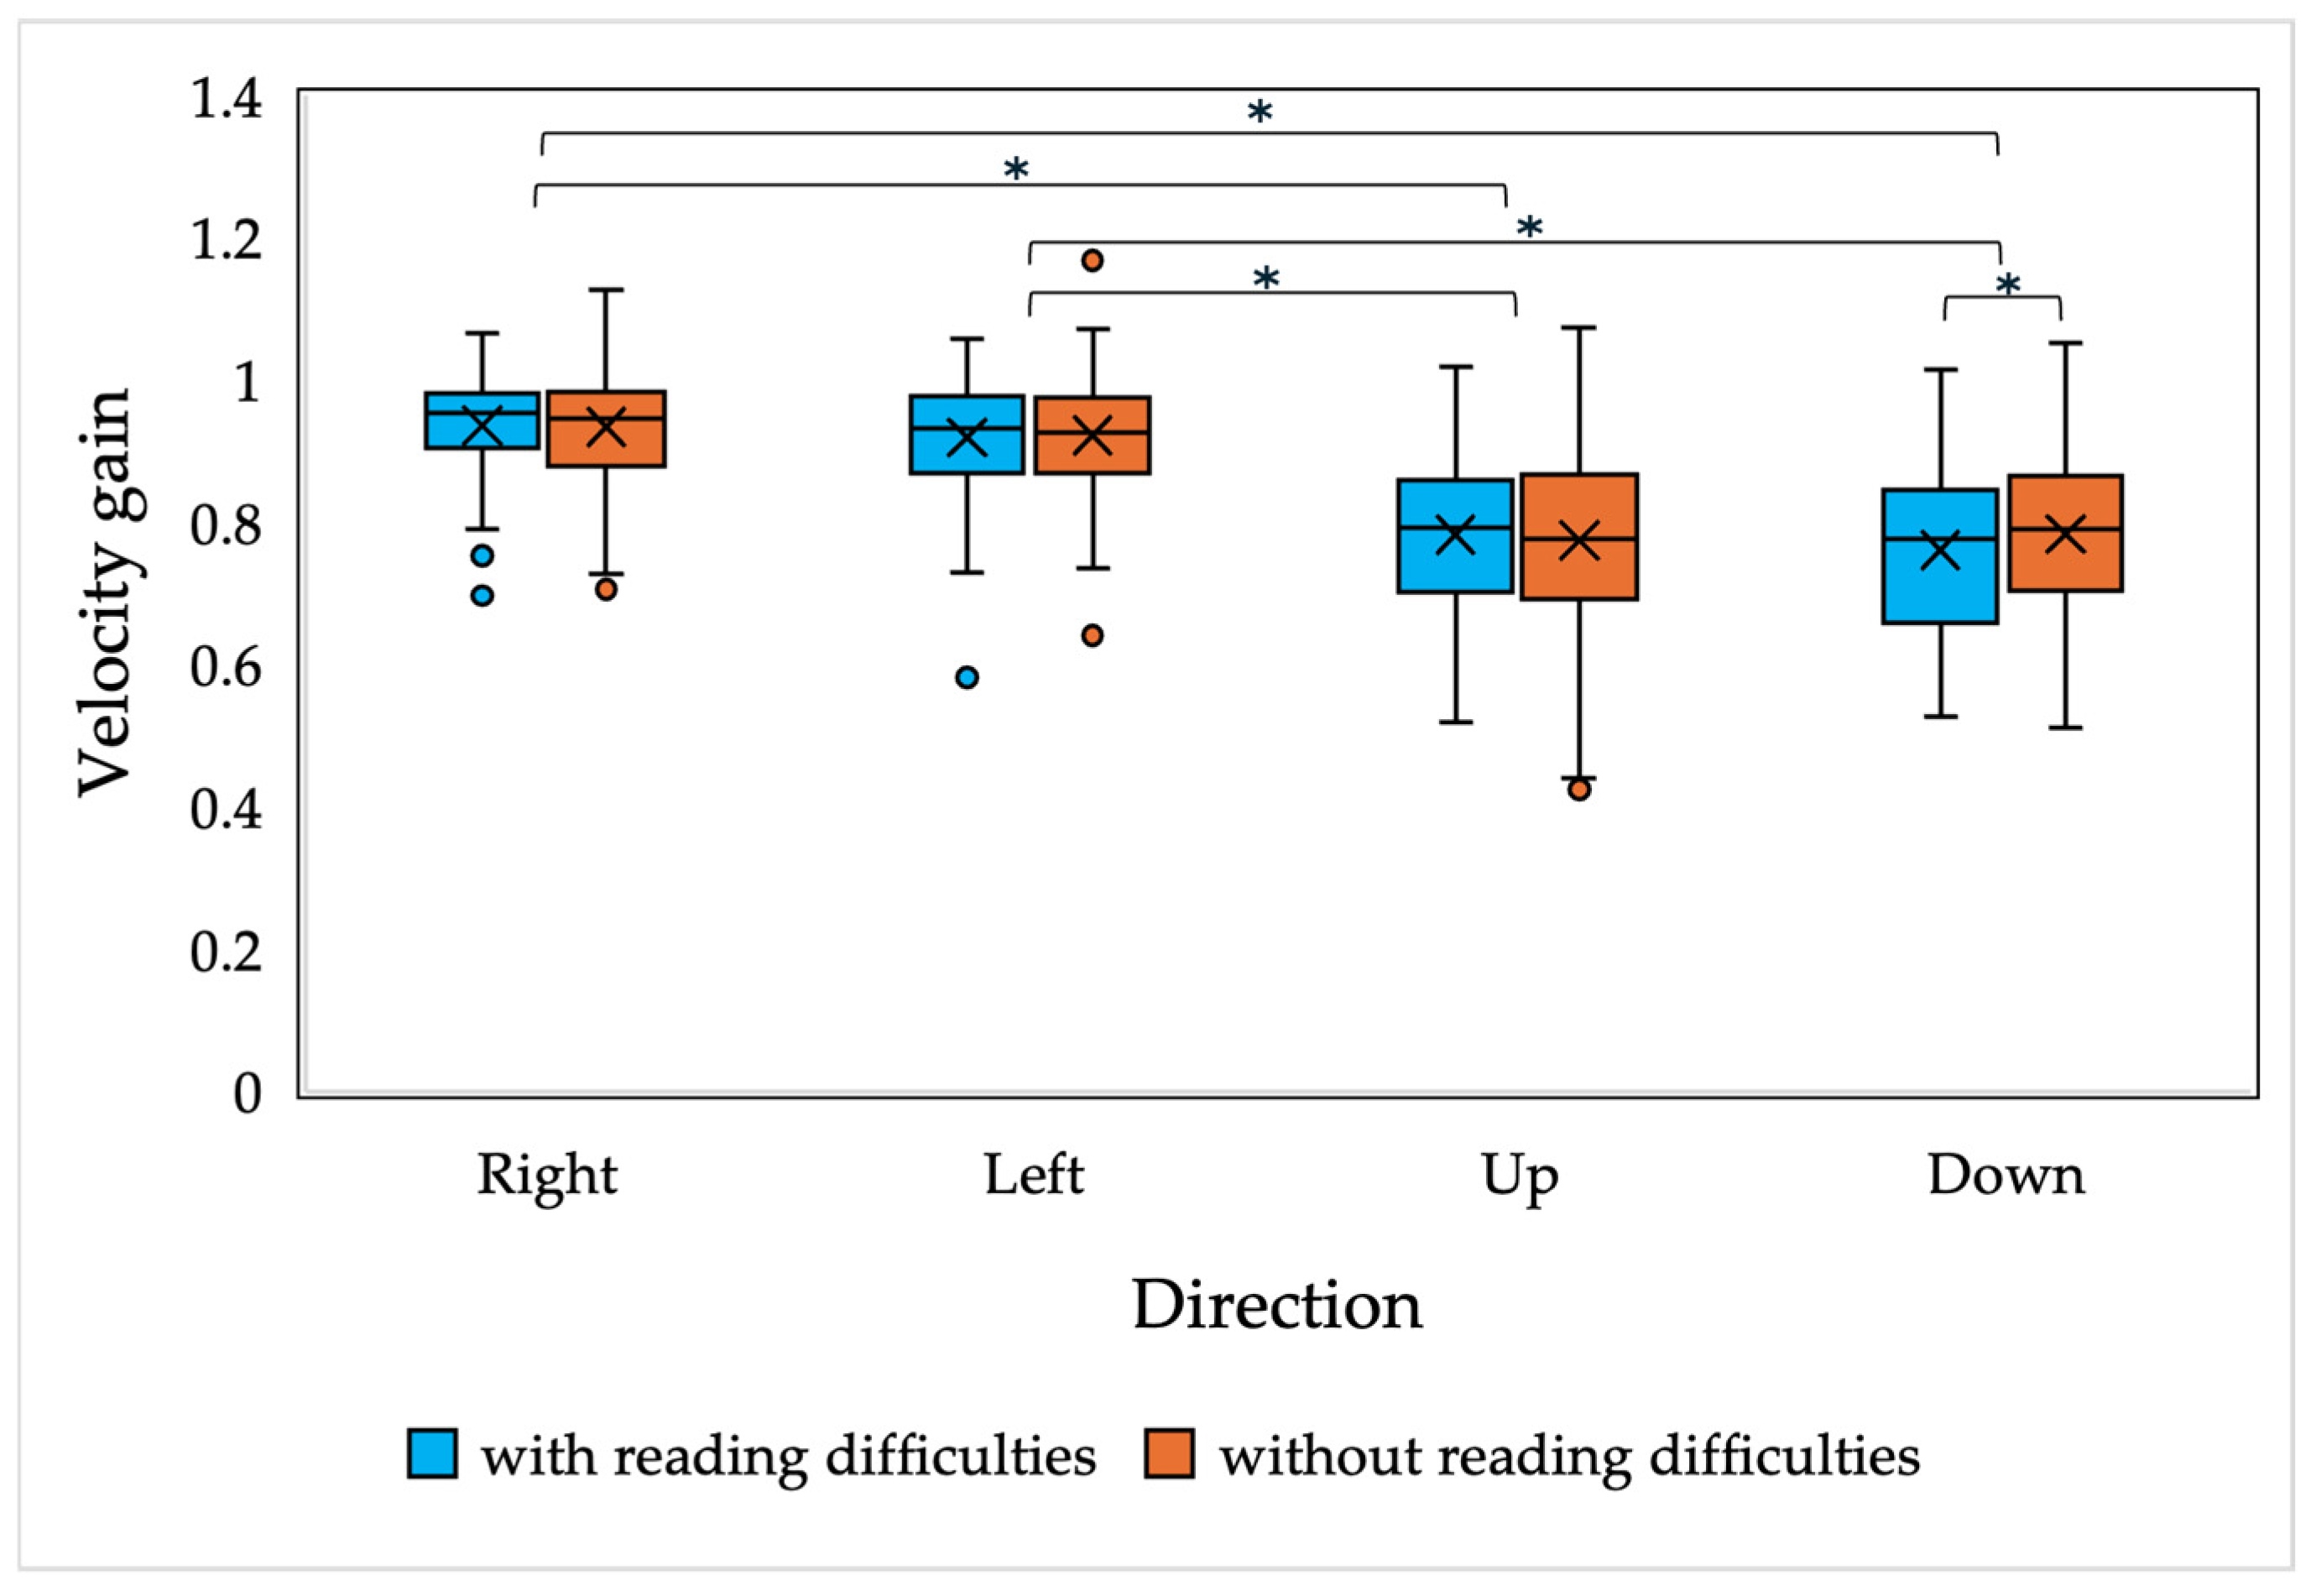
In the study, a mixed-model ANOVA was conducted to compare smooth pursuit eye movement performance between children with and without reading difficulties. The analysis included three between-subject factors: reading performance (two levels: children with reading difficulties and children without reading difficulties) and age (6 levels: 7-, 8-, 9-, 10-, 11- and 12-year-old) and stimulus movement direction (with 4 levels: left, right, up, and down). The within-subject factor was velocity gain, with average values calculated from 3 cycles of stimulus movements back and forth. To control for multiple comparisons and reduce the risk of Type I errors, a Bonferroni post hoc analysis was applied to pairwise comparisons, helping to identify specific differences between groups.
2.6. Fixation Stability Evaluation
The experiment for fixation stability evaluation was generated using the Titta Master toolbox developed by Niehorster et al. [
49]. Before eye-movement recording, a 5-point monocular calibration and 4-point validation procedure was performed. If the calibration accuracy did not reach 0.5 degrees, a repeated calibration and validation process was performed.
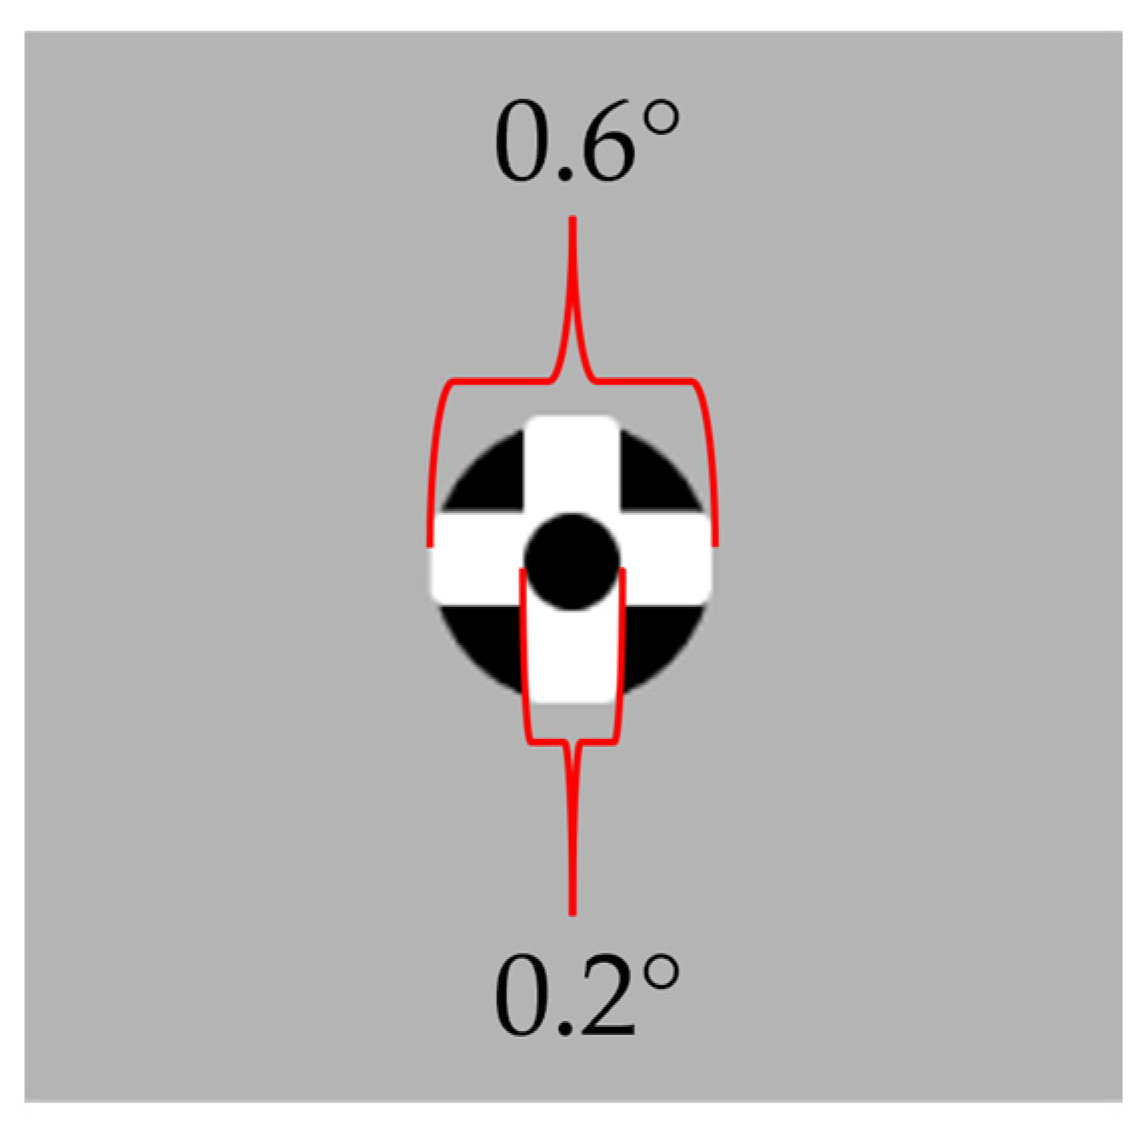
In order to assess fixation stability, a fixation task was generated in which participants were required to maintain their gaze on a fixation stimulus for 10 s. The demonstrated fixation stimulus consisted of a combination of black circles (5 cd/m
2, RGB (0, 0, 0)) and a white cross (180 cd/m
2; RGB * (255, 255, 255)). The stimulus was displayed on a grey background (90 cd/m
2; RGB (180, 180, 180) and had an overall size of 0.6 degrees (see
Figure 2). The fixation task stimulus was chosen based on the study by Thaler et al. [
50], where this stimulus was found to provide a relatively stable fixation. After validation, a black dot appeared in the center of the screen for 3 s, after which a fixation task was presented at the same screen position. The fixation stimulus was displayed for 10 s, but the analysis of fixation included only the middle 9 s, excluding the first and last 0.5 s of the stimulus presentation. The fixation task was performed under binocular viewing conditions, meaning both eyes fixated on the stimulus simultaneously.
The data from 279 children (140 boys and 139 girls) were included in the analysis of the fixation stability. Children who did not have a valid eye movement recording due to insufficient participation or technical issues, e.g., one eye not being recorded, were excluded from the further data analysis. Of all the children, 75 had reading difficulties (RDs) and 204 were referred as the control group (CG). In order to determine the minimum sample size required for the study, a power analysis (G*Power version 3.1.9.7) was conducted (Faul et al., 2007 [
45]). The results of the power analysis indicated that the required sample size to achieve 80% power for detecting a medium effect (f = 0.25), at a significance criterion of α = 0.05, was N = 60 for ANOVA: repeated measures within–between interaction. Thus, the obtained sample size of N = 346 is sufficient to test the study hypothesis. The results of the power analysis indicated that the required sample size to achieve 80% power for detecting a medium effect (f = 0.25), at a significance criterion of α = 0.05, was N = 279 for [ANOVA: Fixed effects, special, main effects and interactions]. Thus, the obtained sample size of N = 279 is adequate to test the study hypothesis”.
In order to extract gaze fixations from the eye movement recordings, the I2MC (identification by two-means clustering) algorithm was applied. This algorithm has been designed for analyzing data with high levels of noise and missing data, making it particularly suitable for analyzing children’s data [
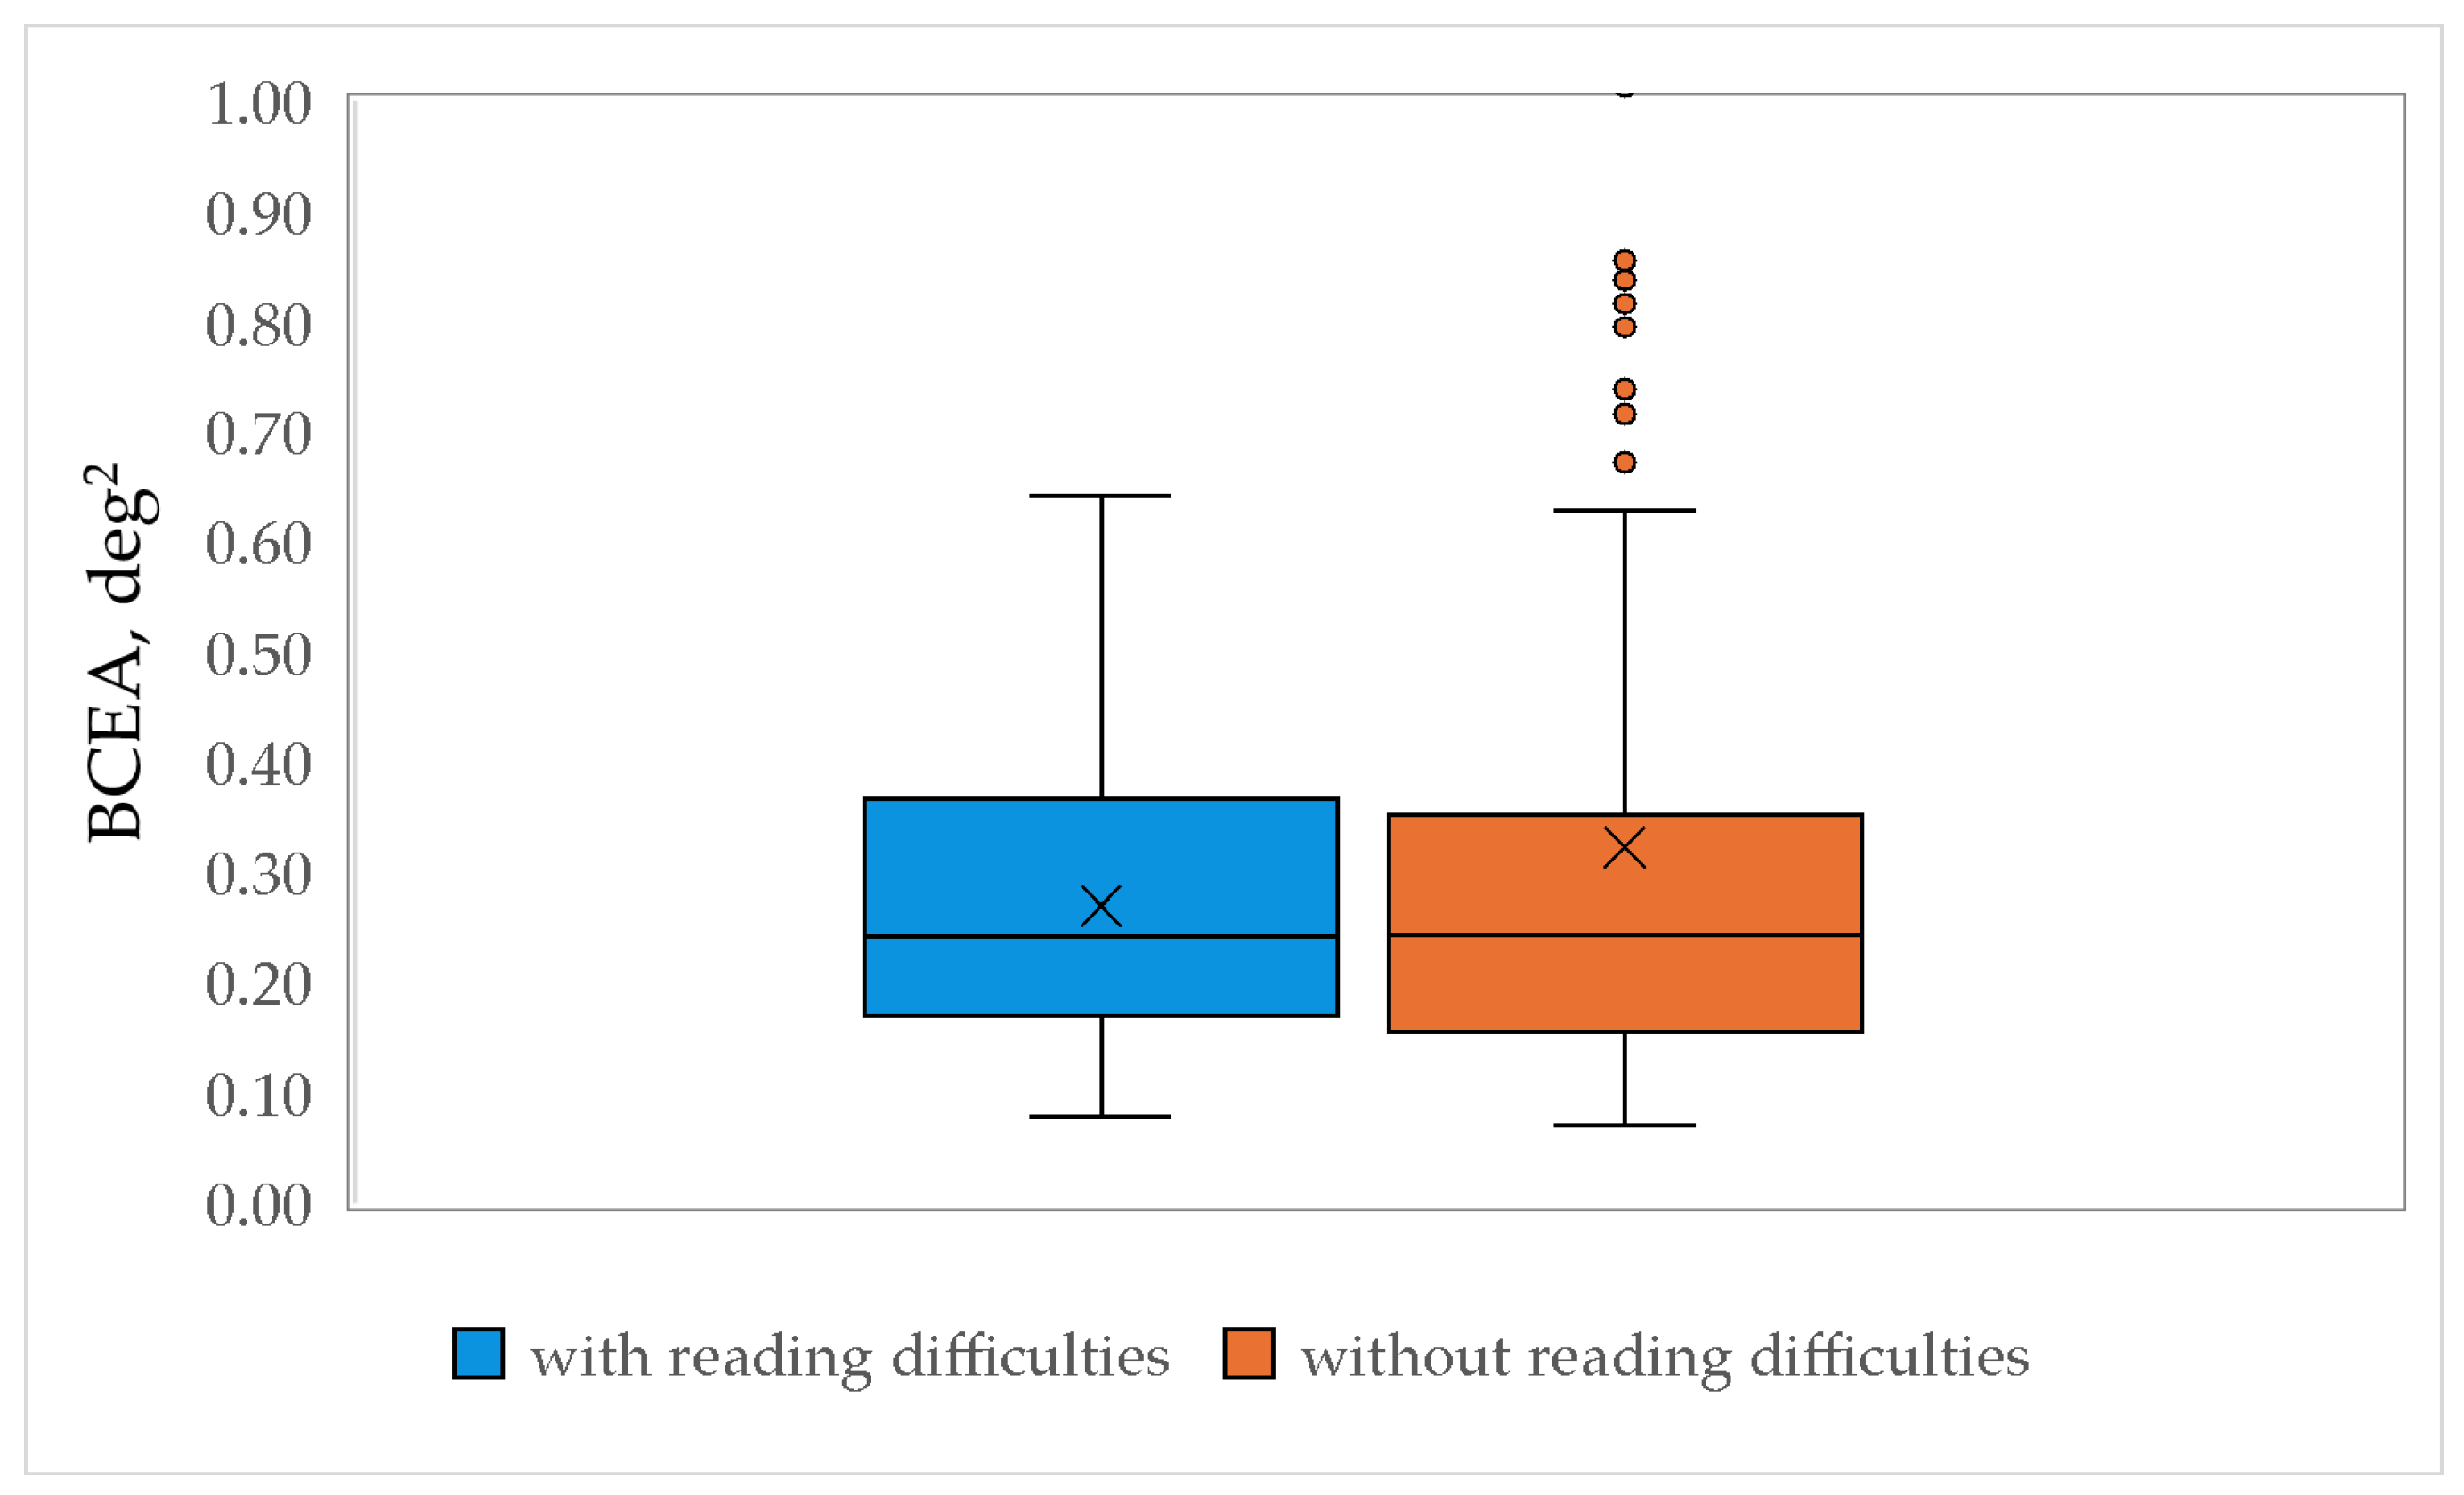
51]. Fixation stability was expressed by the bivariate contour ellipse area (BCEA), which was calculated using the following equation (Equation (6)). Note that a smaller BCEA value indicates a more stable fixation.
where
σH represents the standard deviation of fixations in the horizontal meridian;
σV represents the standard deviation of fixations in the vertical meridian;
ρ represents the Pearson product–moment correlation coefficient between two directions; and the
k value is 1.14, as the chosen probability area is 68% [
52].
To compare gaze fixation stability between children with and without reading difficulties, a mixed-model ANOVA was conducted. The analysis included two between-subject factors: reading performance (levels: children with reading difficulties and children without reading difficulties) and age (6 levels: 7-, 8-, 9-, 10-, 11-, and 12-year-old). The within-subject factor was fixation stability.
4. Discussion
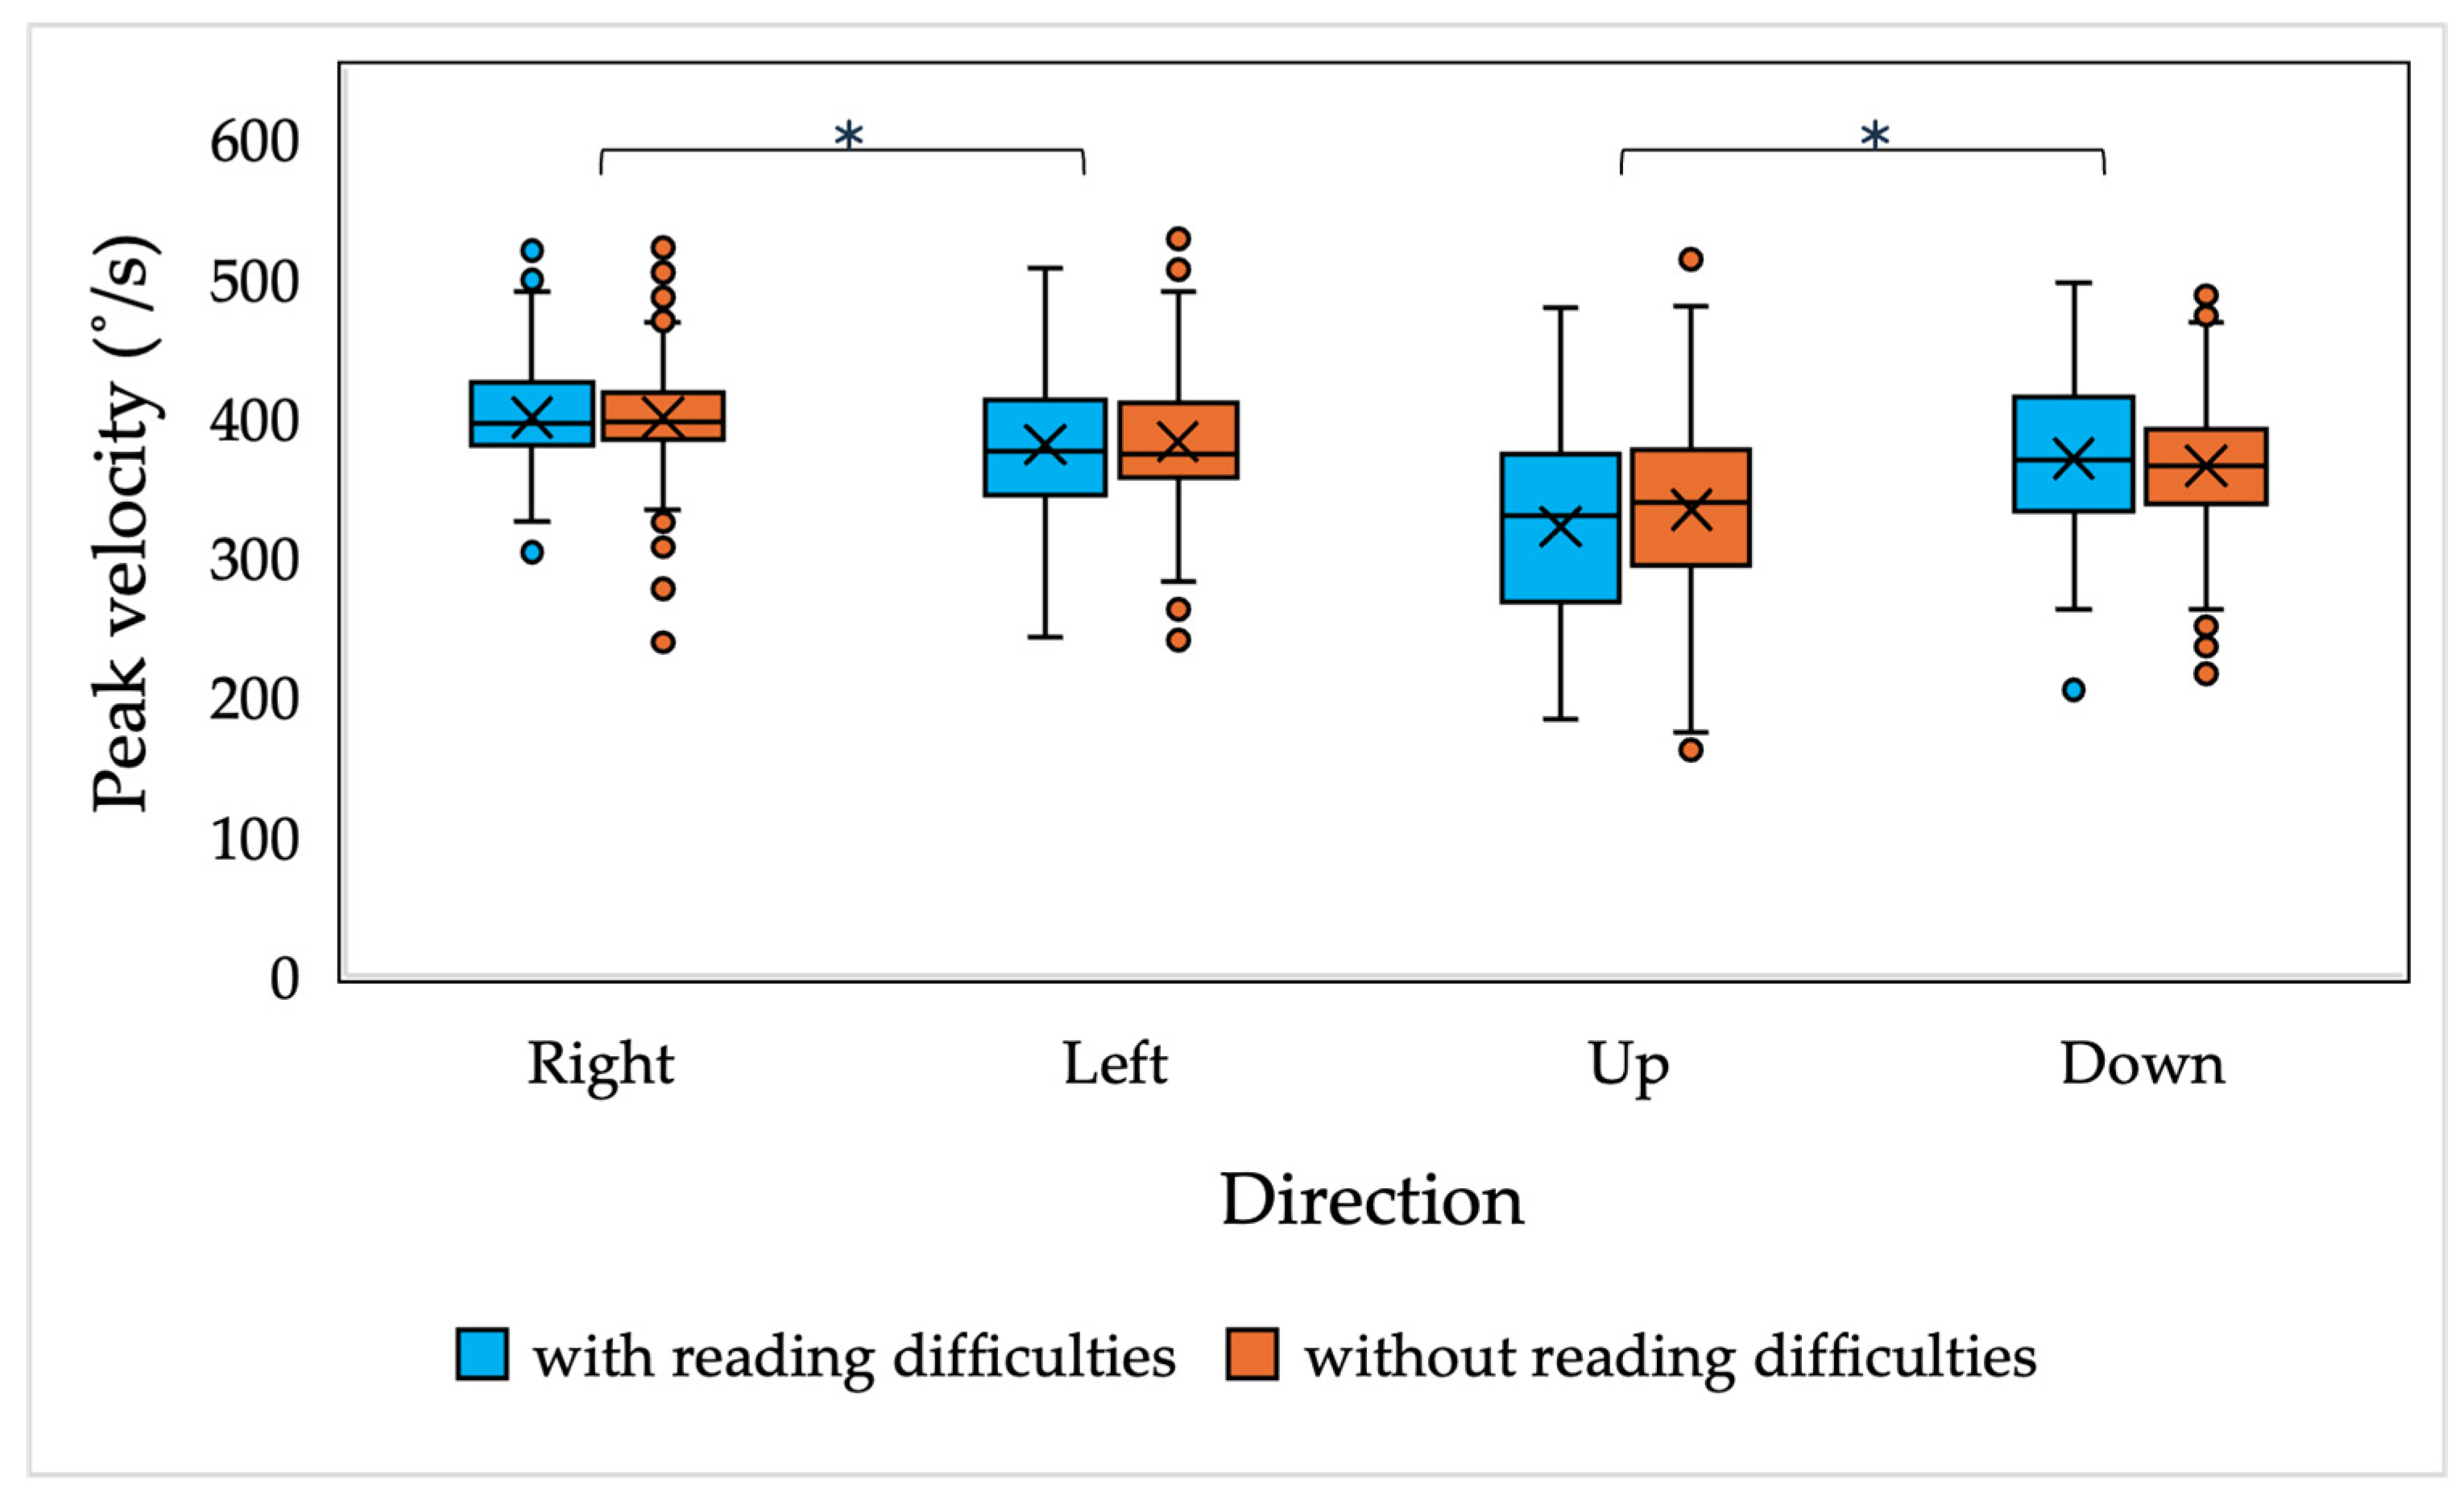
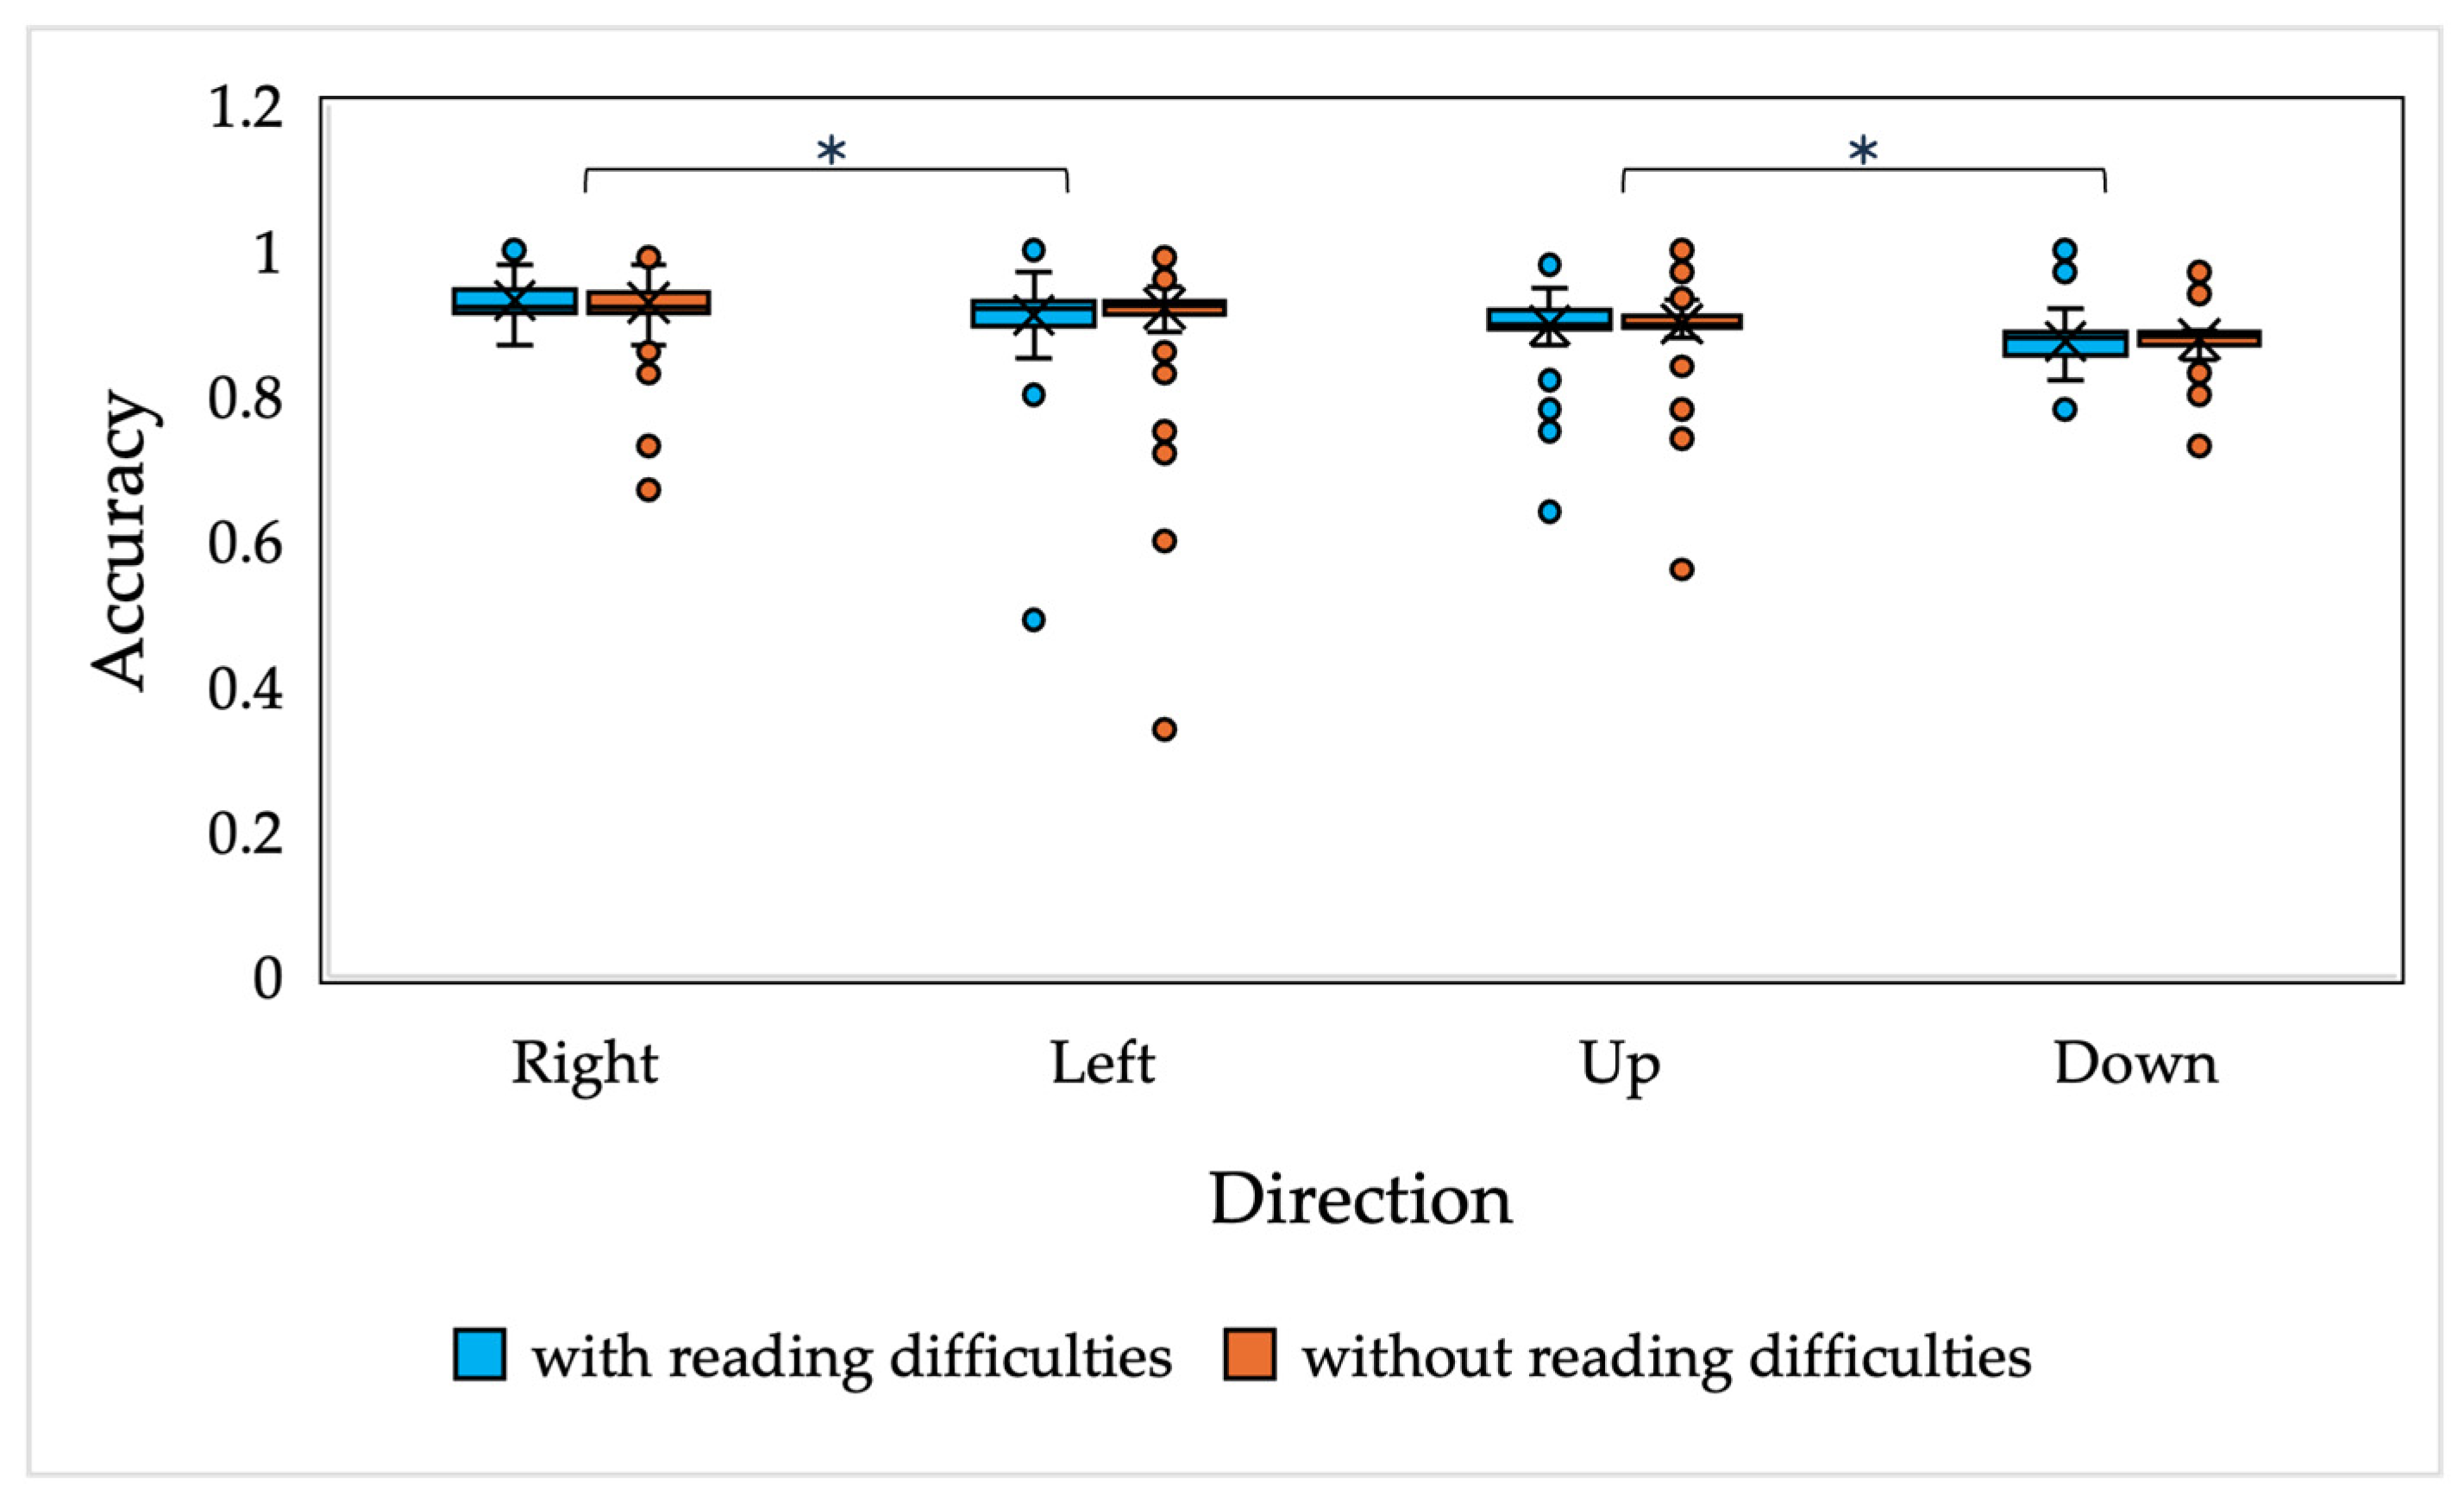
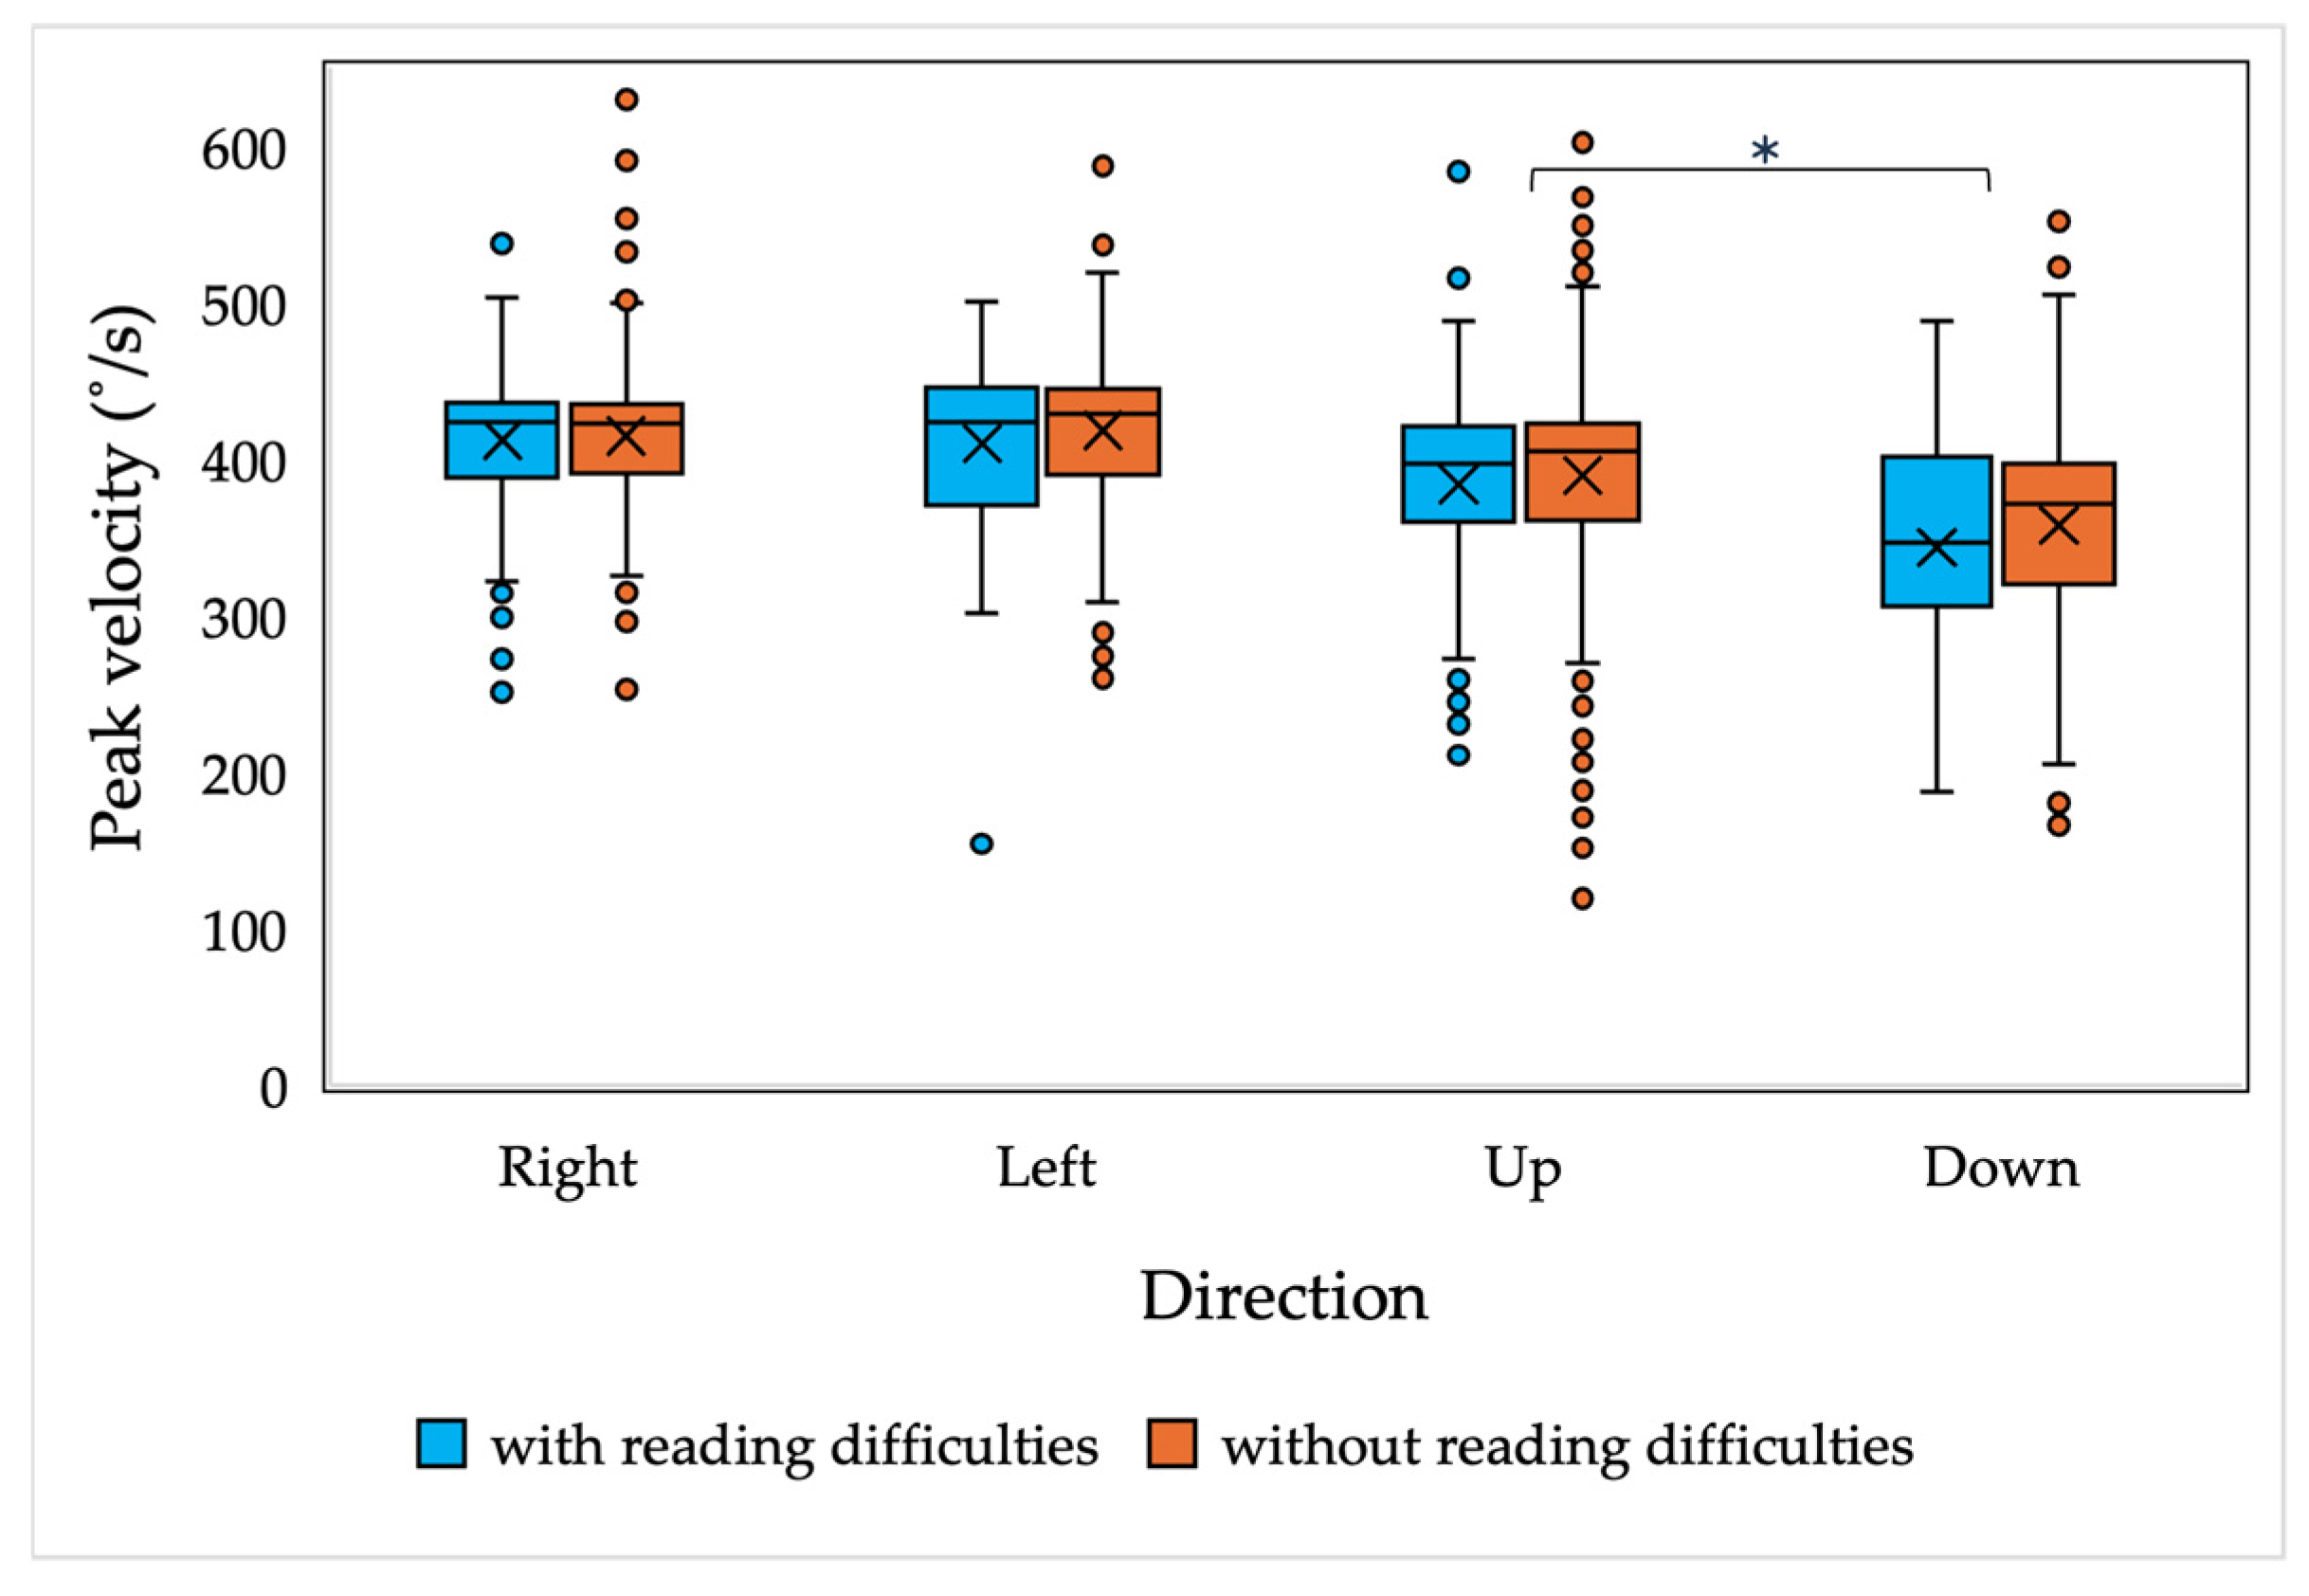
The results of the current study demonstrate that there are no significant differences in saccadic and smooth pursuit parameters, nor in fixation stability, in children with and without reading difficulties. A slight difference was observed in the accuracy of the vertically oriented anti-saccades of all children and the smooth pursuit gain of 7-year-old children with and without reading difficulties; however, the main differences were observed only in the downwards-oriented anti-saccades, which, as presented in the current study and in other studies, have been demonstrated to have higher variability [
53]. In general, the current findings are consistent with the results demonstrated by Black et al. [
39] and Vinuela-Navarro [
38], who did not observe significant differences in saccadic latency, accuracy, or velocity parameters between dyslexic and non-dyslexic children. While different studies [
29,
54,
55] have indicated lower performance in anti-saccade tasks in children with dyslexia, the differences are mainly observed in the error rates and correction rates, not related to the dynamics of saccadic eye movements.
Fukushima et al. [
56] reported that children with different learning difficulties had not only higher error rates, but also significantly higher latencies in anti-saccade tasks compared to the control group. While the differences observed in the current study and the study by Fukushima et al. [
56] could be attributed to differences in research methodologies (e.g., eye tracking equipment, as well as different methods applied in selecting the research participants), the results of the current study are in accordance with other previous studies, indicating that the oculomotor control of saccadic eye movements in children with reading difficulties is intact. And the previously demonstrated differences in the anti-saccade error rates are, as reported by Wilcockson et al. [
57], attributed to the impairment of inhibitory control.
Edelman et al. [
58] demonstrated that the peak velocity of reflexive saccades is higher than in anti-saccade tasks; however, the current results indicate an opposite tendency. The extent to which the peak velocities in reflexive saccades are lower is still under debate. While the study by Bucci and Seassau [
59] observed a tendency of peak velocity in anti-saccade tasks to be slower than in pro-saccade ones, this was not confirmed statistically. Furthermore, in the study by Lunn et al. [
60], the control group of healthy children had almost identical mean peak velocity results in pro-saccade and anti-saccade tasks. The results of the current study indicate slightly higher average peak velocity results in the anti-saccade tasks compared to reflexive saccades (with or without the data replacement). Since the observed differences in the mean results were within the standard error, we assume that they were not of a causal nature; however, the observed differences should be explored in further research.
While previous studies have demonstrated that several brain regions involved in reading also play a role in the neural control of smooth pursuit eye movements [
57], not all individuals with reading difficulties exhibit smooth pursuit abnormalities [
40,
61]. This observation is consistent with the findings of the current research—no significant difference in smooth pursuit eye movements in children with and without reading difficulties was observed (except for in 7-year-old children). Furthermore, the results fell within the normal range according to the normative values defined by Sinno et al. [
62]. Data analysis revealed a significant age effect on the smooth pursuit performance which was independent of reading performance, likely due to improvements in binocular coordination, saccade latency, and coordination between saccadic and vergence movements, which continue to develop until 12 to 15 years of age [
63].
More recent studies by Fukushima et al. [
56] and Caldani et al. [
32] have demonstrated that dyslexic children generally exhibit decreased smooth pursuit gain, especially in the left-to-right direction [
30]. They also tend to make more catch-up saccades [
42]. So what causes the inconsistency with the results of the current research, as well as the results presented by Black et al. [
39] and Ygge et al. [
61]? While all of the previously mentioned studies have explored smooth pursuit performance in children with dyslexia, a different methodology of participant selection can be observed. The criteria for diagnosing dyslexia vary widely, with some studies using broader definitions or different reading-related tests, which could influence group characteristics and outcomes. The prevalence of developmental dyslexia is estimated around 7% [
64], while the prevalence of reading difficulties in the current research was around 25%, including both children with dyslexia and children with reading difficulties caused by other factors (social, environmental, etc.). The results of the current study propose that the smooth pursuit control in children with reading difficulties is intact, and that observed differences in smooth pursuit performance in children with dyslexia might be attributed to magnocellular dysfunction, attention deficits, or other factors previously linked to dyslexia [
65].
One of the parameters that characterizes the fixation quality is its stability, i.e., the ability to keep a steady gaze on the fixation target. To assess whether the fixation stability is impaired in children with reading difficulties, fixation stability was assessed in a non-reading task, thereby reducing the involvement of cognitive processes on the eye movement performance. A similar approach of analyzing binocular fixation quality in children with and without reading difficulties was applied by Vinuela-Navarro et al. [
38], exploring the number and amplitude of saccadic eye movements during fixation. Both the current study and the study by Vinuela-Navarro et al. [
38] did not reveal significant differences in fixation stability in children with and without reading difficulties. The results of our study, however, contradict the findings by Vikesdal et al. [
66], demonstrating that children with dyslexia have more unstable fixation in non-reading tasks than children without dyslexia. Although dyslexia is a specific learning disorder of neurobiological origin that primarily affects reading, as mentioned before, the children included in our study had reading difficulties but were not diagnosed with dyslexia, which could explain why the results contradict those of Vikesdal et al. [
66].
The dynamics of saccadic and smooth pursuit eye movements are also characterized by other parameters, e.g., latency and initial acceleration; however, latency was not considered in the current study, since prior research and methodological constraints have indicated that latency may not reliably reflect oculomotor performance differences in children with and without reading difficulties. For example, Black et al. [
39] and Vinuela-Navarro et al. [
38] found no significant differences in saccadic latency between dyslexic and non-dyslexic children, suggesting that latency might not be a robust marker for reading difficulties. Moreover, latency measurements are often influenced by external factors, such as age-related variability in neural development and task complexity, which could introduce noise rather than providing insight into the specific oculomotor mechanisms linked to reading performance. In this study, the focus was placed on parameters like saccadic accuracy, peak velocity, and fixation stability, as they provide more direct and interpretable measures of oculomotor control in the context of reading difficulties. Additionally, methodological consistency with validated reading tests and eye-tracking protocols ensured that the analysis remained aligned with the study’s primary aims.
While the results of the current study do not indicate significant differences in saccadic, smooth pursuit, and fixation parameters in children with and without reading difficulties, the target group (children with reading difficulties) might still include single children that present with eye movement dysfunction. There has been a lengthy discussion on whether children with dyslexia also present with abnormal eye movements in other non-cognitive tasks and whether eye movement abnormalities are the cause or consequence of reading difficulties [
67]; however, the studies addressing reading performance in patients with other causes of abnormal eye movements indicate the crucial role of oculomotor system performance in successful reading [
68]. The results of the current study do not imply that abnormal eye movements do not cause reading difficulties, but demonstrate that, in general, children with reading difficulties are not prone to oculomotor dysfunction. Furthermore, the absence of general eye movement deficits does not exclude specific oculomotor deficits during reading, since different cognitive processes are involved in oculomotor control during, i.e., attention and lexical processing, which in turn might lead to abnormal eye movements specifically in reading tasks [
69,
70].
Reading is a multifactorial process that is influenced by psychological, physiological, environmental, sociological, and linguistic factors; therefore, determining the etiology or the exact cause of reading difficulties involves a complex analysis of all previously mentioned factors. The Acadience
® Reading test is designed to identify children at risk of developing reading difficulties rather than to diagnose specific reading disorders. In Latvian basic educational schools, reading skills assessment is conducted by speech therapists; however, the diagnostics of specific learning disorders (including dyslexia) requires the involvement of psychologists, neurologists, and other specialists [
71]. As the participant selection for the current study was performed only based on the Acadience
® Reading test results, the reading difficulties observed among the participants may stem from a variety of underlying causes, including both internal (neurobiological and physical) and external (social environmental) factors [
72,
73]. Including children with various causes of reading difficulties is beneficial, but complicates the interpretation of results, which is the main limitation of the current study. A clearer distinction between children with dyslexia and those with other causes of reading difficulties would provide deeper insight into the physiology of dyslexia. However, we found that the inclusion of children with different causes of reading difficulties in their natural school environments enhanced the ecological validity of the current findings.
From an optometrist’s perspective, reading difficulties may be associated with poor visual acuity, unstable binocular vision, accommodative dysfunction, different ocular diseases, or oculomotor dysfunction [
74]. The conventional tests applied to determine the oculomotor performance in reading-like tasks in optometrist practice (e.g., DEM test) are relatively simple and practical; however, these tests are designed for specific eye movement analysis and do not address the overall performance of the oculomotor system, i.e., saccade, smooth pursuit, and fixational tasks. Furthermore, the performance on the DEM test does not correlate with quantitative measurements of eye movements [
75]. Other tests for saccadic, fixational, and smooth pursuit system evaluation, like direct clinical observation, are subjected to difficulties in scoring and subjective evaluation of the examiner [
76]. The current study suggests that children with reading difficulties should not be directly suspected to have oculomotor dysfunction; however, in the case of specific complaints (difficulties of maintaining fixation or allocating the optimal fixation position in reading), as well as if a child is diagnosed with dyslexia or other developmental disorders, oculomotor performance should be evaluated, if possible, by applying quantitative methods (e.g., eye tracking). Recent evidence demonstrates that short-term visual attention training can improve the oculomotor performance during reading [
77].
The current study extends the available information and understanding on oculomo-tor performance in children with reading difficulties, which, as reported by the OECD Programme for International Student Assessment (PISA) [
78], is around 25%, by demonstrating that the oculomotor system in children with reading difficulties (not excluding dyslexia) is intact. The results propose that the observed differences from previous studies exploring eye movements in dyslexic children might be attributed to the participant selection. This implies that, with specific selection of patients diagnosed with developmental dyslexia, differences in the oculomotor performance could still be observed, indicating magnocellular dysfunction, attention deficits, cerebellar functional activation patterns, or other factors previously linked with dyslexia [
65,
79].

