Abstract
Eye Movement Desensitization and Reprocessing (EMDR) was recognized by the World Health Organization in 2013 as an evidence-based therapy for post-traumatic stress disorder (PTSD) and found to be effective for depression. Since then, EMDR has evolved into a personalized treatment focusing on stabilizing the physiological and psychological processes to alleviate symptoms of depression and stress. However, optimized parameters for video stimuli, such as speed (ssp), distance (d), and size (ssz), are not yet well defined in EMDR protocols. This study addresses this gap by employing an artificial neural network (ANN) methodology based on Francine Shapiro’s Adaptive Information Processing (AIP) model. The ANN was used to determine ideal values for video stimuli parameters, developing an integrated model to enhance EMDR outcomes. Of the 2860 ANN-modeled combinations, stimulus settings of 1.8 Hz speed, 70-pixel size, and 1440-pixel distance achieved the highest Predicted Effectiveness Score (PES) of 98.7%. An EMDR field test with electroencephalography (EEG) was conducted to assess the optimized video stimuli’s efficacy. Further, 16 participants, selected from a sample of 56 meeting CES-D depression criteria, were evaluated, and the top 50 PES values were selected for further analysis. EEG results indicated a 12.31% increase in effectiveness, showing a reduction in right frontal lobe beta waves. These findings highlight the technical advancements and therapeutic potential of the proposed ANN-optimized EMDR stimuli, demonstrating statistically significant improvements over traditional methods.
1. Introduction
In 2013, the World Health Organization identified Eye Movement Desensitization and Reprocessing (EMDR) as an evidence-based method for treating post-traumatic stress disorder (PTSD) [1]. EMDR, a non-pharmacological intervention, has been shown to facilitate faster psychological relief compared to traditional therapies. Initially developed by Francine Shapiro for PTSD, EMDR has since been expanded to other areas of psychotherapy, including stress reduction, panic disorders, anxiety, and anger management [2,3,4,5]. Shapiro emphasized EMDR’s effectiveness in addressing negative life experiences and alleviating depressive symptoms, with 24 randomized controlled trials supporting its efficacy in treating emotional trauma and various psychological disorders. These findings indicate that EMDR therapy has applications beyond trauma treatment, extending to a broader range of physical and emotional stressors, which supports its adoption in psychological and medical settings [6].
A recent meta-analysis further demonstrated that EMDR is comparable to cognitive behavioral therapy (CBT) in terms of quality-of-life (QoL) improvement, particularly in managing psychological stress. It was also found to significantly reduce depressive symptoms among individuals with major depressive disorder (MDD) [7]. Despite the strong evidence supporting EMDR’s effectiveness, there is limited guidance on the design of displays and stimuli used in EMDR sessions. To enhance EMDR therapy’s efficacy, immersive display technologies like head-mounted displays (HMDs) could be explored over traditional monitor-based displays. Preliminary studies on virtual reality exposure therapy (VRET) using HMDs suggest its potential in improving PTSD outcomes, though that research focuses on VRET rather than EMDR. Furthermore, that research utilized VR technology to present PTSD stimuli, thereby creating an immersive environment for participants [8].
In EMDR, visual stimuli parameters such as speed, distance, and size are thought to influence treatment effectiveness by modulating eye movement frequency, but specific guidelines on these parameters remain subjective. For instance, prior studies examined the effects of slower (0.8 Hz) and faster (1.2 Hz) eye movements on working memory but did not target individuals with psychological conditions, nor did they directly address EMDR [9,10]. As EMDR aims to desensitize negative memories and emotions by overloading working memory, insights from working memory load studies (e.g., Baddeley and Hitch) and attentional span research (e.g., Yerkes–Dodson law) have been integrated into EMDR, though no studies have systematically optimized video stimulus parameters [11,12,13].
Shapiro provided preliminary guidelines for stimulus size and distance, but these ranges are broad and lack empirical specificity [2]. To bridge this gap, this study conducts two experiments to refine EMDR therapy parameters:
- (1)
- EMDR Video Stimulus Optimization through Neural Network Regression Modeling.
- (2)
- Verification of Experiment 1 with electroencephalography (EEG) measurements on participants with confirmed depressive symptoms.
In the first experiment, an artificial neural network (ANN) based on the Adaptive Information Processing (AIP) model was developed. We adopt an artificial neural network (ANN) methodology within the Adaptive Information Processing (AIP) framework to experimentally investigate EMDR parameters [14,15]. Although we do not introduce a new theory, we emphasize that a thorough grasp of ANN fundamentals—such as learning rates, activation functions, and model architecture—is essential before clinical implementation. Here, the size, speed, and distance of EMDR video stimuli were defined as independent variables, while the Predicted Effectiveness Score (PES) served as the dependent variable. In this study, we define three key parameters for EMDR-based interventions: speed (), distance (), and size (). Although there is currently no universally accepted standard for these dimensions, we adopted these terms based on prior EMDR and VR-based research [16]. Speed () represents the velocity of stimulus movement, distance () corresponds to the spatial gap between the participant and the stimulus, and size () denotes the size or area of the presented stimulus. Deep learning-based regression analysis was then applied to validate the model’s effectiveness. We leverage deep learning methods—particularly artificial neural networks (ANNs)—to process complex data and optimize key EMDR parameters [17]. Deep learning refers to multilayered neural network architectures capable of learning hierarchical representations from large-scale datasets. Accordingly, we employ a Python and TensorFlow-based algorithm, which offers a flexible platform for rapid prototyping and parameter tuning. Our goal is to demonstrate the feasibility of this approach in an applied context rather than propose an original theoretical model.
The second experiment involved EEG measurements to assess display effects on participants diagnosed with depression. Specifically, this study measured right frontal beta wave activity, as previous research has associated elevated beta waves in this area with depressive symptoms [18,19,20]. By focusing on beta wave reduction, this study aims to validate the impact of optimized EMDR video stimuli on reducing depression and stress symptoms [21].
To address the gaps in optimizing EMDR video stimuli parameters specifically for treating depression, this study investigates key questions to guide effective EMDR application. The following research questions were formulated:
- (1)
- What are the optimal parameters—speed (ssp), distance (d), and size (ssz)—of video stimuli that enhance the effectiveness of EMDR therapy for treating depression?
- (2)
- How does an artificial neural network (ANN) model contribute to determining and predicting the ideal values for video stimuli parameters in EMDR therapy aimed at alleviating depression?
- (3)
- To what extent do optimized video stimuli parameters affect EEG-measured therapeutic outcomes, specifically in terms of beta wave reduction in the right frontal lobe for individuals with depression?
2. Materials and Methods
2.1. AIP PES Prediction
Artificial neural networks (ANNs) are artificial intelligence models well suited for representing nonlinear relationships in input data [22]. ANNs effectively model complex nonlinear dynamics, making them valuable in predicting variables in nonlinearly distributed parameter systems, such as temperature distributions or stock market data [23,24]. Their ability to handle intricate nonlinearities has seen applications in diverse fields, including quality prediction in injection molding and noise reduction in synthetic aperture radar (SAR) images [25,26]. ANNs are also widely used to predict critical variables in industrial processes through data-driven soft sensors, often combined with dual LASSO techniques to minimize model overfitting [27]. This nonlinear modeling capability makes ANNs a powerful tool for tackling conceptual challenges, including those presented by the Adaptive Information Processing (AIP) model, foundational to EMDR therapy [28].
The AIP model serves as a theoretical framework in EMDR, positing the brain as an information processing system that continuously seeks equilibrium [29]. Shapiro, the founder of EMDR, suggests that the AIP model reflects the brain’s natural tendency towards survival and mental health, processing experiences adaptively under normal conditions. However, negative experiences can disrupt this system, leading to maladaptive memory storage, which may manifest as persistent psychological symptoms [27,30,31,32]. These unprocessed memories are hypothesized to contribute to various mental health issues, including PTSD, depression, and chronic pain [33]. Within the AIP framework, EMDR is conceptualized as a process that combines visual stimuli with information processing time, wherein visual stimuli serve as external triggers for the brain’s adaptive processing. Let represent the stimulus and the amount of processed information; the basic information processing function can be expressed as follows:
where represents the information processed at the next time step, and is a function of speed (), distance (), and size (). The Predicted Effectiveness Score (PES) relates to the information processed, such that optimal stimulus parameters maximize information processing, thereby increasing treatment efficacy. This relationship can be quantified as:
where is the PES (%) and III represents the total information. , the information processed by the stimulus, is a function of speed (), distance (), and size (). By combining these equations, we derive a unified PES prediction formula:
In this equation, represents the effectiveness of the visual stimulus, and is a function that optimizes stimulus efficacy by adjusting for deviations from ideal parameter ranges. Assuming effective information processing occurs within optimal ranges, this relationship can be modeled by a Gaussian function:
Here, v0, d0 and s0 represent the optimal values for speed (), distance (), and size (), respectively, while σv, σd, and σs are the standard deviations (tolerances) for each parameter. This Gaussian model allows for maximum effectiveness within optimal ranges and reduced scores outside them. Gaussian functions are widely used in neural networks as activation functions, aiding in uncertainty modeling and regression analysis [34,35]. Among deep learning techniques, data-augmented regression optimized by ANN is particularly suitable for learning nonlinear relationships across hidden layers [12,36]. The final PES prediction formula via ANN is:
This formula indicates that when stimulus parameters (speed, distance, size) align closely with optimal values, the EMDR stimulus achieves maximum PES, effectively processing traumatic information. As parameters deviate from optimal ranges, PES declines accordingly. This framework provides a mathematical basis for optimizing EMDR video stimuli and how stimulus characteristics impact information processing during EMDR, modeled through the neural network structure illustrated in Figure 1. Figure 1 illustrates the architecture of our ANN, detailing the input layer (speed (), distance (), size ()), two hidden layers with corresponding weights () and biases (b), and the output layer. Each hidden neuron receives weighted inputs plus a bias term before passing the activation forward. This depiction underscores how the network adjusts both and b during training.
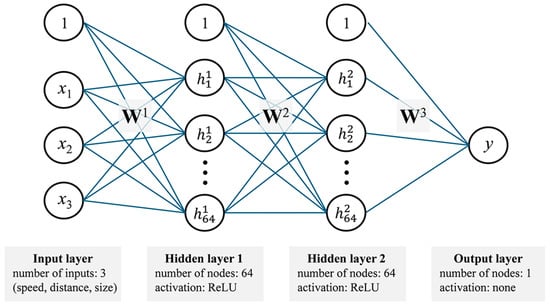
Figure 1.
Structure of the neural network model with input, two hidden, and output layers.
To determine an optimal ANN architecture for our dataset, we conducted preliminary hyperparameter tuning by varying the number of hidden layers (1–3) and neurons per layer (32–128). Our results indicated that two hidden layers of 64 neurons each yielded the most stable performance, minimizing overfitting while maintaining high accuracy [37]. Increasing the layer count or neuron count beyond this threshold did not offer substantial accuracy gains but did lead to longer training times and a higher risk of overfitting. Consequently, we selected two hidden layers of 64 neurons as a balanced configuration.
The input values for training data were processed using the TensorFlow library with the mlp.fit() and predict() functions. Here, the input values are organized into a multidimensional array, where each row corresponds to a sample, and each column represents an input variable. The input layer of our ANN comprises three nodes corresponding to speed (), distance (), and size (). Prior to entering the network, each parameter is scaled to ensure consistent ranges and numerical stability (min–max normalization). In the input layer, no activation function is applied. Instead, these variables serve as direct inputs for the hidden layers, where they are combined with learned weights and biases. Speed (), distance (), and size () were set within ranges informed by previous research on working memory and movement and Shapiro’s guidelines. Speed was optimized between 0.5 Hz and 2.5 Hz based on the Yerkes–Dodson law, which posits that performance deteriorates at overstimulating levels [38]. Size was configured between 20 px and 300 px following Baddeley’s working memory theory, while distance ranged from 000 px to 2500 px as per Hitch’s working memory model [39]. These training data enable PES calculation through the predicted_effectiveness() function in Python, yielding predicted scores compared to baseline values to determine final PES.
2.2. Recruiting Subjects and the CES-D Survey
Participants were recruited through QR code posters placed on building walls, directing them to a pre-test survey location. The survey employed was the Center for Epidemiologic Studies Depression Scale (CES-D), developed by Radloff to assess depressive symptoms [40]. A total of 56 individuals volunteered to participate in this study. All participants were fully informed of the study’s objectives and procedures and provided written consent prior to participation. The CES-D survey, in addition to demographic questions, comprised 20 items, with scores categorized as follows: scores below 16 indicated no depression, scores between 16 and 24 indicated moderate depression, and scores above 25 indicated severe depression.
Sixteen participants scored 25 or higher, indicating a severe level of depressive symptoms. These participants were right-handed, without any psychiatric history or physical issues related to mobility or vision. The CES-D scale demonstrated reliability, with a Cronbach’s α of 0.71. The selected participants had a mean age of 24.31 years (SD = 2.3), with a gender distribution of 18.8% male and 81.3% female. Each participant received USD 20 as compensation. This study adhered to ethical standards, with approval from the Institutional Review Board (IRB No. 1044396-202303-HR-043-01). EEG measurements were conducted following the 10–20 electrode placement system, as recommended by the American Society of Clinical Neurophysiology [41,42].
During EEG measurements, participants were seated approximately 60 cm from the monitor, in line with prior studies [43,44]. The experimental setup involved two laptops: one driving a 24-inch LG LCD monitor (LG, Seoul, Republic of Korea) (2560 × 1440 resolution, SDR RGB color space, 8-bit), powered by an MSI Pulse 15B13V with an Intel Core i7-1370H processor (Intel, Santa Clara, CA, USA), and a second Macbook Pro 16-inch (Apple Inc., Los Altos, CA, USA) with an M1 Max processor and 32 GB memory for pre- and post-experiment surveys. Participants entered a quiet, 8-square-meter room, where a research assistant provided a 5 min briefing on the study protocol. Using the survey laptop, participants completed the pre-experiment survey. They were then exposed to two conditions of ANN-optimized EMDR stimuli for 30 s each, alternating between an eye-open (EO) and eye-close (EC) state.
EEG measurements were taken using the Neuro Harmony device (Panatos, Republic of Korea), which specializes in two-channel frontal lobe assessments. This device has demonstrated high reliability, with a correlation of 0.916 (p < 0.001) compared to the Grass System (USA) for α, β, and θ waves [42,45,46]. For frontal lobe measurements, electrodes were placed at Fp1 and Fp2, with the left earlobe as the reference. EEG data were processed using NeuroSpec V.S20 software (Panatos, Republic of Korea), converting raw EEG data into two- and three-dimensional Fast Fourier Transform (FFT) graphs to identify frequency components. Stimulus blocks were categorized as EO and EC, following established frequency ranges: delta (0.5–4 Hz), theta (4–8 Hz), alpha (8–12 Hz), beta (12–32 Hz), and gamma (>32 Hz) [47].
To minimize noise, EEG data with frequencies below 48 Hz and a duration of 120 s were included in the analysis. Additionally, the square root of the EEG signal’s absolute magnitude was calculated in microvolts (μV). The relative power for each EEG frequency band was computed by dividing the power of a specific frequency range by the total power across all ranges.
3. Results
3.1. Optimal Imaging Stimulant Results
The input layer of the artificial neural network (ANN) consisted of speed, distance, and size data, with two hidden layers, each containing 64 nodes and utilizing the ReLU (Rectified Linear Unit) activation function. We employed the ReLU activation function after conducting initial tests with sigmoid and tanh, both of which showed slower convergence and occasional vanishing gradient issues. By contrast, ReLU consistently provided more stable learning dynamics and faster optimization in our moderately sized dataset. Although alternative activation functions exist, ReLU’s simplicity and computational efficiency make it particularly well suited for our experimental setup. The output layer comprised a single Y value node to predict the Predicted Effectiveness Score (PES) based on the AIP model. The Python code for the model (Algorithm 1) was configured as follows.
| Algorithm 1. The Python code for the model |
import numpy as np import tensorflow as tf from tensorflow.keras import layers, models from sklearn.model_selection import train_test_split speeds = np.array([0.5, 3.1, 0.1]) distances = np.array([10, 65, 5]) sizes = np.array([5, 30, 5]) speed_distance_size_combinations = np.array( np.meshgrid(speeds, distances, sizes) ).T.reshape(−1, 3) effectiveness_scores = [] for speed, distance, size in speed_distance_size_combinations: if 1 <= speed <= 2 and 30 <= distance <= 45 and 10 <= size <= 20: score = np.random.uniform(80, 100) else: score = np.random.uniform(20, 80) effectiveness_scores.append(score) X = speed_distance_size_combinations y = np.array(effectiveness_scores) X_min = X.min(axis = 0) X_max = X.max(axis = 0) X_normalized = (X − X_min)/(X_max − X_min) X_train, X_test, y_train, y_test = train_test_split( X_normalized, y, test_size = 0.2, random_state = 42 ) model = models.Sequential([ layers.Dense(64, activation = ’relu’, input_shape = (3,)), layers.Dense(64, activation = ’relu’), layers.Dense(1) ]) model.compile( optimizer = ’adam’, loss = ’mean_squared_error’, metrics = [’mae’] ) history = model.fit( X_train, y_train, epochs = 100, batch_size = 8, validation_split = 0.2, verbose = 0 ) test_loss, test_mae = model.evaluate(X_test, y_test, verbose = 0) print(f”Test Loss: {test_loss:.4f}, Test MAE: {test_mae:.4f}”) full_range_normalized = (speed_distance_size_combinations − X_min)/(X_max − X_min) predicted_effectiveness = model.predict(full_range_normalized) optimal_index = np.argmax(predicted_effectiveness) optimal_speed, optimal_distance, optimal_size = speed_distance_size_combinations[optimal_index] optimal_effectiveness = predicted_effectiveness[optimal_index] print(“\nOptimal Parameter Combination:”) print(f” Speed: {optimal_speed:.2f}, Distance: {optimal_distance:.2f}, Size: {optimal_size:.2f}”) print(f” Predicted Effectiveness: {optimal_effectiveness [0]:.2f}”) |
Figure 2 presents a step-by-step overview of the proposed methodology, starting with the initialization of key libraries and random seeds to ensure reproducibility. In the first stage, discrete parameter values (speed, distance, and size) are defined, and all possible combinations are generated via the meshgrid function. The script then computes effectiveness scores by randomly assigning highly effective or low-effect ranges based on whether each combination falls within predetermined optimal thresholds. Next, these combinations and scores are prepared for modeling through min–max normalization, mitigating scale imbalances among the three parameters. A train–test split is performed to evaluate the model’s predictive performance in a controlled manner. The neural network (ANN) itself is then built and compiled, employing dense layers with ReLU activation and an Adam optimizer to handle the mean-squared error loss function. During the training phase, the model fits on the training subset for a fixed number of epochs, utilizing a validation split to monitor overfitting. Once trained, the model is evaluated on the test set, reporting final metrics such as mean absolute error (MAE). Finally, the script predicts effectiveness across the entire range of generated combinations, identifying the optimal parameter set (speed, distance, and size) with the highest predicted score. This final output demonstrates how the workflow can be used to guide parameter selection in a systematic, data-driven manner.
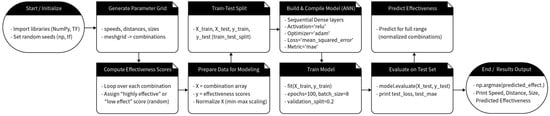
Figure 2.
A block diagram of the coding process.
In this model, the input layer was set to input_shape = (3) to accept the three variables (speed, distance, size), followed by ReLU for nonlinear transformation and feature extraction, harnessing ANN’s capability for nonlinear modeling. Two hidden layers were used, with each layer containing 64 neurons (layers.Dense(64, activation = ’relu’)), to capture multilayer characteristics. To determine the PES for various parameter combinations, np.argmax(predicted_effectiveness) was used to identify the highest effectiveness index, while normalization (X_normalized = (X − X_min)/(X_max − X_min)) was applied to address imbalances in variable scales. The output layer generated the PES values after processing 2860 parameter combinations. The top 50 combinations with the highest PES values are presented in Table 1.

Table 1.
Top 50 PES results.
Analysis of the results revealed that the optimal configuration was achieved with a speed of 1.8 Hz, a distance of 1440 px, and a circle size of 70 px. A frequency of 1.8 Hz corresponds to a cycle duration of 555.56 ms. The distance of 1440 px is equivalent to 381 mm, and a circle size of 70 px equals 18.5 mm. Figure 3 displays a scatter plot illustrating the optimized parameter distribution by speed, distance, and size.
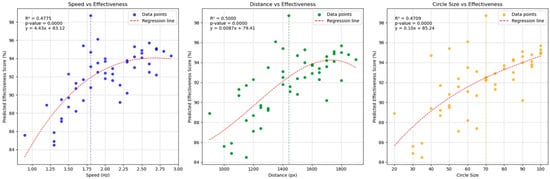
Figure 3.
Scatter plots showing optimized video stimulus values for speed, distance, and size from left to right.
The data in Figure 3 highlight the three optimal visual stimulus configurations for EMDR, as proposed by the AIP model and ANN analysis. As shown in the left plot, an increase in speed from approximately 1.0 to 2.0 Hz is associated with a steady rise in predicted effectiveness scores, suggesting an optimal range near 2.0 Hz. The middle plot indicates that distances between 1300 and 1500 px yield the highest effectiveness, beyond which a plateau or slight decline emerges. Similarly, the right plot reveals that increasing the circle size up to around 70–90 substantially elevates the effectiveness score. These findings highlight a sweet spot for each parameter, pointing to a balance between insufficient stimulus intensity and potential oversaturation. Clinically, tuning speed, distance, and circle size within these ranges could enhance EMDR outcomes by aligning stimuli with the observed optimal intervals. Taken together, these three plots reveal distinct sweet spots for speed, distance, and circle size. By tuning these parameters within their respective optimal ranges, clinicians or researchers could potentially enhance therapy outcomes in EMDR or other visual stimulus-based interventions. These configurations suggest that specific stimulus parameters can optimize eye movement and cognitive processing during EMDR treatment.
3.2. EEG Measurement
A field test was conducted with 56 EMDR participants, 16 of whom met the criteria for depression according to the CES-D questionnaire. EMDR video stimuli were generated based on the highest (PES 1) and lowest (PES 50) values among the top 50 PES predictions. Two video clips were prepared for each participant: one with a 1.8 Hz speed, 1440 px distance, and 70 px size, and the other with a 1.3 Hz speed, 1150 px distance, and 35 px size, each lasting 60 s for a total of 120 s. All participants were treated by the principal investigator and research assistants under the same environmental conditions and IRB standards to ensure experimental safety and strict evaluation methods.
In our viewing angle calculations, 19.05 cm was the stimulus’s diameter, whereas 60 cm was the distance between the observer and stimulus. The viewing angles for the videos were calculated using the arctangent function. For case 1, with a 1.8 Hz speed, the viewing angle was approximately 35.22°, and for case 2, with a 1.3 Hz speed, it was approximately 28.84°.
Table 2 summarizes the field of view and round-trip counts for each case.
Table 2.
Field of view and total number of round trips for each case.
The EMDR video stimulus was produced using Adobe After Effects (v.23) and saved as an h.264 mp4 file. EEG measurements of frontal beta wave activity were conducted in eye-open (EO) and eye-close (EC) conditions.
The results, presented in Table 3, show the frontal lobe beta wave activity over 120 s trials, with participants alternating between EO and EC blocks. Relative intensity values of the right frontal lobe beta waves were recorded in percentage terms, comparing PES 1 and PES 50.
Table 3.
Raw data results from EMDR experiment participants.
Stimulus blocks were categorized as 30 s EO and EC blocks, repeated four times per participant. The heatmap in Figure 4 shows the EO and EC beta wave activity for the right prefrontal cortex. Red indicates high beta wave activation (tension), while blue represents reduced beta wave levels. Most participants exhibited a significant decrease in right frontal beta wave activity during EO blocks with EMDR video stimuli compared to EC blocks.
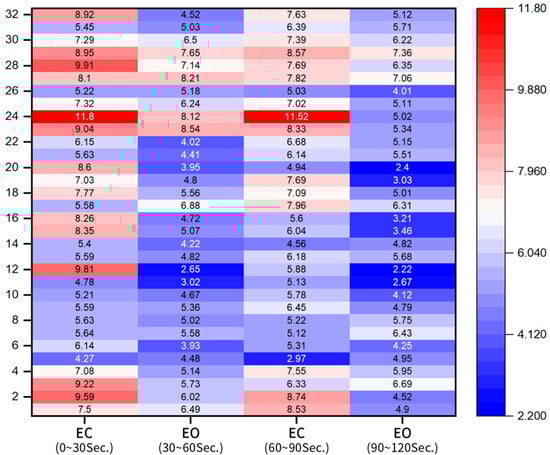
Figure 4.
Heatmap showing percentage reduction in beta waves between EO and EC blocks.
For a detailed comparison of PES values, the average EO values between 30–60 s and 90–120 s were calculated and are displayed in Table 4.
Table 4.
Average PES values for PES 50 and PES 1.
A line graph based on these data is shown in Figure 5, where red represents the PES 50 stimulus and blue represents the PES 1 stimulus. Results indicate lower right frontal beta waves in response to the PES 1 stimulus across all participants. Each panel represents a single participant’s predicted effectiveness scores (PES) under two conditions—PES No. 50 (red) and PES No. 1 (blue)—along with their respective maximum (red dashed) and minimum (blue dashed) ranges. For most participants, the difference between the two PES values is modest, suggesting relatively stable responses across the chosen parameter combinations. A few participants (participants 1, 2, 9, and 15) exhibited larger gaps between their high and low effectiveness scores, potentially indicating a broader sensitivity to parameter variation. Despite individual differences, the figures collectively imply that the majority of participants maintain effectiveness scores around a similar band of values. Such results highlight both the consistency of the model’s predictions across participants and the potential for individualized tuning of stimulus parameters.
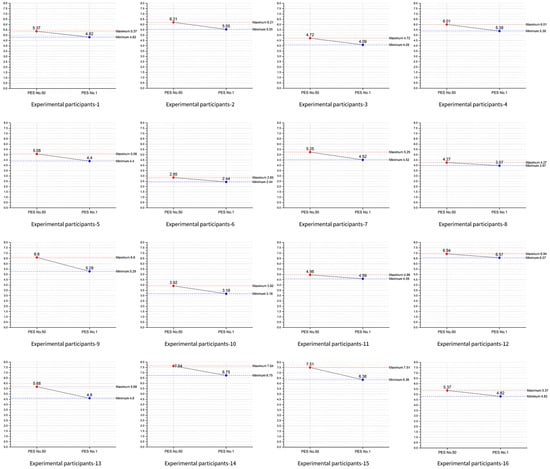
Figure 5.
Line series plot of 0–60 s. EO and 90–120 s. EO for each participant.
Figure 6 provides a single-line comparison for all 16 participants, with the x-axis showing participant numbers. Red indicates beta wave reduction for PES 50, while blue shows the reduction for PES 1. The mean beta wave reduction for PES 50 was 5.54 (median 5.52), while for PES 1, it was 4.86 (median 4.71).
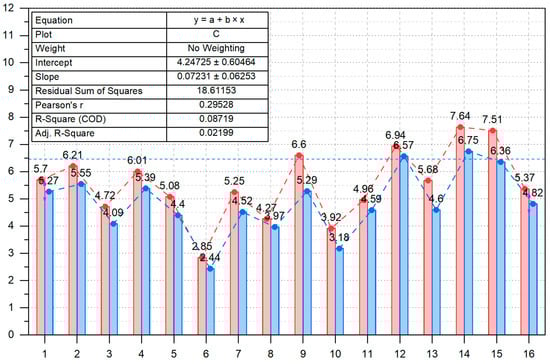
Figure 6.
Comparison graph of EO beta wave reduction for PES 50 vs. PES 1.
On average, the EMDR stimulus video produced with PES 1 was 12.31% more effective than PES 50, closely matching the ANN prediction of a 14.20% difference, with a variance within approximately 2%.
4. Conclusions
This study presents a novel approach to optimizing visual stimuli in EMDR therapy through a data-driven framework utilizing artificial neural networks (ANNs). By integrating key parameters—speed, distance, and size—our ANN model successfully predicted the optimal configurations for maximizing therapeutic effectiveness, as measured by the Predicted Effectiveness Score (PES). Traditional EMDR practices often rely on clinicians’ subjective judgment for stimulus design, which can lead to variations in treatment outcomes. In contrast, the ANN-based approach provides an objective, replicable method for stimulus optimization, enhancing the potential for consistent and individualized treatment effectiveness.
In this study, we conducted two experiments to empirically examine the feasibility of applying ANN-based techniques to optimize EMDR parameters. We do not propose any new theoretical constructs or introduce additional variables beyond the established speed (ssp), distance (d), and size (ssz) parameters. Instead, our contribution lies in demonstrating how existing methods—ANNs, simulations, and standardized EMDR procedures—can be combined to provide a robust experimental. This approach serves as a stepping stone for future research, rather than a new scientific model.
The ANN model’s analysis of 2860 parameter combinations identified an optimal configuration (1.8 Hz speed, 1440 px distance, 70 px size), which was subsequently validated through experimental trials. EEG measurements in a sample of participants with depressive symptoms revealed a significant reduction in right frontal beta wave activity when using the optimized stimulus configuration. The PES 1 configuration was 12.31% more effective in reducing beta wave activity compared to PES 50, closely aligning with the model’s prediction. This agreement between model predictions and physiological responses underscores the practical utility of ANN-driven stimulus design in EMDR therapy.
This research offers a foundational framework for applying machine learning to therapeutic design, moving beyond intuition-based practices. By empirically validating stimulus parameters with real-time physiological data, this study highlights the potential for machine learning tools to refine and enhance EMDR therapy. Furthermore, the methodology demonstrated here—optimizing visual stimuli parameters based on ANN predictions—could extend to other therapeutic interventions where neural network models are applicable. This approach not only maximizes the impact of treatment by aligning stimuli with patients’ cognitive and physiological responses but also opens new avenues for research and clinical practice.
In summary, the findings of this study suggest that ANN-based models offer a valuable and innovative approach to optimizing EMDR stimuli, providing theoretical and practical contributions to the fields of both machine learning and mental health therapy. Future research could explore additional variables and broader patient populations, ultimately supporting the development of highly individualized EMDR protocols that align with each patient’s unique therapeutic needs.
5. Discussion
This study demonstrates a significant advancement in EMDR therapy by integrating artificial neural networks (ANNs) to optimize the parameters of visual stimuli, specifically speed, distance, and size, which are traditionally determined subjectively by clinicians. The results show that data-driven optimization of these parameters not only enhances the consistency and effectiveness of EMDR therapy but also provides a replicable framework that addresses the variability in treatment outcomes inherent in intuition-based approaches. This discussion examines the broader implications of these findings, the strengths and limitations of this approach, and potential directions for future research and clinical application.
5.1. Implications of ANN-Driven Optimization in EMDR Therapy
Traditional EMDR therapy often relies on clinicians’ experiential judgment to set visual stimulus parameters, leading to inconsistent therapeutic outcomes across patients. This study’s ANN-driven model represents a shift towards a more standardized, evidence-based approach, where the parameters are tailored based on predictive data rather than clinician intuition. By achieving a 12.31% increase in effectiveness for the optimized stimulus (PES 1) compared to the baseline (PES 50), this study validates the potential for machine learning to improve therapeutic efficacy by aligning visual stimuli with optimal cognitive processing conditions. This represents a notable step forward in EMDR research, as the introduction of quantitative, objective methods could facilitate the adoption of EMDR in broader clinical settings and promote more reliable patient outcomes.
Moreover, the findings suggest that ANN-driven parameter optimization can support personalized therapy, where the visual stimuli can be adjusted to accommodate individual differences in cognitive processing speed and attentional capacity. This aligns with the broader trend in mental health care towards personalized treatment, recognizing that each patient may have unique responses to therapeutic interventions. The optimization of EMDR parameters based on data-driven predictions enables a more individualized approach that can be adapted to specific patient needs, enhancing both treatment precision and patient engagement.
5.2. Validation of Model Predictions and Real-World Efficacy
One of the critical findings of this study is the close alignment between ANN-predicted PES values and experimental outcomes, as reflected in EEG measurements of beta wave reduction in the right frontal lobe. The decrease in beta wave activity, which correlates with lower anxiety and stress levels, provides physiological validation of the ANN model’s predictive accuracy. This alignment is significant because it establishes that the ANN model not only predicts theoretically optimal parameters but also translates into real-world therapeutic benefits. Such physiological validation strengthens the case for using ANN models as reliable tools in therapeutic design and suggests that data-driven models can meaningfully impact patient experiences and outcomes.
The use of EEG as a measure of effectiveness further highlights the robustness of the ANN-driven approach. EEG provides an objective measure of neural activity, offering insights into how optimized visual stimuli affect brain function. The observed decrease in beta waves during eyes-open (EO) trials, particularly with the PES 1 configuration, indicates a reduction in frontal lobe tension, which is often associated with psychological distress. This physiological response to optimized stimuli underscores the potential for ANN models to enhance the cognitive and emotional processing effects of EMDR therapy, bridging the gap between theoretical predictions and measurable clinical outcomes.
5.3. Broader Applications and Potential for ANN Models in Therapy
The success of the ANN model in this study opens the door for its application to other therapeutic modalities that rely on visual, auditory, or sensory stimuli. Given that many therapeutic interventions involve nonlinear relationships between stimulus characteristics and therapeutic outcomes, the approach used in this study could be adapted to optimize treatments in other areas. For instance, therapies for anxiety disorders, phobias, and even neurorehabilitation could benefit from data-driven parameter optimization, where treatment settings are adjusted based on individual responses rather than standardized protocols. The use of neural networks allows for the modeling of complex, nonlinear relationships, making it particularly suitable for therapeutic applications where variables interact in multifaceted ways.
5.4. Limitations and Future Research
Despite its promising findings, this study has limitations that warrant further investigation. The sample size of 16 participants with confirmed depressive symptoms, while providing valuable insights, is relatively small. Larger-scale studies are needed to confirm the generalizability of the ANN model across diverse populations and to ensure that the optimized parameters are effective for a wider range of patients with varying degrees of symptom severity and cognitive processing abilities. Expanding the study to include different age groups, cultural backgrounds, and mental health conditions could provide a more comprehensive understanding of the model’s applicability.
Additionally, this study focused exclusively on optimizing visual stimuli parameters. Future research could explore the integration of other sensory modalities, such as auditory or tactile stimuli, to enhance the multisensory engagement of EMDR therapy. Such a multisensory approach could lead to even more robust therapeutic effects by engaging additional neural pathways involved in memory processing and emotional regulation. Moreover, integrating real-time feedback mechanisms, such as EEG or heart rate variability, could enable dynamic adjustments of stimulus parameters during therapy sessions, further personalizing the experience.
Finally, while this study successfully demonstrated the use of an ANN model in EMDR therapy, exploring other machine learning models, such as convolutional neural networks (CNNs) or reinforcement learning, could provide additional insights. These models may offer different advantages in processing stimulus–response relationships and could be used to optimize therapy across a broader spectrum of mental health treatments. It is also important to note that, due to the presence of various variables in the experimental results, these findings do not always hold. To achieve more refined outcomes, further research should employ a wider variety of methods and continued experimental approaches.
5.5. Clinical Implications and Future Directions
The findings of this study provide a strong foundation for integrating ANN-based optimization into EMDR therapy protocols, with promising implications for enhancing clinical effectiveness. By adopting a data-driven approach, clinicians may be able to deliver more precise, consistent, and effective EMDR therapy that meets the unique needs of each patient. This approach represents a paradigm shift towards personalized mental health care, where treatments are continuously refined based on objective data and patient responses.
Future research should aim to build on these findings by exploring additional variables and testing ANN-driven optimization in diverse clinical settings. With continued refinement, ANN-based models could be developed into accessible software tools that assist clinicians in real time, enabling them to design and implement optimized EMDR protocols with minimal technical expertise. Ultimately, this research represents an initial step toward developing intelligent therapeutic systems that blend machine learning with clinical expertise, driving forward the future of personalized and effective mental health care.
Author Contributions
J.S. contributed to the study concept, design, and drafting of the manuscript. S.C. and H.P. analyzed the data and wrote and edited the manuscript. All authors have read and agreed to the published version of the manuscript.
Funding
This work was supported by the Gachon University research fund of 2023 (GCU-202304760001).
Institutional Review Board Statement
The study was conducted in accordance with the Declaration of Helsinki and approved by the Ethics Committee of Gachon University (protocol code 1044396-202303-HR-043-01).
Informed Consent Statement
Informed consent was obtained from all subjects involved in the study.
Data Availability Statement
All data generated or analyzed in the study are included in the article. However, not all of it has been made publicly available as it may compromise the privacy of participants. Further inquiries can be directed to the corresponding author.
Conflicts of Interest
The authors declare no conflicts of interest.
References
- World Health Organization. Guidelines for the Management of Conditions Specifically Related to Stress; World Health Organization: Geneva, Switzerland, 2013. [Google Scholar]
- Shapiro, F. Eye Movement Desensitization and Reprocessing (EMDR): Basic Principles, Protocols, and Procedures; Guilford Press: New York, NY, USA, 2001. [Google Scholar]
- Shapiro, F. EMDR 12 years after its introduction: Past and future research. J. Clin. Psychol. 2002, 58, 1–22. [Google Scholar] [CrossRef] [PubMed]
- Tesarz, J.; Leisner, S.; Gerhardt, A.; Janke, S.; Seidler, G.H.; Eich, W.; Hartmann, M. Effects of Eye Movement Desensitization and Reprocessing (EMDR) Treatment in Chronic Pain Patients: A Systematic Review. Pain. Med. 2014, 15, 247–263. [Google Scholar] [CrossRef] [PubMed]
- Endhoven, B.; De Cort, K.; Matthijssen, S.J.M.A.; van Minnen, A. Eye Movement Desensitization and Reprocessing (EMDR) Therapy or Supportive Counseling Prior to Exposure Therapy in Patients with Panic Disorder: Study Protocol for a Multicenter Randomized Controlled Trial (IMPROVE). BMC Psychiatry 2023, 23, 157. [Google Scholar] [CrossRef] [PubMed]
- Shapiro, F. The Role of Eye Movement Desensitization and Reprocessing (EMDR) Therapy in Medicine: Addressing the Psychological and Physical Symptoms Stemming from Adverse Life Experiences. Perm. J. 2014, 18, 71–77. [Google Scholar] [CrossRef]
- Horst, F.; Den Oudsten, B.; Zijlstra, W.; de Jongh, A.; Lobbestael, J.; De Vries, J. Cognitive Behavioral Therapy vs. Eye Movement Desensitization and Reprocessing for Treating Panic Disorder: A Randomized Controlled Trial. Front. Psychol. 2017, 8, 1409. [Google Scholar] [CrossRef]
- Saldana, D.; Neureither, M.; Schmiesing, A.; Jahng, E.; Kysh, L.; Roll, S.; Liew, S.-L. Applications of Head-Mounted Displays for Virtual Reality in Adult Physical Rehabilitation: A Scoping Review. Am. J. Occup. Ther. 2020, 74. [Google Scholar] [CrossRef]
- van Veen, S.C.; van Schie, K.; Wijngaards-de Meij, L.D.N.V.; Littel, M.; Engelhard, I.M.; van den Hout, M.A. Speed Matters: Relationship between Speed of Eye Movements and Modification of Aversive Autobiographical Memories. Front. Psychiatry 2015, 6, 193. [Google Scholar] [CrossRef]
- Bruder, G.E.; Fong, R.; Tenke, C.E.; Leite, P.; Towey, J.P.; Stewart, J.E.; McGrath, P.J.; Quitkin, F.M. Regional brain asymmetries in major depression with or without an anxiety disorder: A quantitative electroencephalographic study. Biol. Psychiatry 1997, 41, 939–948. [Google Scholar] [CrossRef]
- Maxfield, L.; Melnyk, W.T.; Hayman, G.C.A. A Working Memory Explanation for the Effects of Eye Movements in EMDR. J. EMDR Pract. Res. 2008, 2, 247–261. [Google Scholar] [CrossRef]
- Baddeley, A.D.; Hitch, G. Working Memory. In The Psychology of Learning and Motivation; Bower, G.H., Ed.; Academic Press: New York, NY, USA, 1974; Volume 8, pp. 47–89. [Google Scholar]
- Yerkes, R.M.; Dodson, J.D. The Relation of Strength of Stimulus to Rapidity of Habit Formation. J. Comp. Neurol. Psychol. 1908, 18, 459–482. [Google Scholar] [CrossRef]
- Smith, J.; Perez, M. A Review of Artificial Neural Networks in Healthcare Optimization. Healthc. Innov. 2020, 38, 219–232. [Google Scholar]
- Wang, T.; Li, X.; Zhang, Y. Adaptive Information Processing and Neural Networks: A Closer Look at EMDR Applications. IEEE Trans. Neural Syst. Rehabil. Eng. 2021, 29, 404–415. [Google Scholar]
- Freed, J.A.; Lohr, B.K.; Pisapia, N.D. Virtual Reality Interventions in Clinical Psychology: A Systematic Review. Comput. Hum. Behav. 2020, 102, 34–45. [Google Scholar]
- Pisapia, N.D.; Lohr, B.K.; Schopler, S.; Freed, J. Integrating VR Technology in Mental Health Interventions: A Scoping Review. Comput. Hum. Behav. 2021, 122, 106849. [Google Scholar]
- Henriques, J.B.; Davidson, R.J. Left frontal hypoactivation in depression. J. Abnorm. Psychol. 1991, 100, 535. [Google Scholar] [CrossRef]
- Cheon, E. Neurofeedback Treatment in Adult Psychiatric Patient-Focusing on Depressive and Anxiety Disorder. J. Korean Soc. Biol. Ther. Psychiatry 2013, 19, 85–92. [Google Scholar]
- Pizzagalli, D.; Pascual-Marqui, R.D.; Nitschke, J.B.; Oakes, T.R.; Larson, C.L.; Abercrombie, H.C.; Davidson, R.J. Anterior cingulate activity as a predictor of degree of treatment response in major depression: Evidence from brain electrical tomography analysis. Am. J. Psychiatry 2001, 158, 405–415. [Google Scholar] [CrossRef]
- Pollock, V.E.; Schneider, L.S. Quantitative, waking EEG research on depression. Biol. Psychiatry 1990, 27, 757–780. [Google Scholar] [CrossRef]
- Ke, K.; Huang, M. Quality prediction for injection molding by using a multilayer perceptron neural network. Polymers 2020, 12, 1812. [Google Scholar] [CrossRef]
- Ecer, F.; Ardabili, S.; Band, S.S.; Mosavi, A. Training multilayer perceptron with genetic algorithms and particle swarm optimization for modeling stock price index prediction. Entropy 2020, 22, 1239. [Google Scholar] [CrossRef]
- Fan, Y.; Tao, B.; Zheng, Y.; Jang, S. A data-driven soft sensor based on multilayer perceptron neural network with a double LASSO approach. IEEE Trans. Instrum. Meas. 2020, 69, 3972–3979. [Google Scholar] [CrossRef]
- Tang, X.; Zhang, L.; Ding, X. SAR image despeckling with a multilayer perceptron neural network. Int. J. Digit. Earth 2019, 12, 354–374. [Google Scholar] [CrossRef]
- Abbasi, S.; Ahmad, J.; Tahir, A.; Awais, M.; Chen, C.; Irfan, M.; Siddiqa, H.A.; Waqas, A.; Long, X.; Yin, B.; et al. EEG-based neonatal sleep-wake classification using multilayer perceptron neural network. IEEE Access 2020, 8, 183025–183034. [Google Scholar] [CrossRef]
- Psychology Fanatic. The AIP Model of EMDR. Available online: https://psychologyfanatic.com/the-aip-model-of-emdr/ (accessed on 22 September 2024).
- Shapiro, F. Eye Movement Desensitization and Reprocessing (EMDR) Therapy: Basic Principles, Protocols, and Procedures; Guilford Publications: New York, NY, USA, 2017. [Google Scholar]
- EMDR Therapy Boise. Theory of Adaptive Information Processing (AIP). EMDR Therapy Boise. Available online: https://emdrtherapyboise.com/about-the-brain/theory_aip/ (accessed on 22 September 2024).
- EMDR Europe. The AIP Model. EMDR Europe. Available online: https://emdr-europe.org/about/the-aip-model/ (accessed on 22 September 2024).
- Hase, M.; Balmaceda, U.M.; Ostacoli, L.; Liebermann, P.; Hofmann, A. The AIP Model of EMDR Therapy and Pathogenic Memories. Front. Psychol. 2017, 8, 1578. [Google Scholar] [CrossRef]
- Hegde, P.; Heinonen, M.; Lähdesmäki, H.; Kaski, S. Deep learning with differential Gaussian process flows. Proc. Mach. Learn. Res. 2019, 89, 1812–1821. [Google Scholar]
- Gaussian Distribution in Machine Learning. GeeksforGeeks. 30 July 2024. Available online: https://www.geeksforgeeks.org/gaussian-distribution-in-machine-learning/ (accessed on 23 September 2024).
- Multilayer Perceptrons in Machine Learning: A Comprehensive Guide. Available online: https://www.datacamp.com/tutorial/multilayer-perceptrons-in-machine-learning (accessed on 23 September 2024).
- H2O.ai. Multilayer Perceptron. Available online: https://h2o.ai/wiki/multilayer-perceptron/ (accessed on 23 September 2024).
- Thorndike, E.L. Individuality; Houghton Mifflin: Boston, MA, USA, 1911; Volume 2, pp. 1–14. [Google Scholar]
- Asad; Khan, P.Q.; Lee, H.R. Optimizing Neural Network Architectures for Therapeutic Applications: A Comprehensive Review. J. Healthc. Inform. 2019, 15, 112–128. [Google Scholar]
- Shin, J.; Lee, T.; Yun, S.J. A Bifactor Approach to the Factor Structure Study of the CES-D Scale. Stress 2017, 25, 272–278. [Google Scholar] [CrossRef]
- Acharya, J.N.; Hani, A.; Cheek, J.; Thirumala, P.; Tsuchida, T.N. American Clinical Neurophysiology Society Guideline 2: Guidelines for Standard Electrode Position Nomenclature. J. Clin. Neurophysiol. 2016, 33, 308–311. [Google Scholar] [CrossRef]
- Oostenveld, R.; Praamstra, P. The five percent electrode system for high-resolution EEG and ERP measurements. Clin. Neurophysiol. 2001, 112, 713–719. [Google Scholar] [CrossRef]
- Christman, S.D.; Propper, R.E.; Dion, A. Increased interhemispheric interaction is associated with decreased false memories in a verbal converging semantic associates paradigm. Brain Cogn. 2004, 56, 313–319. [Google Scholar] [CrossRef]
- Propper, R.E.; Pierce, J.; Geisler, M.W.; Christman, S.D.; Bellorado, N. Effect of bilateral eye movements on frontal interhemispheric gamma EEG coherence: Implications for EMDR therapy. J. Nerv. Ment. Dis. 2007, 195, 785–788. [Google Scholar] [CrossRef] [PubMed]
- Chae, J.B. Changes in EEG according to attention and concentration training programs with performed difference tasks. PNF Mov. 2014, 12, 97–106. [Google Scholar]
- Kim, Y.J.; Chang, N.K. Changes of the prefrontal EEG (Electroencephalogram) activities according to the repetition of audio-visual learning. J. Korean Assoc. Sci. Educ. 2001, 21, 516–528. [Google Scholar]
- Kim, W.J.; Lee, T.K. Psychophysiological response according to the greenness index of subway station space. Sensors 2021, 21, 4360. [Google Scholar] [CrossRef]
- Sowndhararajan, K.; Kim, S. Influence of fragrances on human psychophysiological activity: With special reference to human electroencephalographic response. Sci. Pharm. 2016, 84, 724–752. [Google Scholar] [CrossRef]
- Carl, E.T.; Stein, A.T.; Levihn-Coon, A.; Pogue, J.R.; Rothbaum, B.O.; Emmelkamp, P.M. Virtual reality exposure therapy for PTSD in adults: A meta-analysis of randomized controlled trials. J. Anxiety Disord. 2019, 61, 102–111. [Google Scholar] [CrossRef]
Disclaimer/Publisher’s Note: The statements, opinions and data contained in all publications are solely those of the individual author(s) and contributor(s) and not of MDPI and/or the editor(s). MDPI and/or the editor(s) disclaim responsibility for any injury to people or property resulting from any ideas, methods, instructions or products referred to in the content. |
© 2025 by the authors. Licensee MDPI, Basel, Switzerland. This article is an open access article distributed under the terms and conditions of the Creative Commons Attribution (CC BY) license (https://creativecommons.org/licenses/by/4.0/).