Abstract
Raw earth bricks made from river sediments and natural fibers are essentially environmentally friendly bricks. They are made from river sediment waste and natural fiber waste, both of which are renewable resources. Sediment-based bricks have been formed from river sediment and flax fibers, the latter being considered as waste. Both types of waste are available in the same region. The study focused on the definition of water content by means of a miniature Proctor test, on the incorporation of short flax fibers of 2, 3 and 4 cm at various dosages and on the shaping by dynamic compaction of bricks of reduced size of 4 cm × 4 cm × 16 cm, dimensions similar to mortar specimens. The air-drying kinetics of the specimens were monitored from manufacture through to stabilization of their mass. The effects of water content, fiber content and fiber length were analyzed. Recommendations are given for the manufacturing and drying of green bricks and natural fibers.
1. Introduction
Unfired earth bricks are a sustainable construction element, but their production requires significant quantities of soil of varying clay content, sometimes sourced from quarries. To save these resources, renewable soils such as dredged sediments could provide a sustainable solution. However, the particle size distribution and plasticity of these sediments will have to satisfy the criteria of a raw earth. Authors have also reported that compacted or compressed earth has low mechanical strength, particularly in the flexural mode [1,2,3]. Stabilization techniques initially remedied this by using binders such as cement or lime in limited amounts. Then, industrial waste gradually replaced these binders, which emit high levels of CO2. Various fly ashes from coal combustion, biomass, blast furnace slag and steel slag were added to either modify the initial properties of the earth or develop pozzolanic properties within the earth material. These same additions are also used as precursors for geo-polymerized unfired earth bricks. Inert waste from construction and demolition, and from the mineral and mining industries, can also help to improve the soil’s initial properties. But to increase strength and modify mechanical behavior, fibrous waste from agricultural sources, depending on the country, has been incorporated into unfired earth bricks [4,5,6]. They are also renewable. Fibers such as sisal, bamboo, jute, date, coconut, oil palm, rice or wheat straw, hemp, etc., [7,8] are used in optimal proportions to give the unfired brick its ductility while developing thermo–hygroscopic properties [9,10,11].
The proposed study focuses on an unfired brick made with renewable materials: dredged sediment and waste fibers from the flax industry. It is a compacted brick based on sediment and flax waste from the same region: an ecological brick. Once the river sediment’s suitability for making unfired bricks has been defined, the water content is determined by miniature Proctor tests. For different fiber dosages and fiber lengths, small-scale bricks measuring 4 cm × 4 cm × 16 cm were produced by dynamic compaction, then demolded and dried. Air drying was monitored as a function of water content, fiber content and fiber lengths of 2, 3 and 4 cm. Observation of the dimensions and mass of the specimens was used to study the drying kinetics of the bricks, more or less investigated in literature [12,13,14,15].
2. Materials and Methods
2.1. Materials
2.1.1. Fluvial Sediment
The sediments were dredged from the downstream section of the Rouen River Port (Rouen, Normandy, France) between kilometric point KP 260, La Bouille/Sahurs, and KP278, Duclair, as shown in Figure 1a. The dredger ‘Gambe d’Amfard’ operated on the Seine (Figure 1b) before delivering some of the dredged sediments either alongside the quayside in big-bag containers (Figure 1c, present study) or by discharging them for agricultural spreading (Figure 1d).
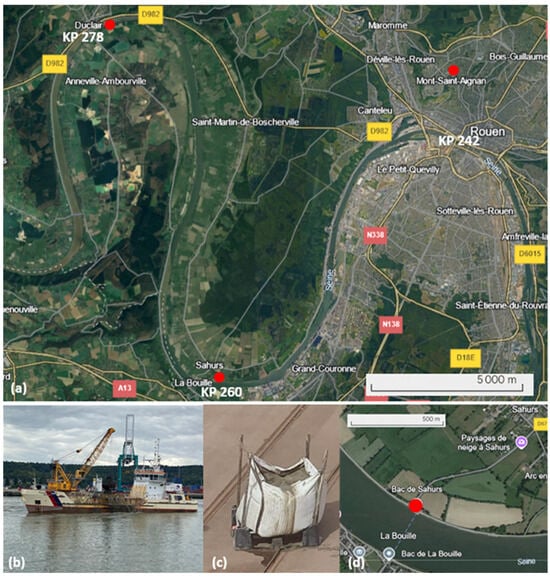
Figure 1.
Sediment dredging on River Seine downstream of Port of Rouen: (a) Dredging location between KP 260 and KP278, (b) Dredger “Gambe d’Amfard” on River Seine; (c) Sediment big-bag container on the quay at La Bouille; (d) Location for agricultural spreading near Sahurs village.
They were collected in two 1 m3 sealed big-bags. All the sediments were oven-dried at temperatures between 40 °C and 60 °C, crushed manually or with a knife mill and sifted with a 2 mm mesh sieve. The physical, geotechnical and chemical properties of the sediments were investigated to identify and characterize them in accordance with European standards. The nature and particle size distribution along with Atterberg limits were first determined to assess their suitability for unfired sediment-based bricks. The main values for the physical, geotechnical and chemical parameters of the sediments are given in Table 1.

Table 1.
Geotechnical data of the fluvial sediments.
As shown in Table 1, the particle size distribution of the sediment depends on its preparation after drying. The Rouen R1 sample was prepared manually and graded under dry conditions. A knife mill was used and the granulometry was performed with a laser particle size analyzer under wet conditions. This reduces the size of the particles and deagglomerates them (samples R2 and R3). The longer the disintegration time with the knife mill, the finer the sediment becomes, as in the case of sample R3. Samples R3-1 and R3-2 come from batch R3 and were prepared in the same way, with two particle sizes performed (see Figure 2). These are the finest sediments obtained in this study. This will have an influence on the compaction curve. Air drying or oven drying can also lead to some changes in the compaction curve, especially in the presence of organic matter [16,17,18]. This can be seen in Figure 2, where the curves shift to the left from sample R1, then R2 and samples R3. The sediment is becoming finer and finer and lacks the coarser elements required to meet standards; samples R1 and R2 appear to be more suitable from a granular point of view. Plasticity also plays a role in the manufacturing of unfired bricks.
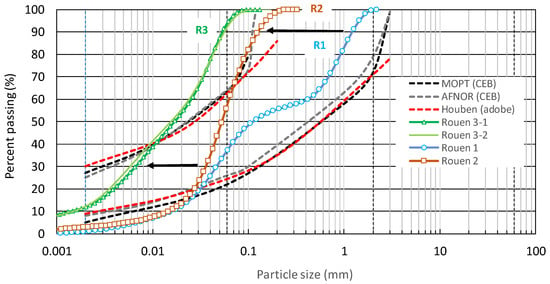
Figure 2.
Particle size distribution graphs for river sediment from Rouen and its suitability for raw earth bricks according to current standards (MOPT, [19]; AFNOR, [20]; Houben, [21]).
The behavior of the water–sediment mixture is evaluated using the consistency with Atterberg limits, i.e., plasticity tests, whatever the manufacturing type (extrusion, molding or handmade). The workability chart proposed by Bain and Highley [22] concerns clays used to produce ceramics, but it enables us to assess a priori whether the water–sediment mixture in this study is workable and to estimate the difficulties relating to grain size (low cohesion) and shrinkage after drying and firing. We can observe in Figure 3a that the points representing fluvial sediment are found between the recommended zone A and the limit zone B, but on the left, indicating a lack of cohesion but a moderate shrinkage. Gippini [23] used the Casagrande chart to define the optimum (zone C) and limit (zone D) extrudability zones for ceramic pastes. In the chart in Figure 3b, it can be seen clearly that the points representative of the sediment investigated are at the limit (zone D), or even outside the extrudability zone, showing average plasticity. These points are found on the boundary (A line) between clays and silts. If we refer to Table 1, we can see that the amount of clay remains low compared with the high percentages of fine sands, which justifies the lack of cohesion and average plasticity. The plasticity of fluvial sediments is affected by the presence of organic matter and some pollutants, the ratio of clay/sand that causes difficulties in the molding (formation of lumps, laminations and cracking), and the drying process (cracks and shrinkage). This extrudability chart can be extended to cover the molding of unfired bricks. A simplified zone (in blue, Figure 3c) was added for compressed earth blocks (CEB), rammed earth blocks (REB) and adobe, according to results reported by Delgado and Guerrero [24]. This zone lies between the A line of Casagrande and its parallel passing through the origin O. The points representing the sediment are found at the border of the blue zone, but they may be suitable for the implementation of unfired bricks, i.e., sediment-based bricks, in this study. Other parameters remain to be fixed, such as the water content of the water–sediment mixture, depending on the brick production process (adobe, CEB or REB).
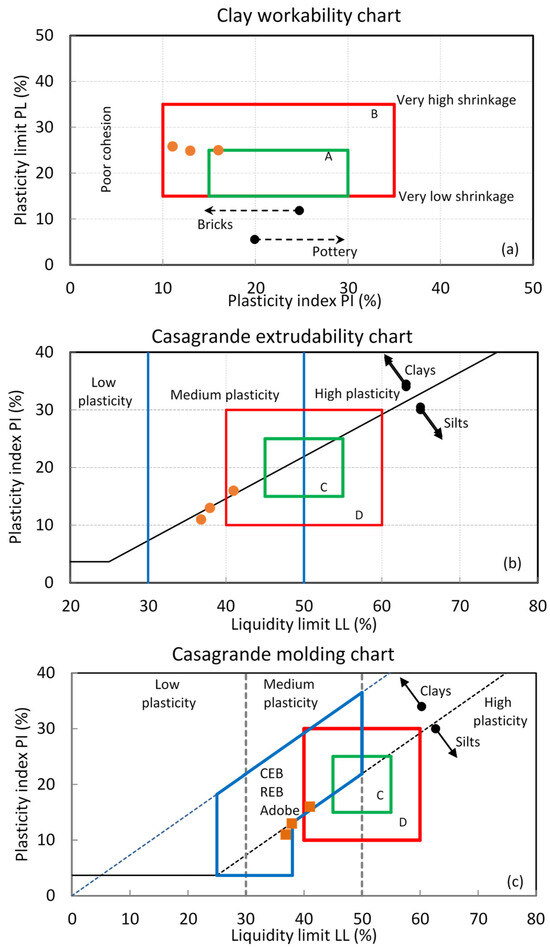
Figure 3.
Position of 3 samples of the river sediments in (a) chart of workability with optimal zone A and possible zone B; (b) chart of extrudability with optimal zone C and possible zone D; and (c) chart of molding.
Whatever the method used to produce unfired bricks, one of the objectives is to obtain the maximum density, i.e., the minimum of voids within the material. A chart proposed by Houben and Grillaud [25], and adopted by other authors [24], was established as a function of the dry density and water content of the molding mix, as shown in Figure 4. It shows the recommended zones for the optimum values obtained from the Proctor test. The widest zone is for the manufacturing of adobe, where the water content of the mold varies from 5% to 40%. We can also see that the maximum densities are obtained for CEB and REB bricks. The optimum moisture content obtained from the Proctor test is often proposed for the molding of unfired bricks. The representative points of the fluvial sediment are at the limit of the zone recommended for adobe; see Figure 4.
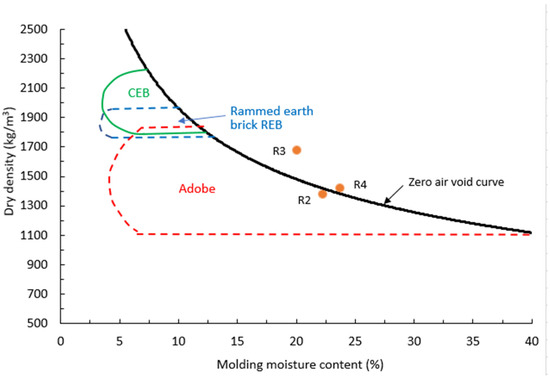
Figure 4.
Position of 3 samples of the fluvial sediments in the compactability chart for different earthen brick types.
2.1.2. Flax Fiber
The flax fibers used in the reinforcement of sediment-based bricks are obtained from spinning waste, in the form of scutching tow. The tow obtained at the end of the flax fiber extraction process is centimetric (tow as shown in Figure 5a). The tow has a low textile value and represents only about 10% of the spinning waste. Some of the fibers are used in the manufacturing of building materials due to their tensile strength, lightweight nature and cost-effectiveness. They are incorporated as short fibers into water–sediment mixtures for the implementation of unfired bricks as a mechanical flexural reinforcement.
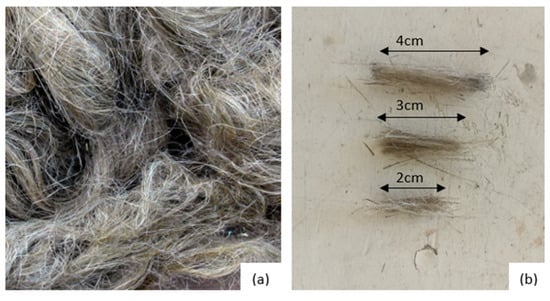
Figure 5.
Waste flax fibers: (a) bulk fibers; (b) short fibers used in this study.
The fibers were therefore cut to length manually for lengths of 2 cm, 3 cm and 4 cm, as shown in Figure 5b. In this study, different fiber rates were used, ranging from 0.1% to 0.5% in increments of 0.1%. Density varies from 1.2 to 1.4 g/cm3 depending mainly on the type and porosity of the plant [26].
2.2. Methods
2.2.1. Proctor Test Miniature
The optimum compaction parameters were obtained using the miniature Proctor test. This laboratory equipment enables these parameters to be quickly achieved from a small volume of sediment [18,27]. The compaction energy applied was the same as for the normal Proctor test, i.e., 600 kN·m/m3. Two examples of graphs for the Rouen fluvial sediment investigated are shown in Figure 6.
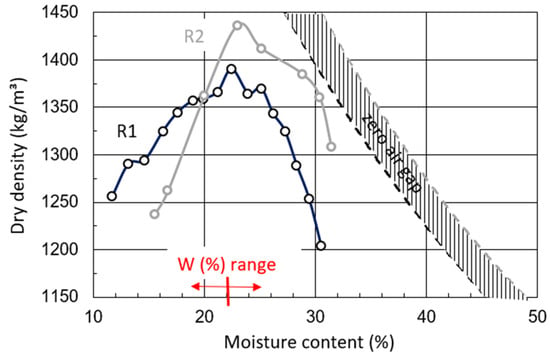
Figure 6.
Proctor graphs for 2 fluvial sediment samples, R1 and R2.
The graphs in Figure 6 show some differences. These can be explained firstly by the natural variability of a sediment, but also by the differences observed in particle size during preparation of the material (Figure 2) and by the organic matter content. The higher the organic matter content, the more the specific weight of the solid particles decreases and the shape of the Proctor curves changes, causing the maximum dry density to fall [18].
However, the maximum moisture content (MMC) does not vary too much, at around 22%. As reported by Murmu and Patel [1], most researchers recommend and retain the optimum moisture content from the normal Proctor compaction test; as the water content of water–earth mixtures for molding unfired bricks, we have chosen this MMC value of 22% ± 3% in our study. Therefore, three values of water content, namely 19%, 22% and 25%, were used to manufacture sediment-based bricks. This variation of ±3% takes into account the variability of the sediment, but also the incorporation of short flax fibers and the water absorbed by the fibers.
2.2.2. Mix Preparation
To prepare sediment-based bricks, the sediment has to be dried to determine initial moisture content. The sediment is first spread out in small steel trays to a thickness of around 2 cm, making it easier to dry. The trays are then placed in an oven set to 45 °C. This temperature ensures that the organic matter is not overly degraded. The dry sediment can then be used to make unfired brick specimens, and it is easier to adjust the desired water content. As it dries, the sediment becomes agglomerated, forming compact lumps. Lumps are crushed with hammer to obtain a texture close to its original grain size; see above, Section 2.1.1. The product obtained is then sieved to 2 mm to avoid incorporating excessively large grains in the test samples (size effect). The sieved sediment is then weighed in order to introduce the required quantity of water according to the desired water content.
Initially, control specimens were made with different water contents (19%, 22% and 23%) to understand the influence of moisture content variation on the mechanical behavior of the specimens. For each water content, 3 prismatic specimens measuring 4 cm × 4 cm × 16 cm were made. Once the water and sediment were weighed, they were mixed by hand (kneading) or with a mixer, taking care to make the resulting paste as homogeneous as possible. The paste was then placed in the molds, which were greased to facilitate the removal of the brick specimens from the mold. Compaction was performed according to the procedure described in the following section. At the end of compaction, the upper surface of the test piece was flattened using a flat spatula to make the specimen conform to the dimensions of 4 × 4 × 16 cm3. The mold was carefully removed, taking care to press evenly on the surface of the brick so as not to break it. The brick was then weighed and placed on a grid to dry.
For the 4 × 4 × 16 cm3 specimens incorporating flax fibers, the choice was made to mix wet sediment with short fibers of lengths of 2 cm, 3 cm and then 4 cm (Figure 5, Section 2.1.2). For each of these lengths, five fiber contents ranging from 0.1% to 0.5% were selected, the percentages being calculated in relation to the weight of the sediment. The preparation of the wet sediment is carried out in the same way as for the control specimens or specimens without fibers, to which the short fibers are added before the addition of water. Care must be taken to ensure that the fibers are well distributed throughout the mixture. The compaction protocol is the same as for specimens without fibers. Levelling must be slower to avoid fibers tearing off pieces of sediment, which could affect the dimensions of the brick sample. The specimens are then removed from the molds and left to dry in the open air.
2.2.3. Brick Sample Compaction
To manufacture prismatic specimens, steel molds designed for mortars (Figure 7b,c) are used to produce small bricks measuring 4 × 4 × 16 cm3, giving a volume of 256 cm3. Compaction is achieved using a miniature compaction device with a mass of 1.043 kg that falls freely at a height h (Figure 7a) onto a steel support. For a given height h, the device can deliver an energy equivalent to the normal Proctor test.
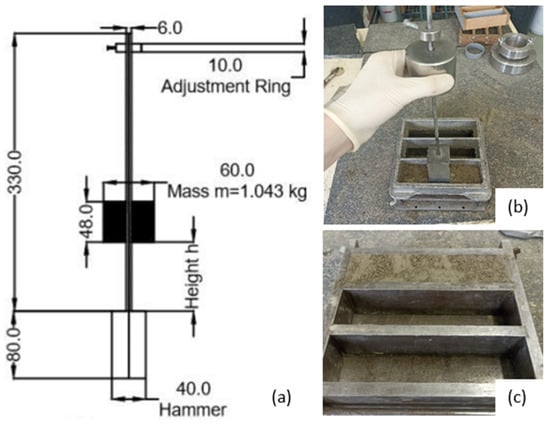
Figure 7.
Prismatic sample compactor: (a) Principle; (b) Layer during compaction with the compactor; (c); Levelled sediment-based brick sample in the mold [28].
Several blows are applied along the length of the sample according to a defined plan comprising 7 positions and repeated 6 times per layer (i.e., a total of 42 blows per layer), giving a total energy of approximately 600 kN·m/m3. The sample is made up of two layers and each layer is compacted with 42 strokes. A wooden plate the size of the mold (4 cm × 16 cm), on which the plan for applying the blows is marked, is positioned on the layer of sediment to be compacted. Before pouring in the second layer, the surface of the previous layer is scratched so that the two layers are bonded together to form a homogeneous sample. The mold is raised so that the water–sediment–fiber mixture can be added without spilling over the sides. Once the two layers have been compacted, the brick is carefully levelled to the height of the mold so as not to tear off any pieces of sediment and to ensure that it is as smooth as possible. The brick can then be removed from the mold and placed on a rack to air dry, as shown in Figure 8a.

Figure 8.
Sediment-based bricks: (a) during air drying at room temperature. Dark-colored bricks are just removed from the mold after manufacturing; the more they become dry, the more they are grey; (b) example of sample labelling: brick with 0.4% of fibers 2 cm long, sample B.
2.2.4. Experimental Program
This study concerns the drying of sediment-based unfired bricks. These bricks are prepared by dynamic compaction. Their dimensions are 4 cm × 4 cm × 16 cm and they are manufactured in sets of 3 bricks.
The unfired bricks are produced without fibers (control samples) and with the addition of short flax-waste fibers (tow). The main factors investigated were as follows: (a) the water content of the water–sediment mixtures, W, for the molding of the control green bricks; 3 contents were considered; (b) the length of the fibers, LF; 3 lengths were proposed, 2 cm, 3 cm and 4 cm; and (c) the fiber content, FC; 5 values were retained, namely 0.1 wt%; 0.2 wt%, 0.3 wt%, 0.4 wt% and 0.5 wt%, these percentages being expressed on the basis of the weight of the sediments. For fiber-reinforced unfired bricks, the water content for molding is a constant 22%. Table 2 summarizes all the factors studied, together with the unfired brick references. After demolding and a few days of drying, all the test specimens were marked with a felt-tip pen when their surface was sufficiently dry, as shown in Figure 8b. The ends of the specimens were also labelled to distinguish them once the 4 cm cubes had been cut after the bending test.

Table 2.
Investigated parameters and unfired brick references.
The references adopted in this article for each brick are as follows:
- -
- Control specimens, without fibers, are simply marked according to the water content (19, 22 and 25) followed by a dash and a letter for the series (A, B, C).
- -
- Specimens containing fibers are labelled according to the length, LF, of the fibers (LF = 2 cm, 3 cm or 4 cm), the fiber content, FC, (from 0.1% to 0.5%) and a letter for the batch (A, B or C). For example, a specimen containing 0.4% 2 cm fibers, being the second in a set of 3, will be referenced: 2-0.4B. Table 2 gives all the factors investigated, together with the unfired brick references.
3. Results
3.1. Analysis and Monitoring of the Drying Process of Sediment-Based Bricks
Once removed from the mold, the unfired brick samples are weighed to determine their initial wet weight. Throughout the air-drying process (Figure 8a), their weight is checked daily to observe how the drying process evolves. It should be noted that the unfired brick samples are rotated a quarter turn every two days in order to homogenize the drying process. The drying curves obtained are normalized to facilitate comparison, both in terms of weight and as a function of time. The size of the unfired brick samples is also measured to determine whether drying affects their dimensions, and to quantify dimensional shrinkage. Visual monitoring is also carried out to observe the formation of cracks and, if necessary, make up the damaged samples again. The unfired brick sample is considered dry once its weight has stabilized and becomes constant. It is then possible to determine the water weight and water content of the mixture and compare the latter with the targeted water content. An analysis of the evolution of the water content is conducted in this study in the following sections. It should be remembered that few results are available in the literature for sediment-based bricks [12,13,14,15,29,30].
3.2. Air Drying of Sediment-Based Bricks
3.2.1. Sediment-Based Bricks with No Fibers
The monitoring of the drying of sediment-based bricks allows us to determine the duration of air drying, an essential parameter for the manufacturing of bricks at an industrial scale. Measurements began after the bricks had been de-molded, i.e., 1.5 h or 0.0625 days after de-molding. This parameter can be deduced from the weight–time graphs on a decimal scale (horizontal asymptote, Figure 9a) or from the intersection of two lines on a logarithmic scale (Figure 9b). For unfired bricks with no fiber, three moisture contents of 19%, 22% and 25% were selected, with 22% being considered the optimum from the Proctor test. Three samples, A, B and C, are manufactured for each water content. Figure 9a shows that the drying time increases as the water content increases. But the initial phase is common whatever the water content; see the initial tangent in the same figure giving a normalized weight loss of 0.025/day. The different phases of drying can be better observed in Figure 9b on a semi-logarithmic scale, i.e., initiation of drying; drying and end of drying. The drying phase concerns the linear part where the negative slope increases as the water content increases but is coupled with a rotation. The minimum weight of the bricks is obtained after an average period of 15 days and 8 h plus or minus 1 day and 8 h for a theoretical average water content of 22% ± 3%. Table 3 shows the water content determined at the end of the drying period. In fact, the experimental average moisture content is around 20.6% ± 3.5%. This difference is linked to the relative humidity of the test room on the one hand and to the water remaining in the core of the specimen on the other. Moreover, beyond the minimum mass observed, oscillations in the normalized mass can be observed in Figure 9a or Figure 9b.
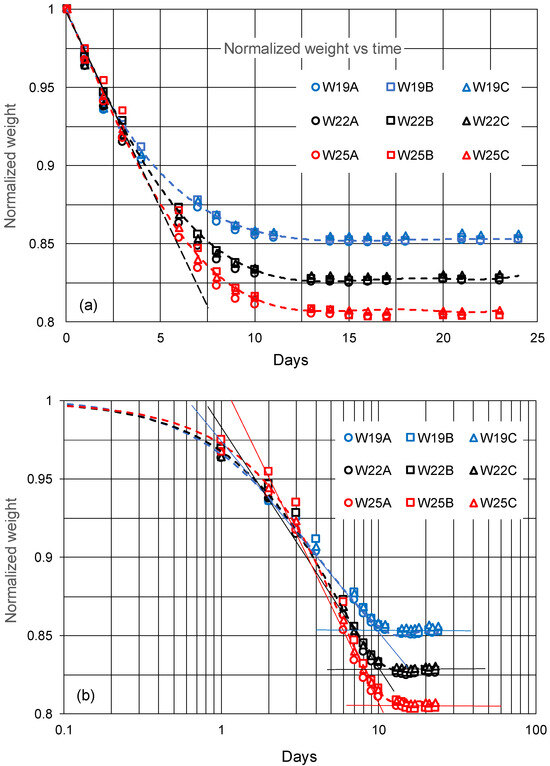
Figure 9.
Normalized weight of sediment-based bricks with no fibers during air drying: (a) decimal time scale, (b) logarithmic time scale.

Table 3.
Targeted or desired moisture content.
3.2.2. Sediment-Based Bricks with Random 2 cm Long Fibers
Fiber-reinforced sediment-based bricks are made with short fibers ranging from 2 to 4 cm. The dosage of fibers is between 0.1% and 0.5%. This dosage is calculated in relation to the mass of sediment. For a fiber dosage, whatever the length chosen, the mass of the fibers remains constant. Only the number of fibers increases for 2 cm fibers compared with 4 cm fibers.
The curves of normalized weight versus time for the 2 cm fibers are similar to those observed for the non-fibered bricks in Figure 9a. The addition of fibers to the bricks tends to reduce the drying time, as shown in Figure 10, which is more significant for low fiber dosages. This reduction in time can be seen between the two average curves plotted in dotted red (bricks without fiber) and blue lines (bricks with 2 cm fibers).
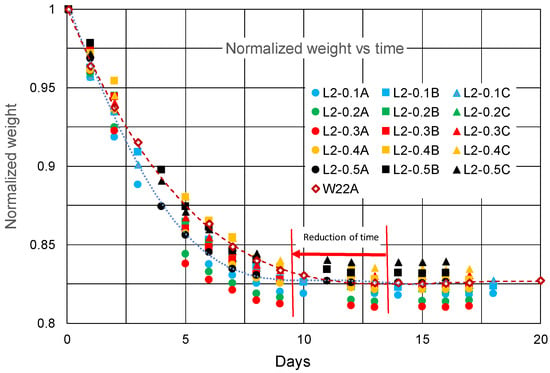
Figure 10.
Normalized weight of sediment-based bricks with 2 cm fibers during air drying at different fiber ratios.
3.2.3. Sediment-Based Bricks with Random 3 cm Long Fibers
If we increase the length of the fibers to 3 cm, the drying curves maintain a similar trend while reducing the drying time of the bricks, in approximately the same way as with 2 cm fibers; Figure 11. Remember that the mass of the fibers is kept constant whatever the length of the fibers.
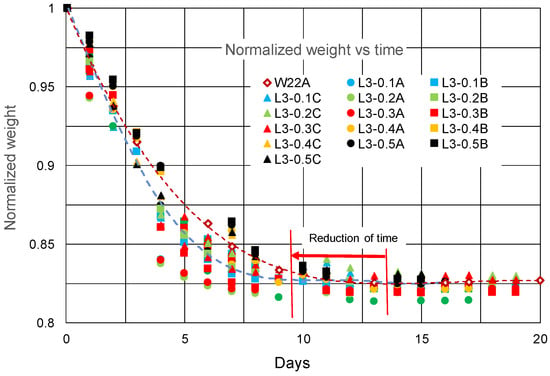
Figure 11.
Normalized weight of sediment-based bricks with 3 cm fibers during air drying at different fiber ratios.
3.2.4. Sediment-Based Bricks with Random 4 cm Long Fibers
Figure 12 shows only one drying curve for the 4 cm fibers at a dosage of 0.1%. It can be seen that this curve is close to that of the brick without fiber and that the reduction in drying time is less evident.
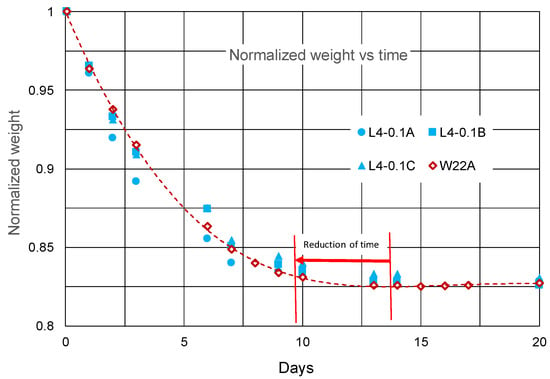
Figure 12.
Normalized weight of sediment-based bricks with 4 cm fibers during air drying at 0.1% fiber ratio.
4. Discussion
The measurements of the individual mass of each brick noted during air drying are used successively to determine the mass of water remaining in the brick and the initial mass of water, the water content in the brick and the initial water content, and to estimate the dry density of each sample at the end of drying, as well as the time required for a brick to dry. Some of these values were initially targeted, such as the water content. A comparison between the targeted values and those obtained shows the differences due to the effect of the operator in producing the bricks, the homogenization of the mixes and evaporation during processing. Another comparison was conducted for the dry densities obtained in relation to the values of the Proctor optimum achieved on the sediment alone and the optimum water content of 22% retained. Dimensional measurements of the dry bricks were used to give an order of importance for the shrinkage of the bricks produced in this way and to observe whether any apparent micro-cracks appeared. The effects of adding fibers at different dosages and lengths were analyzed in terms of drying time and the recommendation to mix at the optimum Proctor water content.
4.1. Effect of Initial Water Content on the Air Drying of Sediment-Based Bricks with No Fiber
The weight of water contained within each brick varies with time since production. The weight decreases continuously, as shown in Figure 13 for a sediment-based brick without fibers, manufactured and compacted to a water content of 19%. For the three samples, A, B, and C, the evolution is the same and can be fitted easily, here by a polynomial of degree 2.
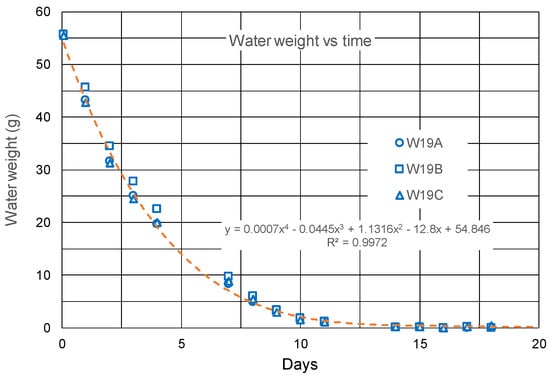
Figure 13.
Evolution of water weight of sediment-based bricks with no fibers during air drying: case of sediment-based bricks with a targeted water content of 19%.
The water content observed for each brick manufactured at different water contents (22% ± 3%, 22% being equal to the Proctor optimum water content), is also continuously decreasing, as shown in Figure 14. The air-drying kinetics are identical, revealing that the more water the brick contains, the longer the drying time.
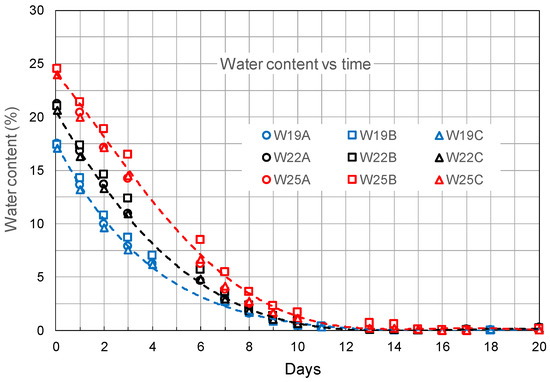
Figure 14.
Evolution of water content of sediment-based bricks with no fibers during air drying: case of 3 different initial water contents for bricks.
4.2. Effect of Fiber Content and Length of Fibers on the Water Content During Air Drying of Randomly Fiber-Reinforced Samples
The addition of flax fiber showed a reduction in drying time, as shown in Figure 9, Figure 10 and Figure 11, based on normalized weight–time curves. These can be interpreted in terms of changes in water content–time, for which this reduction in time should also be observed. For 2 cm flax fibers, Figure 15 shows a decrease in water content with a decrease in time compared with sediment-based bricks without fibers. The addition of even short fibers, i.e., 2 cm, tends to reduce the drying time. In this study, the reduction is around 2 days.
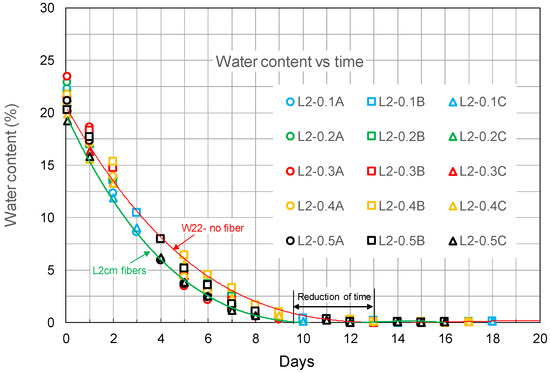
Figure 15.
Evolution of water content of sediment-based bricks with 2 cm fibers during air drying at different fiber ratios.
If 3 cm fibers are added for the same fiber ratios, Figure 16 shows that the reduction in drying time is confirmed. The reduction in drying time is more or less the same, given that the weight of the added fibers remains the same.
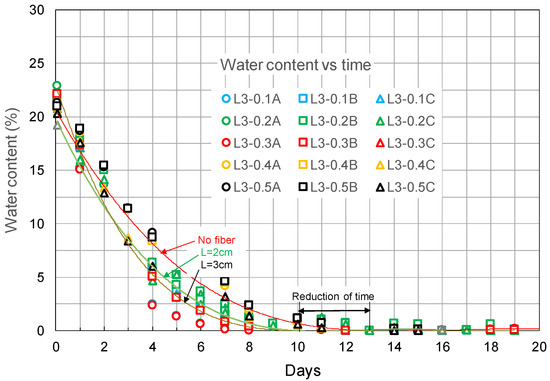
Figure 16.
Evolution of water content of sediment-based bricks with 3 cm fibers during air drying at different fiber ratios.
As in Figure 11, the reduction in water content for sediment-based bricks with 0.1% of 4 cm fiber added is similar to that for 2 cm and 3 cm fiber additions, and the drying time is reduced by the same amount; see Figure 17. This length of fiber corresponds to the width or height of the mold.
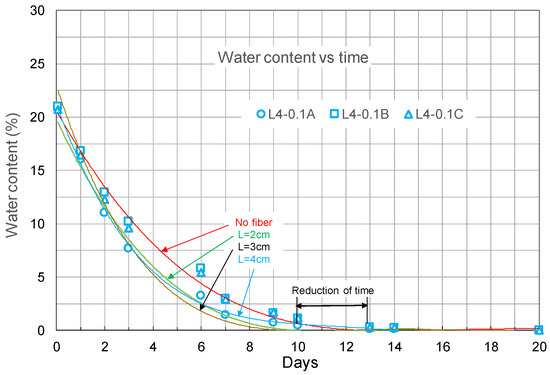
Figure 17.
Evolution of water content of sediment-based bricks with 4 cm fibers during air drying at 0.1% fiber ratio.
4.3. Effect of Fiber Content and Length of Fibers on the Linear Dimensions of Sediment-Based Bricks
The dimensions were measured once the sediment-based bricks had dried before the mechanical behavior tests. These are linear dimensions and, as shown in Figure 18, shrinkage dimensions. The figure shows the average variations measured for width or height for all the sediment-based bricks produced. The initial dimensions of the bricks are 40 mm × 40 mm × 160 mm, those of the mold used. Figure 18 shows that:
- -
- The shrinkage increases with the length of the added fibers;
- -
- The shrinkage increases with the fiber content.
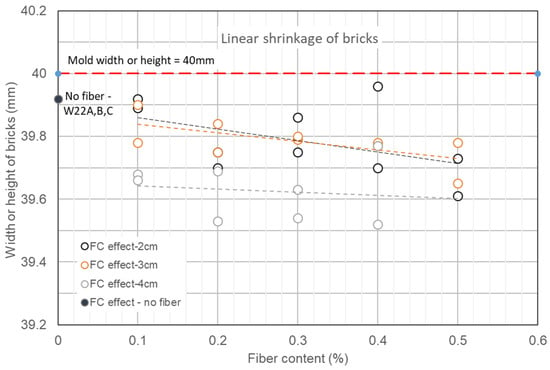
Figure 18.
Measurements of average shrinkage for sediment-based bricks versus fiber contents (FC).
The average relative linear shrinkage observed was 0.25% for the non-fiber-reinforced sediment bricks, whereas it reached a maximum value of around 1.25% for the 4 cm fiber-reinforced sediment bricks. These shrinkages remain acceptable, and no damage was observed.
4.4. Effect of Fiber Content and Length of Fibers on the Density Evolution of Sediment-Based Bricks
If we consider all the sediment-based bricks produced, i.e., 54 bricks, it is interesting to study how the densities evolve. Firstly, what is the bulk density (BD) of the bricks when they are demolded after dynamic compaction for an energy corresponding to the normal Proctor test? Then, what is the dry density (DD) obtained after the drying period?
The water contents are the theoretical or estimated values calculated after drying the bricks, and they differ from the target values. One factor is considered first: the fiber content (FC). Figure 19 shows the changes in density for all the bricks. It can be seen that the bulk and dry densities increase very slightly with the fiber content.
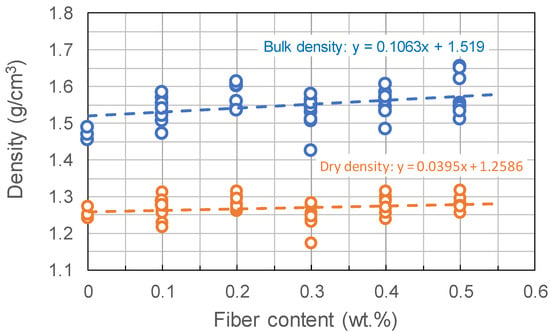
Figure 19.
Evolution of sediment-based brick densities versus fiber contents (FC).
The other factor is the length of the fibers (L). This factor will play an important role in the mechanical behavior of the sediment-based bricks. For the three lengths considered, 2 cm, 3 cm and 4 cm, the variation in density is shown in Figure 20. It can be seen that the apparent density tends to increase but that the dry density for fiber-reinforced bricks remains constant at a value very slightly higher than the dry density of bricks without fibers.
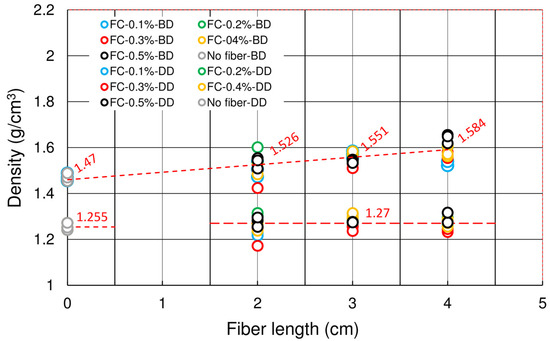
Figure 20.
Evolution of sediment-based brick densities versus fiber lengths (L). BD = bulk density; DD = dry density; indicated values are averaged density values.
4.5. Effect of Theoretical Water Content on the Density Evolution of Sediment-Based Bricks
In this study, the water content of the sediment-fiber or no-fiber mixtures was proposed at the optimum water content value obtained in the Proctor test, i.e., 22%. Theoretical or estimated water content values are deduced from monitoring the drying of bricks considered to be dry. Variations were observed, due to the preparation of the mixes and their use during the manufacture of the bricks and the time allowed between the various laboratory manipulations.
The densities observed as a function of the estimated water contents are shown in Figure 21. In this figure, we can see that the bulk densities increase as the water content increases. This is expected, as the water mass tends to increase. And when this mass of water disappears, we can see that the dry densities tend to remain constant, at around 1.27 g/cm3. But these dry densities are well below the Proctor optimum values, which are around 1.40 g/cm3.
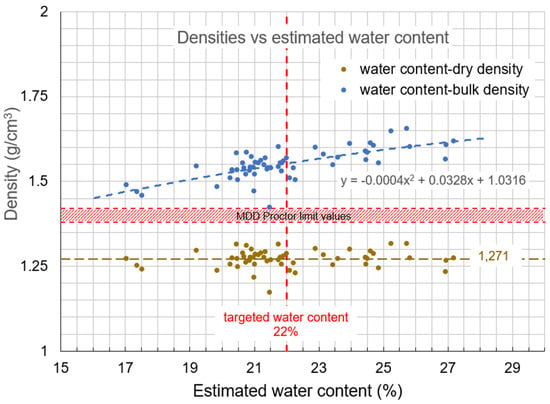
Figure 21.
Evolution of densities of sediment-based bricks with estimated water content.
Laboratory compaction produces an average dry density of 1.27 g/cm3, equivalent to the Proctor optimum minus 10%. However, this value is obtained for a variation in the chosen water content, 22%, of up to ±3%.
5. Conclusions
This investigation was performed with the aim of recovering river sediments from dredging and flax waste in sediment-based bricks for agricultural habitats. The main results obtained or observed according to the defined objectives are as follows:
- -
- In line with the practice of manufacturing unfired bricks, the sediment was characterized, based mainly on a granulometric analysis and the determination of plasticity limits (Atterberg limits). This characterization showed that this fluvial sediment, depending on the samples collected, met the main criteria, while sometimes being at the limit of certain charts. A lack of clay or even plasticity was noted.
- -
- In order to densify the sediment-based brick, a water content needs to be defined for the water–sediment–fiber mixes. This water content was deduced from the normal miniature Proctor test and corresponds to the optimum water content. It was possible to observe a certain variation in the optimum values on the so-called Proctor curves. This can be explained by the intrinsic variability of sediments in general and the small volume of sediments compacted. However, this miniature Proctor test requires a small mass of sediment, and therefore small volumes of sediment to be sampled, and the test is rapid. The value adopted was 22% for this sediment. Sediment-based bricks without fibers were manufactured with water contents of 19%, 22% and 25% for a preliminary study of air drying. The drying time was approximately 13 to 14 days for a moisture content of 22%.
- -
- The sediment-based bricks were compacted using equipment adapted to the 4 cm × 4 cm × 16 cm molds used for mortars, at an energy equivalent to that of the normal Proctor test (600 kN·m/m3). All the sediment-based bricks, whether fiber-reinforced or not, had approximately the same dry density of 1.27 g/cm3, corresponding roughly to the maximum density of the Proctor test minus 10%.
- -
- The addition of waste flax fiber reduces the drying time for dosages ranging from 0.1 wt% to 0.5 wt%. This reduction lasts 2 to 3 days and varies according to fiber length, but it stabilizes at around 0.4 wt%.
- -
- Shrinkage was observed in brick specimens. It remained low, at around 0.25% for a sediment-based brick without fibers, but tended to increase with fiber length reaching up to 1.25% for 4 cm fibers. No damage was observed.
- -
- The effect of the fiber content does not influence the final dry density of the sediment-based bricks, but there is a slight influence of the fiber length on the dry density.
- -
- The effect of the initial water content for all bricks produced does not affect the final dry density. This is important when defining the initial water content of sediment–water–fiber mixes. The recommended water content can be defined from the optimum water content obtained from the Proctor test, but a deviation of ±3 to 4% is allowable. Water content below the optimum value may be recommended to save water.
The addition of waste flax fibers improved the mechanical behavior of sediment-based bricks. This improvement was proposed before correcting the granulometric nature of the sediment (addition of clay) or considering stabilization using industrial by-products (fly ash, slag, biomass ash). This mechanical aspect is the subject of part II of a forthcoming article.
Author Contributions
Conceptualization, D.L. and A.S.; methodology, D.L. and A.S.; validation, D.L. and A.S.; formal analysis, D.L.; investigation, D.L., A.S., D.N., H.Z. and T.S.; resources, D.L.; data curation, D.L. and A.S.; writing—original draft preparation, D.L. and A.S.; writing—review and editing, D.L.; supervision, D.L., N.L. and H.Z.; project administration, N.L. and H.Z.; funding acquisition, N.L. All authors have read and agreed to the published version of the manuscript.
Funding
This research was funded by the Normandy region on RIN Upecomat project during 2 years from 1 October 2023 till 30 September 2025 (onvention number: 00140326-23 E 02549).
Institutional Review Board Statement
Not applicable.
Informed Consent Statement
Not applicable.
Data Availability Statement
Data from this study are available from the corresponding author.
Acknowledgments
Authors thank Magalie Legrain for the tests useful for the fluvial sediment characterization made in the M2C (Continental and Coastal Morphodynamics) laboratory at Caen Normandie University, France.
Conflicts of Interest
The authors declare no conflicts of interest.
References
- Murmu, A.L.; Patel, A. Towards sustainable bricks production: An overview. Constr. Build. Mater. 2018, 165, 112–125. [Google Scholar] [CrossRef]
- Muheise-Araalia, D.; Pavia, S. Properties of unfired, illitic-clay bricks for sustainable construction. Constr. Build. Mater. 2021, 268, 121118. [Google Scholar] [CrossRef]
- Voišnienė, V.; Kizinievič, O.; Albrektienė-Plačakė, R.; Vasiliauskienė, D.; Urbonavičius, J.; Vilkauskaitė, R. The Effect of Organic Lake Sediments (Sapropel) on the Properties and Biological Resistance of Unfired Clay Bricks. Sustainability 2024, 16, 2327. [Google Scholar] [CrossRef]
- Jannat, N.; Hussien, A.; Abdullah, B.; Cotgrave, A. Application of agro and non-agro waste materials for unfired earth blocks construction: A review. Constr. Build. Mater. 2020, 254, 119346. [Google Scholar] [CrossRef]
- Danso, H.; Martinson, D.B.; Ali, M.; Williams, J.B. Physical, mechanical and durability properties of soil building blocks reinforced with natural fibres. Constr. Build. Mater. 2015, 101 Pt 1, 797–809. [Google Scholar] [CrossRef]
- Sharma, V.; Vinayak, H.K.; Marwaha, B.M. Enhancing compressive strength of soil using natural fibers. Constr. Build. Mater. 2015, 93, 943–949. [Google Scholar] [CrossRef]
- Ghavami, K.; Romildo Dias, T.F.; Barbosa, N.P. Behaviour of composite soil reinforced with natural fibres. Cem. Concr. Compos. 1999, 21, 39–48. [Google Scholar] [CrossRef]
- Hussain, M. Valorization of Sediments in Bio-Based Materials: Application to Fluvial Sediments with Incorporation of Natural Fibers. Doctoral Thesis, Rouen University, Rouen, France, 2022; 267p. Available online: https://theses.hal.science/tel-04521617/document (accessed on 4 January 2025).
- Djeran-Maigre, I.; Morsel, A.; Hussain, M.; Levacher, D.; Razakamanantsoa, A.R.; Delfosse, E. Behaviour of masonry lateral loaded walls made with sediment-based bricks from the Usumacinta river (Mexico). Clean. Eng. Technol. 2022, 11, 100587. [Google Scholar] [CrossRef]
- Şükrü, Y.; Çavdar, Ö.; Çavdar, A. The effects of the fiber contents on the mechanic properties of the adobes. Constr. Build. Mater. 2008, 22, 222–227. [Google Scholar] [CrossRef]
- Călătan, G.C.; Hegyi, A.; Dico, C.; Mircea, C.G.R. Determining the Optimum Addition of Vegetable Materials in Adobe Bricks. Procedia Technol. 2016, 22, 259–265. [Google Scholar] [CrossRef]
- Turco, C.; Paula Jr, A.C.; Teixeira, E.R.; Mateus, R. Optimisation of compressed earth blocks (CEBs) using natural origin materials: A systematic literature review. Constr. Build. Mater. 2021, 309, 125140. [Google Scholar] [CrossRef]
- Kiki, G.; Nshimiyimana, P.; Kouchadé, C.; Messan, A.; Houngan, A.; André, P. Physico–mechanical and durability performances of compressed earth blocks incorporating quackgrass straw: An alternative to fired clay. Constr. Build. Mater. 2023, 403, 133064. [Google Scholar] [CrossRef]
- Ashour, T.; Korjenic, A.; Abdelfattah, A.; Sesto, E.; Wu, W. Shrinkage Behavior of Stabilized Earth Bricks Reinforced with Wheat and Barley Straw. Sustainability 2023, 15, 16254. [Google Scholar] [CrossRef]
- Bailly, G.C.; El Mendili, Y.; Konin, A.; Khoury, E. Advancing earth-based construction: A comprehensive review of stabilization and reinforcement techniques for adobe and compressed earth blocks. Engineering 2024, 5, 750–783. [Google Scholar] [CrossRef]
- Franklin, A.G.; Orozco, L.F.; Semrau, R. Compaction and strength of slightly organic soils. J. Soil Mech. Found. Div. 1973, 99, 541–557. [Google Scholar] [CrossRef]
- Al-Kifae, A.; Hamad, M.A. Inspecting the effects of organic content on compaction and consolidation characteristics of organic soil models. Am. Sci. Res. J. Eng. Technol. Sci. (ASRJETS). 2017. Available online: https://www.researchgate.net/publication/344955672_Inspecting_the_Effects_of_Organic_Content_on_Compaction_and_Consolidation_Characteristics_of_Organic_Soil_Models (accessed on 10 September 2024).
- Levacher, D.; Oqabi, S. A note on raw dredged sediments compaction for a recycling as backfill material. Discov. Eng. 2024; in progress. [Google Scholar]
- MOPT. Bases Para el Diseño y Construcción con Tapial; Centro de Publicaciones, SecretaríaGeneral Técnica, Ministerio de Obras Públicas y Transportes: Madrid, Spain, 1992; 79p, ISBN 9788474338393.
- AFNOR XP P13-901; Compressed Earth Blocks for Walls and Partitions: Definitions—Specifications—Test Methods—Delivery Acceptance Conditions. Association Francaise de Normalisation AFNOR: Saint-Denis La Plaine Cedex, France, 2022; 35p. Available online: https://www.boutique.afnor.org/Store/Preview/DisplayExtract?ProductID=321764&VersionID=6 (accessed on 30 October 2024).
- Boubeker, S.; Houben, H. Compressed Earth Blocks: Standards, Guide Séries Technologies, No. 11; RA-Terre-EAG: Brussels, Belgium, 1998; 142p. [Google Scholar]
- Bain, J.A.; Highley, D.E. Regional appraisal of clay resources. A challenge to the clay mineralogist. Dev. Sedimentol. 1979, 27, 437–446. [Google Scholar] [CrossRef]
- Gippini, E. Contribution à l’étude des propriétés de moulage des argiles et des mélanges optimaux de matières premières. L’industrie Céramique 1969, 619, 423–435. [Google Scholar]
- Delgado, M.C.J.; Guerrero, I.C. The selection of soils for unstabilised earth building: A normative review. Constr. Build. Mater. 2007, 21, 237–251. [Google Scholar] [CrossRef]
- Houben, H.; Grillaud, H. Earth Construction: A Comprehensive Guide, 1st ed.; Intermediate Technology Publications: London, UK, 1994; Volume 1, 362p. [Google Scholar]
- Charlet, K. Contribution à L’étude de Composites Unidirectionnels Renforcés par des Fibres de Lin: Relation Entre la Microstructure de la Fibre et Ses Propriétés Mécaniques. Ph.D. Thesis, Université de Caen Basse-Normandie, Caen, France, 6 May 2008. [Google Scholar]
- Ferber, V.; Auriol, J.-C.; Cui, Y.-J.; Magnan, J.-P. On the swelling potential of compacted high plasticity clays. Eng. Geol. 2009, 104, 200–210. [Google Scholar] [CrossRef]
- Hussain, M.; Levacher, D.; Saouti, L.; Leblanc, N.; Zmamou, H.; Djeran-Maigre, I.; Razakamanantsoa, A. Implementation on a preparation and controlled compaction procedure for waste-fiber-reinforced raw earth samples. J. Compos. Sci. 2022, 6, 3. [Google Scholar] [CrossRef]
- Eid, J.; Taibi, S.; Fleureau, J.-M.; Hattab, M. Drying, cracks and shrinkage evolution of a natural silt intended for a new earth building material. Impact of reinforcement. Constr. Build. Mater. 2015, 86, 120–132. [Google Scholar] [CrossRef]
- Ngoulou, M.; Elenga, R.G.; Ahouet, L.; Bouyila, S.; Konda, S. Modeling the drying kinetics of earth bricks stabilized with cassava flour gel and amylopectin. Geomaterials 2019, 9, 40–53. [Google Scholar] [CrossRef]
Disclaimer/Publisher’s Note: The statements, opinions and data contained in all publications are solely those of the individual author(s) and contributor(s) and not of MDPI and/or the editor(s). MDPI and/or the editor(s) disclaim responsibility for any injury to people or property resulting from any ideas, methods, instructions or products referred to in the content. |
© 2025 by the authors. Licensee MDPI, Basel, Switzerland. This article is an open access article distributed under the terms and conditions of the Creative Commons Attribution (CC BY) license (https://creativecommons.org/licenses/by/4.0/).