Article

Comparison of Real-Time Methods Demonstrating the Effects of Reduced Glutathione on Olfactory Neuroblasts

Université de Lyon, UMR Ecologie Microbienne, CNRS 5557, INRA 1418, VetAgro Sup, Université Claude Bernard Lyon 1, Doua Campus, Dubois Bldg, 2nd Floor, 69622 Villeurbanne cedex, France
*
Author to whom correspondence should be addressed.
Appl. Sci. 2025, 15(2), 908; https://doi.org/10.3390/app15020908
Submission received: 28 October 2024 / Revised: 9 January 2025 / Accepted: 10 January 2025 / Published: 17 January 2025

Abstract

:
The objective of the present study was to compare recent methods for characterizing cell modifications. We studied the effect of extracellular reduced glutathione (GSH) on an olfactory neuroblast cell line (13s24). Three methods were used to monitor, in label-free, noninvasive real-time experiments, cell surface occupancy by measuring impedance (xCELLigence), cell behavior (HoloMonitor cytometry), cell ultrastructure by measuring refractive index (3D Nanolive microscopy). Reduced glutathione dose-dependently increased cell volume and motility and decreased cell adhesion. Cell sorting analyses revealed that after short-term exposure (6 h), GSH reduced F-actin polymerization and extracellular glycoproteins leading to adhesion strength loss. Results support the hypothesis that excreted GSH could modulate disulfide bound-dependent integrin conformations involved in neurogenesis and/or neuronal plasticity. This is the first evidence of a causal link between GSH and changes in cell volume and motility required for cell division, migration, and/or differentiation. Results show the importance of real-time analysis methods, without labelling, in the study of cell responses under culture conditions. The present findings highlight important criteria in the choice of methods, beyond the parameters studied, such as cell preparation time, plate filling time, number of cells studied, friendly use of the devices, and the complexity of data processing.

1. Introduction

In vitro analyses of behavioral, physiological and morphological cell responses are often a preliminary to in vivo studies. The objective of the present study was the combinatorial use of new methods to characterize cell modifications in response to a given treatment. To this purpose, we have studied the effects of cell exposure to reduced glutathione (GSH) on an olfactory neuroblast cell line (13s24).
Glutathione holds a special place among antioxidant molecules: it is the most abundant small molecular weight thiol compound of living cells [1]. Although it is a small molecule composed of only three amino acids, it cannot enter directly inside cells. It is broken down in the extracellular space by the enzyme ectoprotein γ-glutamyl transpeptidase to produce dipeptides and free amino acids that are then absorbed by cells to intracellularly resynthesize GSH [2,3]. Reduced glutathione (GSH) is a well-known direct antioxidant and a substrate of several antioxidant enzymes [4]. Glutathione participates to numerous cellular regulations: antioxidant protection, thiol–disulfide exchange of peptides and proteins, cell signaling, gene expression, detoxification of toxic compounds, etc. [5]. Studies have shown that it is excreted by cells such as liver cells [6], lymphoid cells [7], gallbladder [8], and cancer cells [9], supporting the hypothesis of local extracellular activities. Specific transport of GSH through the blood–brain barrier has been described [10]. Glutathione is abundant in the brain (in the range of millimolar) and exerts a protective effect against oxidative stress in neurons [11,12]. The endogenous production of oxidative stress is considered the main endogenous factor of aging, and dysregulation of glutathione homeostasis has been linked to loss of neurons in age-related diseases such as Parkinson’s, Alzheimer’s, and Huntington’s [13]. In a recent study, we demonstrated that both adhesion strength and cell volume are directly regulated by the extracellular GSH concentrations [14]. Both cell adhesion and reactive oxygen species (ROS) play a crucial role in neurogenesis through regulation of proliferation and differentiation [15,16]. Because GSH plays a crucial role as an antioxidant and causes marked cellular changes, cell exposure to GSH is a suitable situation for testing new technological approaches.
In the present study, experiments were carried out on a non-cancerous immortalized cell line representing sensory olfactory neuron precursors (13s24) [17]. This study of olfactory neuroblasts is of particular interest since (1) the olfactory epithelium is the only location where the brain is in direct contact with the environment and thus exposed to partial oxygen pressure and potential oxidative stress higher than other brain cells, and (2) olfactory sensory neurons are continuously renewed during live from olfactory precursors (neuroblasts) [18].
For this purpose, we performed a combinatorial study of cell physiological and morphological properties using highly sensitive methods to measure in real-time experiments, adhesion strength (xCELLigence), physical parameters (cell surface occupancy, size, and cell shape), cellular behavior such as motility (HoloMonitor) and changes in refractive index within the cells (Nanolive). The effects on size and shape were validated, after optimized time of exposure with GSH, using fluorescent markers by flow cytometry. Results show that GSH induced both a reduction in adhesion strength and an increase in cell volume. These findings reveal an unexpected role of GSH in the regulation of cell volume and adhesion strength, suggesting that each cell is able to control its own volume. Although the methods studied measure different parameters, their main interest lies in the fact that they are in real-time and do not require marking.

2. Materials and Methods

2.1. Cell Cultures

Rat 13s24 olfactory neuroblasts were grown in Dulbecco’s Modified Eagle Medium with low glucose (1 g/L) containing 10% fetal calf serum and streptomycin plus penicillin (100 units/mL; Sigma Aldrich, St Quentin-Fallavier, France) at 37 °C with 5% CO2 in a cell culture incubator, SL ShelLab (Sheldon Manufacturing, Inc., Cornelius, NC, USA). Before experiments, cells were dissociated by trypsin (0.25%, Sigma Aldrich) and cell concentration titrations were performed using a Sceptor sensor with 60 µm pipet tips (Millipore, Burlington, VT, USA). Cells were seeded at 10 000 cells/cm2 in either E-96 plates (ACEA, Agilent Technology, Santa Clara, CA, USA), 96-well plates (Corning, Thermo Fisher Scientific, Illkirch, France), or Ibidi® glass bottom dishes with inserts (Clinisciences, Nanterre, France). Cells were grown during 48 h before treatments because in previous studies, as we pointed out, using nanometric nanoparticles, that plasma membrane integrity was not fully restored 24 h after dissociation by trypsin [19]. Freshly prepared stock solutions of reduced glutathione (GSH, Sigma Aldrich) with pH adjusted at 7.4 were filtered at 0.2 μm and serial dilutions were performed in cell culture media.

2.2. Real-Time Cell Analysis of Impedance

The real-time cell analysis xCELLigence single-plate biosensor (RTCA, ACEA, Agilent) measures cell surface occupancy (i.e., by impedance measurement), expressed as cell index. Cell index depends on cell number, cell size, and cell adhesion force. Cells were grown until the cell index reached around 1 (at least 48 h), i.e., they were in a linear proliferative phase. Then, cells were exposed to fresh culture medium containing different concentrations of GSH (100 µL/well). The impedance was recorded for each well every 15 min and data were retrieved using RTCA 2.01 (ACEA). Results are represented by mean delta cell indexes (DCIs) ± SEM, (n = 6 to 8 replicates), i.e., the cell index at a given time point plus a delta value. The delta value is a constant value for each well and is the difference between the DCI value at time of treatment (t0) and the cell index at the delta time point from t0, as follows: DCItime = CItime + (DCI t0 − CIDelta time). Data were retrieved on Microsoft Excel for analyses and graphical presentation of results.

2.3. Quantitative Phase Imaging

Quantitative phase imaging experiments were performed using the HoloMonitor M4 digital holographic cytometer (Phase Holographic Imaging, PHI, Lund, Sweden). The microscope was housed in cell culture incubator Heracell (Heraeus, Thermo Fischer Scientific) at 37 °C with 5% CO2. Cells were grown during 48 h in 96-well plates and treated with reduced glutathione in 150 µL/well. HoloLids were used to insure an optimum optic signal. More than 30 morphological cell parameters were measured in real time every fifteen minutes for twenty-four hours after treatment with GSH (0 to 5 mM) using the software program HoloStudio M4 2.6.2 and retrieved on Microsoft Excel for analyses and graphical presentation of results. Volume is the optical cell volume. It is based on area and optical thickness.

2.4. Holotomographic Microscopy Time-Lapse Acquisition

Label-free images were acquired using a Nanolive 3D Cell Explorer microscope (Nanolive SA, Lausanne, Switzerland). A green light laser diode (520 nm) was split into sample and reference beams. Cells grown on IBIDI® dishes (35 mm diameter) were placed in a heated lid and heated plate (Ibidi), between a high numerical aperture air objective (60× magnification) beneath the sample and a low-power laser (0.2 mW/mm2) reflected by a mirror on a rotational arm above. The samples were illuminated with the laser beam inclined at 45° rotating 360° around the samples. Each rotation of the laser beam around the sample allows for the capture of one hundred holograms, recorded via a digital camera (CMOS) by combining the beam that had passed through the sample with the reference beam. High-resolution images (∆xy = 200 nm; ∆z = 400 nm) of each sample layer were produced using a synthetic aperture and multiple-viewpoint holographic methods. The software displays a comprehensible 96 z-stack cell image in grayscale for a depth of field of 30 µm. Images were captured using STEVE® software (Nanolive) to obtain a refractive index (RI)-based z-stack. The microscope is equipped for long-term live cell imaging: temperature, humidity, and gas composition (Ibidi). Samples were kept at 37 °C under a closed heated glass lid to prevent condensation, which was connected to a gas mixer to maintain 5% of CO2. Raw data were transferred into FIJI, an open-source platform dedicated to biological image analysis [20]. Additionally, cells were colored according to refractive index to quantitative phase imaging in order to underline differences [21].

2.5. Fluorescence Imaging and Cell Sorting by Flow Cytometry

Cell morphological changes and counts induced after GSH treatments were assessed using fluorescent markers for both cell imaging and cell sorting. Images were obtained on a Cytation 3 reader (Biotek Instrument, Agilent) at objectives ×4 or ×20. Cell sorting analyses were obtained with a Novocyte cytometer (Acea Biosciences, San Diego, CA, USA) and data were retrieved using NovoExpress Software1.2.5. Cytoskeleton modifications were analyzed by quantification of polymerized F-actin using fluorescent phalloidin incorporation. At the end of the experiment, cells were dissociated using trypsin, fixed with PBS/formalin 3% (Sigma Aldrich), and then incubated for at least 15 min with PBS, Triton 0.1%, and phalloidin–TRITC (Sigma Aldrich) 10 nM and washed in PBS before analysis. Cell count and fluorescence analyses were performed in at least 4 replicates. Effects on the extracellular matrix were analyzed using glycoprotein-interacting lectin concanavalin A from Canavalia ensiformis conjugated with either Atto488 (FITC filters, ConA Extracellular) or Alexa Fluor 594 (TRITC filters, ConA Total) at 50 μg/mL for cell sorting and 500 μg/mL for cell imaging. After treatments, 13s24 cells were fixed with 5% paraformaldehyde (PFA) (Biotium, Ozyme, Saint-Cyr-l’École, France). A first labeling step without permeabilization was performed in order to quantify extracellular glycosylated sites with ConA-Atto488 in Hank’s Balanced Salt Solution (HBBS; Gibco, Sigma Aldrich) for at least 30 min, then washed twice in HBBS before incubation with ConA AlexaFluor 594 and 0.1%Triton to quantify full glycoproteins in permeabilized cells. Cells were counterstained with Dapi 10 µg/mL for cell imaging (Sigma Aldrich). After two washes in HBSS, ConA fixation was performed using 4% PFA. Cell imaging data were obtained on the Cytation 3 platform using the ×20 objective with identical acquisition parameters (Gen5.03 software).

2.6. Statistical Analyses

The experiments were performed in 6 to 8 biological replicates for the RTCA and HoloMonitor 96-well plate and presented as mean values ± standard error of the mean (SEM). For cytometry analyses, data are presented as the result of mean values ± standard error (4 replicates) or SEM (5 to 6 replicates). Statistical analyses were obtained with StatView 4.5 software (Abacus Corporation, Baltimore, MD, USA) for Windows. The data were analyzed using one-way ANOVA followed by Fisher’s protected least significant difference [PLSD] post-hoc test. Statistical significance was defined as p-values < 0.05. In the figures, different letters indicate significant differences. Significance of correlation was established from the correlation coefficient (r) according to Pearson table, for p-values < 0.05.

3. Results

3.1. Real-Time Monitoring of Cell Impedance Reveals Dose-Dependent Effects of GSH

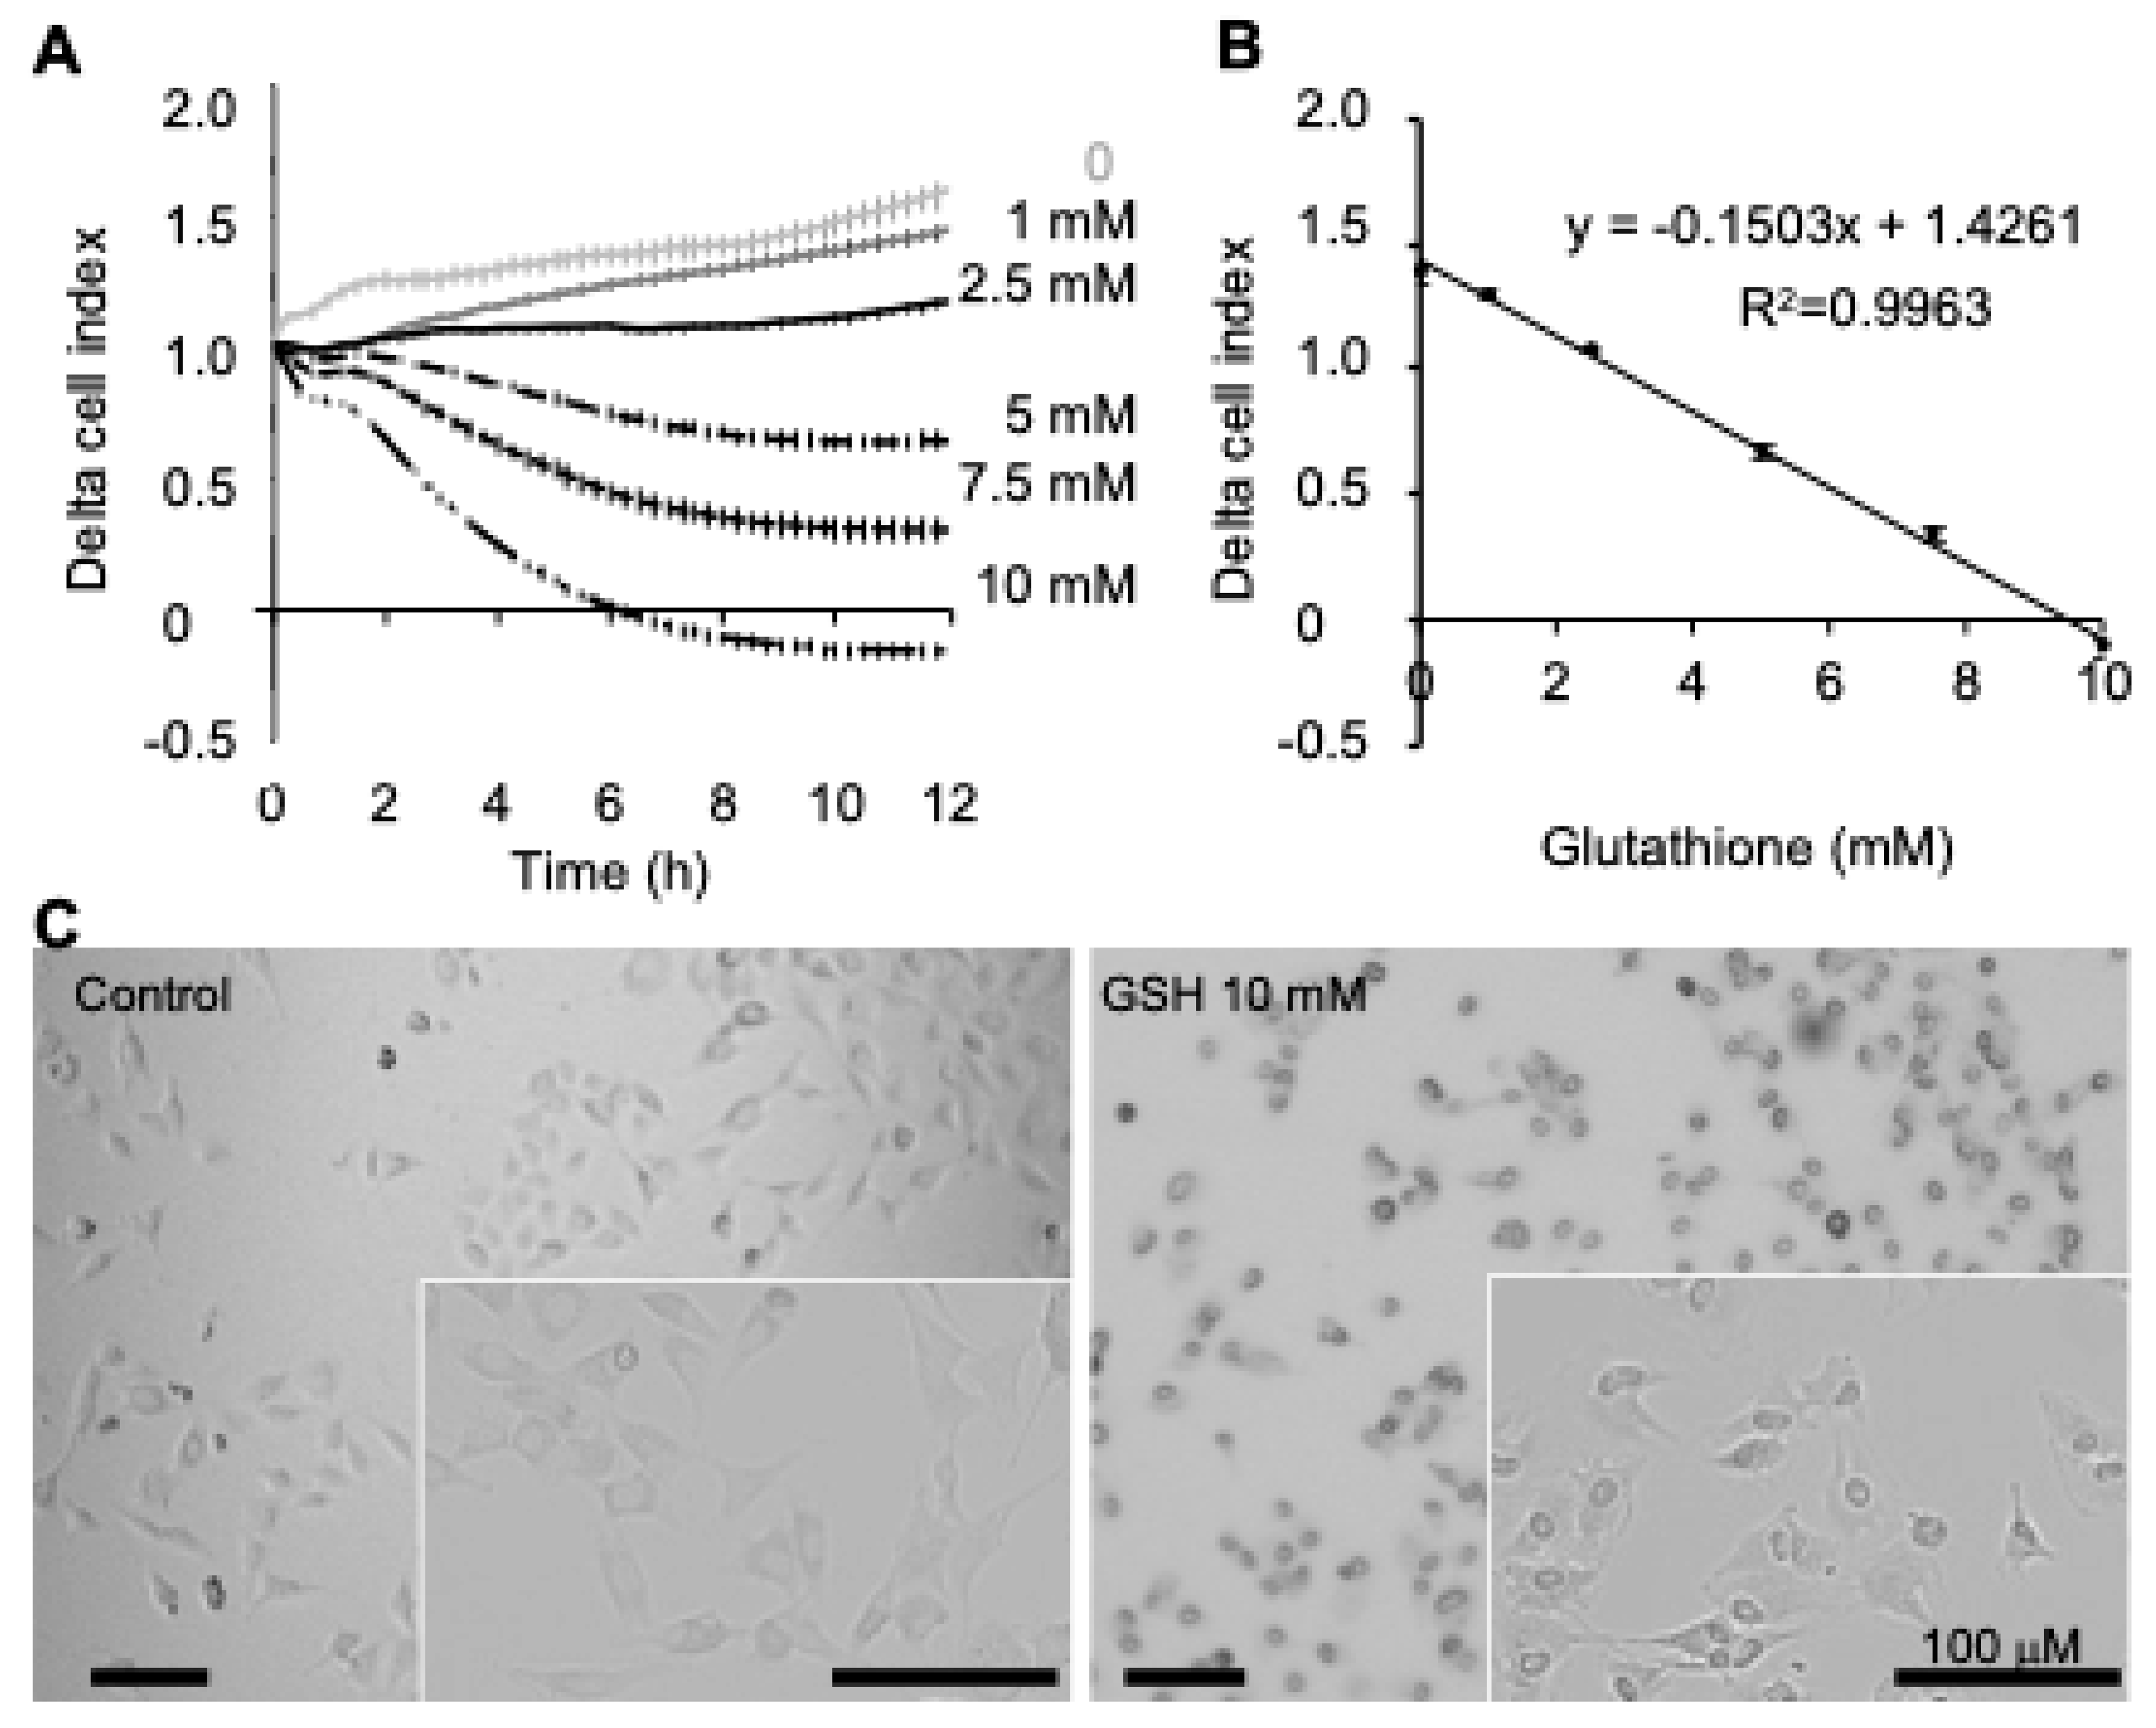
Real-time analysis of olfactory neuroblast impedance was performed for 12 h at several physiological doses of GSH (Figure 1A) in the linear phase of proliferation, validated by the progressive increase in cell index for control cells.
At low doses of GSH (0 to 2.5 mM), the cell index was positive but slightly altered, although at higher concentrations (5–10 mM), it markedly decreased. Effects on cellular index are correlated by dose after exposure for at least 8 h (Figure 1B). Surprisingly, the delta cell index was lower than zero in response to the highest GSH concentration (10 mM), suggesting cell loss or death. The cell index depends on the surface occupied by cells and their adhesion strength onto the substrate. The surface occupied by cells is dependent on cell size (morphological criteria) and number. A decrease in cell index thus reveals either a decrease in adhesion strength, a decrease in cell size, and/or even cell loss due to death when the cell index falls close to zero. Upon GSH treatments at 5 to 10 mM, the decreases in 13s24 cell indexes were so strong that cell death was, at first glance, our main hypothesis. However, phase contrast microscopy indicated that cells were still present, although with morphological differences (Figure 1C).

3.2. Holographic Monitoring of Cell Behavior in Response to GSH

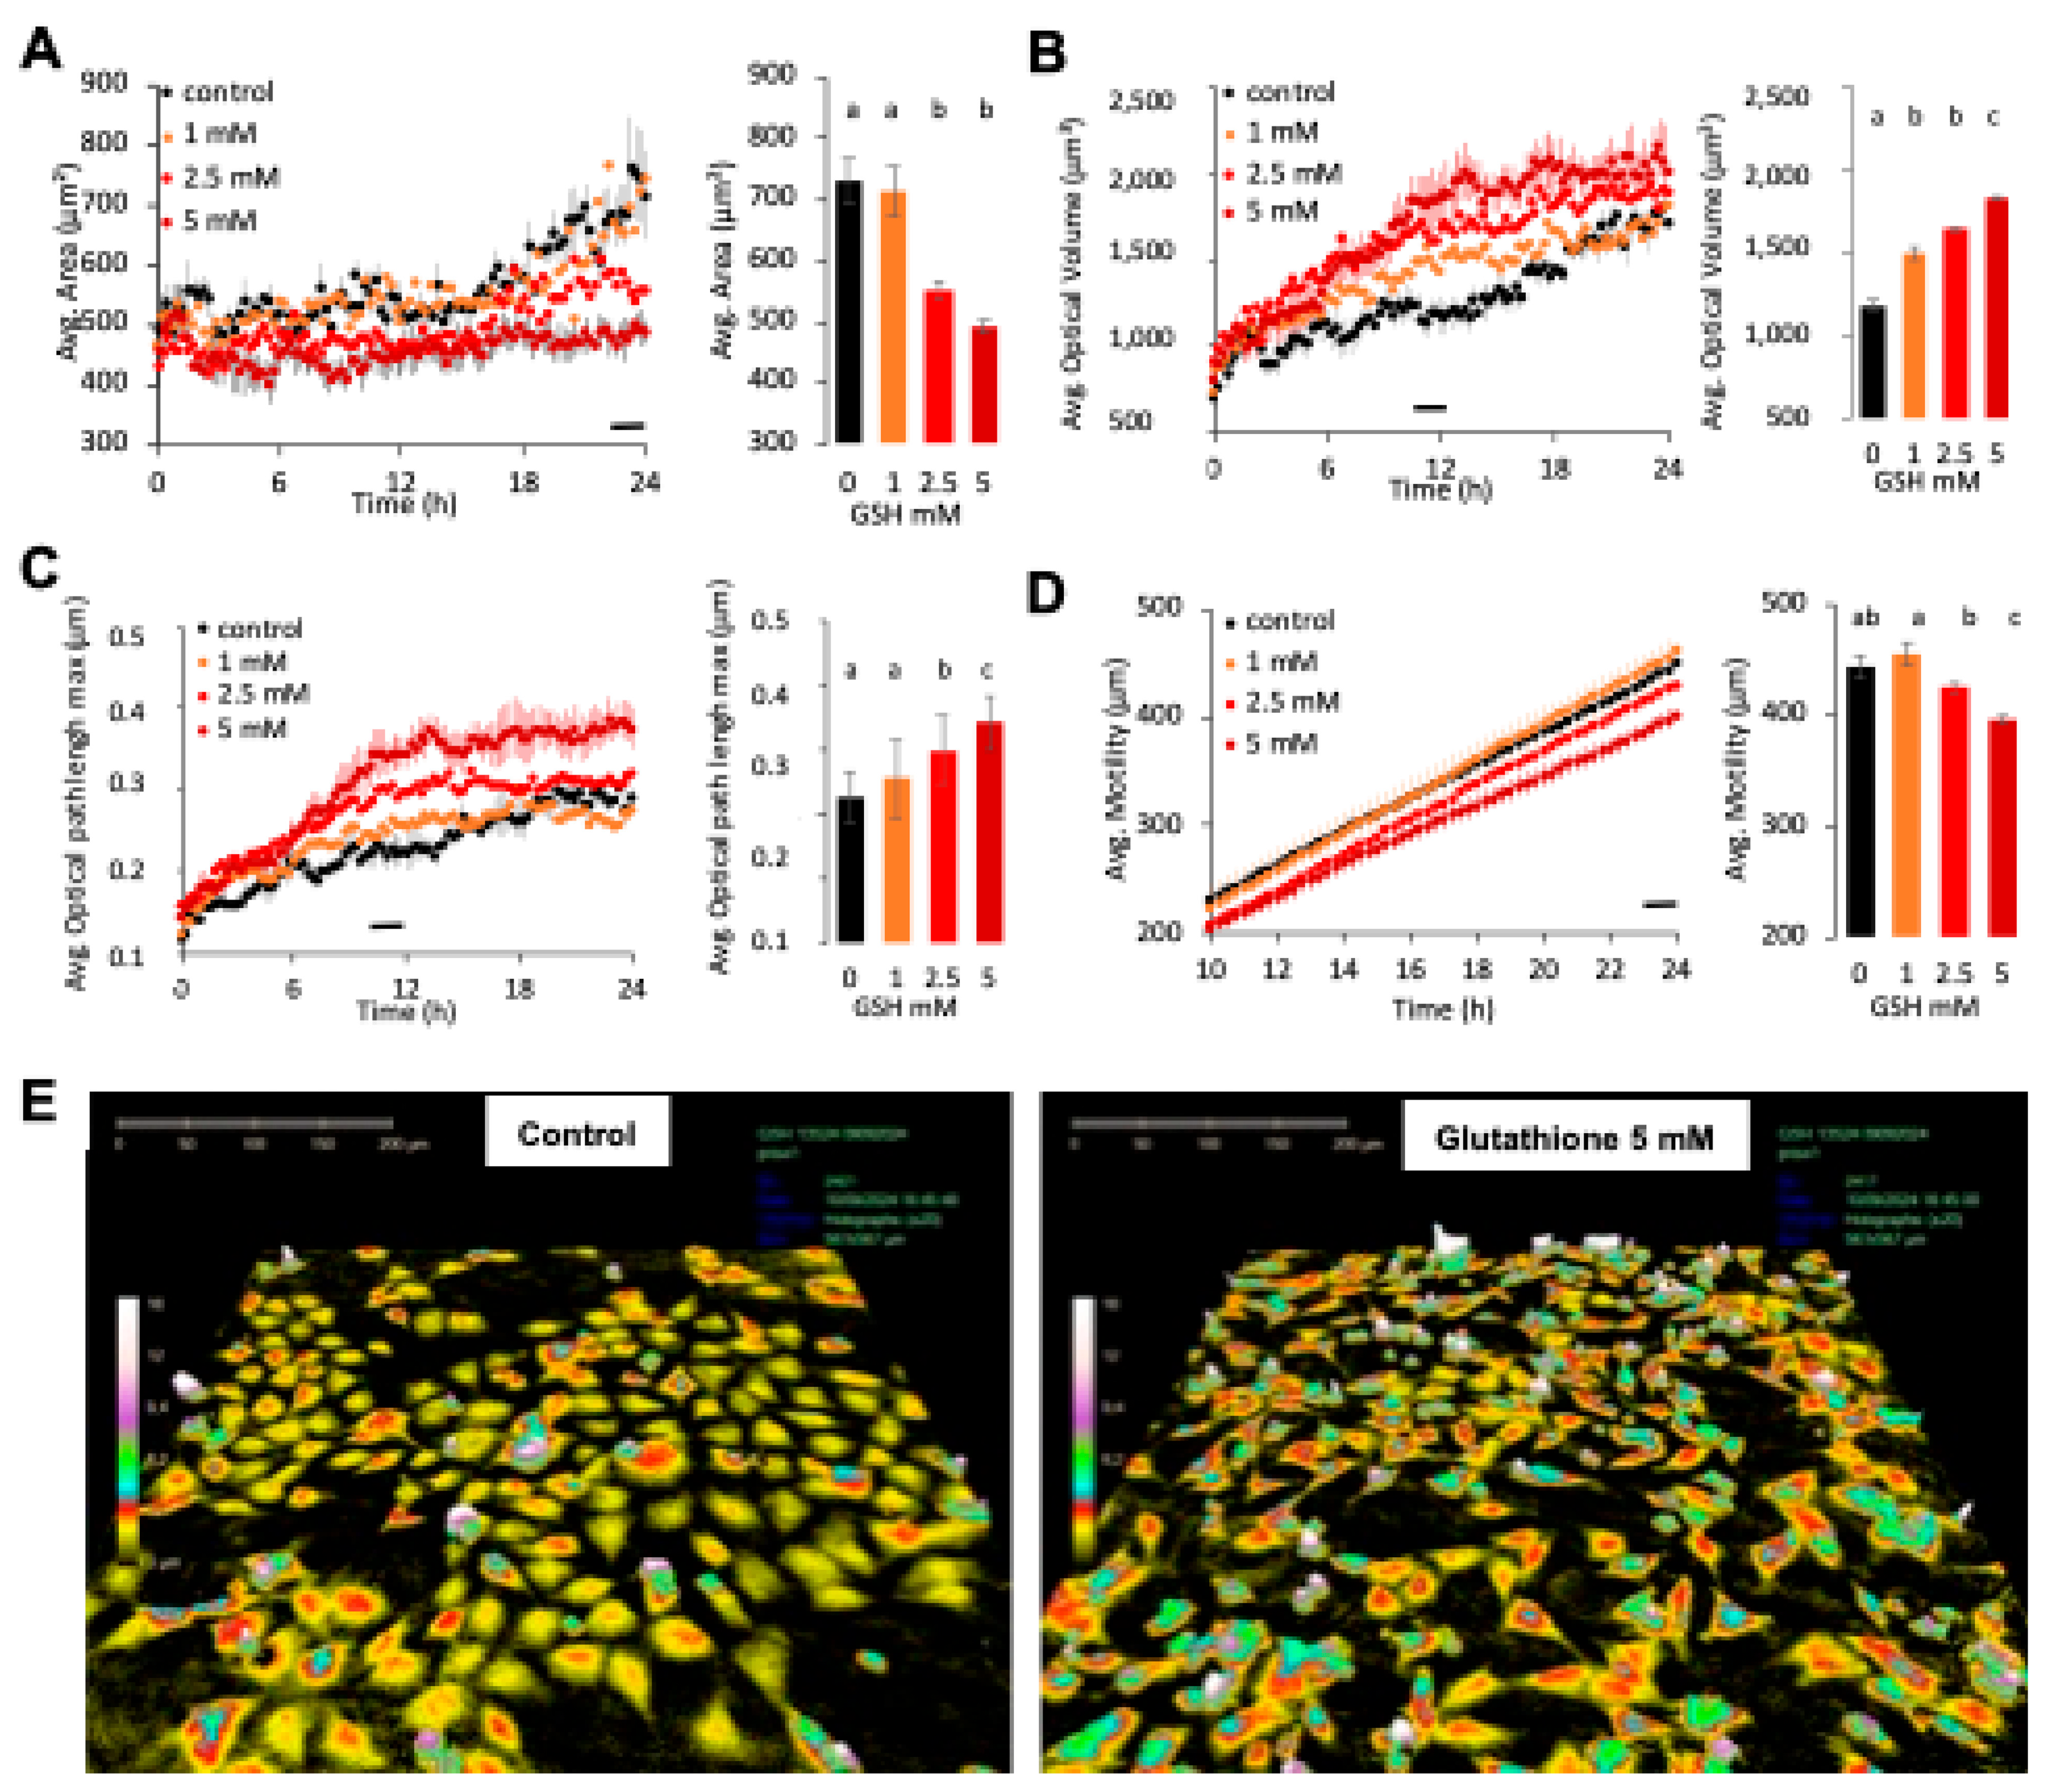
Label-free imaging cytometry using the HoloMonitor microscope was used for real-time monitoring of 13s24 cells. Among the 30 physical and behavioral parameters analyzed, the 4 most representative parameters significantly modulated by GSH are presented and discussed (Figure 2). Cell surface occupancy represented by cell area increased under control conditions during the 24 h recording (Figure 2A). This increase was affected in the presence of GSH 2.5 and 5 mM in a dose-dependent manner with a most significant difference after 18 h (Figure 2A). Inversely, the average optical volume markedly increased for cells exposed to GSH compared to control (Figure 2B). Optical volume increased during the first 12 h and then remained stable. Interestingly optical volume of cell changed according to the GSH concentrations. Concentrations of 1 and 2.5 mM GSH transiently increased optical cell volume from 10 to 15 h of recording. No significant difference was observed between 1 and 2.5 mM GSH. The increased optical volume may be explained by the increase in maximal optical path length of cells (i.e., the distance that light travels through cells, Figure 2C). Regarding cell behavior, only cell motility was significantly affected by 2.5 and 5 mM GSH, with a progressive effect observed over 24 h (Figure 2D). In conclusion, holographic analyses show significant effects of GSH 2.5 and 5 mM on cell phenotype (size) and motility.

3.3. Real-Time Label-Free Imaging of Isolated 13s24 Olfactory Neuroblasts in Response to GSH

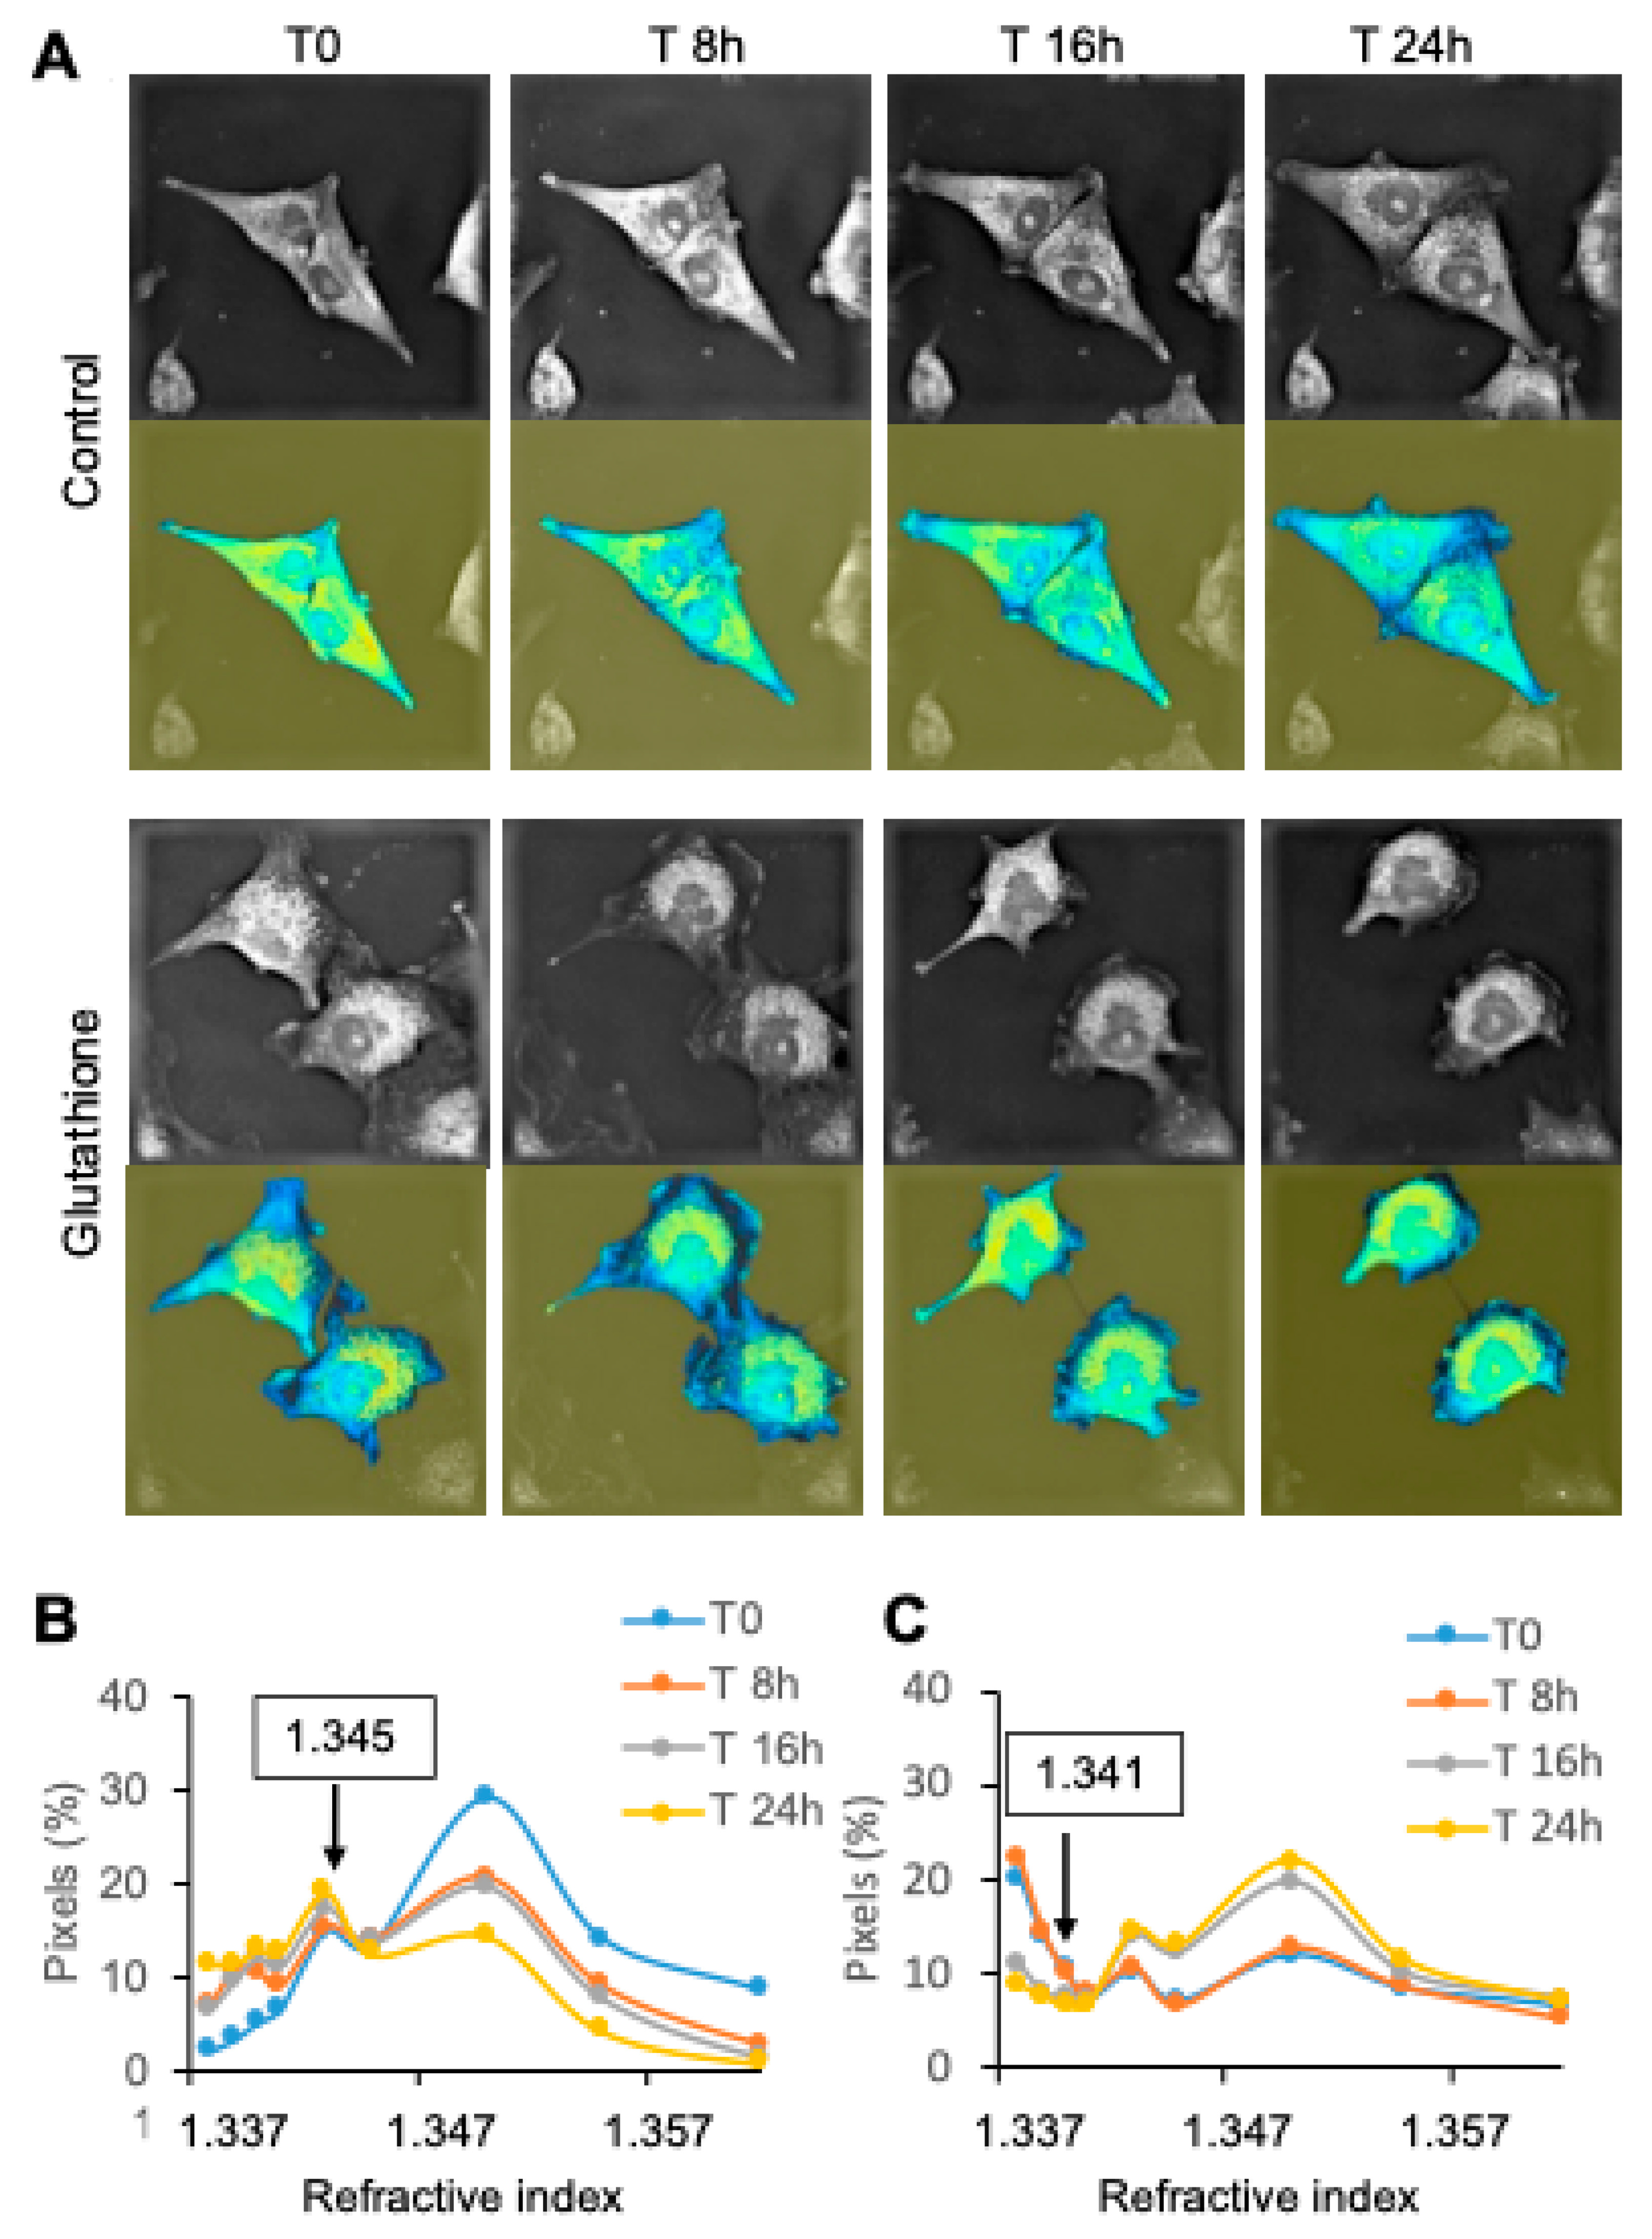
In the next series of experiments, we investigated whether GSH may induce the morphological and intracellular modifications by real-time monitoring of 13s24 cell refractive index (RI) using the 3D Nanolive microscope (Figure 3A).
In control cells, the graphical representation of the evolution of the RI shows a turning point at the value 1.345 (Figure 3B). The number of pixels with RI lower than that value increased during incubation; the pixels with RI higher than that value decreased during incubation. The turning point was lower for cells exposed to 5 mM GSH than the one of control cells (RI 1.341, Figure 3C). Another difference was detected, and the number of pixels with an RI lower than 1.341 indeed decreased in the presence of GSH, while the number of pixels with a higher RI than the turning point increased (from 1.343 to 1.35) with GSH incubation time. Finally, the number of pixels with the highest RI is higher in cells exposed to GSH than in control cells (Figure 3B,C). This observation suggests an increase in water uptake in control cells and its decrease in 13s24 cells exposed to GSH and/or a major reorganization of cell ultrastructure.

3.4. Cell Sorting and Imaging Validate the Effects of GSH on Cell Phenotype and Adherence Properties

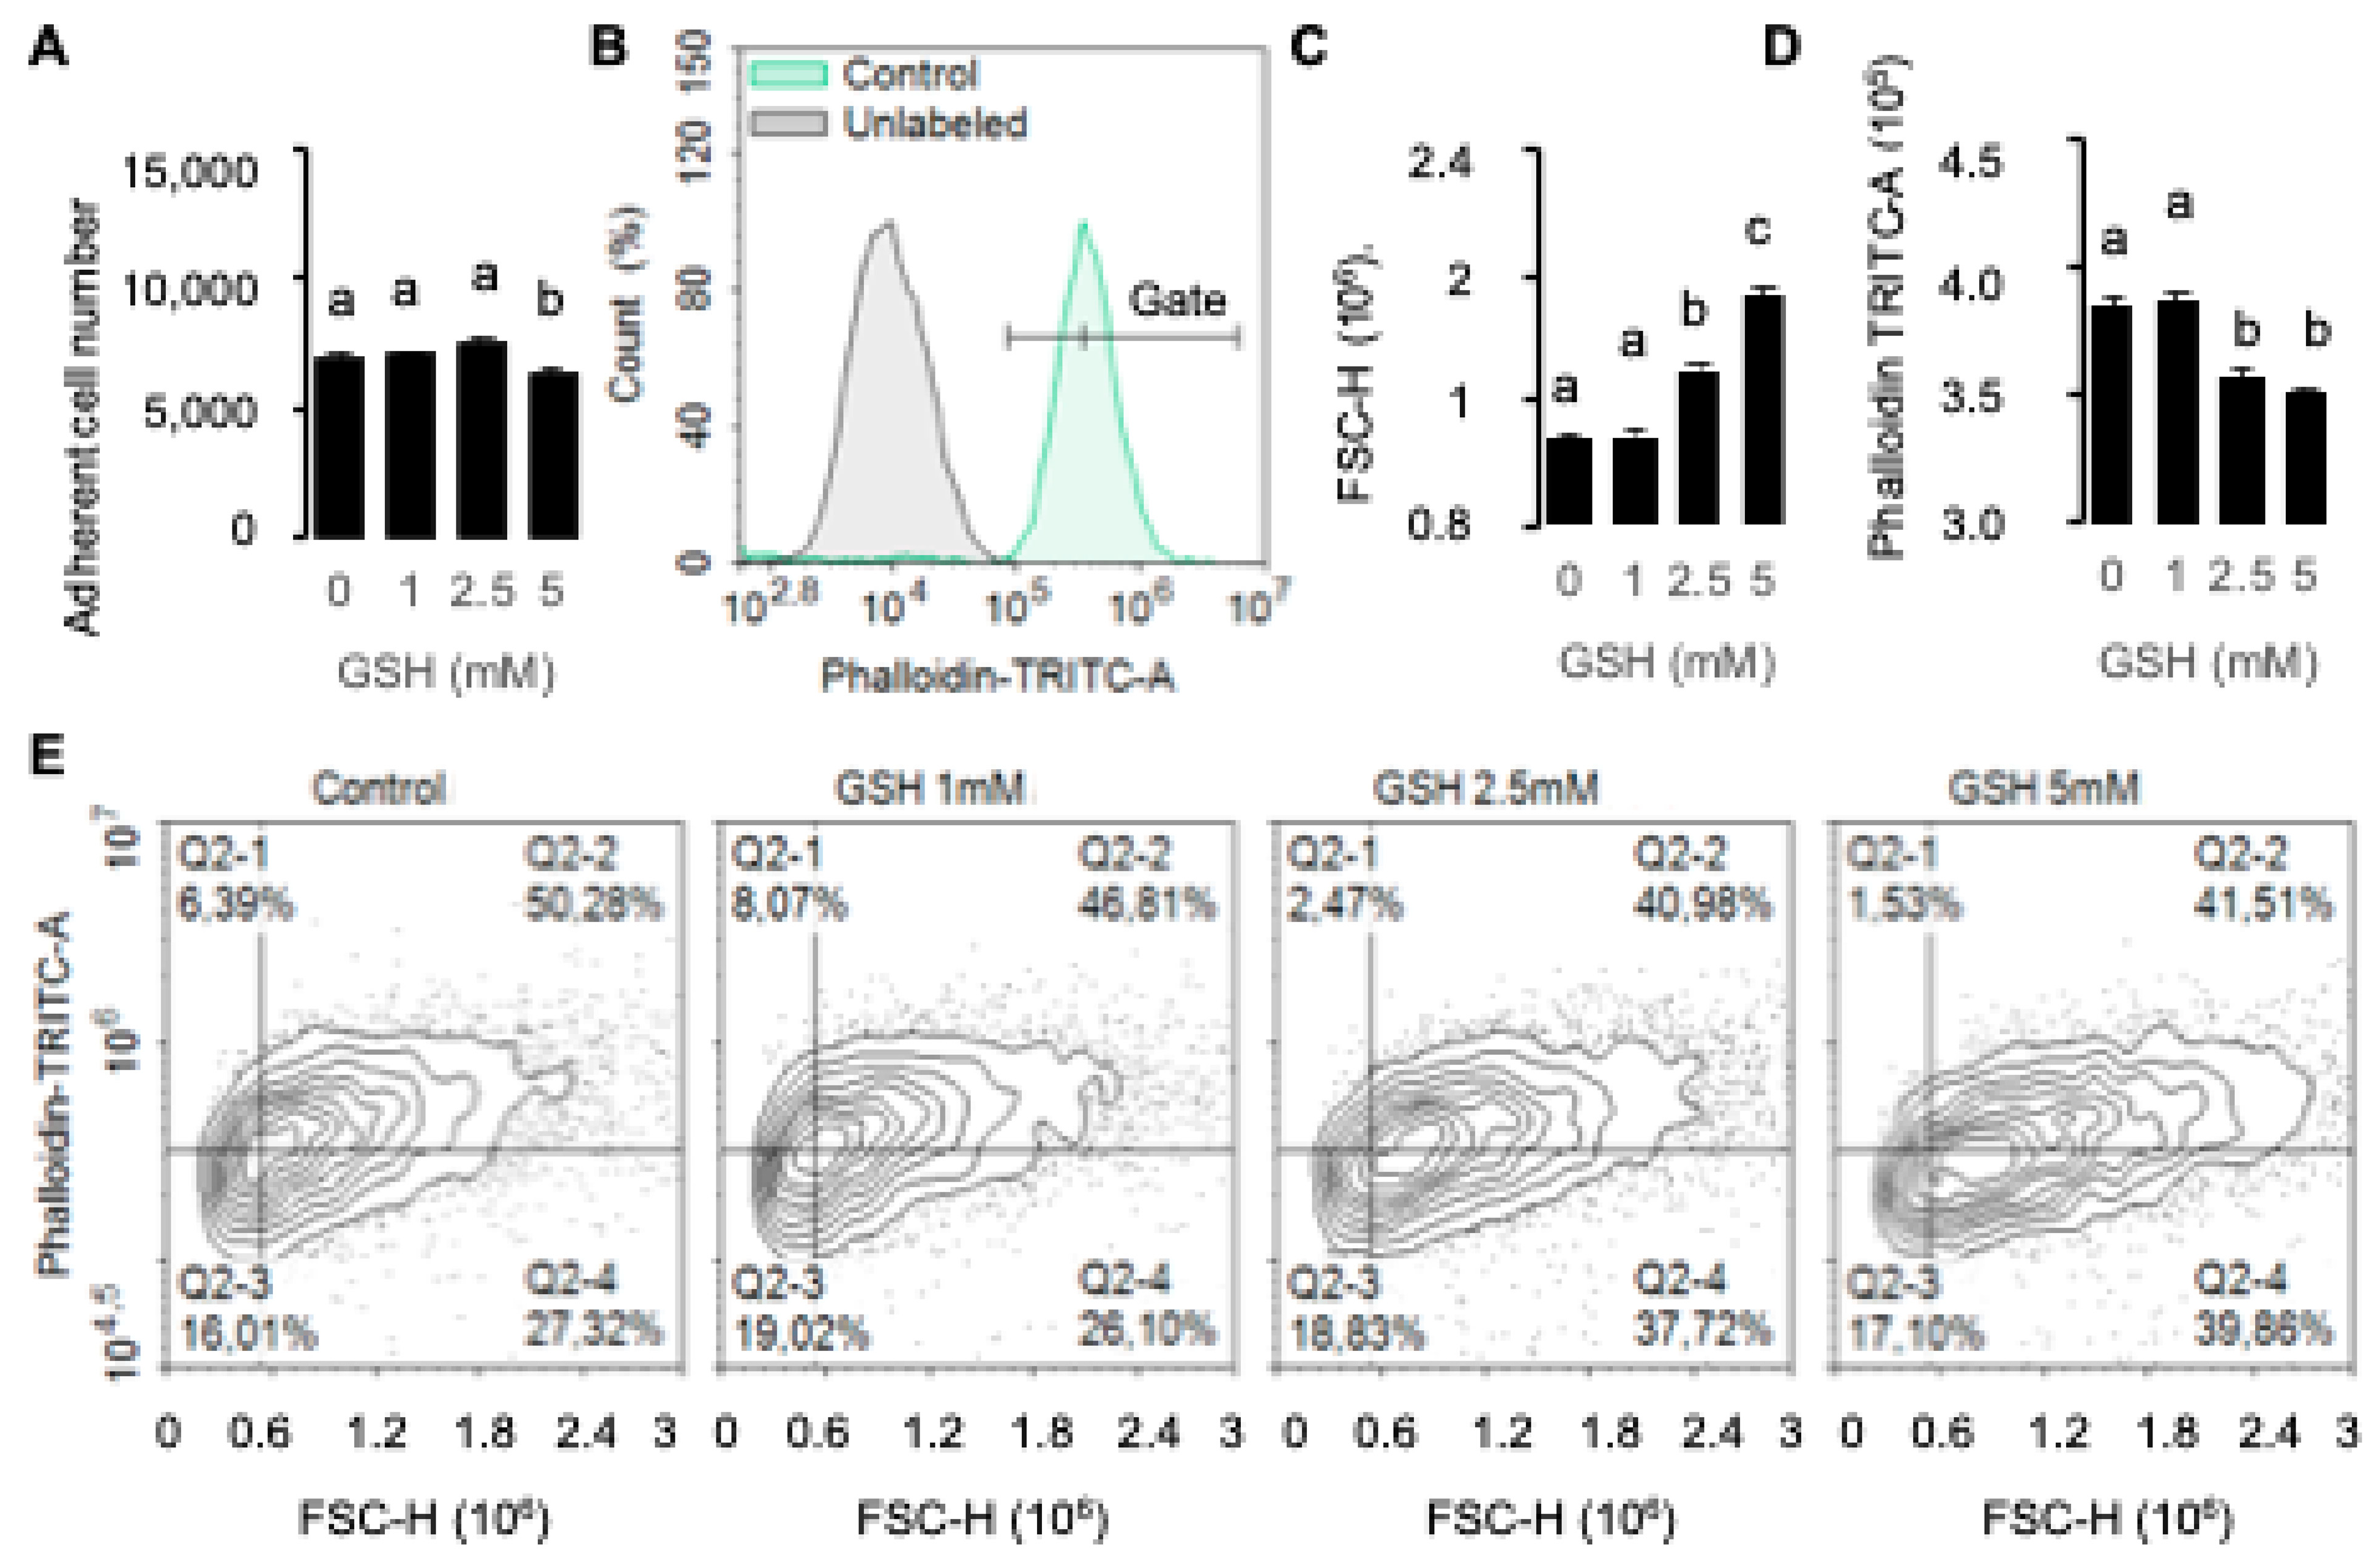
In order to identify the cellular effects involved, 13s24 cells were exposed during 6 h to several doses of GSH. Adherent cells retrieved by dissociation were analyzed by cell sorting (Figure 4).
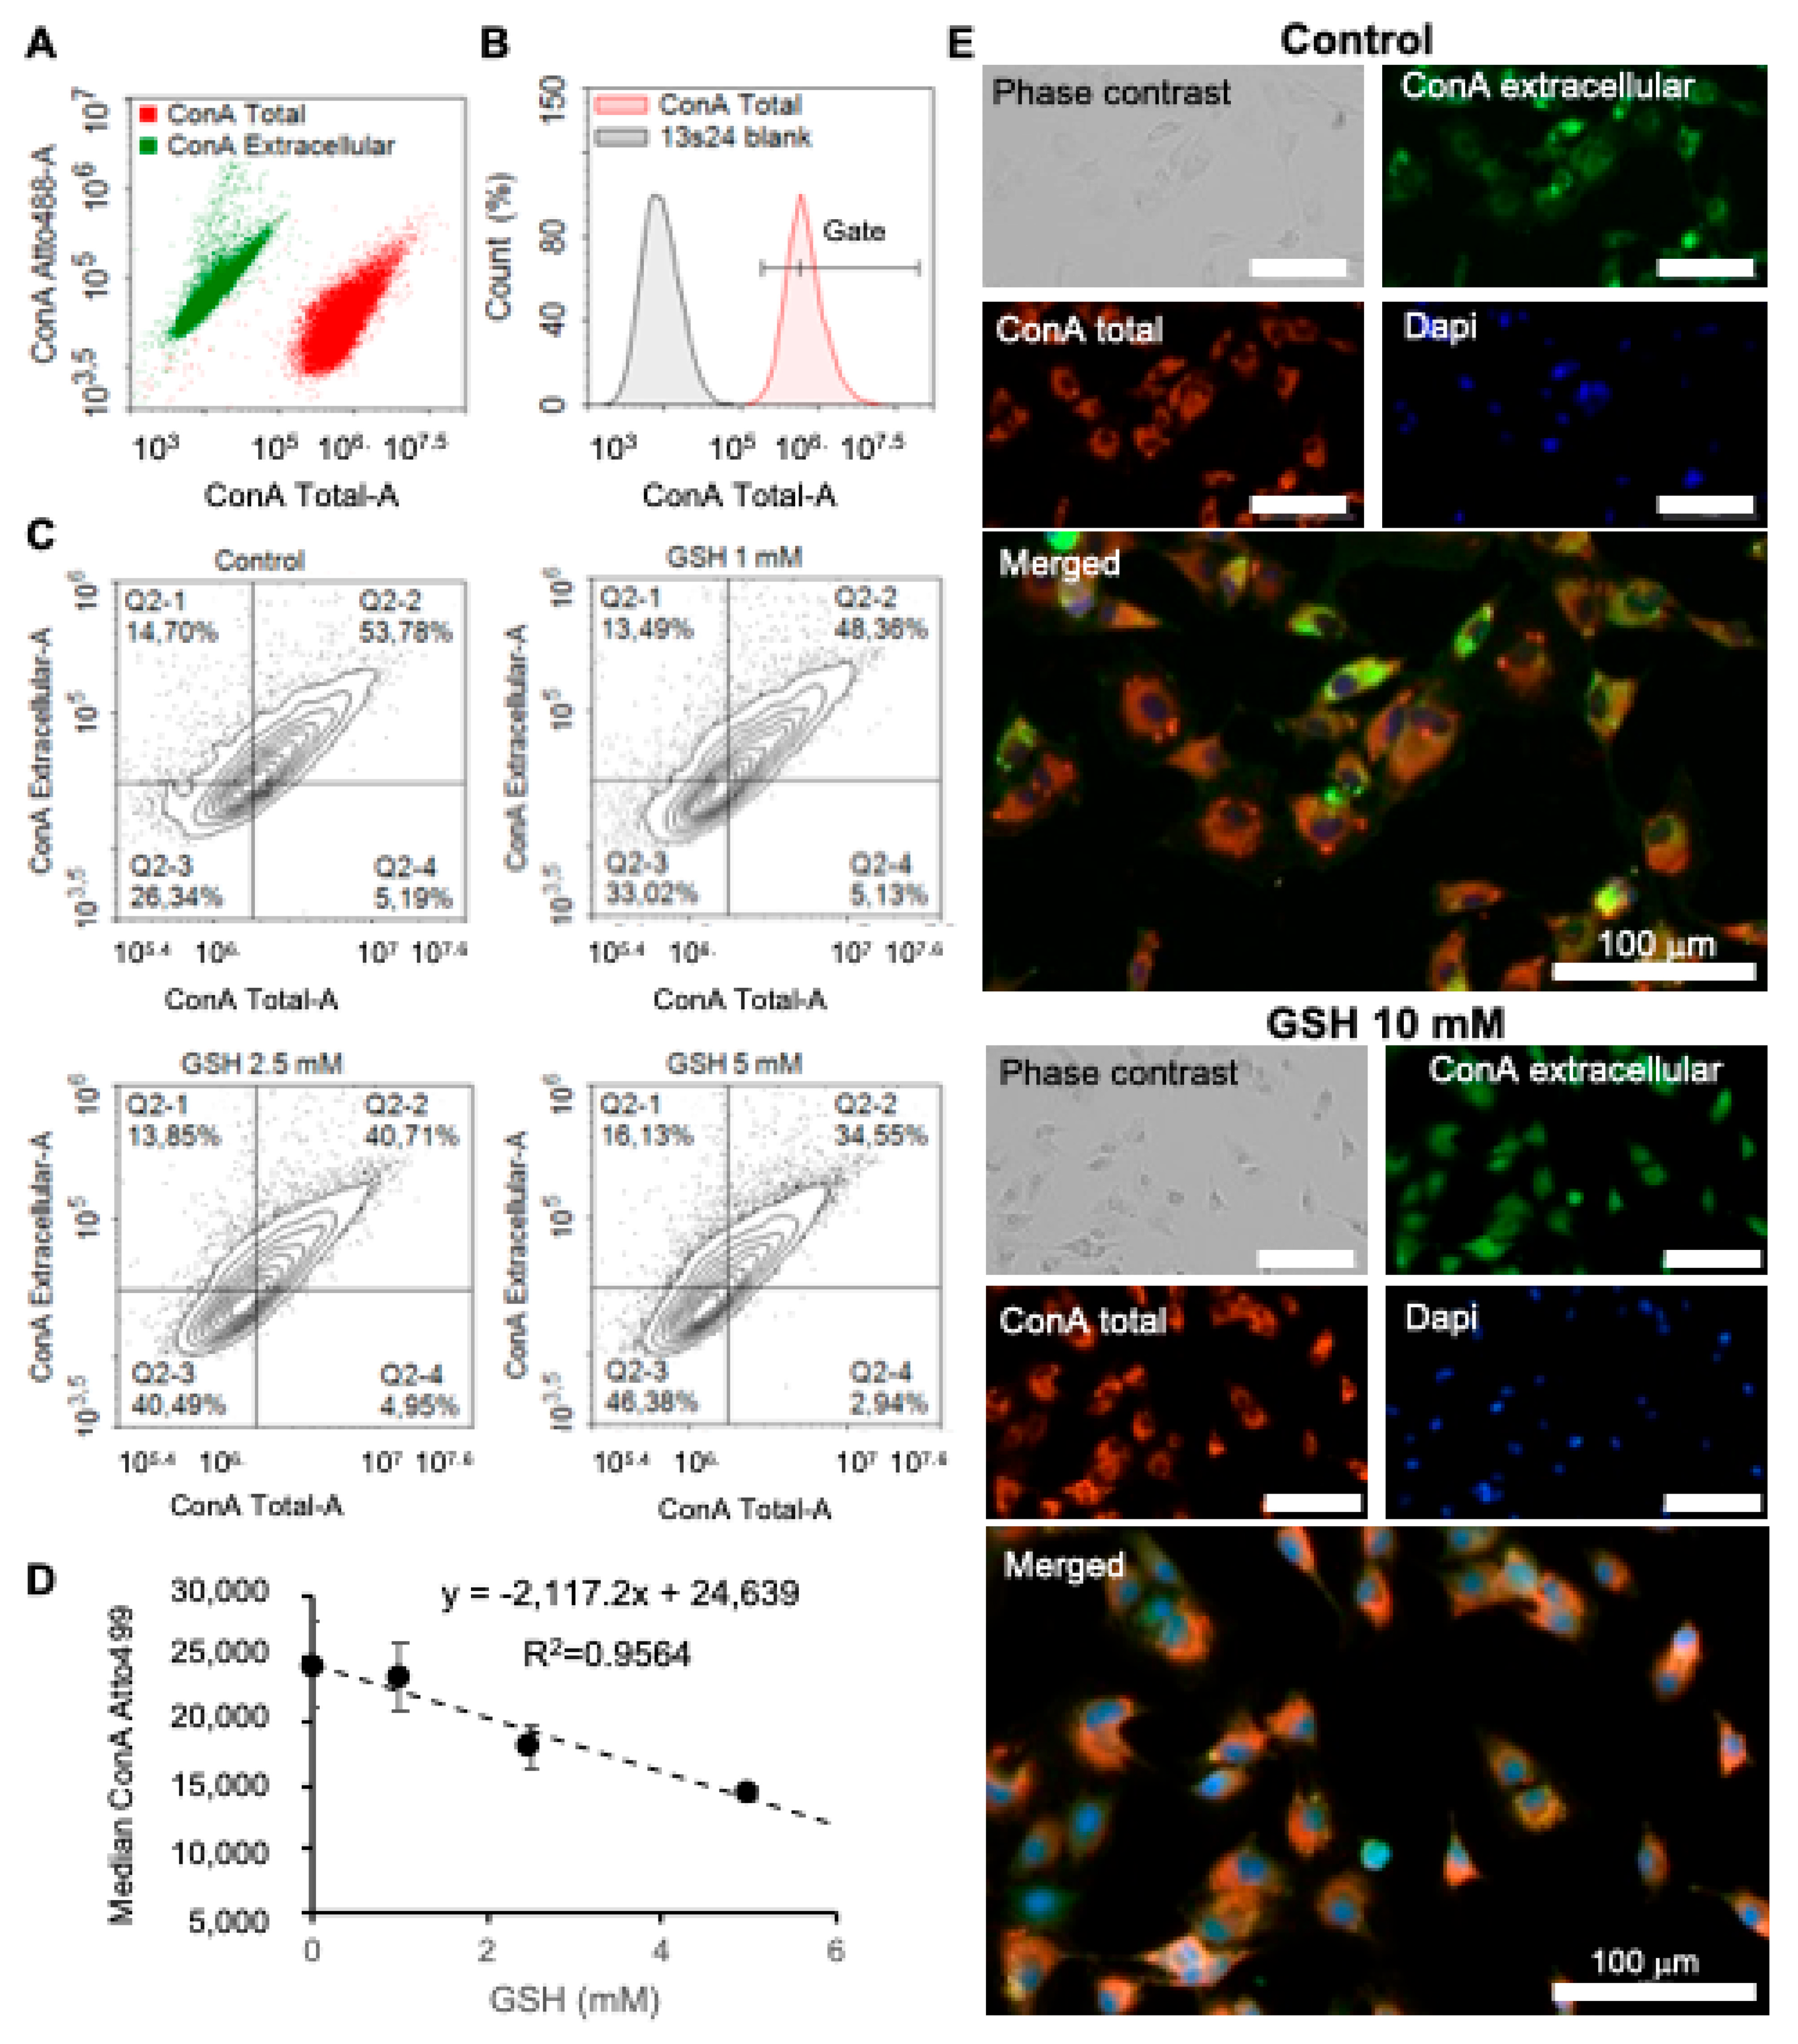
The adherent cell number was not significantly affected in cell cultures treated with 2.5 mM, and only slightly with 5 mM, suggesting that glutathione does not affect cell survival at physiological concentrations. In flow cytometry, the forward-scatter light intensity (FSC) is proportional to the diameter of cells. After 6 h of treatment with GSH, cell size was significantly increased in a dose-dependent manner (Figure 4C). Cell adhesion force is under the control of actin polymerization (F-actin), allowing for intracellular cytoskeleton stability [22]. A TRITC-tagged phalloidin, which specifically interacts with F-actin subunits, was used to detect modifications of adhesion strength. Figure 4D shows a significant reduction in fluorescent phalloidin incorporation in cells treated during 6 h with GSH 2.5 and 5 mM, indicating a decrease in F-actin. Since the effect of actin polymerization reflects significant modifications to the cell cytoskeleton and is related to extracellular matrix organization, we then investigated whether GSH may affect extracellular proteins involved in cell adhesion. Most of them are highly glycosylated; therefore, their extracellular addressing was quantified using extracellular binding to a lectin, concanavalin A (ConA), tagged with Atto488 (detected by the FITC filter), then compared to the whole cell content of glycosylated sites using an Alexa Fluor 584-coupled ConA detected by the TRITC filter (Figure 5). Extracellular distribution of ConA quantified by cell sorting was downregulated in a dose-dependent manner after exposition to GSH over 6 h (Figure 5D). This result suggests that GSH modifies cell size and/or adhesion by modulation of extracellular proteins associated with a loss of F-actin polymers.

4. Discussion

We used different methods to characterize the effects of GSH on 13s24 neuroblasts: cell adhesion (real-time monitoring of impedance on the xCELLigence sensor and flow cytometry analysis with specific markers), cell behavior (time-lapse cytometry on the HoloMonitor microscope), and cell morphology (time-lapse 3D Nanolive refractive index imaging). Of course, the higher the number of analytical methods used, the better the description of GSH effects on cells. However, preliminary distinctions can be made, especially regarding the number of cells analyzed (Table 1).
The microscopy techniques were performed on a small number of cells (a few cells for Nanolive; a few dozen cells for HoloMonitor), a few thousand cells for xCELLigence, and several tens of thousands for cytometry. Another important difference is the time required to complete the analysis of results. Microscopy is time-consuming (HoloMonitor, Nanolive), while, even including the time needed for labeling or preparing cells, other methods are much faster (xCELLigence, cytometry). Another important distinction is the skill required to carry out measurements, although most device software is user-friendly. For example, xCELLigence is very sensitive in the measurement of cell index; however, precise cell counting and accurate pipetting of volumes are required during E-plate filling; otherwise, the results will be scattered. Cytometry allows for the analysis of a large number of cells and the multi-parametric analysis of a single cell using complex labeling strategies that are highly time-consuming, especially for the characterization of the combinatorial assemblages regulating cell adhesion.
The molecular and cellular mechanisms involved in cell adhesion have been extensively studied [23]; however, they have been poorly studied in real-time experiments. In the present study, we used three recently developed time-lapse instruments, allowing for complementary contributions to decipher the mechanisms involved in cell response to GSH. The xCELLigence sensor allows for label-free, noninvasive determination of the surface area occupied by the cells on microelectrodes by measuring their impedance, i.e., their resistance to the passage of a low-intensity current. The adhesion strength of cells on the electrodes can markedly trigger the cell index. While this tool was first dedicated to monitoring cell numbers related to proliferation versus death, it is also possible to study the adhesion strength of cells (Figure 1). In a previous study, we validated this application by measuring lipid uptake by immature adipose cells; indeed, the accumulation of triglycerides in small lipid droplets induces a round cell shape, which is related to a loss of adhesion strength [24]. The regulation of the cell index by the adhesion force was also validated in a study of the molecular mechanisms involved in cancer cell adhesion [25]. xCELLigence stations are designed to use 96-well plates, allowing to obtain results from a large number of cells (103 to 105 cells per well) with a high reproducibility rate. The most recent version of xCELLigence e-Sight is coupled with microscopic observation; there is no doubt that it is a very effective tool for quantifying cellular responses, allowing for primary identification of dose-dependent effects (determination of IC50). However, complementary analyses are then required in order to determine which effects are involved, among the regulation of cell number, cell adhesion force, and/or cell surface occupancy (size, differentiation). Another method for monitoring RTCAs is the optimization of complementary analyses according to time-dependent events to identify short-term (adhesion, toxicity, etc.) and long-term events (proliferation, differentiation, etc.) involving different signaling pathways [26]. Finally, RTCA data can be monitored and analyzed during experiments, allowing for instant result processing and adjustments to the experiment’s duration. The phase holographic cell imaging system HoloMonitor is amazing; the software brings the possibility to follow single cells in time-lapse experiments to quantify their physical (area, perimeter, volume, irregularity, etc.) and behavioral (motility, migration, speed, etc.) characteristics. It is possible to select few tens of cells. It is also possible to select the place to be analyzed inside the wells, which is very convenient in light of cell cultures often being heterogeneous. Such a process takes time before starting acquisition; it may be problematic to study very fast responses, but it is essential to insure efficient measurements. Analysis of the results is time-consuming; therefore, it is necessary to check selected cells from one frame to the following one in order to insure reliable results (Table 1). The third time-lapse method, using the 3D Nanolive microscope, allows for an impressive resolution. It is very user-friendly, and time-lapses bring researchers in the close vicinity of cells. Cell analysis based on refractive index is an original and fascinating approach. Further research is required to increase the potential of the microscope, in particular by defining the refractive index of organelles. The main limitation of the microscopic analysis of cells, apart from the low number of cells analyzed, is that the recent history of cells is unknown, i.e., whether they have divided recently, or whether they will divide soon. Such variations in the metabolic status of cells may introduce confounding results. A limitation applicable to both HoloMonitor and Nanolive is that the time required for processing and sample setup makes it difficult to acquire data quickly enough to measure very early responses (less than 30 min).
The different methods show some discrepancies in terms of glutathione’s dose-dependent effect. For example, GSH-induced effects were detected from the lower concentration 1 mM in RTCA experiments with xCELLigence (cell index, Figure 1A) and HoloMonitor (Figure 2A), although the effects were detected from 2.5 mM with flow cytometry (Figure 4 and Figure 5). Since flow cytometry measurements require cell dissociation and fixation, decreased sensitivity could result from partial cell and extracellular epitope loss, leading to lower sensitivity than the RTCA and HoloMonitor time-lapse monitoring methods. An important experimental parameter rarely indicated, as seen in Section 2, is the culture media volume in which cells are incubated at the time of measurements. It is usual to refer to the concentrations of molecules tested; however, in the case of molecules having a specific attraction for certain chemical bonds, such as GSH for disulfide bridges, incubating cells in 1 mL represents twice the GSH molecules than in 500 μL. This can lead to significant differences in sensitivities measured by different techniques, especially in 96-well plates (xCELLigence and HoloMonitor) versus Ibidi dishes (Nanolive). In the same order, cell number at the time of measurement may be critically important. Indeed, in the present case, it will change the number of disulfide bridges exposed to GSH. It is not always easy to obtain the same cell density when the cell supports are different: although there is not significant difference between E-96 and 96 well plates, well size and bottom glass of Ibidi dishes have significant impact on cell proliferation.
Besides the comparison of the different methods, it is of interest to comment the effects of GSH on 13s24 cells. The most significant result of this work is the dose-dependent alteration of adhesion strength and increase of olfactory neuron cell size. The dose-response of cell index (xCELLigence) was strongly correlated from control conditions to 10 mM GSH (r2 = 0.9963, Figure 1) without significantly affecting cell proliferation and survival (Figure 4A). Such high GSH concentration has been reported in liver cells [3]. The decrease in cell index without affecting cell number suggests an effect on cell adhesion strength. GSH-induced decrease in cell motility (4D), reduction in F-actin content (Figure 4C), and extracellular glycosylation sites (Figure 5) suggest that GSH reduces cell force adhesion to the extracellular matrix (ECM). Indeed, the regulation of cell adhesion, required for the control of cell growth, migration, as well as differentiation, involves a fine regulation of the cytoskeleton by controlling actin polymerization (F-actin) by integrins, which are highly glycosylated proteins [27]. Moreover, GSH was found to increase neuroblast cell size in a dose-dependent manner (Figure 3B and Figure 4B). GSH is produced in the cytosol of most cells [3], and several studies have shown that they are able to export GSH. Two types of carriers were identified: protein multidrug resistance protein (MRP) [28] and organic anion transporting protein (Oatp1) [29]. Cells produce GSH in their cytosol; that GSH can be exported to the extracellular space and can react with extracellular components. Cell adhesion is regulated by complex assemblages of integrins, which are highly glycosylated proteins containing disulfide bonds in the extracellular domains. The binding capacity of integrins can be modulated by various stimuli; the disulfide bonds maintain the integrin in a less active form. The addition of reducing agents results in increased ligand binding [30]. Conformational regulation of integrin affinity (α4β1) by reducing agents has been demonstrated in many studies [31]. GSH regulates integrin α2β3-mediated cell adhesion [32]. Similarly, the disruption of disulfide restriction at integrin knees induces activation and ligand-independent signaling of α4β7 [33]. All these observations strengthen our hypothesis that GSH produced in cell cytosol can be exported to interact with integrins, giving the cells an opportunity to control their volume.
One may argue that the GSH concentrations tested in the present study were not physiological. Admittedly, the plasma GSH concentration is low (in the order of μM), but intracellular concentrations are in the millimolar range and can even reach 10 mM in liver cells; much of it is exported across the plasma membrane into extracellular spaces [34]. It must be noticed that GSH is a highly reactive compound. It is then not a surprise to detect low concentrations of free GSH in the interstitial liquid. Ultimately, what matters is the turnover rate of GSH. GSH turnover rates in most cells are rather fast, with half-lives between 2 and 6 h [35,36], indicating high rates of both GSH synthesis and export [3]. In conclusion, despite rather low concentrations of GSH, high turnover rate and high cell sensitivity are compatible with the role of GSH in the regulation of cell volume. Further, our results already show an increased cell volume at 1 mM GSH, which, according to the literature, seems common in cells [1,14]. In a previous study, we observed a similar effect of GSH on human lung epithelial cell volume suggesting that the effect of GSH on cell volume is a common feature. We also showed that the effect of extracellular GSH is counterbalanced by hydrogen peroxide [14]. Our results support the hypothesis of a major role of GSH exported by cells to interact with the oxidative stress-sensitive integrins. This represents a causal link between the redox state of the cell and the necessary changes in cell volume and motility required for both cell migration and differentiation.
The results obtained on an olfactory neuroblast cell line is of particular interest in the context of the control of neurogenesis, which is a specific feature of the olfactory system in adult humans [37]. In the olfactory epithelium, continuous neurogenesis occurs to replace bipolar neurons involved in odorant molecule detection by specific apical receptors and signaling through axonal projection to the olfactory bulb [38]. In vitro studies using primary non-neuronal cell cultures have shown that both biochemical and mechanical stresses are sufficient to induce stem cell differentiation into bipolar sensory neurons [18]. The regulation of cell morphology by the cytoskeleton contributes to neuronal identity by inducing axonal specification in relation to other neurites that become dendrites [39], assuming, respectively, the transfer of signal at the nasal level by projection to the CNS and specific odorant response signaling by direct exposition to airway flux. In non-neuronal olfactory 13s24 cells, we found that GSH can transiently affect cell adhesion force and F-actin polymerization. Therefore, local production of GSH could participate in the finely tuned regulation of neuronal differentiation versus proliferation of neuronal stem cell progenitors. Loss of brain GSH is associated with development of neurogenerative diseases [40]. The antioxidative properties of intracellular GSH are largely described. Further exploration of the mechanisms involved in its extracellular activity on cell adhesion and regulation of size will improve its promising potential in new therapeutic strategies to treat neurodegenerative diseases. Although cell parameters such as cell volume, surface, and motility have not been directly measured, some results from the literature support our conclusions.
5. Conclusions

The first conclusion of this work concerns the methods used to detect cellular responses. Our results highlight the value of real-time continuous cell recording methods, which allow for label-free and noninvasive assays. Recent technological innovations have seen the development of cost-effective analysis systems that continuously record and analyze a large number of cellular parameters. Sometimes the choice of the method is limited; for example, xCELLigence is the only one system able to evaluate cell adhesion force in real time. Among the criteria for selecting the most accurate analytical method, one must take into account the number of cells that will be analyzed, the time constraints for cell preparation, analysis of results, treatment of cells imposed by the method used, and the training of users.
Regarding the effects of GSH on neuroblasts, results show dose-dependent responses to GSH on cell volume, adhesion strength, and cell motility related to loss of extracellular glycosylated proteins and actin depolarization. These results suggest that GSH exported by cells could interact with the oxidative stress-sensitive integrins of the extracellular matrix. This is the first evidence of a causal link between the redox state and the changes in cell volume and motility, two parameters involved in cell division migration and/or differentiation.

Author Contributions

Conceptualization, A.G.; Methodology, E.B.; Software, E.B.; Validation, A.G. and E.B.; Formal analysis, A.G. and E.B.; Investigation, A.G. and E.B.; Data curation, A.G. and E.B.; Writing—original draft, A.G.; Writing—review & editing, E.B.; Visualization, A.G. All authors have read and agreed to the published version of the manuscript.

Funding

This research received no external funding.

Institutional Review Board Statement

Not applicable.

Informed Consent Statement

Not applicable.

Data Availability Statement

Data is contained within the article. The original contributions presented in the study are included in the article, further inquiries can be directed to the corresponding author/s.

Conflicts of Interest

The authors declare no conflict of interest.

References

  1. Forman, H.J.; Zhang, H.; Rinna, A. Glutathione: Overview of Its Protective Roles, Measurement, and Biosynthesis. Mol. Asp. Med. 2009, 30, 1–12. [Google Scholar] [CrossRef] [PubMed]
  2. Lu, S.C. Regulation of glutathione synthesis. Mol. Asp. Med. 2009, 30, 42–59. [Google Scholar] [CrossRef] [PubMed]
  3. Ballatori, N.; Krance, S.M.; Marchan, R.; Hammond, C.L. Plasma membrane glutathione transporters and their roles in cell physiology and pathophysiology. Mol. Asp. Med. 2009, 30, 13–28. [Google Scholar] [CrossRef] [PubMed]
  4. Aldini, G.; Altomare, A.; Baron, G.; Vistoli, G.; Carini, M.; Borsani, L.; Sergio, F. N-Acetylcysteine as an antioxidant and disulphide breaking agent: The reasons why. Free. Radic. Res. 2018, 52, 751–762. [Google Scholar] [CrossRef] [PubMed]
  5. Vázquez-Meza, H.; Vilchis-Landeros, M.M.; Vázquez-Carrada, M.; Uribe-Ramírez, D.; Matuz-Mares, D. Cellular Compartmentalization, Glutathione Transport and Its Relevance in Some Pathologies. Antioxidants 2023, 12, 834. [Google Scholar] [CrossRef]
  6. Liyun, Y.; Kaplowitz, N. Glutathione in Liver Diseases and Hepatotoxicity. Mol. Asp. Med. 2009, 30, 29–41. [Google Scholar] [CrossRef]
  7. Dethmers, J.K.; Meister, A. Glutathione Export by Human Lymphoid Cells: Depletion of Glutathione by Inhibition of Its Synthesis Decreases Export and Increases Sensitivity to Irradiation. Proc. Natl. Acad. Sci. USA 1981, 78, 7492–7496. [Google Scholar] [CrossRef] [PubMed]
  8. Ballatori, N.; Clarkson, T.W. Biliary Secretion of Glutathione and of Glutathione-Metal Complexes. Fundam. Appl. Toxicol. 1985, 5, 816–831. [Google Scholar] [CrossRef]
  9. Seidlitz, E.P.; Sharma, M.K.; Singh, G. A By-Product of Glutathione Production in Cancer Cells May Cause Disruption in Bone Metabolic processes. Special Issue on Oxidative Stress in Health and Disease. Can. J. Physiol. Pharmacol. 2010, 88, 197–203. [Google Scholar] [CrossRef]
  10. Kannan, R.; Kuhlenkamp, J.F.; Jeandidier, E.; Trinh, H.; Ookhtens, M.; Kaplowitz, N. Evidence for Carrier-Mediated Transport of Glutathione across the Blood-Brain Barrier in the Rat. J. Clin. Investig. 1990, 85, 6. [Google Scholar] [CrossRef]
  11. Aoyama, K. Glutathione in the Brain. Int. J. Mol. Sci. 2021, 22, 5010. [Google Scholar] [CrossRef]
  12. Detcheverry, F.; Senthil, S.; Narayanan, S.; Badhwar, A.P. Changes in Levels of the Antioxidant Glutathione in Brain and Blood across the Age Span of Healthy Adults: A Systematic Review. NeuroImage Clin. 2023, 40, 103503. [Google Scholar] [CrossRef] [PubMed]
  13. Iskusnykh, I.Y.; Zakharova, A.A.; Pathak, D. Glutathione in Brain Disorders and Aging. Molecules 2022, 27, 324. [Google Scholar] [CrossRef] [PubMed]
  14. Géloën, A.; Berger, E. Reduced glutathione decreases cell adhesion and increases cell volume. Arch. Clin. Biomed. Res. 2022, 6, 880–888. [Google Scholar] [CrossRef]
  15. Wojcik-Stanaszek, L.; Gregor, A.; Zalewska, T. Regulation of neurogenesis by extracellular matrix and integrins. Acta Neurobiol. Exp. 2011, 71, 103–112. [Google Scholar] [CrossRef] [PubMed]
  16. Niklison-Chirou, M.V.; Agostini, M.; Amelio, I.; Melino, G. Regulation of Adult Neurogenesis in Mammalian Brain. Int. J. Mol. Sci. 2020, 21, 4869. [Google Scholar] [CrossRef] [PubMed]
  17. Coronas, V.; Féron, F.; Hen, R.; Sicard, G.; Jourdan, F.; Moyse, E.J. In vitro induction of apoptosis or differentiation by dopamine in an immortalized olfactory neuronal cell line. J. Neurochem. 1997, 69, 1870–1881. [Google Scholar] [CrossRef] [PubMed]
  18. Féron, F.; Vincent, A.; Mackay-Sim, A. Dopamine promotes differentiation of olfactory neuron in vitro. Brain Res. 1999, 845, 252–259. [Google Scholar] [CrossRef] [PubMed]
  19. Serdiuk, T.; Alekseev, S.; Lysenko, V.; Skryshevsky, V.; Géloën, A. Trypsinization-Dependent Cell Labeling with Fluorescent Nanoparticles. Nanoscale Res. Lett. 2014, 9, 568. [Google Scholar] [CrossRef] [PubMed]
  20. Schindelin, J.; Arganda-Carreras, I.; Frise, E.; Kaynig, V.; Longair, M.; Pietzsch, T.; Preibisch, S.; Rueden, C.; Saalfeld, S.; Schmid, B.; et al. Fiji: An open-source platform for biological-image analysis. Nat. Methods 2012, 9, 676–682. [Google Scholar] [CrossRef] [PubMed]
  21. Géloën, A.; Isaieva, K.; Isaiev, M.; Levinson, O.; Berger, E.; Lysenko, V. Intracellular Detection and Localization of Nanoparticles by Refractive Index Measurement. Sensors 2021, 21, 5001. [Google Scholar] [CrossRef] [PubMed]
  22. Stricker, J.; Falzone, T.; Gardel, M.L. Mechanics of the F-Actin Cytoskeleton. J. Biomech. 2010, 43, 9–14. [Google Scholar] [CrossRef] [PubMed]
  23. Khalili, A.; Ahmad, M.R. A Review of Cell Adhesion Studies for Biomedical and Biological Applications. Int. J. Mol. Sci. 2015, 16, 18149–18184. [Google Scholar] [CrossRef] [PubMed]
  24. Berger, E.; Héraud, S.; Mojallal, A.; Lequeux, C.; Weiss-Gayet, M.; Damour, O.; Géloën, A. Pathways commonly dysregulated in mouse and human obese adipose tissue: FAT/CD36 modulates differentiation and lipogenesis. Adipocyte 2015, 4, 161–180. [Google Scholar] [CrossRef] [PubMed]
  25. El Kharbili, M.; Robert, C.; Witkowski, T.; Danty-Berger, E.; Barbollat-Boutrand, L.; Masse, I.; Gadot, N.; de la Fouchardière, A.; McDonald, P.C.; Dedhar, S.; et al. Tetraspanin 8 is a novel regulator of ILK-driven β1 integrin adhesion and signaling in invasive melanoma cells. Oncotarget 2017, 8, 17140–17155. [Google Scholar] [CrossRef]
  26. Berger, E.; Vega, N.; Vidal, H.; Géloën, A. Gene network analysis leads to functional validation of pathways linked to cancer cell growth and survival. Biotechnol. J. 2012, 7, 1395–1404. [Google Scholar] [CrossRef]
  27. Galbraith, C.G.; Yamada, K.M.; Sheetz, M.P.J. The relationship between force and focal complex development. Cell Biol. 2002, 159, 695–705. [Google Scholar] [CrossRef]
  28. Rebbeor, J.F.; Connolly, G.C.; Henson, J.H.; Boyer, J.L.; Ballatori, N. ATP-dependent GSH and glutathione S conjugate transport in skate liver: Role of an Mrp functional homologue. Am. J. Physiol. 2000, 279, G417–G425. [Google Scholar] [CrossRef]
  29. Li, L.; Lee, T.K.; Meier, P.J.; Ballatori, N. Identification of glutathione as a driving force and leukotriene C4 as a substrate for oatp1, the hepatic sinusoidal organic solute transporter. J. Biol. Chem. 1998, 273, 16184–16191. [Google Scholar] [CrossRef]
  30. Stegmann, M.; Metcalfe, C.; Barclay, A.N. Immunoregulation through Membrane Proteins Modified by Reducing Conditions Induced by Immune Reactions. Eur. J. Immunol. 2013, 43, 15–21. [Google Scholar] [CrossRef]
  31. Chigaev, A.; Zwartz, G.J.; Buranda, T.; Edwards, B.S.; Prossnitz, E.R.; Sklar, L.A. Conformational Regulation of α4β1-Integrin Affinity by Reducing Agents. J. Biol. Chem. 2004, 279, 32435–32443. [Google Scholar] [CrossRef] [PubMed]
  32. Ball, C.; Vijayan, V.K.; Nguyen, T.; Anthony, K.; Bray, P.F.; Essex, D.W.; Dong, J.F. Glutathione Regulates Integrin Alpha(IIb) Beta (3)-Mediated Cell Adhesion under Flow Conditions. Thromb. Haemost. 2008, 100, 857–863. [Google Scholar] [CrossRef] [PubMed]
  33. Zhang, K.; Pan, Y.; Qi, J.; Yue, J.; Zhang, M.; Xu, C.; Li, G.; Chen, J. Disruption of Disulfide Restriction at Integrin Knees Induces Activation and Ligand-Independent Signaling of α4β7. J. Cell Sci. 2013, 126, 5030–5041. [Google Scholar] [CrossRef] [PubMed]
  34. Deponte, M. The incomplete glutathione puzzle: Just guessing at numbers and figures? Antioxyd. Redox Signal. 2017, 27, 1130–1161. [Google Scholar] [CrossRef] [PubMed]
  35. Meister, A.; Anderson, M.E. Glutathione. Annu. Rev. Biochem. 1983, 52, 711–760. [Google Scholar] [CrossRef] [PubMed]
  36. Meister, A.; Tate, S.S. Glutathione and related γ-glutamyl compounds: Biosynthesis and utilization. Ann. Rev. Biochem. 1976, 45, 559–604. [Google Scholar] [CrossRef] [PubMed]
  37. Kumar, A.; Pareek, V.; Faiq, M.A.; Ghosh, S.K.; Kumari, C. Adult neurogenesis in humans: A Review of Basic Concepts, History, Current Research, and Clinical Implications. Innov. Clin. Neurosci. 2019, 16, 30–37. [Google Scholar] [PubMed]
  38. Brann, J.H.; Firestein, S.J. A lifetime of neurogenesis in the olfactory system. Front. Neurosci. 2014, 8, 812. [Google Scholar] [CrossRef]
  39. Stiess, M.; Bradke, F. Neuronal Polarization: The Cytoskeleton Leads the Way. Dev. Neurobiol. 2011, 71, 430–444. [Google Scholar] [CrossRef]
  40. Hashimoto, S.; Matsuba, Y.; Takahashi, M.; Kamano, N.; Watamura, N.; Sasaguri, H.; Takado, Y.; Yoshihara, Y.; Saito, T.; Saido, T.C. Neuronal Glutathione Loss Leads to Neurodegeneration Involving Gasdermin Activation. Sci. Rep. 2023, 13, 1109. [Google Scholar] [CrossRef]
Figure 1. Dose-dependent effects of GSH on 13s24 olfactory neuroblasts. (A) Real-time evolution of cell index in response to increasing concentrations of GSH. Cell index was normalized at the time of treatment. Data are presented as mean delta cell index ± SEM during time (n = 6). (B) Linear regression curve of mean delta cell index ± SEM, 8 h after exposure to GSH (n = 6). (C) Phase contrast images of 13s24 cells 8 h after treatment at objective ×4 and ×20.
Applsci 15 00908 g001
Figure 2. Kinetics of 13s24 cell morphological and behavioral parameters modified by reduced glutathione (GSH) using label-free imaging cytometry. Three different concentrations were tested, 1, 2.5, and 5 mM, over 24 h. (A) average area, (B) optical volume, (C) average optical path length, and (D) cell motility. In the left panels, results are presented as time-dependent mean values for thirty cells per well measured in five different wells. Standard error of the means are reported only for control and 5 mM GSH (for visibility). In the right panels, histograms present the mean values of 1 h at the optimal time of effect, indicated by a black line on the graph (23–24 h in (A,D); 11–12 h in (B,C)). Different letters indicate significant differences (ANOVA, PLSD, p-values < 0.05). (E) Representative image captures at 24 h for control and 5 mM GSH. Control scale from black to white indicates cell height.
Applsci 15 00908 g002
Figure 3. Time-lapse refractive images monitoring of 13s24 cells reveals ultrastructural modifications induced by GSH. (A) 13s24 imaging at objective ×60 at T0, 8, 16, and 24 h in absence or presence of GSH 5 mM. Upper line: refractive images. Lower line: colorized images according to their refractive index. (B,C) Graphical representations of the evolution of refractive index for control cells (B) and cells exposed to GSH 5 mM (C). Data are presented as mean pixel frequency according to refractive index values (n = 20 cells) in either control, 1, 2.5, or 5 mM glutathione. Arrows indicate turning points.
Applsci 15 00908 g003
Figure 4. Cell sorting analysis of 13s24 adherent cells 6 h after treatment with reduced glutathione (GSH) by flow cytometry. (A) Adherent cell counts; (B) control cells labelled with phalloidin–TRITC indicate the fluorescent population (gate) with central bracket indicating the mode of distribution (C) Cell size (forward-scatter—FSC); (D) phalloidin–TRITC fluorescence intensity in response to increasing GSH concentrations (n = 6). (E) Representative scatter plots with quartiles (Q). Different letters on the graphs indicate statistical differences at p < 0.05 (ANOVA, Fisher’s PLSD).
Applsci 15 00908 g004
Figure 5. Reduced glutathione (GSH) affects glycoprotein on the cell surface in a dose-dependent manner. (AD) Cell sorting analysis of 13s24 cells 6 h after treatment with several doses of GSH detected with extracellular binding with either concanavalin A (ConA)-Atto488 or ConA-AlexaFluor594 (ConA Total) (A). (B) Representative histogram of ConA Total cell distribution according to labelling intensity and the selection of fluorescent population (gate) with central bracket indicating the mode of distribution (C) Representative distribution of ConA Extracellular versus ConA Total in quartiles (Q) according to GSH concentrations. (D) Data are presented as regression curve using mean values of ConA-Atto488 fluorescence intensity ± SEM (6 replicates). (E) Cell imaging at objective ×20 of 13s24 cells 6 h after treatment with GSH 10 mM, labeled extracellularly with ConA-Atto488 (green) then, after permeabilization, with ConA-AlexaFluor 594 (red) and Dapi (blue).
Applsci 15 00908 g005
Table 1. Comparison of the main characteristics of different real-time measuring devices. (++ and +++ refer to medium and high level skill levels).
EquipmentCell Number MeasuredLabellingTime Sample PreparationTime of AnalysisResearcher Skill Level
xCELLigence103–105No labelling10 min/96-well plate5 min/plate0
HoloMonitor25–40/sampleNo labelling40–60 min/96-well plate5 min/well++
Nanolive1–5/sampleNo labelling5 min/sample5 min/sample+++
Disclaimer/Publisher’s Note: The statements, opinions and data contained in all publications are solely those of the individual author(s) and contributor(s) and not of MDPI and/or the editor(s). MDPI and/or the editor(s) disclaim responsibility for any injury to people or property resulting from any ideas, methods, instructions or products referred to in the content.