1. Introduction
The term “vibration measurement” is very general and requires further specification in terms of the recorded physical quantity, measurement method and evaluation parameter.
Firstly, it is necessary to clarify the physical quantity that will represent the vibrating motion. As in the case of any other motion, vibration is characterised by a certain displacement, velocity or acceleration. Therefore, whenever the term “vibration measurement” is used, it must be interpreted as a measurement of one of the aforementioned quantities. The choice of the quantity representing the vibrating motion should be based on the range of frequencies emitted by the tested vibrating object.
Then, it is necessary to determine whether the measured vibration is relative or absolute. Relative vibration is rolling bearing vibration measured relative to a fixed reference point. Absolute rolling bearing vibration can be recorded by using a vibration sensor fitted directly to the vibrating object. The sensor vibrates in the same manner as the bearing does and allows the vibration to be measured without the need for a reference point.
Bearing vibration can be measured in a manner that involves contact, or a manner that is contactless. Contact methods of measuring rolling bearing vibration involve the vibration sensor being in contact with the vibrating object. Contactless methods include measurement methods during which the vibration signal recording device has no physical contact with the tested object.
The bearing vibration evaluation parameter is a quantity calculated based on a raw signal. It is necessary to choose a parameter that will contain the maximum amount of useful information in terms of the research problem under consideration. There are many vibration evaluation parameters, including peak value, peak-to-peak value, average vibration value, the vibration’s RMS value, kurtosis, skewness, peak coefficient, and aspect ratio. Furthermore, artificial intelligence methods have recently been used to evaluate the research results [
1].
Bearing vibration measurements used in quality control aimed at detecting defective products should be regarded as a different problem from diagnostic measurements aimed at monitoring and detecting bearing damage and wear. Bearing vibration measurements related to these two aspects differ both in their objectives and in the methods used. In production measurements, a bearing straight from production is tested. It may only have discrete imperfections, which diagnostic models do not take into account. In production, electrodynamic sensors measuring vibration velocity are used and vibration is measured in a relative (indirect) manner. The bearing is left unbuilt and subjected to a relatively light axial load, with the RMS value of the vibration recorded in three frequency bands at a reference speed that strictly adheres to the recommended standards.
Diagnostic measurements, on the other hand, concern bearings at various stages of life, which are often damaged or worn out. Piezoelectric sensors measuring vibration acceleration are used and vibration measurement is carried out in an absolute manner. The tested bearing is built up and the load can be varied both axially and radially. A variety of analysis methods are used in diagnostics, with spectral analysis being the predominant technique and the speed depending on the specific application.
The vibration measurement result will be substantially affected by the recorded physical quantity, the measurement method and the given parameter. The issue of selecting these three parameters is universal and concerns the broad meaning of vibration measurement. However, in practice, there are additional metrological conditions and obstacles. Knowledge of the numerous issues related to the elusive dynamic quantity of bearing vibration allows for the identification of the highest number of bearing vibration measurement uncertainty components possible. Although this paper relates to the problem of measuring bearing vibrations in industrial plants, the knowledge is also relevant when carrying out diagnostic tests on rolling bearings [
2,
3,
4].
2. Rolling Bearing Quality Control
Although the individual components of the bearing are measured repeatedly within tight tolerances during the manufacturing process, unavoidable manufacturing and mounting errors in the individual bearing components mean that the bearing’s quality can only be fully assessed once the bearing has been assembled [
5].
In order to assess the quality of a rolling bearing, both production companies and independent laboratories must have precise measuring equipment that is adapted to trends in the bearing industry [
6]. Various techniques are used in the bearing industry to assess the quality of a manufactured rolling bearing, the most important of which are listed below [
7,
8,
9]:
Vibration measurement;
Thrust torque measurement;
Durability testing;
Measurement of rotation accuracy (the amount of instantaneous deviation of the bearing from its operating position;
Measurement of noise level;
Cleanliness test;
Testing of load-carrying capacity.
It must be borne in mind that the process of evaluating the quality of a bearing is complex and is strongly dependent on the requirements of the customer. Some procedures, such as vibration measurement, are always performed, while others are carried out only if specifically requested by the customer. Some procedures apply to the entire population of manufactured bearings, while others apply only to a specific statistical sample. Some procedures are destructive; others are not.
It should be noted at this point that the methods used in quality control procedures may differ from the techniques used in rolling bearing diagnostics [
10]. This difference is not only due to the measuring equipment or methods used, but may also relate to the interpretation and analysis of the measurement result. In production measurements, a bearing straight from production is tested, which may only have discrete imperfections, which diagnostic models do not take into account. In production, electrodynamic sensors measuring vibration velocity are used and vibration is measured in a relative (indirect) manner. The bearing is left unbuilt and subjected to a relatively light axial load, with the RMS value of the vibration recorded in three frequency bands at a reference speed strictly in accordance with the standards.
Diagnostic measurements, on the other hand, concern bearings at various stages of life, which are often damaged or worn out. In these methods, piezoelectric sensors measuring vibration acceleration are used and vibration measurement is carried out in an absolute manner. The bearing under test is built up and the load can be varied both axial and radial. A variety of analysis methods are used in diagnostics, with spectral analysis being the predominant technique and the speed depending on the specific application.
Hence, the paragraph highlighted states that although the article deals with production aspects, the knowledge can also be useful in diagnostic topics.
3. Materials and Methods
The manufacturing of rolling bearings involves several stages. These stages include the plastic processing, machining and heat treatment of particular bearing elements. The bearing’s assembly is the last stage of manufacturing [
11,
12]. The bearing manufacturing process is presented in more or less detail in specification and videos published on bearing manufacturers’ websites and is available in scientific publications [
13,
14].
Quality control takes place at many stages of production [
15,
16]. However, the most significant test for a manufactured bearing is the vibration control of the finished product, to which 100% of manufactured bearings are subjected. Vibration measurement is therefore the ultimate test for a manufactured bearing. This is because bearing vibration is proportional to the other parameters which determine bearing quality (thrust torque, noise, life, positioning accuracy, etc.) [
17]. It is therefore reasonable to assume: low vibration high quality, high vibration poor quality. Excessive vibration levels in rolling bearings have a negative impact on the operation of electric cars in particular [
18] and multi-bolted systems [
19].
The manufactured bearing components are delivered to the automatic production line, first being washed. Then, the inner/outer ring pairs are accurately measured on the line and, based on these results, balls are selected from the appropriate dimension group. This ensures that the finished bearings have the required internal clearance. The balls are placed inside the bearing with the outer ring deformed smoothly. After fitting the cage, the bearing is still washed in a liquid which also serves as a conservation lubricant. The assembled and washed bearing then goes on automatic vibration acceptance measurement.
The rolling bearing vibration measurement methodology is based on company procedures, which must comply with the standards of the ISO 15242 group [
20,
21,
22]. According to the measuring principle presented in the first part of the standard, the rolling bearing to be tested is placed on a measuring shaft matched to the size of the inner ring. This shaft is seated in a spindle which has a universal slot for shafts adapted to different bearing types. According to the standard, the rotational speed of the shaft, and consequently of the bearing inner ring, should be 1800 rpm. This is a reference speed closely related to the three analysed frequency bands: low 50–300 Hz, medium 300–1800 Hz and high 1800–10,000 Hz. By agreement between the manufacturer and the customer, the speed can be changed and, where appropriate, be 3600 rpm, 900 rpm or 700 rpm. In such cases, the bands’ limits will also change.
Proper vibration measurement requires axial loading of the bearing under test. This is achieved by a mechanical or pneumatic pusher (usually three-pronged) in contact with the bearing outer ring. The clamping action keeps the outer ring from rotating. The force of the pusher depends on the type and size of the bearing and is also regulated by standards. Usually, the pushers are suitably adjustable, interchangeable or, within certain limits, universal to match the size of the bearing under test. The radial vibration of the operating and loaded bearing is recorded through an electrodynamic vibration velocity sensor in direct contact with the fixed outer ring. The sensor is mounted in a holder above the bearing, which has the ability to move it in two axes. The exact position of the sensor stem is also governed by the aforementioned standards. The measurement principle described is based on the procedures used in practice in bearing manufacturing plants, which are in accordance with the applicable standards [
20,
21,
22]
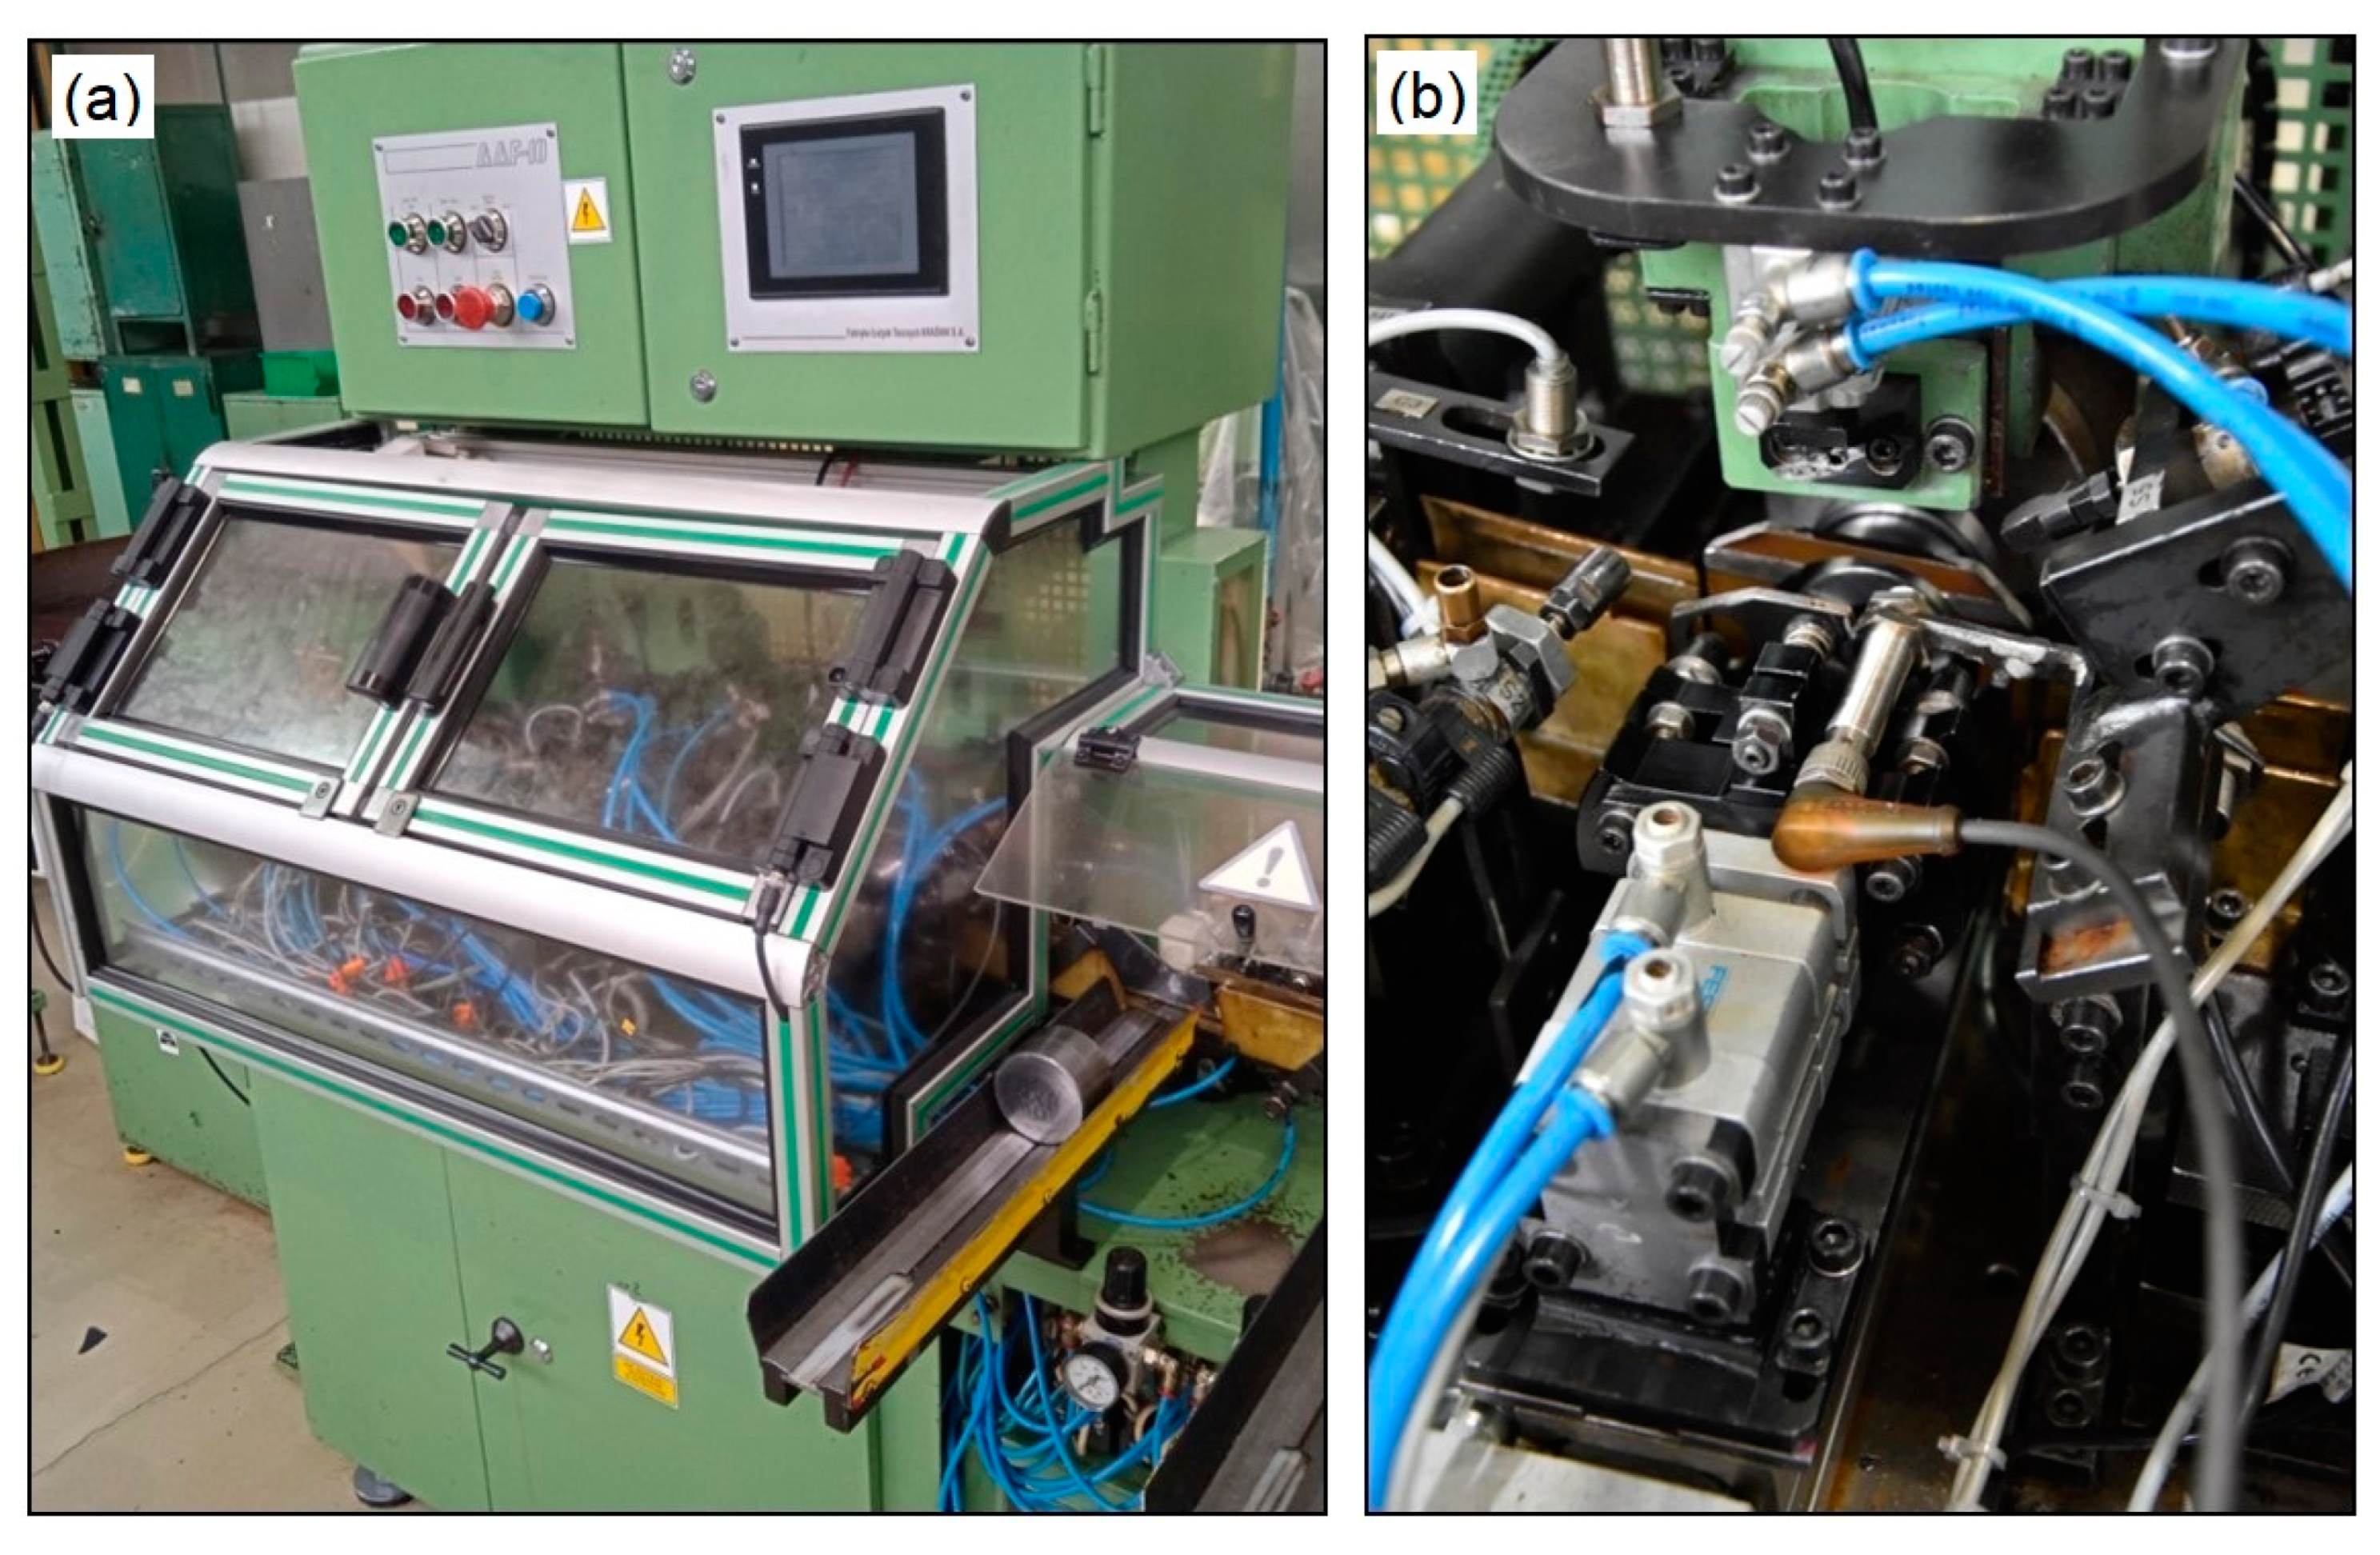
Figure 1a shows a section of the production line where the quality assessment of the manufactured bearings is carried out.
Figure 1b shows the test head of the automatic production line. Visible is the trough inside which the bearings move and the pneumatic actuator that places the bearings on the test shaft. Also visible above the bearing under test is the vibration sensor mounting assembly [
23].
On the basis of the obtained signal, the RMS value of vibrations in three filtered frequency bands is calculated: low frequency range 50–300 Hz, medium frequency range: 300–1800 Hz and high frequencies 1800–10,000 Hz.
The rolling bearing generates a very wide spectrum of vibrfigation frequencies. Separating the signal into three separate bands firstly increases the chance of detecting abnormalities in the bearing under investigation, and secondly helps to pinpoint the presumed cause of increased vibration, as each band is assigned different potential faults. For example, in the low-frequency band we can detect ball diameter difference, ring roundness defect, in the medium-frequency band damage of a ball or inner raceway and waviness errors of mating surfaces, while in the high-frequency band such defects as too high surface roughness of a ball or raceway, contamination and lubrication errors are revealed.
The measurement time should be no less than 0.5 s (for 1800 rpm), and the measurement itself should be performed after the readings have stabilised (the variation in the result should be caused by fluctuations and not by the unstable dynamic state of the bearing associated with the start of ball and raceway mating or by insufficiently distributed lubricant yet).
A special industrial unit has been introduced for the evaluation of vibration levels. The value of the quantity Anderon is determined by the limiting frequencies of the bands used. This unit is closely related to the rotational speed used (in industrial measurements, the rotational speed of the shaft, and therefore in effect the inner ring of the bearing, is strictly defined and is 1800 rpm):
where:
fh—highest frequency in the band,
fl—lowest frequency in the band.
Some companies check the vibration of bearings that have already had grease applied. Measuring greased bearings reflects the actual future behaviour of the manufactured bearing. However, some companies test bearing vibrations before applying a portion of grease. In this case, the mating surfaces are only covered with a thin layer of oil. This is preferable because if the vibration level of the unlubricated bearings does not exceed the critical level, it will even less so after the application of the lubricant (the lubricant additionally dampens the vibrations).
There are usually three vibration measuring stations at the end of each production line. Two of these are typically working and are used to measure all finished products about to leave the plant. A bearing leaving the line is automatically placed on one measuring device and, after measuring one side of the bearing, is placed on the other in a reverse manner. Measuring two sides of the bearing on two stations is simpler to automate. This also reduces the inspection time on the line. In many cases the line clock of vibration measuremnt is approximately 8 s. A third device at the end of the line is used to recheck (manually) any rejects from the automatic inspection. In addition, there are additional manual devices in the laboratories of industrial companies already used for in-depth inspection of bearings, checking new developments or statistical studies. Examples of laboratory devices are presented in
Section 4.
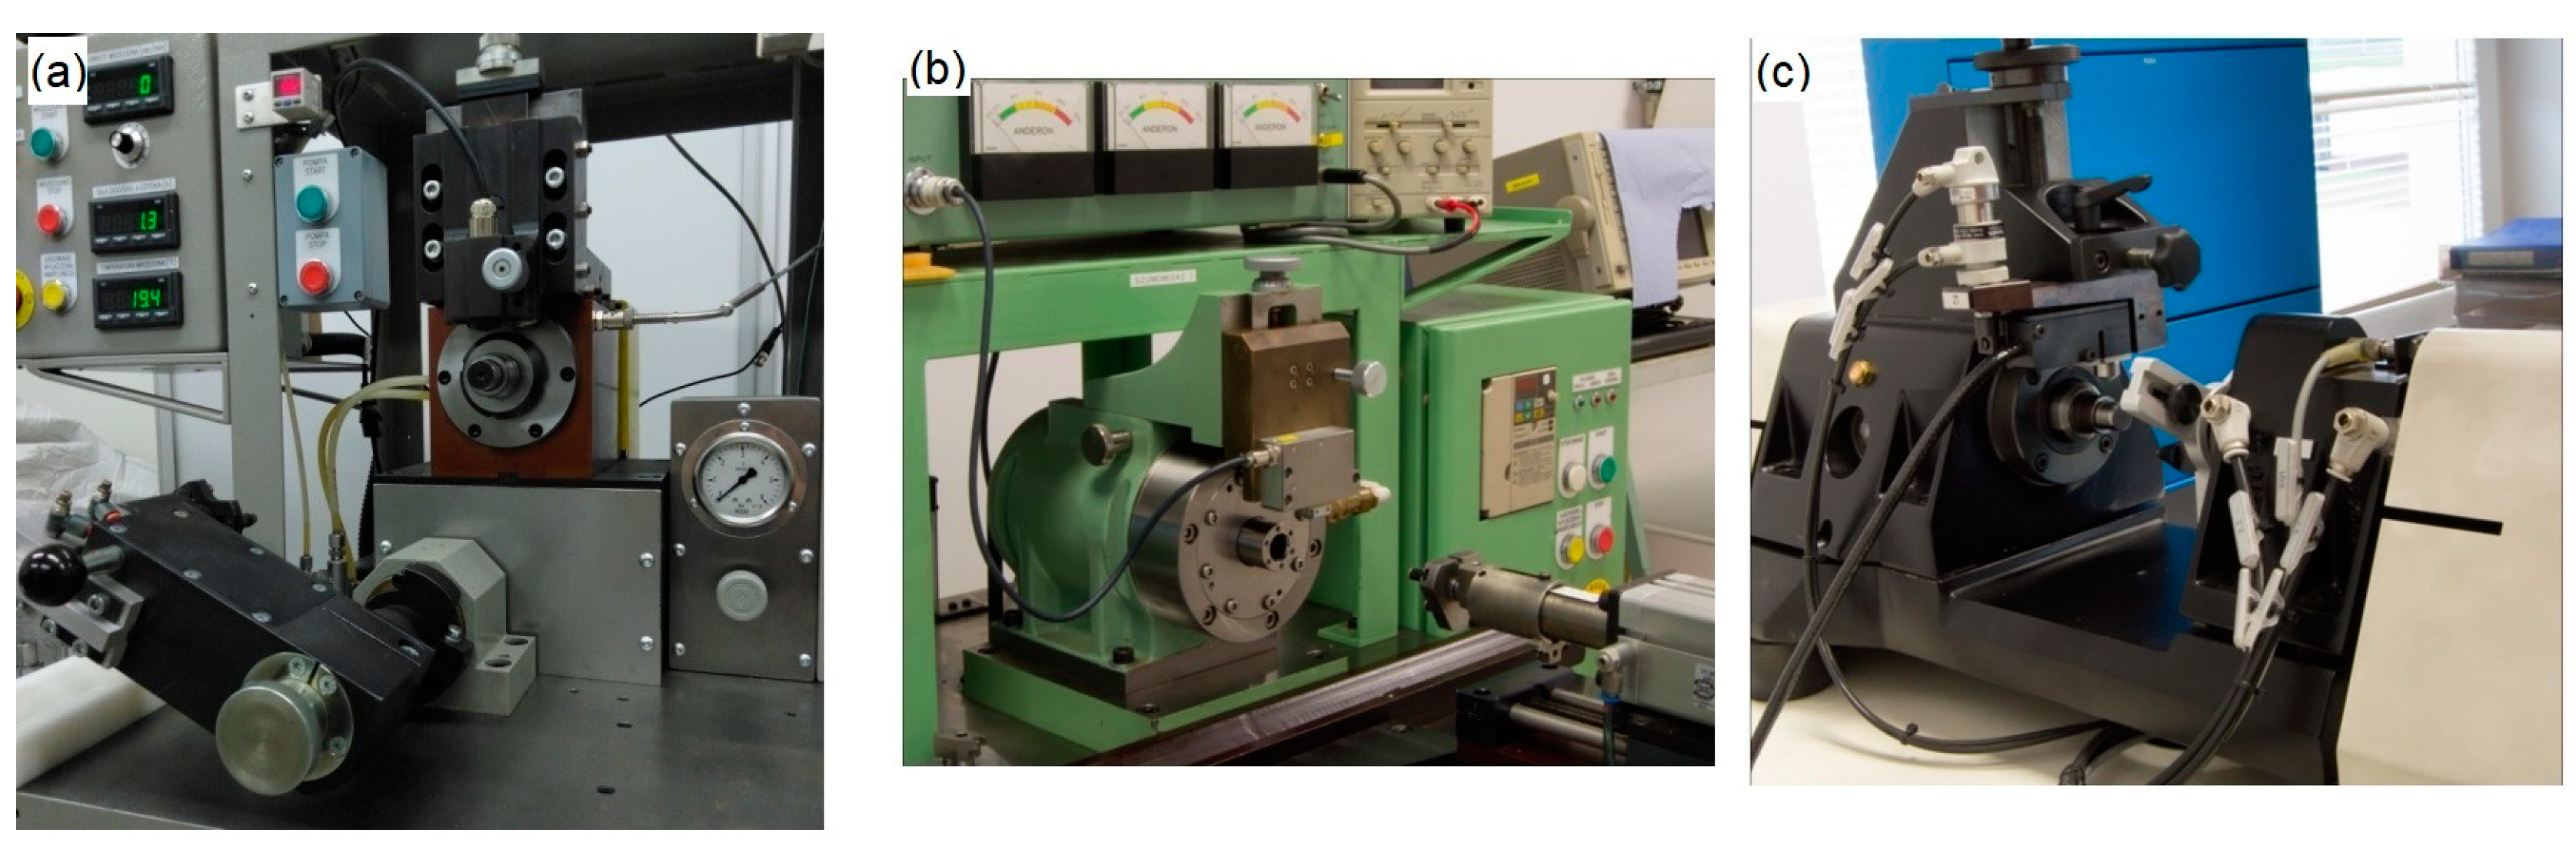
In order to illustrate the resulting difficulties when comparing several systems, an experiment involving a series of 50 measurements of the same bearing type 6205ZZ, on the same side, at the same point on the outer ring’s circumference, on three different measurement stations, was conducted. The tested systems were built by three different entities and differ in some design solutions. The comparison of the three systems used in the test is presented in
Table 1. The systems examined are presented in photographs in
Figure 2.
4. Results and Discussion
The following commonly used statistical parameters were calculated for a population of data specific to each system: arithmetic mean, mean square deviation for a single measurement, spread and final result of a single measurement with a probability of 0.95.
Arithmetic mean and mean square deviation are the most common indicators of the position and variability of a population of measurement variables. The arithmetic mean is an estimator of the expected value of the distribution of a characteristic in the population. It can be used to estimate the expected mean outcome of a random experiment when repeated many times. The mean square deviation is an estimator of the standard deviation. The standard deviation is a measure of the dispersion of the results around the expected value. The spread characterises very well the area of variability of the attribute under study, taking into account only the extreme results (minimum and maximum). The final result of a single measurement is included in the article to make it easier to visualise the result obtained and its uncertainty associated with the statistical analysis of a series of measurement results [
24,
25,
26].
Furthermore, the spread asymmetry expressed with the skewness parameter and the spread flattening expressed with kurtosis were tested. The statistic χ
2 was calculated and compared with the critical value selected from the spread χ
2 tables to check the obtained spreads’ conformity with the normal spread. The obtained spreads’ parameters are presented in
Table 2,
Table 3 and
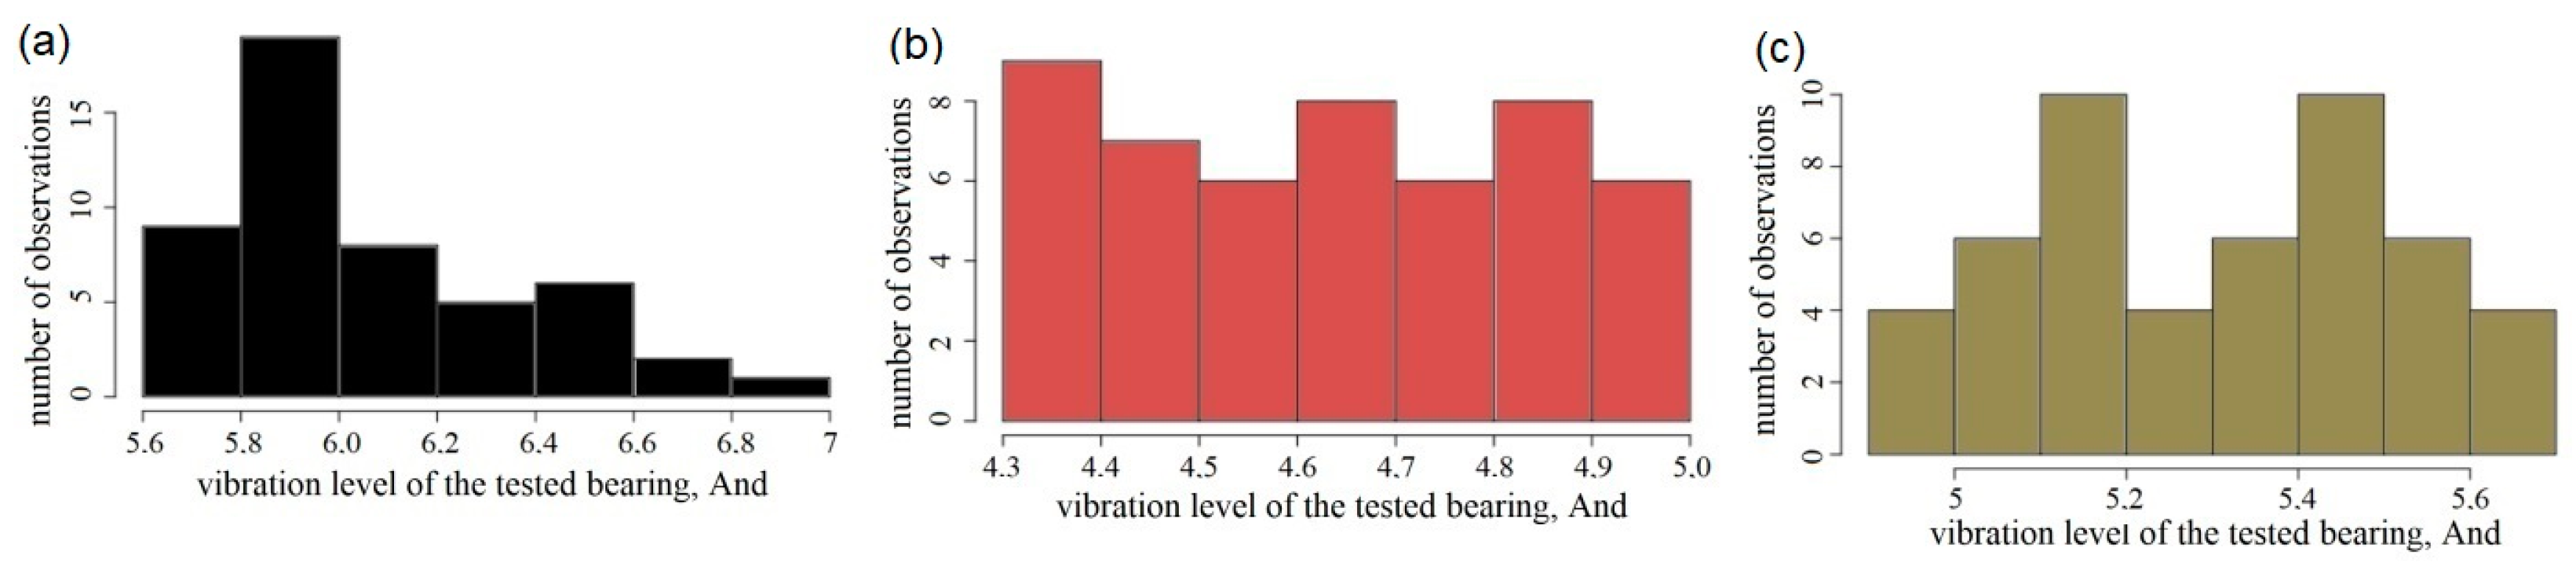
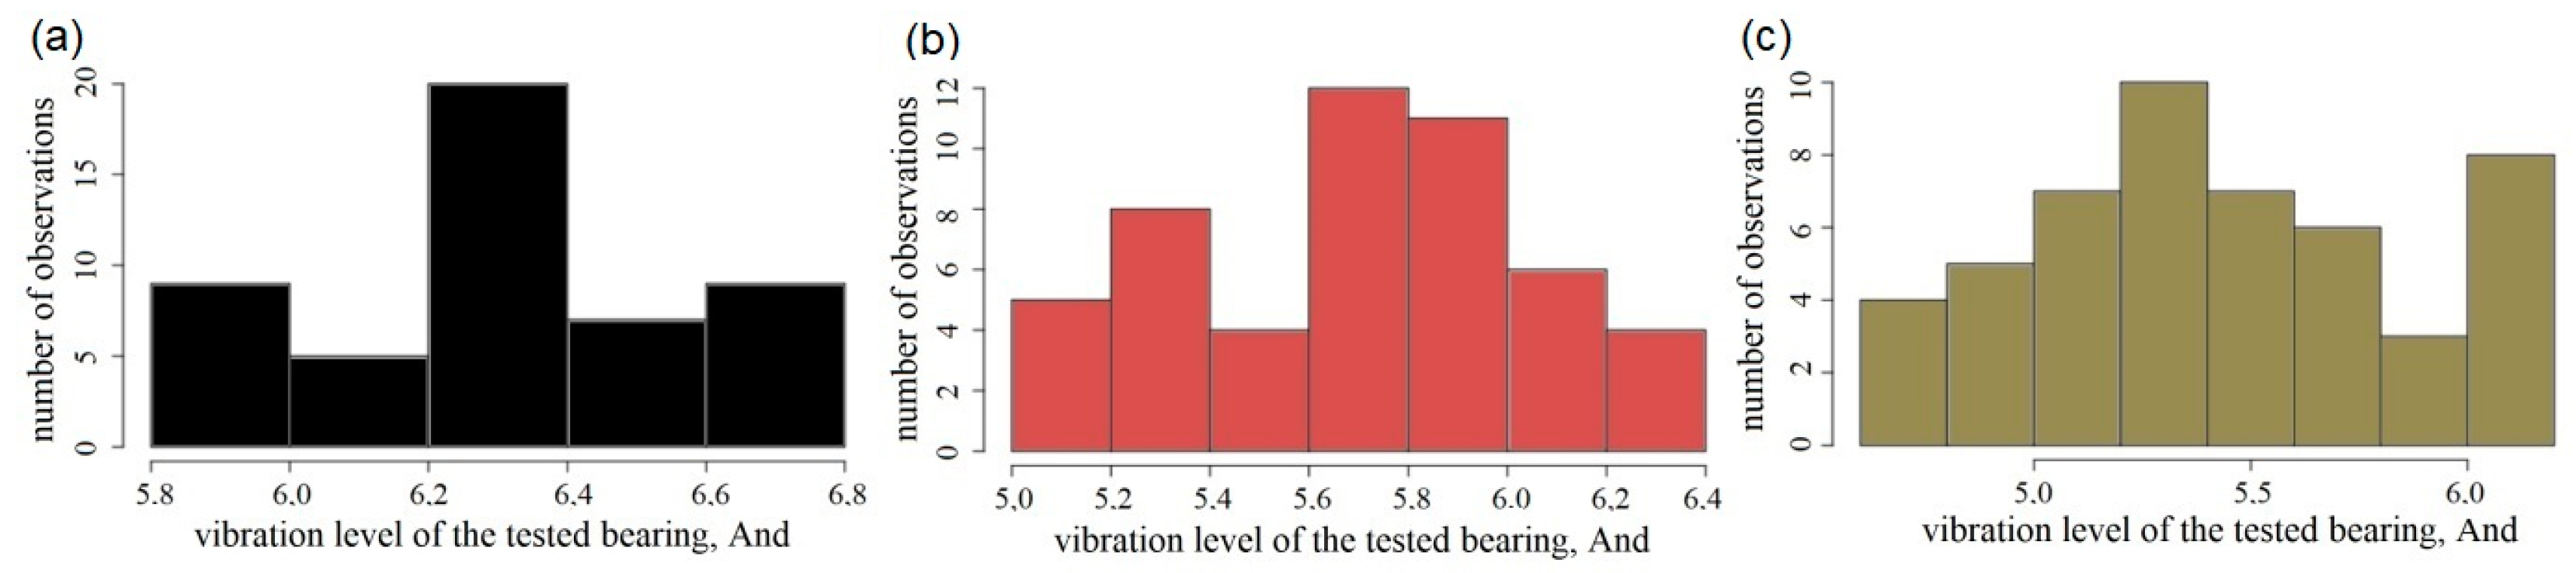
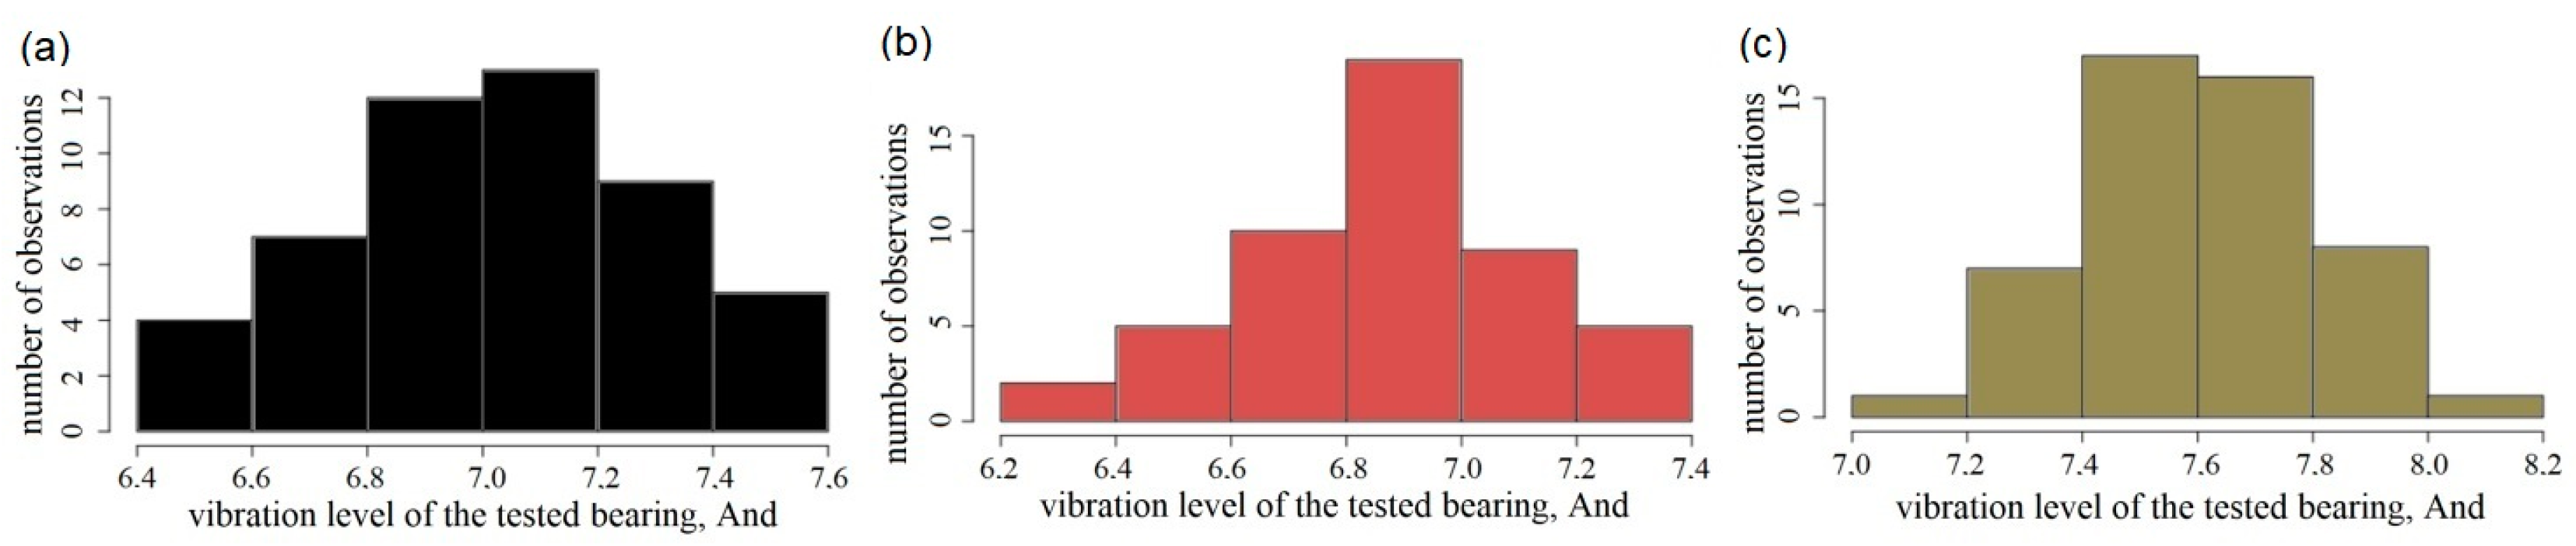
Table 4, while the result histograms divided by frequency bands are presented in
Figure 3,
Figure 4 and
Figure 5. The available statistical data (aside from determining individual features of the measurement series’ spread for each system) also allow for conducting comparative tests between the spreads’ most important parameters, such as the arithmetic mean or variance. Two additional tests were also conducted in the analysis: a comparative test of two mean values from two populations and a comparative test of variances from two populations with normal spreads. The results of the comparative test of mean values of all combinations of the three tested systems, conducted for three frequency bands, are presented in
Table 5. The statistic’s critical value was chosen based on the adopted probability
p = 0.95. The results of the comparative test of mean values of all combinations of the three tested systems are presented in
Table 6. The statistic’s critical value was chosen based on the adopted probability
p = 0.95 and the degrees of freedom related to the size of the measurements.
Due to the fact that the calculated statistics χ2 (which are decisive for treating a spread as normal) were based in the critical area for all systems in the low frequency band, this band was omitted during the presentation of the variance comparison results. In the case of results obtained in the medium frequency band, more similar arithmetic means of vibration levels were received for systems 2 and 3, whereas in the high frequency band, more similar results were received for systems 1 and 2. It is also possible to note the lack of consistency for the maximum and minimum values indicated by the systems. The value chronology of the obtained results also differs depending on the analysed band. However, it is difficult to take into account the differences in arithmetic means as the correct vibration level of the tested rolling bearing is unknown. The same value is measured in theory (assuming that the balls, cage and inner ring generate the same vibration with each rotation). It is therefore possible to assume that the lower the measurement results’ spread and range, the higher the system’s fidelity. However, it is very probable that a different station has higher fidelity depending on the current frequency band (as in the case of the presented experiment). System 1 is characterised by a lower result spread and deviation in the medium band, system 2—in the low band, whereas system 3—in the high band. It is also probable that the result can change in terms of scale and nature of these differences when a different bearing is measured. If a higher number of systems is included in the testing, comparing them will be even more difficult.
The test χ2 conducted individually for each system and frequency band demonstrated that there is no reason not to treat the spreads obtained in the medium and high frequency bands as normal. The result of test χ2 in the low frequency band for all systems also demonstrated that the measurement data are not distributed according to a normal spread. It is possible that the mechanical arrangement specific to each system distorts the spread of the obtained results in the low frequency band. Each design interferes with the results in a different way. When viewing the histograms obtained for the low frequency band, it is possible to note that the data spread for system 1 resembles a left skewed spread, while for system 2—an oblong spread, and for system 3—a bimodal spread. When compared to the low band, the medium frequency band results deviate more from the norm mainly due to the relatively high spread flattening, confirmed by the negative kurtosis (which deviates substantially from 0). The conducted tests to compare the mean values point to the issue that different systems achieve similar results for the same quantity. No value of statistic U was outside of the critical area. It is also worth mentioning that in the variance comparison test, the differences in the spreads of systems 1 and 3 are irrelevant, they are only relevant for system 2.
The tests presented in the next two chapters were carried out on System 1. A lot of academic research work on rolling bearings is carried out on this system, including: [
27,
28].
4.1. Repeatability and Reproducibility of the Bearing Vibration Measurement Result
The analysis conducted in this subchapter is based on the procedures specific to method R&R. The analysis of repeatability and reproducibility (R&R) is a component of the MSA (Measurement Systems Analysis). MSA is a method of assessing the quality and reliability of measurement systems, which is used to identify and remove measurement errors resulting from measurement system variability. In short, analysis R&R allows for analysing the impact of selected factors of an industrial measurement system on the measurement results’ variation [
29,
30]. The main purpose of using analysis R&R is to identify the reasons for the measurement process’ variation. The analysis should result in the minimisation of these reasons.
The testing conducted in this chapter involved 9 measurements of a single bearing in 3 series featuring 3 measurements. Each series was preceded with the bearing’s placement on the verified device, while each measurement in a series was preceded by a clamp release and application. Each measurement was conducted at the same point on the outer ring’s circumference. The order of procedure was as follows: the bearing’s inner ring was fitted to the spindle’s rotating shaft to enable contact between the outer ring and the sensor’s pin at a specific point.
The first measurement was conducted after the bearing was loaded with the force applied by the clamp (selected for the given type). Then, the clamp was released and applied again to conduct the second measurement without changing the outer ring’s position in relation to the sensor. The third measurement conducted at the same point was also preceded by the clamp’s release and repeated application. The tested bearing was removed from the shaft after a series of three measurements. The same measurement sequence was used when the bearing was fitted onto the shaft for the second and third time. The testing was conducted on 10 ball bearings type 6305. The methodology specified above allowed for obtaining 90 measurement results. Only damaged bearings were included in the testing.
The structure of the experiment for rolling bearing vibration measurement systems allows for the adoption of the following definitions:
Repeatability EV (Equipment Variation) will be the degree of conformity of subsequent rolling bearing vibration measurements taken without removing the bearing from the device’s measuring shaft, whereas the reproducibility will be interpreted as the degree of conformity of subsequent vibration measurements when the bearing is removed from the device’s measuring shaft and then fitted again. It is necessary to note that the bearing vibration measurement is always taken on the same side when the electromagnetic sensor’s pin is in contact at the outer ring’s same point. However reproducibility AV (Appraiser Variation) is in the average of measurements made by different appraisers using the same instrument when measuring the identical characteristic on the same part. The analysis results are presented in
Table 7.
The MSA analysis assumes that the value R&R is expressed as a percentage and is used as basis for specifying the tested system’s efficiency. In the standard method, the calculation of coefficient R&R expressed as a percentage is done by division of the obtained parameter R&R by the designated process variation related to the standard deviation or by the manufactured product’s design tolerance zone. The international standards do not clearly specify the limits obtained in vibration level quality control, for instance depending on the bearing type. Bearing manufacturing plants regulate these limits themselves, also based on customer requirements. For the purpose of this testing, it was decided to adopt the following limits: low frequency band (50–300 Hz)—20 And, medium frequency band (300–1800 Hz)—12.6 And, high frequency band (1800–10,000 Hz)—9.8 And. The R&R percentage values presented in
Table 7 were obtained by division of the resulting repeatability and reproducibility by the tolerance range in the given band. The quotient result is multiplied by 100% and the interpretation of the results of value %R&R is presented as follows: lower than 10%—acceptable measurement system; between 10% and 30%—the system can be accepted conditionally; higher than 30%—the measurement system cannot be accepted, improvement required.
The results demonstrate that the repeatability, i.e., the variation caused by the clamp, is between 1.36 and 1.75 And, depending on the band. Reproducibility, i.e., the variation caused by the fitting, varies between 1.02 and 1.77 And, depending on the band. Both parameters are higher in higher bands. The resulting R&R value constitute a substantial part of the vibration level tolerance field in the high frequency band (25.42%) and a rather substantial part of tolerance in the medium frequency band (15.7%). The variation caused by the clamp and fitting has the least impact on the low frequency band (8.5% of the total vibration level tolerance field in this band).
4.2. Influence of Measuring Point on the Result of Rolling Bearing Quality Control
The end of each bearing manufacturing line features two devices that verify the bearing in terms of generated vibration: on the first device, the measurement is conducted on one of the sides, while on the other device, the same bearing is fitted inversely and tested again. This allows for obtaining general information on the manufactured bearings and verifies the entire technological process. From a metrological point of view, a single measurement for each side (which in essence must be treated as a different measurement object) is not sufficient to obtain important information about the tested bearing. The testing of the accuracy of rolling bearing vibration measurement systems requires an increase in the number of measurements and measurement points along the outer ring’s circumference. When conducting a series of measurements at different points along the outer ring’s circumference, it is possible to observe the result’s dependency on the sensor’s application point.
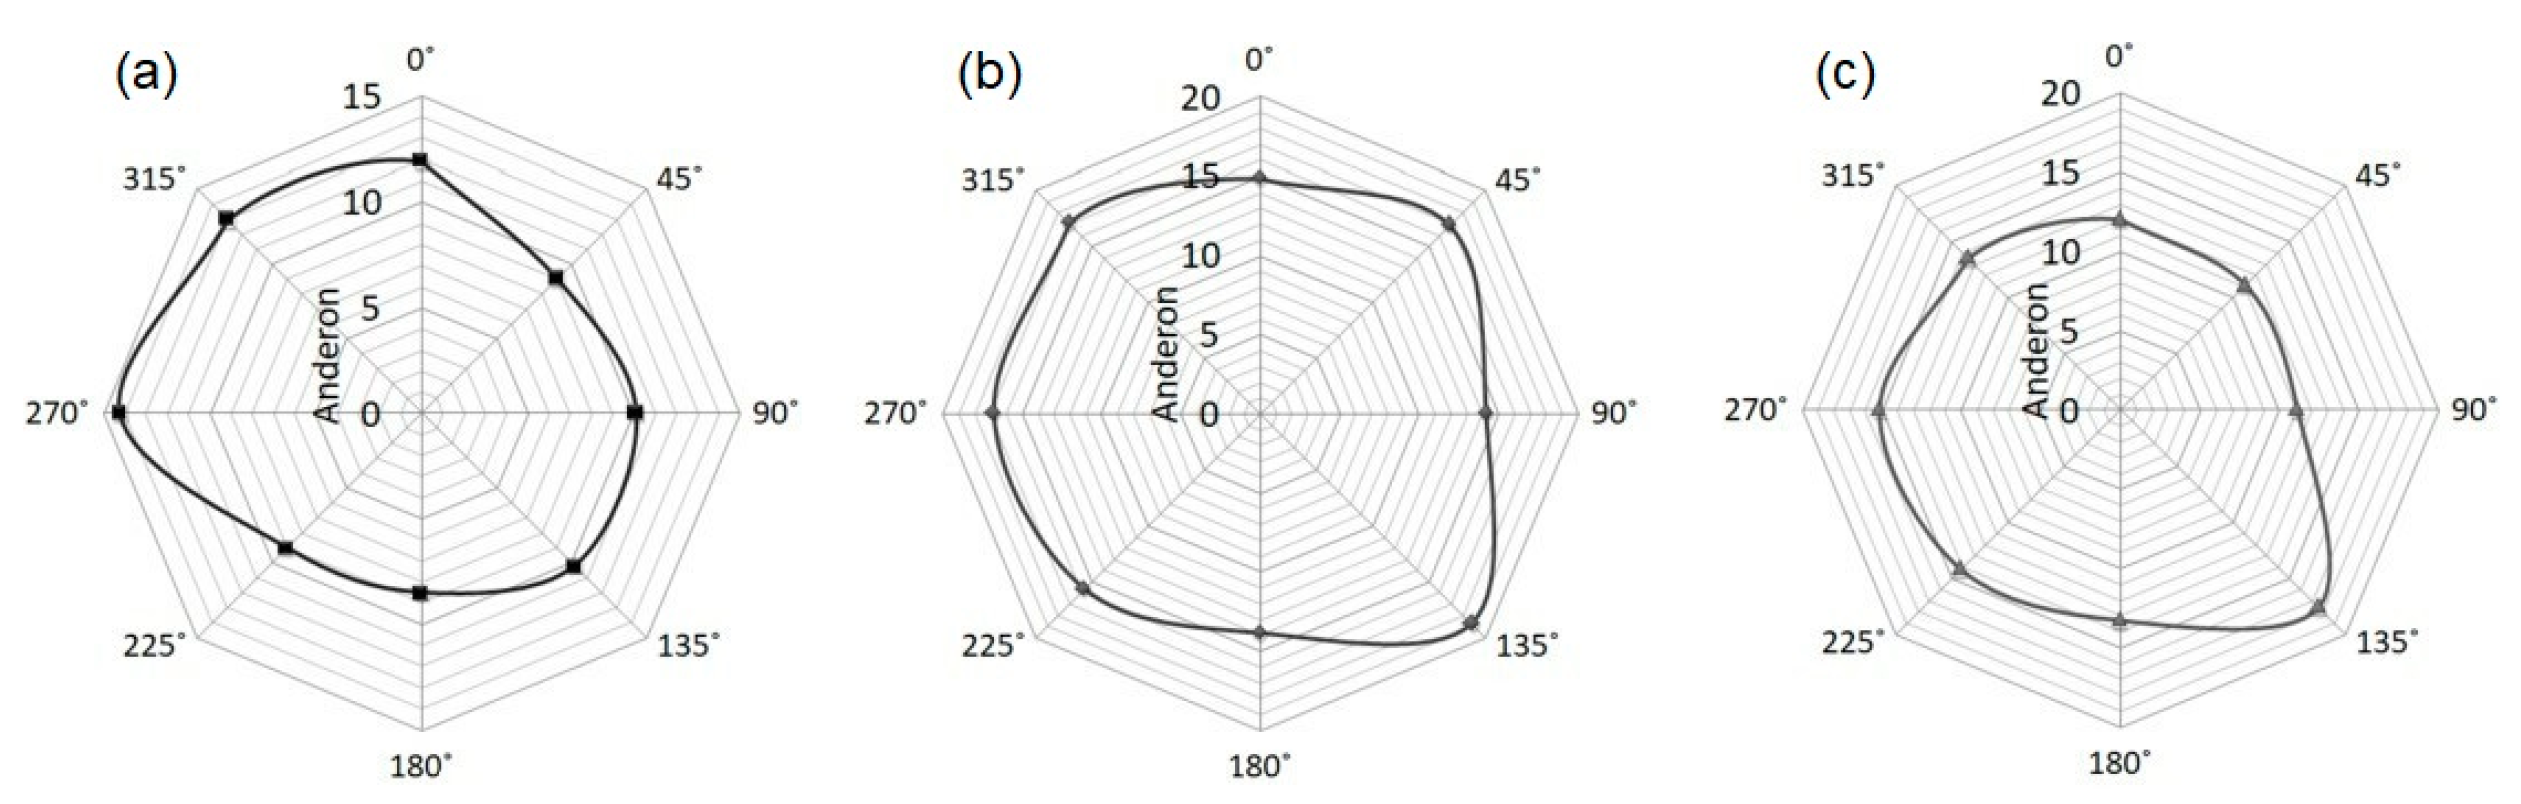
In this case, testing was conducted on 12 bearings with different technical conditions: 4 bearings without substantial manufacturing defects or damage, 4 bearings with the inner race’s manufacturing imperfections and 4 bearings with local operating damage on the outer race. Eight equally spaced measurement points (every 45°) were marked along the circumference of each bearing’s outer ring. Three measurements were conducted at each point.
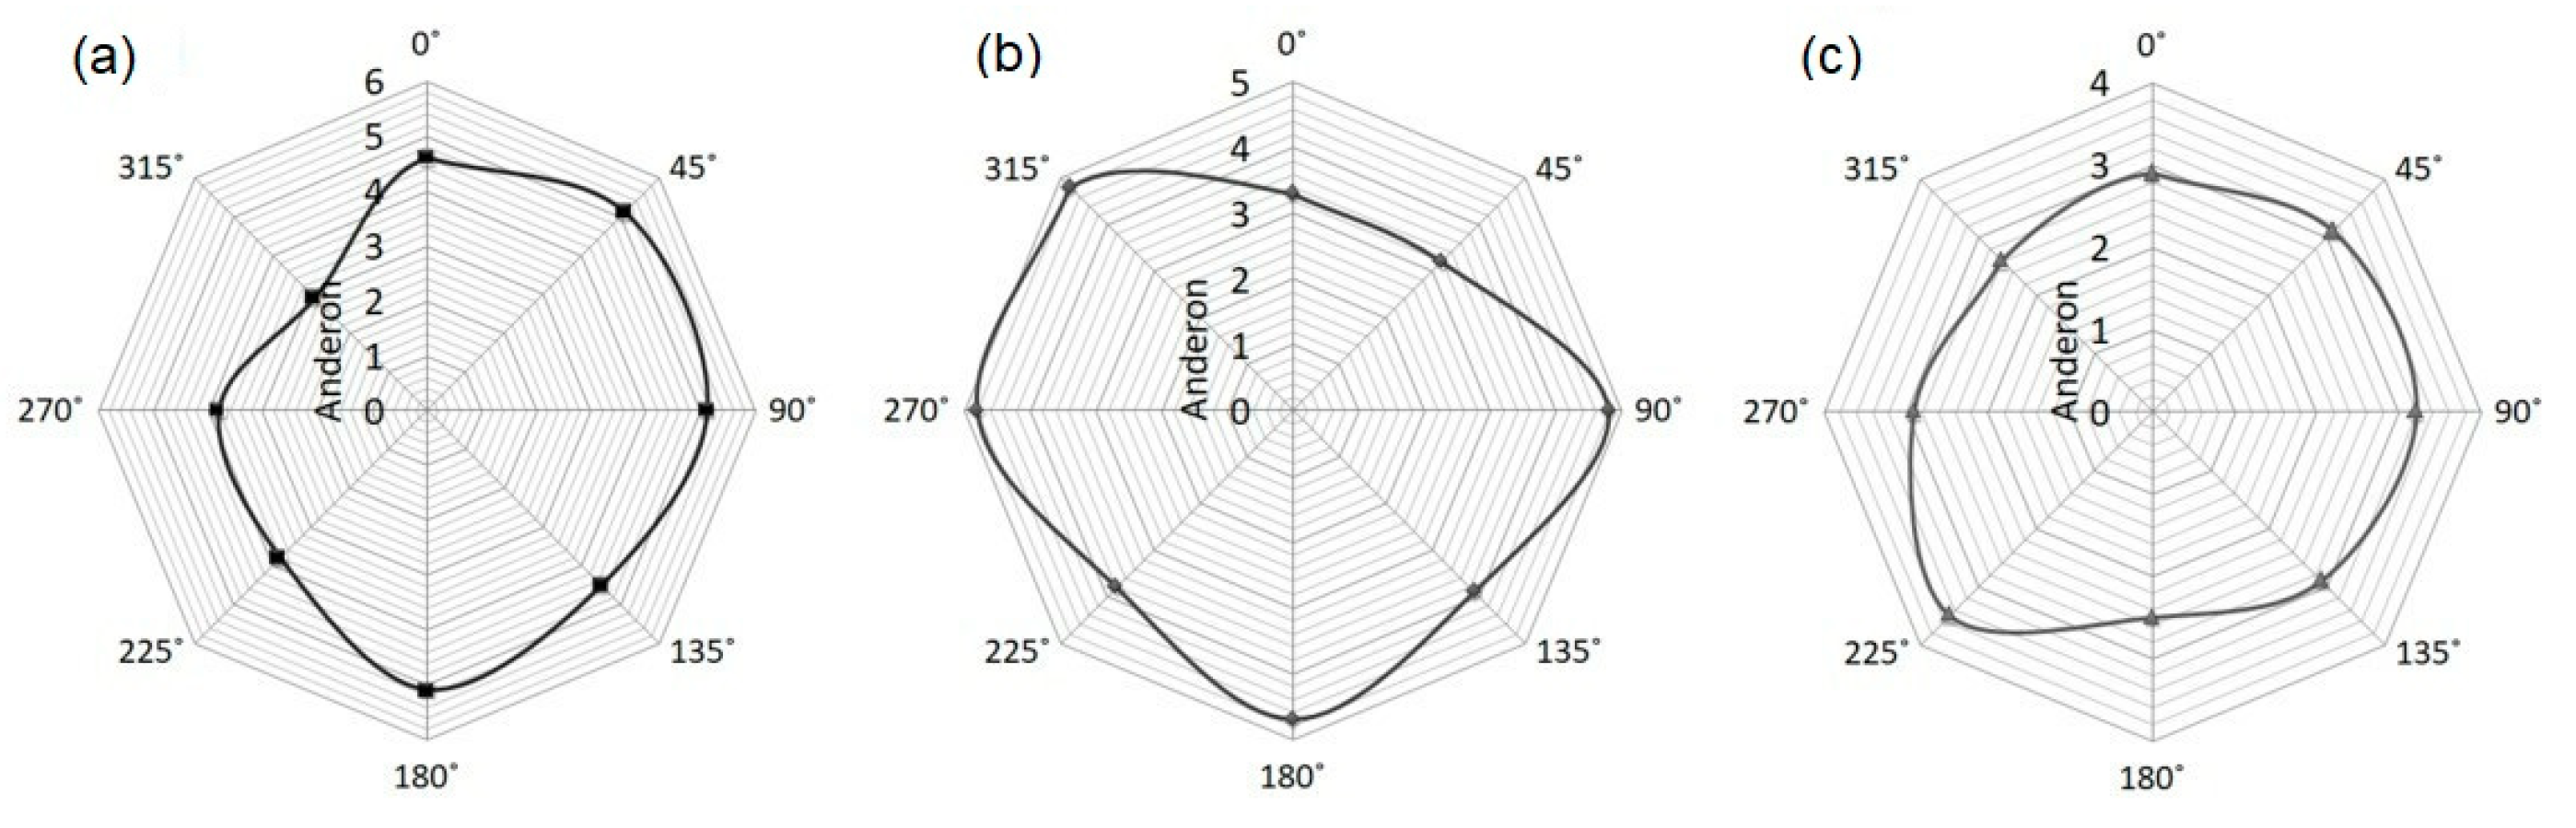
Thanks to this methodology, it is possible to obtain plots in polar coordinates that demonstrate the result’s variation depending on the outer ring’s measurement point. Selected results are presented in
Figure 6,
Figure 7,
Figure 8 and
Figure 9. The type and location of the defects assigned to the tested bearings were detected on three different test devices. The result of the vibration measurement at the bearing’s given point depends mainly on the geometrical structure of its outer ring’s race. This results from the fact that this point is stationary as a point of contact with the sensor. Other rolling bearing components (inner ring, cage and balls) perform periodic rotating motions. The impact of other factors, such as grease, contamination or random errors, should be very similar at all measurement points and be distributed evenly along the entire circumference. The scale of the result’s variation will be best described in this case by a spread of mean results for each measurement point. The result’s variation is illustrated well by the plots showing the RMS value of the vibration velocity expressed in Anderons, obtained depending on the sensor’s application point. The results are presented in three frequency bands.
Figure 6 presents the variation of the result for an efficient bearing. In this case, the vibration level is low (does not exceed 6 And in any band). The spread of result at various points along the outer ring’s circumference fluctuates from 1 to 2.2 And depending on the frequency band. On the other hand,
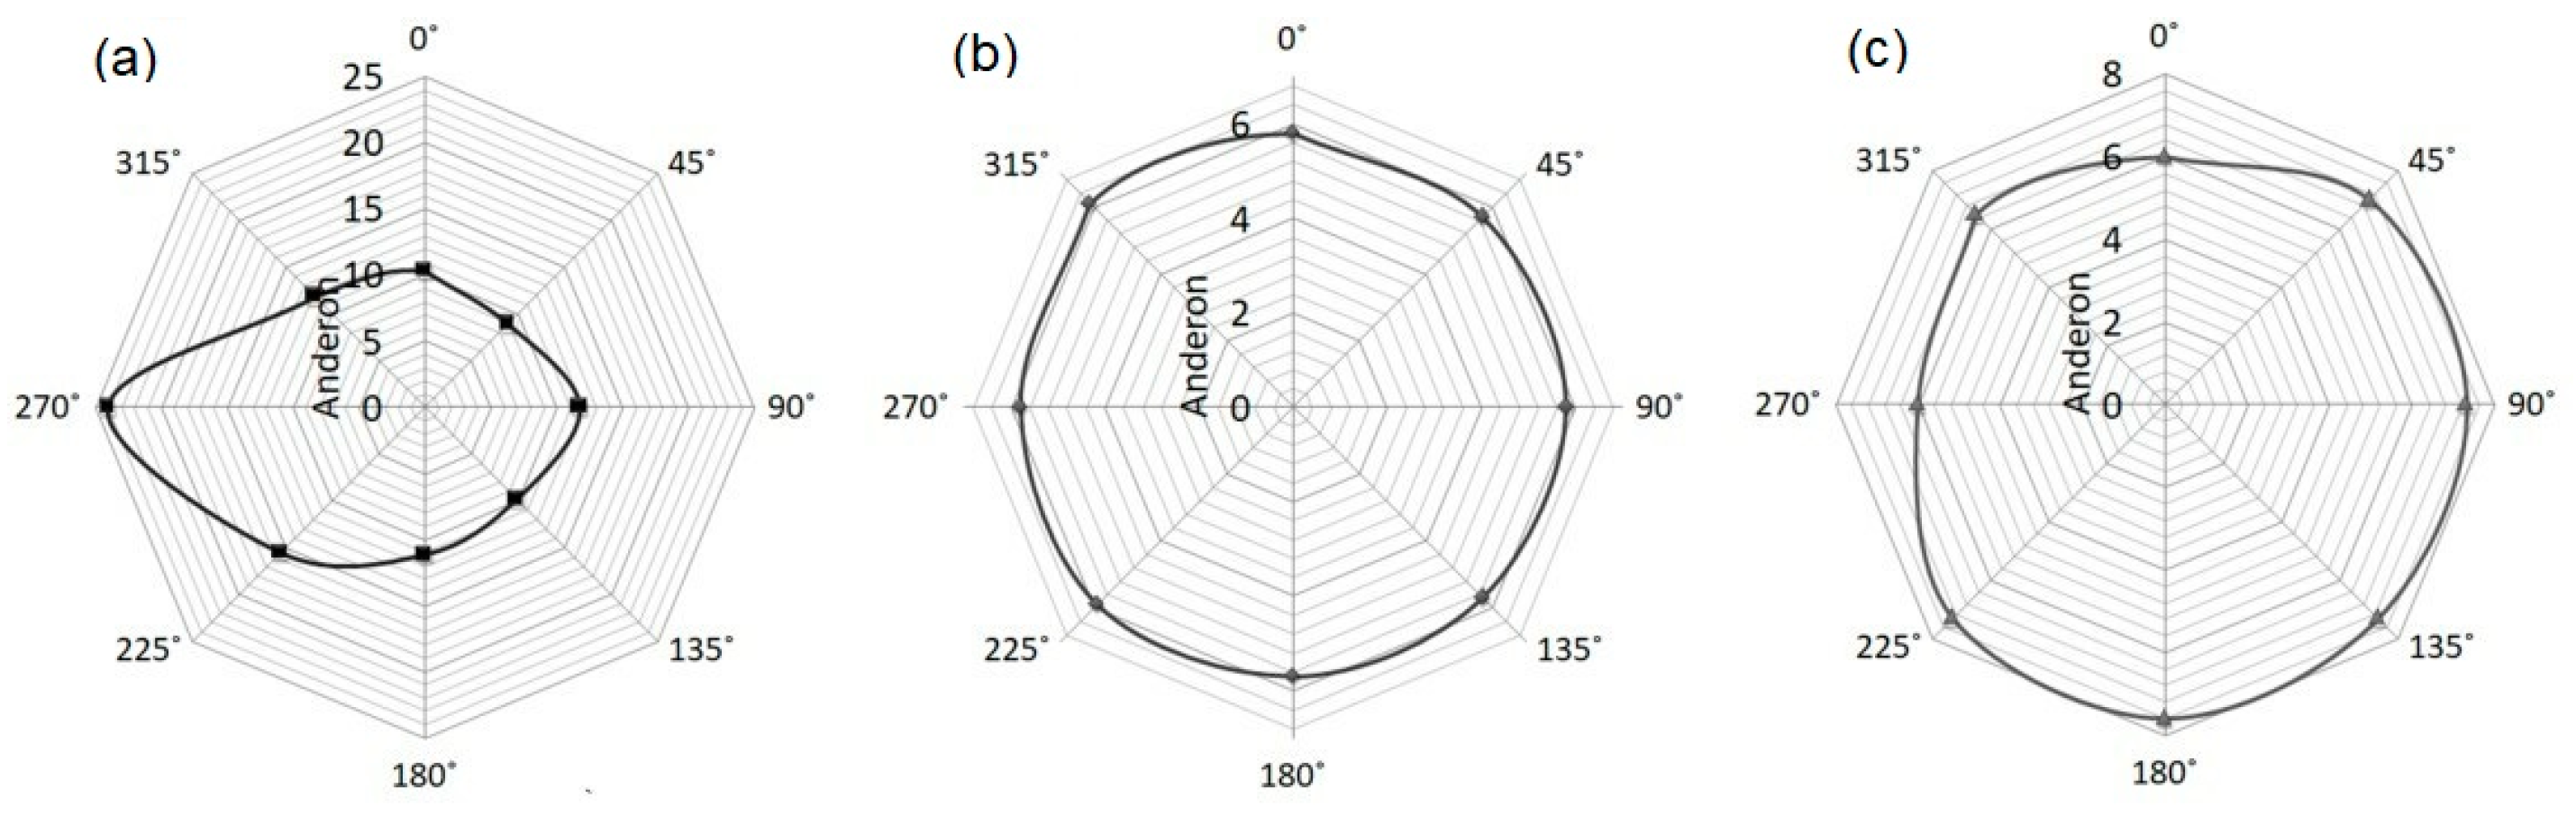
Figure 7 and
Figure 8 present the measurements of bearings with substantial outer race damage. In the first case, it is local damage, while in the second case, it is a local geometrical structure alteration. In
Figure 7a, it is possible to note a drastic change in the vibration level in the low frequency band when applying the sensor to the point designated as 270°. Changing the sensor’s application point can result in a spread of over 15 And. However, the damage does not affect other bands.
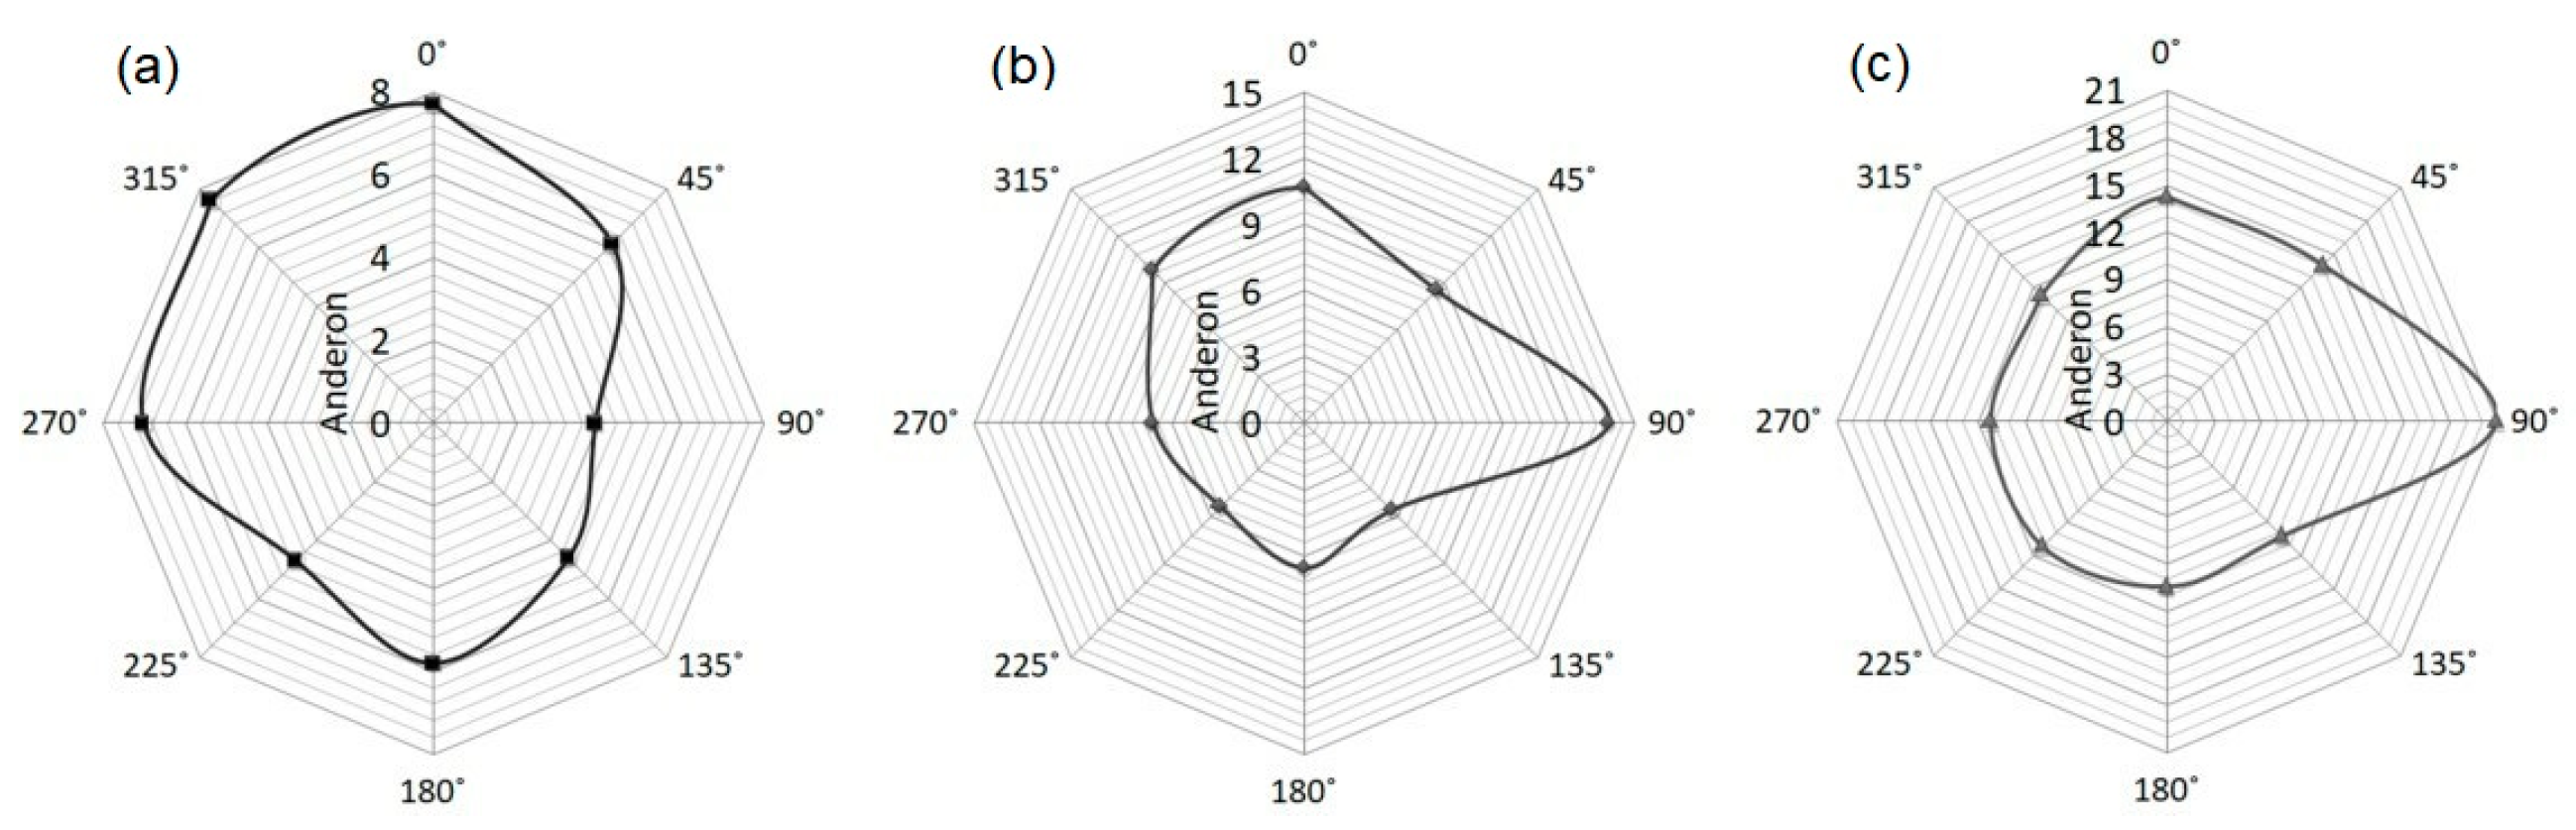
Figure 8 presents a situation in which the device type substantially affects medium and low bands. It is possible to observe a substantial result change near the local surface alteration on the outer ring (point marked as 90°), resulting in a spread of over 8 And in the medium band and over 10 And in the high band. This device type has less impact on the result’s variation in the low band.
Figure 9 presents the impact of the sensor’s application point on the measurement’s result for local inner race damage. It is possible to observe an increased vibration level in each band, but the results are distributed relatively evenly, resulting in a result spread of 5–6 And.
Table 8 presents the obtained vibration measurement result spread at 8 evenly spaced points on the outer rings of 12 rolling ball bearings.It is possible to note that damaged bearings (especially bearings with an outer ring defect) generate a more varied vibration level depending on the sensor’s application point. Occasionally, it is a substantial limit percentage. It must be noted that bearings designated with numbers 9, 11 (low band), 8, 12 (medium band) and 6, 10 (high band) can undergo or not undergo quality control depending on what point on the outer ring’s circumference they are tested on (taking into account the limits adopted in the previous chapter).
In
Table 9, it is possible to note the spread of a series of 20 measurements of bearing 6206 at the same measurement point. After each measurement, the load was removed from the bearings and then applied again without removing the bearing from the measurement pin. The result reflects the clamp’s operation manner to a certain degree, but it mainly shows that the spread caused by conducting measurements at different points along the circumference on bearings without defects and damage (
Table 8—bearings 1–4) does not differ substantially from the spread obtained for a large series of measurements on a single point.
5. Conclusions
The research presented in this paper aimed to present the most common phenomena of variation in results, which are not intuitive and are not taken into account in the acceptance quality control of rolling bearings.
The results demonstrate the extent to which a result obtained for the same object, measured in the same manner but on a different test station, can be ambiguous. It must be noted that the extent of result difference between different systems can also substantially depend on the bearing’s condition, i.e., on the general vibration level generated by the bearing. For properly crafted, undamaged bearings operating in a predictable manner, the differences in the results obtained for different systems can be minor and can change in narrow ranges. Imperfections and damage of tested objects can affect the systems’ operation and result in a change in the proportions of the results obtained for undamaged bearings.
The repeatability values are mainly related to the correct operation of the clamp that applies an axial load. It must be noted that the clamp’s operation affect each measurement, thereby affecting reproducibility (repeatability is related to reproducibility). On the other hand, reproducibility is related to the natural result variation. This variation results from the dynamic nature of a bearing’s operation and is caused by the fact that the bearing can be “positioned” differently during each fitting to a certain degree, thereby making it operate differently after each fitting. A change in the balls’ rotation axis also substantially affects a system’s reproducibility result. After removal and repeated fitting, a bearing’s balls can roll in completely different planes.
Additional result demonstrates that omission of the fact of obtaining different (occasionally substantially different) results depending on the sensor’s application point in scientific testing prevents one from obtaining a relevant result, while in quality control of manufacturing plants can result in the sale of defective bearings.
The research presented here shows how ambiguous the result of a vibration measurement can be. The result depends both on the measuring system, on the place of application of the sensor, and also varies on its own (be difficult to repeat and difficult to reproduce).
The drive for continuous improvement in rolling bearings necessitates changes in the measuring systems used for acceptance checks. In order to improve the quality control process for vibration measurement, a number of works should be carried out consisting of:
analysing the design solutions of various vibration measurement systems, carrying out comparative studies and selecting the most effective ones,
equipping production lines with additional vibration sensors which will allow measurements to be taken at various points of the outer ring during a single mounting, thus increasing the number of measurements per bearing.
taking into account in the analysis of results the poor repeatability and reproducibility of dynamic measurement of rolling bearing vibrations.


