
Improving Medical Image Quality Using a Super-Resolution Technique with Attention Mechanism


Abstract
1. Introduction
1.1. Deep Learning-Based Methods
1.2. Data Availability
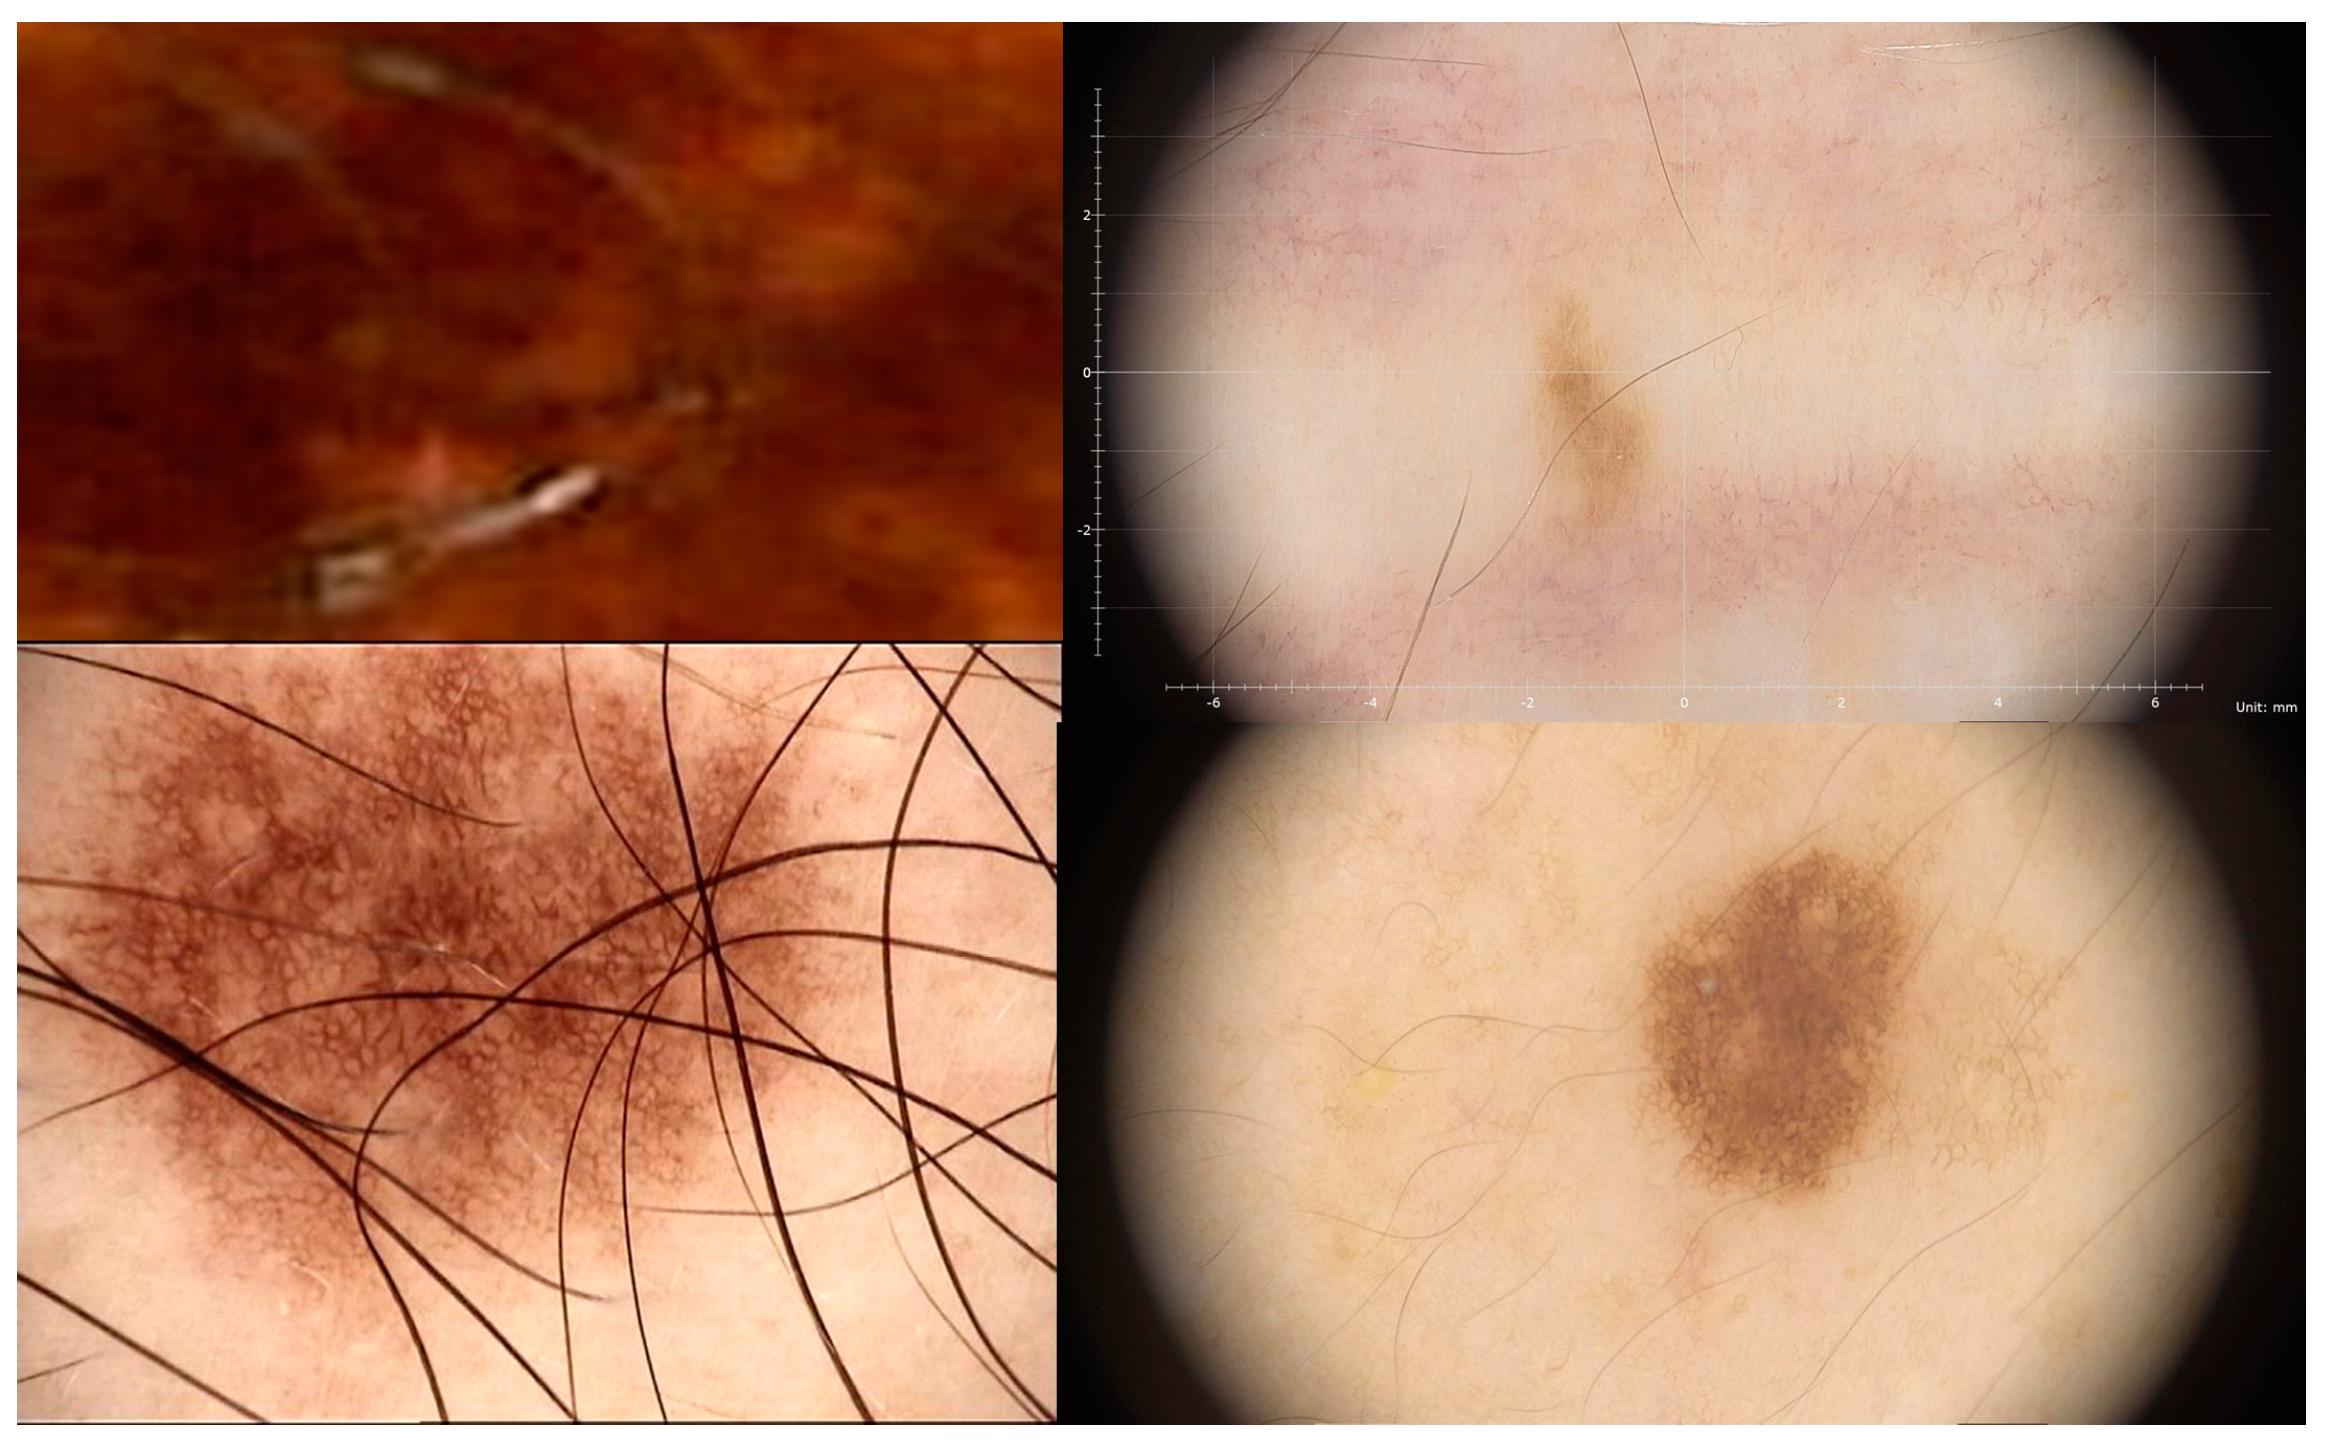
- ISIC Archive;
- ISIC 2020 Challenge.
1.3. Ethical Considerations
2. Related Work
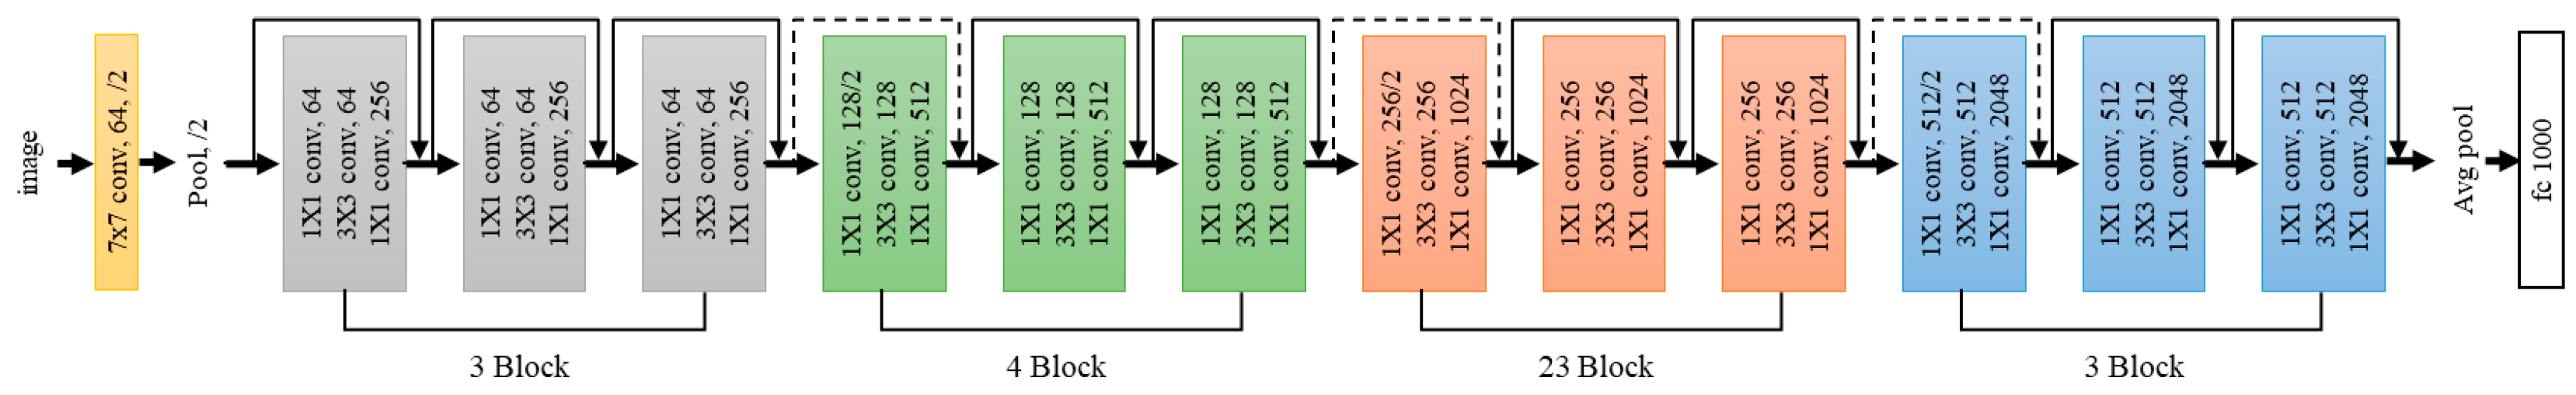
2.1. ResNet
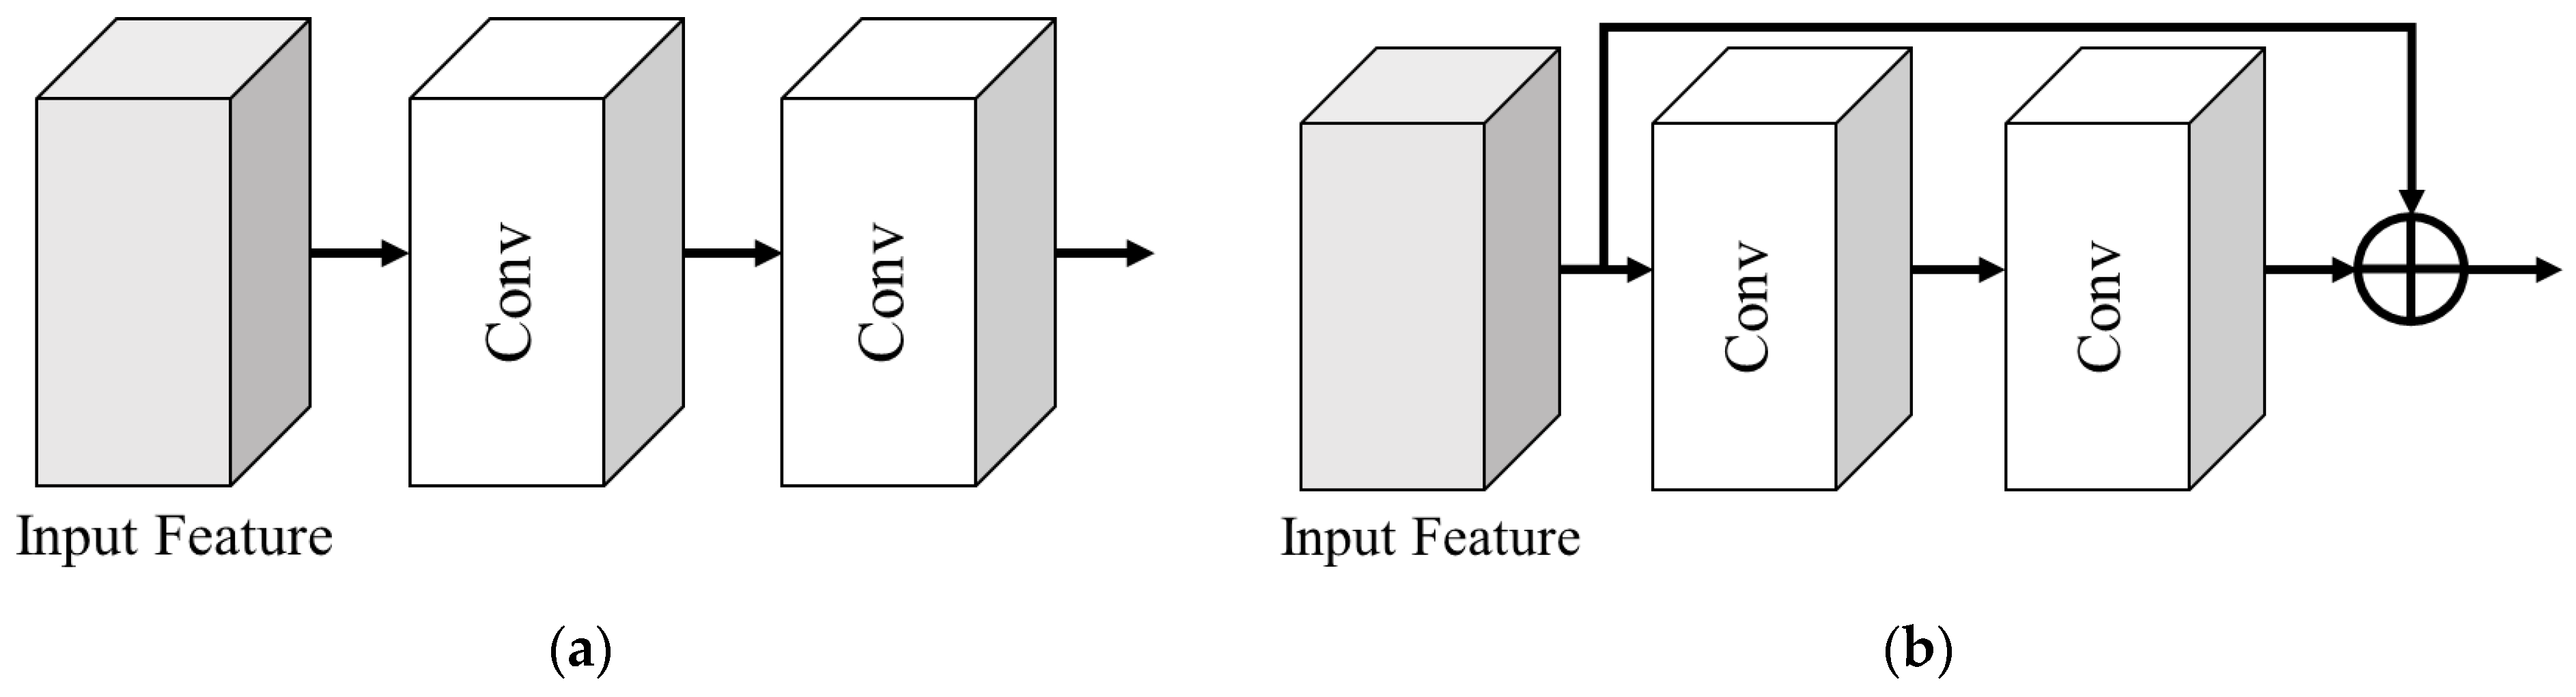
- Expansion to deep networks: ResNet introduces residual connections to enable the stacking of networks to deeper levels, thereby alleviating the gradient vanishing that occurs in deep networks. Residual connections construct a network by learning the residuals between the input and output and adding them to the output. This allows for a better performance as the network depth increases.
- Performance: With its ability to construct deep networks, ResNet can learn and extract more complex and abstract image features, leading to high classification accuracy.
- Efficient learning: Residual connections preserve information from the previous layers, ensuring stable gradients and a smooth learning process.
- Reusable block structure: The block structure is composed of stacked basic blocks, constituting a reusable form that facilitates model construction.
- Neural network architecture: Generally, ResNet is built by stacking basic blocks consisting of convolution layers and rectified linear units (ReLUs) as activation functions. These basic blocks are connected by residual connections, enabling the neural network to learn the residuals between the inputs and outputs. Convolution layers with various kernel sizes and strides are employed for each layer, enabling feature extraction at different scales.
- Computational and memory requirements: Deep networks have high computational and memory requirements during training and inference. Training with larger models requires significant resources and increases memory usage.
- Model Size: Deep structures result in relatively large models. Therefore, models with extensive structures may encounter storage space and transmission speed constraints in certain scenarios.
- Overfitting Issue: Constructing models with deep structures requires more parameters. Consequently, overfitting might arise in cases with limited training data.
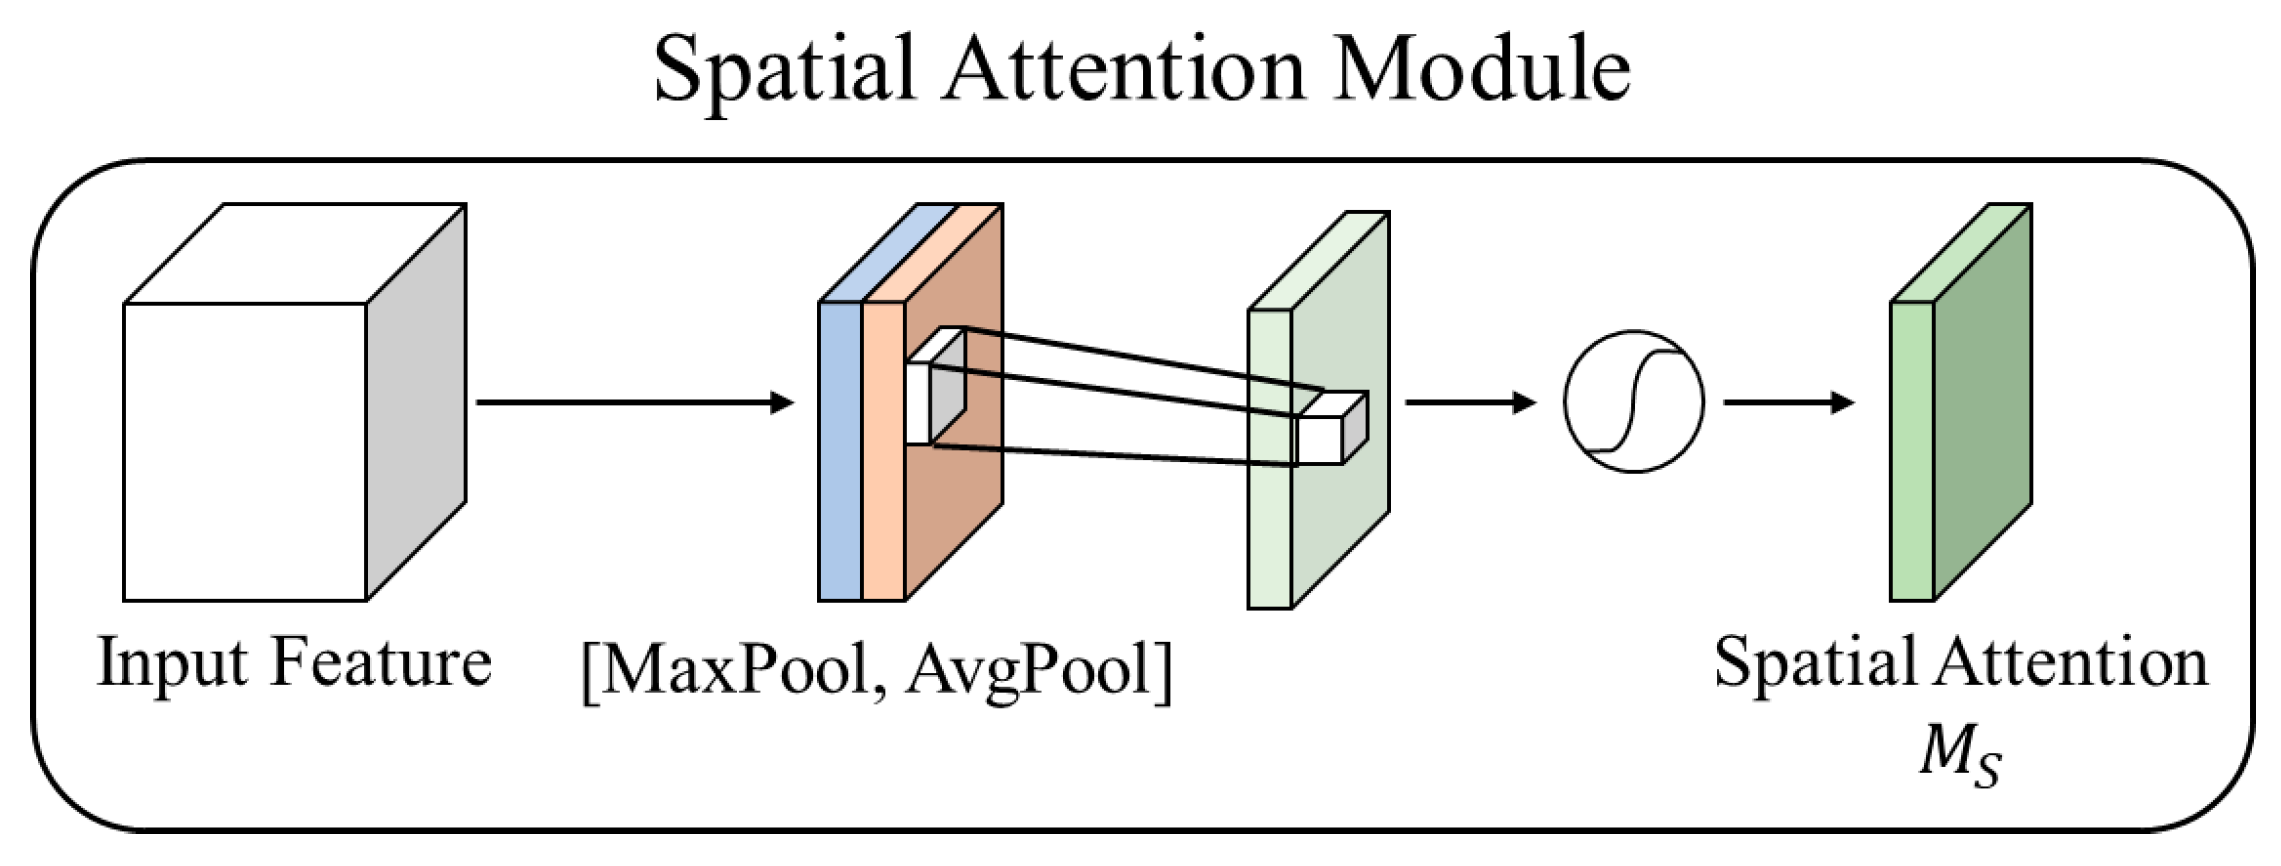
2.2. Attention Mechanism
- Encoder stageThis involves embedding each element (e.g., word or token) of the input sequence to represent its meaning in a vector space. These embeddings contribute to extracting and representing input features. Encoder structures are typically implemented using recurrent neural networks (RNNs) or modified functions (e.g., transformers). The output of the encoder serves as a context vector and is used in the subsequent attention stage.
- Attention stageHerein, a weighted average is computed based on the output from the encoder and the previously generated state from the decoder. This process focuses on the relevant parts of the input sequence. The query, key, and value concepts are commonly used. The query is generated based on the previous state or output of the decoder, whereas the key and value are generated from the output of the encoder. Attention weights are used to calculate the relevance between the query and key, with the attention-weighted sum summarizing the information of specific parts of the input.
- Decoder stageThe decoder utilizes the computed weighted average from the attention stage and combines it with the previous state to generate the subsequent output. This process is iteratively repeated with the decoder, using the previous output as the input to complete the sequence. Similarly to the encoder, the decoder is implemented using RNNs or structures such as transformers. The output of the decoder serves as the final prediction, and can be used in various ways, depending on the objective of the model.
2.3. Super-Resolution Approaches
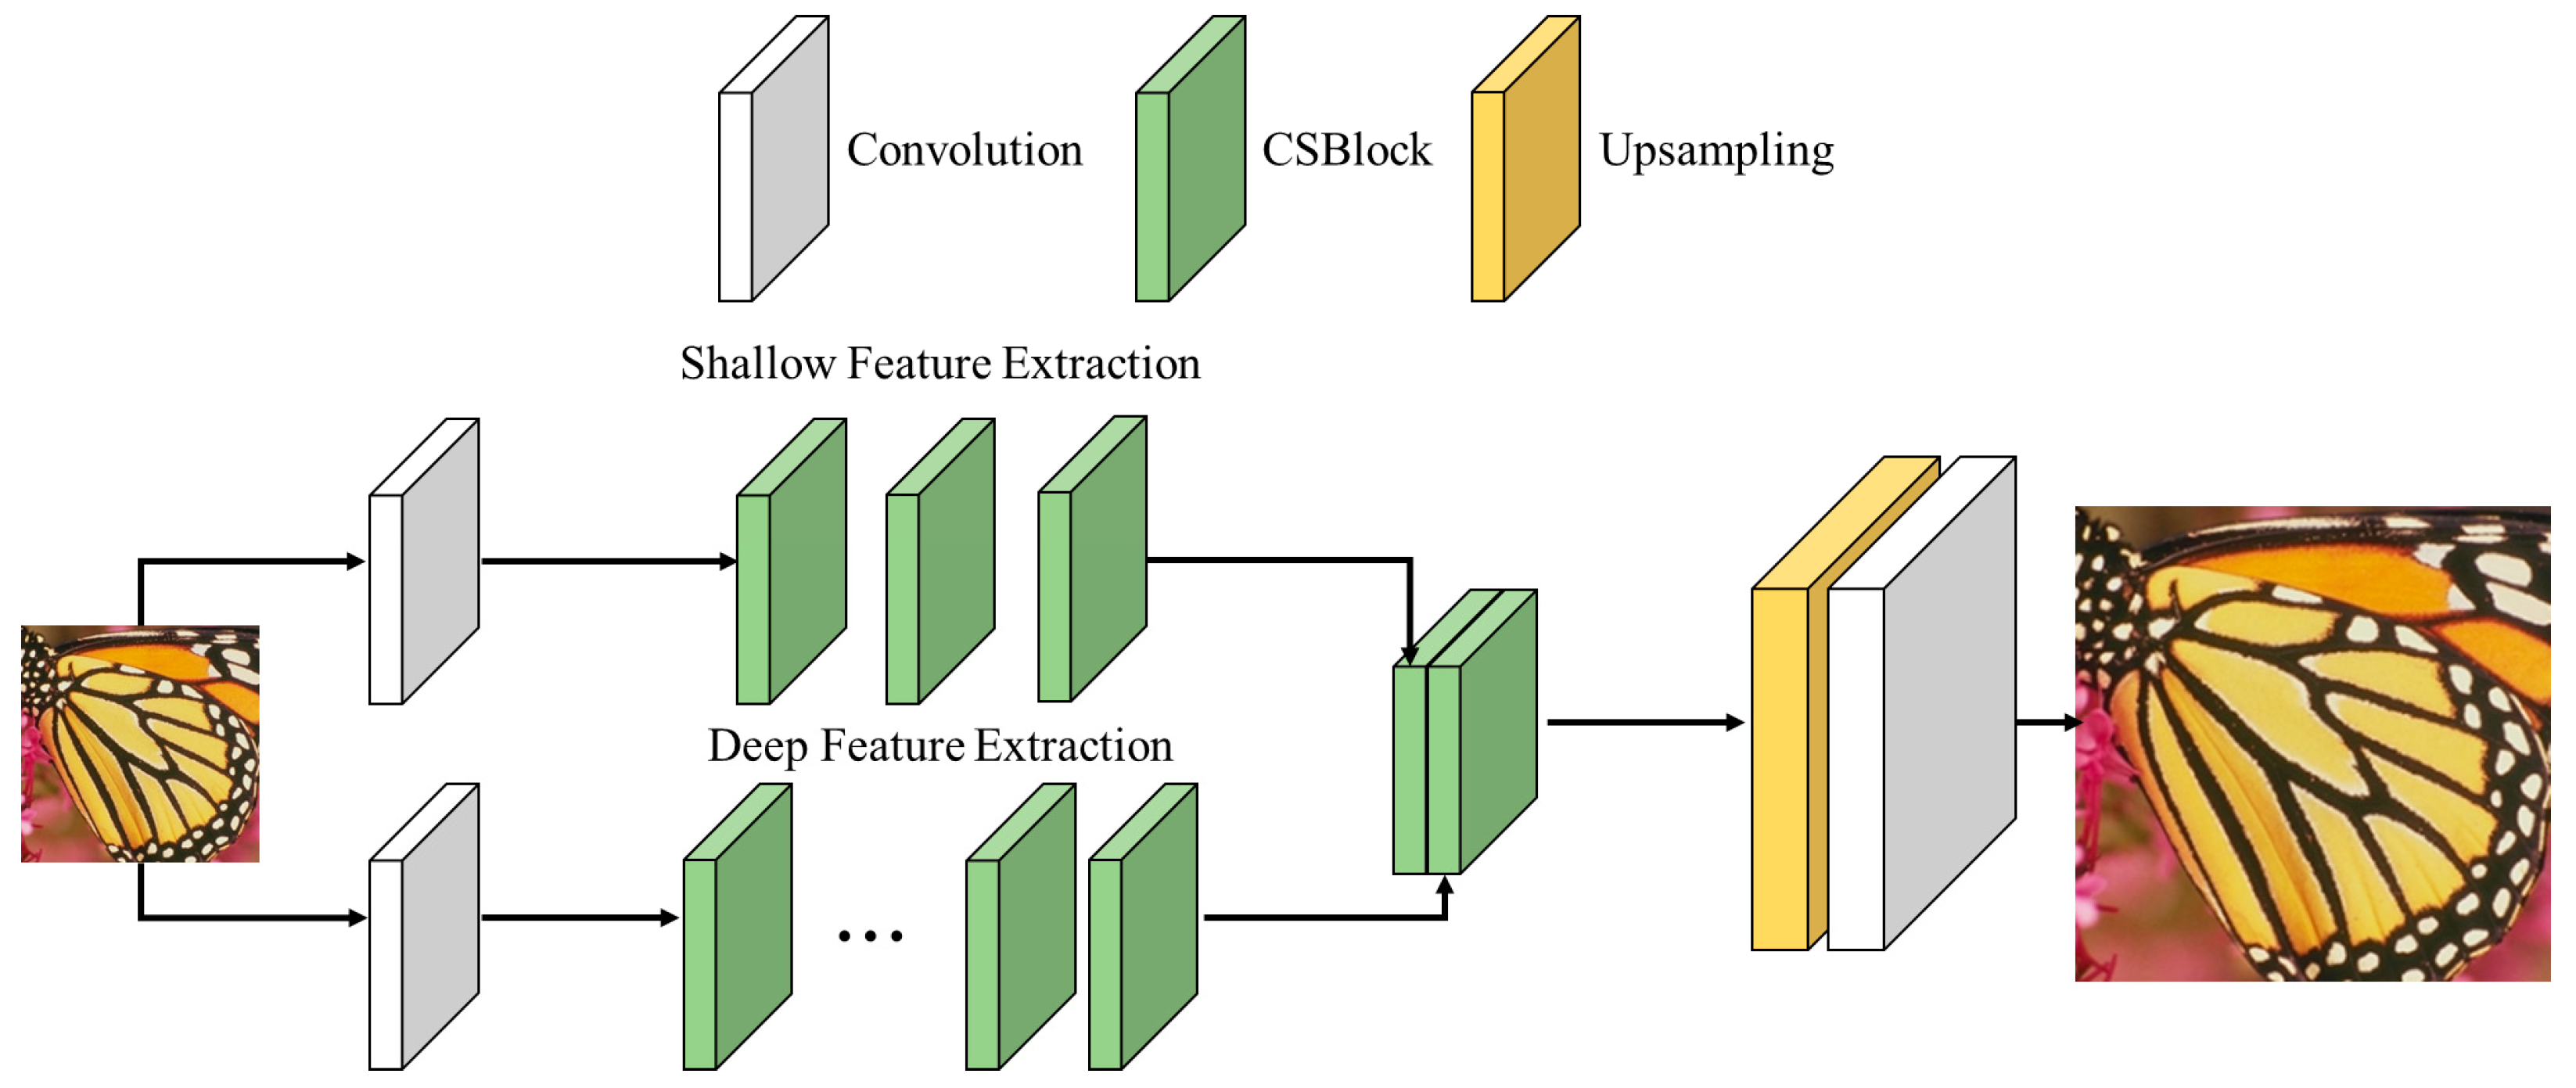
3. Proposed Method
- Shallow feature extraction focuses on capturing low-level features such as edges, textures, and basic patterns in the initial layers of the network. These features are extracted using convolution operations, which process the input data to highlight essential visual elements. To ensure that the shallow features contribute effectively to the final reconstruction, skip connections are employed. These connections directly link the output of the shallow layers to the deeper layers, preserving critical base-level information necessary for accurate image reconstruction.
- Deep feature extraction involves learning complex and abstract features in the later stages of the network. This process focuses on capturing high-level patterns and relationships that are essential for reconstructing detailed and high-quality images. To enhance feature representation, skip connections and concatenation are utilized. Skip connections ensure that shallow, low-level features are retained and seamlessly integrated with deeper, high-dimensional features. By combining these features, the network effectively preserves low-level details while learning high-level abstractions, resulting in an improved and comprehensive feature representation.
- Skip connection directly connects the output of a previous layer to a current layer within the network. This design helps mitigate the problem of gradient vanishing, which often occurs in deep networks, by ensuring that gradients can flow uninterrupted through the layers during backpropagation. By maintaining this direct connection, the network is able to learn deeper and more complex features effectively, contributing to an enhanced image reconstruction quality.
- Concatenation combines feature maps from different depths of the network, enabling the extraction of a wider range of features. This approach allows the model to integrate both low-level and high-level features, creating a richer and more diverse feature representation. By leveraging features at varying depths, concatenation enhances the network’s ability to capture fine details and complex patterns, improving the overall performance of the super-resolution method.
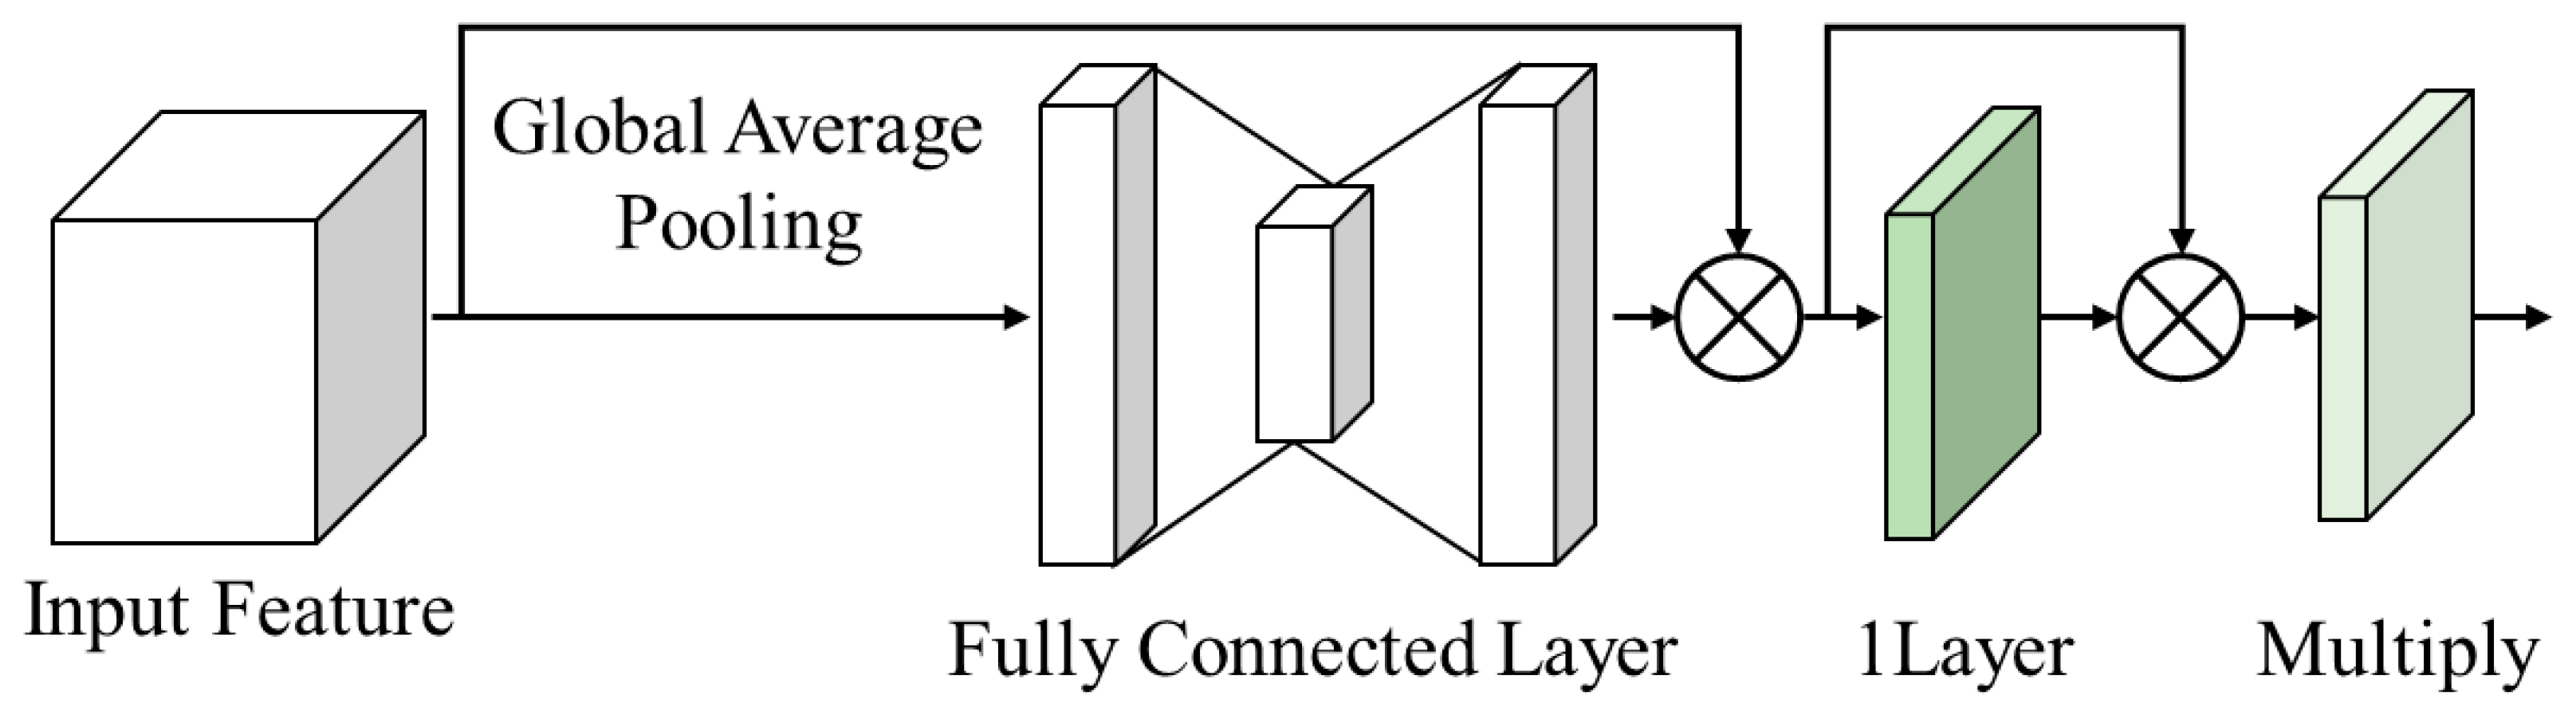
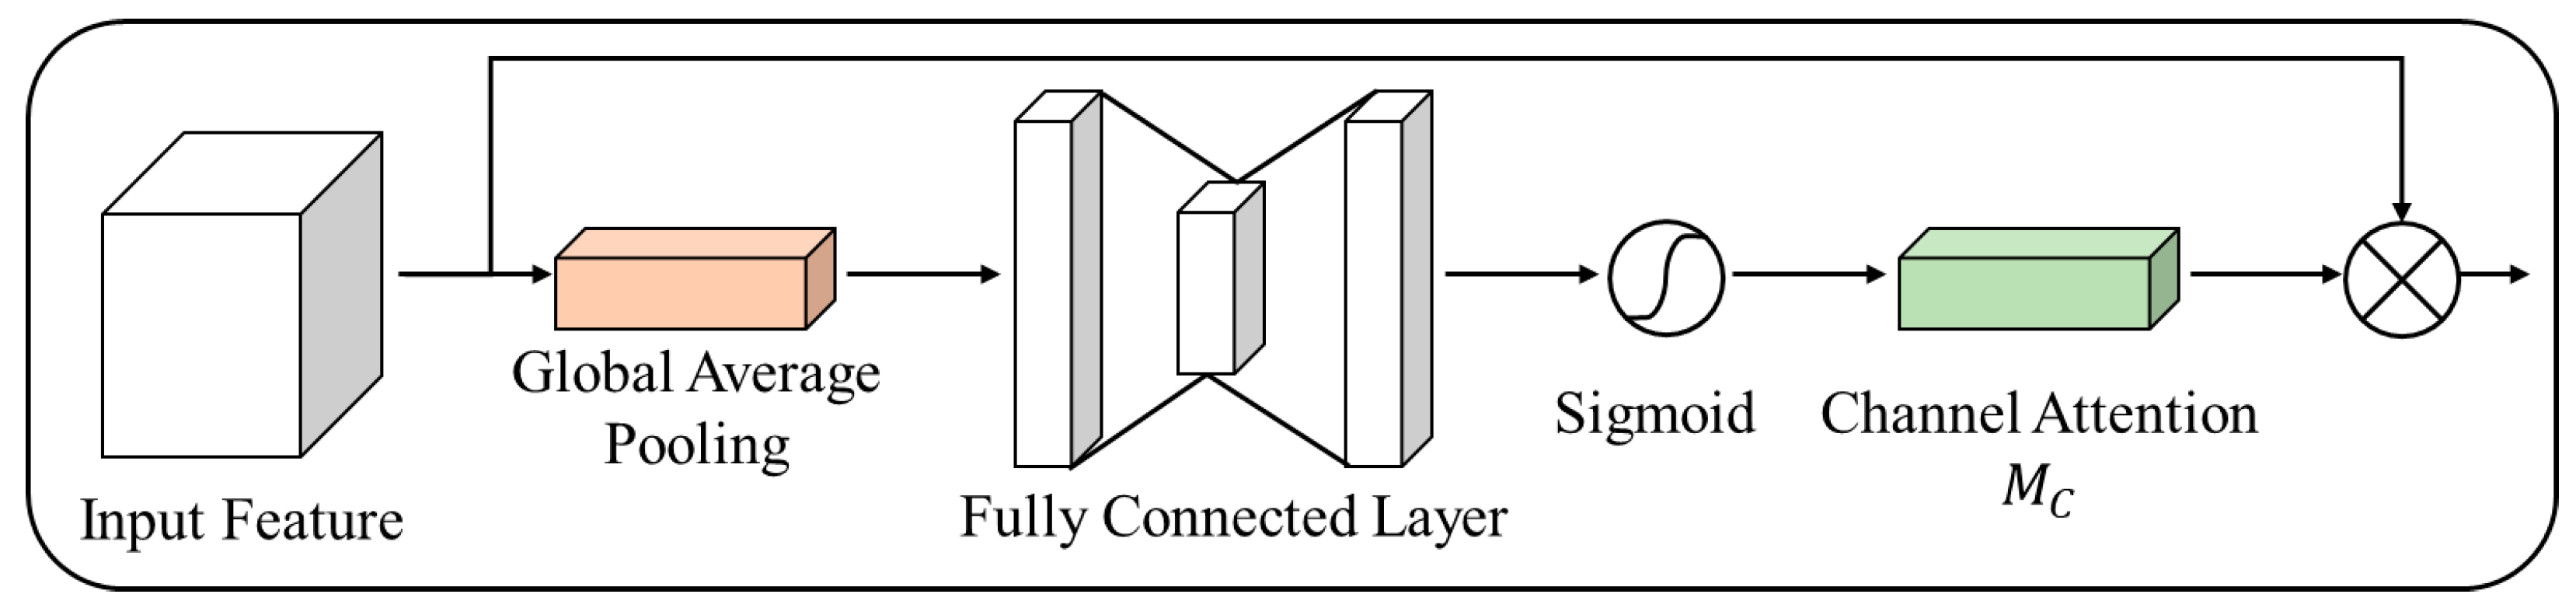
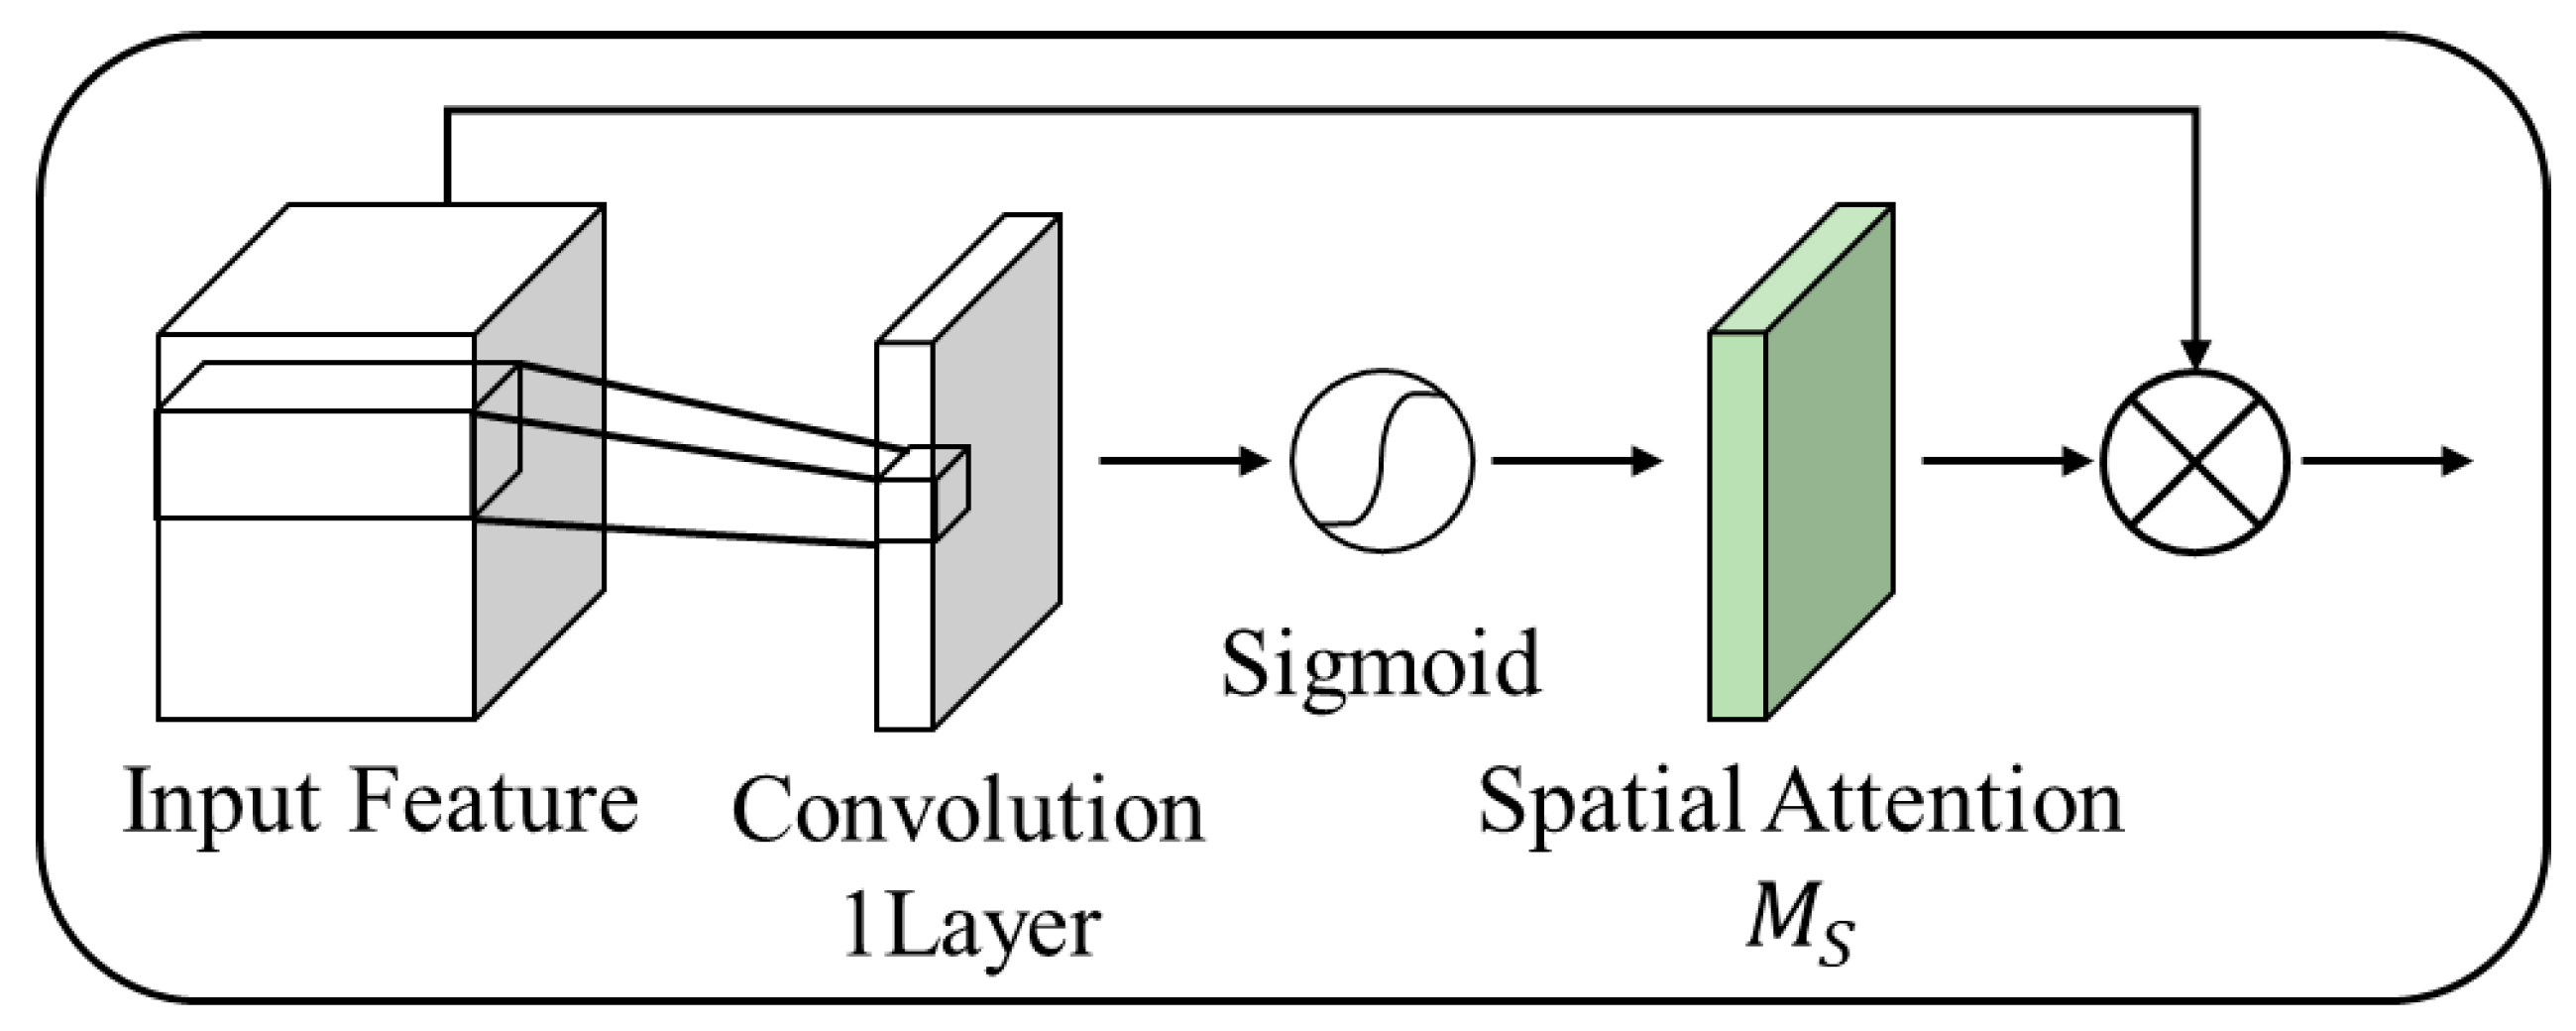
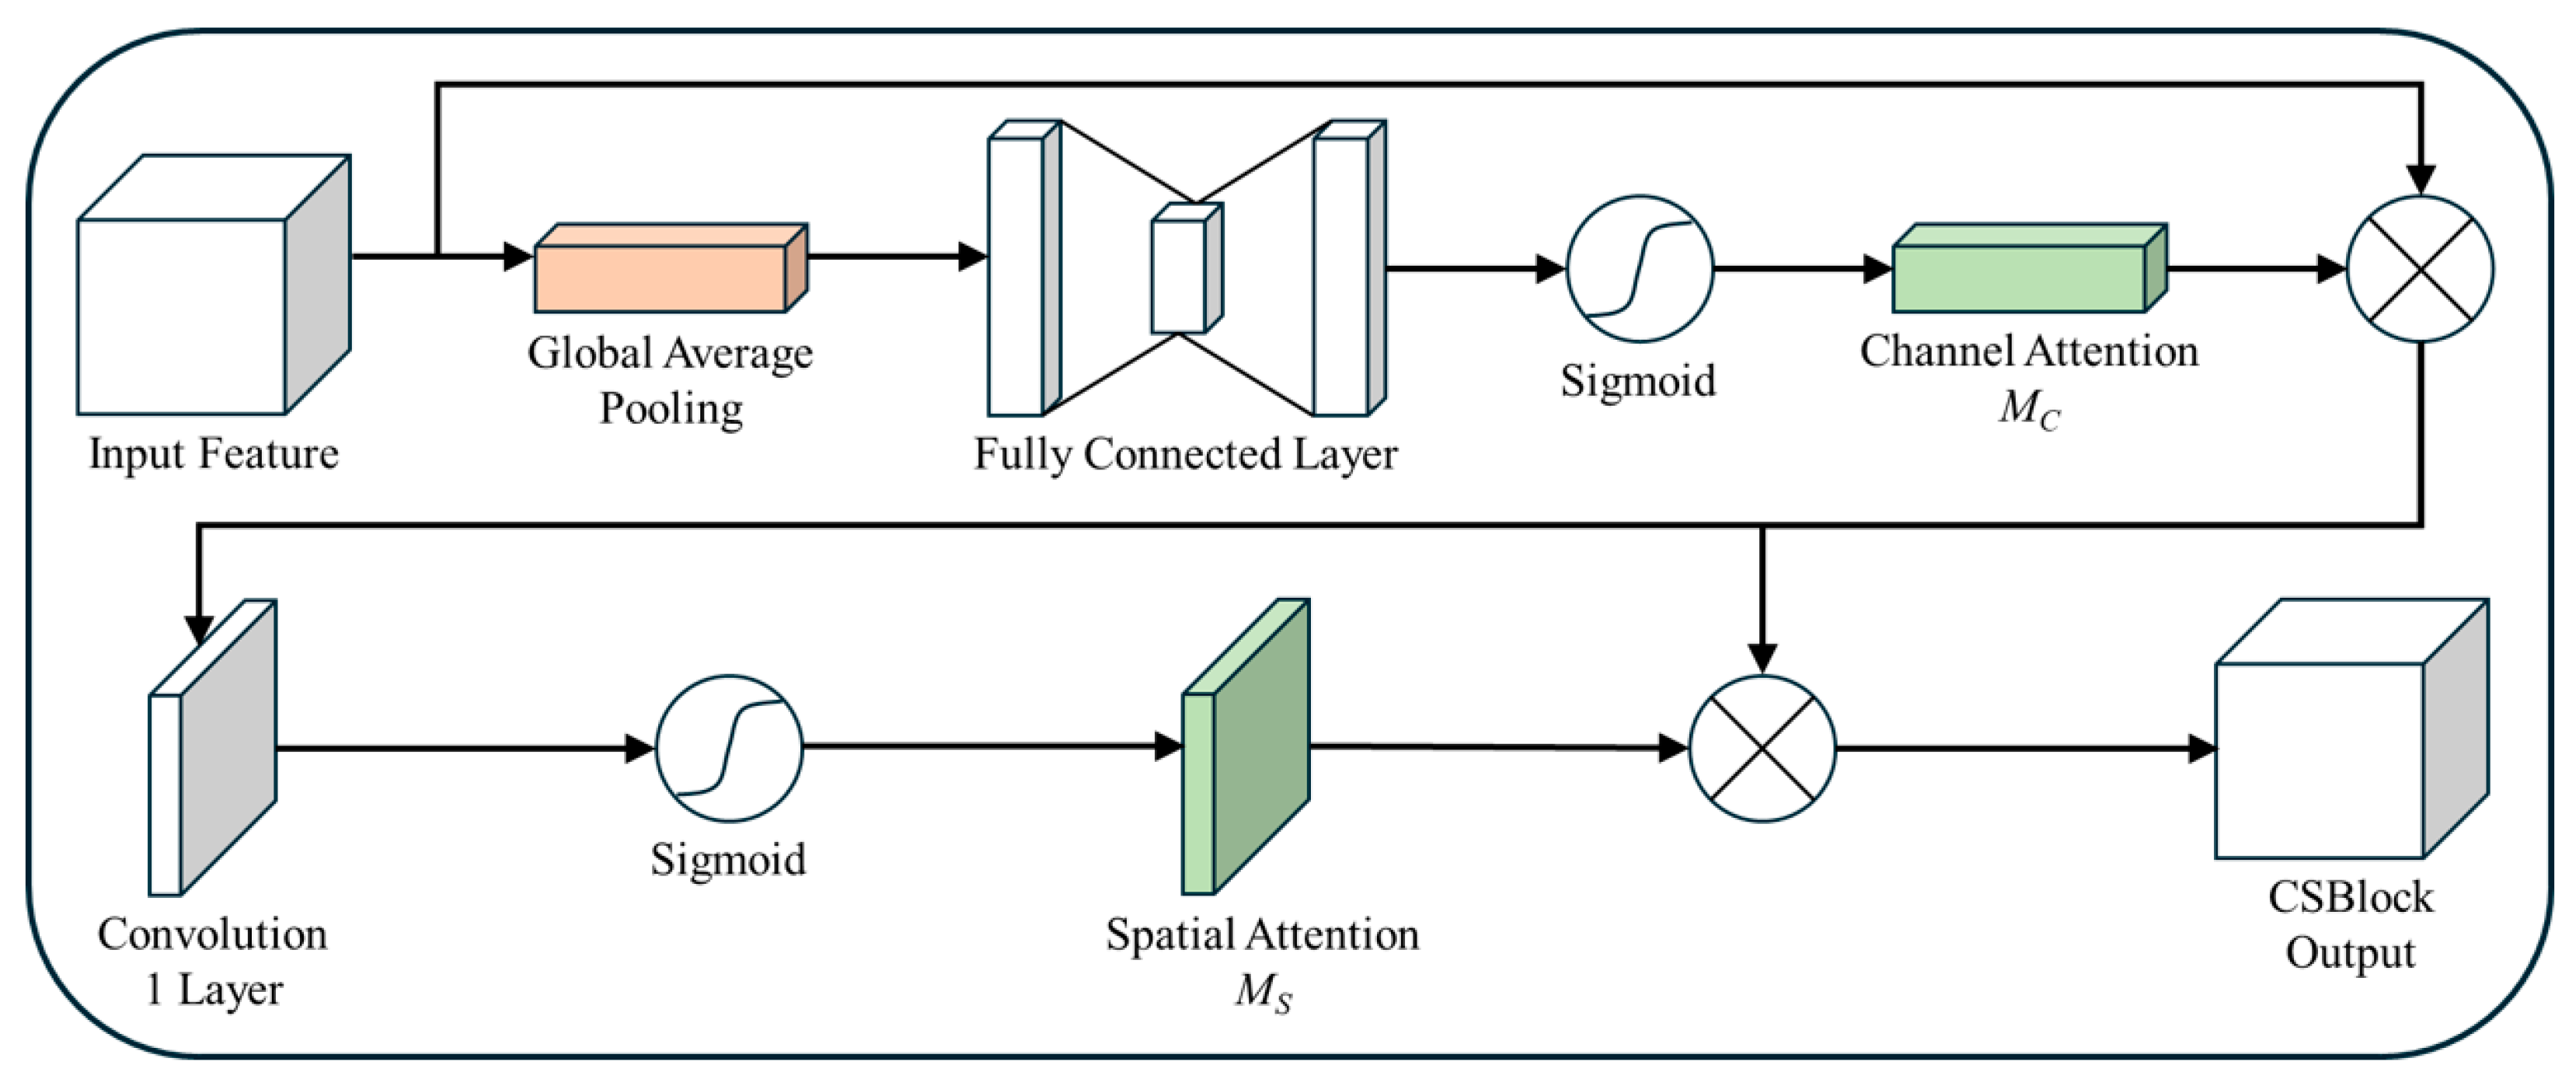
3.1. Attention Block
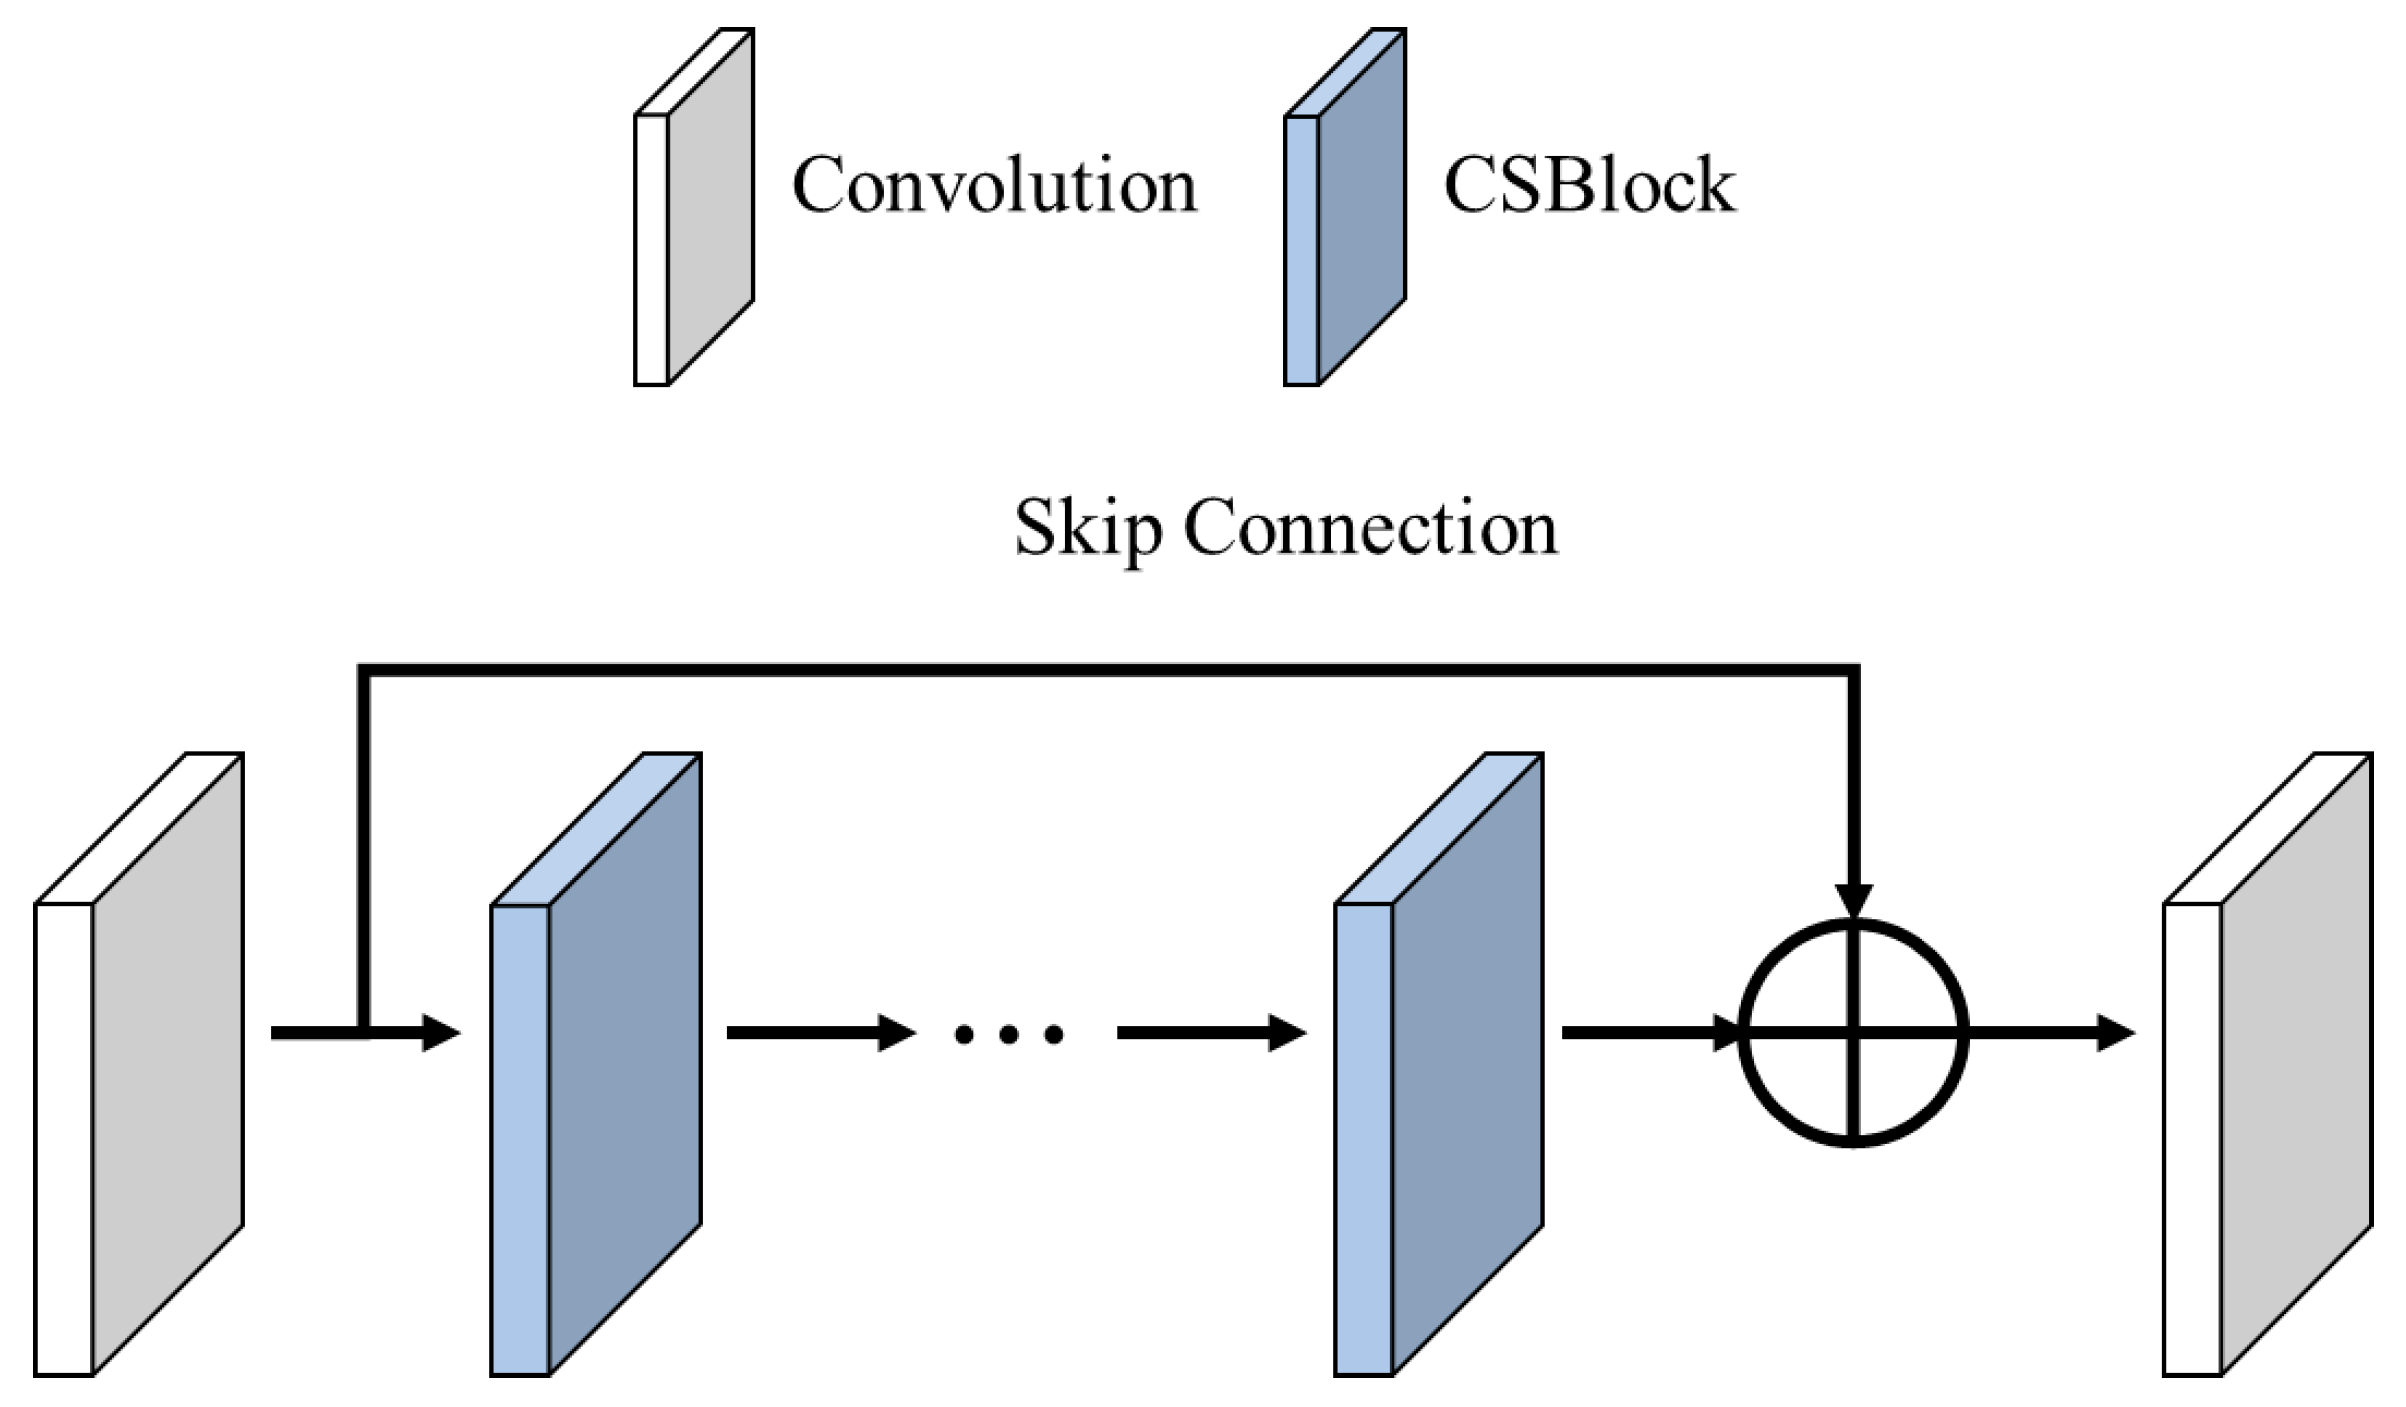
3.2. CSBlock
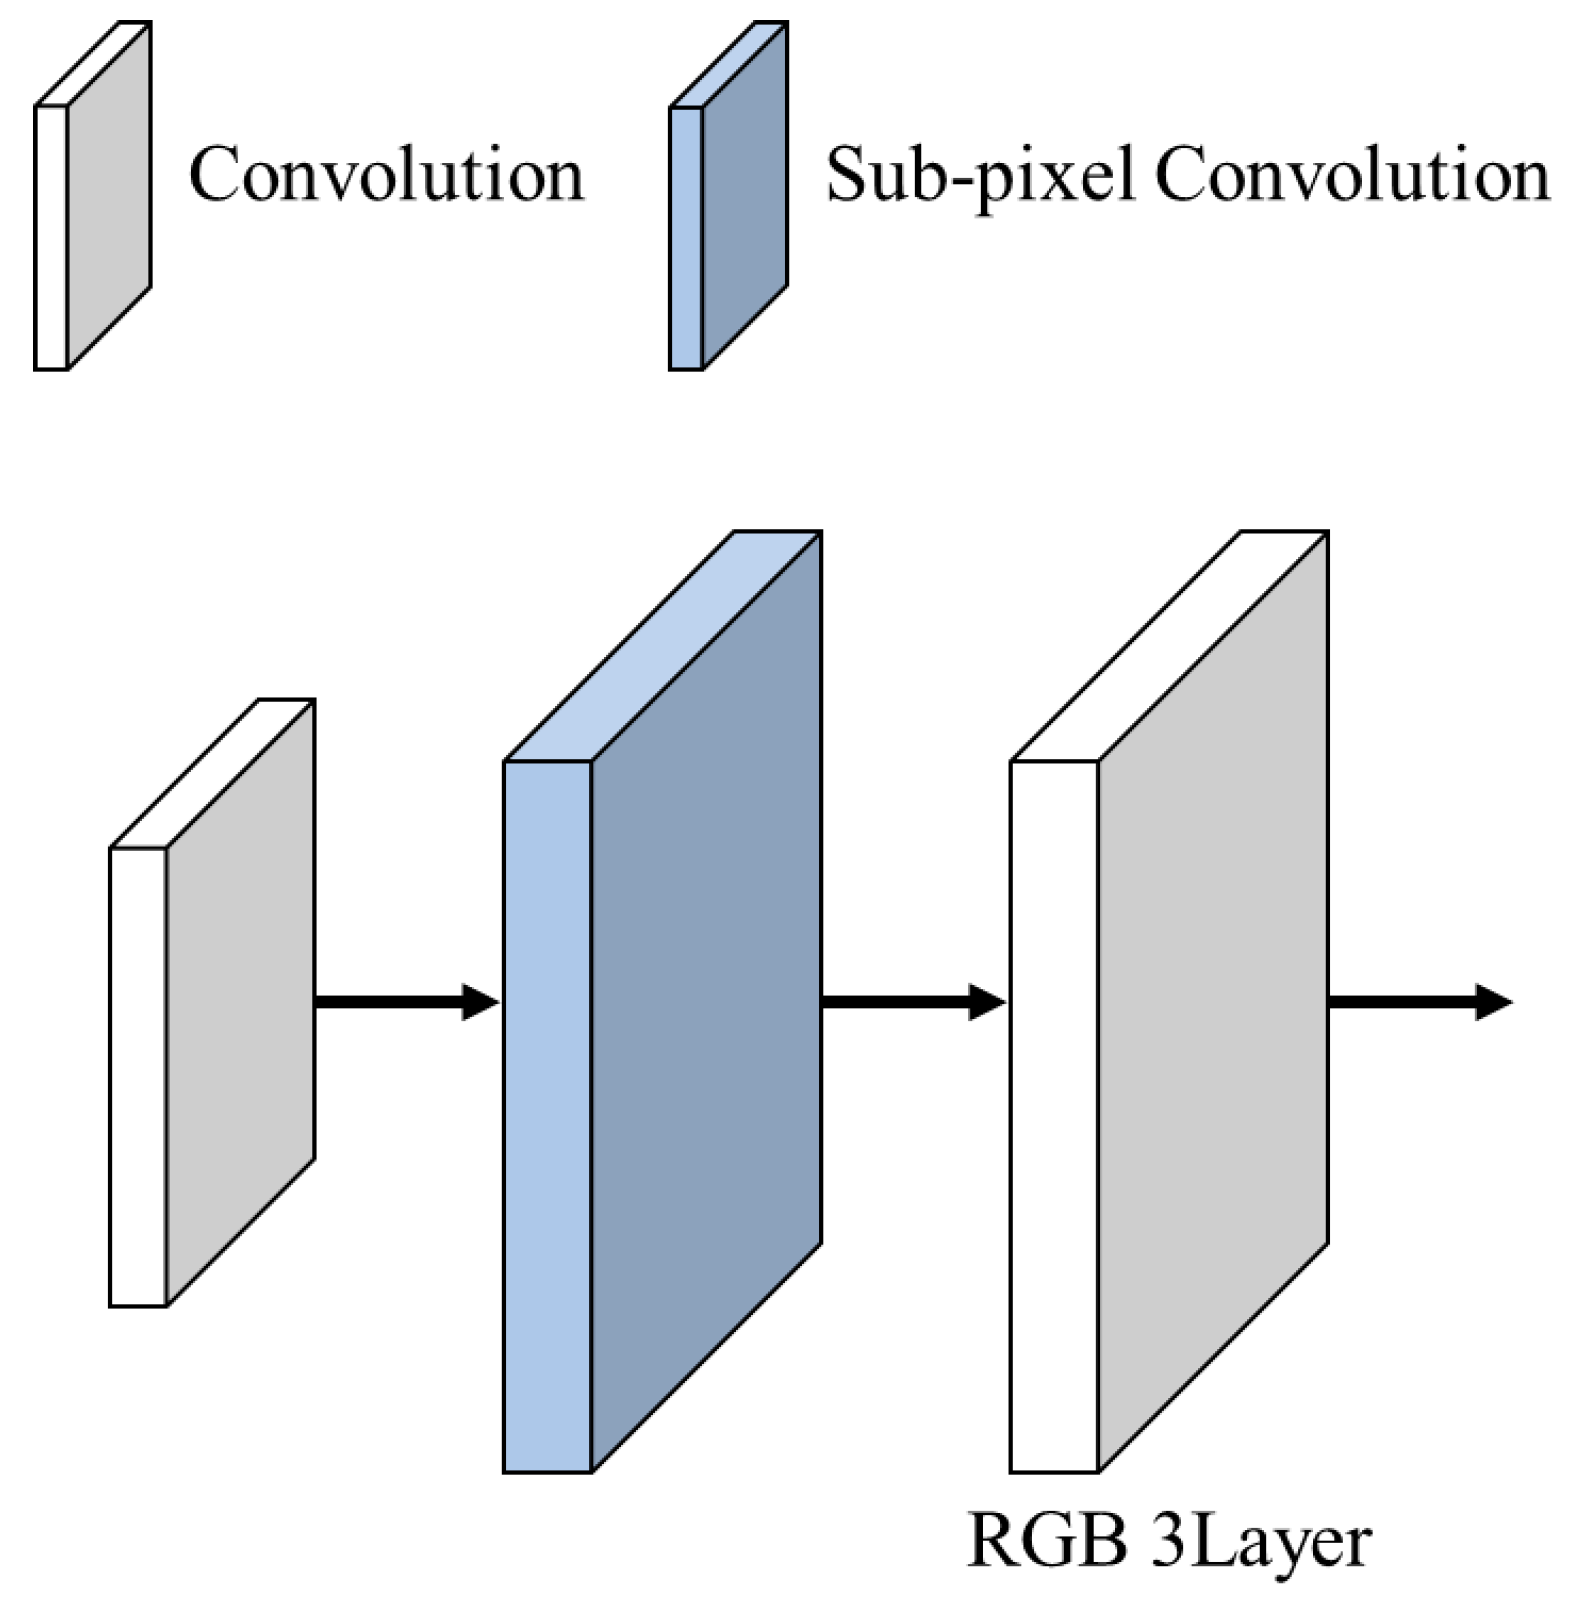
3.3. Upsampling
4. Experimental Results
4.1. Training Configurations and Evaluation Metrics
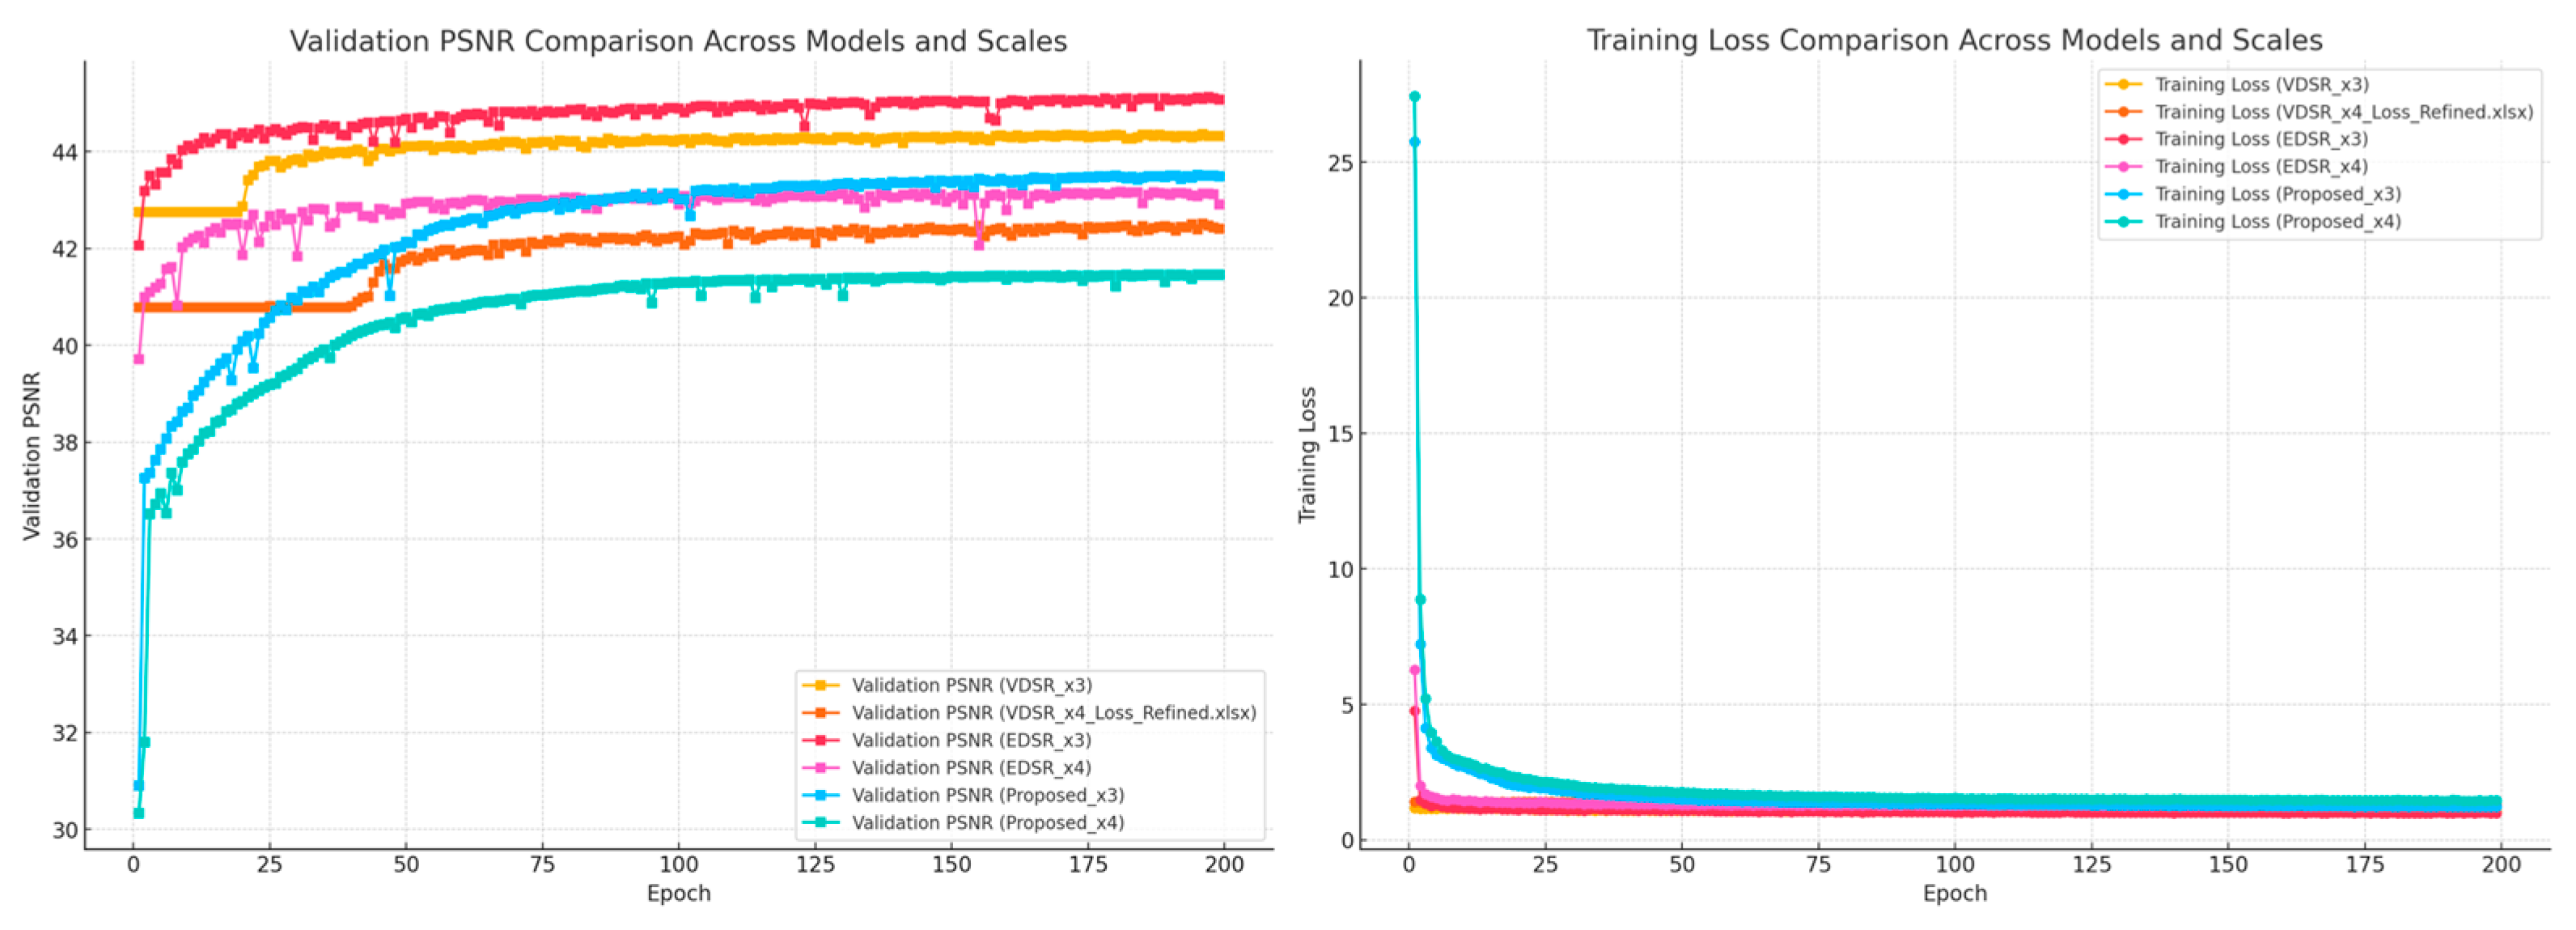
4.2. Convergence Analysis
- Training Loss: As shown in Figure 16, the training loss steadily decreases, reflecting the model’s effective optimization. The use of the L1 loss function contributes to the preservation of fine details while mitigating over-smoothing.
- Validation PSNR: Figure 16 shows the validation PSNR values improving consistently across epochs, highlighting the model’s ability to generalize effectively to unseen data. This result further validates the robustness of the proposed approach.
4.3. Diagnostic Accuracy Assessment
4.4. Diagnostic Accuracy in Related Studies
4.5. Relevance to This Study
4.6. Clinical Applicability
5. Discussion
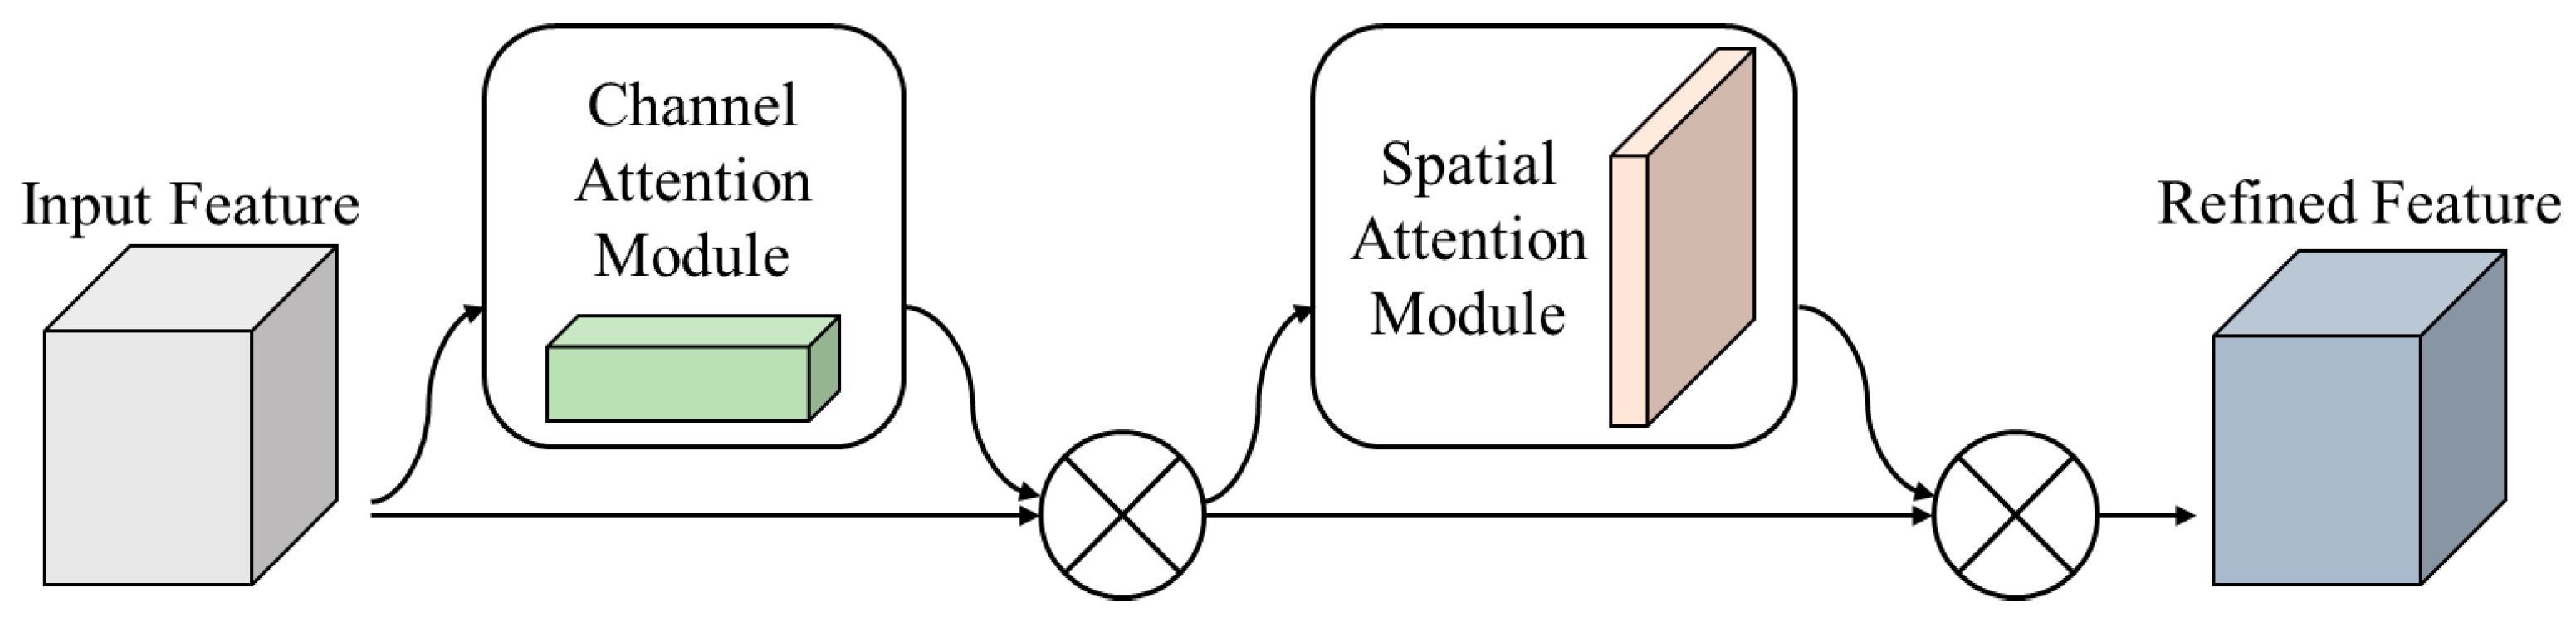
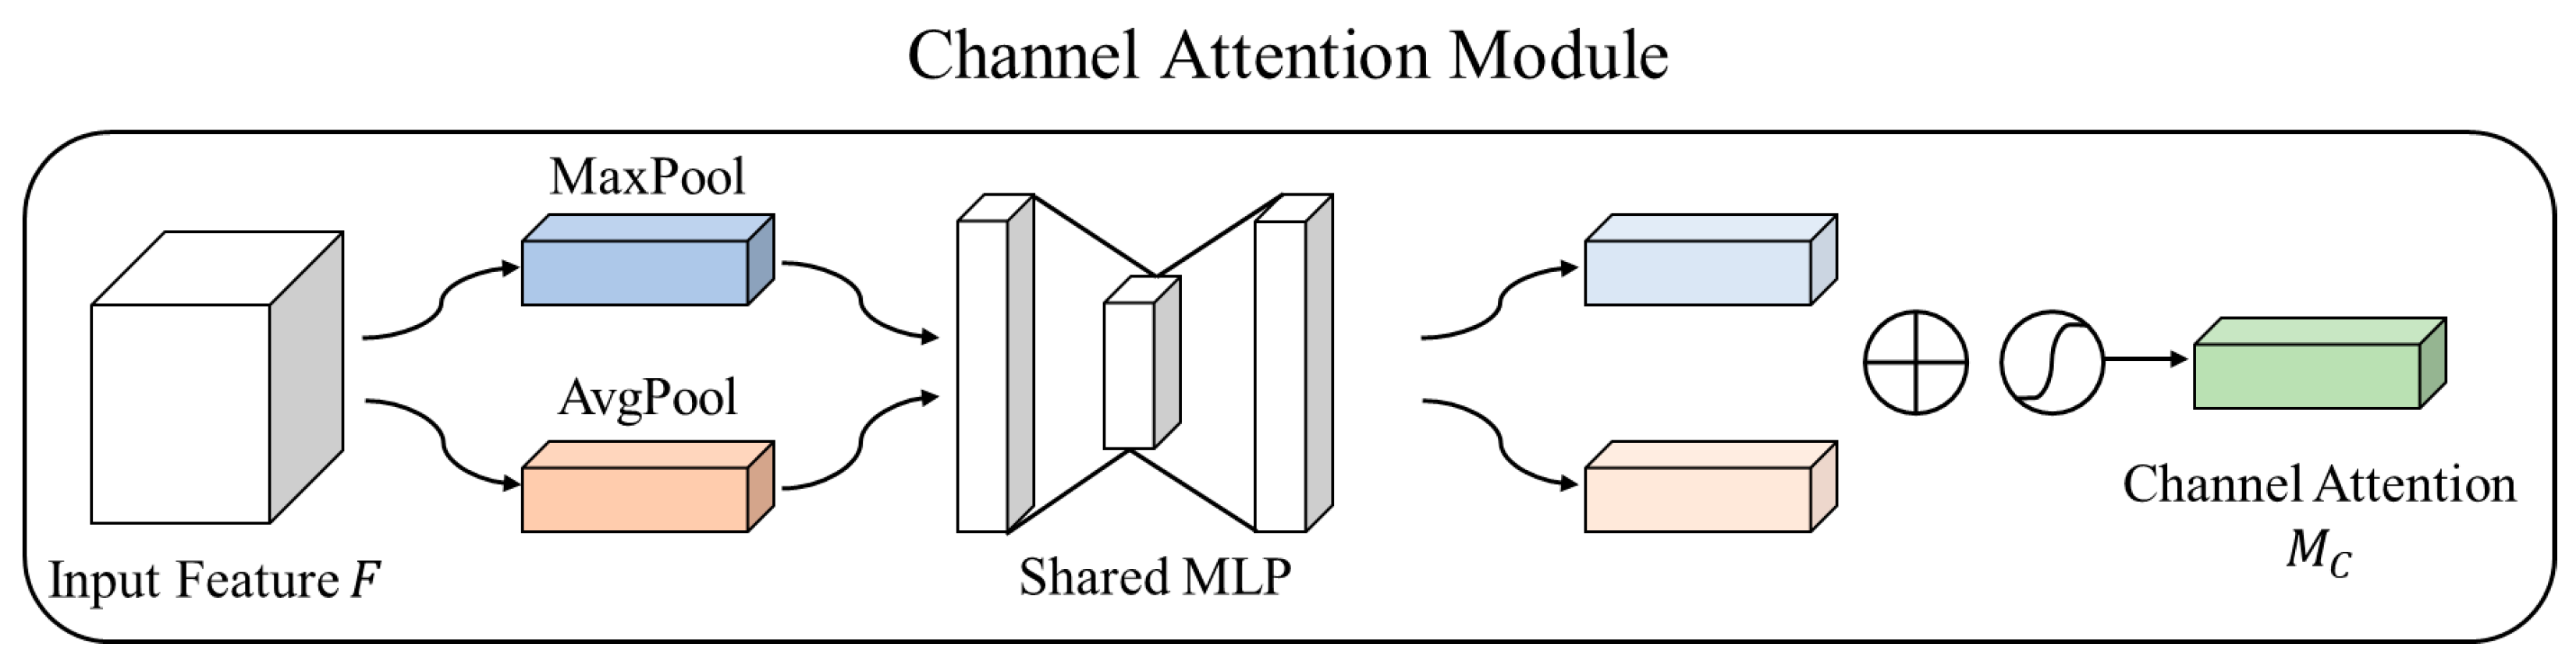
- Dynamic Attention Mechanisms: The CSBlock effectively combines channel and spatial attention to prioritize diagnostically relevant features. This allows the model to emphasize high-frequency details, such as lesion boundaries, while suppressing irrelevant noise.
- Subpixel Convolution for Upsampling: Unlike deconvolution-based methods, the use of subpixel convolution reduces artifacts and improves the clarity of restored images, particularly in high-frequency regions.
- Stable Training with L1 Loss: The use of L1 loss mitigates over-smoothing effects, resulting in sharper and more realistic outputs compared to VDSR and EDSR.
6. Conclusions and Future Directions
- Dataset Diversity: Incorporating additional datasets, such as PH2 and HAM10000, which include diverse lesion types and higher variability in image resolution, to validate the model’s generalizability across diverse patient populations.
- Model Simplification and Scalability: Developing lightweight architectures, such as MobileNet-based designs, to reduce the computational overhead while maintaining high performance. This approach aims to enable deployment on portable diagnostic devices and in telemedicine applications.
- Expanding Evaluation Metrics: Including diagnostic metrics, such as sensitivity, specificity, and AUC, along with qualitative assessments by medical experts. These evaluations will provide a more comprehensive understanding of the model’s clinical relevance.
Author Contributions
Funding
Institutional Review Board Statement
Informed Consent Statement
Data Availability Statement
Acknowledgments
Conflicts of Interest
References
- Singh, N.K.; Raza, K. Progress in deep learning-based dental and maxillofacial image analysis: A systematic review. Expert Syst. Appl. 2022, 199, 116968. [Google Scholar] [CrossRef]
- Zhao, M.; Naderian, A.; Sanei, S. Generative Adversarial Networks for Medical Image Super-resolution. In Proceedings of the 2021 International Conference on e-Health and Bioengineering (EHB), Iasi, Romania, 18–19 November 2021; pp. 1–4. [Google Scholar]
- Park, J.; Hwang, D.; Kim, K.Y.; Kang, S.K.; Kim, Y.K.; Lee, J.S. Computed tomography super-resolution using deep convolutional neural network. Phys. Med. Biol. 2018, 63, 145011. [Google Scholar] [CrossRef] [PubMed]
- Li, Y.; Sixou, B.; Peyrin, F. A review of the deep learning methods for medical images super resolution problems. IRBM 2021, 42, 120–133. [Google Scholar] [CrossRef]
- Rajeshwari, P.; Shyamala, K. Pixel attention based deep neural network for chest CT image super resolution. In Advanced Network Technologies and Intelligent Computing, Proceedings of the Second International Conference, ANTIC 2022, Varanasi, India, 22–24 December 2022; Proceedings, Part II; Springer Nature: Cham, Switzerland, 2023; pp. 393–407. [Google Scholar]
- Yang, W.; Zhang, X.; Tian, Y.; Wang, W.; Xue, J.H.; Liao, Q. Deep learning for single image super-resolution: A brief review. IEEE Trans. Multimed. 2019, 21, 3106–3121. [Google Scholar] [CrossRef]
- Jo, Y.; Oh, S.W.; Vajda, P.; Kim, S.J. Tackling the ill-posedness of super-resolution through adaptive target generation. In Proceedings of the IEEE/CVF Conference on Computer Vision and Pattern Recognition 2021, Nashville, TN, USA, 20–25 June 2021; pp. 16236–16245. [Google Scholar]
- Liu, W.; Zhang, B.; Liu, T.; Jiang, J.; Liu, Y. Artificial Intelligence in Pancreatic Image Analysis: A Review. Sensors 2024, 24, 4749. [Google Scholar] [CrossRef] [PubMed]
- Zhang, S.; Liang, G.; Pan, S.; Zheng, L. A fast medical image super resolution method based on deep learning network. IEEE Access 2018, 7, 12319–12327. [Google Scholar] [CrossRef]
- Bai, Y.; Zhuang, H. On the comparison of bilinear, cubic spline, and fuzzy interpolation techniques for robotic position measurements. IEEE Trans. Instrum. Meas. 2005, 54, 2281–2288. [Google Scholar] [CrossRef]
- Dong, C.; Loy, C.C.; Tang, X. Accelerating the super-resolution convolutional neural network. In Computer Vision—ECCV 2016, Proceeding of the 14th European Conference, Amsterdam, The Netherlands, 11–14 October 2016; Proceedings, Part II; Springer: Cham, Switzerland, 2016; pp. 391–407. [Google Scholar]
- Kim, J.; Lee, J.K.; Lee, K.M. Accurate image super-resolution using very deep convolutional networks. In Proceedings of the IEEE Conference on Computer Vision and Pattern Recognition 2016, Las Vegas, NV, USA, 27–30 June 2016; pp. 1646–1654. [Google Scholar]
- Lim, B.; Son, S.; Kim, H.; Nah, S.; Mu Lee, K. Enhanced deep residual networks for single image super-resolution. In Proceedings of the IEEE Conference on Computer Vision and Pattern Recognition Workshops 2017, Honolulu, HI, USA, 21–26 July 2017; pp. 136–144. [Google Scholar]
- Keys, R. Cubic convolution interpolation for digital image processing. IEEE Trans. Acoust. Speech Signal Process. 1981, 29, 1153–1160. [Google Scholar] [CrossRef]
- Simonyan, K.; Zisserman, A. Very deep convolutional networks for large-scale image recognition. arXiv 2014, arXiv:1409.1556. [Google Scholar]
- Chen, L.C.; Zhu, Y.; Papandreou, G.; Schroff, F.; Adam, H. Encoder-decoder with atrous separable convolution for semantic image segmentation. In Proceedings of the European Conference on Computer Vision (ECCV) 2018, Munich, Germany, 8–14 September 2018; pp. 801–818. [Google Scholar]
- He, K.; Gkioxari, G.; Dollár, P.; Girshick, R. Mask r-cnn. In Proceedings of the IEEE International Conference on Computer Vision 2017, Venice, Italy, 22–29 October 2017; pp. 2961–2969. [Google Scholar]
- Lin, T.Y.; Dollár, P.; Girshick, R.; He, K.; Hariharan, B.; Belongie, S. Feature pyramid networks for object detection. In Proceedings of the IEEE Conference on Computer Vision and Pattern Recognition 2017, Honolulu, HI, USA, 21–26 July 2017; pp. 2117–2125. [Google Scholar]
- Hu, J.; Shen, L.; Sun, G. Squeeze-and-excitation networks. In Proceedings of the IEEE Conference on Computer Vision and Pattern Recognition 2018, Salt Lake City, UT, USA, 18–23 June 2018; pp. 7132–7141. [Google Scholar]
- Sutskever, I.; Vinyals, O.; Le, Q.V. Sequence to sequence learning with neural networks. In Proceedings of the Advances in Neural Information Processing Systems 27, Montreal, QC, Canada, 8–13 December 2014. [Google Scholar]
- Kitaev, N.; Kaiser, Ł.; Levskaya, A. Reformer: The efficient transformer. arXiv 2020, arXiv:2001.04451. [Google Scholar]
- Wang, S.; Li, B.Z.; Khabsa, M.; Fang, H.; Ma, H. Linformer: Self-attention with linear complexity. arXiv 2020, arXiv:2006.04768. [Google Scholar]
- Liu, Z.; Lin, Y.; Cao, Y.; Hu, H.; Wei, Y.; Zhang, Z.; Lin, S.; Guo, B. Swin transformer: Hierarchical vision transformer using shifted windows. In Proceedings of the IEEE/CVF International Conference on Computer Vision 2021, Montreal, BC, Canada, 11–17 October 2021; pp. 10012–10022. [Google Scholar]
- Vaswani, A.; Shazeer, N.; Parmar, N.; Uszkoreit, J.; Jones, L.; Gomez, A.N.; Kaiser, Ł.; Polosukhin, I. Attention is all you need. In Proceedings of the Advances in Neural Information Processing Systems 30, Long Beach, CA, USA, 4–9 December 2017. [Google Scholar]
- Woo, S.; Park, J.; Lee, J.Y.; Kweon, I.S. Cbam: Convolutional block attention module. In Proceedings of the European Conference on Computer Vision (ECCV), Munich, Germany, 8–14 September 2018; pp. 3–19. [Google Scholar]
- Dharejo, F.A.; Zawish, M.; Deeba, F.; Zhou, Y.; Dev, K.; Khowaja, S.A.; Qureshi, N.M.F. Multimodal-boost: Multimodal medical image super-resolution using multi-attention network with wavelet transform. IEEE ACM Trans. Comput. Biol. Bioinform. 2022, 20, 2420–2433. [Google Scholar] [CrossRef] [PubMed]
- Georgescu, M.I.; Ionescu, R.T.; Miron, A.I.; Savencu, O.; Ristea, N.C.; Verga, N.; Khan, F.S. Multimodal multi-head convolutional attention with various kernel sizes for medical image super-resolution. In Proceedings of the IEEE/CVF Winter Conference on Applications of Computer Vision 2023, Waikoloa, HI, USA, 2–7 January 2023; pp. 2195–2205. [Google Scholar]
- Yu, Y.; She, K.; Liu, J.; Cai, X.; Shi, K.; Kwon, O.M. A super-resolution network for medical imaging via transformation analysis of wavelet multi-resolution. Neural Netw. 2023, 166, 162–173. [Google Scholar] [CrossRef] [PubMed]
- Yu, Y.; She, K.; Shi, K.; Cai, X.; Kwon, O.M.; Soh, Y. Analysis of medical images super-resolution via a wavelet pyramid recursive neural network constrained by wavelet energy entropy. Neural Netw. 2024, 178, 106460. [Google Scholar] [CrossRef] [PubMed]
- Zhang, Y.; Li, K.; Li, K.; Wang, L.; Zhong, B.; Fu, Y. Image super-resolution using very deep residual channel attention networks. In Proceedings of the European Conference on Computer Vision (ECCV) 2018, Munich, Germany, 8–14 September 2018; pp. 286–301. [Google Scholar]
- Liang, J.; Cao, J.; Sun, G.; Zhang, K.; Van Gool, L.; Timofte, R. Swinir: Image restoration using swin transformer. In Proceedings of the IEEE/CVF International Conference on Computer Vision 2021, Montreal, BC, Canada, 11–17 October 2021; pp. 1833–1844. [Google Scholar]
- Odena, A.; Dumoulin, V.; Olah, C. Deconvolution and checkerboard artifacts. Distill 2016, 1, e3. [Google Scholar] [CrossRef]
- Kingma, D.P.; Ba, J. Adam: A method for stochastic optimization. arXiv 2014, arXiv:1412.6980. [Google Scholar]
- Wang, Z.; Bovik, A.C.; Sheikh, H.R.; Simoncelli, E.P. Image quality assessment: From error visibility to structural similarity. IEEE Trans. Image Process. 2004, 13, 600–612. [Google Scholar] [CrossRef] [PubMed]


| Component | Description | Primary Role |
|---|---|---|
| Channel–Spatial (CS) Block | Applies channel and spatial attention mechanisms to enhance high-frequency information. | Enhances high-frequency details for better feature extraction. |
| Residual Block | Calculates the residual between high-resolution and low-resolution images to improve reconstruction. | Generates natural and detailed high-resolution images. |
| Sub-Pixel Convolution | Upsamples low-resolution input images to high-resolution output images. | Increases image resolution while preserving details. |
| L1 Loss Function | Minimizes the difference between low- and high-resolution image patches during training. | Improves the quality of high-resolution image reconstruction. |
| Component | Specification |
|---|---|
| GPU | NVIDIA RTX 3090 (24 GB VRAM) |
| CPU | AMD Ryzen 3950X (16-core, 32-thread) |
| RAM | 64 GB DDR4 |
| Operating System | Ubuntu 20.04 LTS |
| Framework | PyTorch |
| Parameter | Value |
|---|---|
| Optimizer | Adam |
| Loss Function | L1 Loss |
| Batch Size | 64 |
| Epochs | 100 |
| Input Patch Size | 48 × 48 |
| Upscaling Factors | 2 × (48 × 48 → 96 × 96), 3× (48 × 48 → 144 × 144), 4 × (48 × 48 → 192 × 192) |
| Dataset | Scale | Bicubic PNSR/SSIM | VDSR PNSR/SSIM | EDSR PNSR/SSIM | Proposed Method PNSR/SSIM |
|---|---|---|---|---|---|
| ISIC_3371618 | ×2 | 36.4989/0.9862 | 37.2781/0.9873 | 38.9535/0.9856 | 39.6759/0.9930 |
| ×3 | 33.0617/0.9734 | 35.5203/0.9776 | 36.0538/0.9718 | 37.2398/0.9801 | |
| ×4 | 31.4003/0.9645 | 31.4003/0.9661 | 33.6596/0.9633 | 34.8293/0.9763 |
| Dataset | Scale | Bicubic PNSR/SSIM | VDSR PNSR/SSIM | EDSR PNSR/SSIM | Proposed Method PNSR/SSIM |
|---|---|---|---|---|---|
| ISIC_4382016 | ×2 | 30.5099/0.9892 | 32.7068/0.9832 | 33.6450/0.9890 | 34.6367/0.9868 |
| ×3 | 25.8663/0.9671 | 26.5130/0.9671 | 26.9616/0.9703 | 28.4344/0.9732 | |
| ×4 | 23.6031/0.9446 | 24.1231/0.9494 | 25.9737/0.9504 | 26.1630/0.9583 |
| Dataset | Scale | Bicubic PNSR/SSIM | VDSR PNSR/SSIM | EDSR PNSR/SSIM | Proposed Method PNSR/SSIM |
|---|---|---|---|---|---|
| ISIC | ×2 | 40.9848/0.9956 | 42.1513/0.9956 | 43.7888/0.9983 | 44.0720/0.9983 |
| ×3 | 38.7052/0.9870 | 39.9154/0.9892 | 41.4544/0.9922 | 41.4387/0.9932 | |
| ×4 | 35.2591/0.9823 | 37.0129/0.9866 | 39.5213/0.9887 | 39.7872/0.9907 |
Disclaimer/Publisher’s Note: The statements, opinions and data contained in all publications are solely those of the individual author(s) and contributor(s) and not of MDPI and/or the editor(s). MDPI and/or the editor(s) disclaim responsibility for any injury to people or property resulting from any ideas, methods, instructions or products referred to in the content. |
© 2025 by the authors. Licensee MDPI, Basel, Switzerland. This article is an open access article distributed under the terms and conditions of the Creative Commons Attribution (CC BY) license (https://creativecommons.org/licenses/by/4.0/).
Share and Cite
Lee, D.Y.; Kim, J.Y.; Cho, S.Y. Improving Medical Image Quality Using a Super-Resolution Technique with Attention Mechanism. Appl. Sci. 2025, 15, 867. https://doi.org/10.3390/app15020867
Lee DY, Kim JY, Cho SY. Improving Medical Image Quality Using a Super-Resolution Technique with Attention Mechanism. Applied Sciences. 2025; 15(2):867. https://doi.org/10.3390/app15020867
Chicago/Turabian StyleLee, Dong Yun, Jang Yeop Kim, and Soo Young Cho. 2025. "Improving Medical Image Quality Using a Super-Resolution Technique with Attention Mechanism" Applied Sciences 15, no. 2: 867. https://doi.org/10.3390/app15020867
APA StyleLee, D. Y., Kim, J. Y., & Cho, S. Y. (2025). Improving Medical Image Quality Using a Super-Resolution Technique with Attention Mechanism. Applied Sciences, 15(2), 867. https://doi.org/10.3390/app15020867