Article

Enhancing Clinical Assessment of Skin Ulcers with Automated and Objective Convolutional Neural Network-Based Segmentation and 3D Analysis

1
Department of Electronic Engineering and Telecommunications (DET), Politecnico di Torino, 10129 Turin, Italy
2
Department of Management and Production Engineering (DIGEP), Politecnico di Torino, 10129 Turin, Italy
3
Vulnology Unit, Clinica Eporediese, 10015 Ivrea, Italy
*
Author to whom correspondence should be addressed.
Appl. Sci. 2025, 15(2), 833; https://doi.org/10.3390/app15020833
Submission received: 25 November 2024 / Revised: 4 January 2025 / Accepted: 14 January 2025 / Published: 16 January 2025
(This article belongs to the Special Issue Pioneering Progress in Medical Imaging and Diagnostic Advancements)

Abstract

:
Skin ulcers are open wounds on the skin characterized by the loss of epidermal tissue. Skin ulcers can be acute or chronic, with chronic ulcers persisting for over six weeks and often being difficult to heal. Treating chronic wounds involves periodic visual inspections to control infection and maintain moisture balance, with edge and size analysis used to track wound evolution. This condition mostly affects individuals over 65 years old and is often associated with chronic conditions such as diabetes, vascular issues, heart diseases, and obesity. Early detection, assessment, and treatment are crucial for recovery. This study introduces a method for automatically detecting and segmenting skin ulcers using a Convolutional Neural Network and two-dimensional images. Additionally, a three-dimensional image analysis is employed to extract key clinical parameters for patient assessment. The developed system aims to equip specialists and healthcare providers with an objective tool for assessing and monitoring skin ulcers. An interactive graphical interface, implemented in Unity3D, allows healthcare operators to interact with the system and visualize the extracted parameters of the ulcer. This approach seeks to address the need for precise and efficient monitoring tools in managing chronic wounds, providing a significant advancement in the field by automating and improving the accuracy of ulcer assessment.

1. Introduction

Wound care is a specialized medical field focused on the assessment, treatment, and management of wounds that fail to heal properly, such as chronic ulcers, burns, or surgical wounds. It involves a multidisciplinary approach to promote healing, prevent infection, and reduce complications, often incorporating techniques such as cleaning, dressing, debridement, and advanced therapies like negative-pressure wound therapy or the use of bioengineered skin substitutes [1]. Effective wound care aims to restore the skin’s integrity while minimizing pain and improving the patient’s overall quality of life. It is a condition that affects approximately 1–2% of the global population [2].
This medical field has long been considered a second-tier specialty but has gained recognition as the importance of chronic wound management has grown, especially with aging populations and the rise of conditions like diabetes [3]. However, it has been recognized that the clinical pathway for the diagnosis and treatment of skin ulcers requires particular attention. Skin ulcers are open wounds on the skin characterized by the loss of epidermal tissue, often resulting from various underlying conditions such as poor circulation, pressure, or infection [4]. They can be acute or chronic, with chronic ulcers persisting for over six weeks and often being difficult to heal [5]. The management of skin ulcers is complex and varies based on their etiology and severity, necessitating a comprehensive understanding of their pathophysiology and treatment options. In addition, wounds that do not respond to standard therapies have a significant impact causing discomfort in the daily lives of patients and their caregivers and increasing the burden on the healthcare system. Early detection, assessment, and treatment of the wound are crucial for patient recovery. Estimates suggest that about 5–10% of individuals will suffer from this condition during their lifetime, while the annual incidence ranges from 0.3% to 1.9% [6]. Further studies have shown that after four weeks, there is a 30 % chance that the injury will never heal, in particular, a 50 % chance of loss of the affected limb and a 50 % probability of death within the next five years [7].
Several interviews conducted with specialists in the field revealed an alarming situation regarding the scarcity of experts and the lack of standardized protocols for the diagnosis and the definition of treatment plans. In particular, it was found that in clinical practice, wound dressing and monitoring were typically performed by nurses and non-specialist caregivers, who rotated in the care of the patient. This rotation often cannot ensure continuity and adequate attention to each patient. These issues highlight the need for a tool that supports clinicians and healthcare providers in the clinical evaluation of wound status, providing fast, precise, and objective assessment. Although new opportunities are emerging for the development of new innovative techniques in this field [8,9], gaining the trust of physicians remains a challenge. Moreover, the high cost of technology and the attachment to traditional visual methods for wound assessment continue to dominate the clinical management of skin lesions [10]. On the other hand, it is important to consider that traditional methods for extracting evaluation parameters are often rudimentary, imprecise, and painful for the patient. Specifically, measuring the wound area is traditionally done with simple tools such as a ruler [11], especially in homecare settings. This approach can only measure regular shapes, such as the area of a square or a rectangle, leading to measurement errors of up to 30%, as shown in Figure 1a.
Beyond the lack of precision in extracting wound parameters, manual measurement also causes discomfort and sometimes pain to the patient due to direct contact with the sensitive damaged skin.
Given these premises, the need clearly emerges to introduce and promote the use of technologies capable of automatically and accurately providing information regarding skin ulcers, thereby offering a support tool for physicians to quickly provide a comprehensive clinical picture of the patient and the status of the wound.
As the healthcare landscape continues to evolve, the integration of AI and digital tools is revolutionizing traditional practices, setting new standards for efficiency and effectiveness in all the phases of the clinical practice [12]. This shift highlights the limitations of manual techniques and underscores the critical role of technology in advancing patient care.
In recent years, there has been increasing attention to this topic and the development of new solutions for skin ulcer assessment that are more accurate and non-invasive. To this end, a study was conducted by Biagioni et al. [13] to test a smartphone application capable of calculating the wound area from a picture. That method allowed for a more precise measurement by manually outlining the irregular shape of the lesion. However, it still heavily depended on the operator’s experience and remained a time-consuming process.
An innovative aspect in the evaluation of chronic wounds is the development of new approaches to standardize the accuracy of their measurement. For this reason, there is a push towards various computer-aided solutions for the automatic segmentation of skin ulcers, enabling more accurate and faster analysis [14]. Furthermore, several studies have demonstrated that protocols enabling easy and continuous monitoring through standardized data are key factors in preventing complications like infection and the occurrence of necrotic tissue, which can lead to the need for surgical intervention [15,16]. This topic has been studied by various research groups, which have developed artificial intelligence (AI) algorithms demonstrating the reliability of such tools in the field of wound care [17].
Recent works [18,19] have also demonstrated the capability of automatically identifying and determining the etiology of wounds through advanced computational means. In particular, an approach was proposed by Secco et al. [20], who developed a technology, shown in Figure 1b, integrating a memristive Discrete-Time Cellular Neural Network (DT-CNN) capable of automatically identifying, classifying, and measuring wounds through 2D wound images, with an accuracy of up to 90%. In another work, the actual reliability of such a telemedical device for supporting the diagnosis and monitoring of skin ulcers was demonstrated through a clinical trial that showed the clinical utility and effectiveness of an AI-based tool capable of providing precise and reliable clinical information to the physician in a telemedical setting [21].
Given the current state of the art, the purpose of this work was to integrate a three-dimensional approach into the traditional two-dimensional methods for extracting wound assessment parameters, providing a more comprehensive picture of the skin lesion condition. Specifically, the goal was to develop an AI-powered tool for more accurate and efficient monitoring of the wound progression to support the physician, enabling the XR interaction and visualization of the patient’s clinical history alongside the wound’s two-dimensional and three-dimensional parameters, such as its area and perimeter. Such a tool provides the opportunity to support clinicians through automated and standardized processes, leading to more efficient patient management by enabling a rapid and accurate storage of clinical data.
The remainder of this paper is structured as follows: Section 2 outlines the implementation of wound detection and segmentation using a CNN, parameter extraction from depth maps and 2D images, and the handling of 3D models within Unity3D. It also discusses the integration and functionality of the interactive graphical interface. Section 3 presents the obtained results. Section 4 discusses the results, addresses limitations, and suggests potential future implementations of the technology. Finally, Section 5 provides the conclusions.

2. Materials and Methods

The current work aimed to develop a tool designed to assist physicians in the diagnosis and management of patients with skin ulcers. Specifically, earlier identification and intervention reduce the risk of complications such as infections or wound worsening. Moreover, improved detection accuracy leads to more reliable assessments, enabling tailored treatment plans that can enhance healing outcomes and reduce recovery times. This precision minimizes misdiagnoses, which can result in unnecessary treatments or delays in addressing the underlying issue. The proposed procedure, summarized in Figure 2, leverages AI and XR technologies to provide enhanced support by enabling the more accurate identification of skin ulcers.
RGB images were used for the automatic wound segmentation based on the employment of a Convolutional Neural Network (CNN). After the coordinates identified on the RGB images were mapped onto depth images, the area and perimeter parameters of the wound were calculated based on the obtained 2D and 3D segmentation. Subsequently, the 3D point clouds were rendered within a custom-built XR application, after undergoing a preprocessing stage designed to enhance the quality of the data.
The publicly available WoundsDB database [22] was utilized to develop the proposed procedure. WoundDB includes images obtained from 47 patients with skin ulcers. Images were captured in various modalities along the same axis, including RGB photography, thermovision, stereovision, and depth perception. For the current application, the following images were selected: RGB images, in png format, acquired with a FujiFilm X-T1 digital camera equipped with Fujinon XF/XC lenses (FujiFilm, Tokyo, Japan); depth images, in ply format, captured using a SwissRanger SR4000 time-of-flight camera (SwissRanger, Neuchâtel, Switzerland); and thermal information acquired through a FLIR A300 thermal camera (FLIR, Wilsonville, OR, USA).
The procedure description is detailed in the following subsections: First, Section 2.1 describes how the neural network was implemented with detection and segmentation tasks for processing 2D RGB images of wounds. Once the network was trained, obtained lesions contours were mapped onto the depth images, and the quantitative parameters for the ulcer assessment were extracted, as outlined in Section 2.2. Finally, Section 2.3 presents the development of an XR application for skin ulcer visualization.

2.1. Automatic Skin Ulcer Segmentation

This section describes the process of automatically identifying and outlining the boundaries of skin ulcers from standard digital photographs using advanced artificial intelligence (AI) techniques. The primary goal of this process was to accurately and objectively assess the wound’s characteristics without relying on manual methods, which can be time-consuming, prone to human error, and often inconsistent. To achieve this, the method employed a state-of-the-art AI model known as YOLOv8-seg, a neural network specifically designed for tasks involving object detection and segmentation.
This AI model was trained on a dataset of wound images to recognize and distinguish ulcer areas from the surrounding healthy skin or background. The training process involved exposing the model to various wound images, augmented with techniques like blurring, grayscale conversion, and contrast enhancement, to improve its ability to generalize across different wound types and imaging conditions. Once trained, the model processed each input photograph, identifying the wound and creating precise outlines or masks that delineated its boundaries.
These automatically generated outlines served as a foundation for further analyses, such as calculating wound dimensions and integrating the data into three-dimensional models. By automating this initial step, the approach ensured a high degree of accuracy and reproducibility, making it an essential component for advanced wound assessment systems and clinical applications.
The YOLOv8-seg network [23] was chosen since it has demonstrated significant effectiveness when applied to various medical applications, such as cancer detection [24,25], skin lesion segmentation [26], and pill identification [27]. These applications have led to marked improvements in diagnostic accuracy, enabling more precise assessments and earlier detection. Additionally, the integration of such models has streamlined treatment processes, allowing for faster and more efficient therapeutic interventions. The underlying architecture is based on a Region-based Convolutional Neural Network (R-CNN), structured with alternating convolutional layers, pooling layers, and activation functions to extract relevant features from input data and perform object detection tasks.
For the current application, we utilized the YOLOv8-seg model, a state-of-the-art variant of the YOLO framework, pre-trained on the large Common Objects in Context (COCO) dataset. This open-source model, available from Ultralytics, has been specifically designed to address challenges in real-time object detection and segmentation. In particular, the YOLOv8-seg version incorporates improvements for more precise object localization and segmentation, making it well suited for tasks that require high accuracy in distinguishing objects of interest within complex images. The Region Proposal Network (RPN) employed by YOLOv8-seg performs a critical function by first localizing the object of interest within an image using a bounding box. Once the object is localized, the network segments it from the background or other surrounding elements. This two-stage process, which involves object localization and segmentation, ensures that the model can effectively distinguish the target object with a high precision degree, even in cluttered environments. YOLOv8 uses the max pooling operation in its pooling layers to help reduce the spatial dimensions of the feature maps, which aids in capturing essential information while minimizing computational complexity. The intermediate layers of the network utilize the Sigmoid Linear Unit (SiLU) as the activation function, which introduces non-linearity and helps the network learn complex patterns more effectively (1). In the final layer, the sigmoid activation function is applied to produce the output of the model, ensuring that the results are appropriately scaled for binary classification tasks, such as determining the presence or absence of an object within a given region (2).
S i L U ( x ) = x σ ( x ) ,
σ ( x ) = 1 1 + e x ,
Furthermore, during the learning phase, the network implements a loss function with three assigned weights: one concerning the loss component on the bounding box that identifies the object of interest, the second one related to the loss component on the segmentation task, and the last one related to the loss component on the predicted object class, if the objective includes an object classification task.
The standard hyperparameters of the model, shown in Table 1, were chosen, except for the number of training epochs, which was set to 150 due to the limited size of the available dataset, and the patience parameter, which was set to 30 epochs to avoid over-fitting on the Training Set.
Additionally, data augmentation was applied to the dataset by means of the albumentations library in order to enhance the model’s robustness and generalization ability. Several image transformation techniques were used to augment and preprocess images: blur, to improve the robustness of models to slight variations in sharpness and focus by applying a blur effect; median blur, for removing salt-and-pepper noise while keeping the edges of objects relatively sharp; grayscale, helpful for simplifying color information and focusing on the structure and features of the image, reducing computational complexity and making models more robust to variations in color; Contrast-Limited Adaptive Histogram Equalization (CLAHE), to enhance features in areas with subtle variations, by improving the contrast of the image, especially in regions with a poor one. Selected parameters are reported in Table 2.
After further consideration, it was decided to expand the available dataset of RGB images, as it was too limited in the number of images for the current work. Therefore, an additional dataset containing 319 RGB images acquired through the Wound Viewer (WV) device was used [20]. Such data were anonymized and used for research purposes.
For the network training and validation, 84 RGB images were extracted from the WoundsDB database to create Dataset A. As depicted in Figure 3a, that dataset was initially split into a Construction Set and a Test Set. Approximately 70% of the images were allocated to the Construction Set, with the remaining assigned to the Test Set. Within the Construction Set, a further division was made: 60% for the Training Set, used to train the network and 40% for the Validation Set, employed to fine-tune network parameters.
After evaluating the segmentation performance on the Test Set of Dataset A, Dataset B was created by incorporating additional images acquired through the WV device. Figure 3b illustrates the updated dataset. The additional images augmented the Training and Validation Sets, while the Test Set retained only the original WoundsDB images, crucial for subsequent ulcer parameter calculation and visualization in the Unity3D environment.
The initial splits used for the WoundsDB were preserved, with no new images added to the Test Set, ensuring a high representation of this dataset in the network’s training examples. This decision was driven by the study’s focus on achieving robust segmentation performance specifically on WoundsDB images.
For training, the network required a ground-truth text file for each image in the Training and Validation Sets and given the dataset’s size constraints, a single-class training approach was adopted, with “Ulcer” designated as the sole object of interest to recognize. Creating the ground truth required the following steps: (1) manual segmentation of each image; (2) creation of the binary masks to identify the regions of interest; (3) extraction of the object contour coordinates; (4) creation of text files, where each line contained the class identification number of the object and the corresponding extracted coordinates of the contour.
Once the network was trained with lesion detection and segmentation tasks, inference was performed on the Test Set. Different metrics were considered to quantify network performance. The Intersection over Union (IoU) evaluated the degree of overlap between the objects contained in the two masks and was calculated as follows:
I o U = X Y X Y
where X is the set of white pixels belonging to the manual mask and Y is the set of white pixels belonging to the automatic mask. This metric ranges from 0 to 1.
The counting error was computed as reported below:
E r r o r = N m a n u a l N a u t o m a t i c
where N m a n u a l represents the number of objects contained in the manual mask, and N a u t o m a t i c is the number of objects detected in the automatic mask.
Finally, to quantify the performance improvement obtained by training the network on Dataset B, the percentage increase in the average IoU was computed as:
I m p r o v e m e n t = I o U B I o U A I o U A
where I o U A is the average IoU calculated from the inference performed with the weights trained on Dataset A, and I o U B is the average IoU calculated from the inference performed with the weights trained on Dataset B. Comparing the performance achieved using datasets of varying sizes is essential for quantifying the actual improvement that comes with increased data availability. This type of analysis allows for a precise evaluation of the impact that expanding the dataset has on model performance, highlighting how much the increase in available data can influence the quality of the results obtained. Especially in the medical field, various factors may limit the use of large datasets, such as privacy concerns and data security. Therefore, this type of analysis can serve as a guide for future research, helping to navigate these challenges while assessing the potential benefits of increased data availability.

2.2. Skin Ulcer Parameter Extraction

The following steps for surface segmentation and parameter extraction were carried out using the output from the inference performed on the Test Set, which contained only WoundsDB images and their associated depth information. Starting from the binary mask obtained through the CNN automatic segmentation, the coordinates of the 2D ulcer contour and its internal pixels were extracted.
Before proceeding with the 3D segmentation, a preprocessing of the 3D point cloud was performed to ensure the alignment of the RGB and depth Field of Views (FOVs). This process was carried out through the color thermal information that was superimposed on the 3D object only in the common area. Therefore, grayscale vertices were excluded. In particular, processing of the input point cloud was performed by removing points with identical color information across red, green, and blue channels, indicating grayscale values. Finally, further refinement was achieved by excluding isolated vertices representing noise.
To convert the automatic 2D segmentation obtained with the CNN into a 3D segmentation, pixel coordinates of the 2D image were uniquely associated with the X and Y coordinates of the 3D point cloud. First, the 3D coordinates were sorted in descending order, and a median filter was applied using a non-overlapping sliding kernel, resampling the axes to 240 × 320 for Y and X. Then, 2D segmentation coordinates, extracted from the binary mask, were converted into 3D coordinates by obtaining the corresponding Z values through linear interpolation with the original point cloud. A further translation of −20 along the x-axis and −5 along the y-axis was applied for refinement. Subsequently, the 3D segmentation contour coordinates extracted were stored in a txt file for the visualization step. Similarly, the internal points of the 3D graphic object within the segmented wound were obtained for area computation and wound visualization.
After the preprocessing step and the calculation of the lesion’s 3D coordinates, the 3D point cloud was reconstructed into a surface using the Screened Poisson Surface Reconstruction (SPSR) technique [28], while for the ulcer area, the Ball Pivoting method was employed to preserve the number of vertices [29]. Once the lesion segmentation process was completed, it was possible to calculate the area and parameter in both three-dimensional and two-dimensional coordinates.
The 3D and 2D perimeters were computed by summing the Euclidean distances between consecutive contour points ( X c , Y c , Z c ), with or without considering the Z dimension, as shown in Equation (6).
P = i = 1 N 1 ( X i + 1 c X i c ) 2 + ( Y i + 1 c Y i c ) 2 + ( Z i + 1 c Z i c ) 2 ,
where i = 1 , 2 , , N 1 identifies the contour point, and N is the total number of points.
The 2D area was evaluated using Delaunay triangulation [30], while the 3D area was calculated by summing the areas of the obtained triangular faces, whose coordinates were retrieved from the ply file.

2.3. XR Environment for Skin Ulcer Visualization

An environment conceived to identify ulcers through AI-powered automatic recognition can greatly benefit from the integration of XR. By incorporating XR, the application can enhance visualization and interaction with 3D information, making it more precise and intuitive for users. A user-centered design approach is crucial in this context, as it ensures the tool is tailored to the specific needs and workflows of its users, i.e., the healthcare professionals. This approach highlights the necessity for a visualization system that not only provides accurate 3D representations of ulcers but also allows for seamless and user-friendly manipulation of the data. XR can enable users to explore the ulcer’s morphology, size, and spatial characteristics in a more natural and immersive manner, thereby improving diagnostic accuracy and facilitating effective decision-making. The result is a tool that bridges the gap between complex AI outputs and practical, real-world usability.
In this sense, a preliminary XR environment exploiting automatic skin ulcer identification was developed. The prototype of the designed environment’s Graphical User Interface (GUI) is shown in Figure 4.
As shown, the 3D model of the ulcer is positioned centrally in the user’s FOV. This design choice was made to ensure that the potential of XR was aimed primarily at enhancing the presentation of the three-dimensional information while keeping the rest of the visual field as uncluttered as possible. This approach minimizes distractions that could negatively affect the user experience, a consideration that applies equally to virtual reality and augmented reality environments [31]. On the left side of the interface, the upper section displays the reference RGB image, which is used for automatic recognition based on artificial intelligence. The lower section includes a window that displays patient-related metadata, such as ID, gender, age, or medical record number. On the right side of the interface, the upper section presents a panel that allows users to adjust the properties of the 3D ulcer model, such as color and material, and access controls to calculate quantitative parameters, including the perimeter and area of the ulcer. The 3D contour outlining the ulcer’s perimeter was generated from the coordinates identified through the CNN-based segmentation and mapped onto the 3D surface (Figure 5). Specifically, Blender (version 4.1) was used to generate a polygon from the interpolated coordinates of the depth map (z) and the coordinates of the CNN segmentation (x, y).
Finally, the bottom section shows a final window containing the patient’s medical history and clinical picture.
The designed GUI was implemented using the cross-platform game engine Unity3D (version 2022.3.31f1), and the Mixed Reality ToolKit (MRTK) (version 2.8.3) was included to support user interactions within the application. The MRTK framework offers a set of components mainly intended for creating XR applications, including features for detecting hand gestures, tracking head movements, and recognizing voice commands. The system was designed to ensure a smooth and interactive user experience, with an emphasis on customization and flexibility in interacting with the 3D model. To this end, interactive objects inside the virtual scene, such as the 3D model of the ulcer, were equipped with specific components to enable direct manipulation through gestures and physical interactions. In addition, constraints were applied to properly handle transformations, such as translation, rotation, and scaling, ensuring the intuitive and precise management of 3D objects in the virtual environment. In addition, a material derived from the 3D model of the thermal map was applied to the ulcer model for color extraction. However, users are provided with the option to modify the color, including a toggle feature that allows switching between heatmap rendering and a neutral color scheme.

3. Results

This section emphasizes the most significant aspects that contribute to the accurate identification of the ulcer-affected region. First, the outcomes of the automatic ulcer recognition process are analyzed, showcasing how effectively the system identifies and delineates the ulcer area from the input data. This step is critical, as it lays the foundation for the subsequent analyses and ensures that the identified region is precise and reliable.
Next, attention is given to the performance of the 3D reconstruction phase. This involves evaluating how accurately the system reconstructs the three-dimensional morphology of the ulcer and how well it supports the extraction of quantitative parameters, such as area and perimeter. These parameters are essential for assessing the severity and progression of the condition, making their accuracy and reliability pivotal for both diagnostic and monitoring purposes.
Finally, the development of a preliminary user interface is discussed. This interface is designed to visualize the results clearly and intuitively, tailored to the needs of healthcare professionals. The goal is to present the extracted information, both in terms of visual models and quantitative data, in a way that maximizes its usability and supports clinical decision-making. By integrating user-friendly design principles, the interface ensures that complex data are made accessible, reducing cognitive load and allowing healthcare providers to focus on delivering optimal patient care.

3.1. Segmentation Assessment

Following the training of YOLO with both datasets, the loss functions were evaluated on the segmentation task to ensure that the number of epochs and patience settings were appropriate.
Figure 6 shows the trend in the segmentation loss function in both training sessions. In the case of Dataset A (Figure 6a), training was stopped at epoch 101 because no improvement in validation metrics had been observed in the last 30 epochs. For Dataset B (Figure 6b), the training continued until epoch 150, as there were slight improvements up to that threshold. However, the number of training epochs set to 150 was appropriate, as the loss function reached a plateau beyond which no further decrease was likely to occur.
After training and tuning the network, the segmentation performance was evaluated by running inference on the Test Set with the weights obtained from both training sessions. Figure 7 shows an example of the output results from the trained network, given as input the example RGB image (Figure 7a). The object of interest was detected through a bounding box reporting the confidence level (Figure 7b). Subsequently, each pixel within the bounding box was classified as either belonging or not belonging to the object of interest, resulting in the segmentation of the detected lesion. From the YOLO network’s inference output, a binary mask was obtained for further analysis, as shown in Figure 7c.
For the evaluation of the detection and segmentation performance, the IoU and counting error values were obtained for each image. The results obtained with the training on Dataset A are shown in Figure 8a, with an average IoU of 0.56 ± 0.23 , a median value of 0.62, and five images where the network failed to detect any lesions.
Using Dataset B instead, the results shown in Figure 8b were obtained, with an average IoU of 0.66 ± 0.25 , a median value of 0.77, and only two images where no detection occurred. The counting errors on individual images were also lower, with 18 images having no error in the number of detected lesions, compared to 11 with the initial dataset. Overall, the increase in the number of training and tuning examples, even with wound images acquired using devices with different characteristics, led to an 18% improvement in segmentation performance in terms of average IoU.

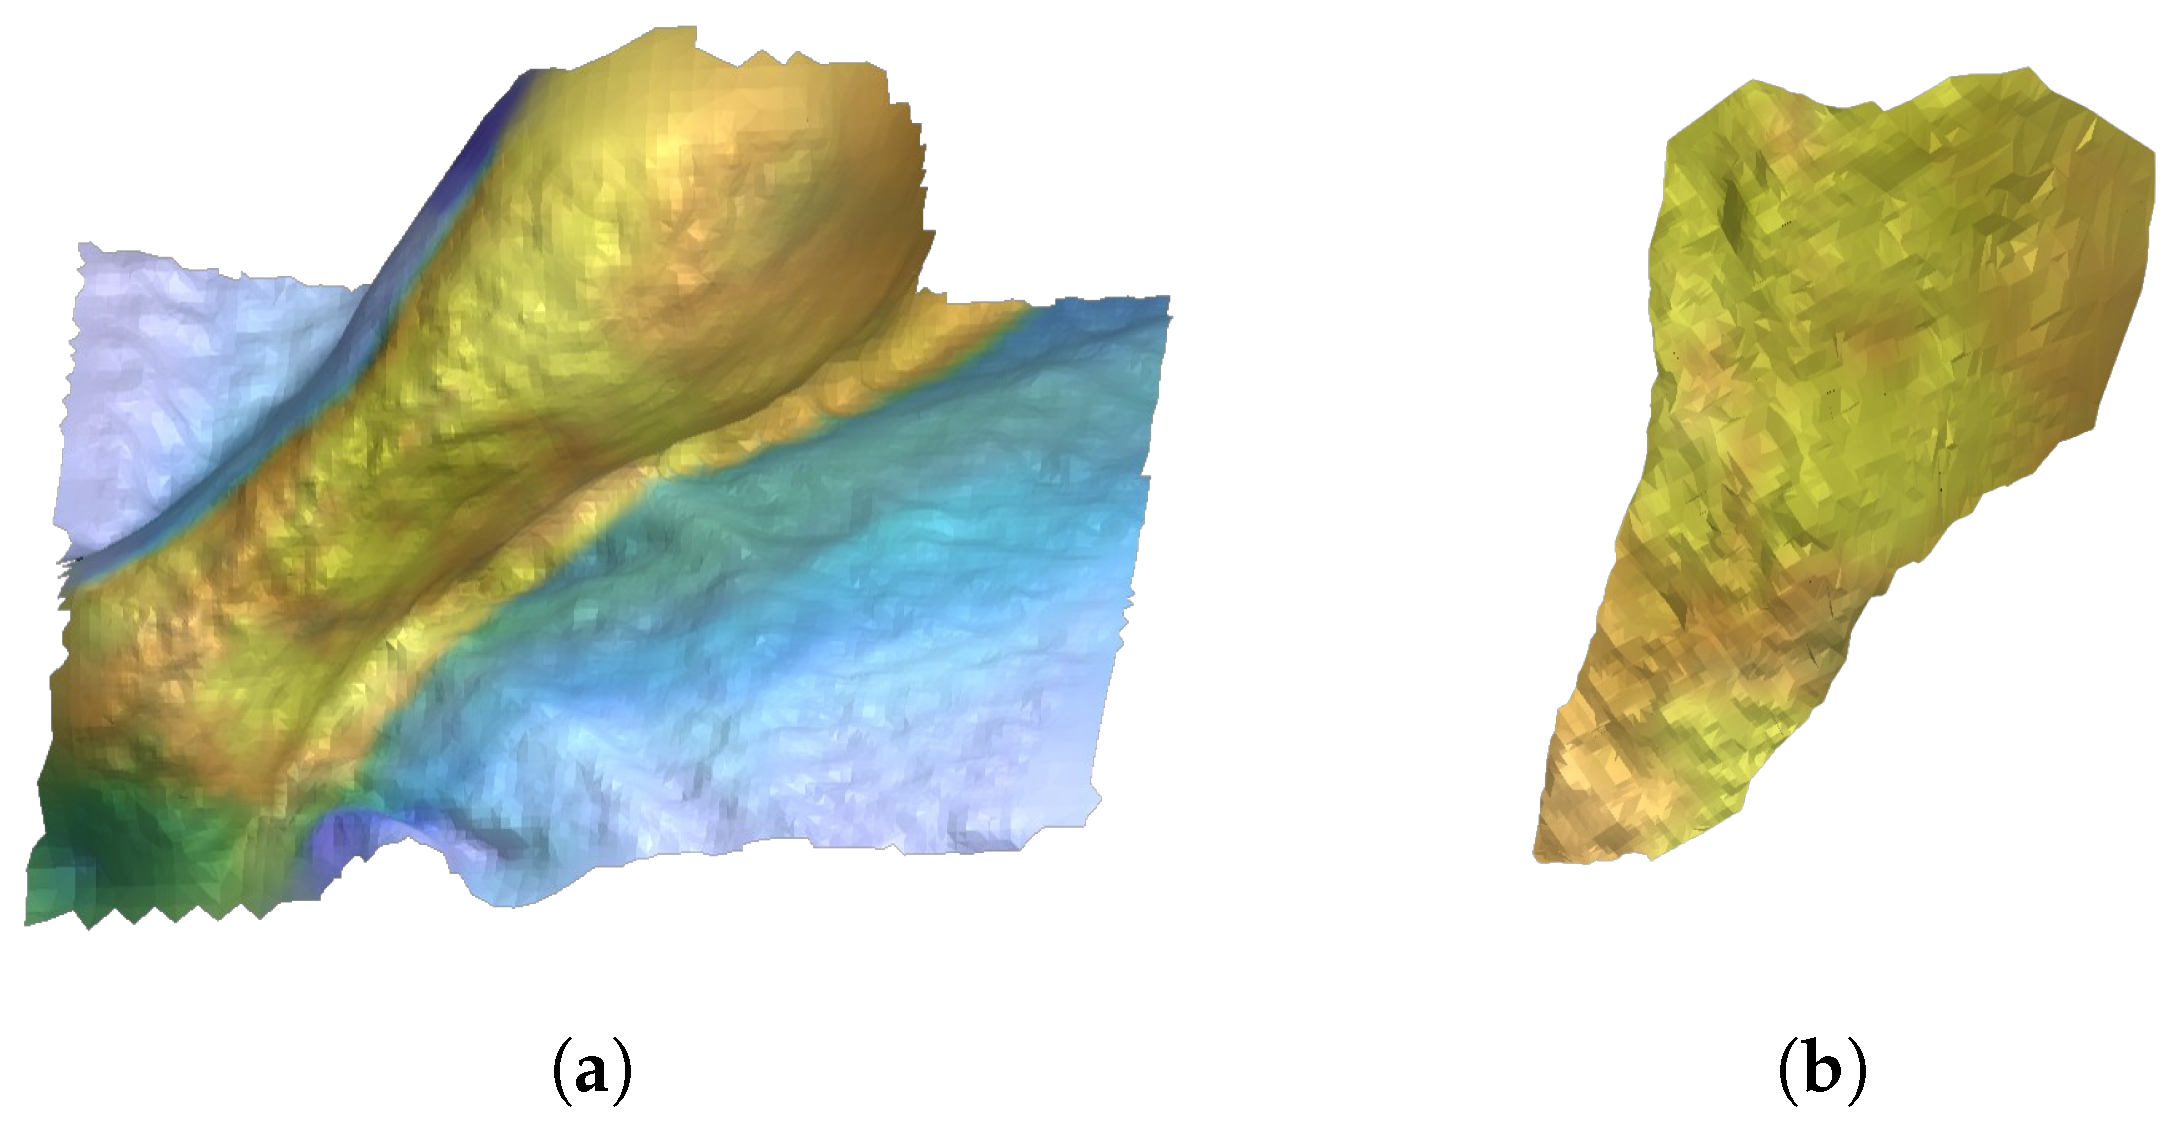
3.2. Surface Segmentation and Parameter Evaluation

The identification of the region of interest began with an essential preprocessing step involving the cleaning of the point cloud. This process was aimed at removing noise, outliers, and irrelevant data points that could otherwise interfere with the accuracy of the subsequent 3D reconstruction. By refining the point cloud, the quality and precision of the generated mesh were significantly improved, ensuring that the reconstructed surface accurately represented the ulcer region. This step was critical for maintaining the integrity of the data and for enabling a reliable analysis in later stages, such as the extraction of quantitative parameters or the visualization of the 3D model.
Figure 9a shows the initial point cloud corresponding to the analyzed ulcer. The preliminary preprocessing method implemented resulted in a mostly accurate alignment of the FOV with respect to the RGB camera, as depicted in Figure 9b.
Surface reconstruction of the cleaned depth 3D image yielded the result shown in Figure 10a. Furthermore, internal ulcer points were leveraged to isolate and reconstruct the ulcer surface shown in Figure 10b.
The quantitative parameters of the perimeter and area were then extracted as support for the clinical evaluation of the wound. The results are shown in Table 3 which summarizes the considered ulcer parameters.
The 3D perimeter resulted in a value of 66.8 cm, which would have been strongly underestimated if measured in the 2D domain, yielding 39.5 cm. The 3D area computation followed a similar trend, showing almost a doubled value compared to the 2D measurements. The importance of 3D information lies in its ability to capture the true geometry and spatial characteristics of complex surfaces, which are often oversimplified in 2D representations. In the case of the ulcer measurements, the 3D perimeter and area significantly exceeded their 2D counterparts, illustrating how flat, two-dimensional approximations can underestimate the true extent of irregular or curved regions. By incorporating 3D data, it becomes possible to account for variations in surface topography and depth, providing a more accurate and comprehensive assessment of the ulcer’s dimensions. This level of precision is crucial for clinical applications, where reliable measurements are necessary for diagnosis, treatment planning, and monitoring the progression or healing of the condition. Without 3D information, critical details may be missed, leading to suboptimal clinical outcomes.

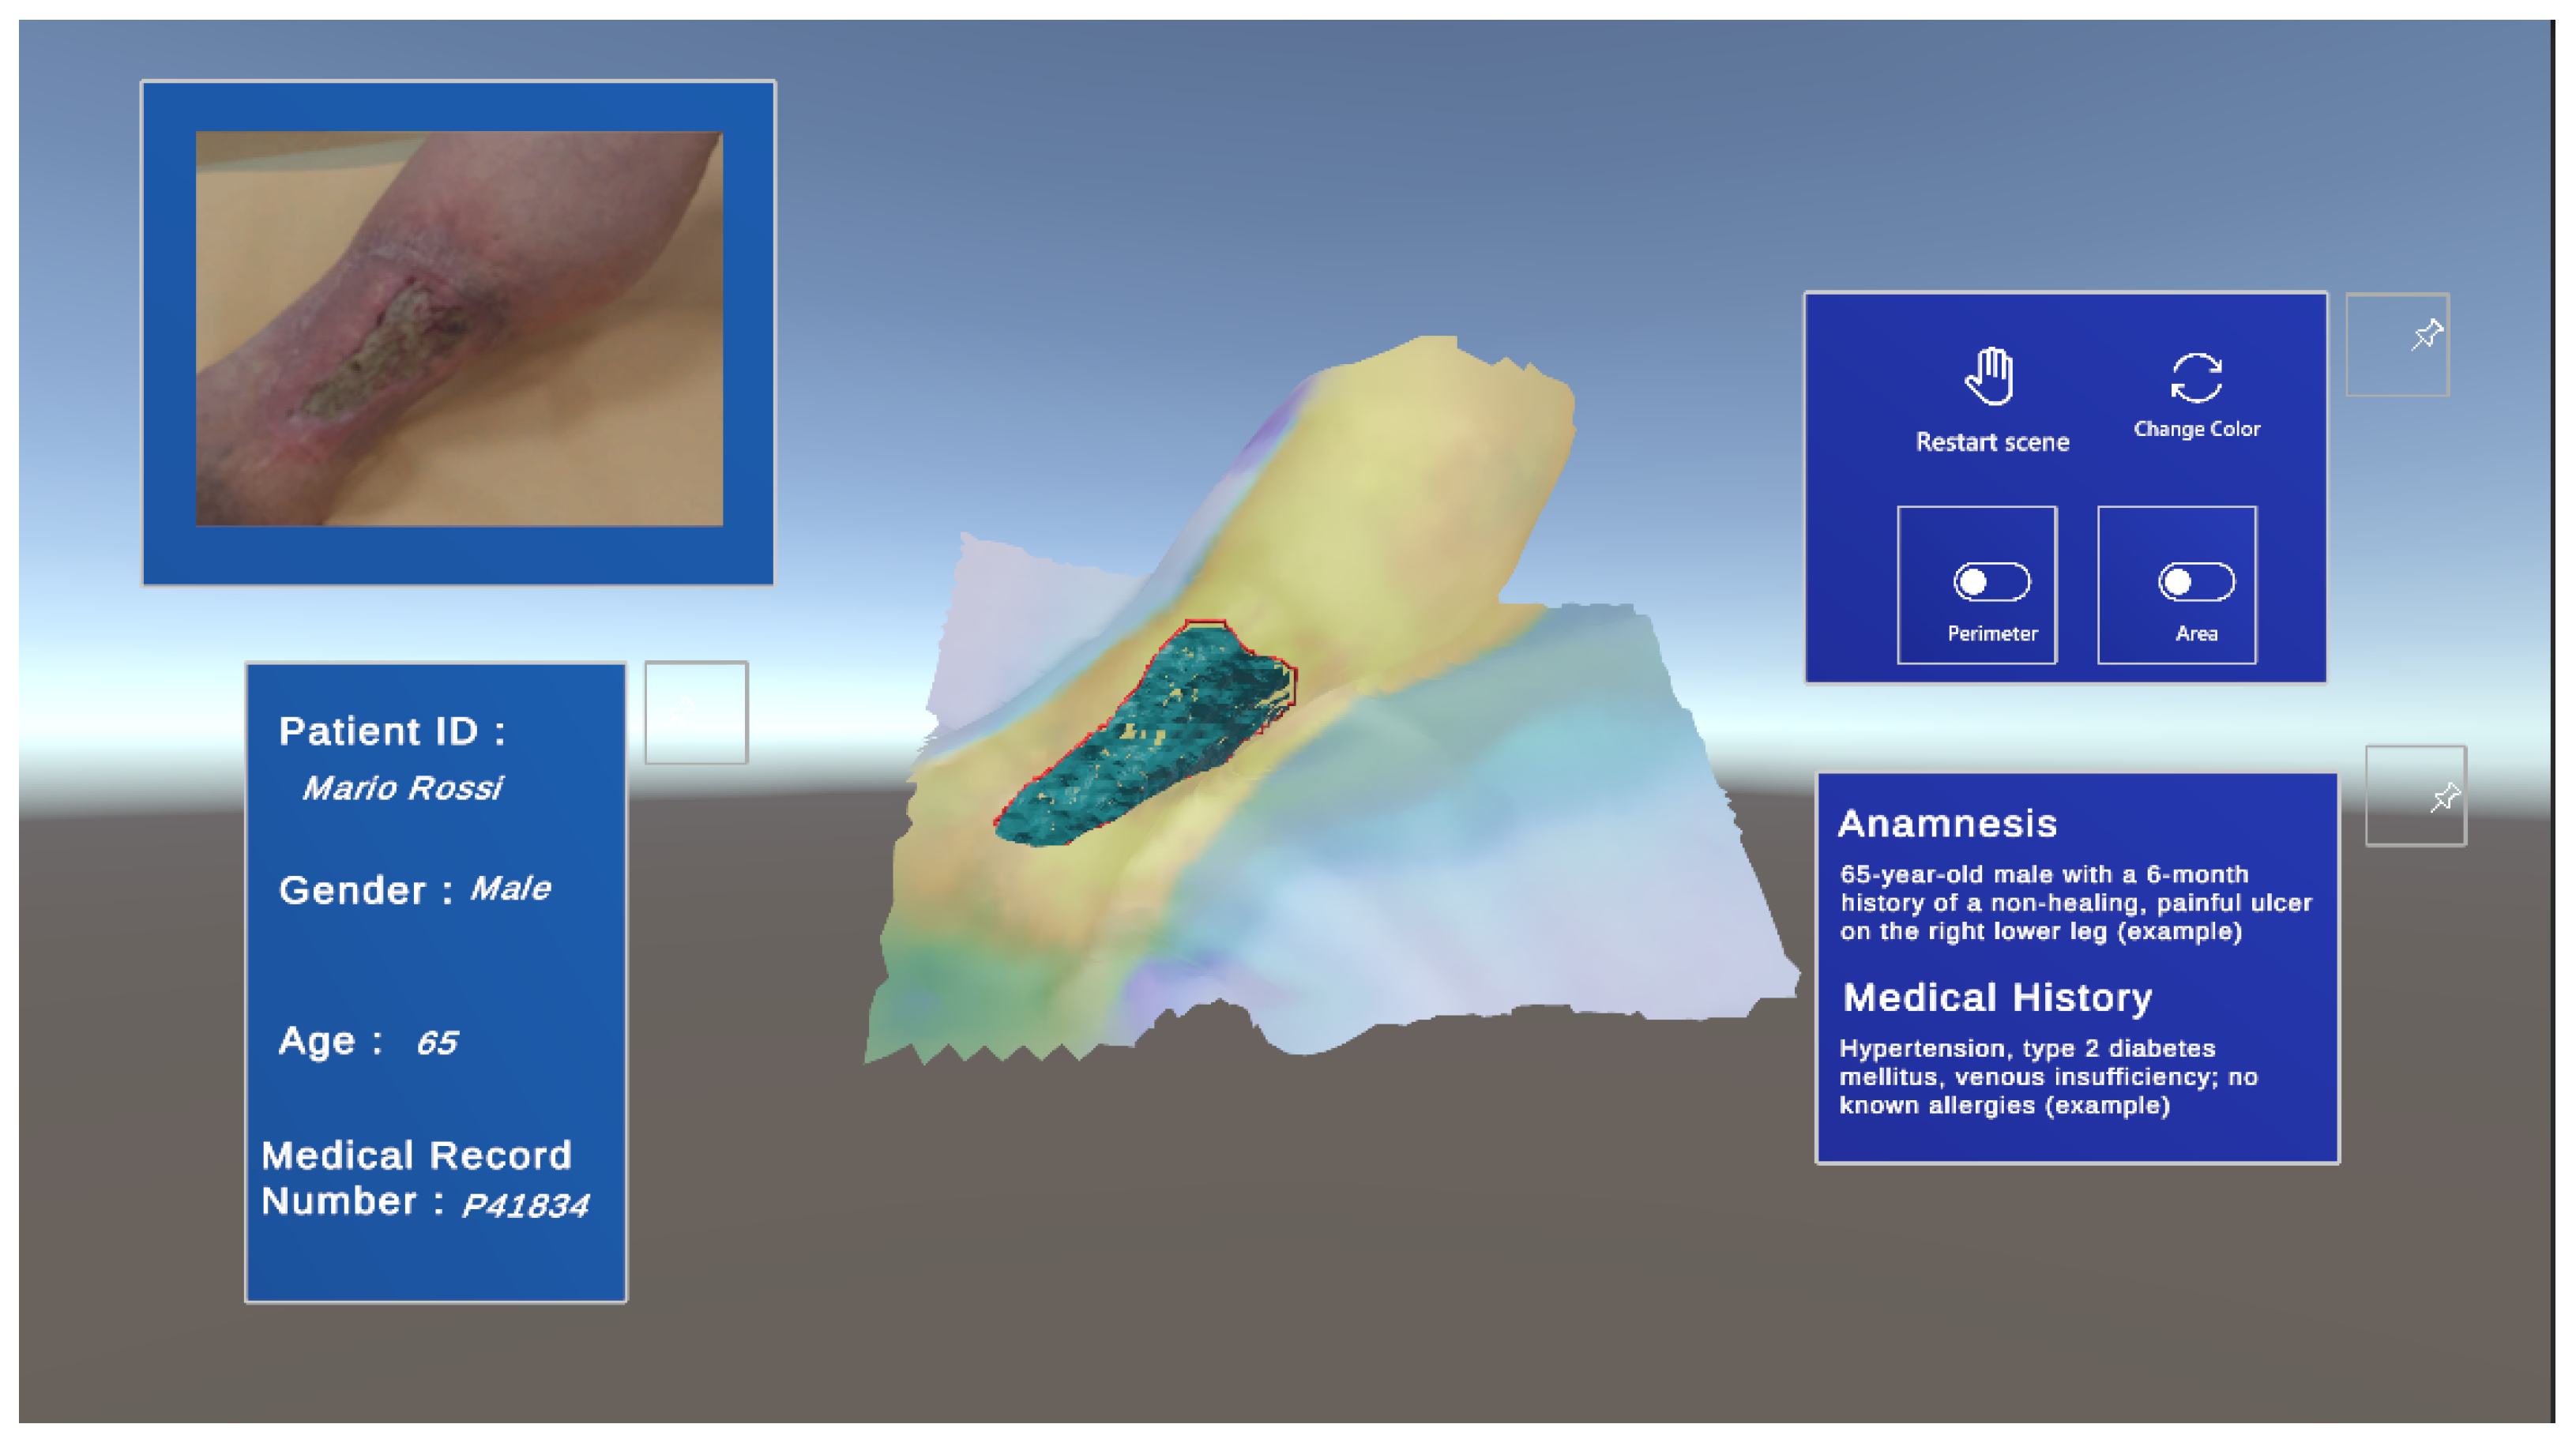
3.3. XR Environment Setup

The XR environment was developed to enhance visualization and interaction with the results obtained from the segmentation of RGB images related to ulcers. It was designed to offer a clear and intuitive representation of the segmented regions, allowing users to better analyze and understand the affected areas. Additionally, it facilitated access to the quantitative parameters extracted during the analysis, such as the ulcer’s area and perimeter, which are critical for accurate assessment and monitoring. By combining advanced visualization capabilities with user-friendly interaction, this solution aimed to improve the evaluation process, supporting healthcare professionals in making informed decisions and enhancing patient care.
The resulting XR environment (Figure 11) offers a comprehensive view by presenting the patient’s demographic information, including their age, gender, and medical record details, alongside a summary of the wound’s anamnesis. It features three interactive buttons that enable users to independently visualize specific aspects of the ulcer: the estimated perimeter, the calculated area, and a thermal map overlaid on the 3D model of the leg. These functionalities provide clinicians with the flexibility to analyze various parameters of the wound in detail. In addition to the 3D model, the corresponding RGB image of the wound is displayed, further enhancing the analysis by incorporating rich color information. This integration allows physicians to correlate the spatial data with the visible characteristics of the ulcer, such as coloration and texture, offering a more holistic perspective on the wound’s condition.

4. Discussion

The current work aimed to propose a semi-automatic and objective system to support the diagnosis and monitoring of chronic wounds and to address the numerous limitations identified in the treatment process of individuals suffering from this pathology. Among these limitations, the shortage of wound care experts, the lack of standardized protocols, and the difficulties in ensuring continuous monitoring and patient-specific therapy play a crucial role.
The first contribution of the work consisted in automatically segmenting the wound from a two-dimensional image through the implementation of a CNN. By training the network on the dataset expanded with additional 319 WV images, an 18% increase in performance on the Test Set was achieved, reaching an average IoU of 66%. In addition to average values, the median IoU was also assessed, scoring 77% for the expanded dataset, indicating most images were recognized with high IoU values, while a few lower-quality images affected the average value.
The extraction of the wound contour from two-dimensional images enabled the subsequent implementation of 3D lesion parameter calculation and the visualization of the results in the XR environment. Two-dimensional measurements obtained during the current work aligned with prior studies on ulcer size evaluation [32]. Moreover, further studies such as the one by Jørgensen et al. [33] found that changes in 3D area were significantly larger than 2D area measurements, particularly for larger wounds. They proved that 3D ulcers’ bed area monitoring captured changes in ulcer dimensions more accurately compared to 2D images. Thus, integrating depth information for skin ulcer assessment and monitoring can lead to many advantages over traditional 2D methods, providing information about the extent of the internal area of the wound and consequently, an indication of its depth. Previous studies have demonstrated the superiority of a 3D measurement method over the 2D method for calculating wound areas, especially in complex or curved anatomical regions, showing greater precision and reliability in shape and temperature measurements [34,35,36]. Along the same lines, the values obtained in this study suggest that they carry informative content also regarding the depth of the wound, as the 3D parameter computation yielded higher values compared to those calculated from 2D images.
Another contribution of the current study is the integration of the skin ulcer assessment methodology within an XR environment, while past research focused only on parameter extraction. The proposed tool aimed to support clinicians for enhanced clinical decision-making and patient care, by consulting 2D images and 3D models of the skin ulcer along with quantitative data such as its area and perimeter parameters. Additionally, thermal data indicating infection status and microvascularization in the wound and surrounding tissues was overlaid for surface visualization, as it has been shown that the assessment of microvascularization aids in predicting wound progression [37]. The obtained Unity3D XR design was reviewed by two dermatology specialists, who emphasized the need for analyzing the ulcer’s edge and base separately for accurate assessment and therapeutic insights. Experts valued combining 2D and 3D information and the patient’s clinical history to facilitate initial evaluation and enhance and speed up treatment decisions.
Despite the promising results, this study has certain limitations that deserve consideration. First, the dataset, which included RGB and their matching depth images, was restricted in size. This limitation may have influenced the 2D segmentation performance, which might be considerably improved with a larger dataset. Indeed, the study found that expanding the dataset resulted in significant gains in segmentation accuracy, highlighting the importance of larger and more varied datasets in improving model performance. Furthermore, the WoundsDB 2D pictures suffered from low resolution and suboptimal framing, raising challenges for the network’s training process and consequently affecting the recognition accuracy. Addressing these challenges through higher-quality image collection and improved framing is expected to significantly improve automated segmentation skills in future developments of this study.
In addition, the lack of ground-truth data for the direct evaluation of 3D segmentation accuracy limits the final validation of the results. Future research should prioritize reliable ground-truth data to conduct more comprehensive assessments of 3D segmentation accuracy and evaluate the practicality of the suggested methodologies.
Finally, clinical validation is an important step in future development. While this study provides a solid technological foundation, its ultimate significance will be assessed by its effectiveness and reliability in real-world clinical situations. A thorough evaluation across a wide range of patient groups and wound types should be conducted in future works to verify that the suggested procedures are both accurate and practicable for use in clinical settings. This validation procedure will validate the system’s effectiveness in supporting healthcare professionals and suggest possible areas for further improvement to optimize its application in wound evaluation and treatment. Clinical validation will be fundamental in establishing the system as a trustworthy tool for improving patient outcomes by bridging the research–practice divide.

5. Conclusions

The implementation of advanced image processing techniques, including automatic detection and segmentation of skin ulcers using a CNN and 3D image analysis, marks a significant advancement in skin ulcer management. This study introduced an automated and accurate tool for clinical assessment, improving the monitoring of wound evolution and consequently enhancing patient care. The methodology supported early detection, accurate assessment, and monitoring, benefiting elderly individuals and those with chronic diseases. The graphical interface in Unity3D allowed the easy interaction of healthcare operators with the interface, enabling the visualization of the wound along with its extracted parameters and comprehensive care management. Overall, integrating the implemented methodologies in clinical settings represents a substantial improvement, introducing a 3D analysis approach compared to traditional methods. Future directions will include acquiring a larger number of images of ulcers to improve the segmentation performance and to carry on a clinical validation of the procedure. Moreover, depending on the number of available images, skin ulcers could also be classified according to the varying wound severity, which would enable the performance of a secondary classification according to the Wound Bed Preparation (WBP) scale. By providing a reliable means of assessing and monitoring skin ulcers, this technology supports healthcare providers in delivering timely and precise care, ultimately improving patient outcomes.

Author Contributions

Conceptualization, R.C., A.F., A.C., M.G. and E.R.; Methodology, R.C., A.F., A.C. and M.G.; Software, R.C., A.F., A.C., M.G. and S.B.; Validation, C.I., G.M., E.R., J.S. and L.U.; Formal analysis, R.C., A.F., A.C., M.G. and E.R.; Investigation, R.C., A.F., A.C., M.G. and S.B.; Resources, E.R., J.S. and E.V.; Data curation, R.C., A.F., A.C., M.G., S.B., C.I., G.M., J.S. and L.U.; Writing—original draft, R.C., A.F., A.C., M.G. and G.M.; Writing—review & editing, C.I., G.M., J.S. and L.U.; Visualization, R.C., C.I. and L.U.; Supervision, J.S., E.V. and L.U.; Project administration, E.R., J.S. and E.V.; Funding acquisition, J.S. and E.V. All authors have read and agreed to the published version of the manuscript.

Funding

This research received no external funding.

Institutional Review Board Statement

Not applicable.

Informed Consent Statement

Not applicable.

Data Availability Statement

The WoundsDB used during the current work and accessed on 24 May 2024 is publicly available through https://chronicwounddatabase.eu/. Other WV images used to expand the available dataset are under license of Politecnico Di Torino and are available from the authors upon reasonable request and with permission from the Politecnico di Torino. For further information please contact Jacopo Secco ([email protected]).

Conflicts of Interest

The authors declare no conflicts of interest.

References

  1. Garcia, F.R.; da Silva Olanda, D.E.; Filgueiras, M.F.; de Pontes, A.T.A.; dos Santos, M.C.S.; do Nascimento, N.C.; Ferreira, J.A.G.; Silva, T.C.S.; Sousa, K.S. Multiprofessional Care in Chronic Wounds. Health Soc. 2022, 2, 31–36. [Google Scholar] [CrossRef]
  2. Iversen, A.K.S.; Lichtenberg, M.; Fritz, B.G.; Cort, I.D.P.; Al-Zoubaidi, D.F.; Gottlieb, H.; Kirketerp-Møller, K.; Bjarnsholt, T.; Jakobsen, T.H. The chronic wound characterisation study and biobank: A study protocol for a prospective observational cohort investigation of bacterial community composition, inflammatory responses and wound-healing trajectories in non-healing wounds. BMJ Open 2024, 14, e084081. [Google Scholar] [CrossRef] [PubMed]
  3. Sharma, A.; Shankar, R.; Yadav, A.K.; Pratap, A.; Ansari, M.A.; Srivastava, V. Burden of Chronic Nonhealing Wounds: An Overview of the Worldwide Humanistic and Economic Burden to the Healthcare System. Int. J. Low. Extrem. Wounds 2024. [Google Scholar] [CrossRef] [PubMed]
  4. Suksawat, T.; Panichayupakaranant, P. Skin Ulcers as a Painful Disorder with Limited Therapeutic Protocols. In Natural Products for Treatment of Skin and Soft Tissue Disorders; Bentham Science Publishers: Potomac, MD, USA, 2023; 209p. [Google Scholar]
  5. Markova, A.; Mostow, E.N. US skin disease assessment: Ulcer and wound care. Dermatol. Clin. 2012, 30, 107. [Google Scholar] [CrossRef]
  6. Laucirica, I.; Iglesias, P.G.; Calvet, X. Peptic ulcer. Med. Clín. (Engl. Ed.) 2023, 161, 260–266. [Google Scholar] [CrossRef]
  7. Secco, J. Imaging and Measurement. In Pearls and Pitfalls in Skin Ulcer Management; Springer: Berlin/Heidelberg, Germany, 2024; pp. 317–338. [Google Scholar]
  8. Jaganathan, Y.; Sanober, S.; Aldossary, S.M.A.; Aldosari, H. Validating wound severity assessment via region-anchored convolutional neural network model for mobile image-based size and tissue classification. Diagnostics 2023, 13, 2866. [Google Scholar] [CrossRef]
  9. Sánchez-Jiménez, C.L.; Verdesoto, E.S.B. State of the art of the automatized characterization of chronic wound patterns. In Proceedings of the 2024 IEEE Eighth Ecuador Technical Chapters Meeting (ETCM), Virtual, 15–18 October 2024; pp. 1–6. [Google Scholar]
  10. Sarp, S.; Kuzlu, M.; Zhao, Y.; Gueler, O. Digital twin in healthcare: A study for chronic wound management. IEEE J. Biomed. Health Inform. 2023, 27, 5634–5643. [Google Scholar] [CrossRef]
  11. Dini, V.; Granieri, G. Wound Measurement. In Pearls and Pitfalls in Skin Ulcer Management; Springer: Berlin/Heidelberg, Germany, 2024; pp. 339–346. [Google Scholar]
  12. Innocente, C.; Piazzolla, P.; Ulrich, L.; Moos, S.; Tornincasa, S.; Vezzetti, E. Mixed reality-based support for total hip arthroplasty assessment. In Proceedings of the International Joint Conference on Mechanics, Design Engineering & Advanced Manufacturing, Ischia, Italy, 1–3 June 2022; pp. 159–169. [Google Scholar]
  13. Biagioni, R.B.; Carvalho, B.V.; Manzioni, R.; Matielo, M.F.; Neto, F.C.B.; Sacilotto, R. Smartphone application for wound area measurement in clinical practice. J. Vasc. Surg. Cases Innov. Tech. 2021, 7, 258–261. [Google Scholar] [CrossRef]
  14. Fauzi, M.F.A.; Khansa, I.; Catignani, K.; Gordillo, G.; Sen, C.K.; Gurcan, M.N. Computerized segmentation and measurement of chronic wound images. Comput. Biol. Med. 2015, 60, 74–85. [Google Scholar] [CrossRef]
  15. Smith-Strøm, H.; Igland, J.; Østbye, T.; Tell, G.S.; Hausken, M.F.; Graue, M.; Skeie, S.; Cooper, J.G.; Iversen, M.M. The effect of telemedicine follow-up care on diabetes-related foot ulcers: A cluster-randomized controlled noninferiority trial. Diabetes Care 2018, 41, 96–103. [Google Scholar] [CrossRef]
  16. Bolton, L. Telemedicine Improves Chronic Ulcer Outcomes. Wounds A Compend. Clin. Res. Pract. 2019, 31, 114–116. [Google Scholar]
  17. Dabas, M.; Schwartz, D.; Beeckman, D.; Gefen, A. Application of artificial intelligence methodologies to chronic wound care and management: A scoping review. Adv. Wound Care 2023, 12, 205–240. [Google Scholar] [CrossRef] [PubMed]
  18. Sarp, S.; Kuzlu, M.; Wilson, E.; Cali, U.; Guler, O. The enlightening role of explainable artificial intelligence in chronic wound classification. Electronics 2021, 10, 1406. [Google Scholar] [CrossRef]
  19. Anisuzzaman, D.; Patel, Y.; Rostami, B.; Niezgoda, J.; Gopalakrishnan, S.; Yu, Z. Multi-modal wound classification using wound image and location by deep neural network. Sci. Rep. 2022, 12, 20057. [Google Scholar] [CrossRef]
  20. Secco, J.; Pittarello, M.; Begarani, F.; Sartori, F.; Corinto, F.; Ricci, E. Memristor Based Integrated System for the Long-Term Analysis of Chronic Wounds: Design and Clinical Trial. In Proceedings of the 2022 29th IEEE International Conference on Electronics, Circuits and Systems (ICECS), Glasgow, UK, 24–26 October 2022; pp. 1–4. [Google Scholar]
  21. Zoppo, G.; Marrone, F.; Pittarello, M.; Farina, M.; Uberti, A.; Demarchi, D.; Secco, J.; Corinto, F.; Ricci, E. AI technology for remote clinical assessment and monitoring. J. Wound Care 2020, 29, 692–706. [Google Scholar] [CrossRef]
  22. Kręcichwost, M.; Czajkowska, J.; Wijata, A.; Juszczyk, J.; Pyciński, B.; Biesok, M.; Rudzki, M.; Majewski, J.; Kostecki, J.; Pietka, E. Chronic wounds multimodal image database. Comput. Med. Imaging Graph. 2021, 88, 101844. [Google Scholar] [CrossRef]
  23. Ahmed, A.; Imran, A.S.; Manaf, A.; Kastrati, Z.; Daudpota, S.M. Enhancing wrist abnormality detection with yolo: Analysis of state-of-the-art single-stage detection models. Biomed. Signal Process. Control 2024, 93, 106144. [Google Scholar] [CrossRef]
  24. Al-Masni, M.A.; Al-Antari, M.A.; Park, J.M.; Gi, G.; Kim, T.Y.; Rivera, P.; Valarezo, E.; Choi, M.T.; Han, S.M.; Kim, T.S. Simultaneous detection and classification of breast masses in digital mammograms via a deep learning YOLO-based CAD system. Comput. Methods Programs Biomed. 2018, 157, 85–94. [Google Scholar] [CrossRef]
  25. Nie, Y.; Sommella, P.; O’Nils, M.; Liguori, C.; Lundgren, J. Automatic detection of melanoma with yolo deep convolutional neural networks. In Proceedings of the 2019 E-Health and Bioengineering Conference (EHB), Iasi, Romania, 21–23 November 2019; pp. 1–4. [Google Scholar]
  26. Ünver, H.M.; Ayan, E. Skin lesion segmentation in dermoscopic images with combination of YOLO and grabcut algorithm. Diagnostics 2019, 9, 72. [Google Scholar] [CrossRef]
  27. Tan, L.; Huangfu, T.; Wu, L.; Chen, W. Comparison of RetinaNet, SSD, and YOLO v3 for real-time pill identification. BMC Med. Inform. Decis. Mak. 2021, 21, 324. [Google Scholar] [CrossRef]
  28. Kazhdan, M.; Hoppe, H. Screened poisson surface reconstruction. ACM Trans. Graph. (ToG) 2013, 32, 1–13. [Google Scholar] [CrossRef]
  29. Bernardini, F.; Mittleman, J.; Rushmeier, H.; Silva, C.; Taubin, G. The ball-pivoting algorithm for surface reconstruction. IEEE Trans. Vis. Comput. Graph. 1999, 5, 349–359. [Google Scholar] [CrossRef]
  30. Lee, D.T.; Schachter, B.J. Two algorithms for constructing a Delaunay triangulation. Int. J. Comput. Inf. Sci. 1980, 9, 219–242. [Google Scholar] [CrossRef]
  31. Ulrich, L.; Salerno, F.; Moos, S.; Vezzetti, E. How to exploit Augmented Reality (AR) technology in patient customized surgical tools: A focus on osteotomies. Multimed. Tools Appl. 2024, 83, 70257–70288. [Google Scholar] [CrossRef]
  32. Monroy, B.; Sanchez, K.; Arguello, P.; Estupiñán, J.; Bacca, J.; Correa, C.V.; Valencia, L.; Castillo, J.C.; Mieles, O.; Arguello, H.; et al. Automated chronic wounds medical assessment and tracking framework based on deep learning. Comput. Biol. Med. 2023, 165, 107335. [Google Scholar] [CrossRef]
  33. Jørgensen, L.B.; Halekoh, U.; Jemec, G.B.; Sørensen, J.A.; Yderstræde, K.B. Monitoring wound healing of diabetic foot ulcers using two-dimensional and three-dimensional wound measurement techniques: A prospective cohort study. Adv. Wound Care 2020, 9, 553–563. [Google Scholar] [CrossRef]
  34. Liu, C.; Fan, X.; Guo, Z.; Mo, Z.; Chang, E.I.C.; Xu, Y. Wound area measurement with 3D transformation and smartphone images. BMC Bioinform. 2019, 20, 724. [Google Scholar] [CrossRef]
  35. Souto, J.R.; Barbosa, F.M.; Carvalho, B.M. Three-Dimensional Wound Reconstruction using Point Descriptors: A Comparative Study. In Proceedings of the 2023 IEEE 36th International Symposium on Computer-Based Medical Systems (CBMS), L’Aquila, Italy, 22–24 June 2023; pp. 41–46. [Google Scholar]
  36. Gutierrez, E.; Castañeda, B.; Treuillet, S.; Lucas, Y. Combined thermal and color 3D model for wound evaluation from handheld devices. In Proceedings of the Medical Imaging 2021: Imaging Informatics for Healthcare, Research, and Applications, San Diego, CA, USA, 20–24 February 2021; Volume 11601, pp. 27–34. [Google Scholar]
  37. Monshipouri, M.; Aliahmad, B.; Ogrin, R.; Elder, K.; Anderson, J.; Polus, B.; Kumar, D. Thermal imaging potential and limitations to predict healing of venous leg ulcers. Sci. Rep. 2021, 11, 13239. [Google Scholar] [CrossRef]
Figure 1. (a) The red outline describes a manual measurement of a generic wound, while the green outline describes the automatic segmentation performed by the device. The area of the rectangle and the area of the wound can have a difference of up to 30%. (b) A device for the acquisition, automatic segmentation, and area calculation of a skin lesion. Adapted from [7].
Applsci 15 00833 g001
Figure 2. Procedure workflow.
Applsci 15 00833 g002
Figure 3. (a) Initial Dataset A split for network training and validation. (b) Updated Dataset B obtained by adding WV images for the training and fine-tuning of the network. In the Test Set, the initial images from WoundsDB, necessary for the subsequent purposes of this work, were maintained, while the Training Set and Validation Set were expanded.
Applsci 15 00833 g003
Figure 4. GUI concept design of the proposed XR environment for skin ulcer identification.
Applsci 15 00833 g004
Figure 5. The red line in the figure represent the perimeter generated on the Blender platform using the previously extracted 3D coordinates of the contour.
Applsci 15 00833 g005
Figure 6. (a) YOLO segmentation loss function on the Validation Set of dataset A. (b) YOLO segmentation loss function on the Validation Set of dataset B. In the case of Dataset A, early stopping occurred at epoch 101. For Dataset B, the training continued until epoch 150, with slight improvements still being observed.
Applsci 15 00833 g006
Figure 7. (a) The RGB image provided as input to the network to perform inference. (b) Network output. (c) Binary mask obtained from the automatic segmentation returned by the network. These figures show an example of YOLO network inference for an RGB image of the Test Set.
Applsci 15 00833 g007
Figure 8. (a) Network trained on Dataset A. (b) Network trained on Dataset B. This figure shows YOLO segmentation performance (IoU) for each image. The median value is drawn in black, while the mean value is drawn in orange.
Applsci 15 00833 g008
Figure 9. (a) Raw Point cloud. (b) Cleaned point cloud. The cleaning step on the points of no interest is shown, focusing solely on the area aligned with the corresponding 2D image highlighted with the thermal color map.
Applsci 15 00833 g009
Figure 10. (a) Total surface reconstruction of the cleaned depth 3D image corresponding to the 2D image. (b) Skin ulcer 3D surface reconstruction obtained by isolating internal points of the ulcer contour.
Applsci 15 00833 g010
Figure 11. Final interactive Unity3D workspace displaying the patient’s demographic data and the qualitative and quantitative parameters of the wound.
Applsci 15 00833 g011
Table 1. Network’s main hyperparameter set for YOLO network training. These parameters regulate the learning rate, the number of samples to be processed in a forward pass, the extent of the resizing to be applied to the images, the number of training epochs, and the number of epochs to wait without improvements before early stopping the training, respectively.
Learning RateBatchImage SizeEpochsPatience
0.011664015030
Table 2. Data augmentation parameters applied to the training images. p is the probability with which the transformation is applied to the image.
BlurMedian BlurToGrayCLAHE
p = 0.01
blur_limit = (3, 7)
p = 0.01
blur_limit = (3, 7)
p = 0.01p = 0.01
clip_limit = (1, 4)
Table 3. Extracted parameters for the example RGB image.
Area [cm2]
Delaunay
Perimeter [cm]
2D67.939.5
3D123.166.8
Disclaimer/Publisher’s Note: The statements, opinions and data contained in all publications are solely those of the individual author(s) and contributor(s) and not of MDPI and/or the editor(s). MDPI and/or the editor(s) disclaim responsibility for any injury to people or property resulting from any ideas, methods, instructions or products referred to in the content.

