Article

Quantifying Thermal Discharges from Nuclear Power Plants: A Remote Sensing Analysis of Environmental Function Zones

1
National Marine Environmental Monitoring Center, Dalian 116023, China
2
Naval Architecture and Shipping College, Guangdong Ocean University, Zhanjiang 524088, China
*
Author to whom correspondence should be addressed.
Appl. Sci. 2025, 15(2), 738; https://doi.org/10.3390/app15020738
Submission received: 5 December 2024 / Revised: 3 January 2025 / Accepted: 9 January 2025 / Published: 13 January 2025

Abstract

:
Nuclear energy plays a crucial role in global carbon reduction. However, thermal discharges from nuclear power plants can potentially impact marine ecosystems. This study investigates the long-term thermal impact of the Haiyang Nuclear Power Plant on the adjacent marine environment using a decade-long Landsat thermal infrared dataset. Spatial and temporal patterns of thermal discharge were analyzed, focusing on the temperature difference between intake and outlet water, the warming trend in the thermal mixing zone, and the spatial distribution of the thermal plume. Our results indicate the following: (1) Seasonal Variation in Thermal Discharge: The temperature difference between intake and outlet water exhibited significant seasonal variability, with higher values in winter and lower values in summer. The spatial distribution of the thermal plume was influenced by tidal currents, leading to a cyclical pattern. (2) Long-Term Warming Trend: Prolonged thermal discharge resulted in a notable warming trend in the thermal mixing zone, with an average annual increase of 0.3 °C. This warming effect was most pronounced in winter and least in summer. (3) Spatial Distribution of Thermal Plume: The spatial extent and intensity of the thermal plume varied seasonally. Summer exhibited a larger influence range but with lower temperature rises, while winter showed a smaller influence range but with higher temperature rises. In winter, the 4 °C temperature rise area exceeded the designated environmental functional zone boundary in some instances. These findings provide valuable insights into the thermal impact of nuclear power plants and highlight the importance of considering seasonal variations and long-term monitoring to ensure environmental sustainability.

1. Introduction

Nuclear power plants (NPPs) and thermal power plants (TPPs) rely on large volumes of cooling water to maintain operational efficiency. This practice, known as thermal discharge, can significantly impact aquatic ecosystems. With the thermal efficiency of coastal NPPs typically around 33%, and supercritical large-scale TPPs achieving efficiencies of up to 40% [1], a significant portion of the energy input is dissipated as waste heat into cooling water. To facilitate efficient cooling, many power plants are strategically located in coastal areas, leveraging vast bodies of water as heat sinks.
As of July 2023, China operates 17 NPPs with a total installed electrical capacity exceeding 57,000 MW [2]. Each 1000 MW unit discharges approximately 41.4 m3/s of cooling water at a temperature increase of around 9.0 °C [3]. The substantial volume and elevated temperature of this discharge raise concerns about its potential ecological consequences, including altered water temperature regimes, disrupted marine ecosystems, and reduced biodiversity [4,5,6,7,8,9,10,11,12].
Coastal thermal discharges from NPPs can have significant ecological impacts. The construction of intake and outlet structures alters tidal patterns, potentially leading to erosion, sedimentation, and geological instability [13,14]. Water withdrawal and entrainment can directly harm aquatic organisms [15]. Elevated water temperatures from thermal pollution can disrupt the physical and chemical properties of the water body, affecting aquatic life and ecosystem functions [4,6,7,8,12,16,17]. Additionally, biocides released from cooling systems can contaminate water and harm aquatic organisms [18,19,20]. By understanding the complex interactions between thermal discharges and the marine environment, we can develop strategies to minimize environmental impact and ensure sustainable power plant operations.
To accurately assess the environmental impact of thermal discharge from NPPs, it is essential to delineate the affected area. Field measurements, while providing precise data, are often costly and logistically challenging [21]. Numerical simulations, though useful, can be limited by model assumptions and may not accurately represent real-world conditions [22]. Thermal infrared remote sensing offers a cost-effective and efficient method for monitoring large-scale thermal plume dispersion. It can reveal interannual and seasonal variations in plume patterns [3,23,24], influenced by factors like tidal currents, wind speed, water depth, and plant capacity [25,26,27,28,29,30,31].
This study pioneers the use of long-term Landsat thermal infrared imagery to quantitatively analyze and compare the impacts of thermal discharge with coastal environment regulations. By comparing sea surface temperature (SST) variations between environmental functional zones (EFZs) and a reference region, the study quantifies the incremental SST rise attributable to HYNPP’s thermal discharge. The analysis focuses on the following: (1) Annual and seasonal fluctuations in SST increases induced by thermal effluents. (2) Spatial extent and magnitude of HYNPP’s thermal influence within each EFZ. It is important to note that this study primarily focuses on surface-level SST variations and does not delve into the vertical temperature profile of the water column.

2. Data and Methods

2.1. Study Area

HYNPP is situated in Haiyang City, China, at the eastern tip of a cape surrounded by the sea. To the northeast lies Rushan Bay, to the southwest is Haiyang Harbor, and to the east and south is the vast Yellow Sea of the Western Pacific Ocean, as depicted in Figure 1a,b. The site is located within a region classified as having a temperate continental monsoon climate. Distinct seasonal variations in wind direction are observed, with prevailing northwesterly winds in winter and predominantly southeasterly winds in summer. The annual mean wind speed, temperature, and water vapor pressure are 3.3 m/s, 11.9 °C, and 12.2 hPa, respectively. The sea area around HYNPP is primarily influenced by regular semi-diurnal tidal currents, with a multi-year average tidal range of approximately 2.39 m. The tidal currents are predominantly reciprocating, flowing mainly within a range of WSW-WNW during flood tide and within a range of ENE-ESE during ebb tide. The ebb tide is generally stronger than the flood tide.
Designed to house six pressurized water reactor (PWR) nuclear power units, HYNPP currently operates units 1 and 2, commissioned in January 2019 (Table 1). As shown in Figure 1c, the plant’s cooling water is sourced from an open channel intake on the south side. The Phase I discharge outlet is located on the west side, while the inactive Phase II outlet is on the east side.
A 40.4 km2 sea area surrounding HYNPP is designated as a Type III EFZ. This zone encompasses two main areas: the thermal mixing zone and the external nuclear power utilization zone. The thermal mixing zone is divided into two sub-areas: Zone A (9.6 km2) on the west side and Zone B (7.7 km2) on the east side of the plant site, as shown in Figure 1c. Zone C (23.1 km2), located on the south side, is designated as the external nuclear power utilization zone, which is also a Type III EFZ. Generally, the main water quality indicators in HYNPP’s EFZs adhere to Type II sea water quality standards [32], with the exception of water temperature.

2.2. Data and Preprocessing

(1)
Landsat Imagery
The United States Geological Survey (USGS) released the Landsat Collection 2 Level-2 (C2L2) scientific product in November 2020 (https://earthexplorer.usgs.gov/, accessed on 2 January 2022), containing long-time series (August 1982–Present) as well as high-spatial-resolution and high-temporal-resolution data imaged across a large swath of landscapes (185 km), which allows for long-term thermal discharge monitoring with fine-scale grading. USGS-released Landsat C2L2 scientific products were used in this study, and 139 scenes of high-quality data, acquired between 2013 and 2024, covering the study area were selected.
By linear stretching Equation (1), SST values are determined from the Landsat C2L2 surface temperature data.
SST = ST × Scale + Offset − 273.15
where SST is the surface temperature of the water body after linear stretching, in °C, ST is the DN value of the C2L2 dataset surface temperature band, and Scale and Offset are the scaling and offset factors for linear stretching, respectively, where Scale = 0.00341802, and Offset = 149.0.
The SST data underwent quality control using several techniques to ensure accuracy and reliability. First, singular value rejection identified and removed anomalous SST values deviating significantly from expected patterns. Values outside the valid SST range of 293–61,440, as defined in the science product guide [33], were also excluded to retain only physically plausible measurements. Second, cloud-contaminated pixels were removed using the Level-2 pixel quality band (ProductID_QA_PIXEL) within each C2L2 dataset. This band uses binary representation to provide information on cloud cover and other quality indicators, ensuring retention of only valid, cloud-free SST data. Third, to enhance dataset robustness, SST data from nearshore intertidal and foreshore areas were excluded. These areas are susceptible to inaccuracies due to land proximity and shallow water influences [26]. Furthermore, during summer, shallow bathymetric conditions can cause higher temperatures in submerged areas, potentially mimicking coastal thermal plumes and leading to data misinterpretation.
(2)
EFZs data
The EFZ data of the sea area near HYNPP utilized in this study were obtained from the Environmental Functional Zone Planning of Nearshore Sea Areas in Shandong Province (http://lyc.sdein.gov.cn/dtxx/201605/t20160529_716079.html, accessed on 20 May 2024), which was approved by the People’s Government of Shandong Province, China, in May 2016. The data were used to determine the environmental functions of the sea area near HYNPP. The planning stipulates Type I to Type IV EFZs, which implement the corresponding sea water quality standards [32], respectively, and no water quality objectives are set for the thermal mixing zone, but it should not affect the water quality of the adjacent EFZs.
(3)
Tidal Data
Daily tidal data of HYNPP (https://www.cnss.com.cn/html/tide.html, accessed on 15 November 2024), spanning from April 2018 to November 2024, were acquired from the National Marine Information Centre, Ministry of National Resources, China. The tidal data were matched to the satellite image in time order, and the tidal state at the scene time of the satellite image and the tidal height were extracted and applied to thermal dispersion analysis.
(4)
Criterion for Temperature Rise Intensity Grading
To assess the thermal impact of the NPP, a background temperature approximating the natural temperature of the area in the absence of thermal discharge is essential [28,30,31]. Given the marine location of the heat dissipation areas, an adjacent-zone substitution method was employed to determine a reference temperature (TRef). Specifically, a 600 m × 600 m square zone located approximately 3 km from the intake, and positioned to avoid the influence of thermal discharge, was selected as TRef for calculating Temperature Rise Intensities (TRIs).
To maintain consistency with sea water quality standards regarding temperature, TRIs were categorized into four levels using TRef as the baseline (Table 2). For descriptive convenience, areas exhibiting SST increases of 1–2 °C, 2–3 °C, 3–4 °C, and >4 °C were designated as R+1, R+2, R+3, and R+4, respectively. The sum of the areas for each TRI category was designated as Atotal.

3. Results

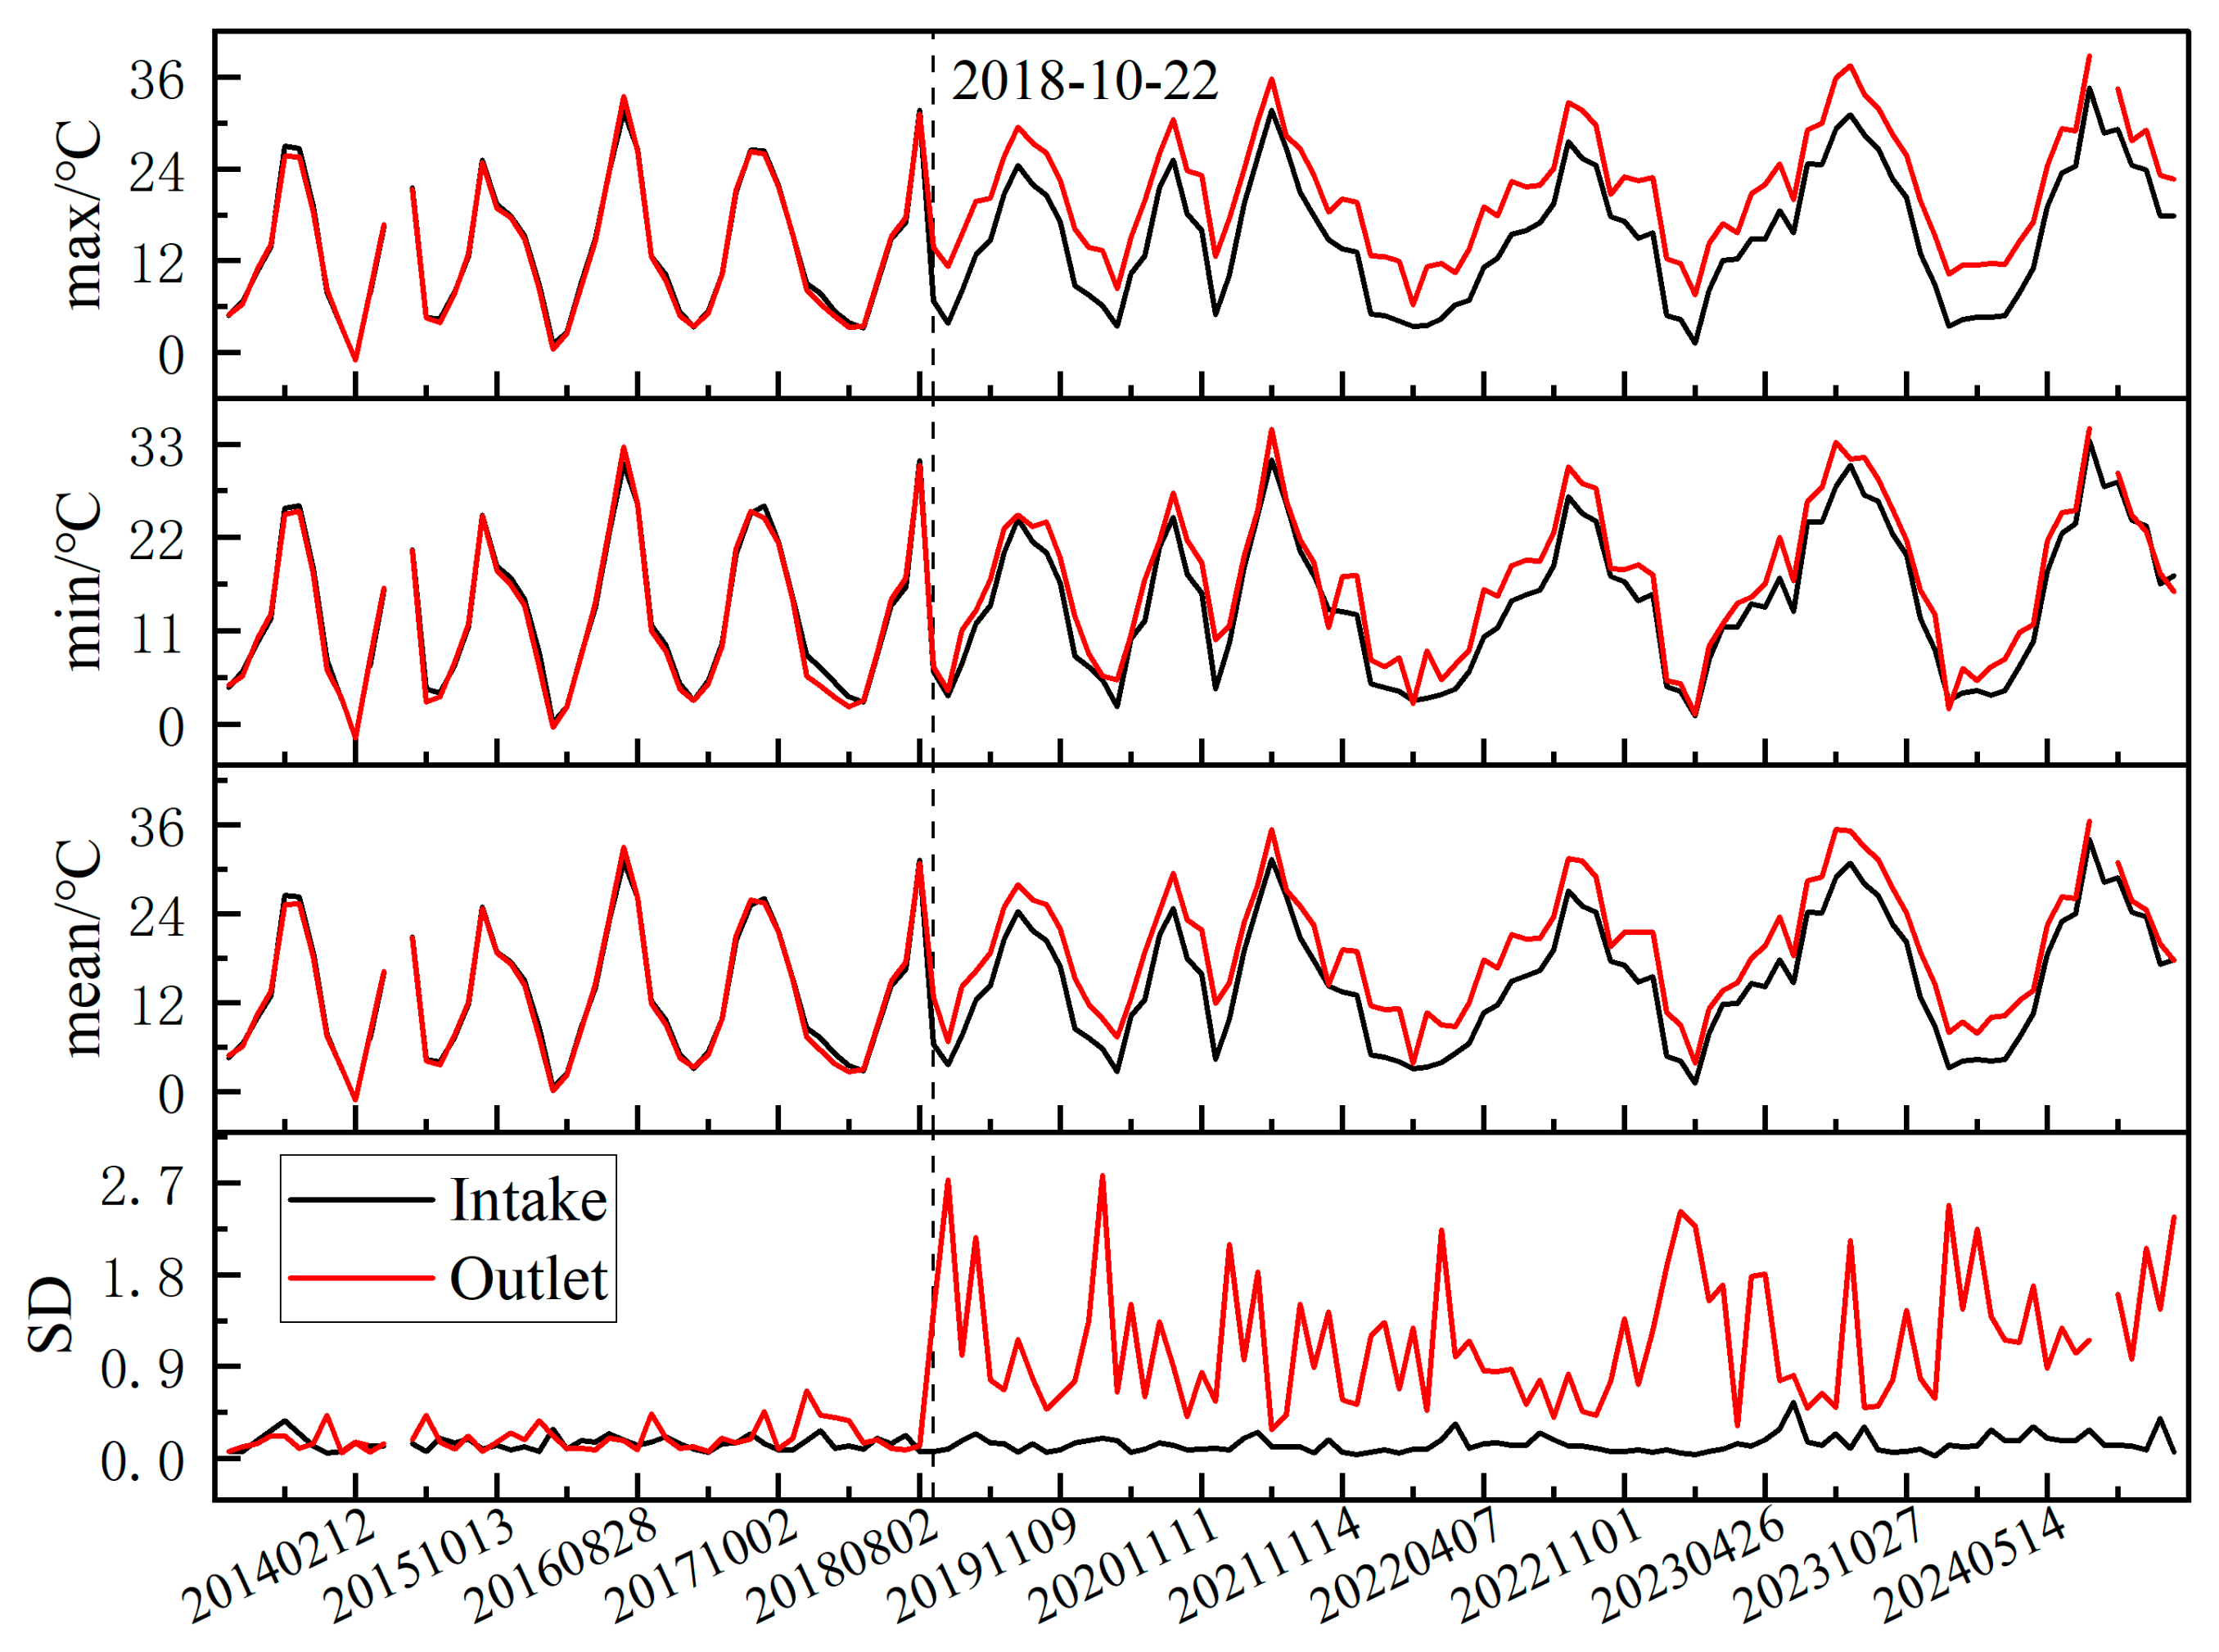
3.1. Thermal Impact of HYNPP Operation on Intake and Outlet Water

NPPs necessitate substantial circulating cooling water to regulate reactor temperature. Consequently, warm water containing waste heat is discharged into surrounding waters. A significant environmental impact of NPP operations is the alteration of discharge water temperature.
This study examines long-term temperature variations in the intake and outlet areas of the HYNPP from March 2013 to November 2024. Key statistical parameters—maximum (Max), minimum (Min), Mean, and standard deviation (SD) of SST—were analyzed to assess the intensity of thermal discharge impacts. Max, Min, and Mean values primarily characterize the magnitude of temperature differences between intake and discharge waters before and after operations. SD reflects the influence of warm water discharge on the homogeneity of the temperature field in the surrounding sea area. Figure 2 presents the temporal variations in Max, Min, Mean and SD of SST values within the intake and outlet areas before and after the NPP commenced operations on 22 October 2018.
Prior to the HYNPP’s operation, as shown in Figure 2 and Table 3, both intake and outlet areas exhibited similar seasonal SST patterns, with Max reaching approximately 31.6 °C. Min fluctuations in Mean SST (<0.3 °C) and SD (<0.03) indicate a highly homogeneous temperature field. Following the NPP’s operation, while the overall temperature trends remained consistent in both areas, a significant temperature increase was observed in the outlet area. The Max in the outlet area rose from 33.49 °C to 35.79 °C, exceeding 2 °C. The Mean SST in the outlet area experienced a substantial increase from 12.95 °C to 18.02 °C, reflecting the influence of thermal discharge. The most pronounced change occurred in the SD of the discharge area, which increased from 0.2 to 1.12, indicating a significant disruption to the temperature field homogeneity caused by the continuous release of thermal discharge. These findings unequivocally demonstrate the substantial thermal impact of NPP operations on the surrounding water environment.
The monthly mean SST difference between the outlet and intake waters exhibited distinct seasonal variations. As illustrated in Figure 3, prior to the NPP’s operation, the temperature difference remained relatively low throughout the year, fluctuating within a range of approximately ±0.5 °C.
Following the plant’s operation, a significant increase in the temperature difference was observed, reaching a maximum of 7.3 °C in January. This difference remained relatively stable from February to April before gradually decreasing from May to a minimum of 4.6 °C in September, after which it increased again. Seasonally, the average temperature difference was highest in winter (6.8 °C), followed by spring (5.9 °C), autumn (5.3 °C), and summer (4.9 °C). This “high in winter, low in summer” pattern is consistent with the plant’s design, which prioritizes higher discharge water temperatures during colder months. This direct surface discharge leads to pronounced temperature increases, contributing to the observed seasonal variation, with greater increases in winter and smaller increases in summer. Compared to deep-discharge systems, this surface design restricts heat transfer to the deeper water column, amplifying the influence of the designed discharge temperature on the maximum observed temperature difference within the thermal plume [34]. While previous studies [3] have highlighted the roles of current velocity and shoreline topography, a comprehensive regional re-evaluation of these factors, using extensive, near-concurrent hydrometeorological and remote sensing data, is necessary to fully understand their contributions to thermal plume behavior in the HYNPP region.

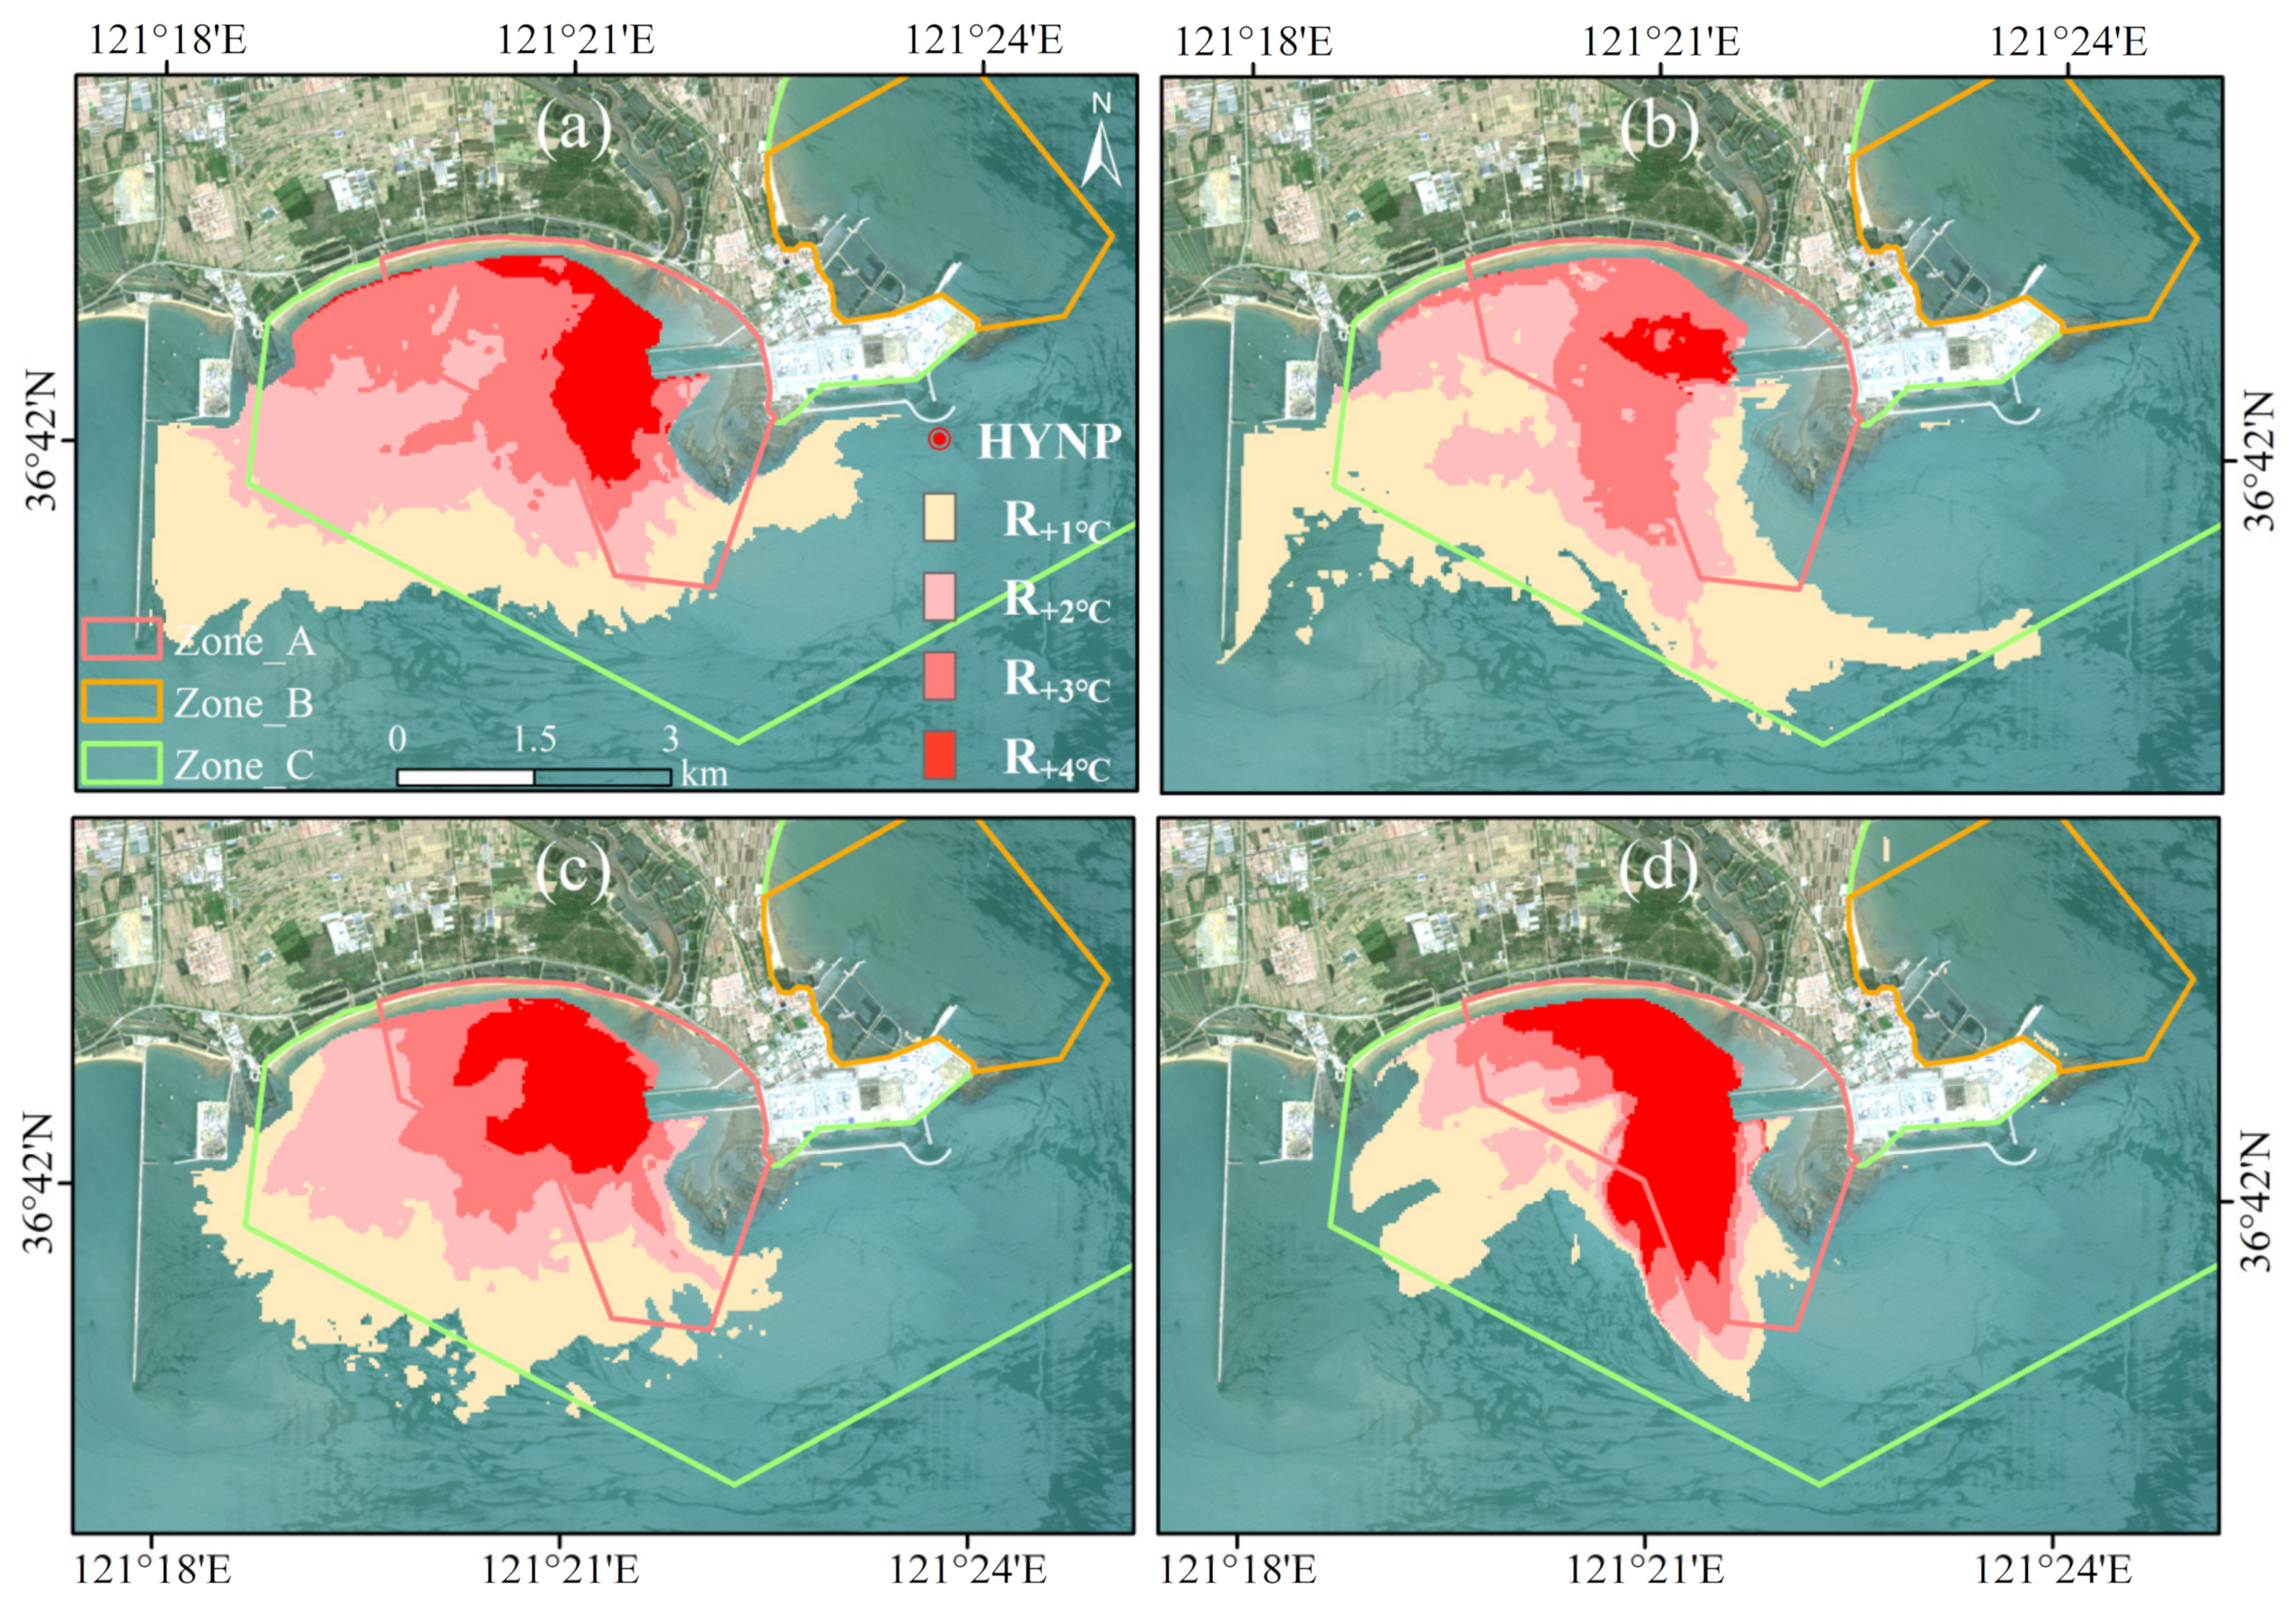
3.2. Spatial Patterns of Thermal Discharge in Response to Varying Tidal Conditions

The thermal plumes released from the west side of the plant provide valuable insights into surface water current patterns. Figure 4 illustrates the spatial distribution of the thermal discharge water from the HYNPP under various tidal conditions.
During the flood tide (Figure 4a–c), the southwestward current propels the warm plume along the water flow direction, forming a distinct thermal boundary between the warm and cold water masses. As the flooding current intensifies, the warm plume is gradually confined to the bay near the outlet, and the warm water is pushed towards the nearshore region. Near high tide (Figure 4c), the warm plume is fully contained within the bay, and the warm water tends to extend along the nearshore zone.
During the ebb tide (Figure 4d,e), the northeasterly current carries the warm plume out of the bay. The combined effects of falling currents and coastal topography compress the plume, forming a narrow strip. As the falling tide intensifies (Figure 4f), the warm plume breaks through the headland and spreads northeastward, exhibiting a similar pattern to the initial stage of the flood tide cycle.
The spatial distribution and morphological changes of the thermal plume are thus closely linked to tidal cycles [34]. The detected surface plume location is directly influenced by the prevailing flow direction under different tidal conditions [26].

4. Discussion

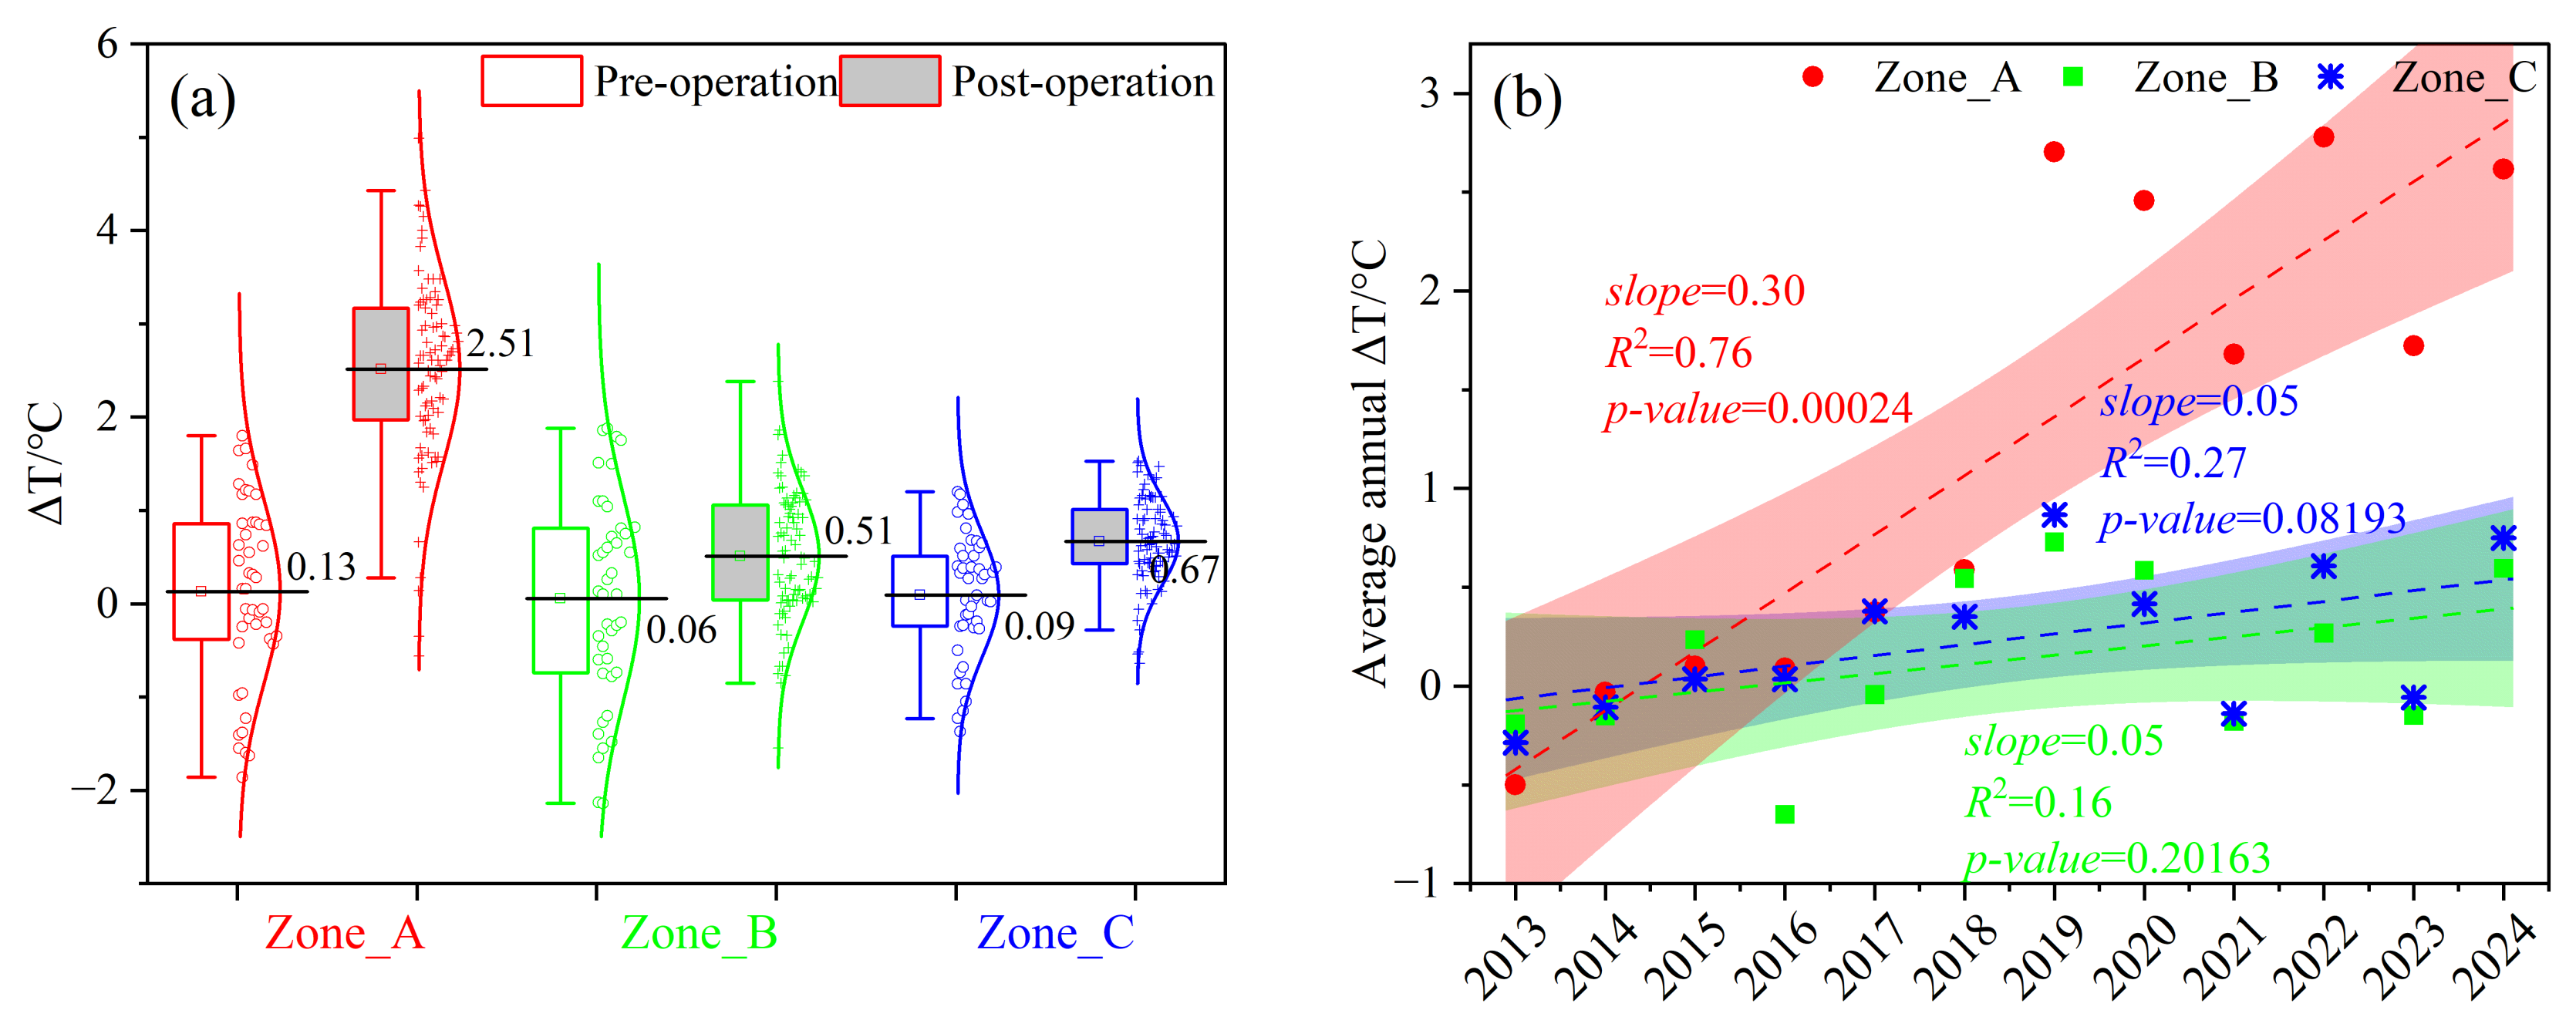
4.1. Impact of Thermal Discharge on SST in EFZs

Following the commencement of nuclear power operations, the discharge of warm water leads to an increase in the temperature of the receiving water body. The magnitude of this thermal impact can be assessed by comparing the changes in SST between the affected and unaffected areas.
To assess the extent and intensity of this thermal impact, the EFZs surrounding the HYNPP were divided into three areas: thermal mixing zones A and B, and the functional zone (Zone C). Zone A, located west of the plant, has an operational drainage outlet, while Zone B, situated to the east, is designated for a future outlet but is currently inactive. Zone C encompasses the entire EFZ, excluding the thermal mixing zones. As illustrated in Figure 1b, this spatial distribution of the EFZs provides a framework for analyzing the thermal impact. By comparing the temperature variations among these zones, we can gain insights into the spatial extent and intensity of the thermal influence.
To quantify the thermal impact, we compared the multi-year average change in SST (ΔT) within each effluent field zone to a reference zone unaffected by the discharge. This reference zone (TRef) is situated far from the outlet and, consequently, is not influenced by the thermal plume.
Prior to the plant’s operation, the ΔT values for all three zones ranged from 0.06 to 0.13 °C, which can be seen in Figure 5a, reflecting small inherent geographical variations in SST. Post-operation, ΔT values for Zone B and Zone C increased to 0.51 °C and 0.67 °C, respectively, indicating the long-term influence of thermal discharge. However, these increases were relatively modest, less than 0.6 °C in both cases. In contrast, Zone A experienced a dramatic increase in ΔT from 0.13 °C to 2.51 °C, highlighting the significant impact of warm water discharge in this region.
The preceding analysis demonstrates the significant warming impact of discharged warm water on the receiving water body. To further investigate the rate of warming and any potential seasonal variations, we analyzed the annual averaged ΔT values for each zone.
Figure 5b illustrates the results of scatter plot and linear regression analyses, indicating that Zone B and Zone C experienced an average annual temperature increase of approximately 0.05 °C. In contrast, Zone A exhibited a substantially higher warming rate of approximately 0.3 °C per year, with a strong correlation (R2 = 0.76, p = 0.00024). These findings clearly demonstrate the concentrated impact of thermal discharge, as evidenced by the significantly elevated temperature increase in Zone A compared to the other two zones.
Analysis of seasonal variations in warming rates (Figure 6) reveals a consistent pattern across all three zones: the highest rates occur in winter, followed by autumn and spring, with the lowest rates observed in summer. This seasonal trend aligns with the NPP’s design, which prioritizes higher discharge temperatures during winter months. As a result, more heat is injected into the receiving water body in winter, leading to a more pronounced warming effect.
Among the three zones, Zone A consistently exhibited the highest warming rates, reflecting its proximity to the outfall and direct exposure to the thermal plume. The winter warming rate in Zone A reached 0.41 °C/a, approximately three times higher than that of the other zones. The warming rates for Zone A decreased sequentially from winter (0.41 °C/a) to autumn (0.31 °C/a), summer (0.26 °C/a), and spring (0.21 °C/a). In contrast, Zones B and C experienced significantly lower warming rates compared to Zone A. While these zones also exhibited higher warming rates in winter, the differences were less pronounced. The decreasing warming rates with increasing distance from the outlet suggest that the thermal impact gradually diminishes due to water mixing and the dissipation of heat energy.
Furthermore, the seasonal warming rate fitting models exhibit varying degrees of correlation, as indicated by the R2 and p value. Zone A demonstrates strong correlations (R2 > 0.64) and highly significant p-values (<0.05) in all seasons except summer, suggesting a robust relationship between time and temperature change. Zone B, on the other hand, shows a significant correlation only in winter (p < 0.05), with a maximum R2 value of 0.51. Similarly, Zone C exhibits significant correlations in fall and winter (p < 0.05) but with a maximum R2 of 0.57. These findings suggest that the impact of warm water discharge is more pronounced in Zone A compared to Zones B and C, particularly during winter.

4.2. Comparative Analysis of Thermal Discharge Diffusion Ranges in Different EFZs

According to the national marine functional zoning, the sea area adjacent to HYNPP is designated as an industrial and urban construction sea use area. During development and utilization, this area adheres to Type II sea water quality standards and Type III water temperature standards. However, the temperature rise within the thermal mixing zone is not explicitly limited. Referencing the sea water quality, Type III sea water quality stipulates that human-induced sea water temperature rise should not exceed 4 °C compared to local ambient temperatures.
To assess the spatial overlap between different TRIs of HYNPP thermal discharges and EFZs, maximum temperature rise envelopes were plotted for each season from the start of NPP operation to November 2014 (Figure 7). These envelopes represent the potential temperature increase from R+1 to R+4. Table 4 summarizes the distribution areas of these TRIs.
Summer exhibits the largest impact area, totaling 33.4 km2. Notably, the lower TRIs, R+1 and R+2, occupy the largest area (22.5 km2) and account for over 67% of the total. Conversely, the highest temperature rise class, R+4, has the smallest area at 4.1 km2. Winter presents a stark contrast to summer, with the smallest total impact area of 19.3 km2. The higher temperature rise classes, R+3 and R+4, dominate, covering 7.6 km2 and 5.7 km2, respectively, and comprising nearly 69% of the total. Furthermore, winter is the only season where the R+4 impact area extends beyond the thermal mixing zone by approximately 0.35 km2.
HYNPP’s thermal discharge exhibits distinct seasonal spatial patterns, with a larger influence range and lower temperature rise in summer, and a smaller influence range but higher temperature rise in winter. Two primary factors contribute to this phenomenon:
(1)
Temperature rise of discharged water. Winter thermal discharge exhibits a higher temperature rise (10.79 °C) compared to summer (8.09 °C) due to HYNPP design. This elevated temperature rise in winter concentrates the high-temperature water near the discharge point, resulting in a significantly larger influence area with higher temperature rises.
(2)
Water body mixing. Winter’s stronger vertical mixing within the water body accelerates the dispersion and cooling of the thermal discharge, reducing its influence range. Conversely, summer’s pronounced thermal stratification inhibits mixing and cooling, resulting in a larger area of influence and a more persistent thermal plume [23].
These factors collectively shape the spatial distribution pattern of thermal discharge influence on HYNPP, with a larger extent in summer and a smaller extent in winter.

5. Conclusions

Based on the analysis of the thermal discharge impact of HYNPP on the surrounding marine environment, the following conclusions can be drawn:
Significant Thermal Impact on the Receiving Water Body: The discharge of warm water from HYNPP has a significant impact on the temperature of the receiving water body, particularly in the vicinity of the discharge outlet (Zone A). This impact is evidenced by the substantial increase in SST in Zone A compared to the other zones.
Seasonal Variation in Thermal Impact: The thermal impact of HYNPP’s discharge exhibits significant seasonal variability. Winter, characterized by higher discharge temperatures and stronger vertical mixing, leads to a more concentrated thermal plume with higher temperature rises. In contrast, summer, with lower discharge temperatures and weaker vertical mixing, results in a more dispersed thermal plume with lower temperature rises.
Spatial Distribution of Thermal Impact: The spatial extent of the thermal impact decreases with increasing distance from the discharge outlet. Zone A, located closest to the outlet, experiences the most significant warming, while Zones B and C, situated farther away, exhibit progressively lower temperature increases.
Compliance with Sea Water Quality Standard: While the thermal impact of HYNPP’s discharge is significant, it generally complies with the applicable sea water quality standards. However, it is crucial to continue monitoring the thermal impact, especially in Zone A, to ensure long-term environmental sustainability.

Author Contributions

Conceptualization, X.W. (Xiang Wang); Data curation, Q.M.; Formal analysis, L.W.; Methodology, X.W. (Xiang Wang); Software, X.W. (Xinxin Wang); Visualization, L.W.; Writing—original draft, X.S.; Writing—review and editing, J.X. All authors have read and agreed to the published version of the manuscript.

Funding

This research was supported by the National Natural Science Foundation of China (Grant No. 41906156).

Institutional Review Board Statement

Not applicable.

Informed Consent Statement

Not applicable.

Data Availability Statement

Landsat imagery was obtained from United States Geological Survey (USGS) and is available https://earthexplorer.usgs.gov/ (accessed on 25 November 2024) with permission from USGS. Tide data were obtained from National Marine Information Centre, Ministry of Natural Resources, China. Public access is available through website (https://psmsl.org/data/obtaining/stations/723.php, accessed on 15 November 2024).

Acknowledgments

We acknowledge the U.S. Geological Survey for providing freely available Landsat-8/9 data. We thank the National Marine Information Centre, Ministry of Natural Resources, China, for providing historical tide data.

Conflicts of Interest

The authors declare no conflicts of interest.

References

  1. Zhang, A.; Wang, S.; Zhao, Y.; Yuan, J. Analysis of key issues in environmental impact assessment of thermal discharge from coastal nuclear power plant. Environ. Impact Assess. 2015, 37, 57–60. [Google Scholar]
  2. Available online: http://nnsa.mee.gov.cn/ztzl/jgdxsjk/hdc/yxhdjz/ (accessed on 5 November 2024).
  3. Lin, J.; Zou, X.; Huang, F.; Yao, Y. Quantitative estimation of sea surface temperature increases resulting from the thermal discharge of coastal power plants in China. Mar. Pollut. Bull. 2021, 164, 112020. [Google Scholar] [CrossRef] [PubMed]
  4. Karås, P. Zooplankton entrainment at Swedish nuclear power plants. Mar. Pollut. Bull. 1992, 24, 27–32. [Google Scholar] [CrossRef]
  5. Hung, T.-C.; Huang, C.-C.; Shao, K.-T. Ecological survey of coastal i water adjacent to nuclear power I plants in Taiwan. Chem. Ecol. 1998, 15, 129–142. [Google Scholar] [CrossRef]
  6. Poornima, E.; Rajadurai, M.; Rao, T.; Anupkumar, B.; Rajamohan, R.; Narasimhan, S.; Rao, V.; Venugopalan, V. Impact of thermal discharge from a tropical coastal power plant on phytoplankton. J. Therm. Biol. 2005, 30, 307–316. [Google Scholar] [CrossRef]
  7. de Oliveira Dias, C.; Bonecker, S.L.C. Long-term study of zooplankton in the estuarine system of Ribeira Bay, near a power plant (Rio de Janeiro, Brazil). Hydrobiologia 2008, 614, 65–81. [Google Scholar] [CrossRef]
  8. Teixeira, T.P.; Neves, L.M.; Araújo, F.G. Effects of a nuclear power plant thermal discharge on habitat complexity and fish community structure in Ilha Grande Bay, Brazil. Mar. Environ. Res. 2009, 68, 188–195. [Google Scholar] [CrossRef]
  9. Ingleton, T.; McMinn, A. Thermal plume effects: A multi-disciplinary approach for assessing effects of thermal pollution on estuaries using benthic diatoms and satellite imagery. Estuar. Coast. Shelf Sci. 2012, 99, 132–144. [Google Scholar] [CrossRef]
  10. Lee, P.-W.; Tseng, L.-C.; Hwang, J.-S. Comparison of mesozooplankton mortality impacted by the cooling systems of two nuclear power plants at the northern Taiwan coast, southern East China Sea. Mar. Pollut. Bull. 2018, 136, 114–124. [Google Scholar] [CrossRef]
  11. Wang, J.; Tao, Z.; Wang, Y.; Wei, H.; Liu, X.; Li, C. Effects of Liaoning Hongyanhe Nuclear Power Plant on the Zooplankton Community in Summer of 2017. J. Ocean. Univ. China 2020, 19, 1140–1152. [Google Scholar] [CrossRef]
  12. Wu, J.; Kong, J.; Laws, E.A.; Liu, X.; Wang, C.; Chen, J.; Chen, M.; Yao, Q.; Wang, Y.; Zhen, Y.; et al. The Link Between Marine Thermal Discharges and Nemopilema Nomurai Blooms Around Nuclear Power Plants. Ecosyst. Health Sustain. 2023, 9, 9. [Google Scholar] [CrossRef]
  13. Jia, H.; Shen, Y.; Su, M.; Yu, C. Numerical simulation of hydrodynamic and water quality effects of shoreline changes in Bohai Bay. Front. Earth Sci. 2018, 12, 625–639. [Google Scholar] [CrossRef]
  14. Zhang, L.; Shi, H.; Xing, H.; Li, P.; Ma, P. Analysis of the evolution of the Yellow River Delta coastline and the response of the tidal current field. Front. Mar. Sci. 2023, 10, 1232060. [Google Scholar] [CrossRef]
  15. Xing, X.; Zhang, Z.; Tang, J.; Guo, T.; Wang, S.; Tao, Z. Study on the Issue about Water Intake Blockage by Marine Organism in Nuclear Power Plant. Nucl. Saf. 2021, 20, 103. [Google Scholar]
  16. Chavan, P.; Kumar, R.; Kirubagaran, R.; Venugopalan, V.P. Comparative toxicological effects of two antifouling biocides on the marine diatom Chaetoceros lorenzianus: Damage and post-exposure recovery. Ecotoxicol. Environ. Saf. 2017, 144, 97–106. [Google Scholar] [CrossRef]
  17. Muthulakshmi, A.; Natesan, U.; Ferrer, V.A.; Deepthi, K.; Venugopalan, V.; Narasimhan, S. Impact assessment of nuclear power plant discharge on zooplankton abundance and distribution in coastal waters of Kalpakkam, India. Ecol. Process. 2019, 8, 22. [Google Scholar] [CrossRef]
  18. Zargar, S.; Ghosh, T. Thermal and biocidal (chlorine) effects on select freshwater plankton. Arch. Environ. Contam. Toxicol. 2007, 53, 191–197. [Google Scholar] [CrossRef]
  19. Torres, M.J.F.; Beviá, F.R. Chlorine use reduction in nuclear or conventional power plants: A combined cooling-and-stripping tower for coastal power plants. J. Clean. Prod. 2012, 26, 1–8. [Google Scholar] [CrossRef]
  20. Mallikarjuna, M.; Katiyar, V.; Basavarajappa, K.; Kumar, T. Mathematical study on thermal pollution with reference to diffusional transfer of dispersants. Arya Bhatta J. Math. Inform. 2022, 14, 1–6. [Google Scholar] [CrossRef]
  21. Zhu, L.; Zhao, L.; Wang, Q.; Zhang, A.; Wu, C.; Li, J.; Shi, J. Monitoring the thermal plume from coastal nuclear power plant using satellite remote sensing data: Modeling and validataion. Spectrosc. Spectr. Anal. 2014, 34, 3079–3084. [Google Scholar]
  22. Zheng, Z.; Zhang, J.; Gong, H. Uncertainty analysis of MIKE SHE hydrologic model parameter. Yellow River 2015, 37, 23–26. [Google Scholar]
  23. Tang, D.; Kester, D.R.; Wang, Z.; Lian, J.; Kawamura, H. AVHRR satellite remote sensing and shipboard measurements of the thermal plume from the Daya Bay, nuclear power station, China. Remote Sens. Environ. 2003, 84, 506–515. [Google Scholar] [CrossRef]
  24. Zhou, Y.; Gong, C.; Kuang, D.; Hu, Y. Distribution of thermal discharge from a power plant: Analysis of thermal infrared data from the environmental mitigation satellite. J. Infrared Millim. Waves 2012, 31, 544–549. [Google Scholar] [CrossRef]
  25. Ahn, Y.H.; Shanmugam, P.; Lee, J.H.; Kang, Y.Q. Application of satellite infrared data for mapping of thermal plume contamination in coastal ecosystem of Korea. Mar. Environ. Res. 2006, 61, 186–201. [Google Scholar] [CrossRef]
  26. Faulkner, A.; Bulgin, C.E.; Merchant, C.J. Coastal Tidal Effects on Industrial Thermal Plumes in Satellite Imagery. Remote Sens. 2019, 11, 2132. [Google Scholar] [CrossRef]
  27. Liu, M.; Yin, X.; Xu, Q.; Chen, Y.; Wang, B. Monitoring of Fine-Scale Warm Drain-Off Water from Nuclear Power Stations in the Daya Bay Based on Landsat 8 Data. Remote Sens. 2020, 12, 627. [Google Scholar] [CrossRef]
  28. Xing, M.; Wang, D.; He, X.; Bai, Y.; Cheng, Y. Temporal and spatial characteristics of thermal discharge in Tianwan Nuclear Power Plant based on remote sensing data. J. Mar. Sci. 2020, 38, 72. [Google Scholar]
  29. Lin, J.; Zou, X.; Huang, F. Quantitative analysis of the factors influencing the dispersion of thermal pollution caused by coastal power plants. Water Res. 2021, 188, 116558. [Google Scholar] [CrossRef]
  30. Zhang, Z.; Wang, D.; Cheng, Y.; Gong, F. Long-Term Changes and Factors That Influence Changes in Thermal Discharge from Nuclear Power Plants in Daya Bay, China. Remote Sens. 2022, 14, 763. [Google Scholar] [CrossRef]
  31. Wang, X.; Su, X.; Wang, L.; Xinxin, W.; Chen, Y. Unmanned remote sensing identification and driving force analysis of spatial distribution of thermal discharge from coastal nuclear power plant. Mar. Environ. Sci. 2023, 42, 542–549. [Google Scholar] [CrossRef]
  32. GB3097-1997; National Seawater Quality Standard of the People’s Republic of China. National Environmental Protection Administration: Beijing, China, 1997.
  33. Cook, M.; Schott, J.R.; Mandel, J.; Raqueno, N. Development of an operational calibration methodology for the Landsat thermal data archive and initial testing of the atmospheric compensation component of a Land Surface Temperature (LST) Product from the archive. Remote Sens. 2014, 6, 11244–11266. [Google Scholar] [CrossRef]
  34. Wei, J.; Feng, L.; Tong, Y.; Xu, Y.; Shi, K. Long-term observation of global nuclear power plants thermal plumes using Landsat images and deep learning. Remote Sens. Environ. 2023, 295, 113707. [Google Scholar] [CrossRef]
Figure 1. Geographic location of the study area and division of EFZs. (a) Geolocation of HNP; (b) EFZ distribution; (c) Intake and outlet locations of HNP.
Applsci 15 00738 g001
Figure 2. Temporal changes in SST parameters at intake and outlet of HYNPP.
Applsci 15 00738 g002
Figure 3. Impact of NPP operation on monthly temperature difference between intake and outlet.
Applsci 15 00738 g003
Figure 4. Temporal variation in the spatial morphology of the thermal plume from HYNPP under typical tidal conditions. Panels (ac) illustrate the plume’s evolution during flood tide, while panels (df) depict the ebb tide.
Applsci 15 00738 g004
Figure 5. Spatial Variability of SST within EFZs attributed to thermal discharge. (a) Change in ΔT within EFZs pre- and post-operation; (b) Change in EFZ Warming Rate.
Applsci 15 00738 g005
Figure 6. Seasonal variations in EFZ warming induced by thermal discharge at HYNPP. (a) Spring; (b) Summer; (c) Autumn; (d) Winter.
Applsci 15 00738 g006
Figure 7. Spatial distribution of TRIs due to HYNPP thermal discharges in different seasons: (a) spring; (b) summer; (c) autumn; (d) winter.
Applsci 15 00738 g007
Table 1. Operational parameters of HYNPP units.
Power UnitReactor TypeGross CapacityFirst Criticality DateCommercial Operation Date
No. 1PWR1253 MW8 August 201822 October 2018
No. 2PWR1253 MW29 September 20189 January 2019
Table 2. Temperature ranges for different levels of increases in SST (℃).
Ranges of SST IncreasesLevels
[+1 °C, +2 °C)R+1
[+2 °C, +3 °C)R+2
[+3 °C, +4 °C)R+3
≥4 °CR+4
Table 3. Comparison of SST parameters between intake and outlet pre- and post-operation.
AreaOperation StatusSST Parameters
Max/°CMin/°CMean/°CSD
IntakePre-operation31.670.1513.080.15
Post-operation31.660.9813.380.12
OutletPre-operation33.49−0.3312.950.20
Pre-operation31.670.1513.080.15
Table 4. Area of warming zone envelopes for various TRIs and seasons.
SeasonArea/km2
R+1R+2R+3R+4Atotal
Spring9.65.05.83.523.9
Summer15.86.76.84.133.4
Autumn10.14.73.95.424.1
Winter2.83.27.65.719.3
Disclaimer/Publisher’s Note: The statements, opinions and data contained in all publications are solely those of the individual author(s) and contributor(s) and not of MDPI and/or the editor(s). MDPI and/or the editor(s) disclaim responsibility for any injury to people or property resulting from any ideas, methods, instructions or products referred to in the content.

