1. Introduction
In recent years, emotion recognition technology has shown great potential across various fields, including healthcare, education, workplaces, and robotics. For example, in healthcare, monitoring a patient’s emotional state in real time can enable the early detection of mental health conditions through continuous observation of their psychological state and, consequently, help prescribe more accurate treatment procedures [
1,
2,
3]. In educational settings, understanding students’ emotions allows for personalized learning tailored to each individual’s comprehension and interests [
4,
5,
6]. In workplace environments, managing employee stress can reduce human error, enhance efficiency, and prevent workforce losses due to work-related accidents [
7,
8,
9]. In the field of robotics, emotion recognition technology can improve the interactions between humans and robots, facilitating more natural and intuitive communication [
10,
11,
12].
Recently, many emotion estimation methods have been studied, primarily using functional magnetic resonance imaging (fMRI), physiological data, and facial images. These methods estimate emotions by extracting and analyzing features from the obtained data. Conversely, machine learning and deep learning methods for emotion estimation have also been widely researched recently, enabling high-accuracy emotion estimation. However, these conventional methods are associated with several issues, including invasiveness and privacy concerns.
To address these issues, our research group is developing an emotion estimation method using indoor environmental data [
13,
14,
15]. This method collects environmental data selected based on human perception through a wireless sensor network utilizing noncontact environmental sensors. The environmental big data thus collected are used to construct models for emotion estimation by employing machine learning and deep learning techniques. This approach avoids the need for wearable devices or cameras in conducting such research, thereby addressing issues related to stress and privacy. In previous studies, emotions are predominantly treated as categorical data (Relaxed, Sad, Angry, and Happy) and addressed as a classification problem, where the goal was to assign each data point to one of the predefined categories. In contrast, this study represents emotions using two continuous dimensions: Arousal and Valence. These dimensions capture both the type and intensity of emotional states, enabling a more nuanced understanding compared to the categorical approach. The proposed method utilizes physiological sensor data during the model training phase to estimate Arousal and Valence values. However, after training, it estimates emotions using only environmental sensor data. The proposed method, similar to previous research, uses physiological sensor data for emotion data during the model training phase. However, after training, it estimates emotions using only environmental sensor data.
With the rapid advancement of Internet of Things (IoT) technology, many household devices have become connected to the internet, leading to the widespread adoption of smart home technologies. These devices are equipped with environmental sensors such as temperature, humidity, CO2 concentration, and light intensity, and the real-time environmental data collected from these sensors can now be easily gathered and analyzed online. Furthermore, by utilizing devices such as air conditioners, air purifiers, and humidifiers, it is possible to adjust the indoor environment sensors. For example, by estimating emotions in real time and adjusting the room temperature or exchanging the air based on the results, it is possible to provide an optimal environment for each individual’s psychological state. Emotion estimation technology using environmental data can be easily implemented in both homes and workplaces, offering significant potential to greatly improve the quality of daily life. To validate the effectiveness of estimating Arousal and Valence using environmental data, we prepared an experimental facility and conducted experiments to collect both environmental and emotional data. Using these data, we constructed models for emotion estimation employing random forest (RF), gradient-Boosting decision trees (GBDT), and cnvolutional neural netwark-long short-term memory (CNN-LSTM). We evaluated the accuracy of models using the coefficient of determination (R2).
The objective of this study is to discuss the feasibility of estimating emotions such as arousal and valence based on environmental data through experiments, and to propose a model that can estimate emotions with high accuracy. This method is non-invasive, as it does not require wearable devices, and it also does not require cameras, thus addressing privacy concerns in emotion estimation. Such emotion estimation methods are easier to implement as services in general businesses, households, and educational settings, potentially expanding the range of people who can benefit from emotion estimation. Furthermore, emotion estimation models based on environmental data have the potential to identify environmental factors that influence emotions. This not only deepens the understanding of emotions but also enables environmental adjustments in real life according to emotional states, making a significant contribution to practical applications.
The structure of this paper is as follows.
Section 2 reviews previous research on emotion estimation and discusses the relationship between environmental factors and emotions. In
Section 3, the methodology used for the experiments in this study is presented, detailing the experimental design and the data collection process.
Section 4 presents the experimental results and provides an interpretation of the findings.
Section 5 offers a discussion on the implications of these results, comparing them with existing literature and exploring their significance. Finally,
Section 6 concludes the paper by summarizing the key findings and suggesting potential directions for future research.
2. Emotion Estimation Approaches and Environmental Factors
Emotion estimation has garnered significant attention in recent years due to its potential applications in various fields, including healthcare, education, and robotics. Various methods have been proposed for emotion estimation, such as functional magnetic resonance imaging (fMRI), physiological data, and facial expression recognition, and these methods have shown promising results. However, these conventional approaches face several challenges, including invasiveness, privacy concerns, and the need for specialized equipment. In this chapter, we provide an overview of conventional emotion estimation methods and their limitations, as well as introduce the influence of environmental data on emotions estimation.
2.1. Using fMRI
In emotion estimation using fMRI, changes in blood flow in the brain are measured to identify the active regions of the brain and to analyze their responses to evaluate the type and intensity of emotions. This method can capture the neural dynamics of emotions with high precision, allowing for direct observation of emotional changes over time and, consequently, fiacilitaing more precise explanations of the estimated changes in emotions. Additionally, fMRI allows for a detailed visualization of activity in different brain regions and networks, making it possible to detect emotions or subtle emotional responses that may not be externally expressed [
16,
17]. This ability is a crucial criterion for evaluating emotional recognition. For example, in mental disorder research, fMRI has been used to analyze patients’ emotional responses, helping improve treatment methods [
16,
18]. In particular, techniques using real-time fMRI feedback to control stress and anxiety have garnered attention. By adjusting the activity of the amygdala through real-time fMRI feedback, training in emotional suppression has been conducted to enhance emotional regulation skills. This approach has proven effective in reducing anxiety and stress and may contribute to improvements in mental health. However, fMRI measurement equipment is generally expensive and large, making it difficult to secure the necessary space for installation and operation in general companies and households. Furthermore, acquiring and interpreting data from fMRI requires expert knowledge, creating a significant barrier for general users.
2.2. Physiological Data
Emotion estimation using physiological data primarily involves methods that utilize heart rate variability [
19,
20], electroencephalogram [
12,
21,
22], and electrodermal activity [
23,
24,
25]. These data are collected by usining wearable devices that estimate emotions based on the analysis of autonomic nervous system activity and other factors. Because these devices are often relatively inexpensive and compact, users can perform tasks while wearing them, making them suitable for real-time estimation in workspaces. For example, in the healthcare, they may be used for stress management and mental health monitoring. However, when measuring data such as heart rate, users must ensure that the device is correctly worn at all times, which can lead to discomfort or stress, especially during prolonged use. In addition, long-term wear may cause skin issues, necessitating caution in actual usage. However, recent technological advancements have led to the development of new sensor technologies that provide more comfortable wear and higher measurement accuracy, raising expectations for future developments.
2.3. Facial Expressions
Emotion estimation methods using facial images primarily identify emotions by analyzing changes in facial expressions. In this approach, facial feature points are first detected, and then features related to a given expression are extracted. Based on the extracted data, emotions are classified using machine learning and deep learning techniques [
26,
27]. Emotion estimation through facial images enables real-time emotion analysis and facilitates noncontact emotion estimation. This method is utilized in the field of robotics; for example, robots such as Pepper recognize users’ facial expressions, estimate their emotions, and respond accordingly, leading to more natural communication. However, this method can only analyze emotions expressed through facial expressions, which means that it cannot read underlying emotions, raising concerns about privacy invasion.
2.4. Emotion and Physical Environment
The impact of physical environmental factors, such as room temperature, noise, and CO
2 concentration, on emotions has been widely documented. For example, elevated CO
2 levels have been shown to impair cognitive function and decision-making abilities, which may lead to reduced concentration, anxiety, and irritability, ultimately affecting healthcare outcomes [
28,
29]. Additionally, environmental noise, such as traffic sounds, can trigger anger and anxiety, impair cognitive functions, cause sleep disturbances, and increase cardiovascular risk [
30]. Moreover, research has also explored how combined environmental factors influence emotions [
31]. Understanding the relationship between emotions and the environment is crucial for creating comfortable living spaces.
3. Materials and Methods
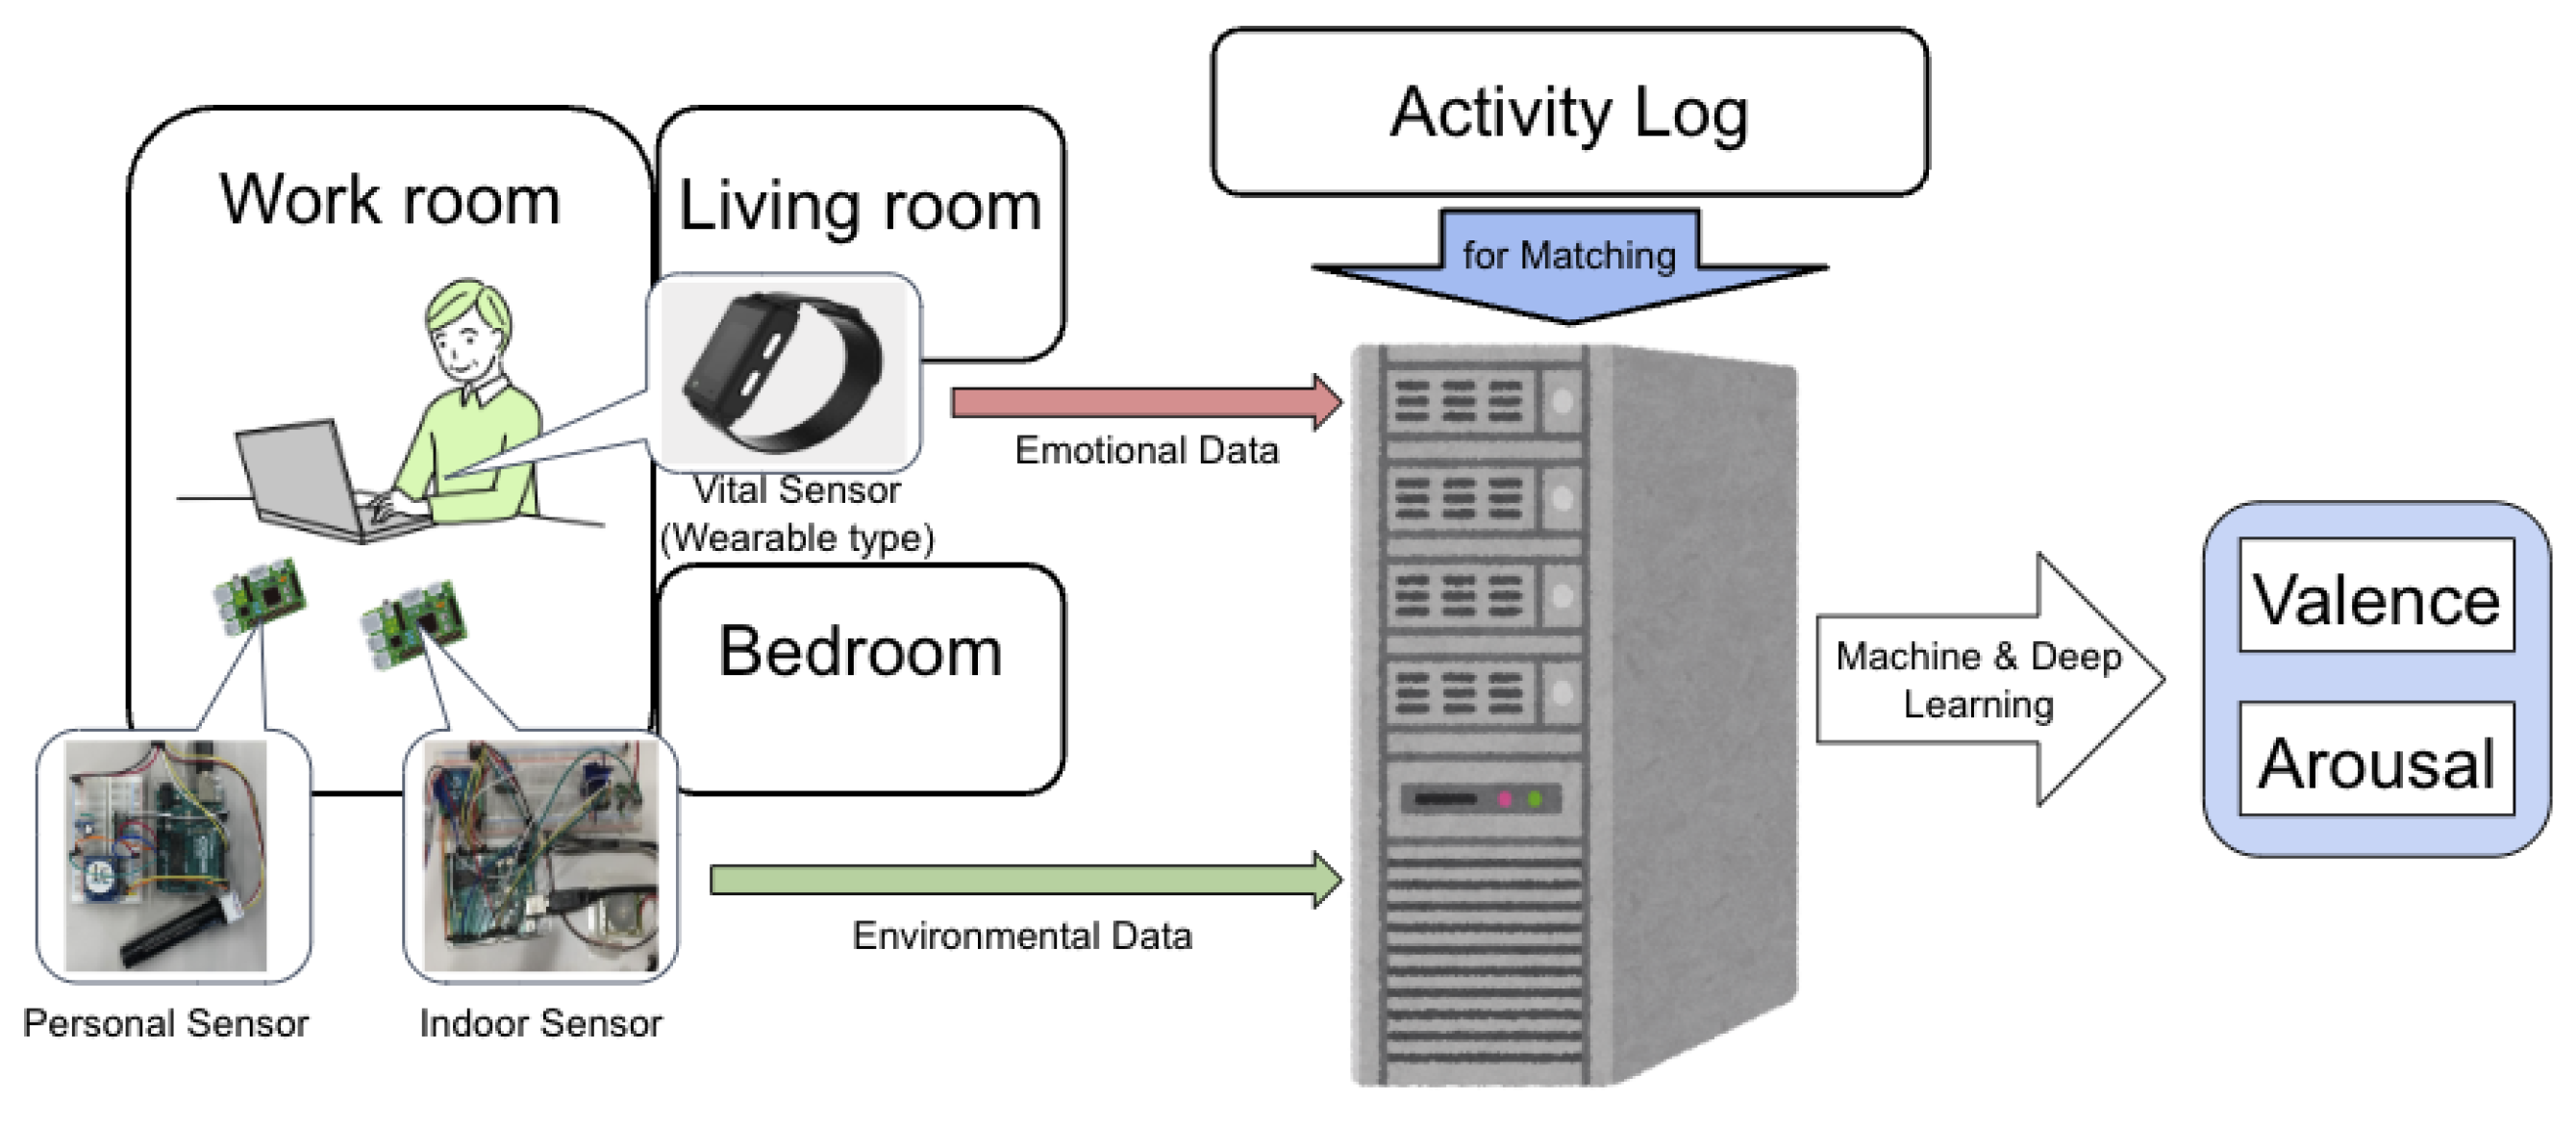
This study’s overview is as follows: Sensors placed around a person working in a given space collect environmental data, such as CO2 concentration, temperature, and other factors expected to influence human emotions, are collected by sensors placed around a person working in a given space. These data are then input into a predictive model trained using machine learning and deep learning techniques to estimate the individual’s arousal and aalence values.
An experiment was conducted to verify the effectiveness of this method.
3.1. Overview of Machine Learning Model Settings
Figure 1 illustrates an overview of the experiment. In the experiment, a dedicated facility was prepared for the participants to live in. Environmental sensors were installed in the facility to measure the data, and participants wore wearable devices to facilitate data collection.
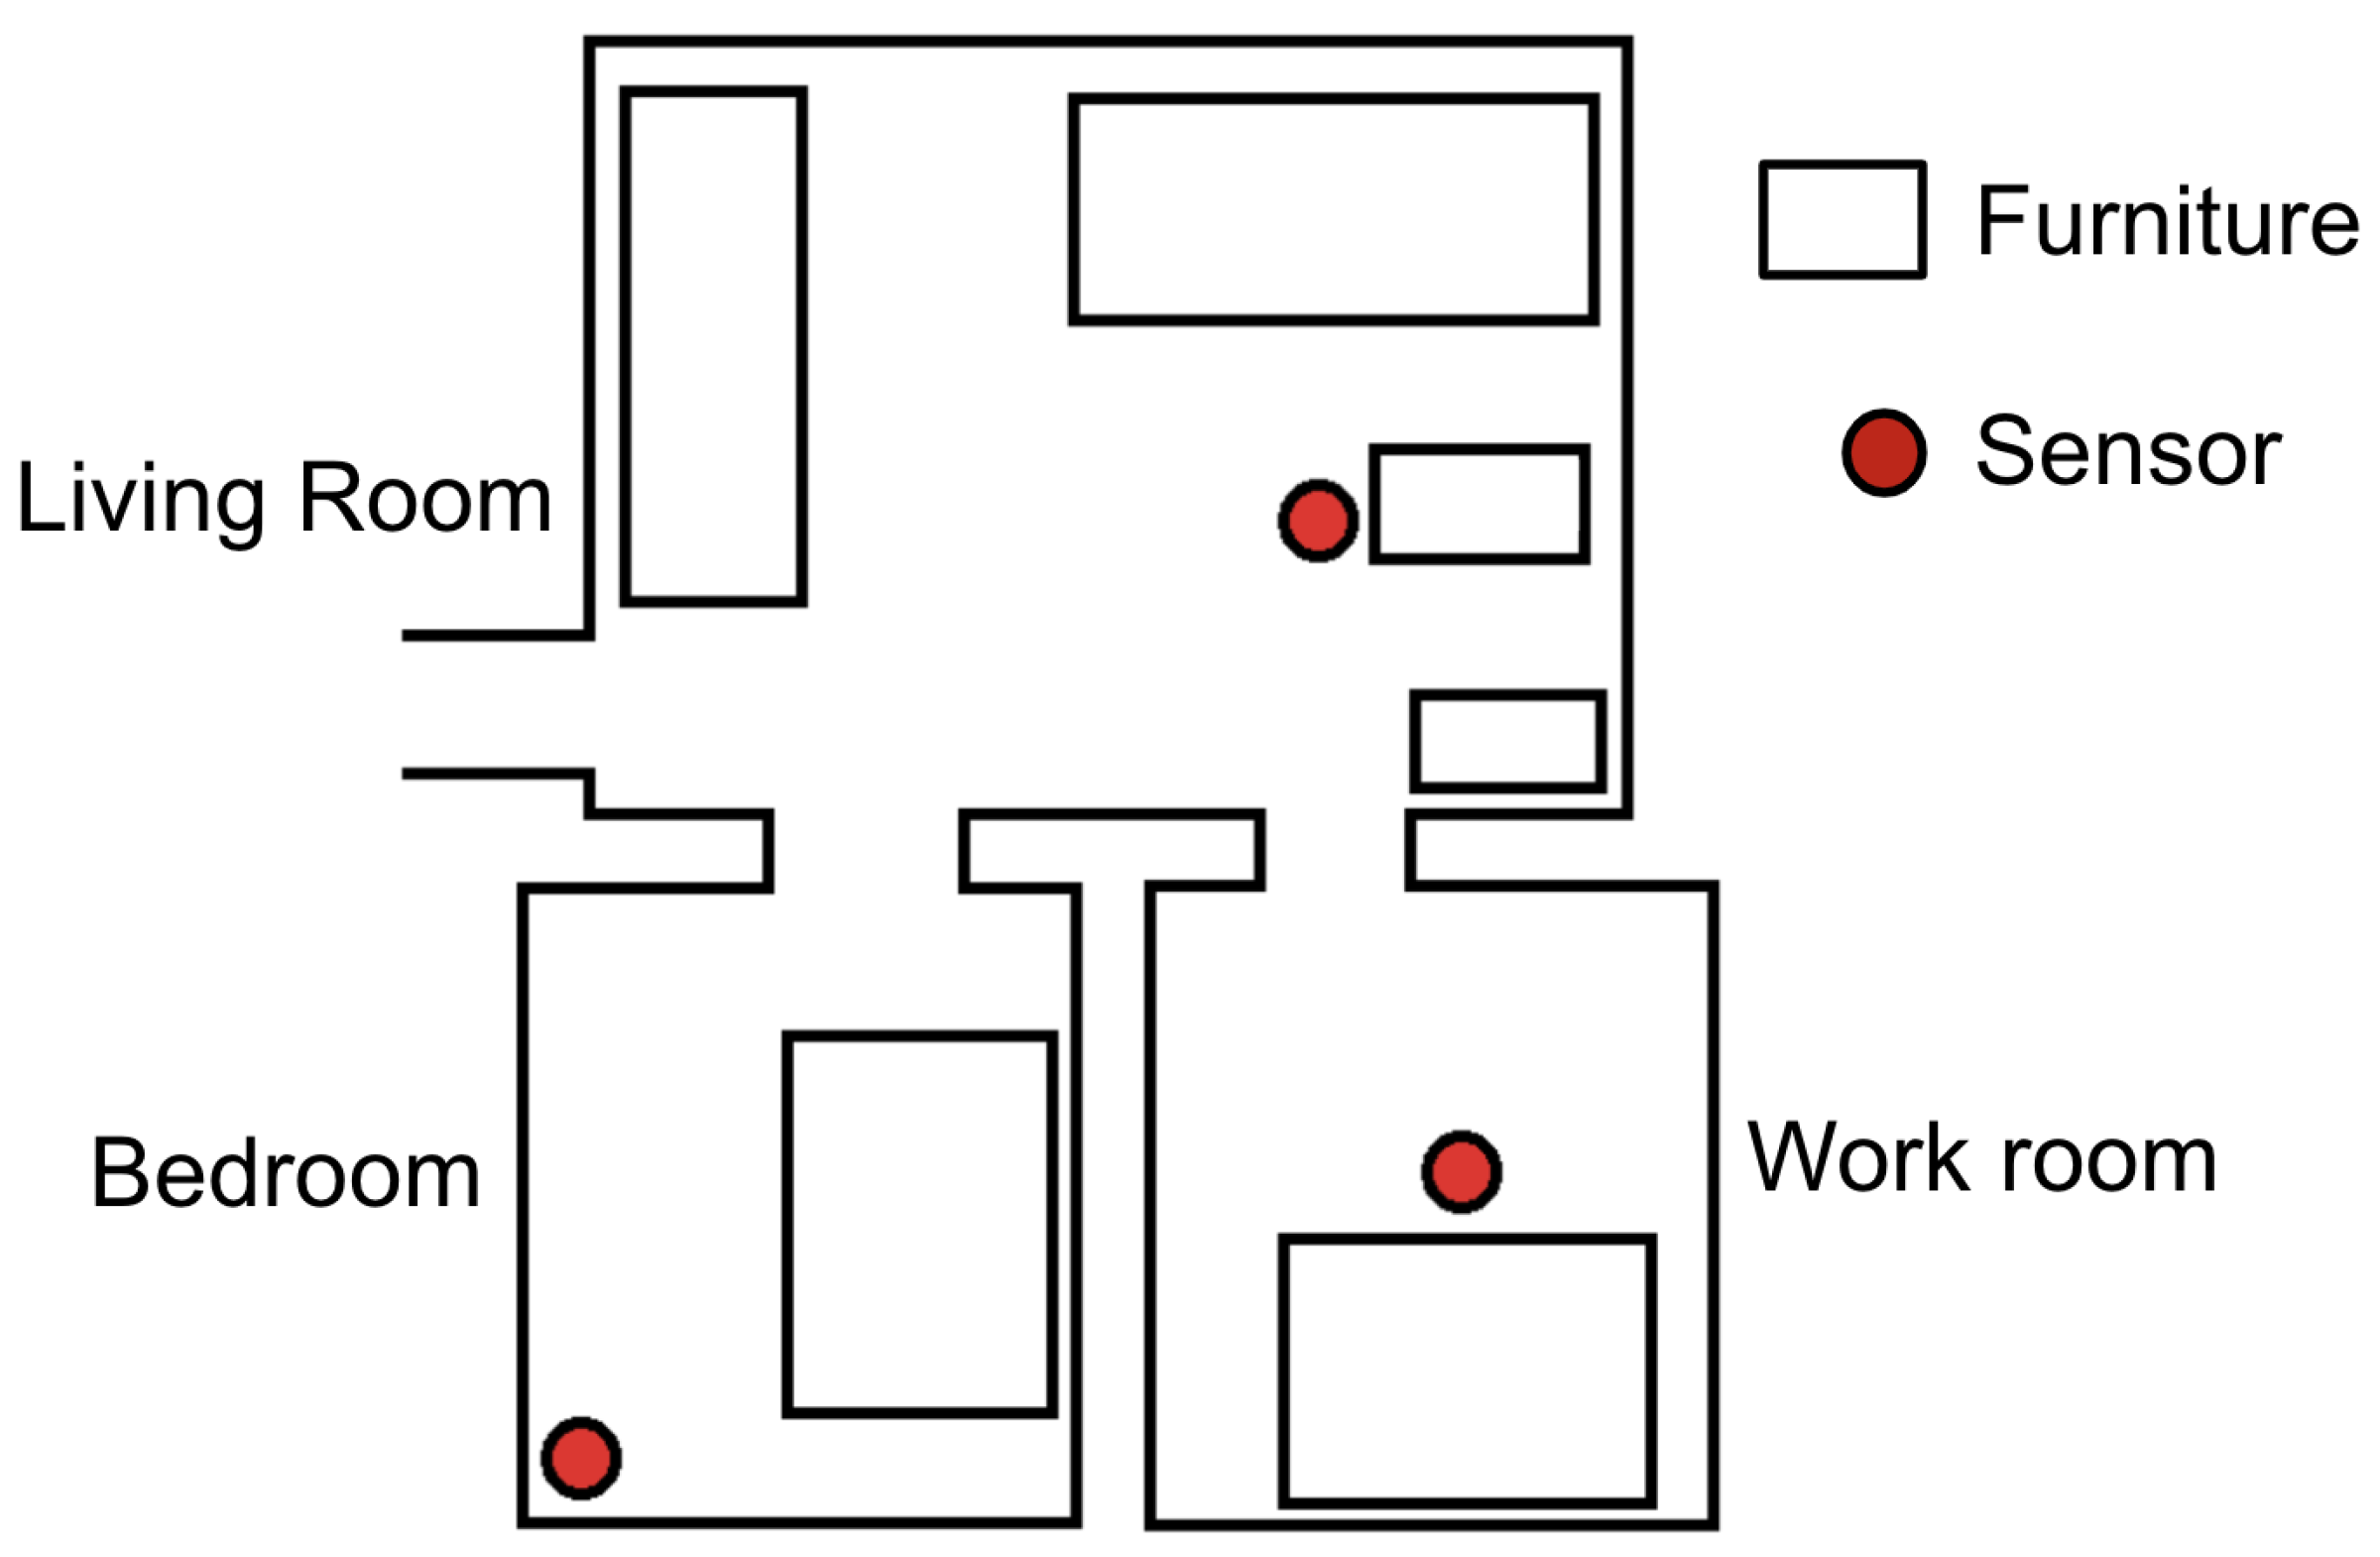
3.2. Experimental Facility
The experiment was conducted in two rooms at the Chiba University Prevention Center. Each room comprises three separate areas: a “bedroom”, a “work room”, and a “living room”. Sensors are installed in each area, as illustrated in
Figure 2 and
Figure 3.
3.3. Participant Conditions and Experiment Duration
The experiment was conducted over five weeks, spanning September and October, and involved a total of 17 participants. Each participant’s data were recorded over four days. In one room, the participants lived individually for the first three weeks, whereas in the last two weeks, the roomm was occupied by two individuals simultaneously. In the other room, two individuals shared the space throughout the five weeks. the participants kept a behavioral log to track their activities, which was used to determine the room they occupied throughout their daily activities.
3.4. Collection of Environmental Data
In this experiment, a synthetic sensor similar to those in references [
13,
15] was constructed to collect the environmental data. Both Arduino and XBee were used for data collection. Arduino is an open-source development board equipped with a microcontroller, making it suitable for sensor control and data processing, and is ideal for data collection and I/O operations. XBee is a wireless module based on the ZigBee protocol, which, when combined with Arduino, enables wireless communication between sensors and allows the creation of a wireless sensor network (WSN). Among the environmental data collected by the sensors mentioned above, we used the data shown in the
Table 1 for emotion estimation.
In this experiment, Arduino controlled the environmental sensors, and data collected every 5 s were transmitted via XBee to a single server using the WSN. Each room was equipped with a total of six composite sensors, each assigned a sensor ID from 1 to 6. The sensor ID, timestamp, and measurement data were recorded on the server. Based on the participants’ activity logs, the environmental data recorded by the sensor corresponding to the participant’s living space at that time were used as the environmental data for that period.
3.5. Collection of Ground Truth Data
In this experiment, the NEC’s emotion analysis solution was utilized to collect emotion data [
32]. This system employs the Silmee™ W22, a dedicated wristband-type wearable device, to analyze biological signals based on methods in health science and medicine, allowing estimation of the wearer’s emotional state. Emotion data were measured every 10 s and stored on a server. Additionally, a custom-developed web application was employes to verify and download of the measured emotion data. This solution uses Russell’s arousal-valence model, and the application displays both arousal and valence values as well as four emotion states—Happy, Relaxed, Sad, and Angry—derived from these values. Both arousal and valence each range from −1 to 1. Higher values of arousal, those approaching 1, indicate a state of alertness or focus, whereas values closer to −1 represent drowsiness or fatigue. Similarly, higher valence values, those approaching 1, reflect a sense of comfort, whereas values closer to −1 indicate discomfort. The Silmee™ W22 also measures, in addition to heart rate, conversation volume, ultraviolet light, and skin temperature.
3.6. Data Processing
In the obtained data, rows with missing values were deleted, and data with an illuminance of 0 were excluded, as they were considered to represent sleep time or time spent outdoors. This resulted in a dataset suitable for estimating emotions during the activity. Data from seven participants, for whom sufficient data were collected, were used to build and evaluate the model. Before training the model, all data were scaled using the MinMaxScaler from the scikit-learn library in Python. MinMaxScaler normalizes the scale differences between features, allowing the model to treat each feature equally. This leads to improved convergence speed, greater stability in learning, and reduced overfitting, particularly for gradient-based models. Furthermore, scaling preserves the relationships between features, enabling the model to learn more efficiently.
3.7. Model Building
In this experiment, RF and GBDT models were adopted as machine learning models for emotion estimation. These models were chosen in the initial phase of the experiment because of their high versatility and accuracy potential in handling regression tasks involving multiple features. RF is an ensemble learning method known for its robustness against feature dependency and overfitting, and it enables the evaluation of feature importance, which helps clarify the contribution of each environmental data point to emotion estimation. THe GBDT model captures complex nonlinear relationships within the data, offering the potential for improved accuracy compared to the RF model.
In addition, we adopted the CNN-LSTM model as a deep learning model. This CNN component captures data features, while the LSTM components learns temporal patterns. Specifically, by inputting multiple time steps of data, we can incorporate a temporal range, while the LSTM component enables the consideration of past data’s influence. Since emotions are thought to change continuously over time, processing them as time-series data in this way allows a better capture of these ongoing emotional changes, with an anticipated improvement in accuracy.
3.7.1. Random Forest(RF)
The training process used scikit-learn, an open-source Python library, to configure the parameters of the RF model.
Table 2 shows the parameters of the RF model. Default values were used for all other parameters.
3.7.2. Gradient Boosting Decision Tree (GBDT)
The training process used LightGBM, an open-source Python library, to set the parameters for the GBDT model.
Table 3 shows the parameter of the GBDT model. Default values were used for all other parameters.
For GBDT, the learning process was controlled using early stopping, with the parameters show in
Table 4.
3.7.3. CNN-LSTM
In this experiment, we constructed a CNN-LSTM model using Keras, an open-source Python library.
Table 5 shows the structure of the CNN-LSTM model This model utilizes convolutional layers (Conv2D) for feature extraction. The input layer has the following form: (timesteps, number of columns, 1), and Conv2D layers with a kernel size of (1, 4) and ReLU activation functions were applied sequentially. The number of filters in the convolutional layers was set to 16, 32, 64, 128, and 256, and after each convolutional layer, a MaxPooling layer with a size of (1, 4) was used for downsampling. The output of the convolutional layers was reshaped to (timesteps, 256) and then processed by an LSTM layer with 128 units and a ReLU activation function, capturing the temporal dependencies of the time-series data. This was followed by a fully connected layer with 16 units and ReLU activation, and the final output was produced by a linear output layer with 1 unit for regression. The model was compiled using the Adam optimization algorithm with a learning rate of 0.001 and the mean squared error loss function.
When constructing the model, the number of timesteps, batch size, and number of epochs were set to 16, 64, and 1000, respectively. Furthermore, to prevent overfitting, the following parameters were set for controlling the training progress: monitor was set to loss, min_delta was set to 0.0, and patience was set to 5, with early stopping applied.
3.8. Evaluation Method
To evaluate the proposed model, we used a 5-fold cross-validation method for each subject, ensuring reliability and unbiased assessment of the model’s performance. In this method, the dataset for each subject is divided into five subsets, with each subset sequentially used as a validation set while the remaining subsets serve as the training set. This process was repeated five times. By averaging the evaluation results from each run, we obtained an overall evaluation score for each subject. These scores were further averaged across all subjects to derive a comprehensive evaluation score for the model.
To measure the model’s accuracy, we used the coefficient of determination (R2 score) as a performance metric. The R2 score indicates the proportion of variance in the dependent variable that can be predicted from the independent variables, serving as a standard metric for assessing the goodness-of-fit of regression models. A high R2 score suggests that the model has a good predictive capability for the data. This metric enables consistent evaluation, especially when comparing the accuracy of multiple models.
To gain a more comprehensive understanding of the model’s performance, we calculated the mean R2 score, standard deviation (SD), and 95% confidence interval (CI) based on the cross-validation results, thereby assessing the model’s fit. The SD indicates the variability in the model’s performance across different folds, while the standard error estimates the uncertainty of the mean performance score. We selected a 5-fold cross-validation to maintain an adequate sample size in the validation data. Moreover, the use of 5-fold cross-validation is a common practice, providing a balance between the sample size and the stable model evaluation.
4. Results
In this experiment, three models (RF, GBDT, and CNN-LSTM) were constructed to estimate arousal and valence, and their accuracies were evaluated using the coefficient of determination (R2). The following figures show the average values and 95% confidence intervals(CI) of the results from the 5-fold cross-validation for each model and dataset.
4.1. Results for Arousal
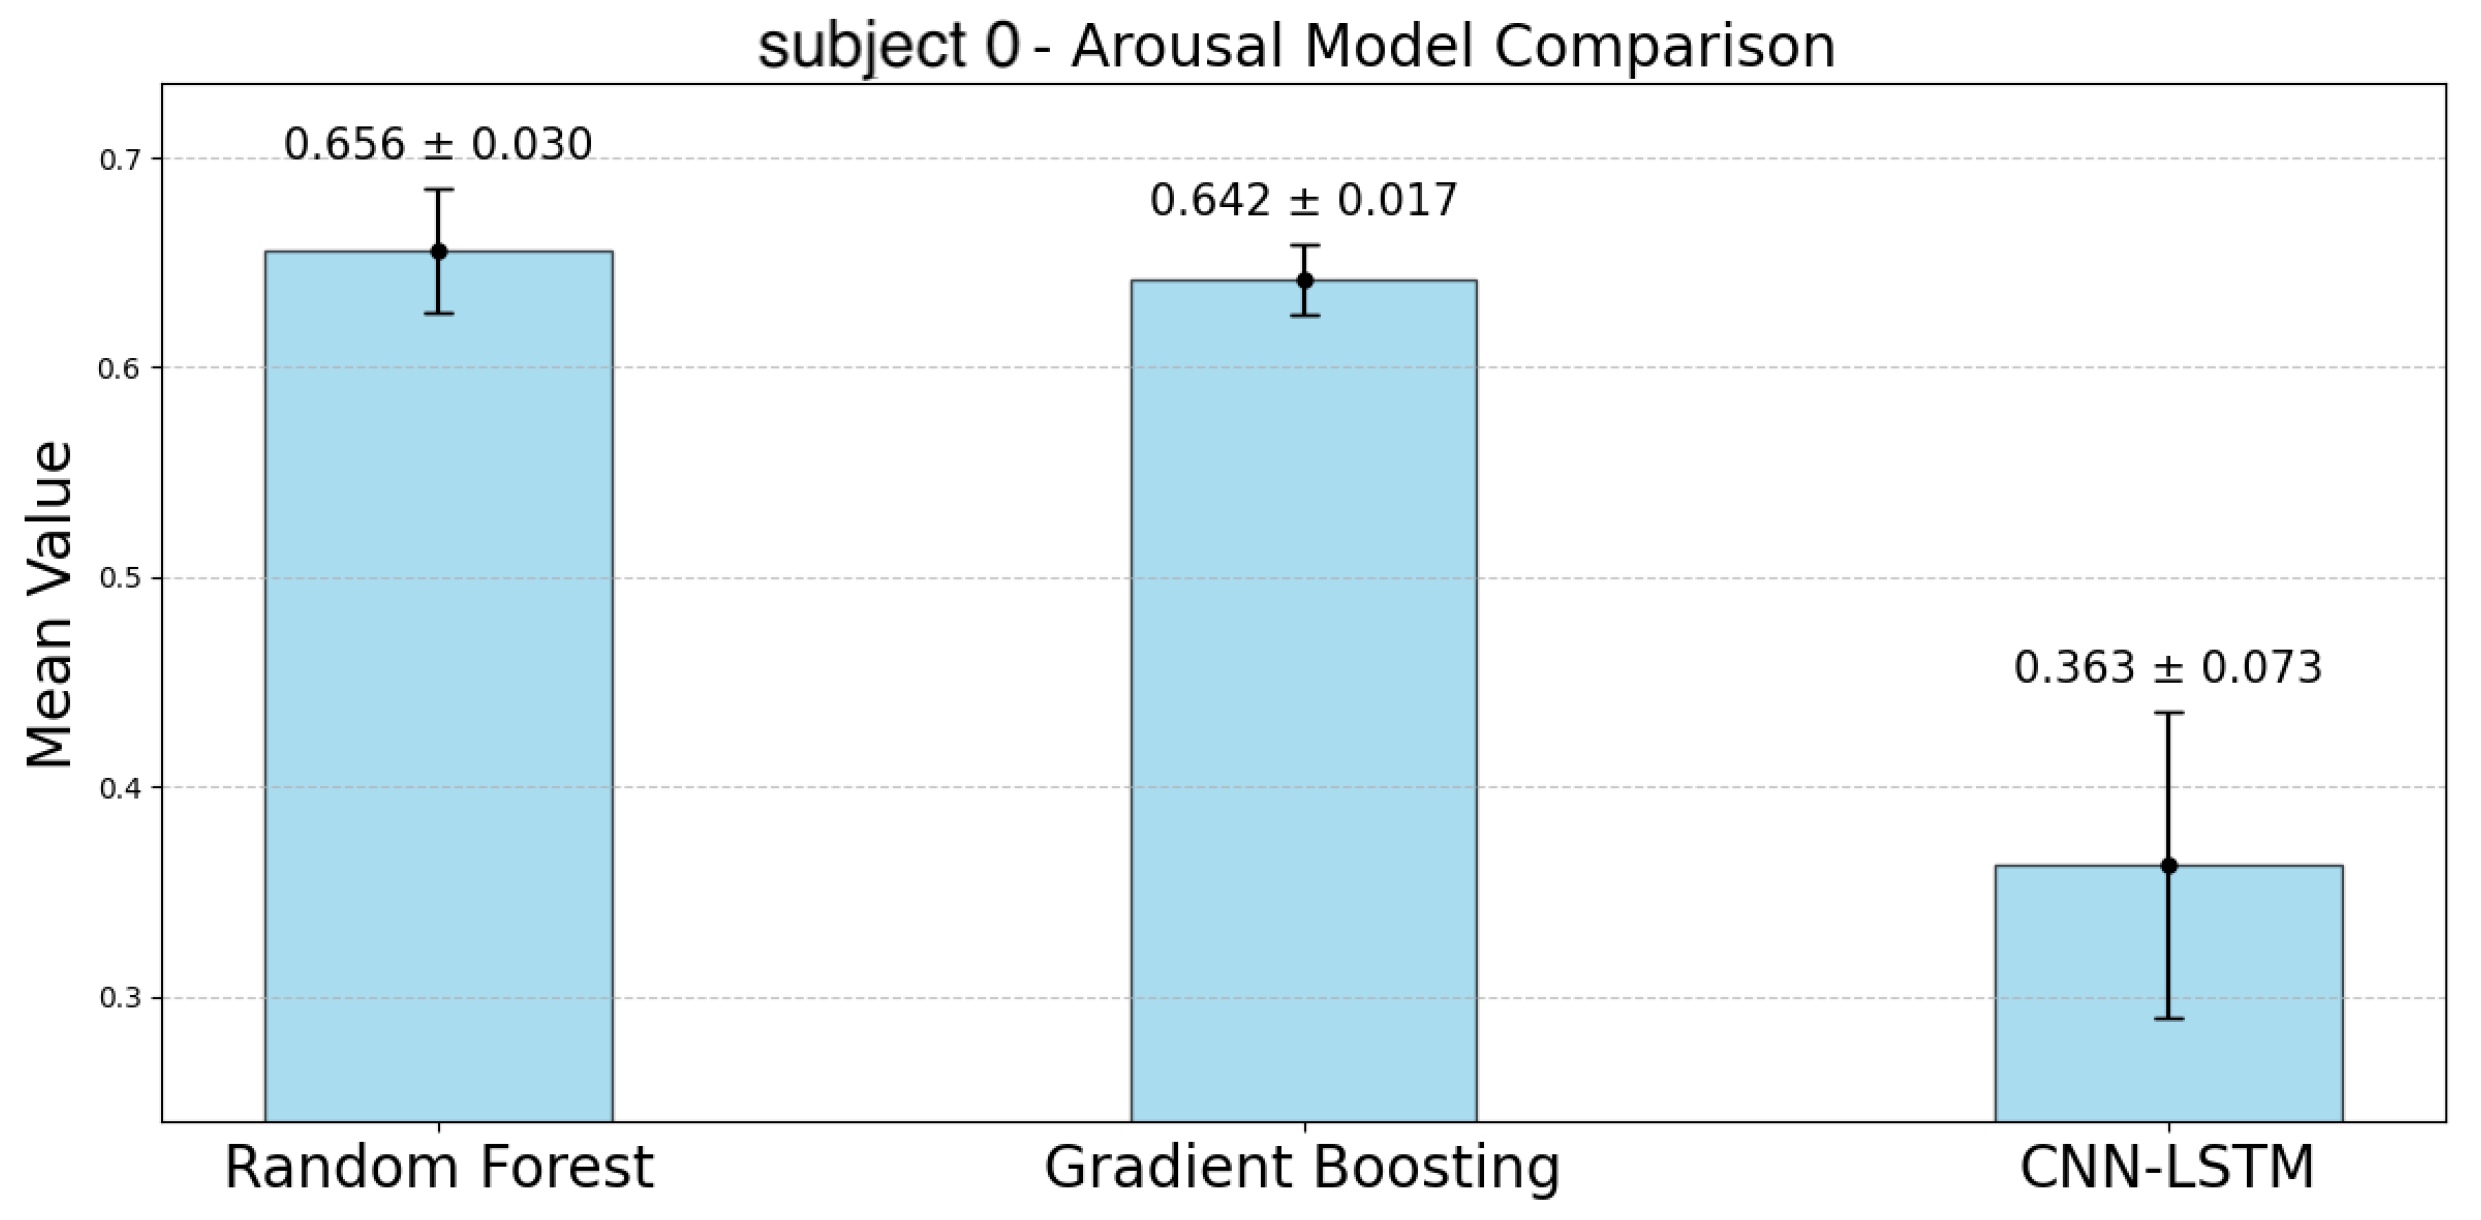
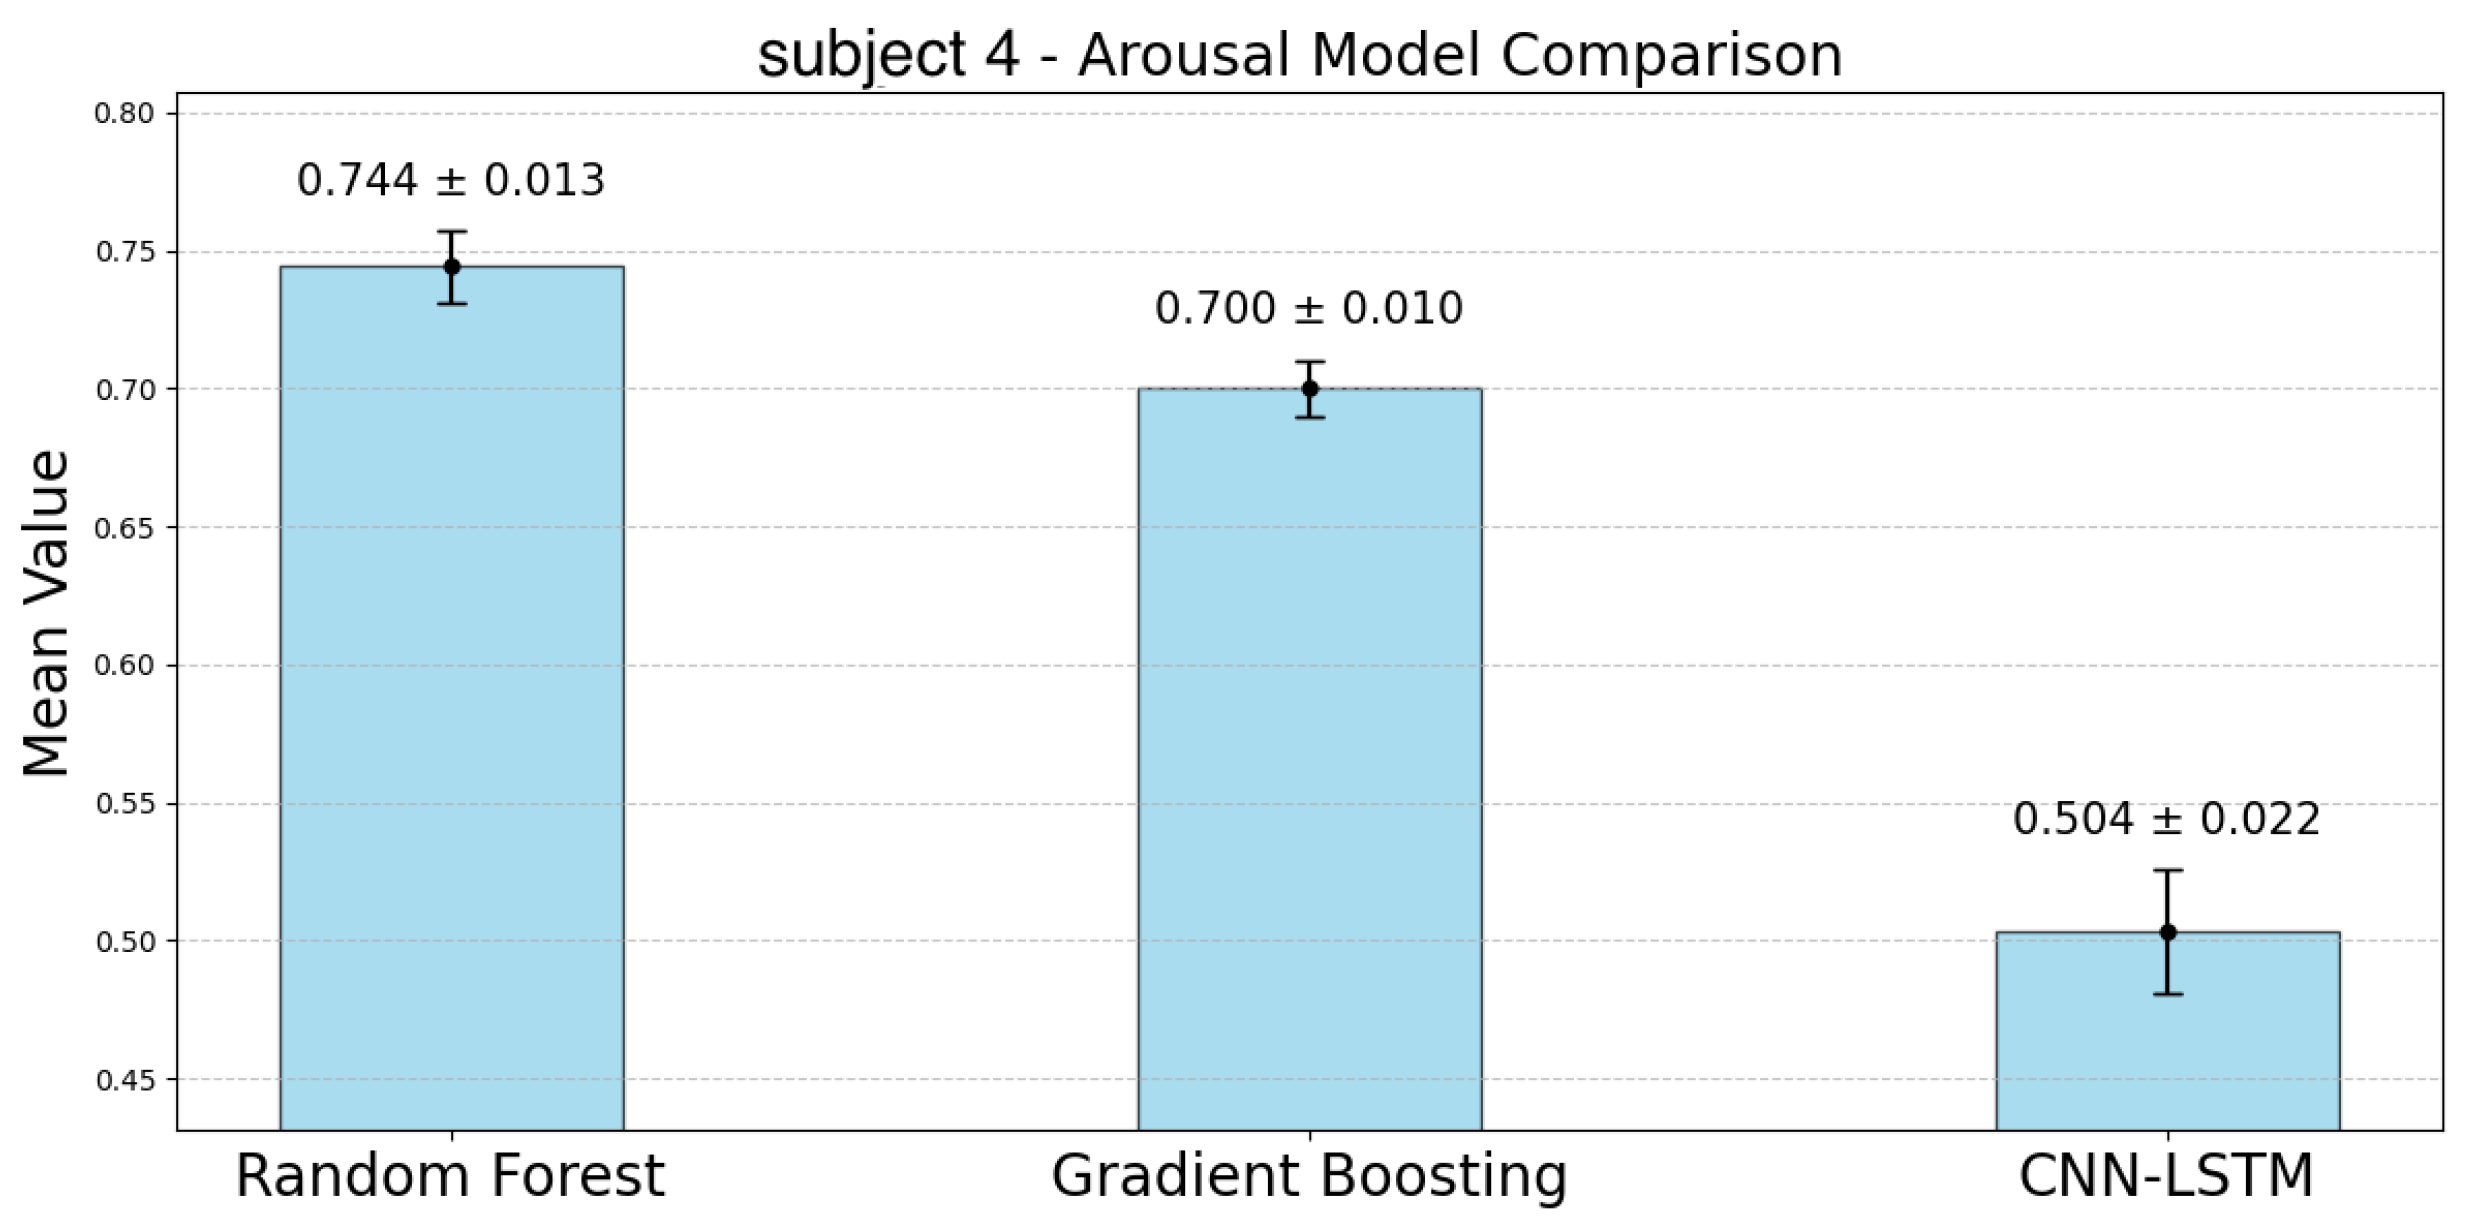
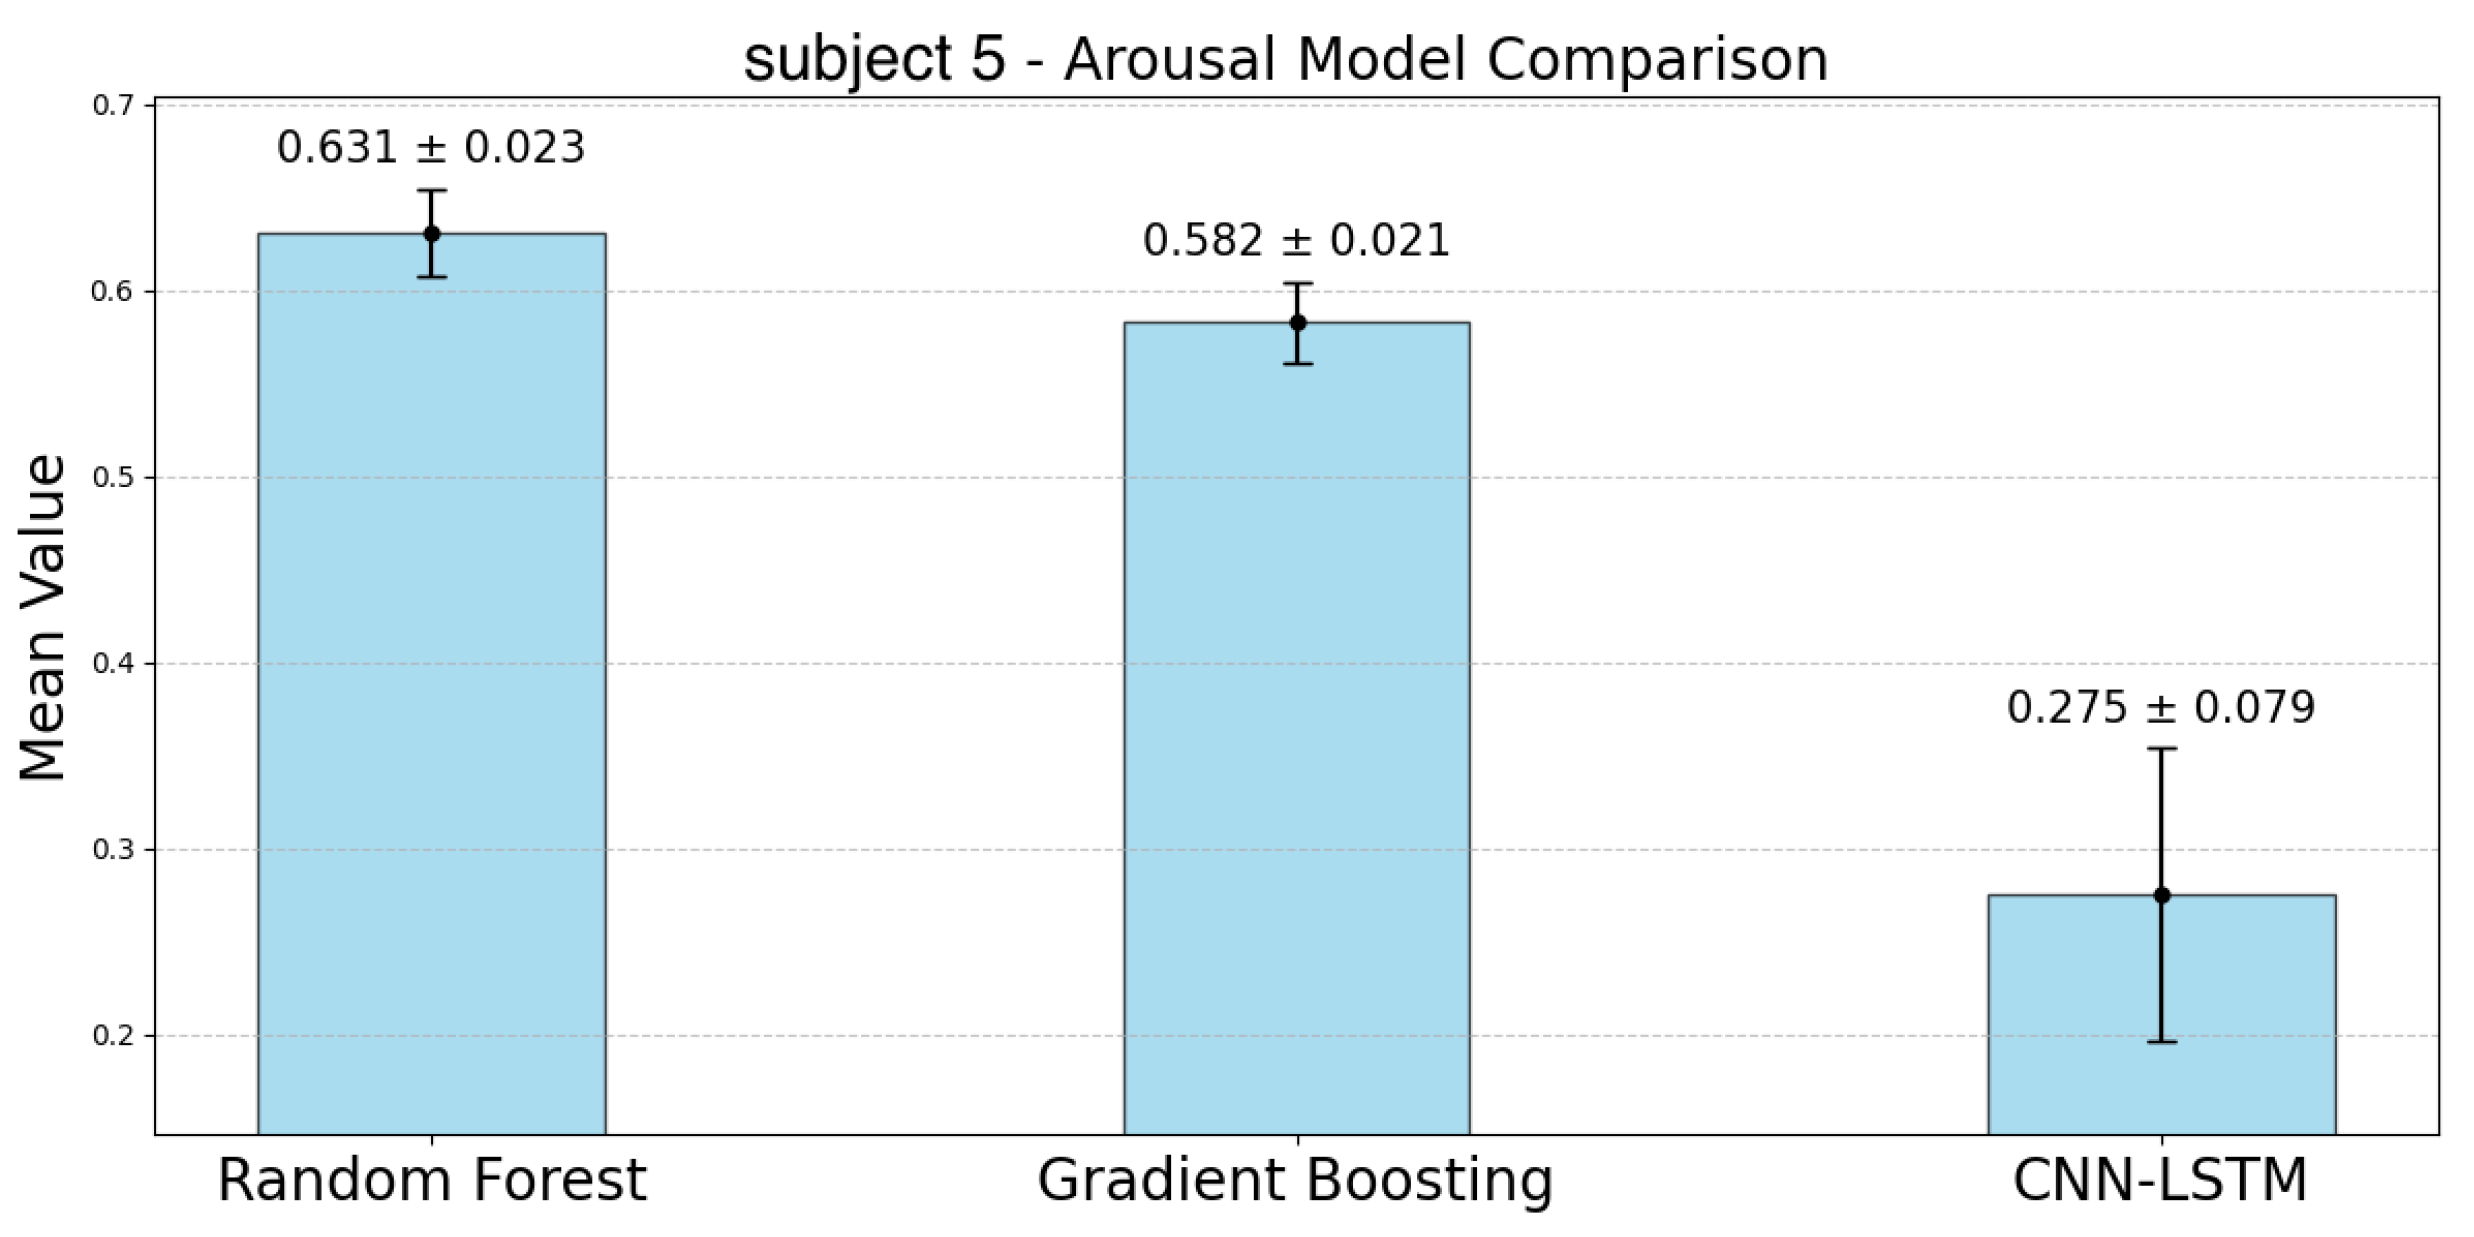
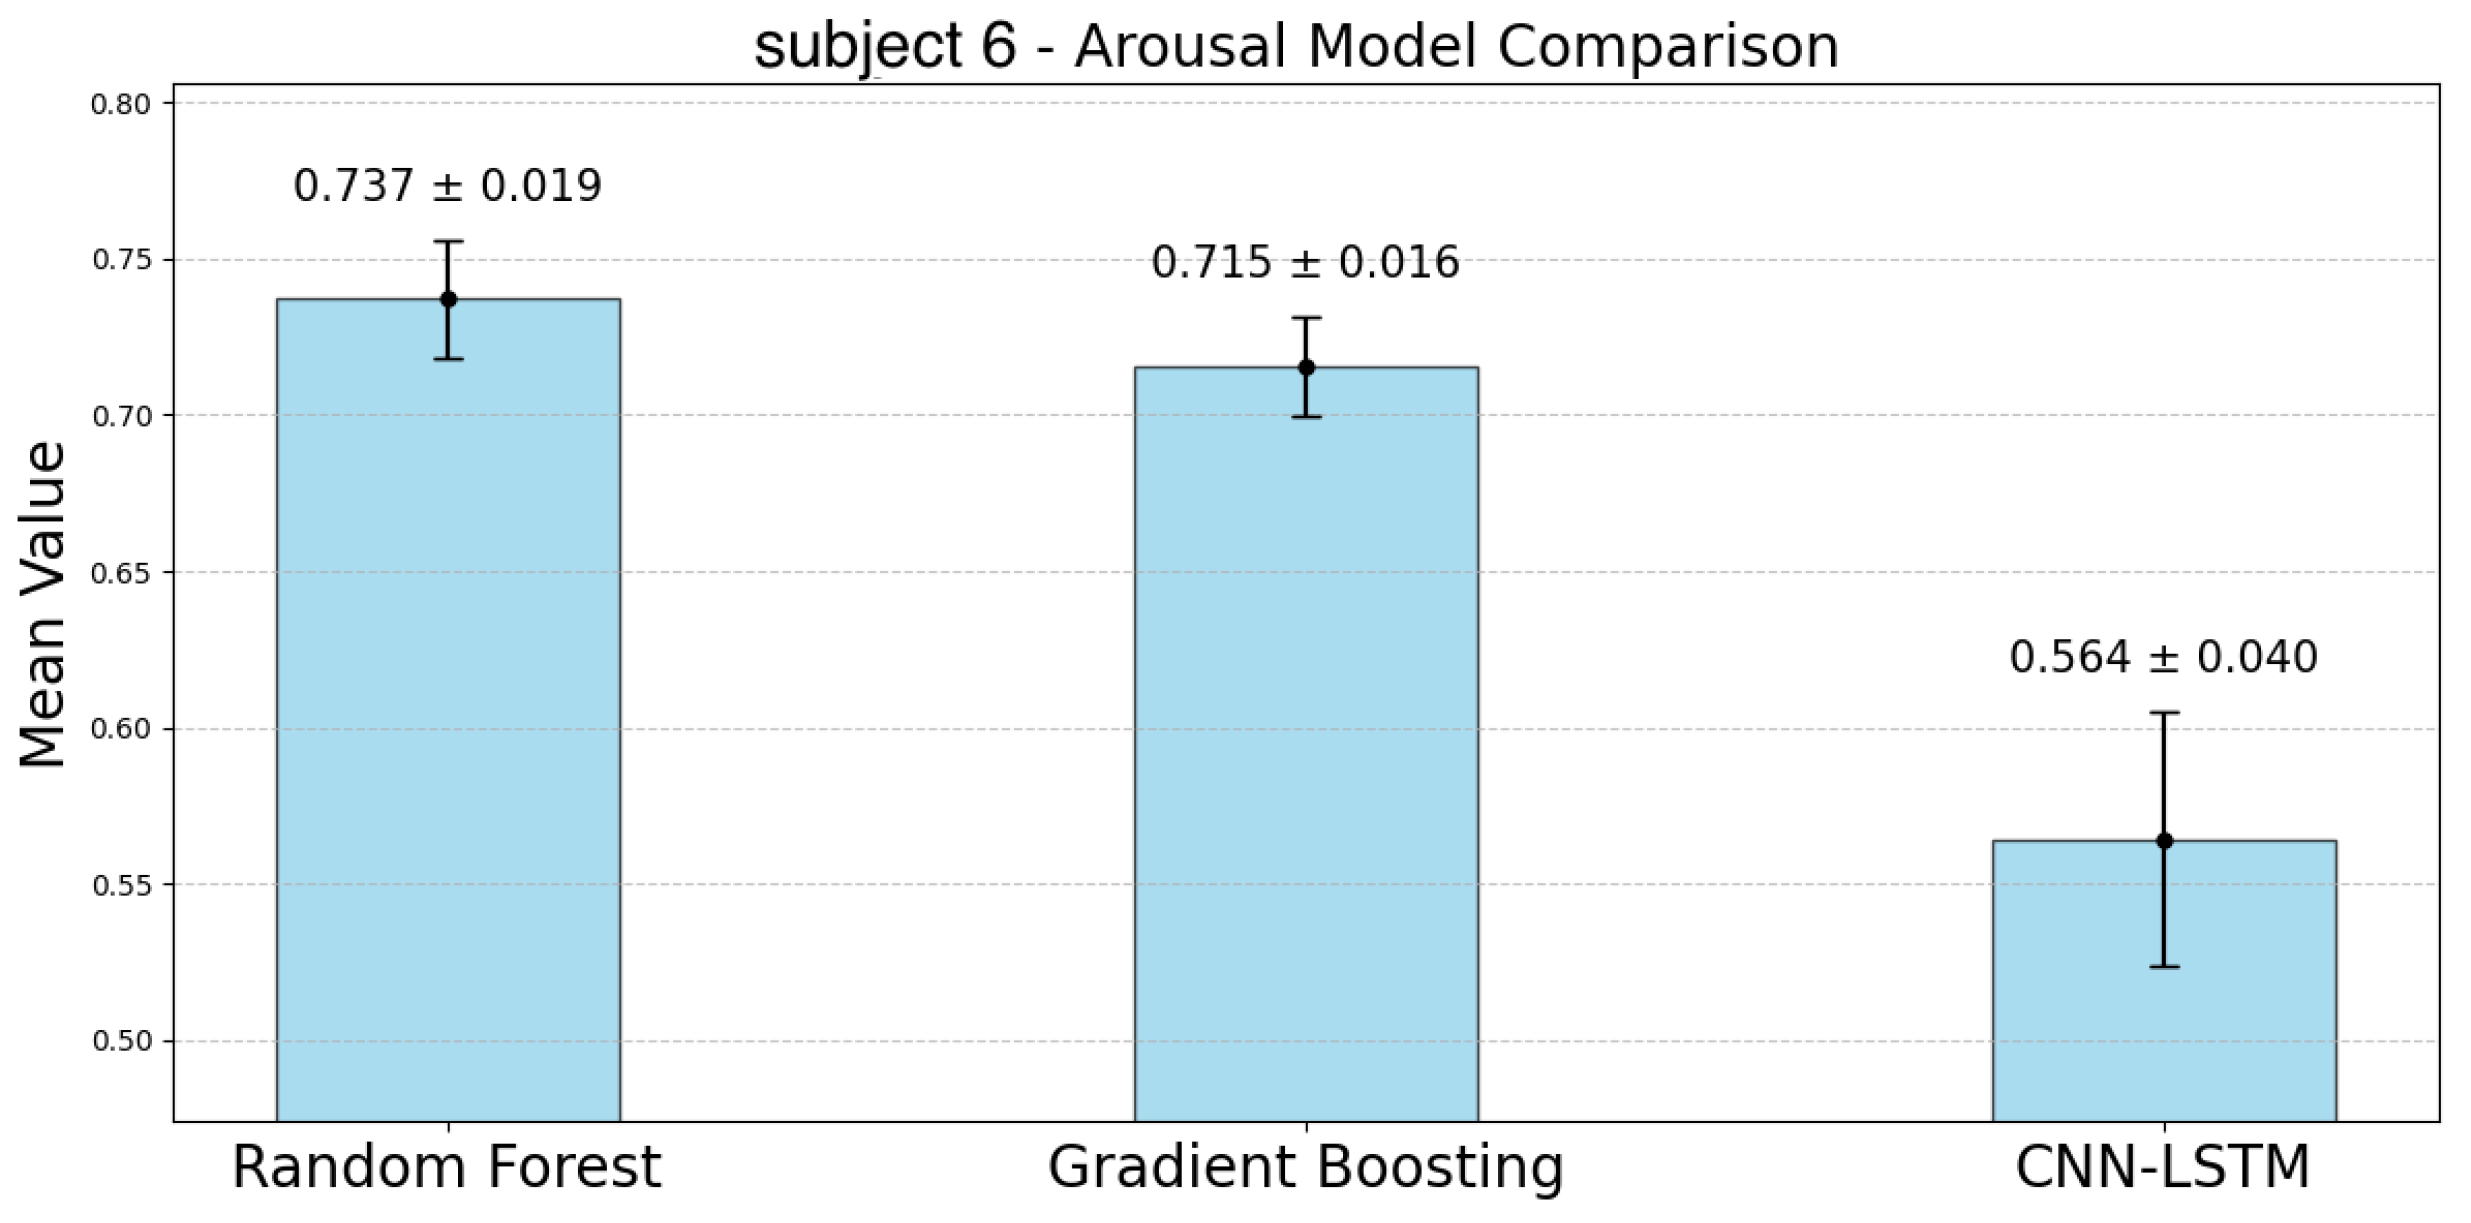
The following
Figure 4,
Figure 5,
Figure 6,
Figure 7,
Figure 8,
Figure 9 and
Figure 10 represent the accuracy of arousal estimation for each model across individual subjects. For arousal prediction, the RF model demonstrated the highest accuracy across all participants. Comparing the mean accuracy across subjects, RF achieved its maximum value of 0.744 for subject 4 and its minimum value of 0.631 for subject 5. The CIs of the GBDT model were narrower than those of the RF model for all participants except subject 3. The mean accuracy for GBDT ranged from 0.715 (subject 6) to 0.582 (subject 5). In contrast, the CNN-LSTM model showed significantly the lowest accuracy compared to the other two models and the largest CIs, indicating greater variability. For the CNN-LSTM model, the highest accuracy was observed for subject 6 (Mean: 0.564), while the lowest was for subject 1 (Mean: 0.241). Although the accuracy differences between RF and GBDT were relatively small, RF consistently outperformed GBDT across all subjects. In contrast, CNN-LSTM showed lower accuracy with greater variability in its predictions.
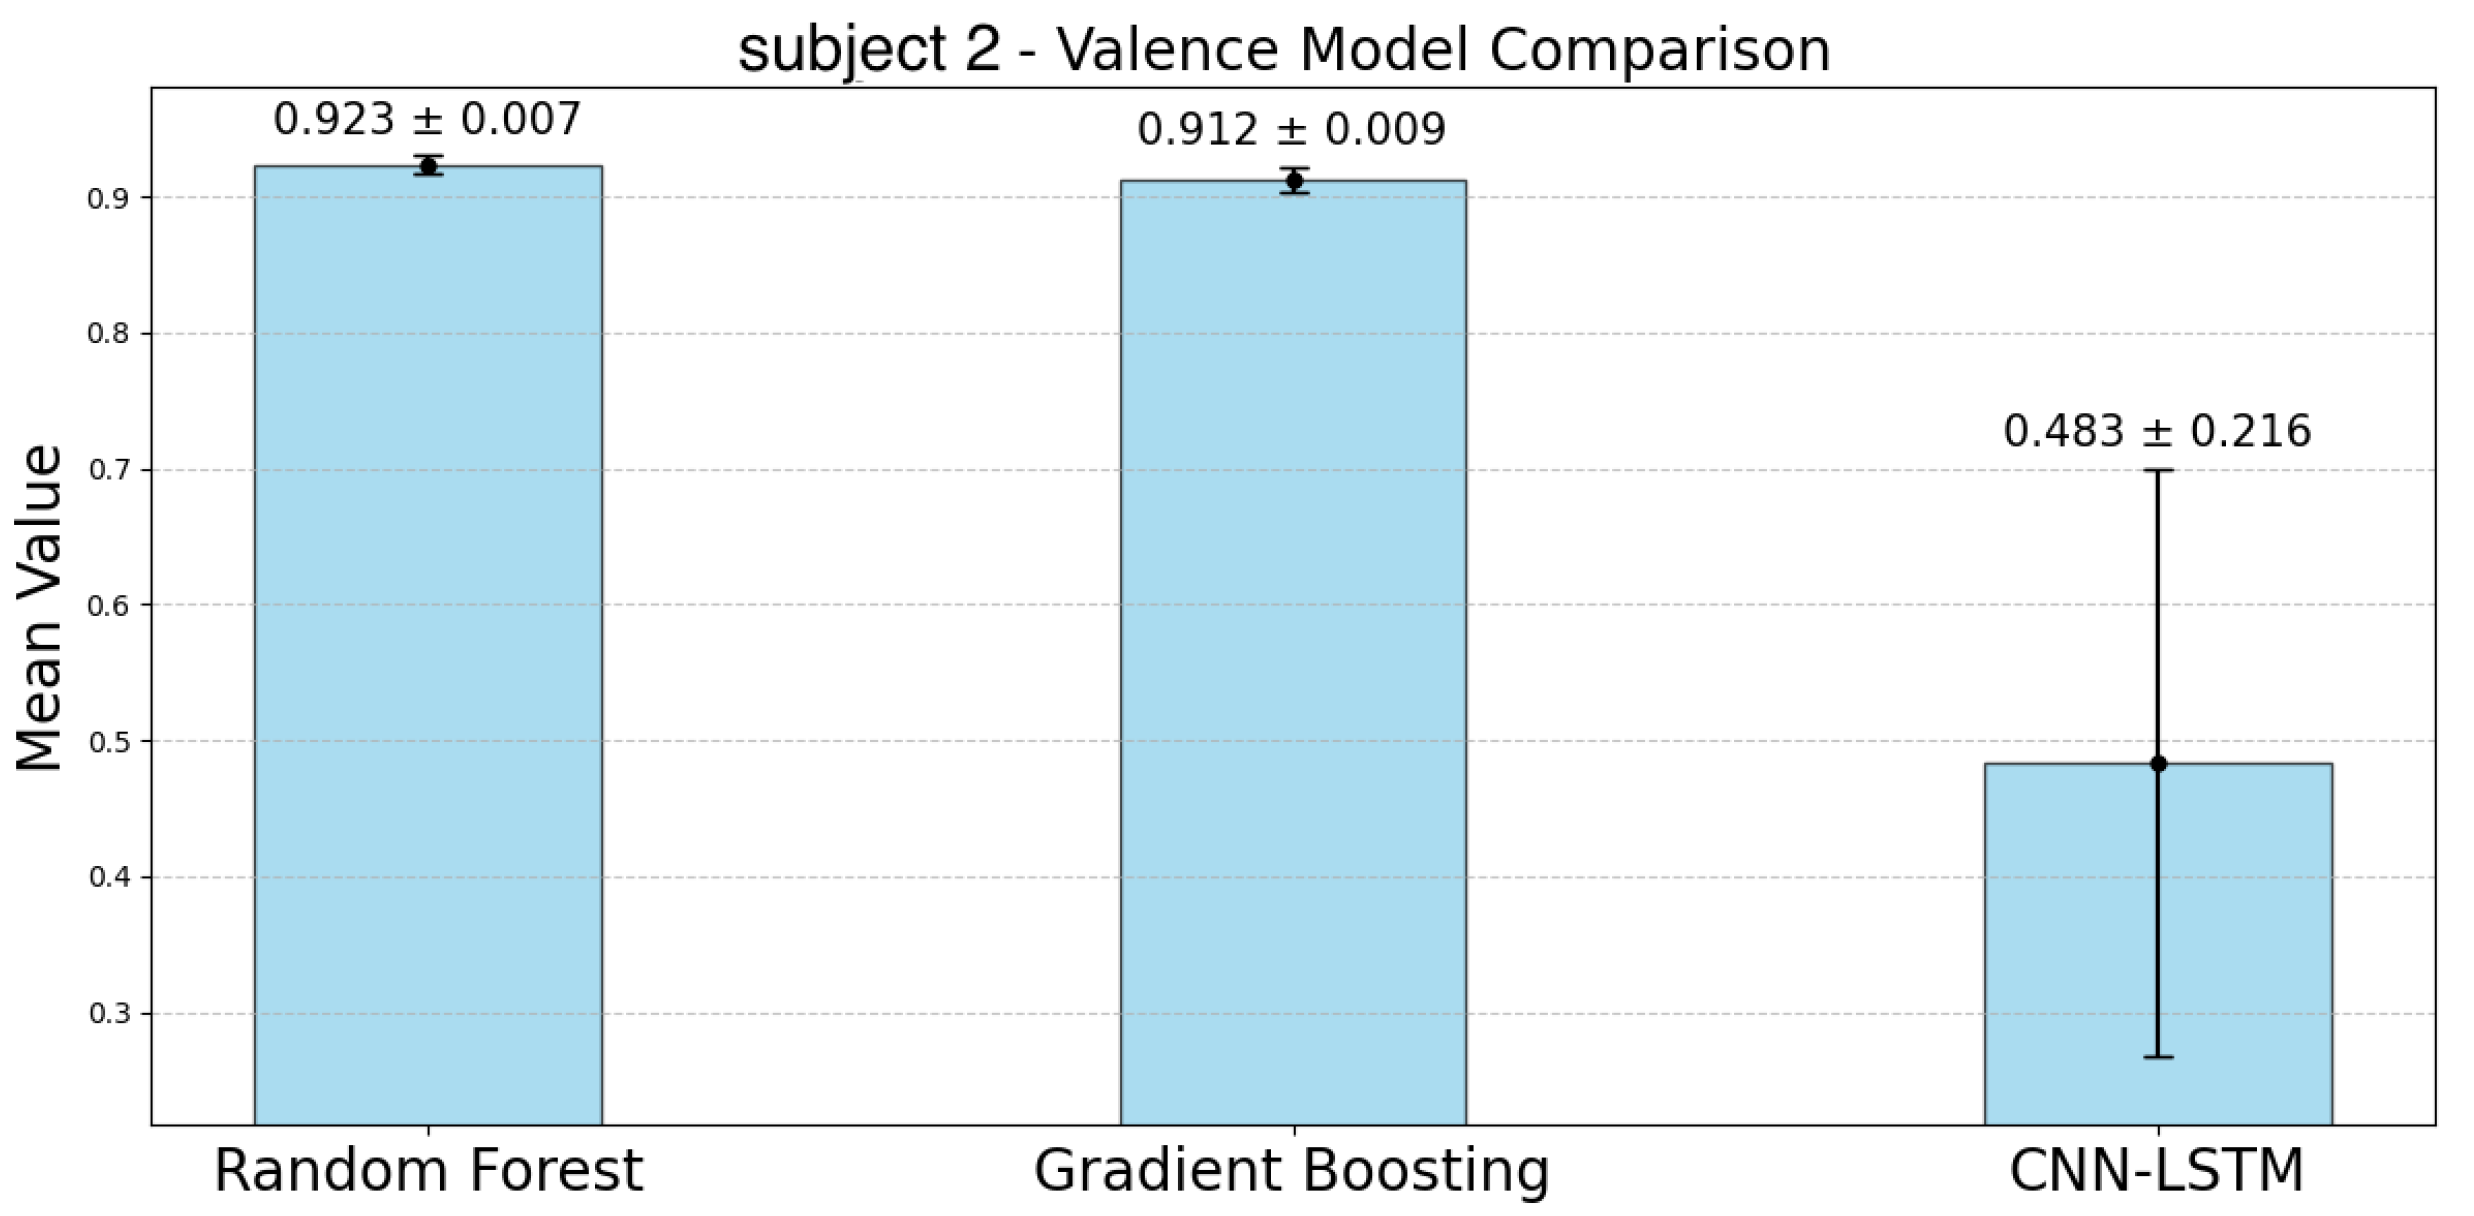
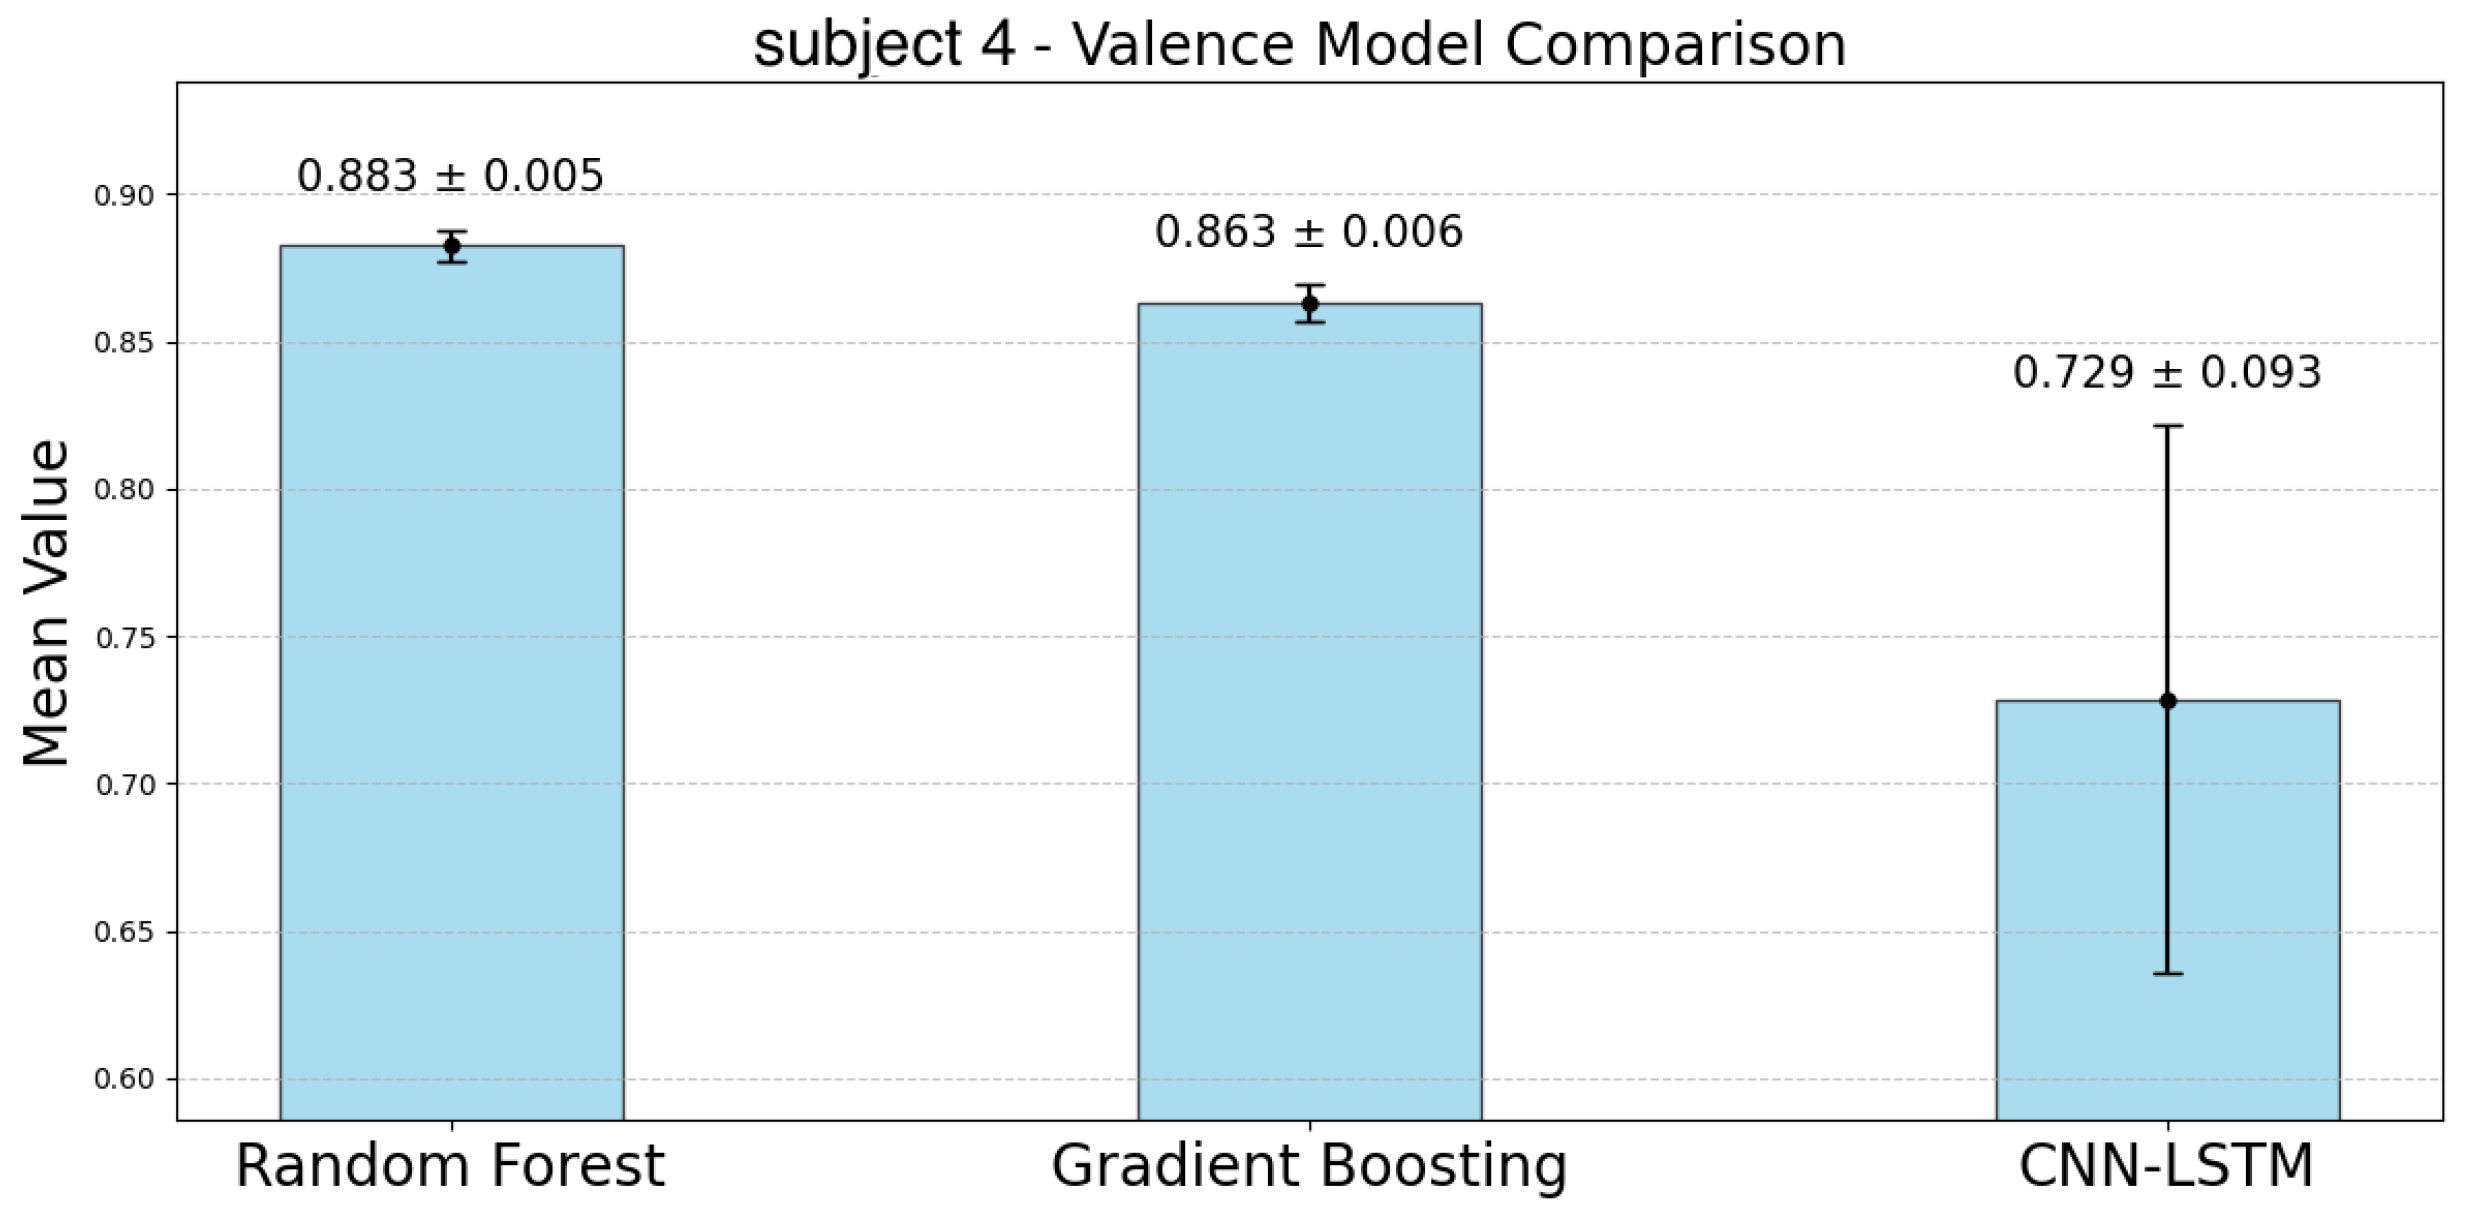
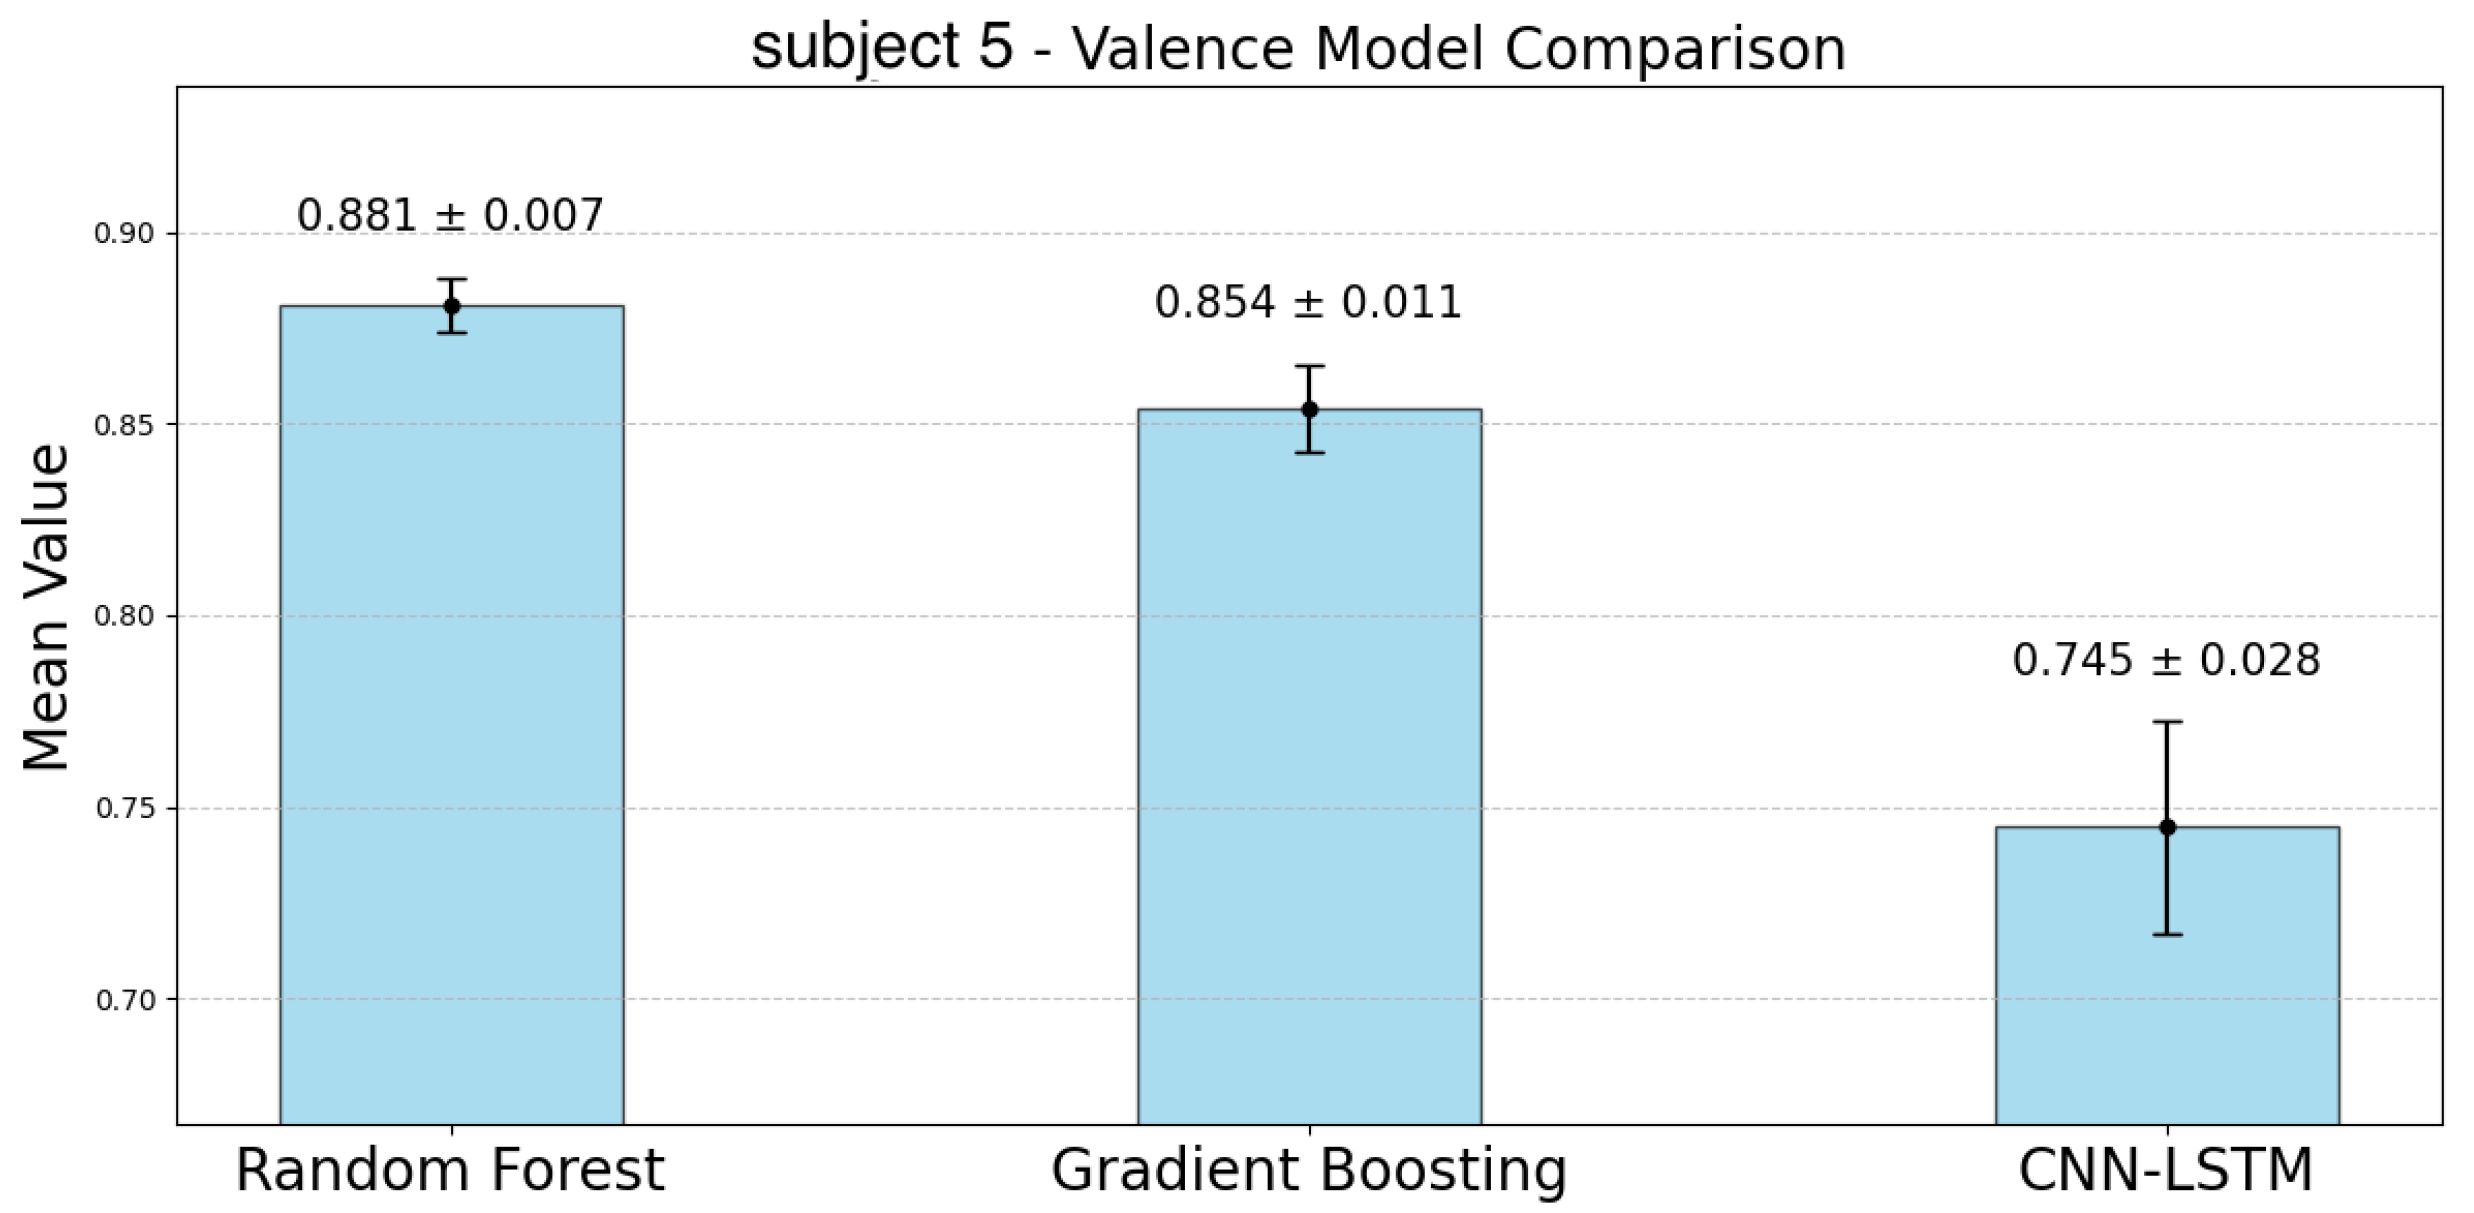
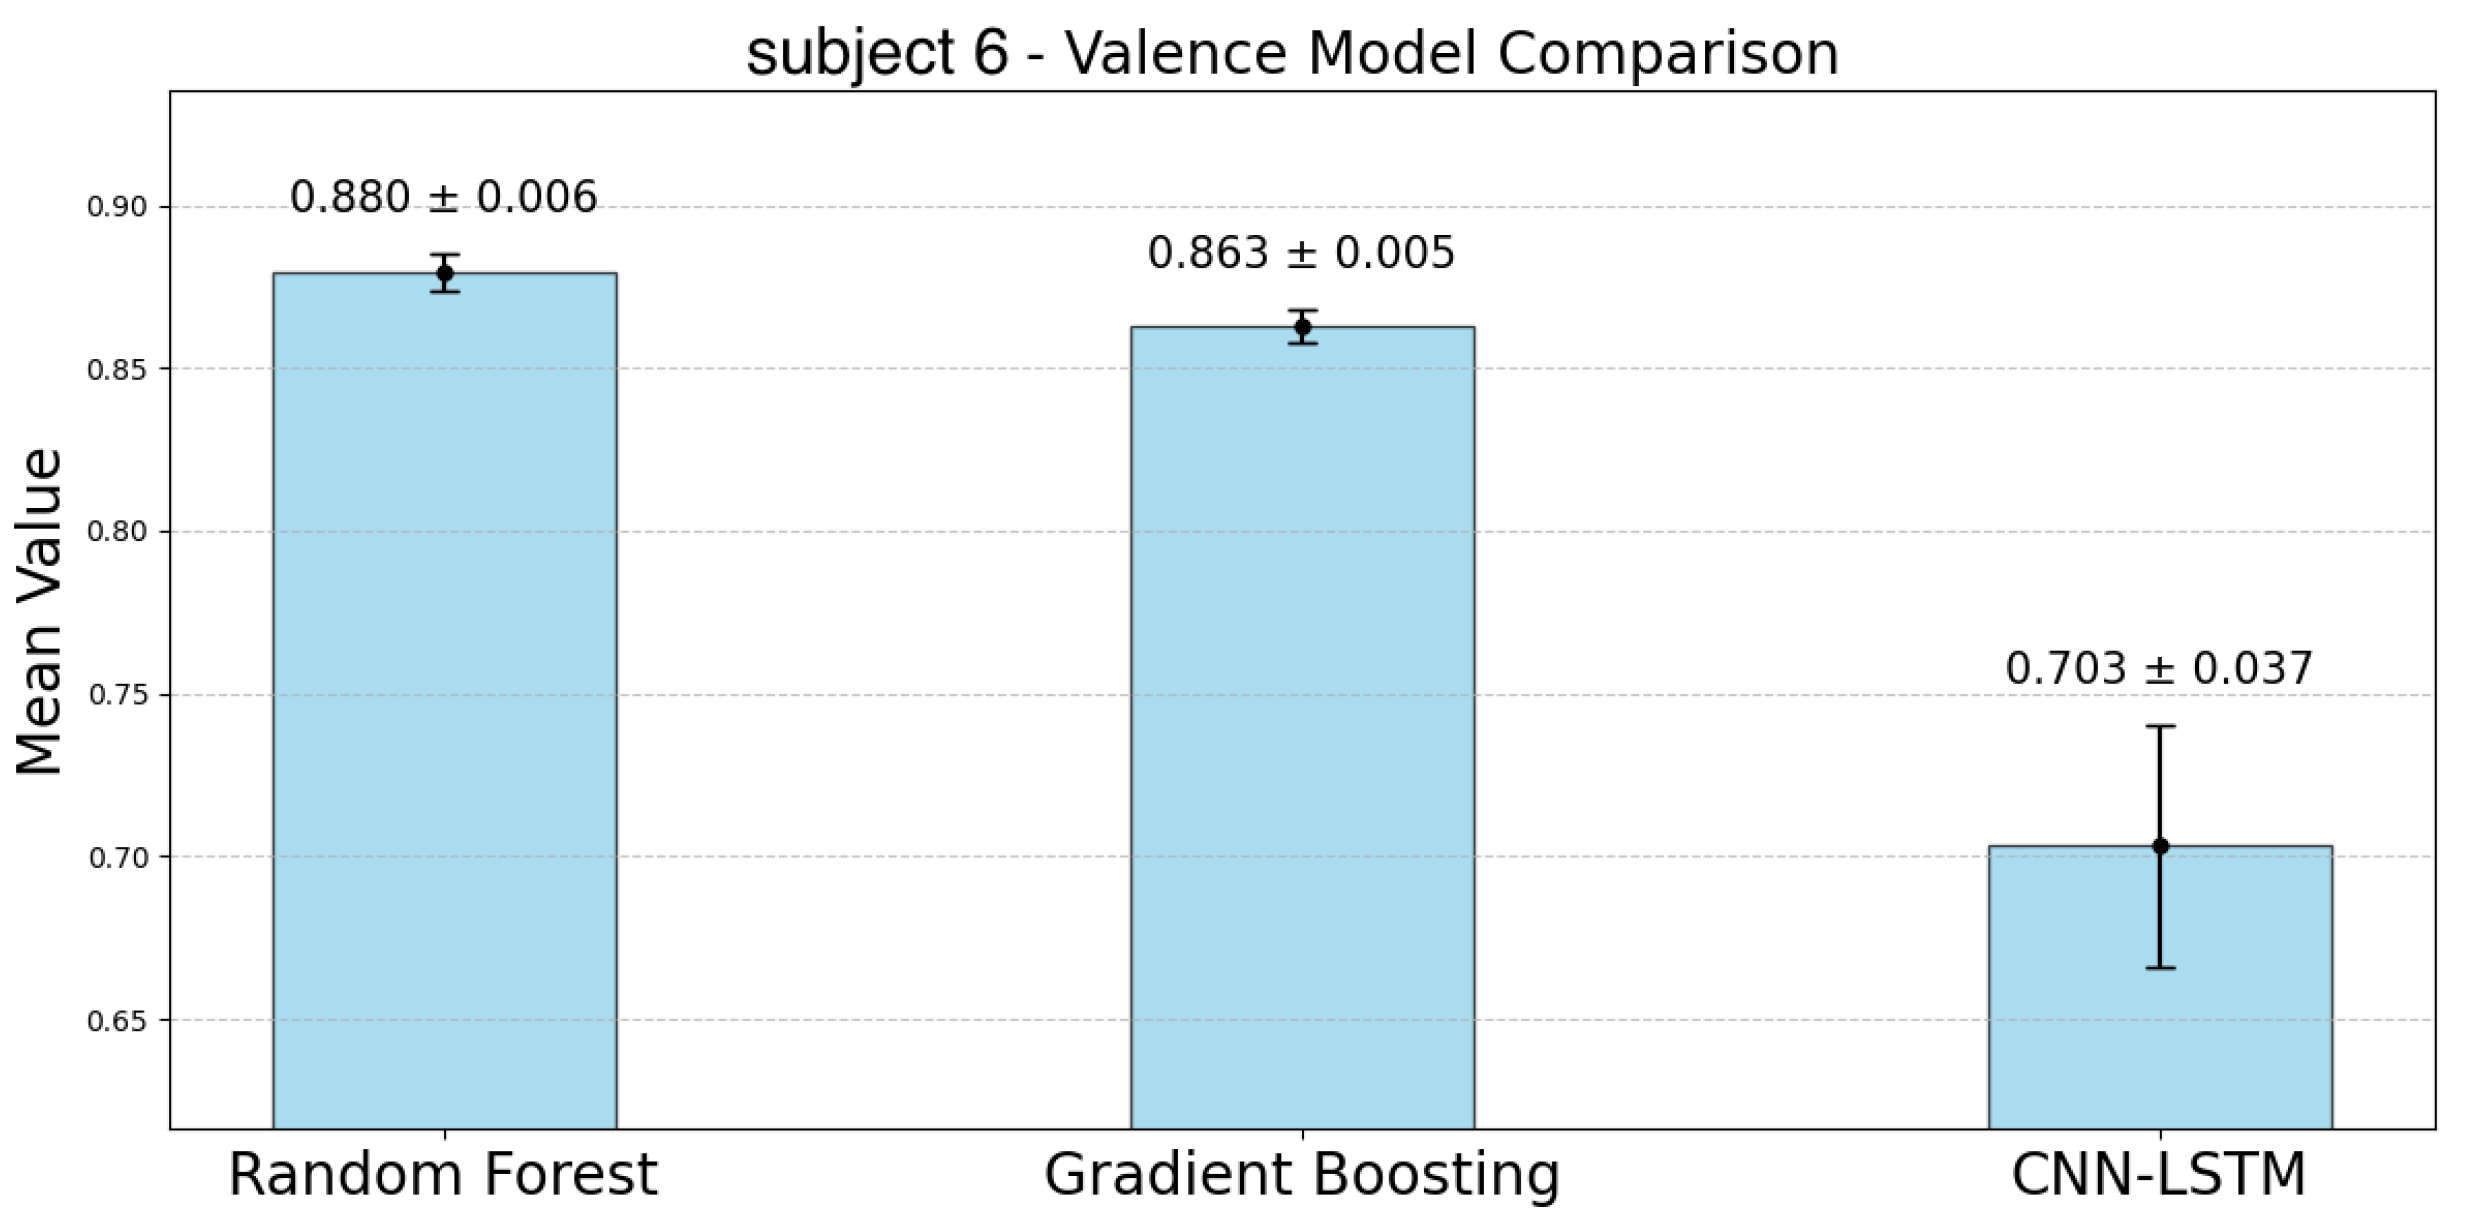
4.2. Results for Valence
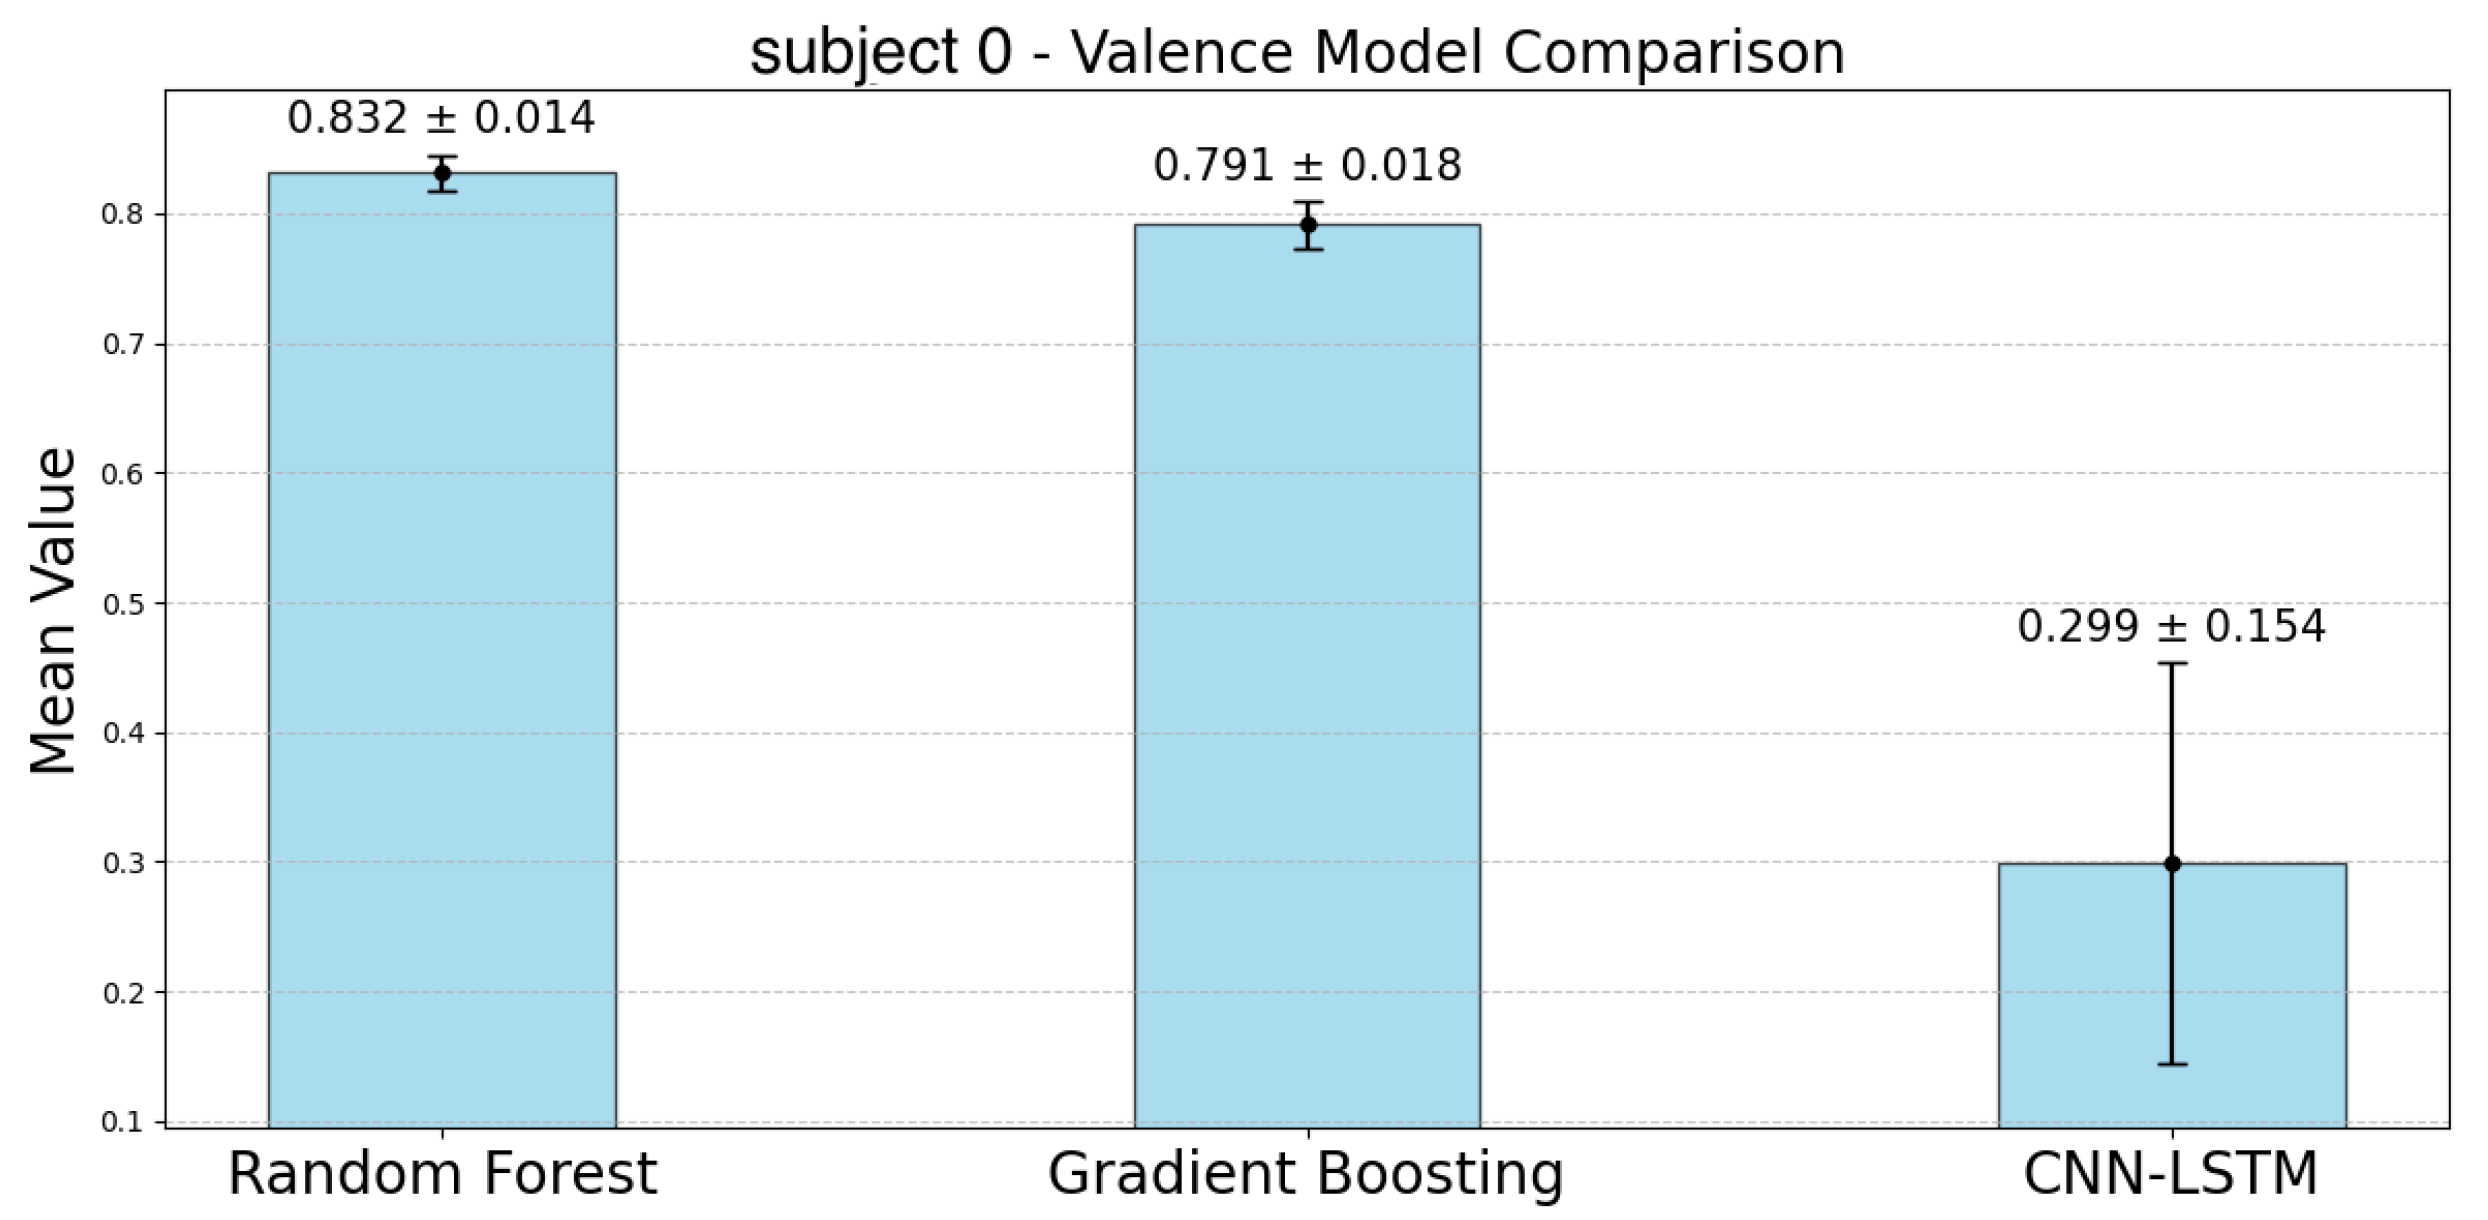
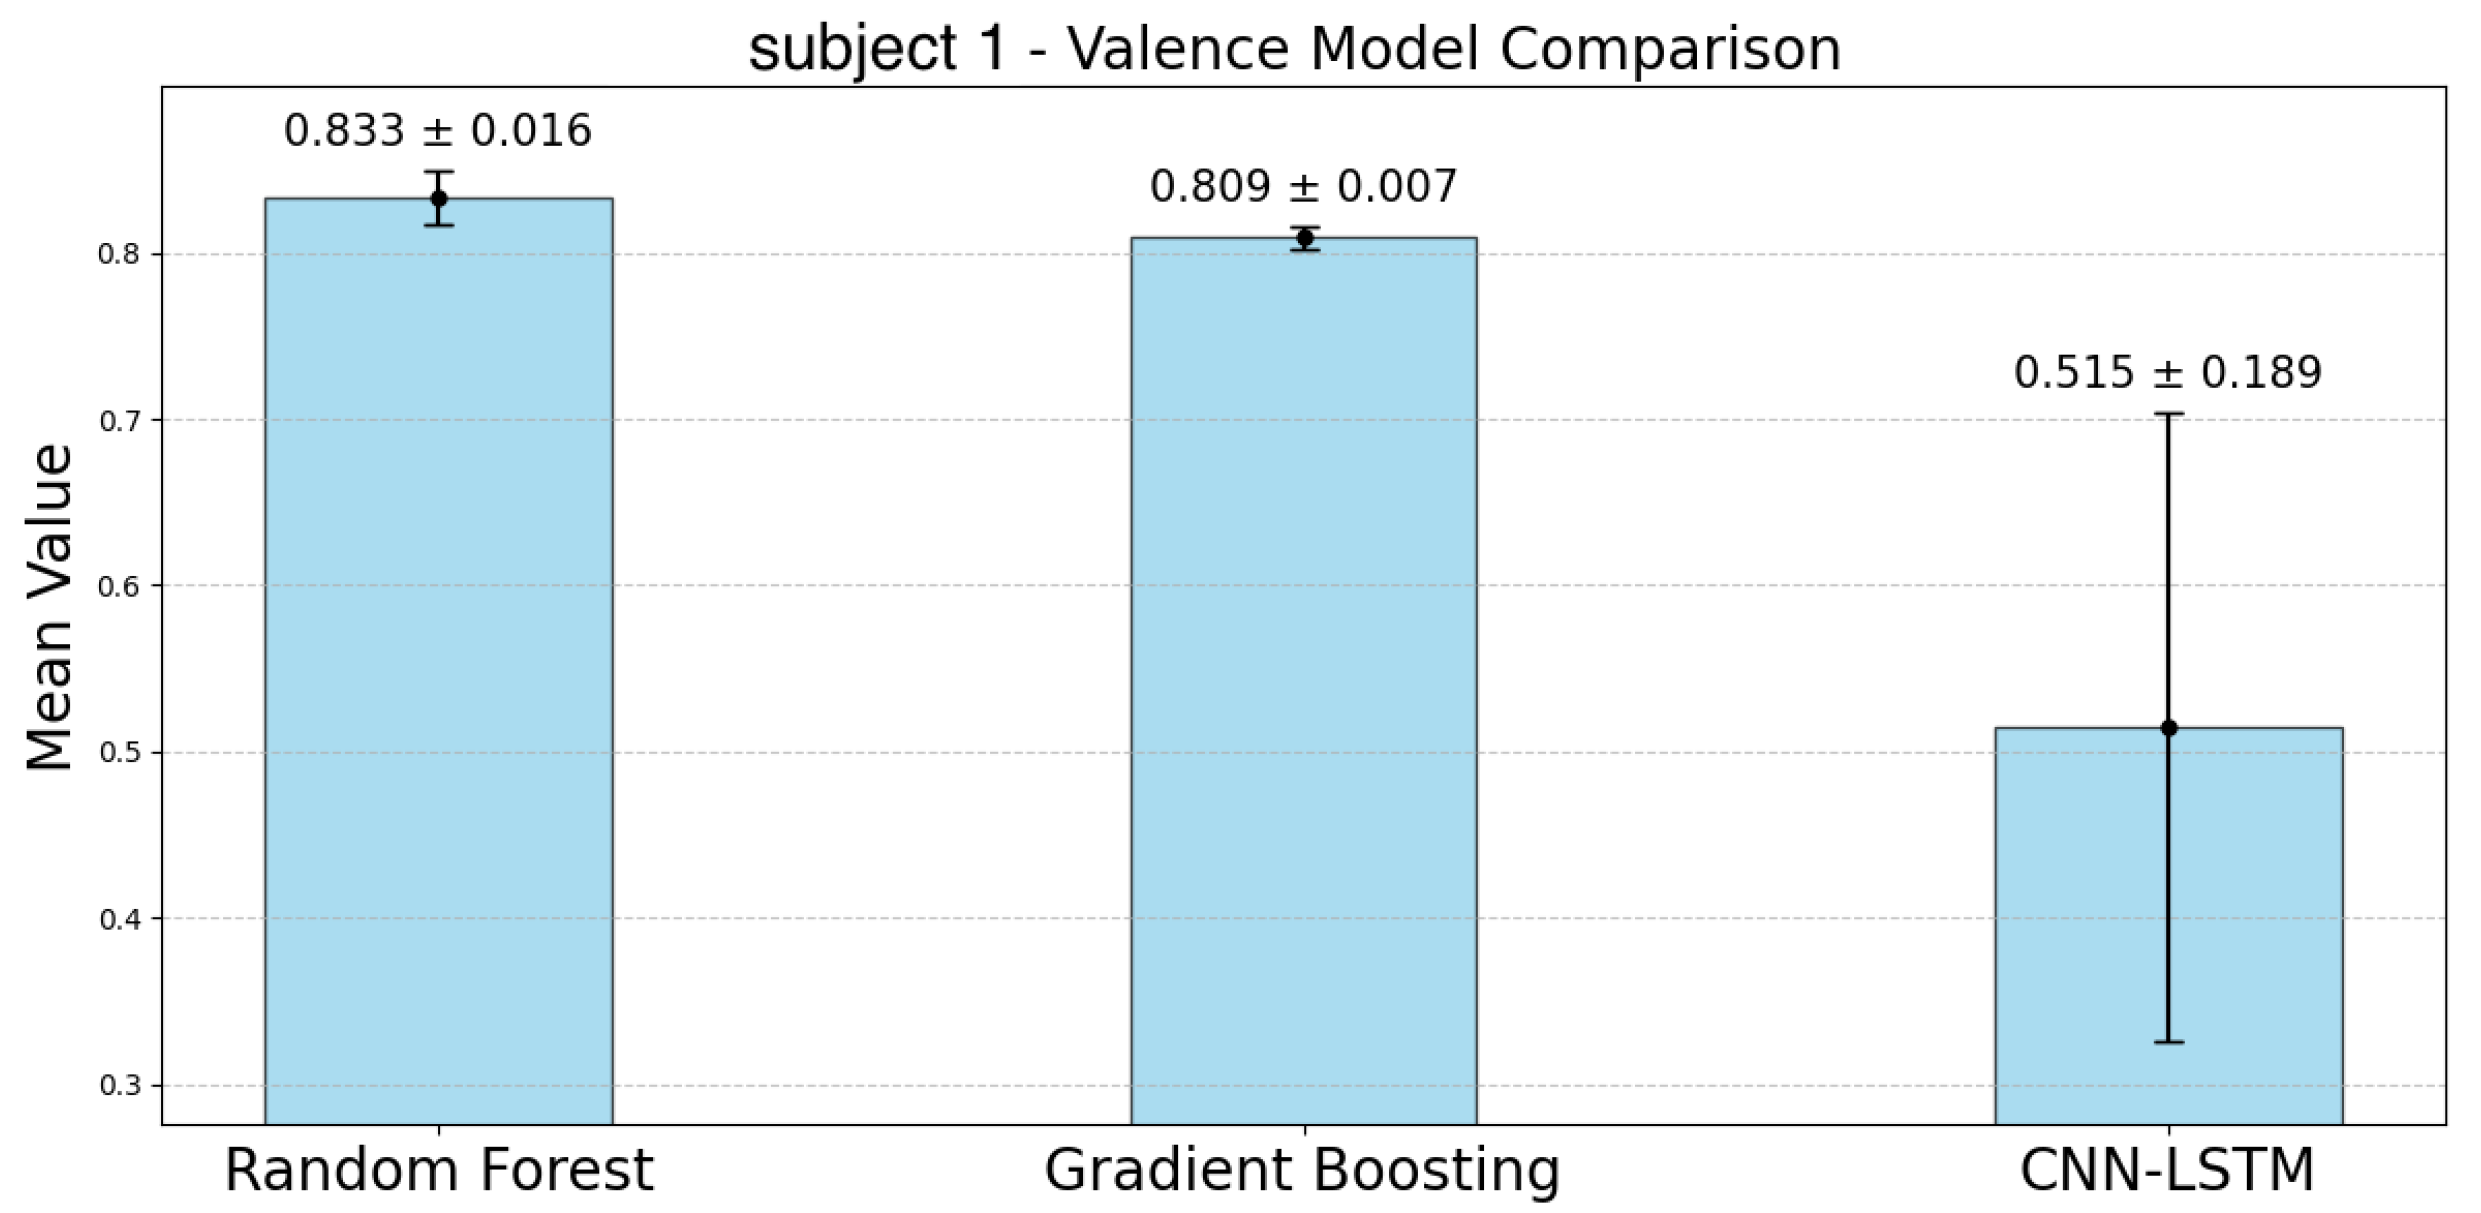
The following
Figure 11,
Figure 12,
Figure 13,
Figure 14,
Figure 15,
Figure 16 and
Figure 17 represent the accuracy of the valence estimation for each model across individual subjects. For valence prediction, the RF model consistently outperformed the other models, with subject 2 achieving the highest accuracy of 0.923, while subject 0 showed the lowest accuracy of 0.832. In comparison, the GBDT model showed slightly lower accuracy, with subject 2 reaching 0.912 and subject 0 0.791. The CNN-LSTM model struggled, particularly with subject 0, where the accuracy was as low as 0.299, while subject 5 achieved 0.745. Regarding CIs, the RF model exhibited narrower ranges than the GBDT model for participants 0, 2, 4, and 6. Similar to the case of arousal, the CNN-LSTM model showed the lowest accuracy and the largest CIs, indicating greater variability.
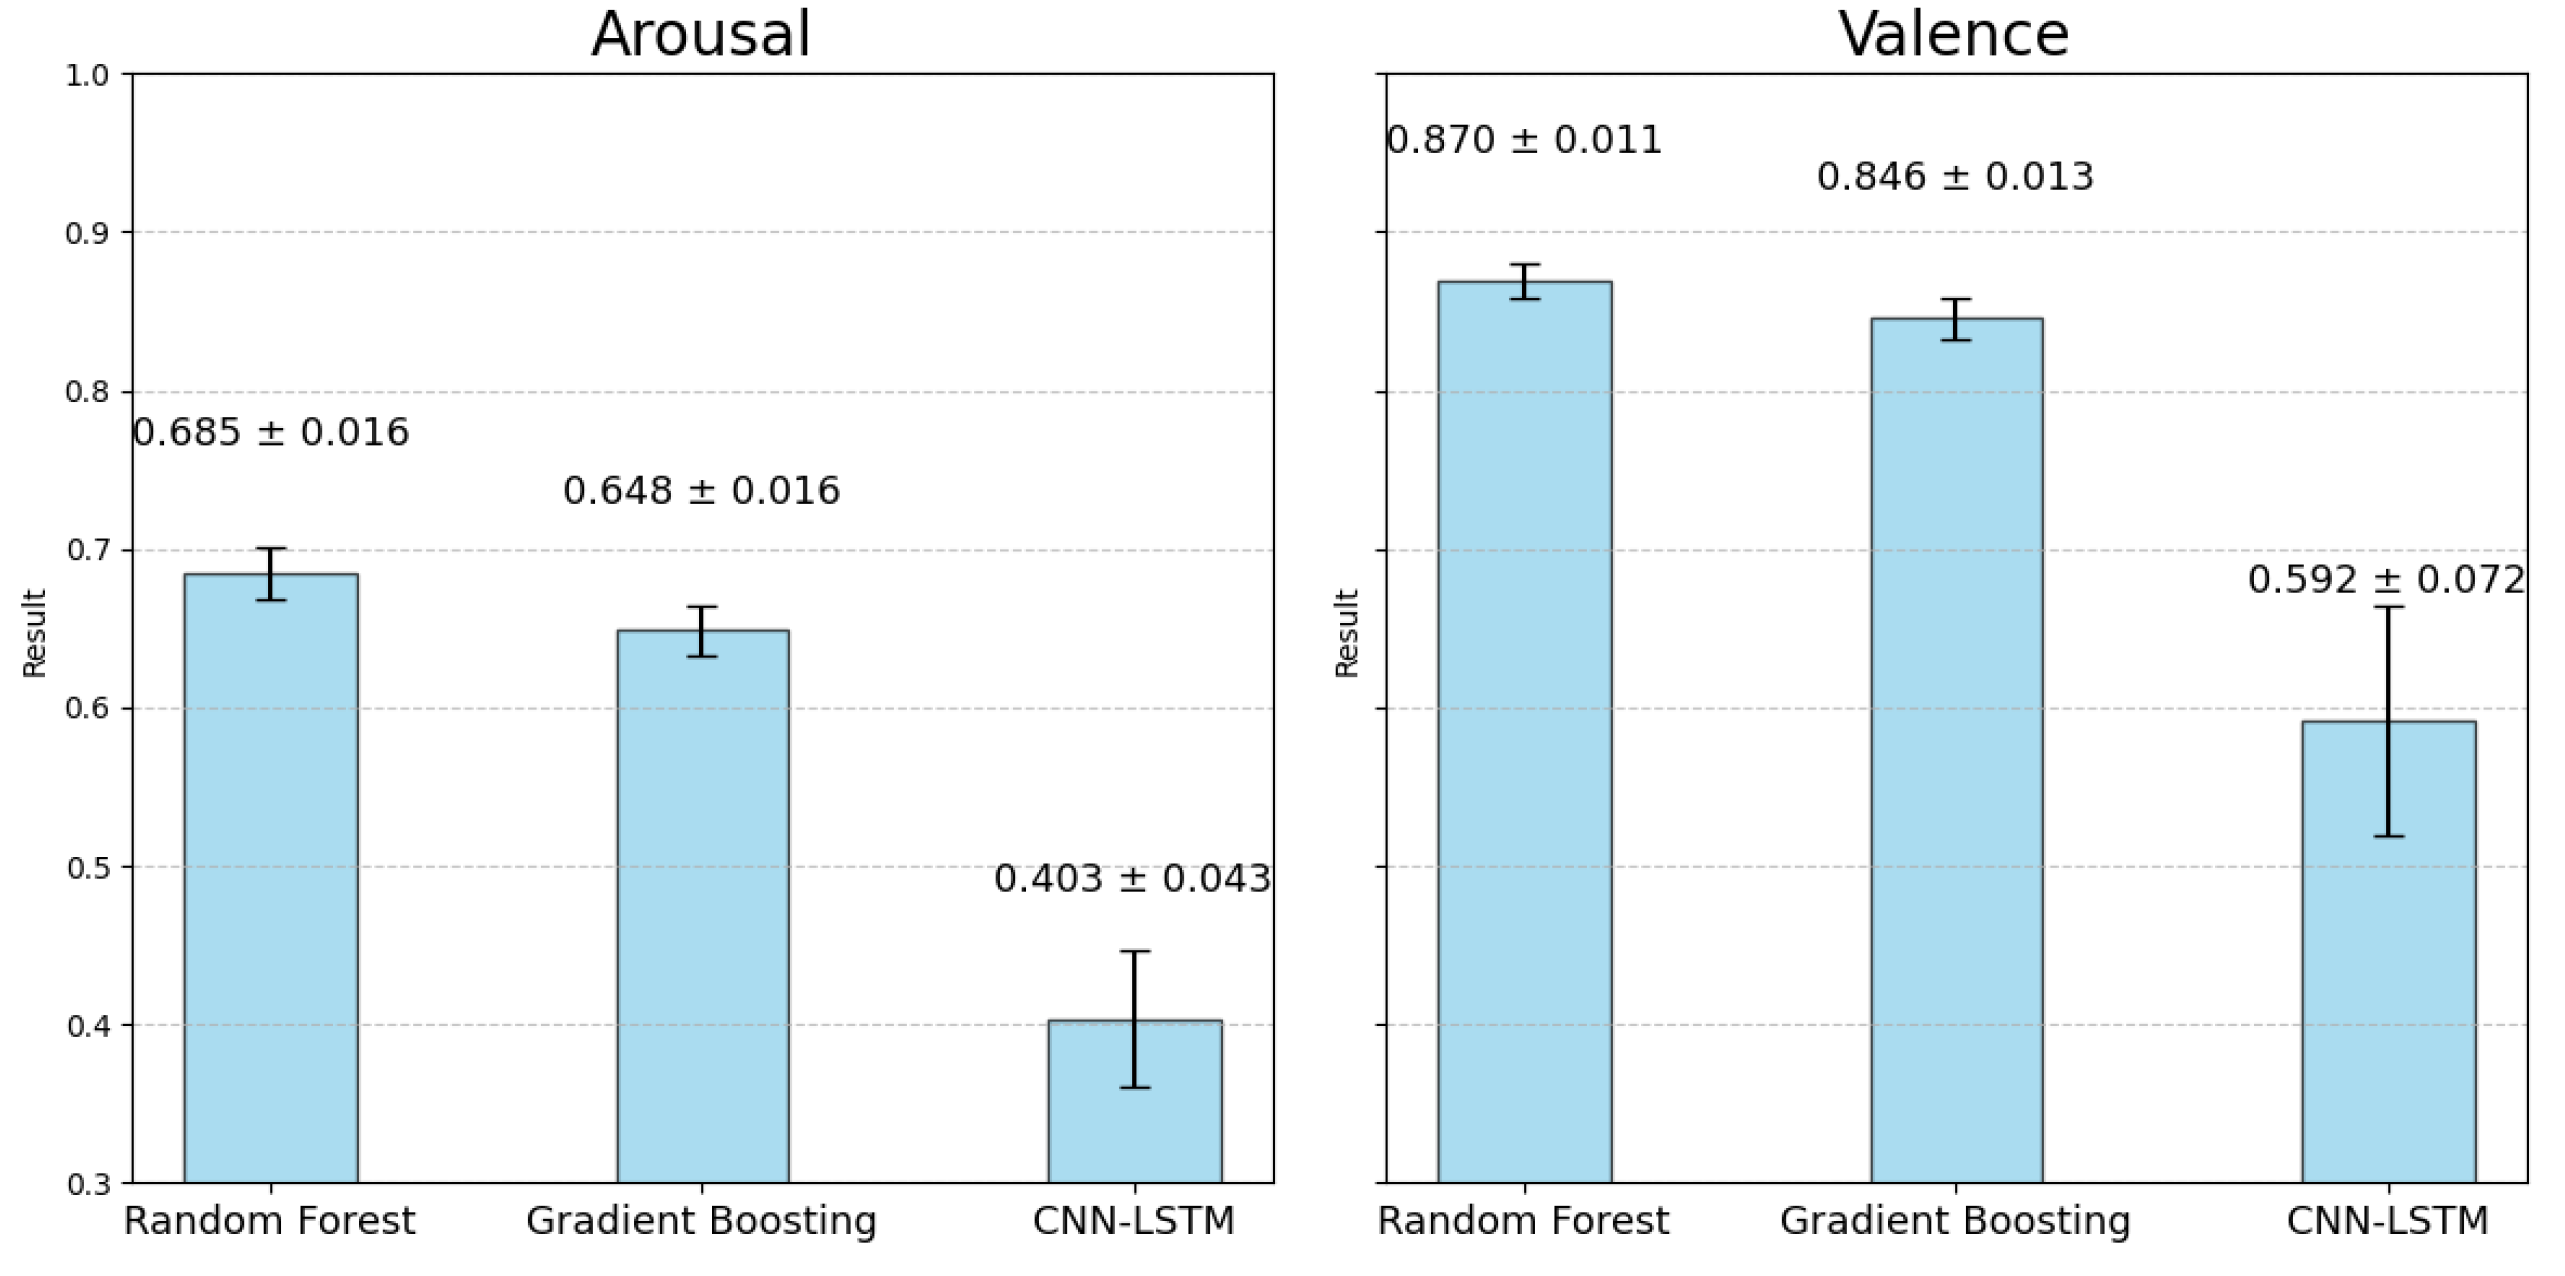
4.3. Model Comperison
Figure 18 shows each model’s average estimation results and 95% CIs calculated across all subjects. The results of the experiment confirmed a certain level of accuracy in estimating emotional valence, with the highest accuracy achieved by the RF model (RF valence estimation accuracy: mean: 0.870, 95% CI: [0.859, 0.880]). Although the GBDT model was less accurate than the RF model, it demonstrated potential for emotion estimation (GBDT valence estimation accuracy: mean: 0.846, 95% CI: [0.833, 0.859]). The CNN-LSTM model, which was expected to improve accuracy by capturing temporal information, showed a significant drop in accuracy and variability compared to the other two models (CNN-LSTM arousal estimation accuracy: mean: 0.403, 95% CI: [0.360, 0.446], valence estimation accuracy: mean: 0.592, 95% CI: [0.520, 0.664]). Regarding the CIs, no significant differences were observed between the RF model and the GBDT model when averaging the accuracy across all seven subjects, as both models exhibited similar CI sizes. For arousal estimation, accuracy was generally lower across all models compared to valence estimation. The RF model again outperformed the others (Mean: 0.685, 95% CI: [0.669, 0.701]), with GBDT showing slightly lower accuracy (Mean: 0.648, 95% CI: [0.632, 0.665]). These results suggest that environmental data-based emotion estimation is effective for both Valence and Arousal. While the RF model and the GBDT model demonstrated higher accuracy in this experiment, the CNN-LSTM model, which captures temporal patterns, showed lower accuracy and higher variability. This suggests that, despite its potential, the CNN-LSTM model requires further refinement. In the next section, we will analyze the training convergence curves to identify potential areas for improvement.
4.4. Training Convergence
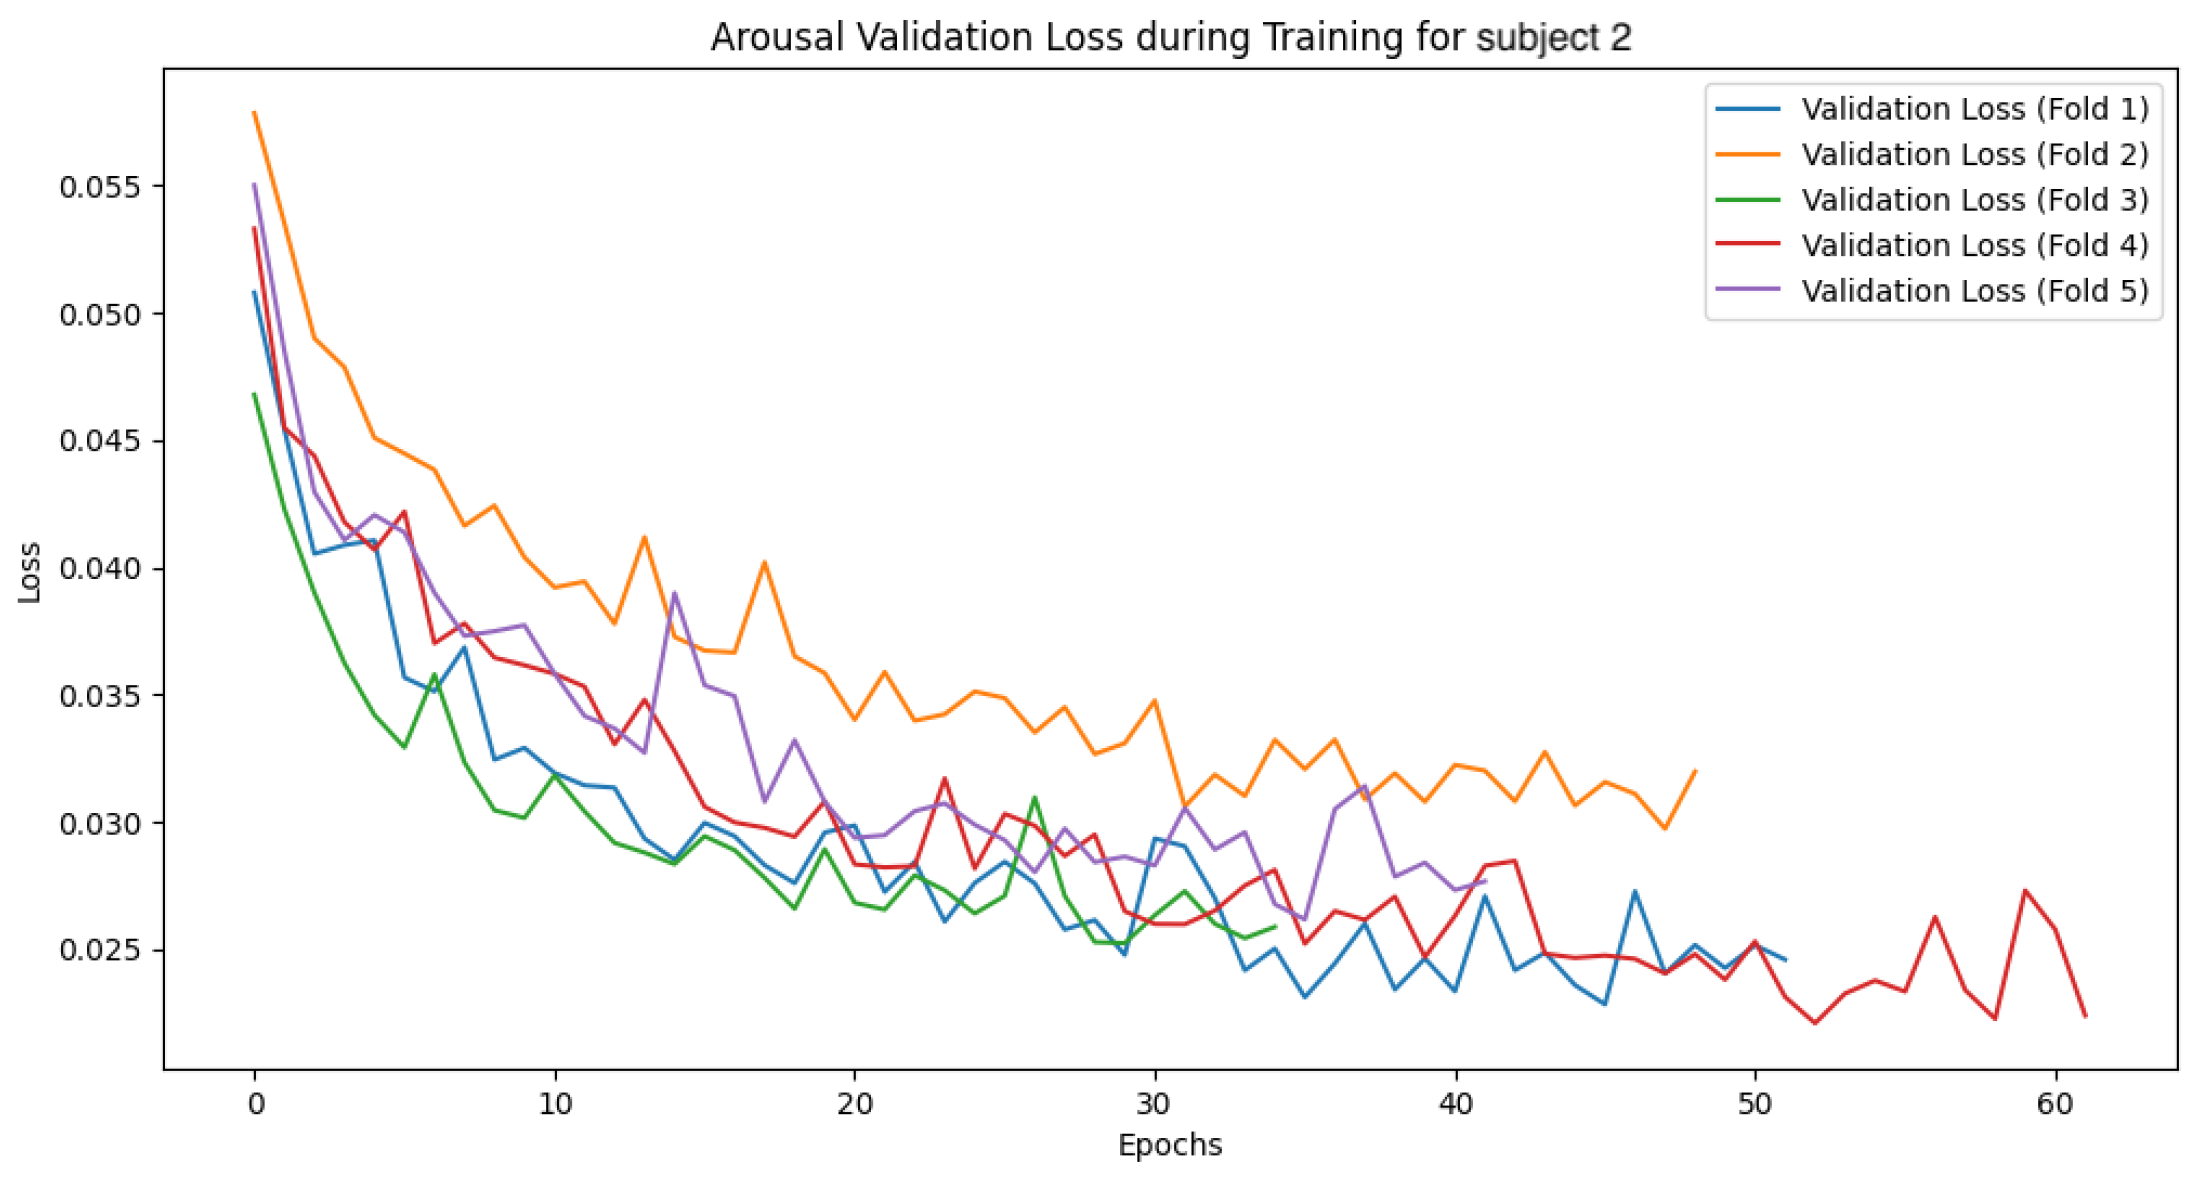
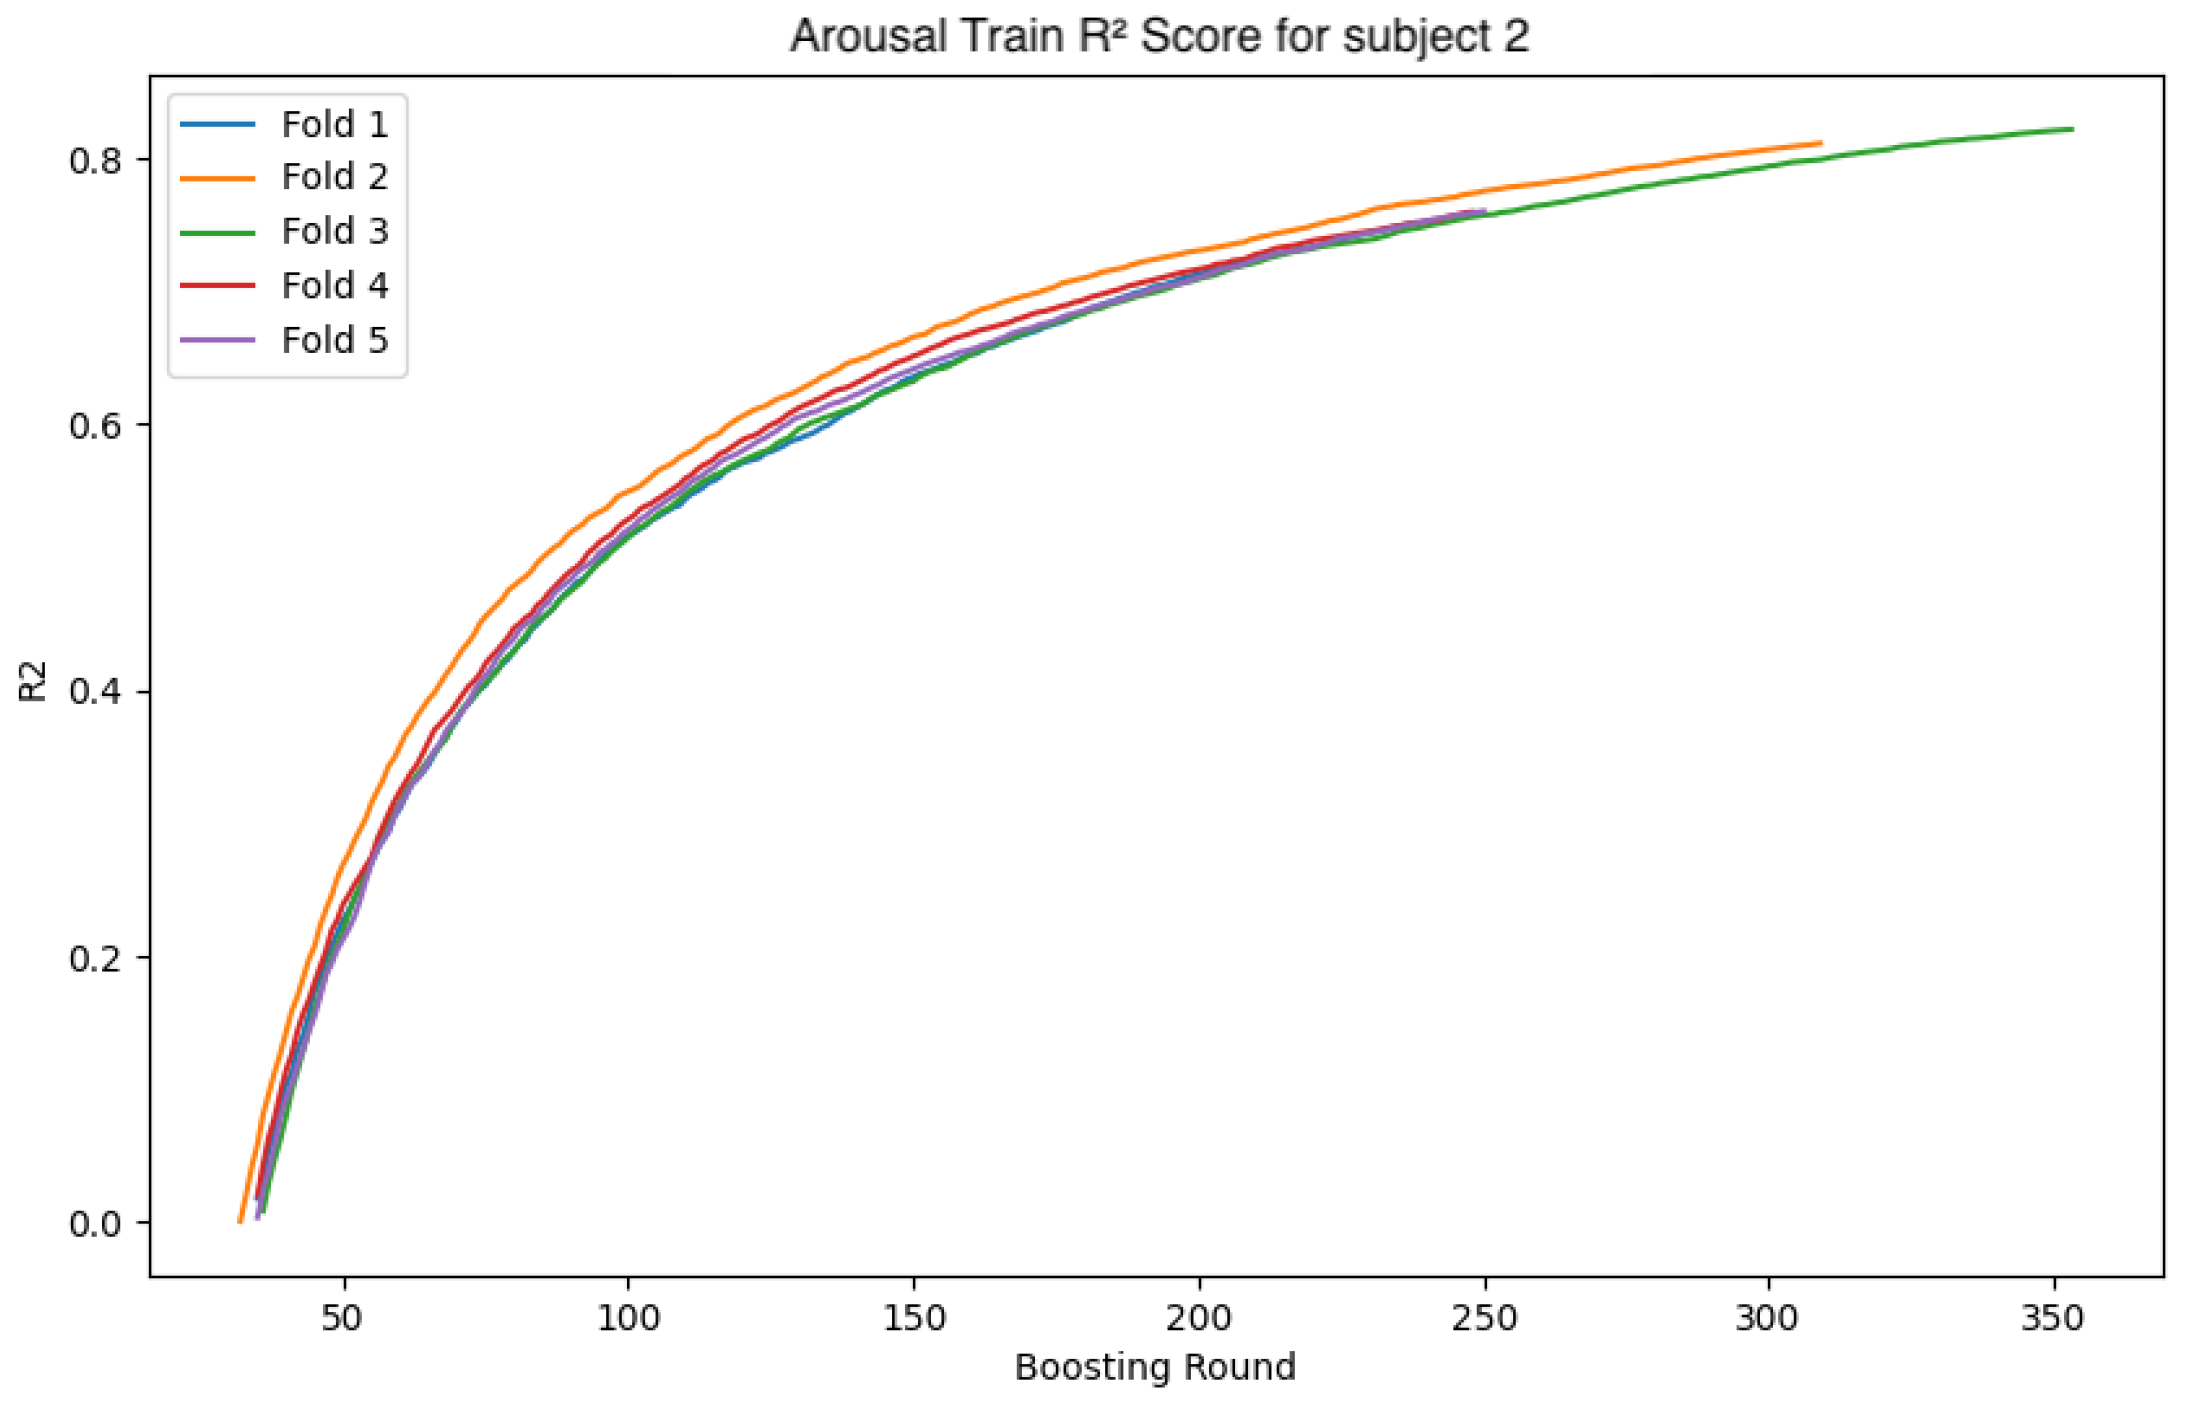
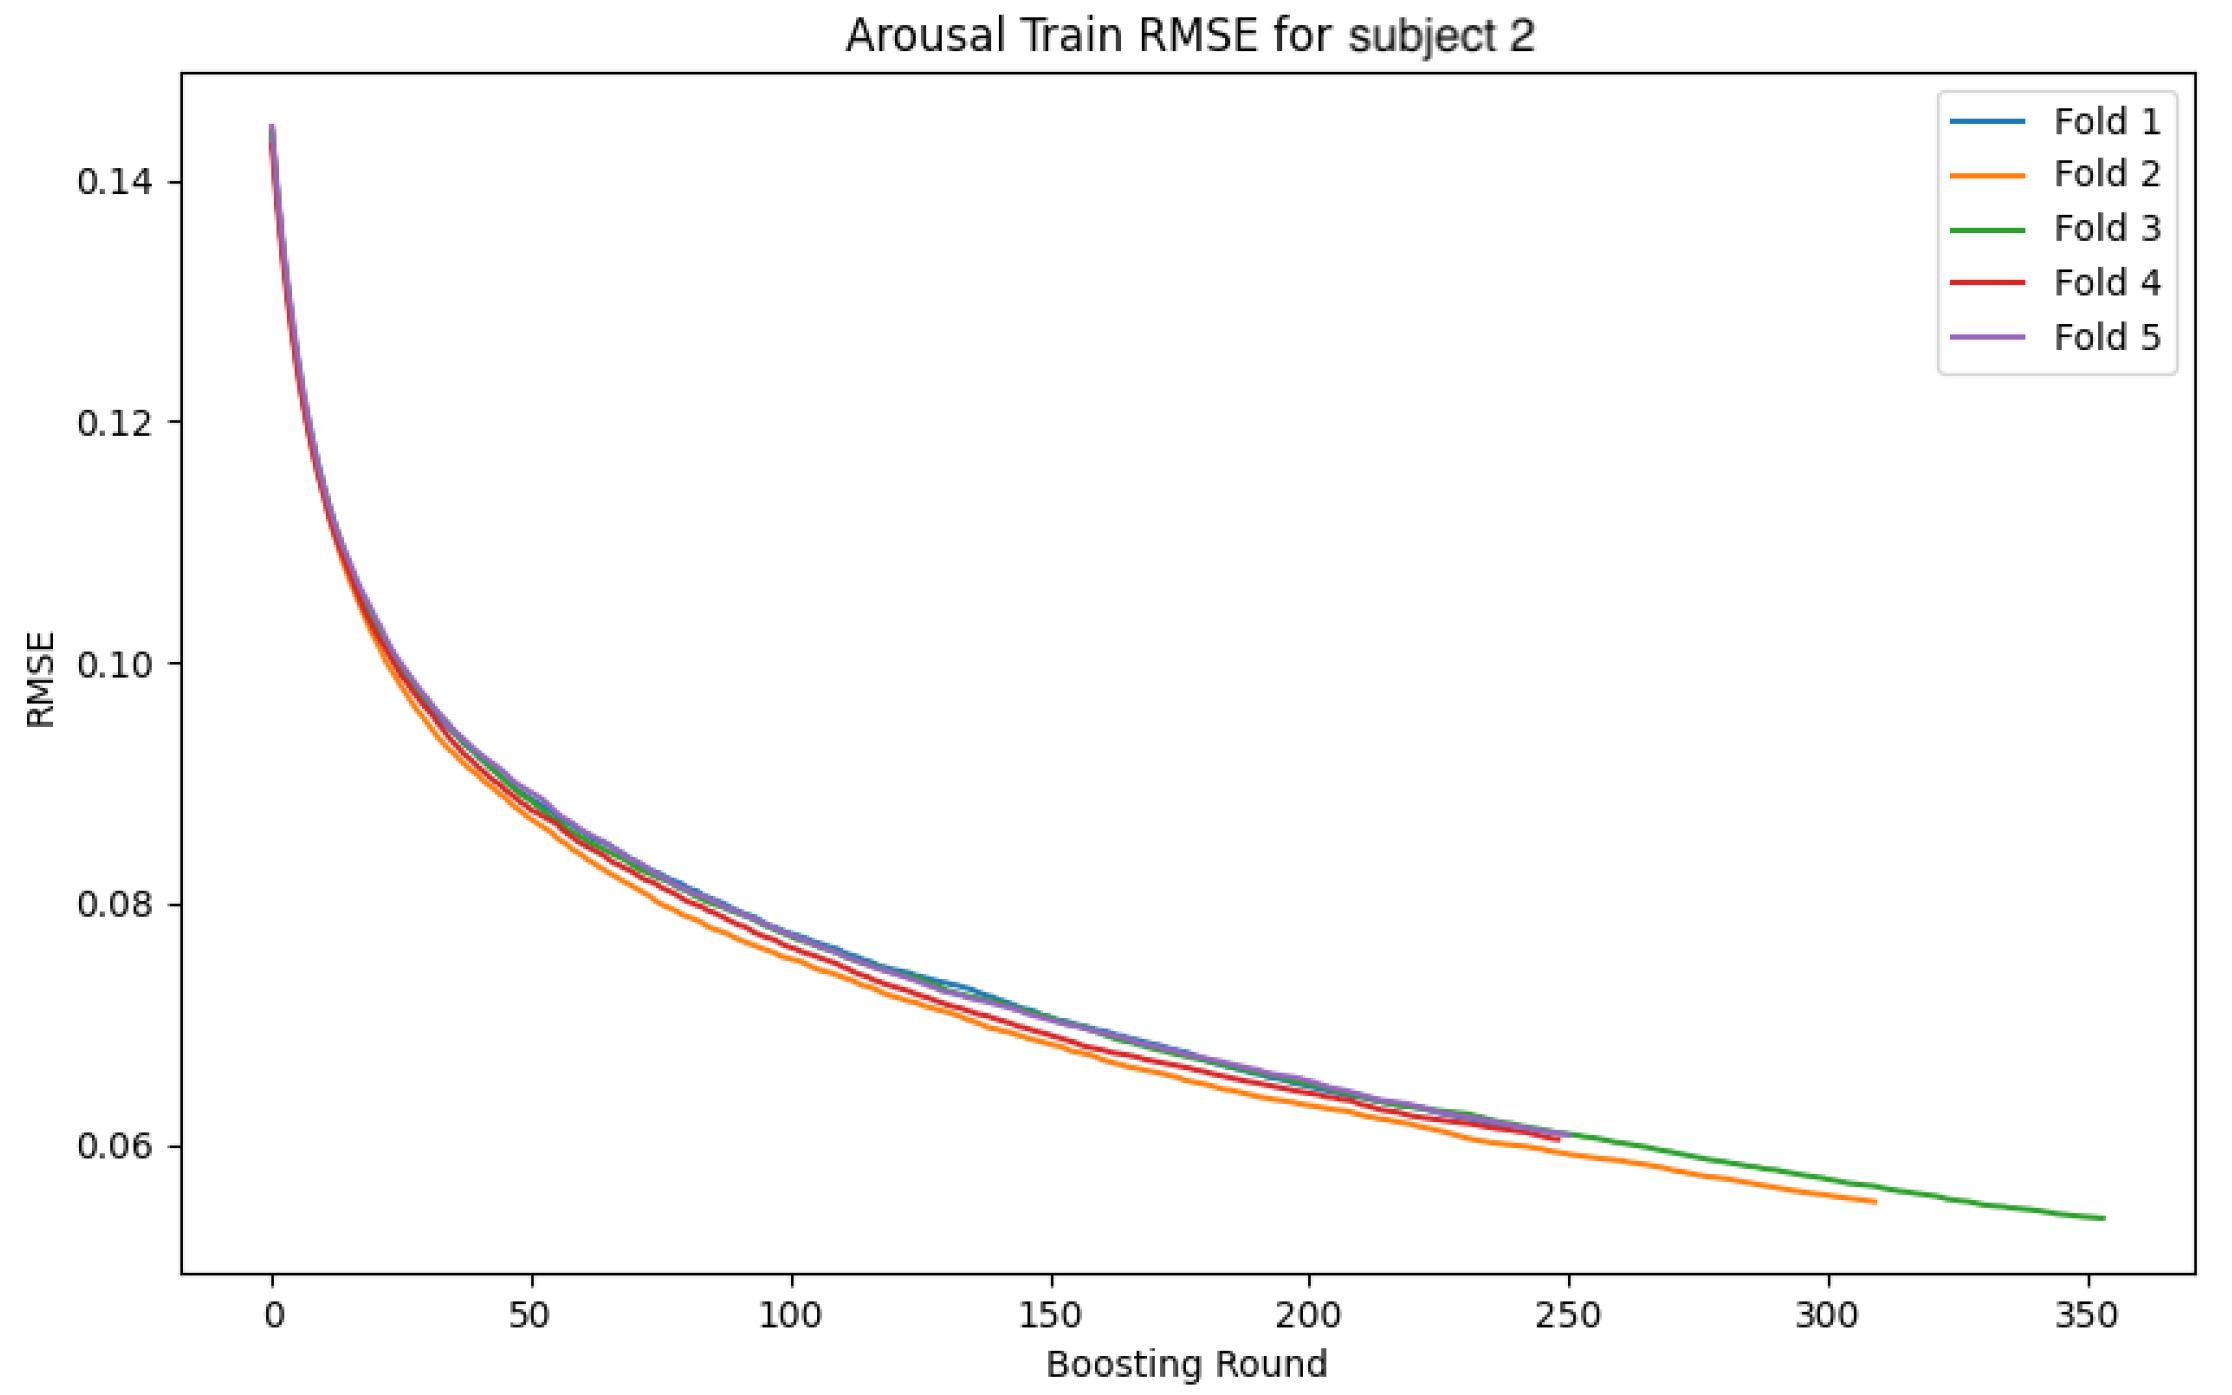
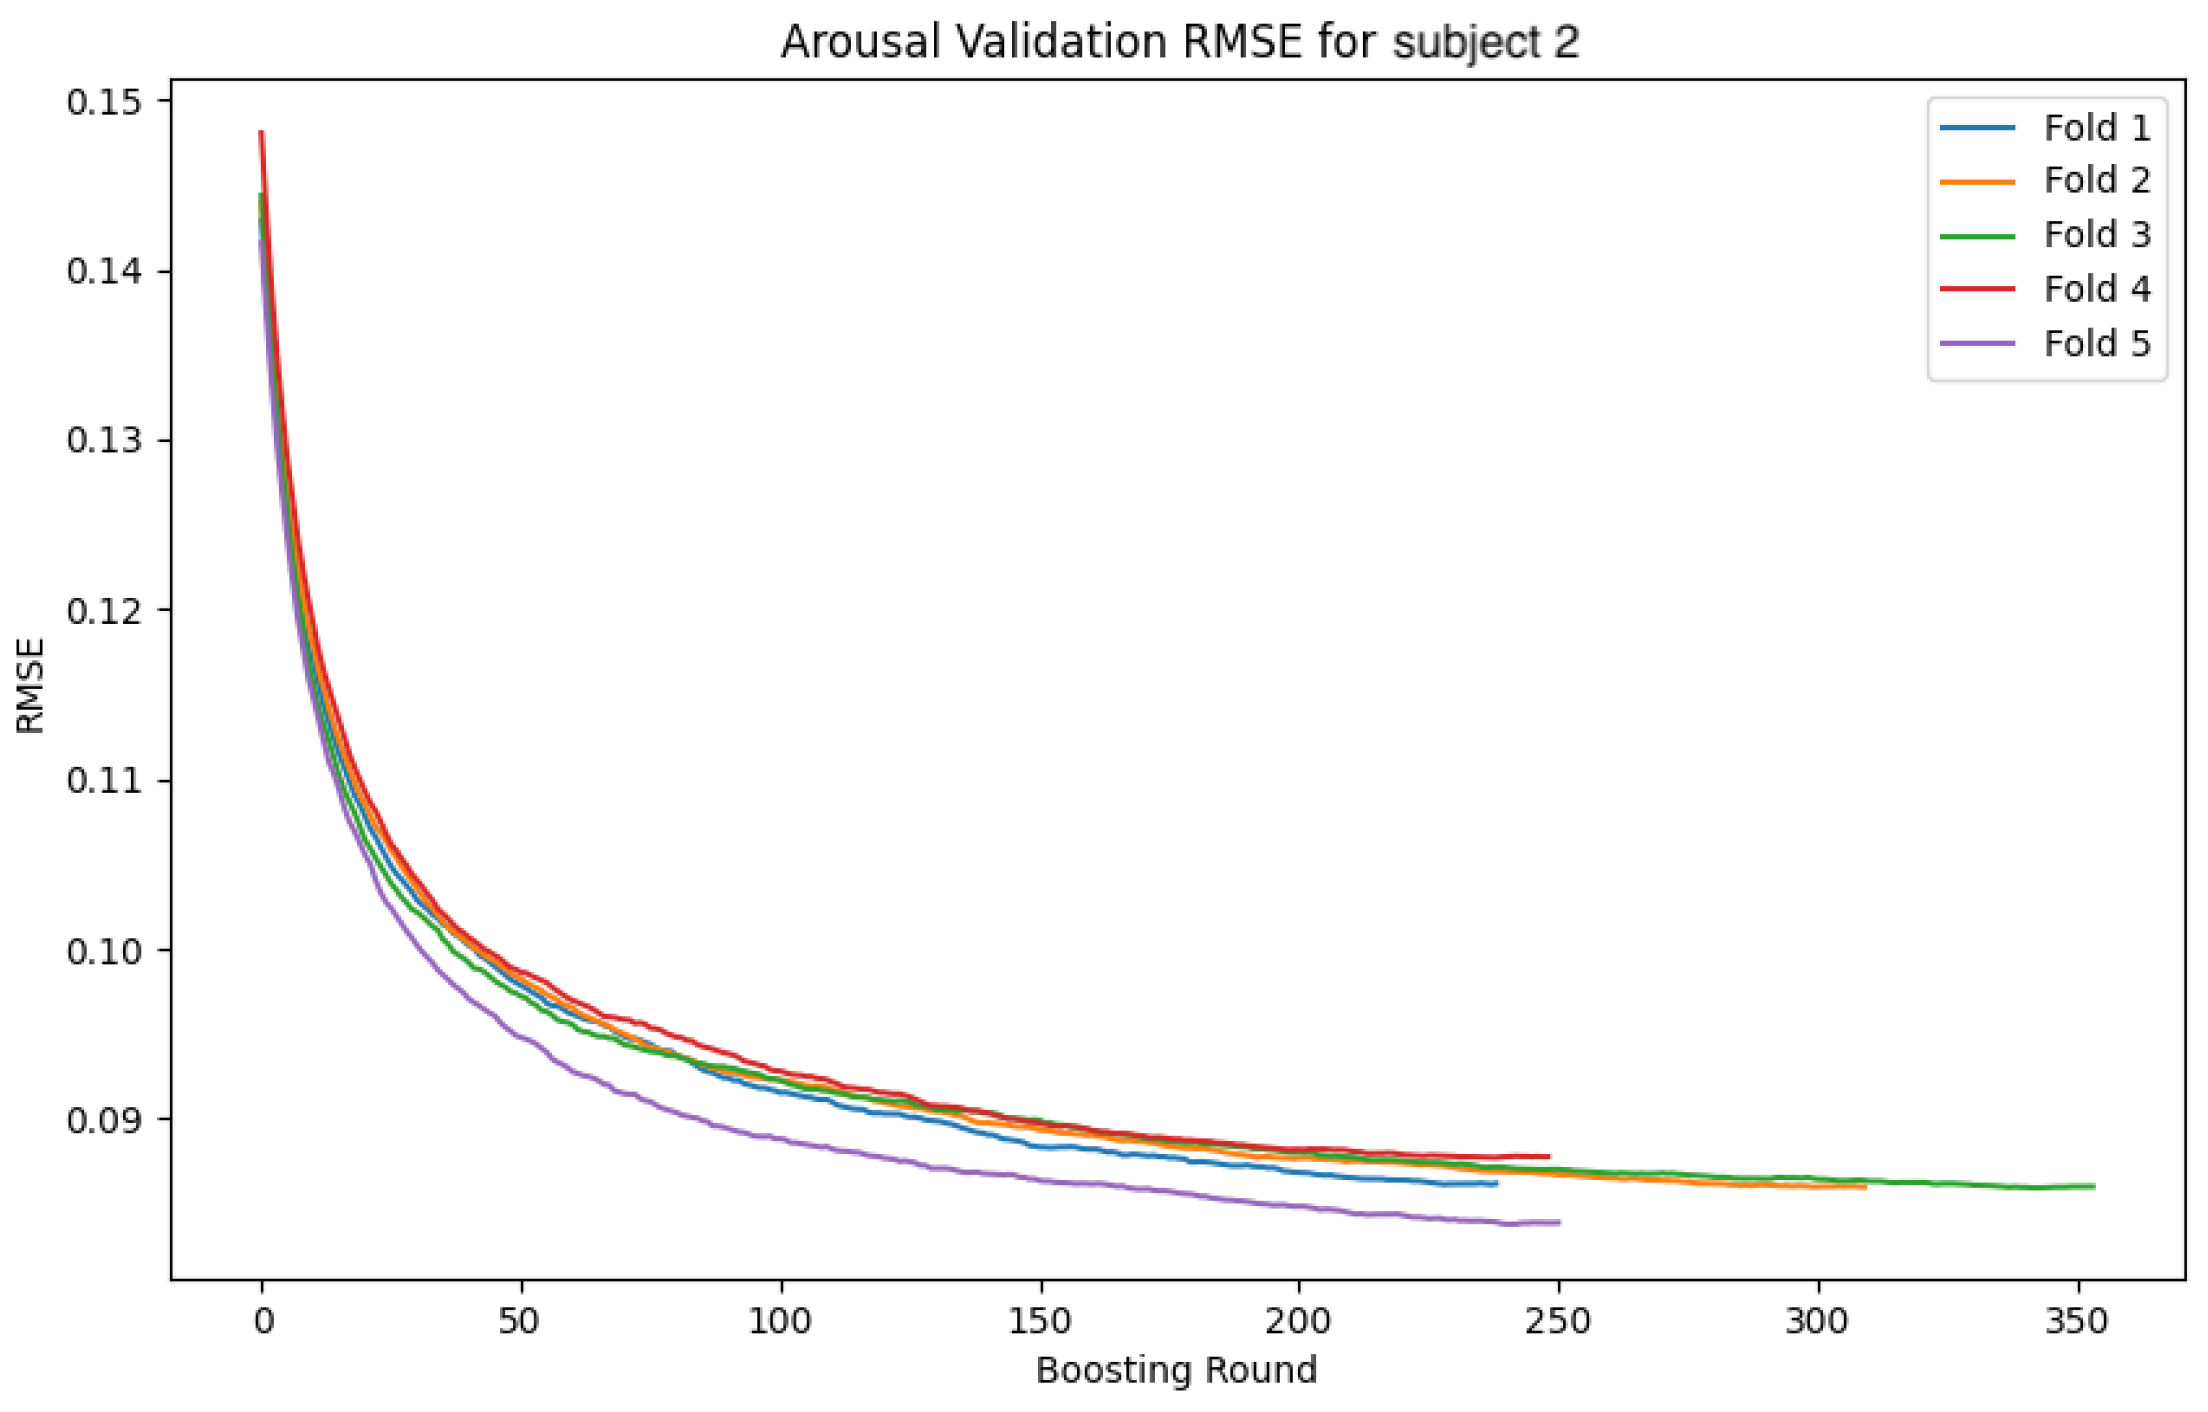
In this section, we analyze the models by presenting the convergence curves of the loss function and accuracy during the training of the GBDT model and the CNN-LSTM model for two subjects. The values are calculated separately for the training and validation data. The subjects were selected based on distinctive characteristics in their data, serving as representative examples. The overall trend observed during the GBDT model’s training was relatively stable across all folds. Although some variability was noted in the validation data, this is considered to be due to differences in data distribution and sampling. In contrast, the CNN-LSTM model’s training exhibited more complex behaviors, necessitating a deeper analysis of the model’s behavior and performance. In the following sections, we focus on the CNN-LSTM model and examine the convergence curves of the loss function and accuracy for both the training and validation datasets.
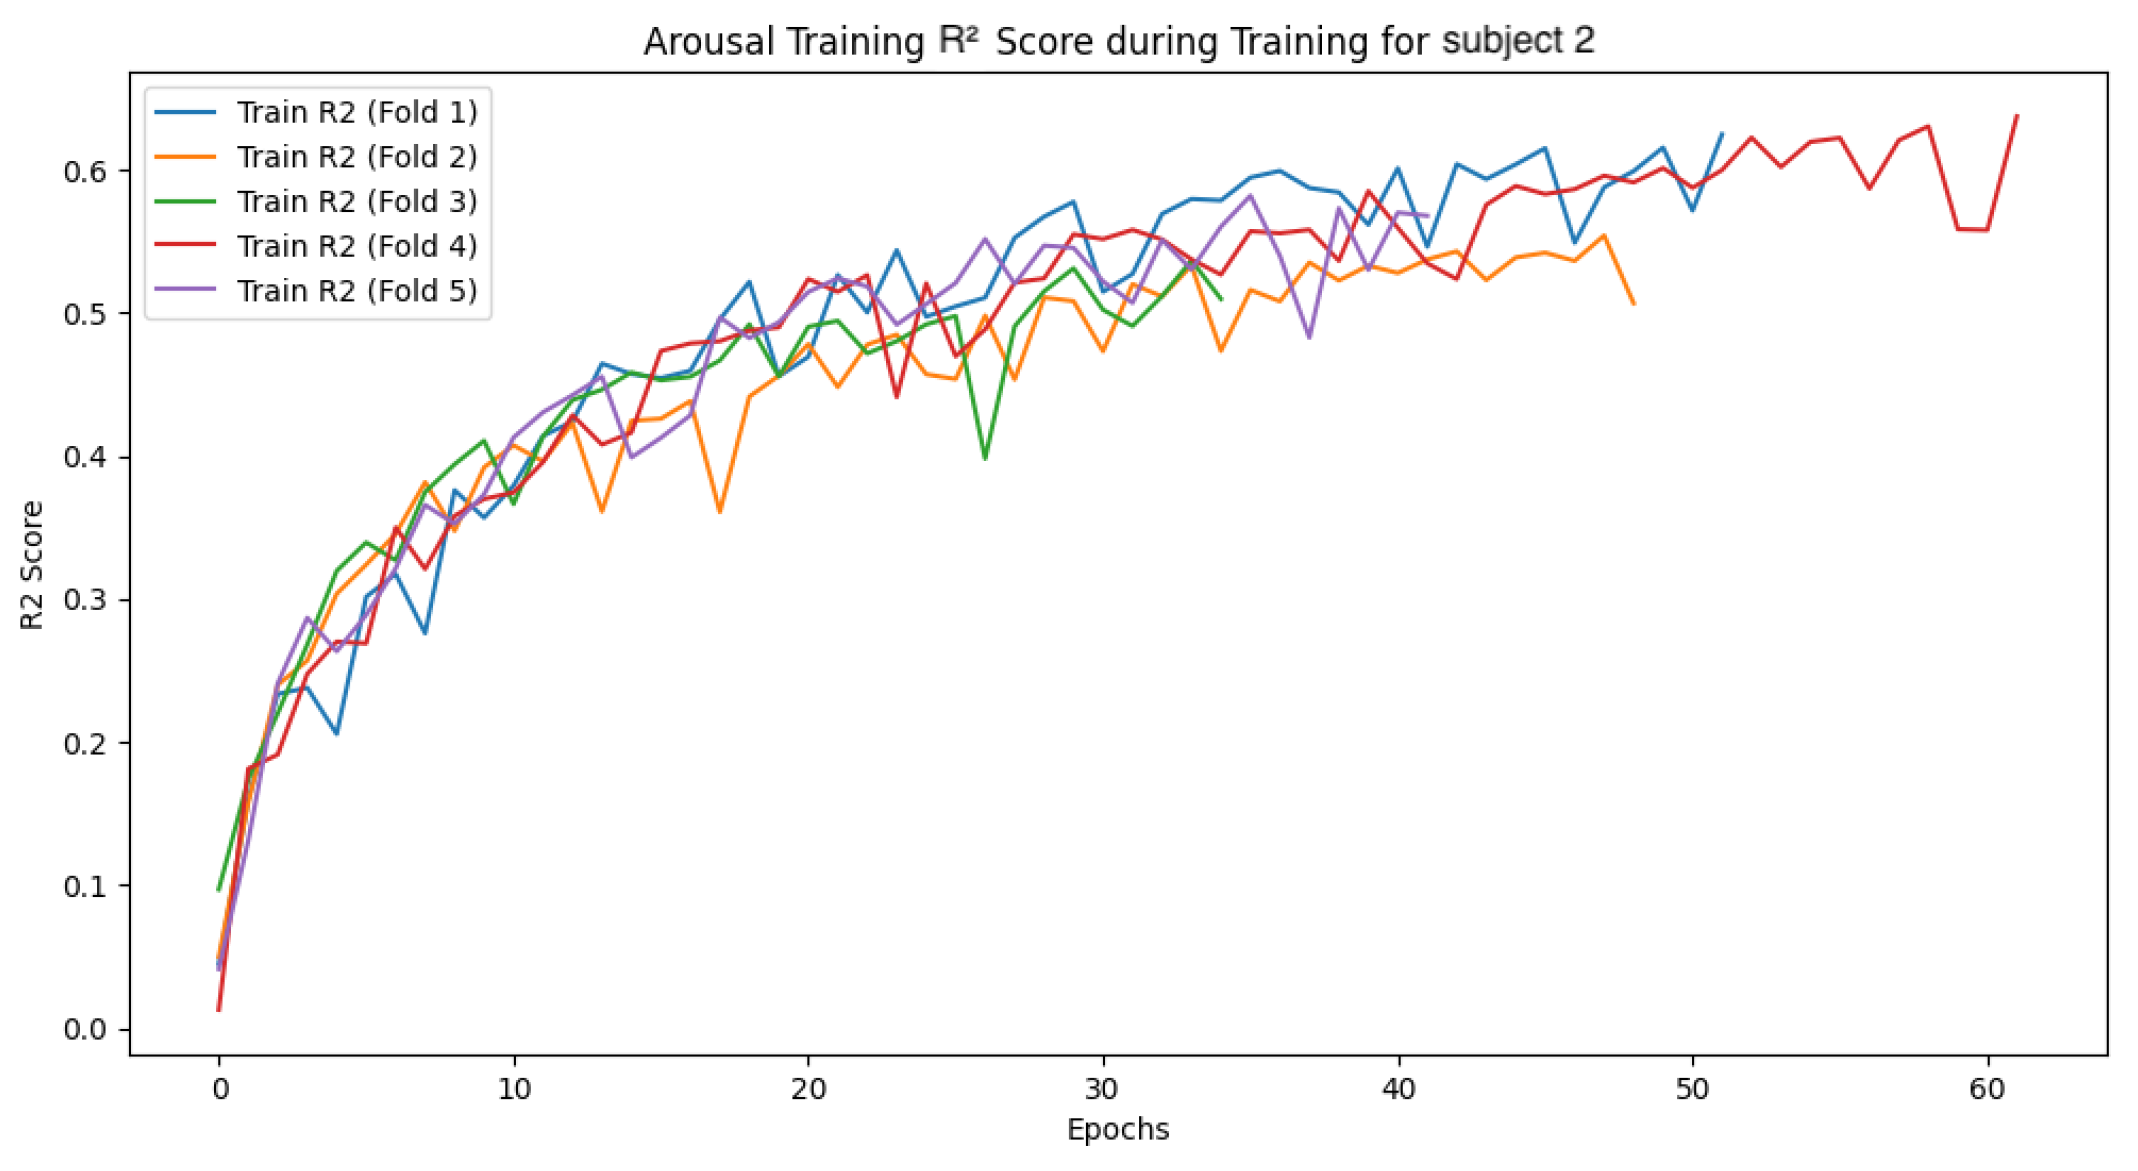
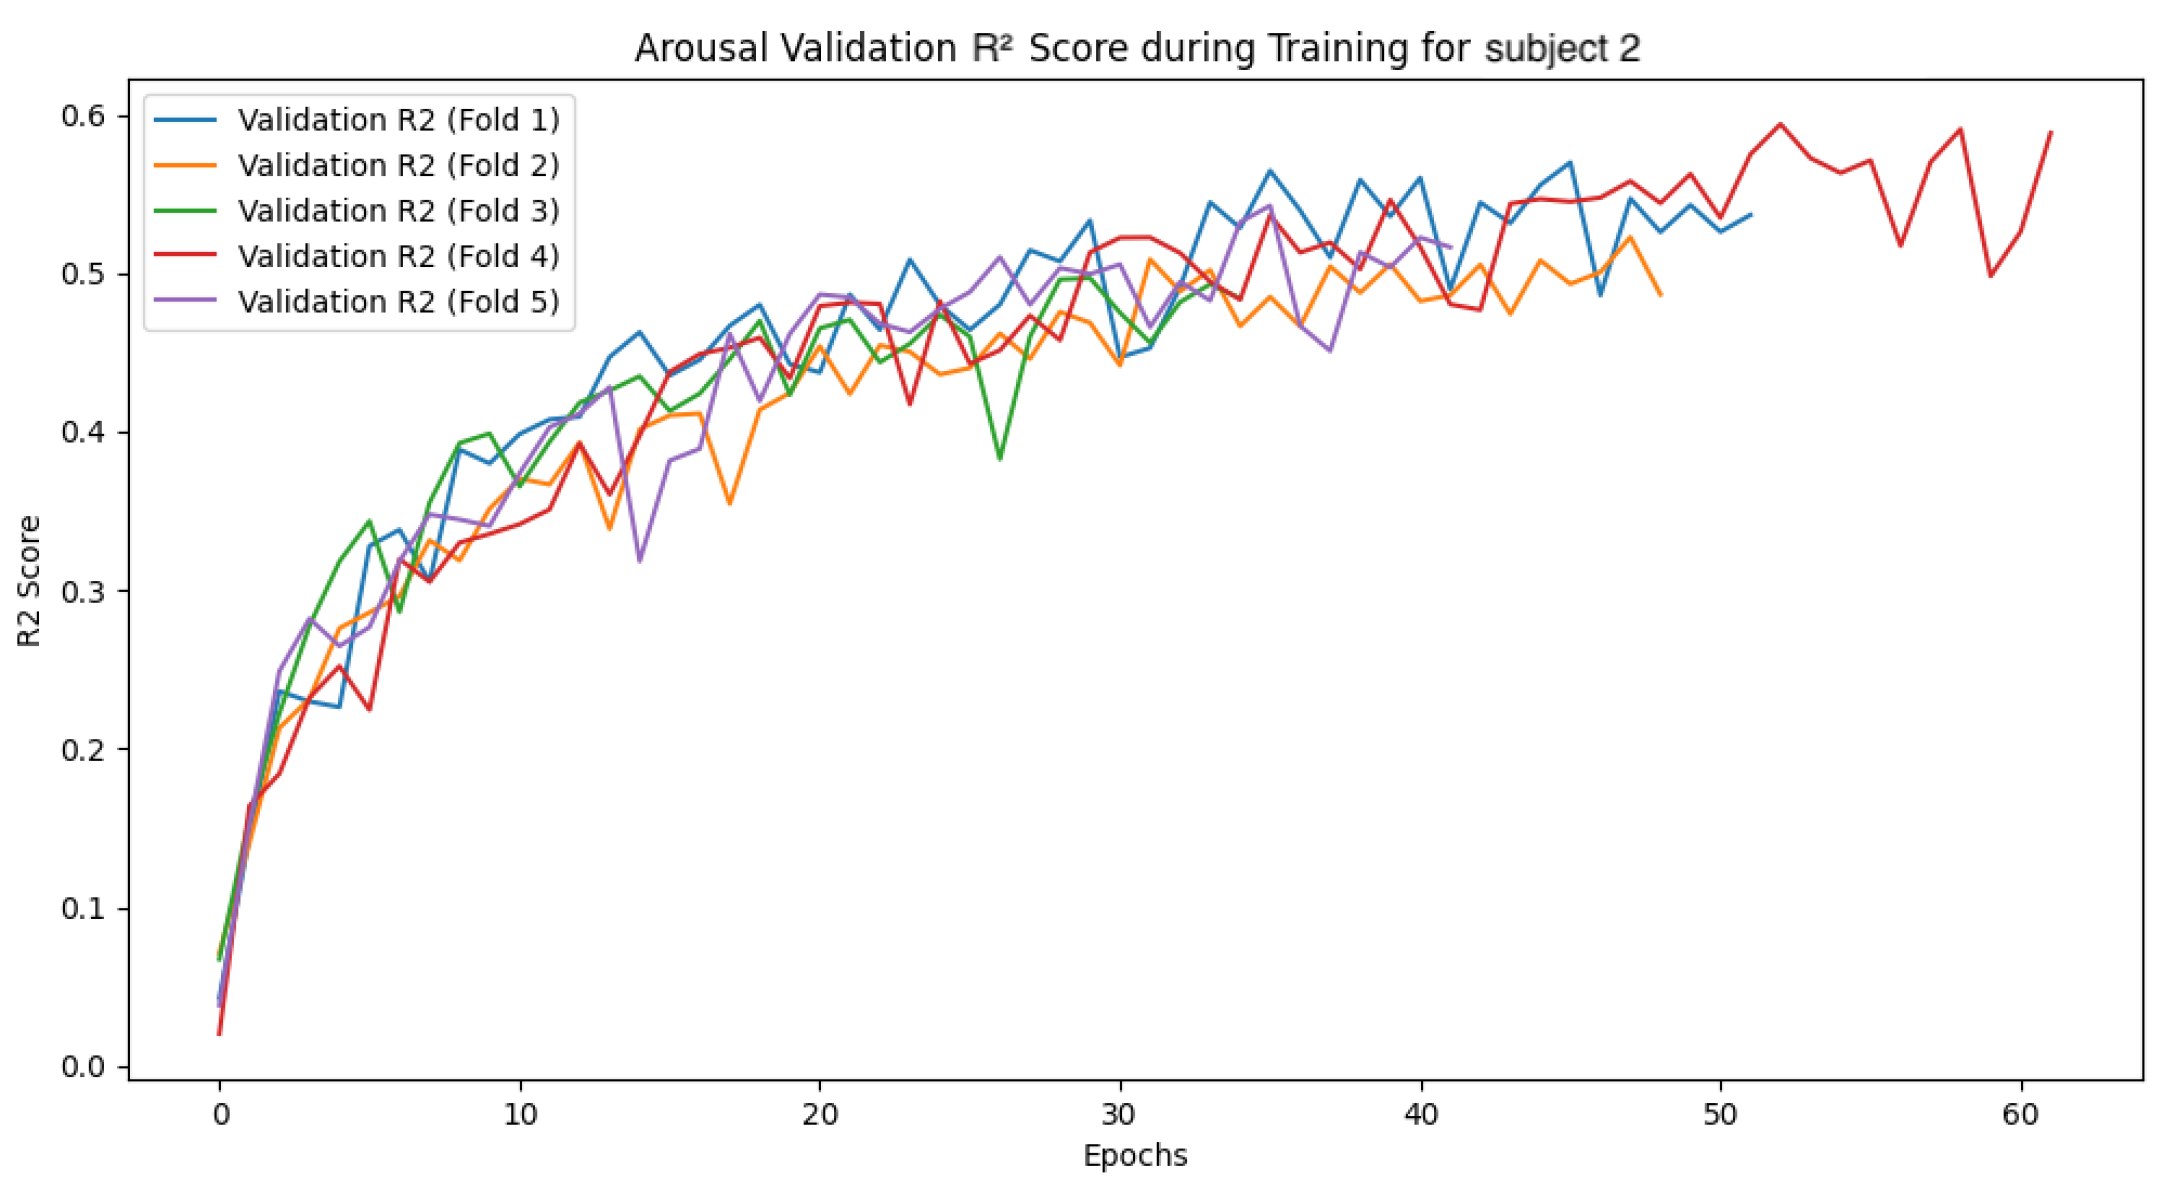
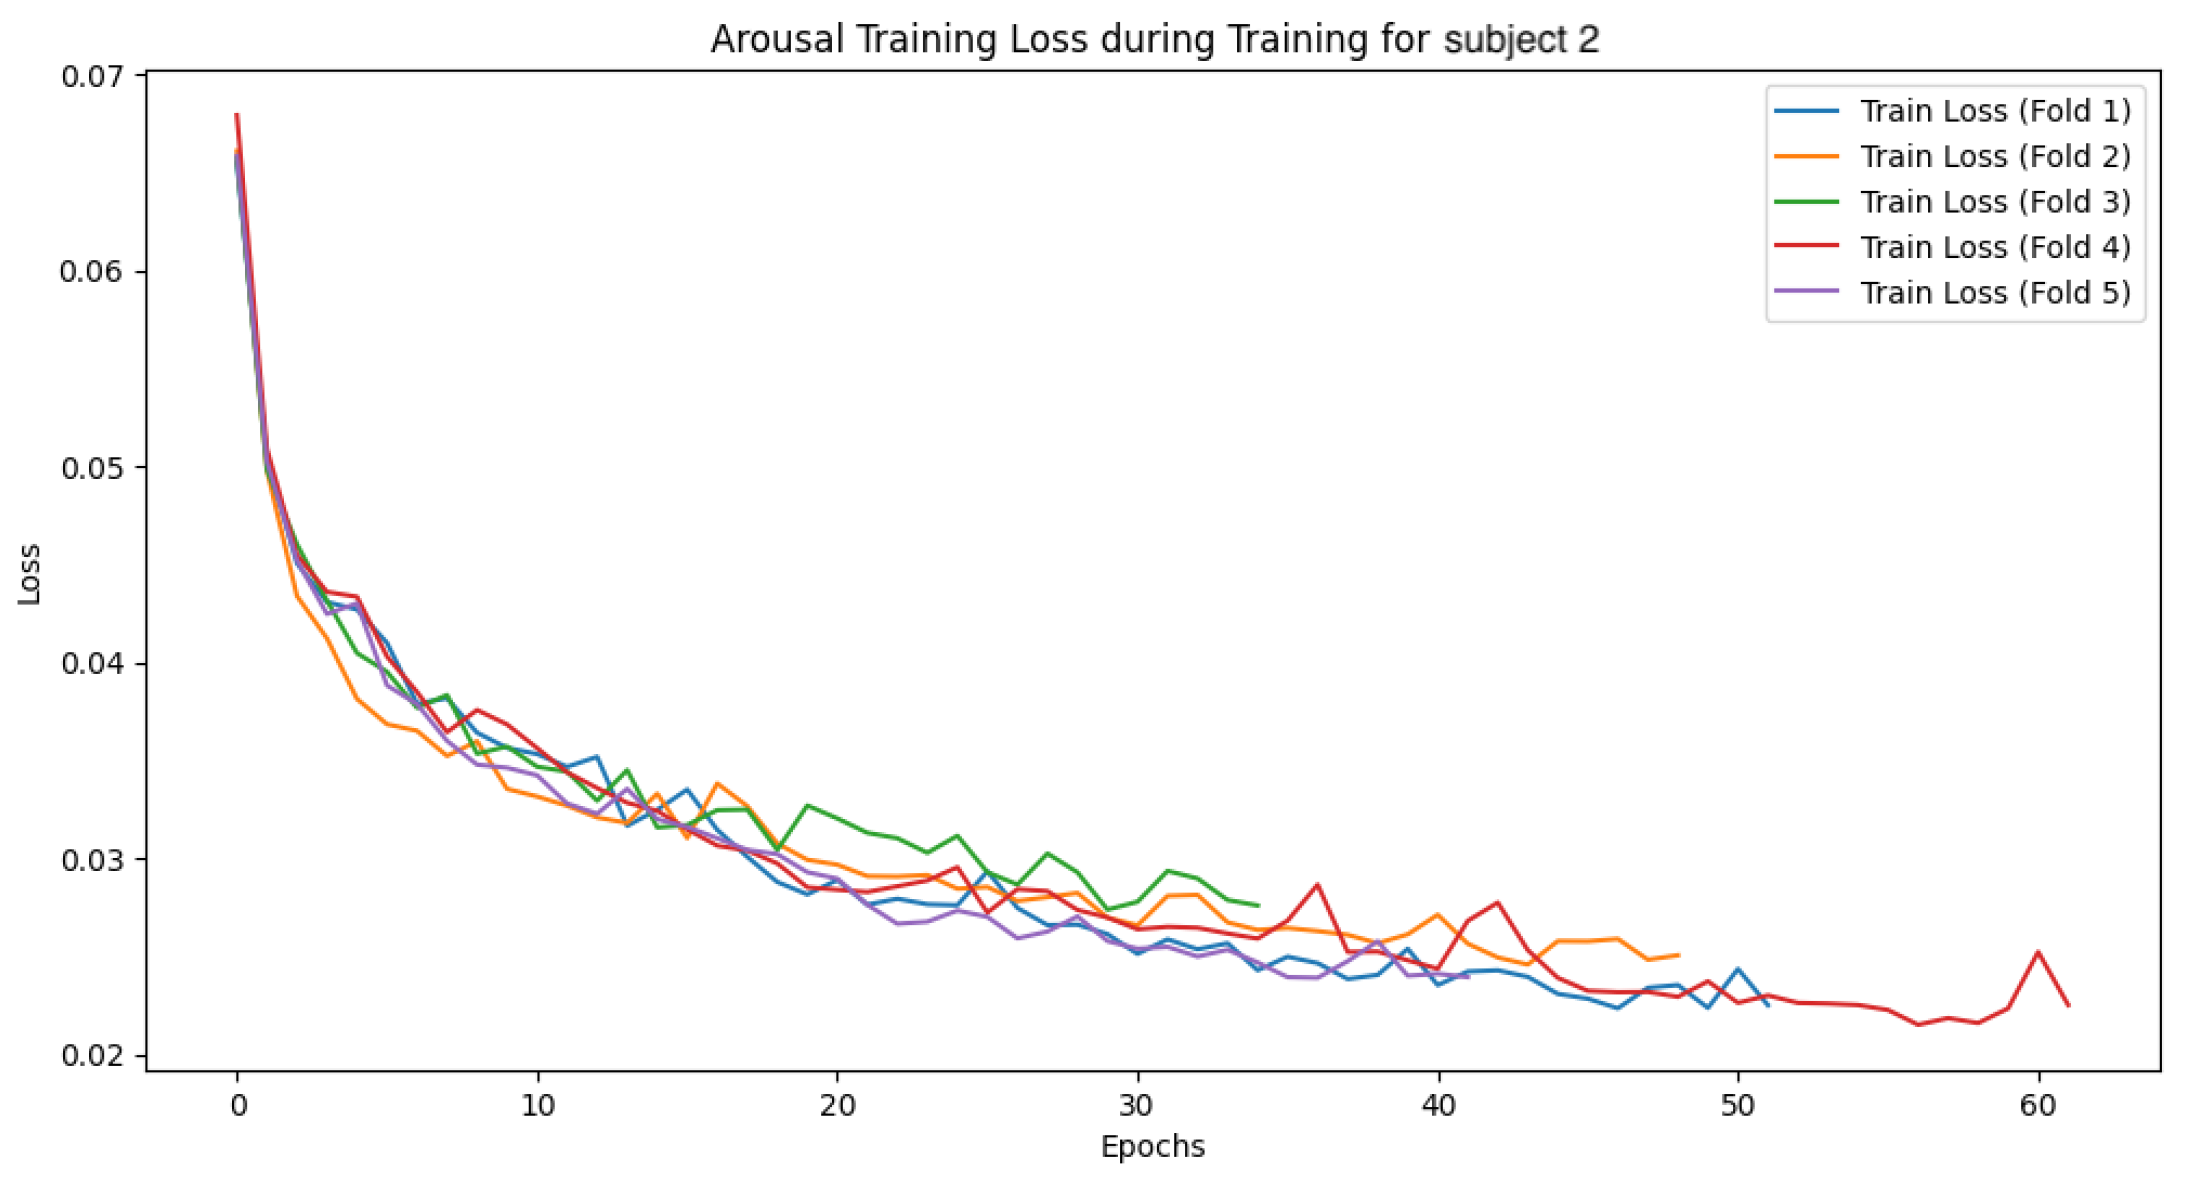
4.4.1. Subject 2
The following
Figure 19,
Figure 20,
Figure 21,
Figure 22,
Figure 23,
Figure 24,
Figure 25 and
Figure 26 show the loss function and accuracy convergence curves during training for the GBDT model and the CNN-LSTM model for subject 2. Subject 2 exhibited the most stable results during training. Specifically, the small gap between training and validation accuracy indicates that the model maintained its generalization ability without overfitting. This suggests that an ideal training process was achieved. However, the accuracy was lower compared to the other two machine learning models, which was an unexpected outcome. This difference in accuracy suggests that the neural network may not have been sufficiently trained, or the network structure may not have been optimized adequately.
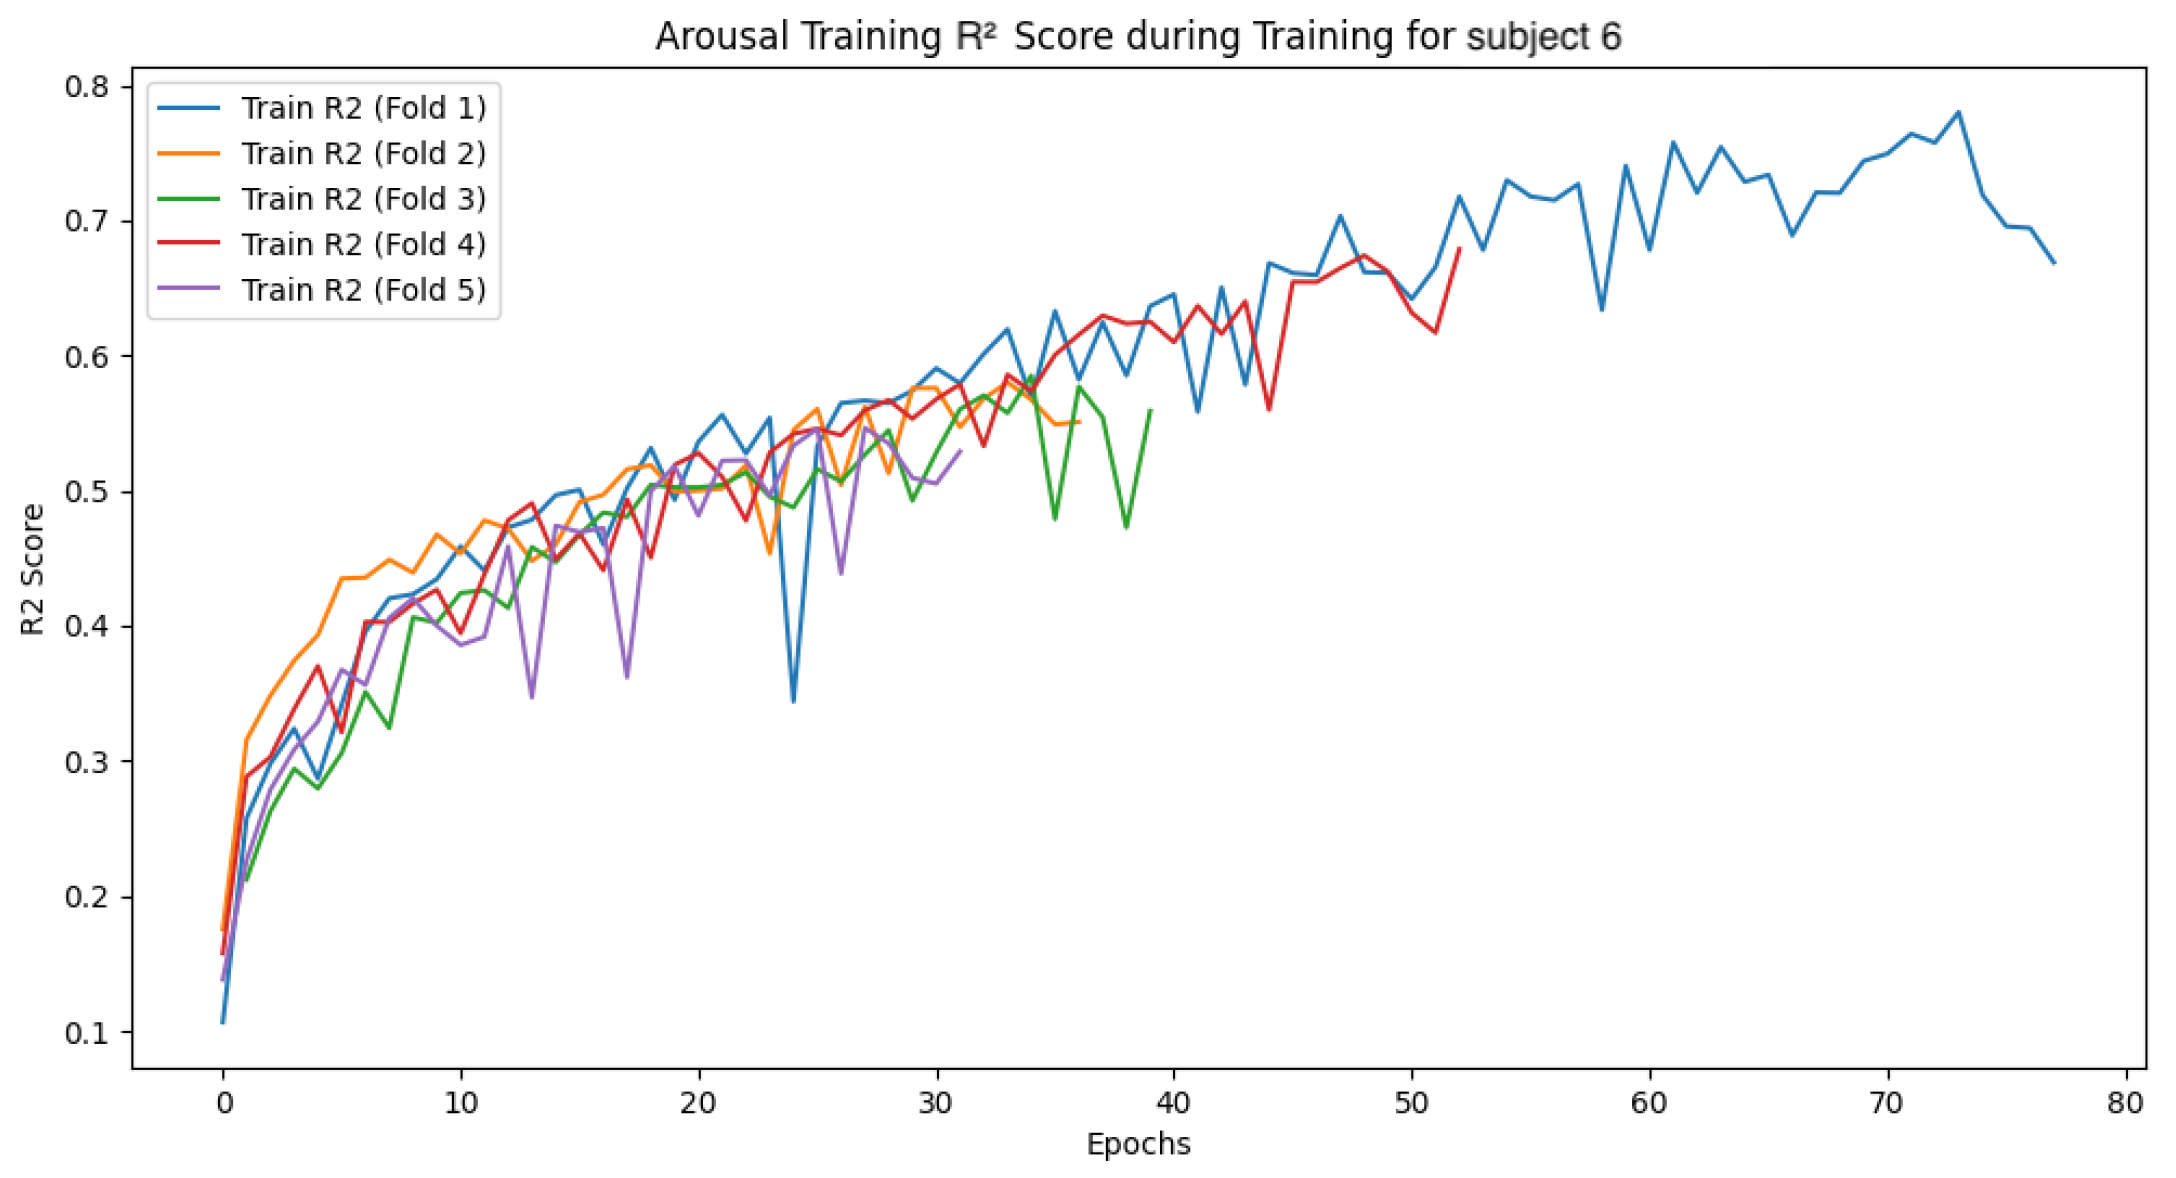
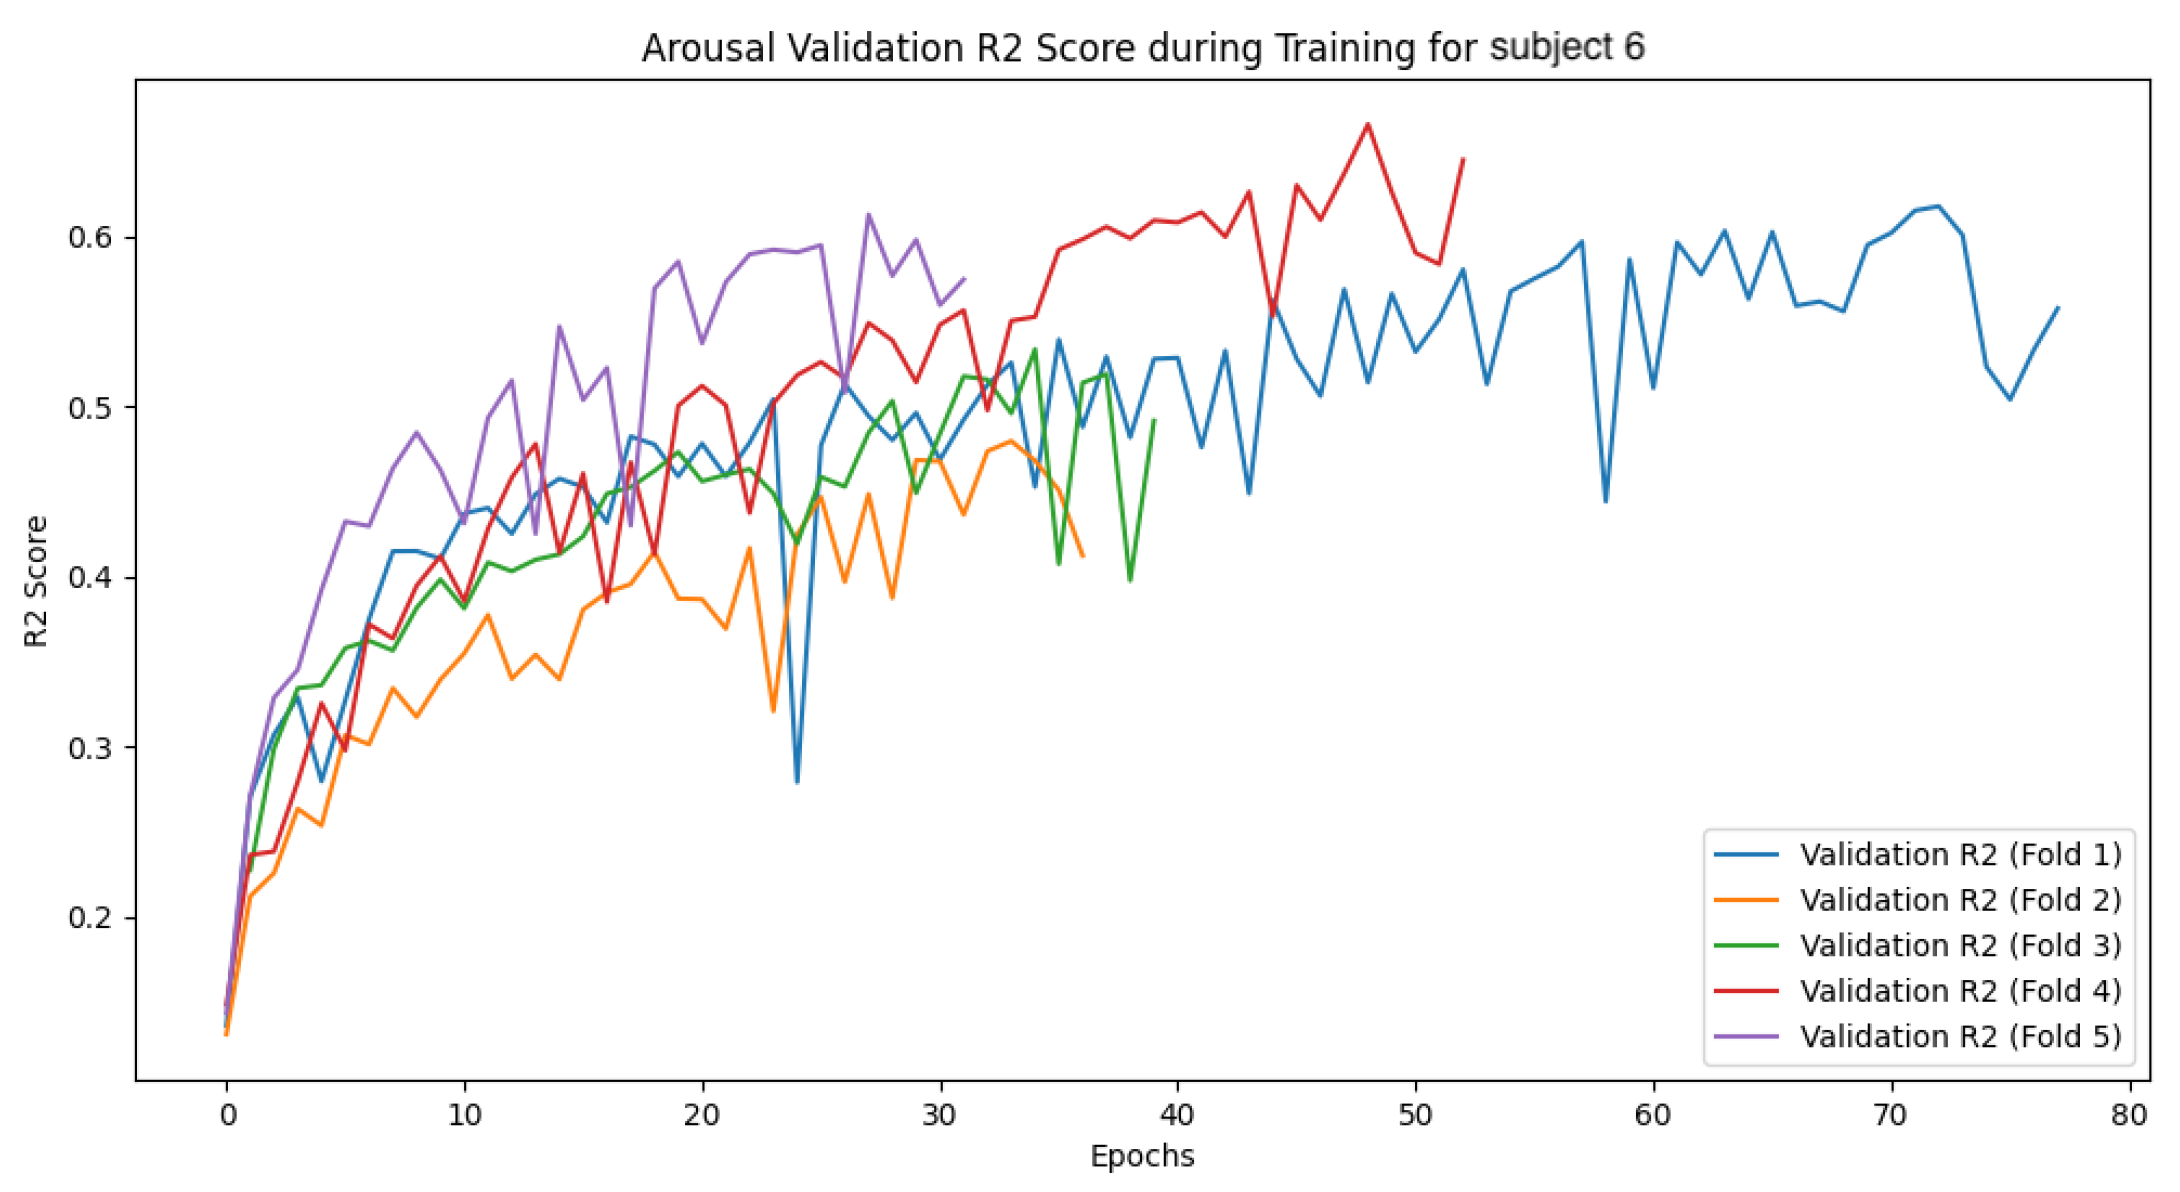
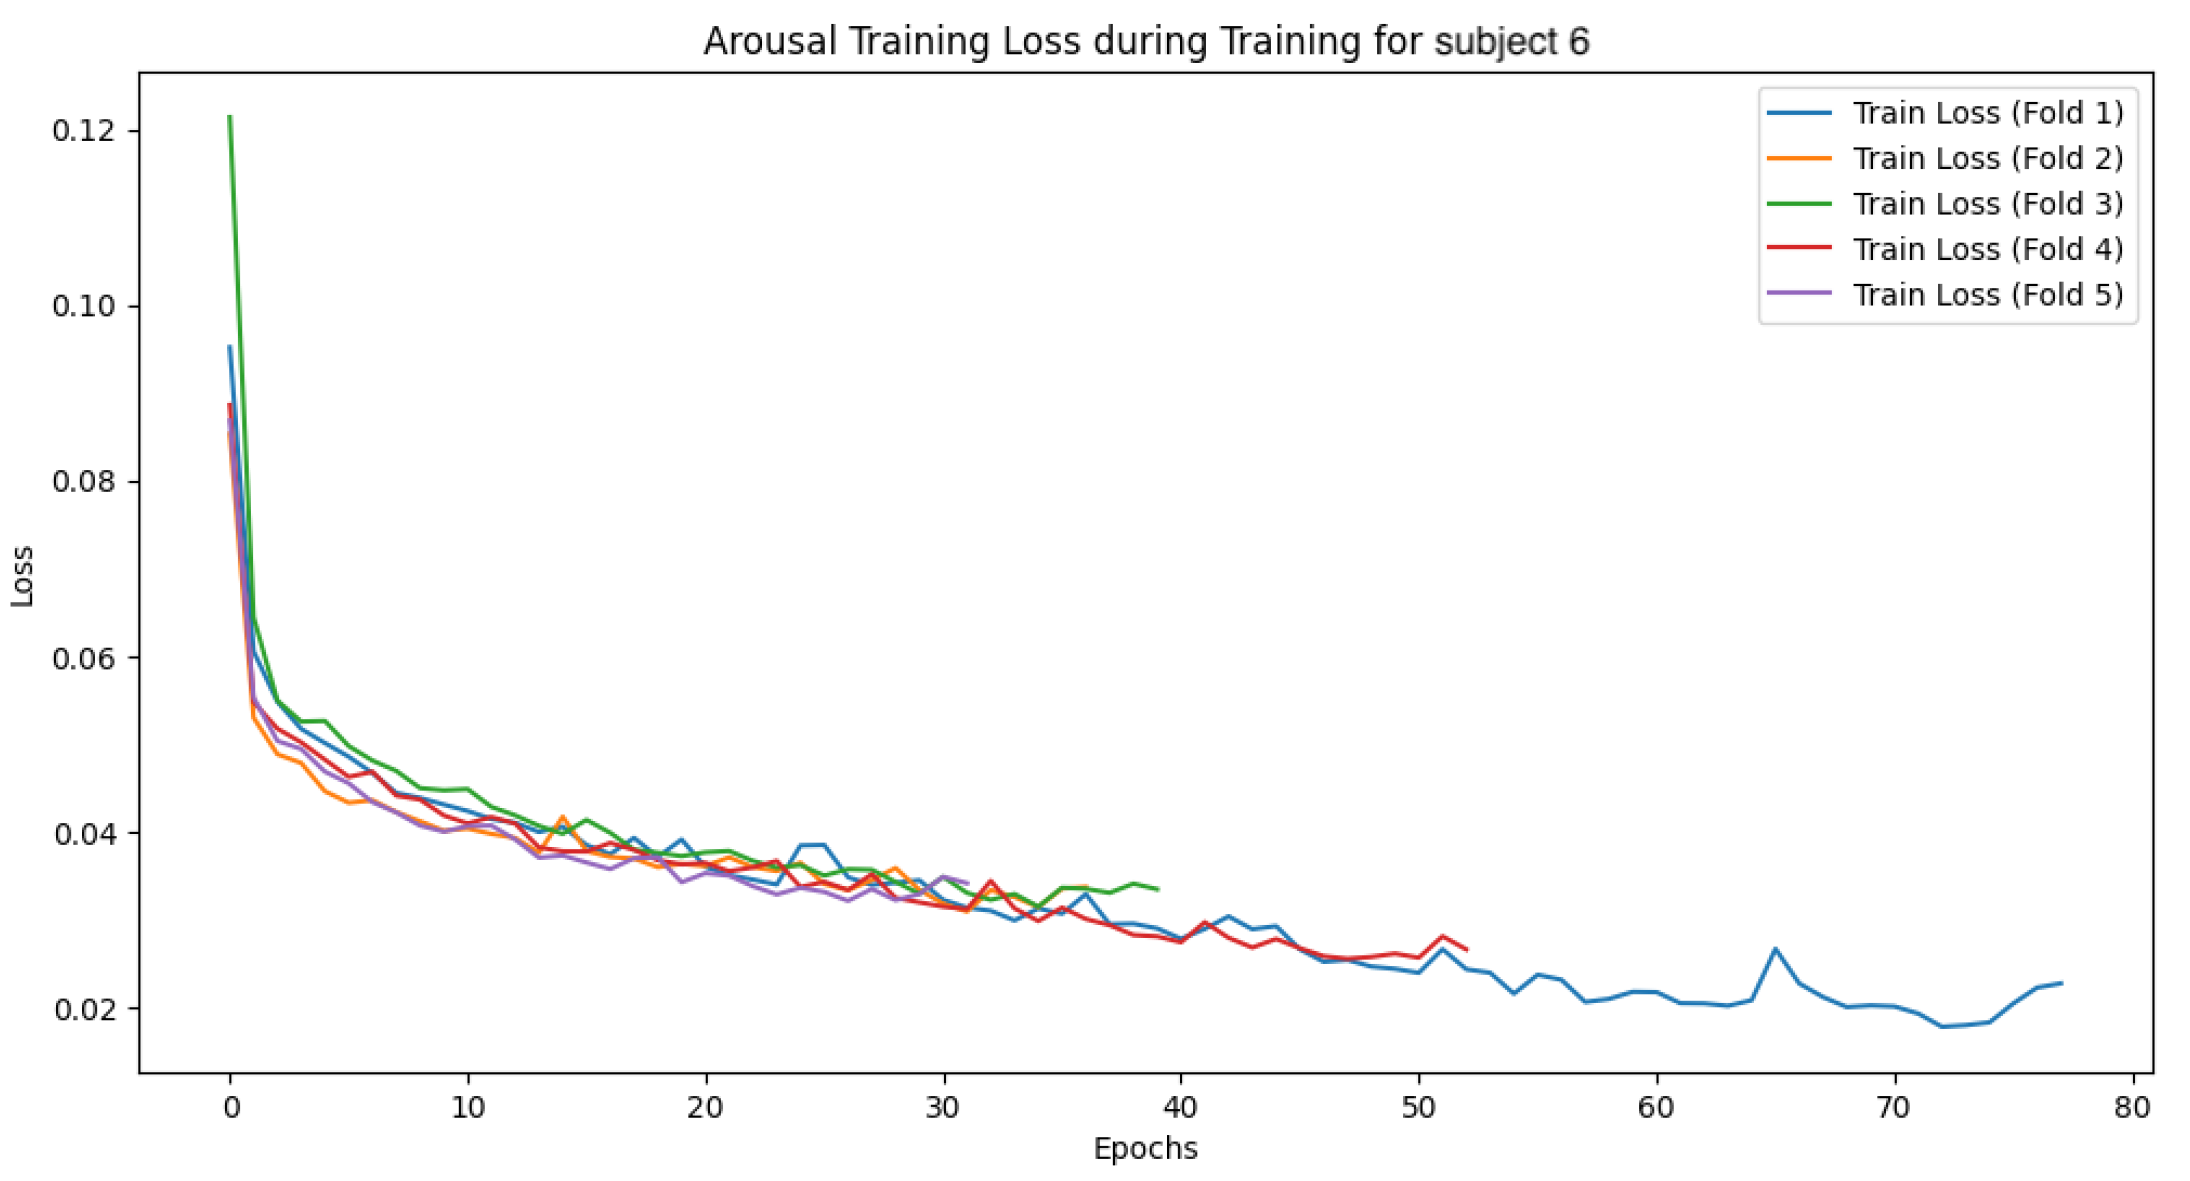
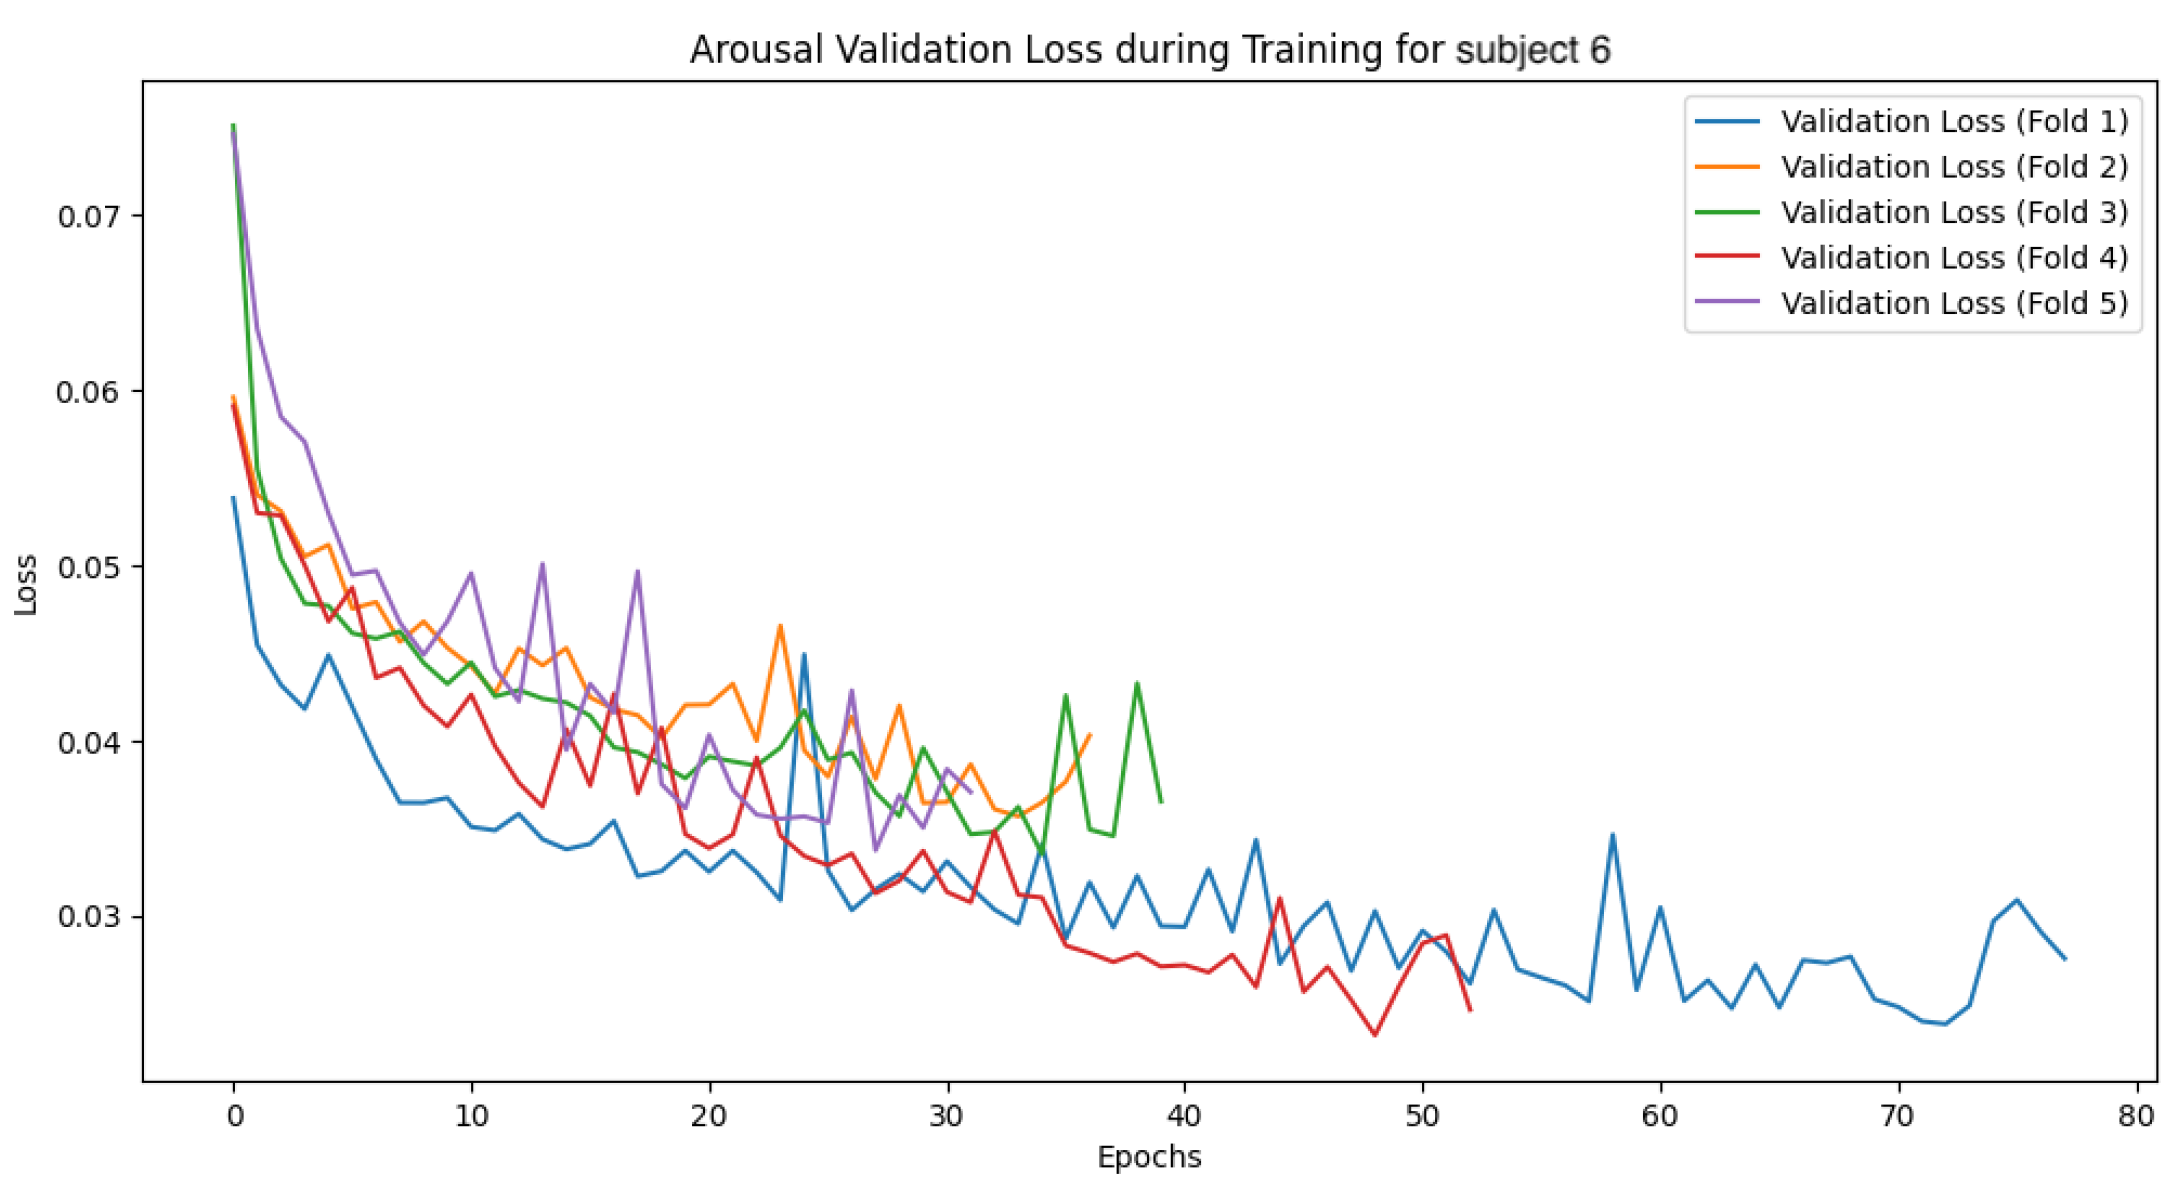
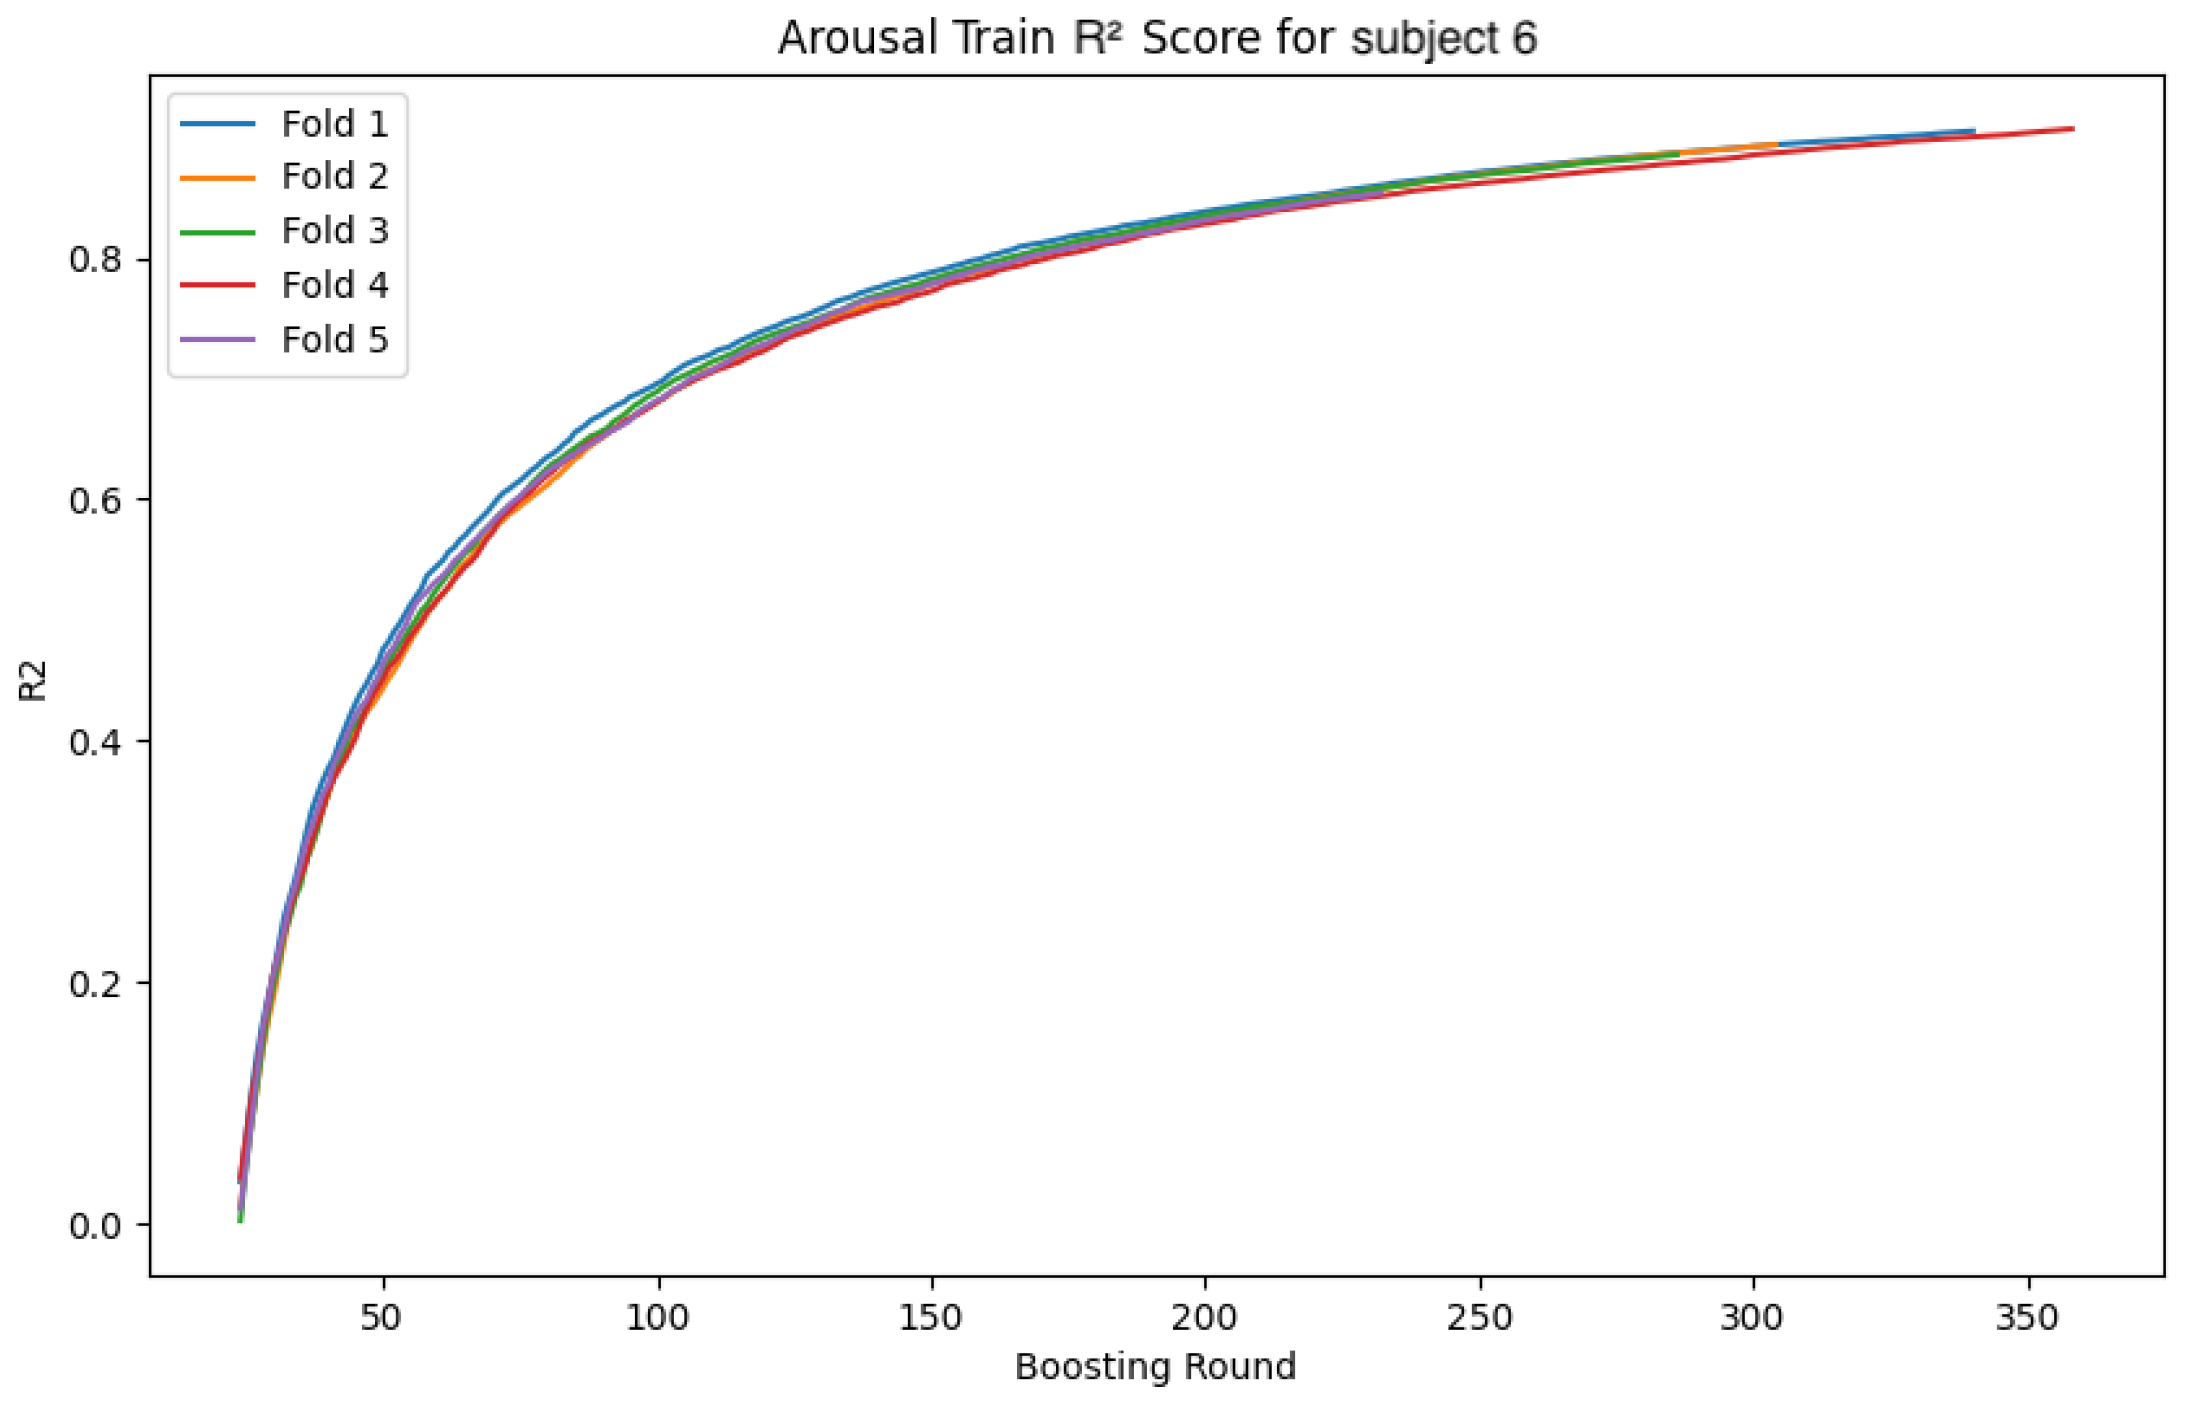
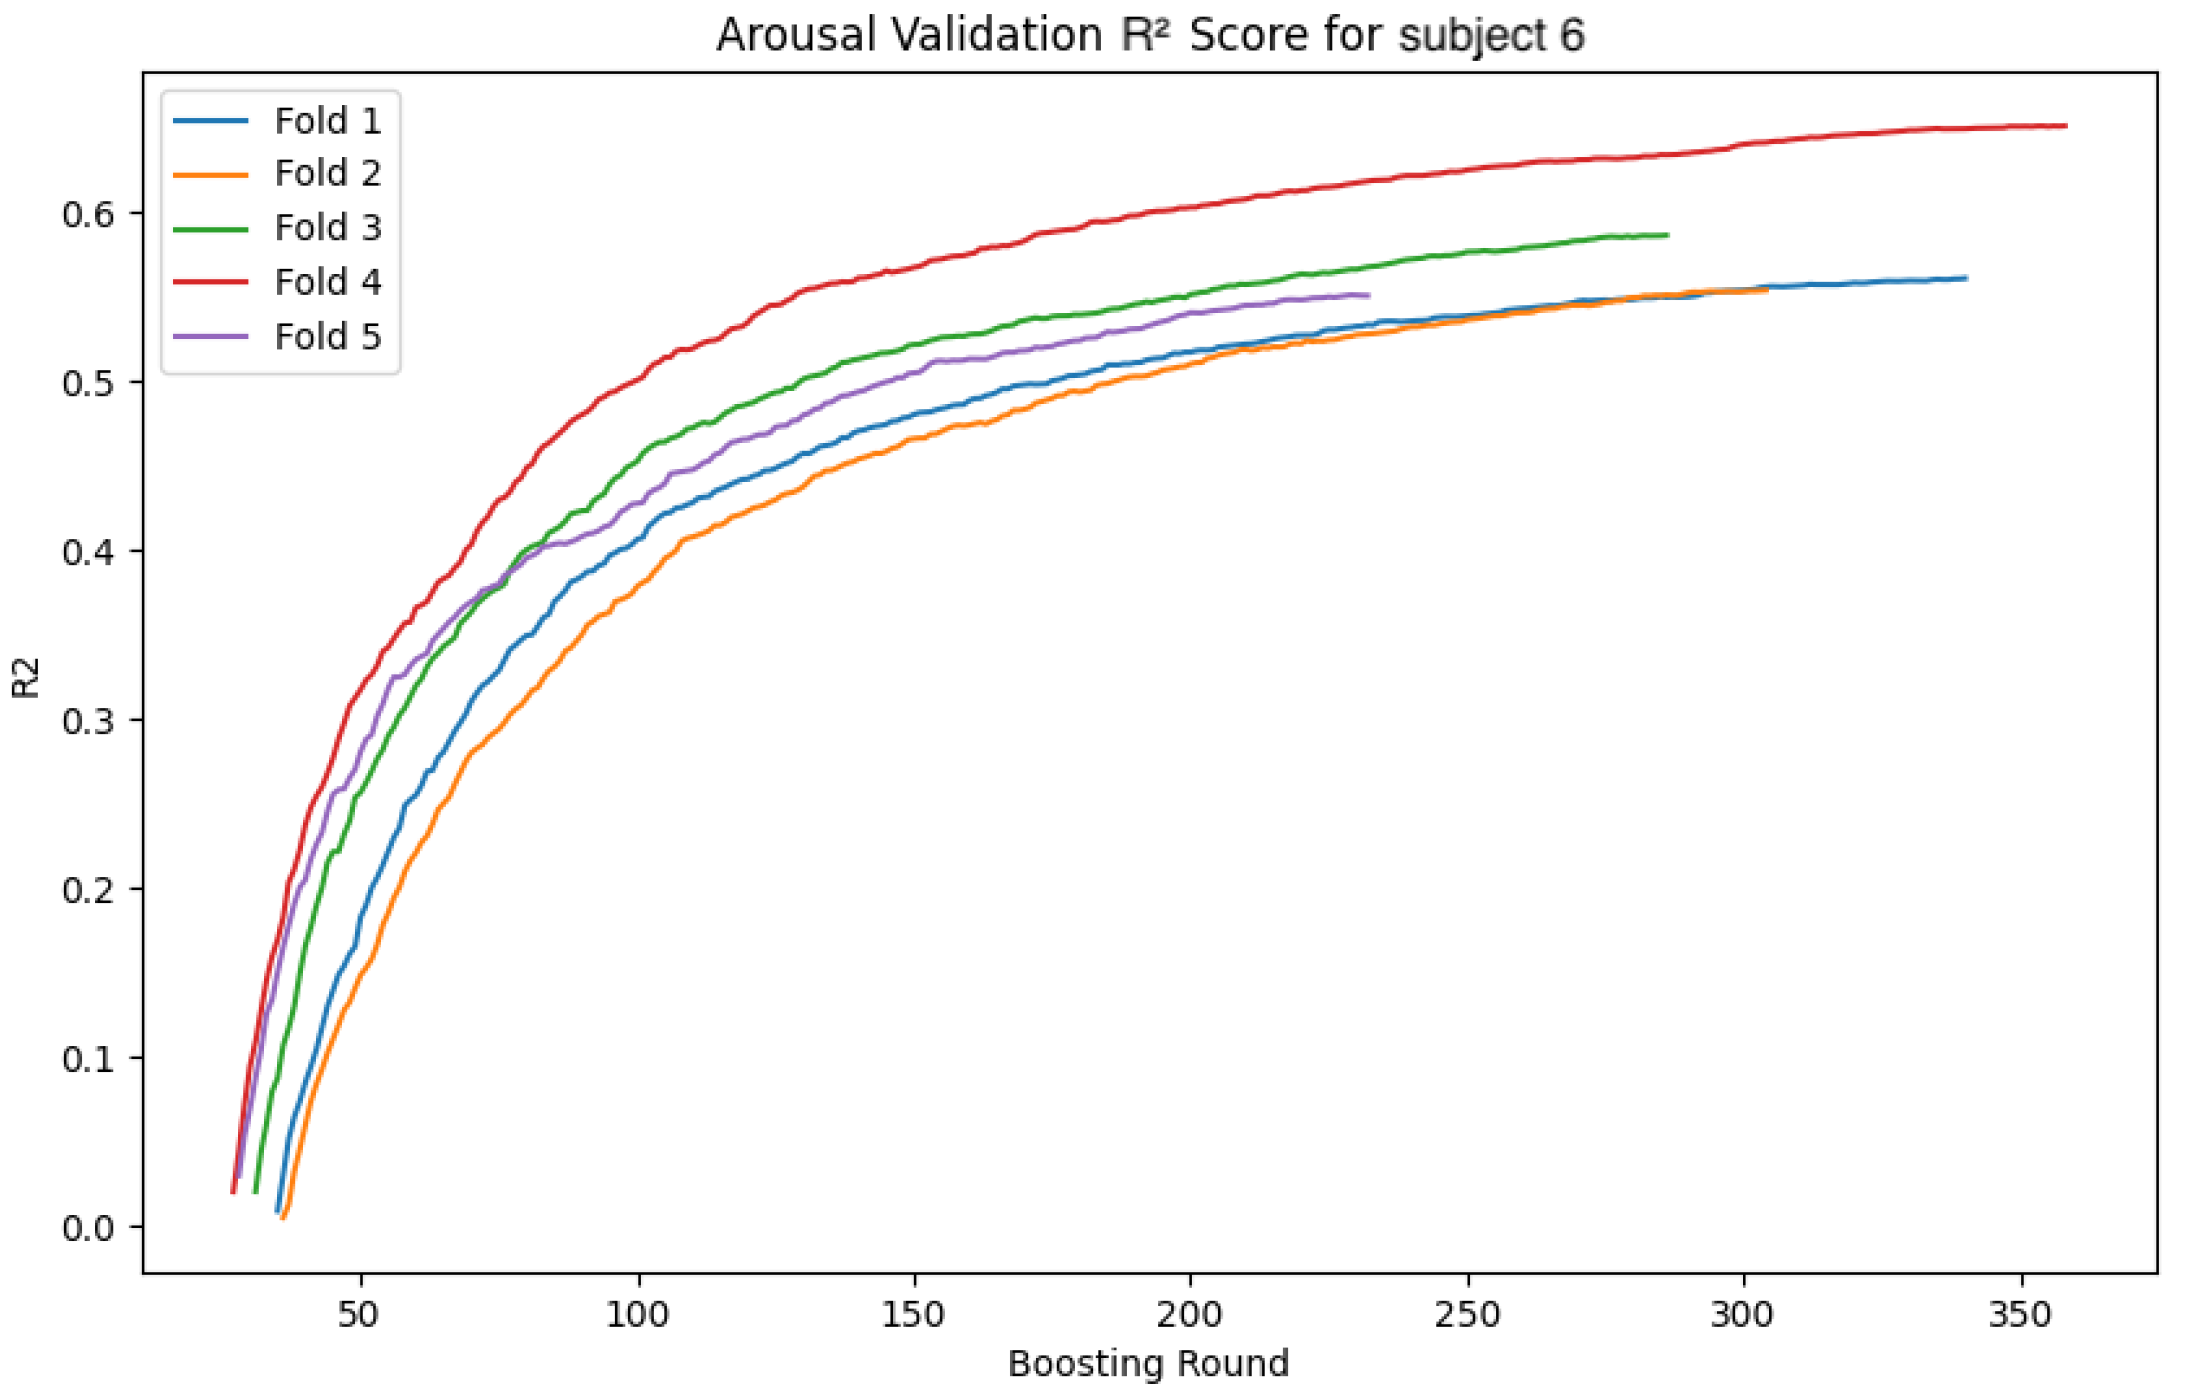
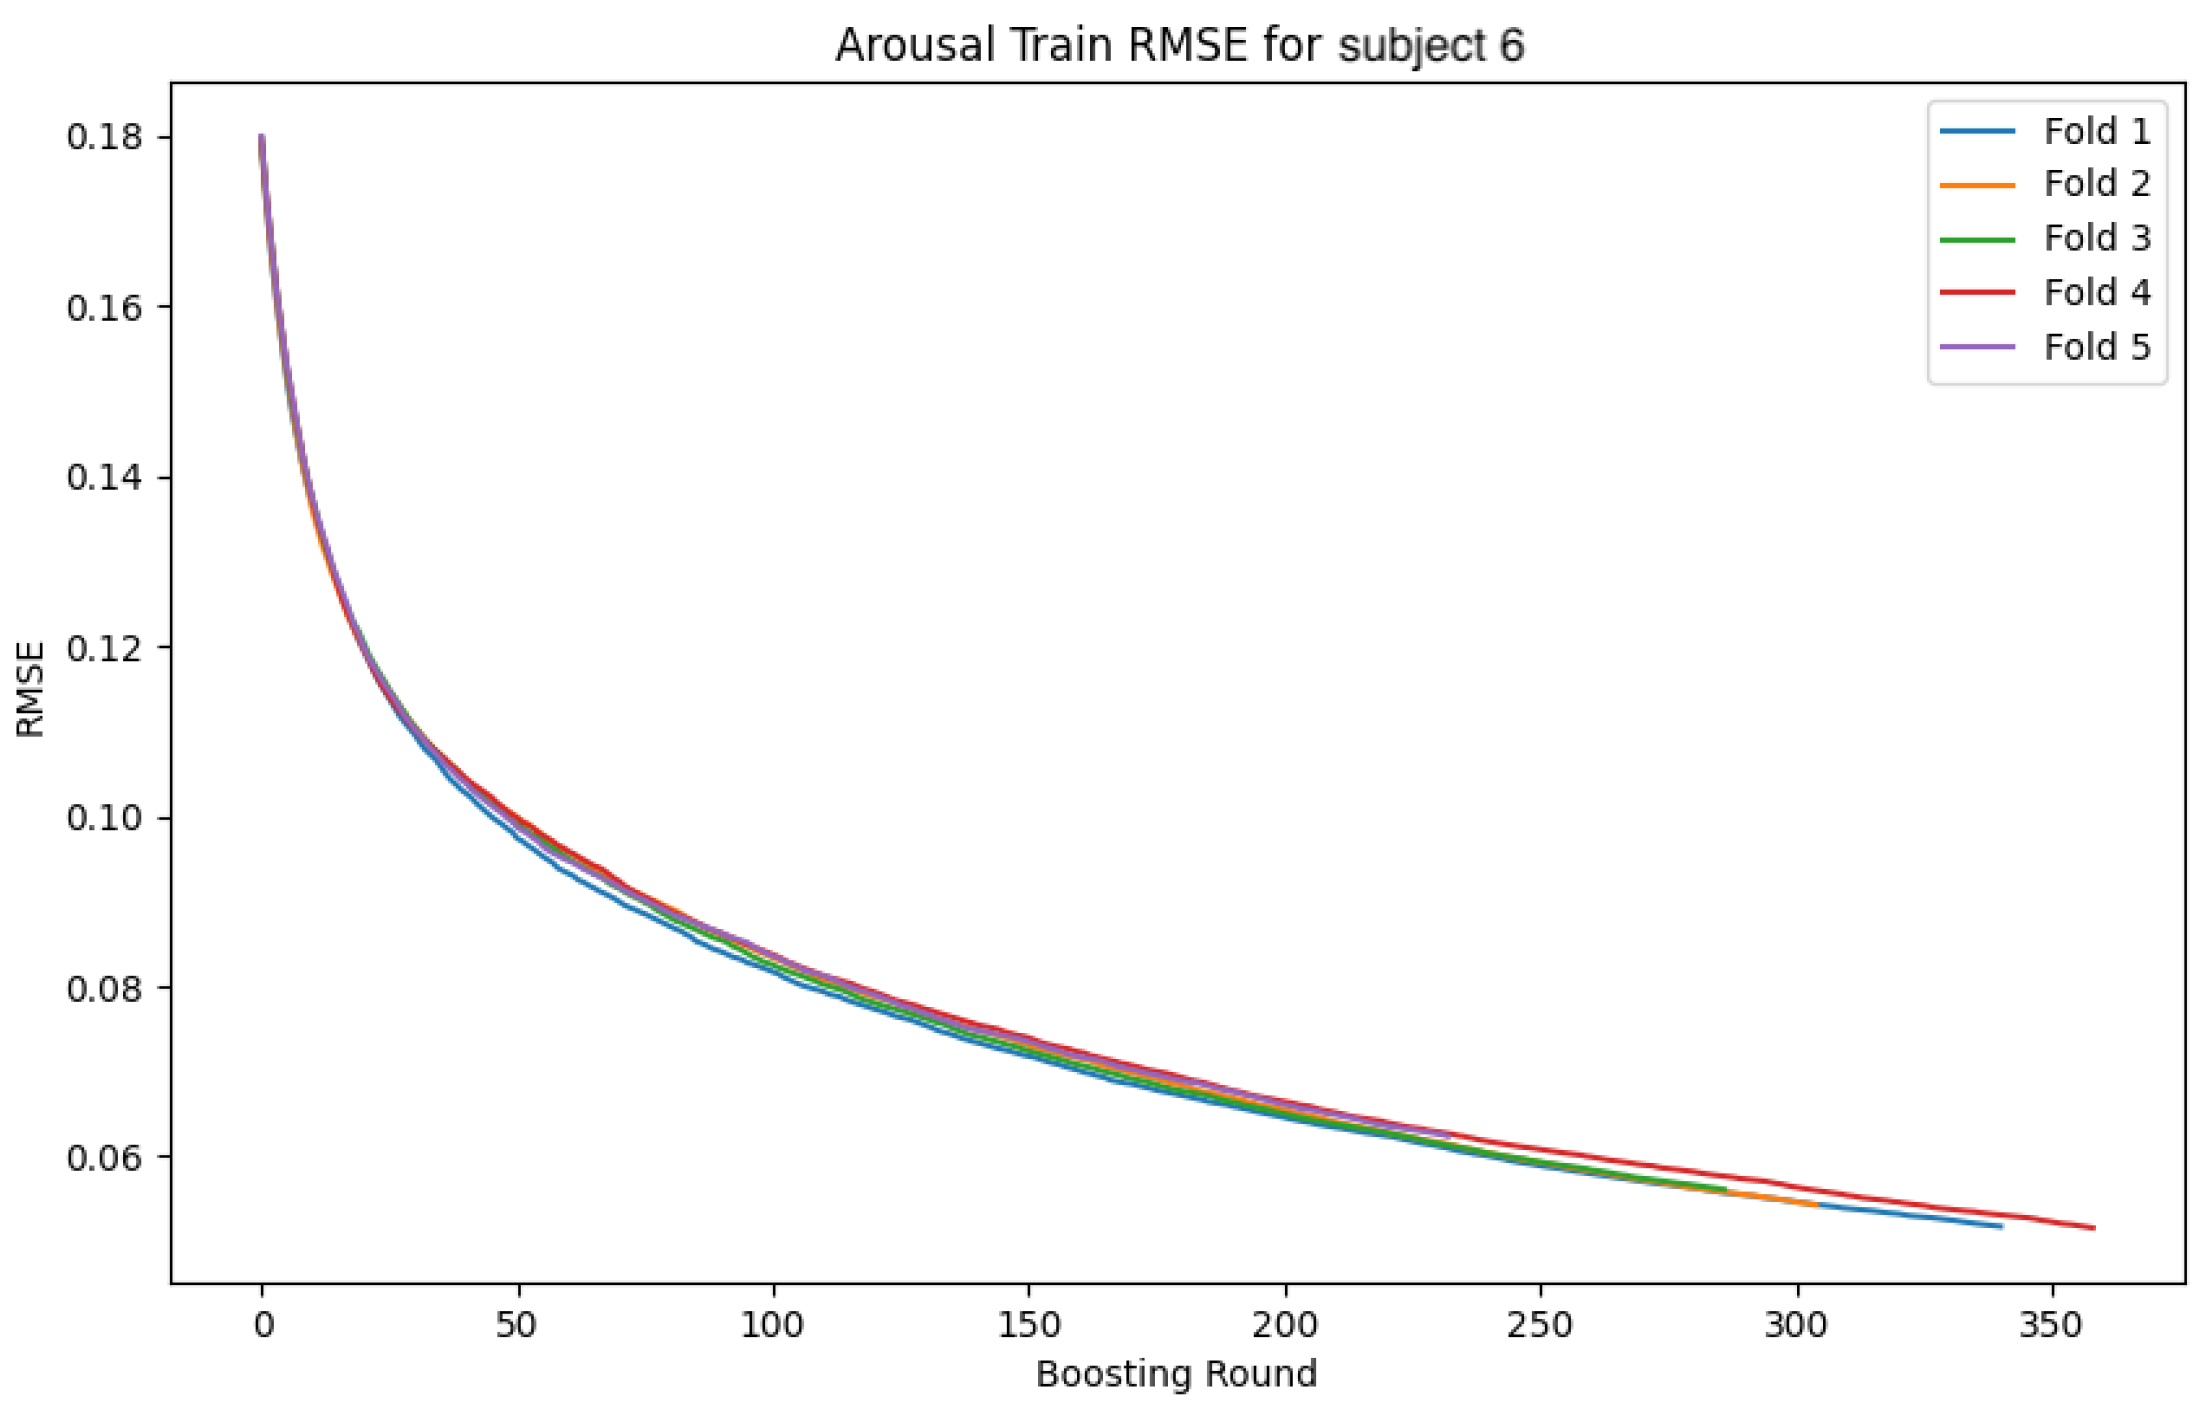
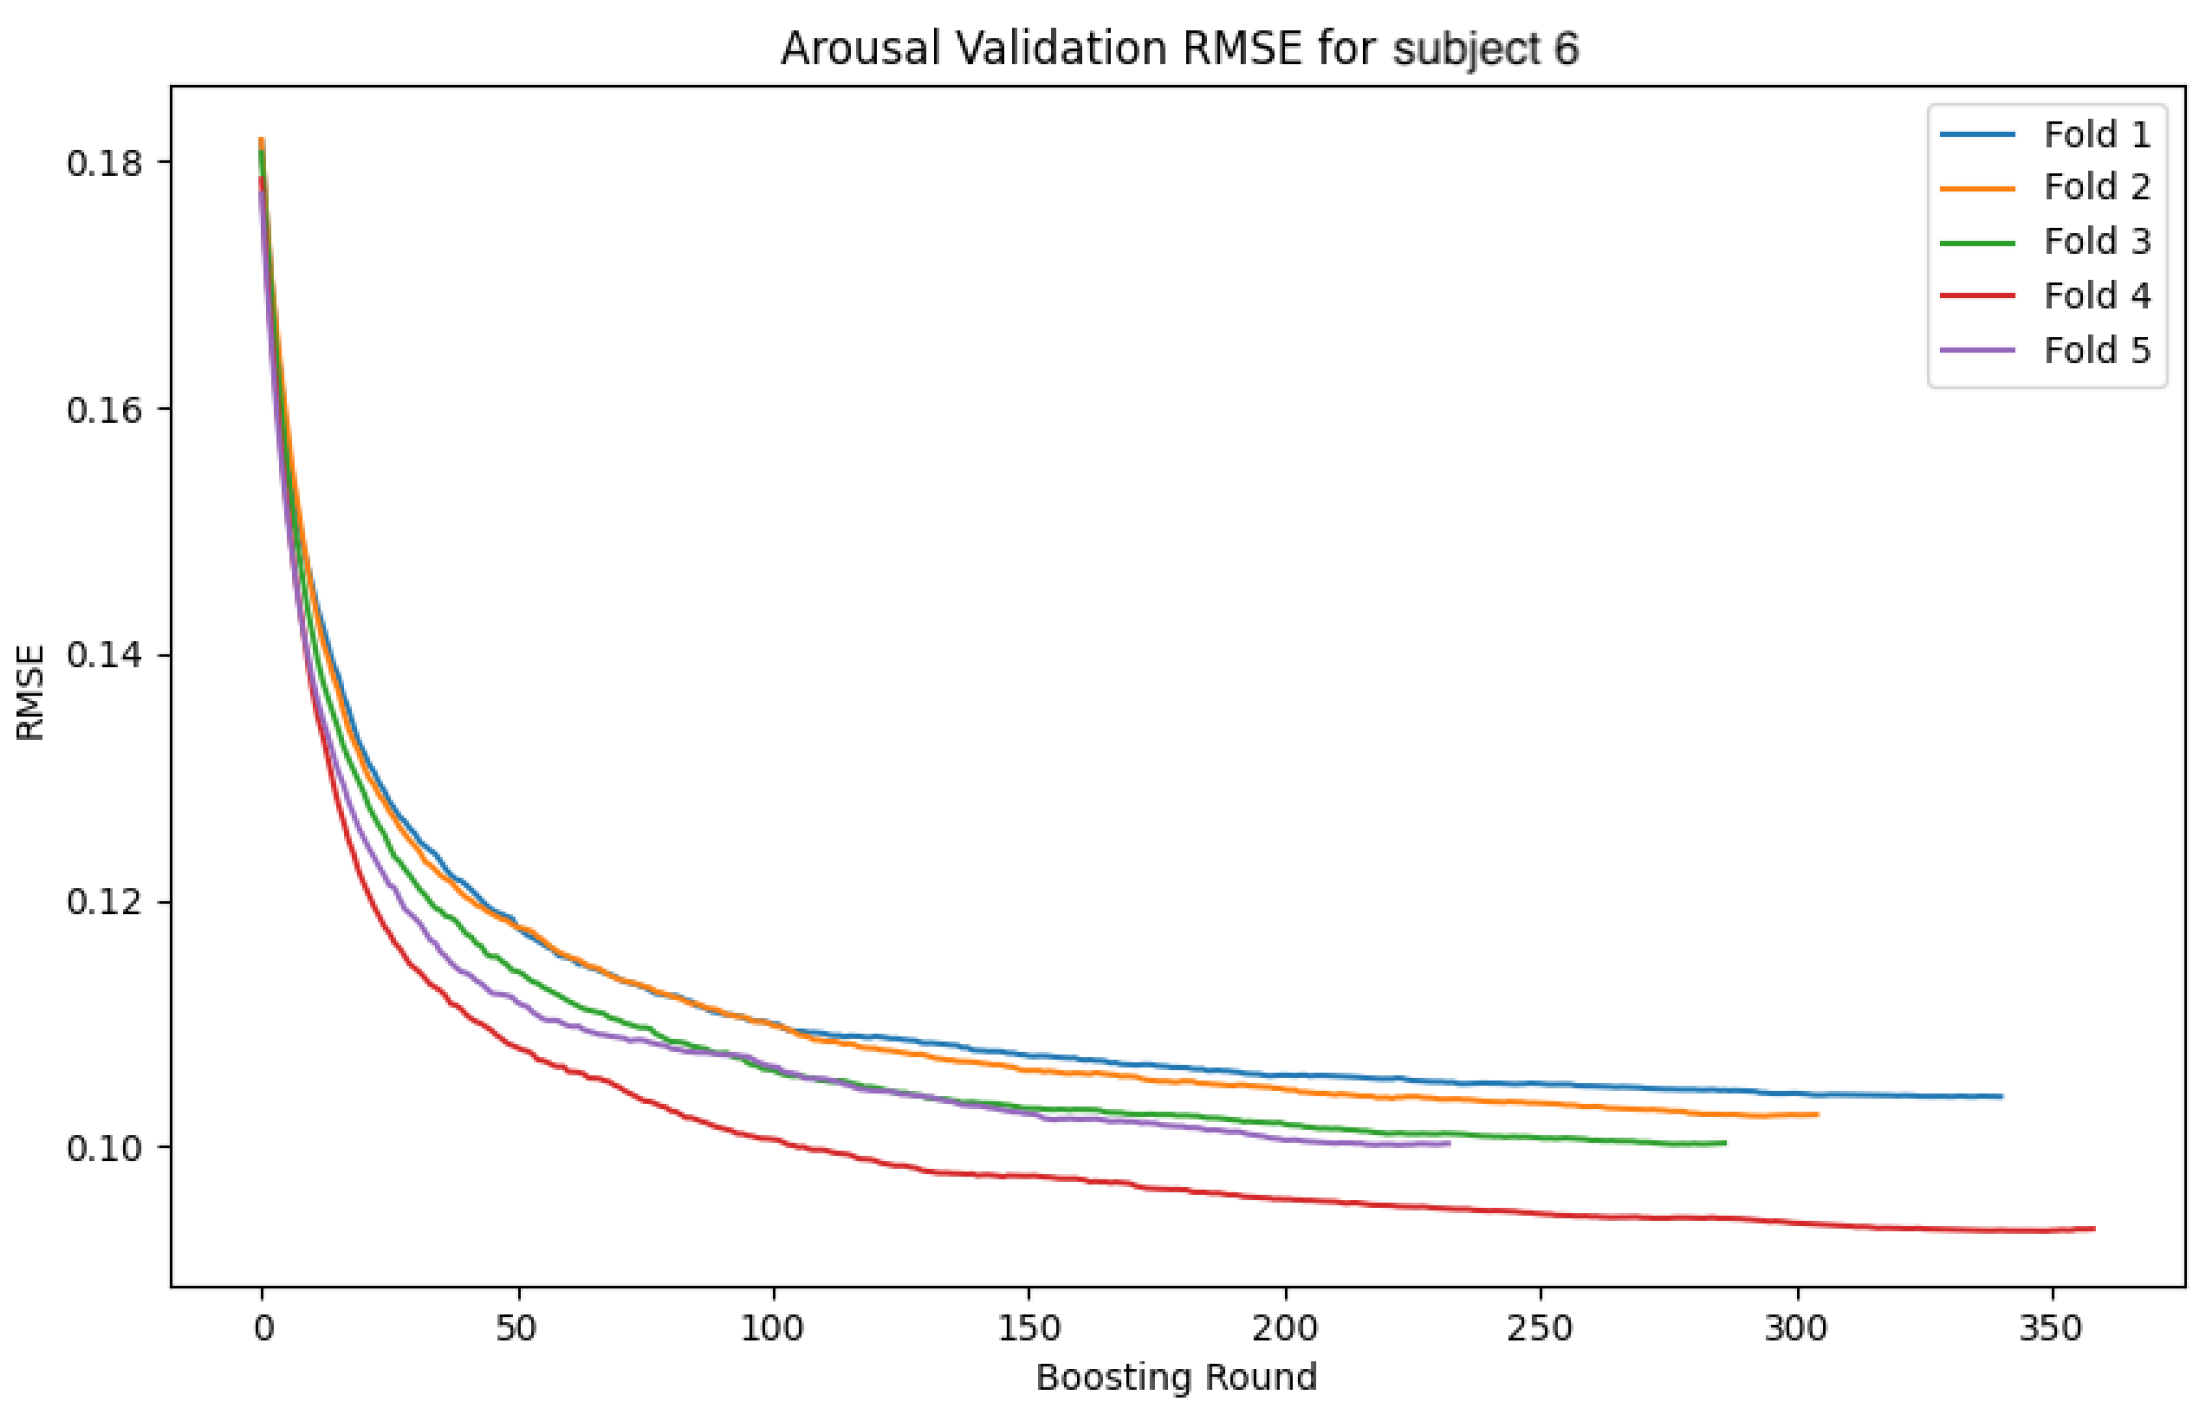
4.4.2. Subject 6
The following
Figure 27,
Figure 28,
Figure 29,
Figure 30,
Figure 31,
Figure 32,
Figure 33 and
Figure 34 show the loss function and accuracy convergence curves during training for the GBDT model and the CNN-LSTM model for subject 6. Subject6 was selected as a representative example of early stopping during training. For this subject, there was variability in the stopping time for each fold. In some folds, training stopped around 40 epochs, while in others it progressed until 80 epochs. These differences are likely due to variations in data distribution between folds and the settings for early stopping. Additionally, the characteristics of the validation data and the learning rate may have contributed to these differences.
4.4.3. Overall Trends
Overall, there was noticeable variation in the loss function and accuracy curves on the validation data. This variation is likely due to the model not being sufficiently trained, leading to a decrease in generalization performance. Furthermore, large fluctuations in accuracy and loss values at each epoch suggest that the learning rate was set too high, causing instability in the model’s training.
5. Discussion
In this study, the proposed emotion estimation method based on environmental data demonstrated its potential, especially for valence estimation. However, the performance of the models varied, and several interesting findings emerged from the analysis.
The RF model and the GBDT model exhibited high accuracy, with the RF model consistently outperforming the GBDT model across all subjects. One possible explanation for this result is that the RF model is particularly effective at handling noise and non-linear relationships in the data, as it constructs multiple decision trees and combines their outputs. This ability to handle noisy environmental data makes the RF model a robust choice for emotion estimation.
On the other hand, the GBDT modelproduced results that were inferior to those of the RF model in this experiment. This could be attributed to the fact that the study focused on exploring the potential of various estimation methods, rather than optimizing the models. While the GBDT model has been shown to perform well in various contexts, its performance in this study could have been hindered by factors such as suboptimal hyperparameter settings or the complexity of the data. Future work should focus on tuning the parameters of the GBDT model to explore its full potential.
However, it is also important to consider the practical implications of hyperparameter tuning in real-world applications. In operational settings, the ability to achieve high performance with minimal parameter adjustment can be a significant advantage, particularly in time-sensitive or resource-constrained environments. In this regard, the RF model’s inherent robustness and its lesser dependency on hyperparameter tuning make it an appealing choice. Unlike the GBDT model, which often requires careful adjustment of parameters such as learning rate and tree depth to avoid issues like overfitting or underfitting, the RF model can deliver stable and reliable results with default settings. This characteristic reduces the need for extensive trial-and-error during model setup and makes the RF model a more practical solution for emotion estimation in scenarios where ease of deployment and consistent performance are priorities.
In this experiment, the performance of the CNN-LSTM model showed variability in the loss and accuracy curves on the validation data. This variability may stem from insufficient generalization caused by underfitting. Furthermore, significant fluctuations were observed in the accuracy and loss values across epochs, suggesting instability in the learning process due to an excessively high learning rate. To mitigate these issues, several improvements can be considered. First, adjusting the learning rate could stabilize the training process, leading to more consistent learning outcomes. Second, implementing data augmentation techniques and optimizing early stopping conditions may help reduce performance discrepancies across folds and achieve more stable results. By increasing the amount of training data and refining the training process, the model’s generalization ability could be enhanced. Additionally, introducing more complex network architectures may enable the model to better capture patterns in the training data and learn a broader range of features. This could lead to improved accuracy and potentially allow the CNN-LSTM model to outperform other models. The incorporation of advanced methods such as regularization, dropout, or batch normalization may further enhance the model’s robustness and reduce overfitting. Addressing these challenges is expected to significantly improve the performance of the CNN-LSTM model, both in terms of accuracy and stability, making it a more competitive approach for emotion estimation tasks.
Other researchers’ results should also be considered, as comparing these results with those of this study can provide broader insights. For example, Dissanayake et al. demonstrated the effectiveness of ensemble learning algorithms over single classifiers for ECG-based emotion recognition, particularly showing that ensemble learning using decision trees achieves the highest accuracy [
19]. This result aligns with the performance of the methods used in this study, confirming that similarly promising results have been obtained. As demonstrated by Wang et al., deep learning models such as the LSTM model and the CNN-LSTM model have achieved high accuracy in EEG-based emotion recognition [
21]. Additionally, Kurebayasi et al. have shown that the CNN-LSTM model exhibits high accuracy in emotion recognition using environmental data [
13]. These results suggest that deep learning models enhance emotion recognition accuracy by leveraging their strong ability to handle time-series data. Therefore, it is suggested that improving the CNN-LSTM model in the context of this study may make deep learning techniques effective for emotion recognition in environmental data as well.
Valence estimation achieved higher accuracy, likely due to the significant impact of environmental factors such as room comfort and surrounding conditions. These factors directly influence emotional states associated with valence, making them easier to estimate from environmental data alone. In contrast, arousal estimation appears to be more challenging, as it may be influenced by additional factors such as individual psychological states and temporal variations in behavior or activity levels. For example, changes in energy levels throughout the day or external stressors may contribute to the observed difficulty in accurate prediction.
To improve arousal estimation within the scope of non-invasive environmental data, future efforts could focus on exploring new environmental metrics and refining existing analyses. For instance, while factors such as illuminance and noise levels are already measured, delving into detailed characteristics such as noise frequency spectra may uncover additional patterns relevant to emotional arousal. Similarly, introducing additional air quality metrics beyond CO2 and Odor, such as particulate matter (PM2.5), might enhance the model’s ability to capture subtle environmental influences. Moreover, incorporating temporal dynamics—such as diurnal patterns or activity-based time segmentation—could provide deeper insights into the interaction between environmental conditions and arousal over time, leading to improved prediction accuracy.
This experiment has several limitations. For example, the data collection period was limited to September and October, and the sample size was only seven participants. To gain more generalizable insights, a more extended data collection period and sample size are necessary. Additionally, data for other methods were not collected, so a comparison of accuracy could not be achived. Future research should compare the proposed method with other models to clarify its relative performance.
By further developing the insights gained from this study, it is expected that emotion estimation technologies will become more practical for implementation in workplaces and homes. In particular, collaboration with IoT technologies is anticipated to lead to the development of devices capable of real-time environmental data collection and automatic adjustment. In workplaces, real-time monitoring of employees’ stress and emotional states will enable immediate environmental adjustments, leading to stress reduction and improved work efficiency. In homes, smart devices will be controlled according to changes in residents’ emotions and comfort, providing a more comfortable and healthy living environment. As a result, emotion estimation technologies have the potential to be widely applied as automated support in daily life.
6. Conclusions
In this study, we proposed a non-contact method for estimating emotional valence and arousal using environmental data and evaluated its effectiveness. This approach offers a novel contribution to emotion estimation research by addressing privacy concerns, discomfort caused by wearable devices, and the limitations of traditional emotion sensing methods.
The experimental results demonstrated that valence estimation achieved high accuracy, with the RF model showing particularly strong performance. The satisfactory results from both the RF model and the GBDT model highlight the potential of environmental data as a promising approach for valence estimation. On the other hand, the relatively lower accuracy of arousal estimation suggests the need for further improvements, especially by exploring additional data sources and refining the models.
This study highlights the potential of non-invasive methods for emotion estimation using environmental data. While combining environmental data with physiological signals might enhance accuracy, such approaches could compromise the non-invasive nature of the proposed method. Future work should focus on exploring additional environmental features or refining machine learning models to further improve accuracy within the scope of non-invasive methodologies. Additionally, by incorporating interpretability into the learning models, it is anticipated that the changes in physiological signals and the environmental factors influencing those changes could be analyzed. These findings hold promise for applications in various fields, such as architecture, environmental design, and preventive medicine.
From an industrial perspective, the findings are relevant for sectors where real-time emotion estimation can improve user experience, such as healthcare, customer service, and automotive industries. The development of devices capable of real-time environmental data collection, enabled by IoT technologies, could allow emotion estimation systems to be deployed in everyday applications, leading to personalized and context-aware interactions.


