Article

Research on Mechanical Behavior of Geogrid–Soil Interface Under Rainfall Infiltration

School of Mechanics and Engineering Science, Shanghai University, Shanghai 200444, China
*
Author to whom correspondence should be addressed.
Appl. Sci. 2025, 15(2), 705; https://doi.org/10.3390/app15020705
Submission received: 12 December 2024 / Revised: 1 January 2025 / Accepted: 6 January 2025 / Published: 13 January 2025

Abstract

:
With the objective of disaster prevention and the control of geotechnical structures under rainfall environments, an experimental method was adopted to study the mechanical behavior of the geogrid–soil interface. A series of monotonic direct shear tests under different working conditions were carried out to analyze the effects of normal stresses, shear rates and infiltration time on the shear characteristics of the geogrid–soil interface, and to investigate the interaction mechanism of the geogrid–soil interface under rainfall infiltration by means of an independently adapted experimental apparatus to simulate the actual rainfall infiltration situation. The results show that the soil under rainfall infiltration conforms to the Mohr–Coulomb criterion; with the increase in rainfall infiltration time, the peak shear stress at the geogrid–soil interface decreases, and the cohesion and friction angle of the geogrid–soil interface are significantly reduced, and the cohesion decreases by 45.5%, and friction angle decreases by 22.9% when the shear rate is 1.5 mm/min. The research results can provide theoretical and practical guidance for more accurate prediction and response to the effects of rainfall on soil properties in engineering practice. However, the research is only targeted at specific conditions. The variability of geotechnical engineering in aspects such as different soil types, various geosynthetic materials and diverse environmental conditions still needs to be further explored in depth, so as to contribute to the sustainable development of global geotechnical engineering and the effective prevention of disasters.

1. Introduction

Rainfall causes an increase in water in the soil. In the early stages of rainfall, the soil surface absorbs water, causing the water content to increase rapidly. Short-term rainfall may only affect the top layer of the soil; however, when rainfall is heavy or of longer duration, water gradually infiltrates into the deeper layers of the soil, resulting in an increase in the deep soil water content, especially in the case of good soil structure and strong drainage capacity. In actual engineering, earth dams, road embankments, and other fill slopes as well as natural soil slopes may undergo strength damage due to reduced soil stability under overloading, seepage or even heavy rainfall, which may cause natural disasters such as landslides [1,2,3,4].
Reinforced soil structure has good shear strength and seismic performance, and plays an important role in many fields such as retaining walls, foundation treatment, slope protection, and so on [5,6,7,8]. The working principle of reinforced soil is to use the friction between the soil and the reinforcement to transfer the tensile stress in the soil to the reinforcement, which will bear the tensile force, and the soil will bear the soil pressure and shear stress, so that both the reinforcement and the soil in the reinforced soil can play their respective roles well. The shear strength of the geogrid–soil interface is a crucial indicator, and the problem of soil strength is essentially the problem of shear strength. The direct shear test is a common test methods for assessing the shear strength of the geogrid–soil interface.
There are many studies on the mechanical behavior of the geogrid–soil interface, mainly focusing on the type and compactness of the soil, the characteristics and arrangements of the reinforcement, and the methods and conditions of the test. Morsy et al. [9,10] studied the interaction between reinforcement and soil under different vertical spacing, normal stress, and tensile strain of reinforcement through experiments. It was found that the influence of normal stress on the active load transfer can be neglected, but when the active load is large, the decrease in normal stress will reduce the transfer amount. In addition, the change in lateral earth pressure is proportional to the vertical spacing and the tensile strain of reinforcement, and is inversely proportional to the vertical stress, and the normal stress will affect the thickness of the shear zone. Sayão et al. [11] found that the inclination angle of the reinforcement had a significant effect on the strength of the soil body, and the strength of the soil body was at its maximum when the inclination angle of the geogrid arrangement was at 60°. Nhema et al. [12] analyzed the effects of discrete fiber strips on the mechanical properties of reinforced sandy soils by means of a series of isotropic direct shear tests in which the initial orientation of the fiber strips was strictly controlled. Infante et al. [13] found that the shear strength of geogrid-reinforced specimens was generally better than that of geotextile-reinforced specimens. Makkar et al. [14] compared and analyzed the effect of triangular and rectangular forms of reinforcement on interfacial shear strength, and found that 3D geogrid-reinforced soils possessed higher interfacial shear strength than un-reinforced and planar geogrid-reinforced soils. Linhares et al. [15] conducted a parametric study on different combinations of additional load width, wall height, compaction-induced stress (CIS), and wall inclination. The results show that the maximum reinforcement load and lateral displacement of the GRS wall are different under different combinations. Liu et al. investigated the effects of particle shape, particle size ratio, concrete surface roughness, moisture content and displacement amplitudes on the cyclic shear characteristics of reinforced soil interface [16,17,18,19,20].
The widespread use of reinforcement in engineering practice has shown that they are essential for improving the soil properties under actual working conditions. The effect of rainfall on soil is mainly reflected in the change in moisture content. Therefore, an in-depth study of soil moisture content is important for soil prevention and control under rainfall. Ferreira et al. [21] found that an increase in soil moisture content can significantly reduce the shear strength of the reinforced soil interface. Vieira et al. [22] studied the interface characteristics of building demolition waste as a filler material for reinforced structures. It was found that the interfacial shear strength between it and geosynthetics after proper compaction was affected by water content, and high-water content would lead to a decrease in strength. Ensani et al. [23] studied the interfacial shear strength of five geosynthetics in marginal clay sand under different water contents through large-scale direct shear tests. The results show that compared with the optimal water content, the cohesion and internal friction angle decrease significantly when the water content increases by 6%. Namjoo et al. [24] found that the interfacial friction angle and friction force of the specimens increased with decreasing moisture content by using the direct shear test and pullout test, respectively.
The results of the studies show that the moisture content of soil has a significant effect on its shear strength, and with the increase in the moisture content, the cohesion and internal friction angle decrease. However, most of the above studies focused on the strength performance of soil under fixed moisture content, and there is a lack of studies on the dynamic change in moisture content. It is not known whether the change trend of cohesion and internal friction angle under rainfall infiltration conditions is consistent with the existing conclusions. At the same time, most of the current studies focus on the influence of a single factor on the mechanical behavior of the reinforced soil interface. However, in practical engineering, the reinforced soil structure is often in a complex multi-factor coupling environment. This raises the question of how to accurately analyze the effect of rainwater infiltration on the shear strength of soil during rainfall. In order to more realistically simulate the effect of rainfall infiltration on soil properties, this paper simulates natural rainfall through a series of large indoor direct shear tests, monitors the change in soil moisture content in real time, investigates the moisture content at different time points and different soil depths, analyzes the shear strength of soil under dynamic moisture content, and explores the interaction mechanism of the geogrid–soil interface under rainfall infiltration, so as to provide a more accurate theoretical basis and practical guidance for slope stability evaluation and reinforced soil structure design under the change in the moisture content of soil in practical engineering, and promote the development of this field to be more in line with the actual working conditions.

2. Materials and Methods

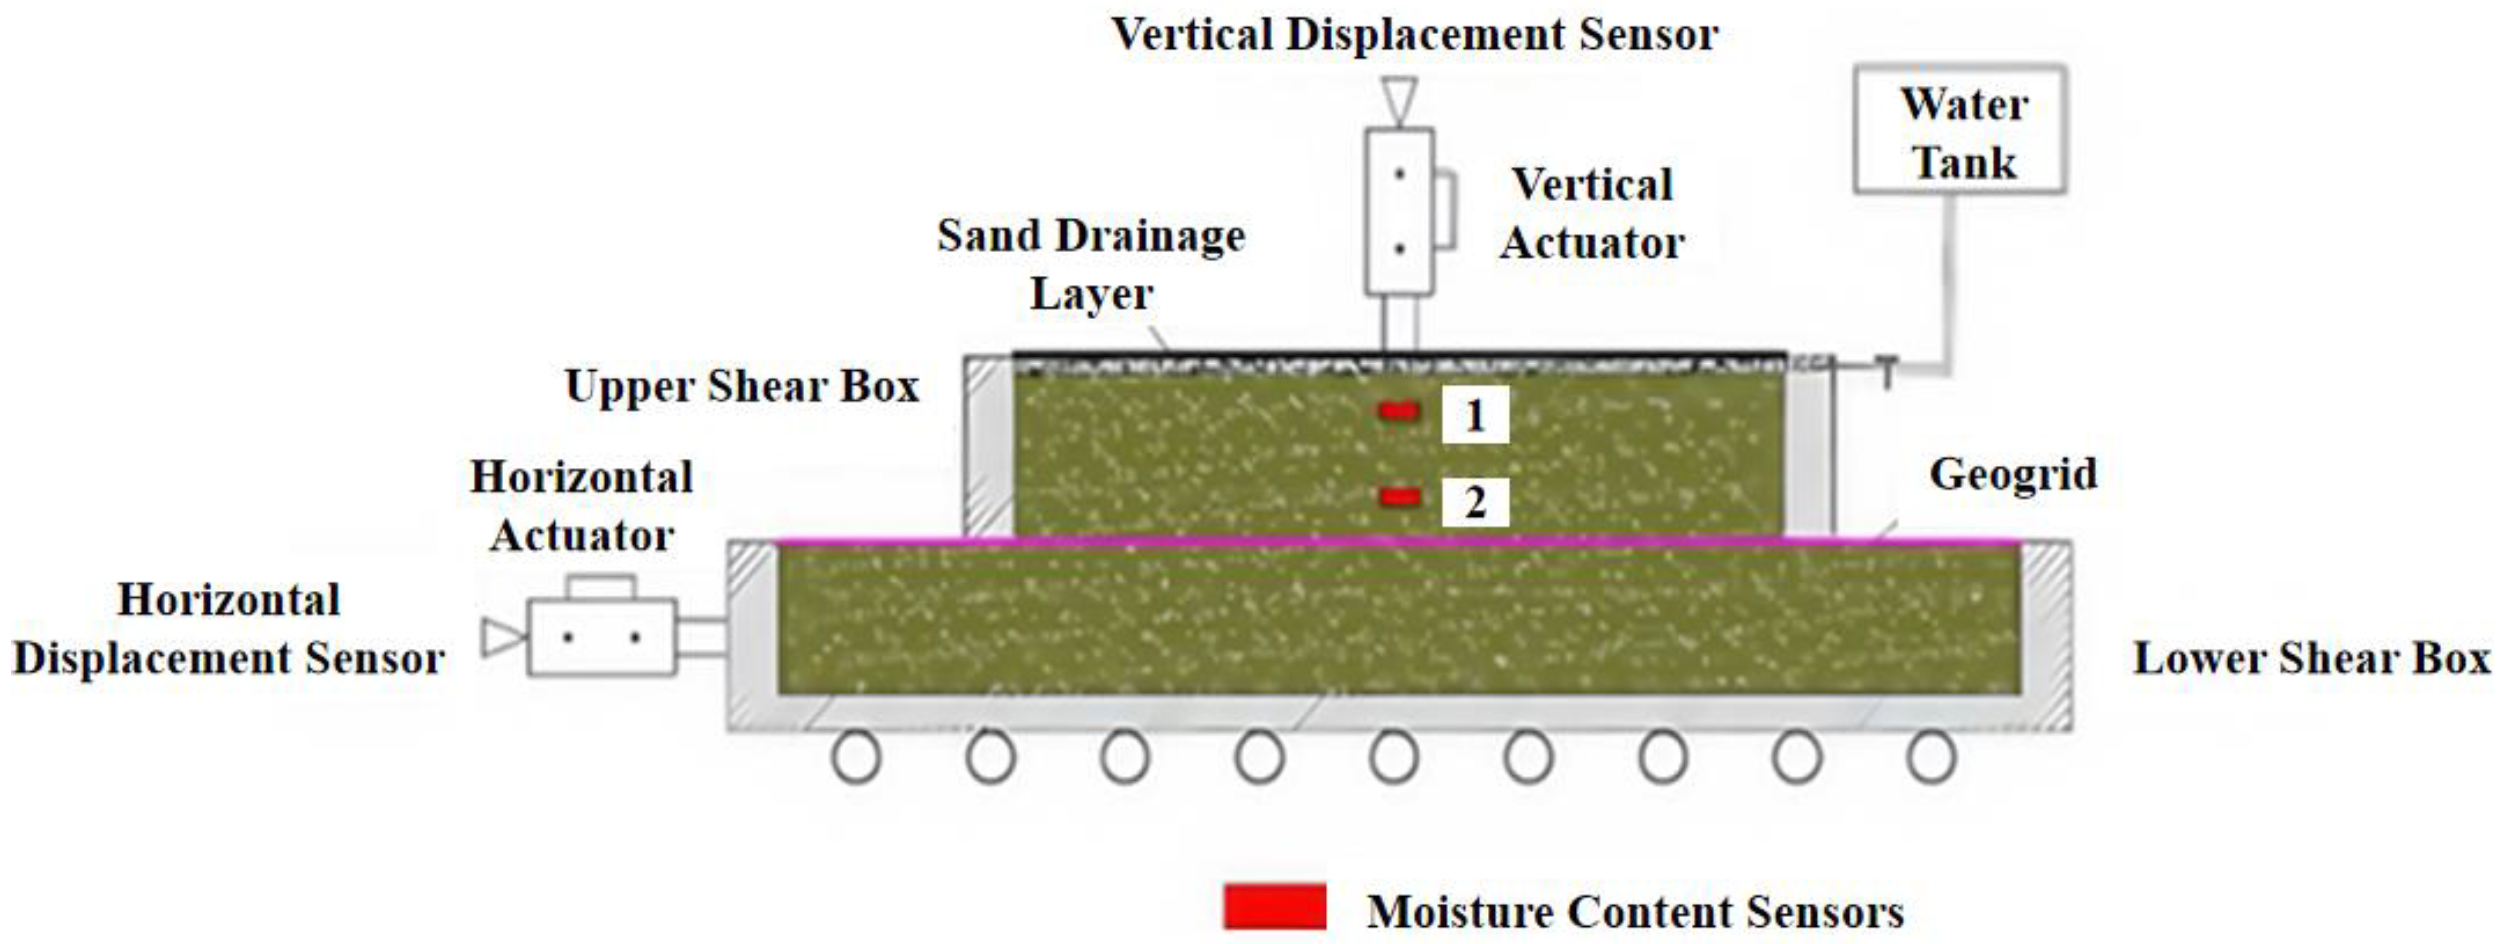
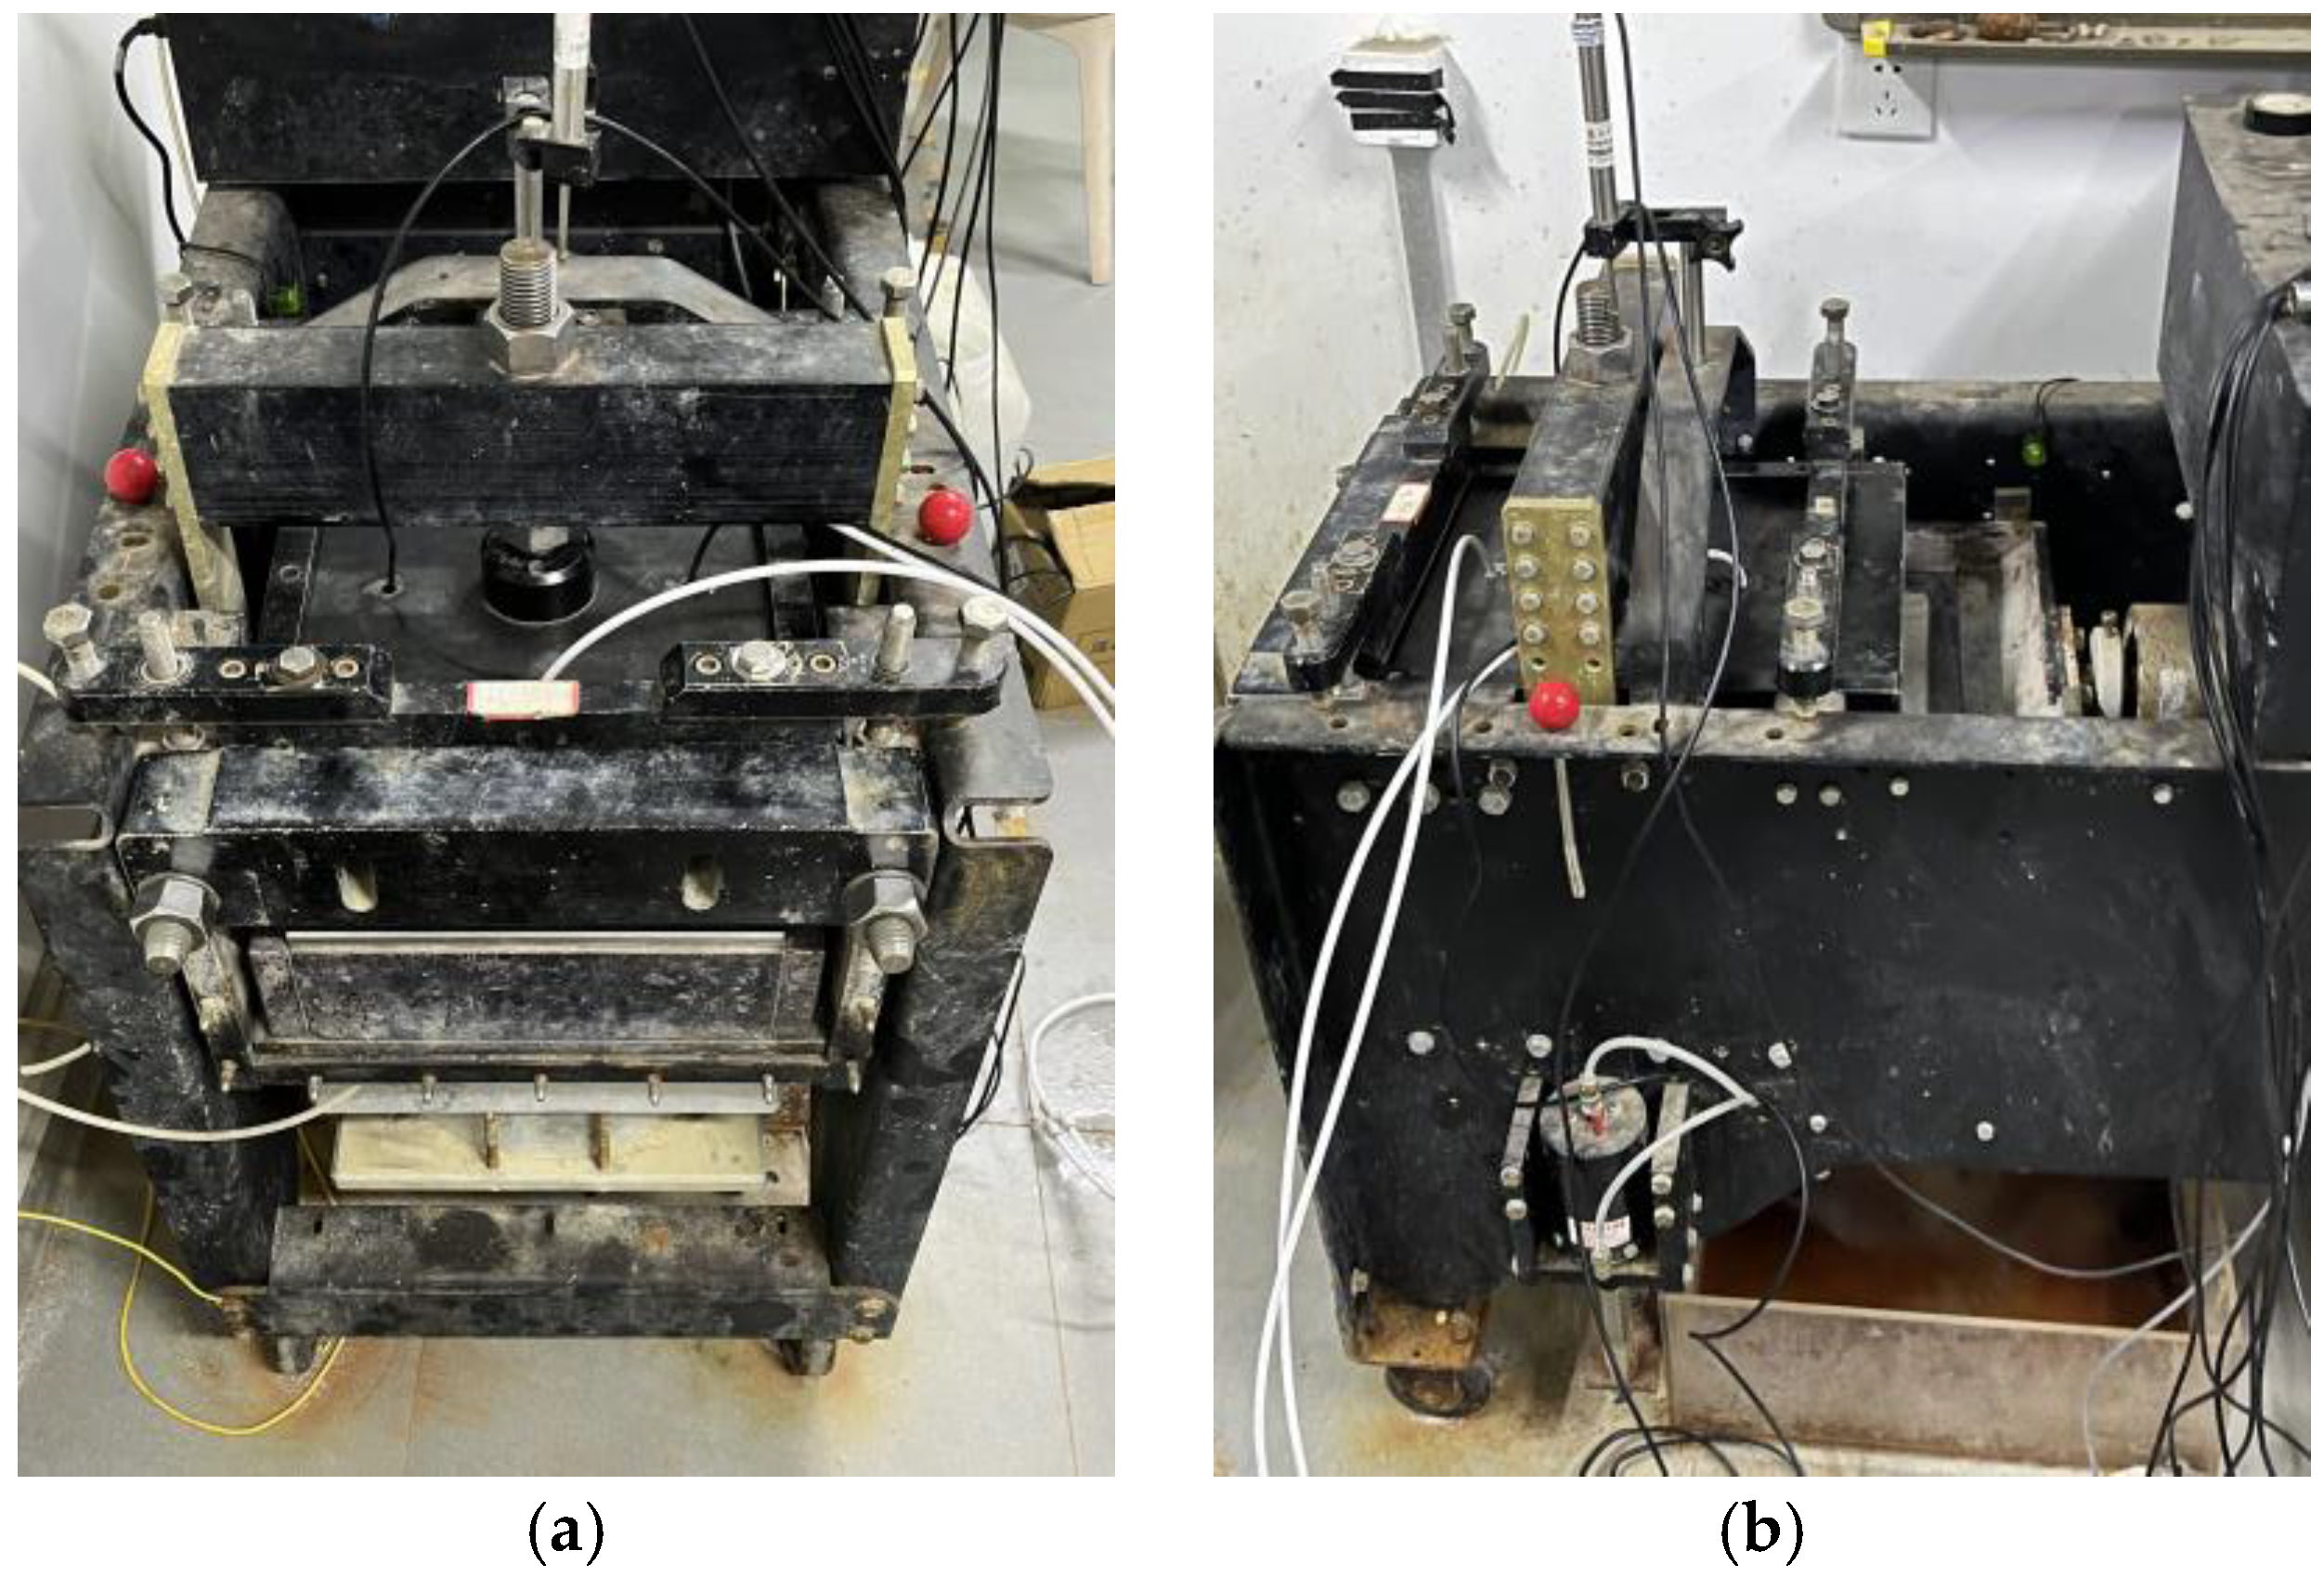
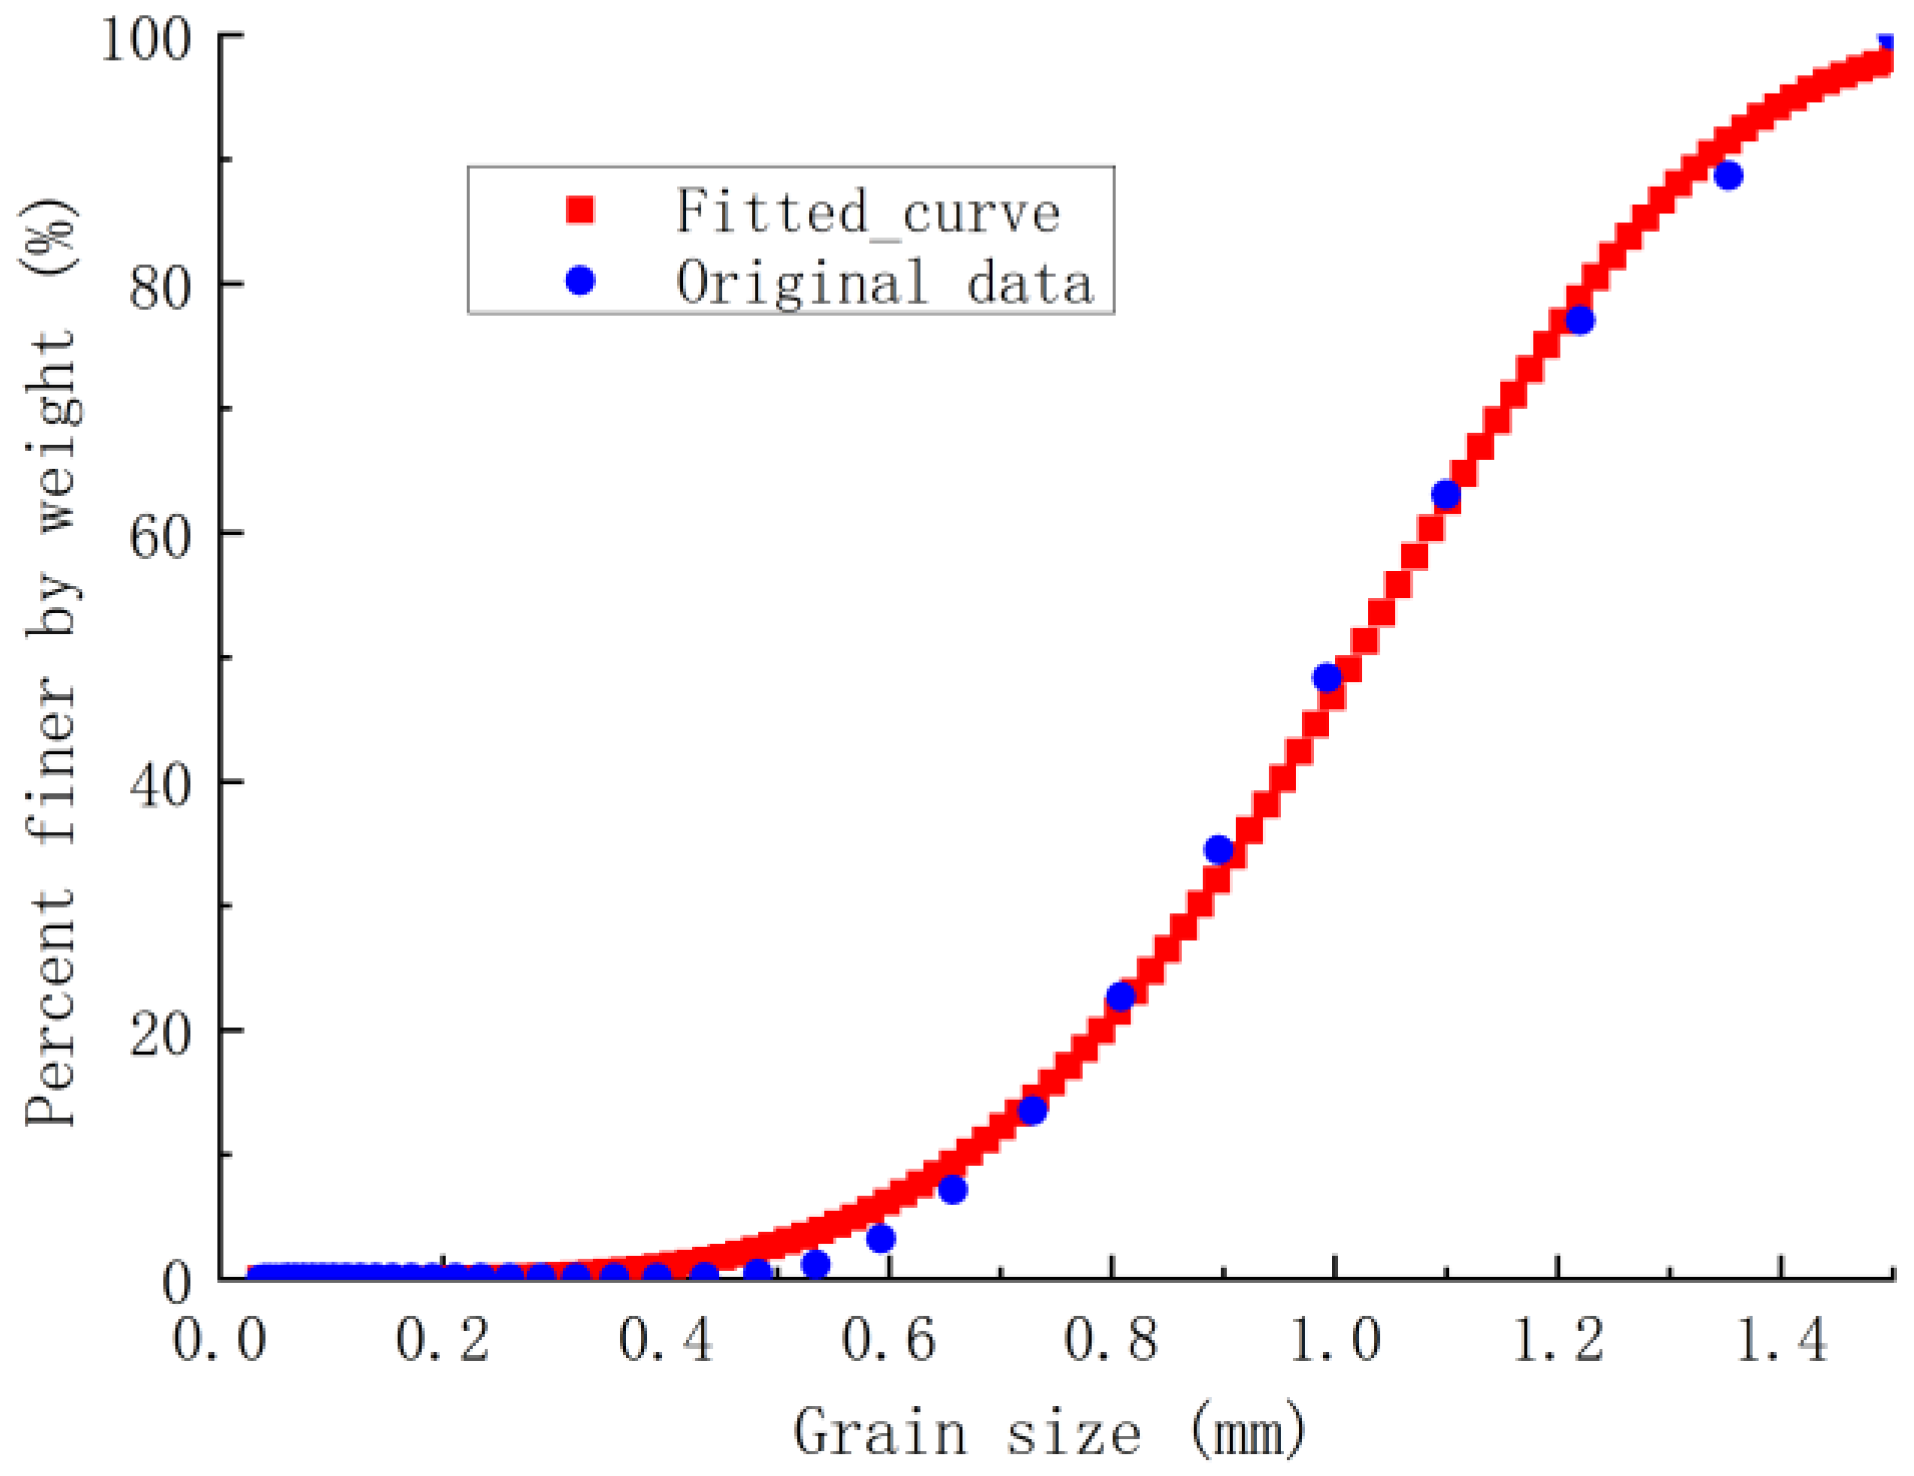
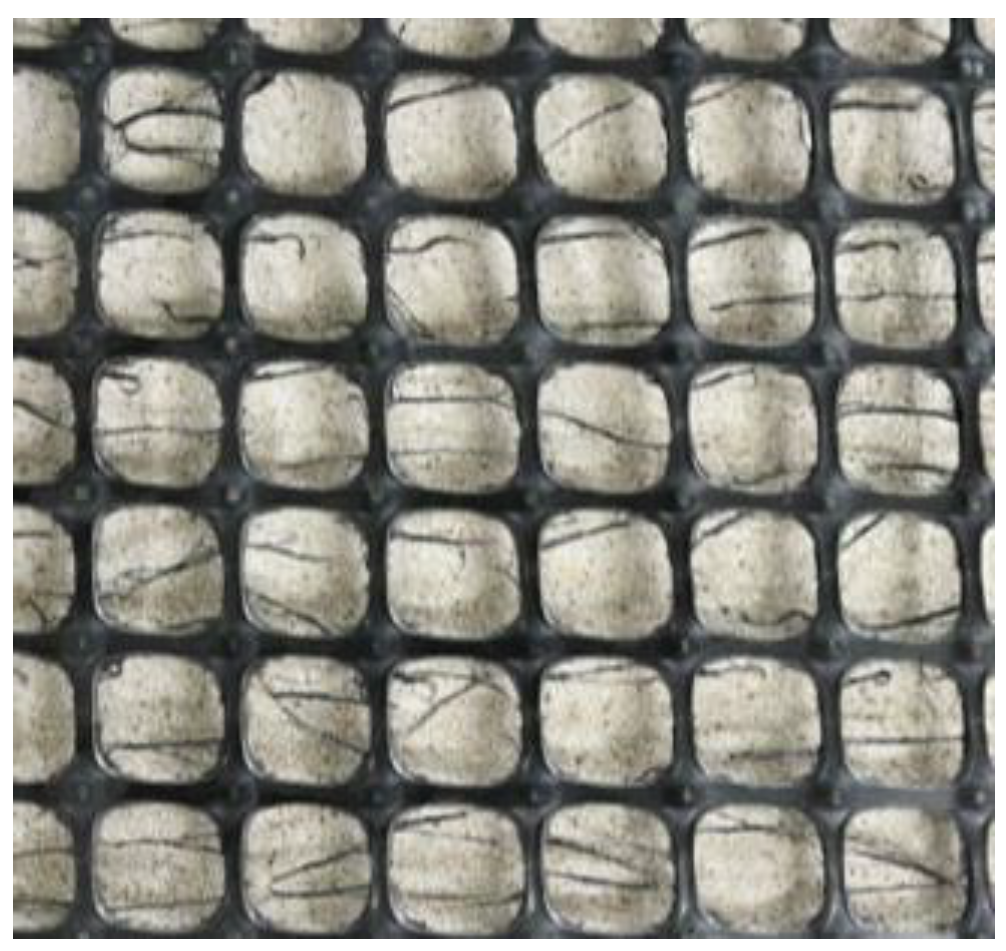
2.1. Apparatus and Materials

This test used HUMBOLDT, which was a large multifunctional direct shear apparatus, to simulate the monotonic direct shear test under rainfall infiltration with a modified loading plate. The main technical indicators are shown in Table 1. The apparatus consisted of a vertical displacement sensor, a horizontal displacement sensor, an upper shear box, a lower shear box, a water tank, and a sand drainage layer, which was capable of conducting direct shear tests under both strain and stress control conditions, with strain control conditions used for this test.
To ensure a uniform distribution of water over the soil surface, a thin drainage layer was placed below the normal loading plate, and the magnitude of the infiltration rate was controlled by measuring the output volumetric flow rate in the water pipe. A set of vertical moisture content sensors was installed inside the soil to obtain moisture content profiles to evaluate the permeability and interfacial hydraulic characteristics of the geogrid reinforcement system. In this regard, the moisture content sensors, from top to bottom, were the moisture content sensor 1 and the moisture content sensor 2. Moisture content sensor 1 measured the dynamic moisture content at 30 mm above the geogrid–soil interface, and moisture content sensor 2 measured the dynamic moisture content at 10 mm above the interface. A diagram of the equipment setup is shown in Figure 1, and the actual test equipment pictures are shown in Figure 2.
The particle shape, size distribution, and physicochemical properties of standard quartz sand are relatively stable and uniform. Compared with other natural soils, its reactions in processes such as rainfall infiltration are easier to study and analyze, which enables the better control of variables and reduces errors caused by differences in the properties of the soil itself during experimental research. Since this experiment required a large number of soil samples for multiple repeated tests, considering the availability and cost of test materials, Fujian standard quartz sand was finally selected as the test soil. The grain size distribution curve is shown in Figure 3, and its physical property indexes are shown in Table 2.
Polypropylene geogrid has good tensile strength and deformation resistance. Throughout the country, whether in road engineering or water conservancy projects, polypropylene geogrid is a commonly used geosynthetic material. The geogrid selected in this paper was the Hubei Lite polypropylene geogrid. This brand has an excellent reputation in the market, and its product quality has been tested and meets the requirements of the research for the stability of material quality. This means that during multiple tests, its own performance fluctuates less, which is beneficial for accurately studying the mechanical behavior of the soil-reinforcement interface. Its specific pattern is shown in Figure 4.

2.2. Methods

The purpose of this test is to study the changing law of interface characteristics of geogrid–soil under different normal stresses, shear rates and infiltration time. The total number of trial groups is 42. The specific test schemes are shown in Table 3.
Referring to [25], the shear displacement in the direct shear test was set to 50 mm, the shear rate was taken as 1.0 mm/min, 1.2 mm/min, 1.5 mm/min, 2.0 mm/min. In order to further explore the destructive effect of rainfall on soil strength, according to the classification standard of rainfall intensity issued by the National Meteorological Administration, the rainfall intensity simulated in this experiment was 120 mm/h, which belongs to the heavy rainstorm intensity level. When filling the soil sample of the shear box, with layer-compacting, the upper and lower shear box were divided into 5 layers, and the soil samples were compacted into the shear box with 2 cm per layer. The quality of each layer was controlled to be the same, to ensure that the samples were uniform and the dry density reached 1.435 g/cm3. After the soil sample was filled and the shear box was fixed, the normal stress was slowly applied to the set value. After the deformation of the soil sample was stable and the vertical load was constant, the water head switch was turned on to simulate rainfall infiltration. When the infiltration time reached the specified time, the normal stress was set to 50 kPa, 100 kPa, and 150 kPa, respectively, and the sample was sheared. The test data were automatically read and recorded by the onboard software.

3. Results and Discussion

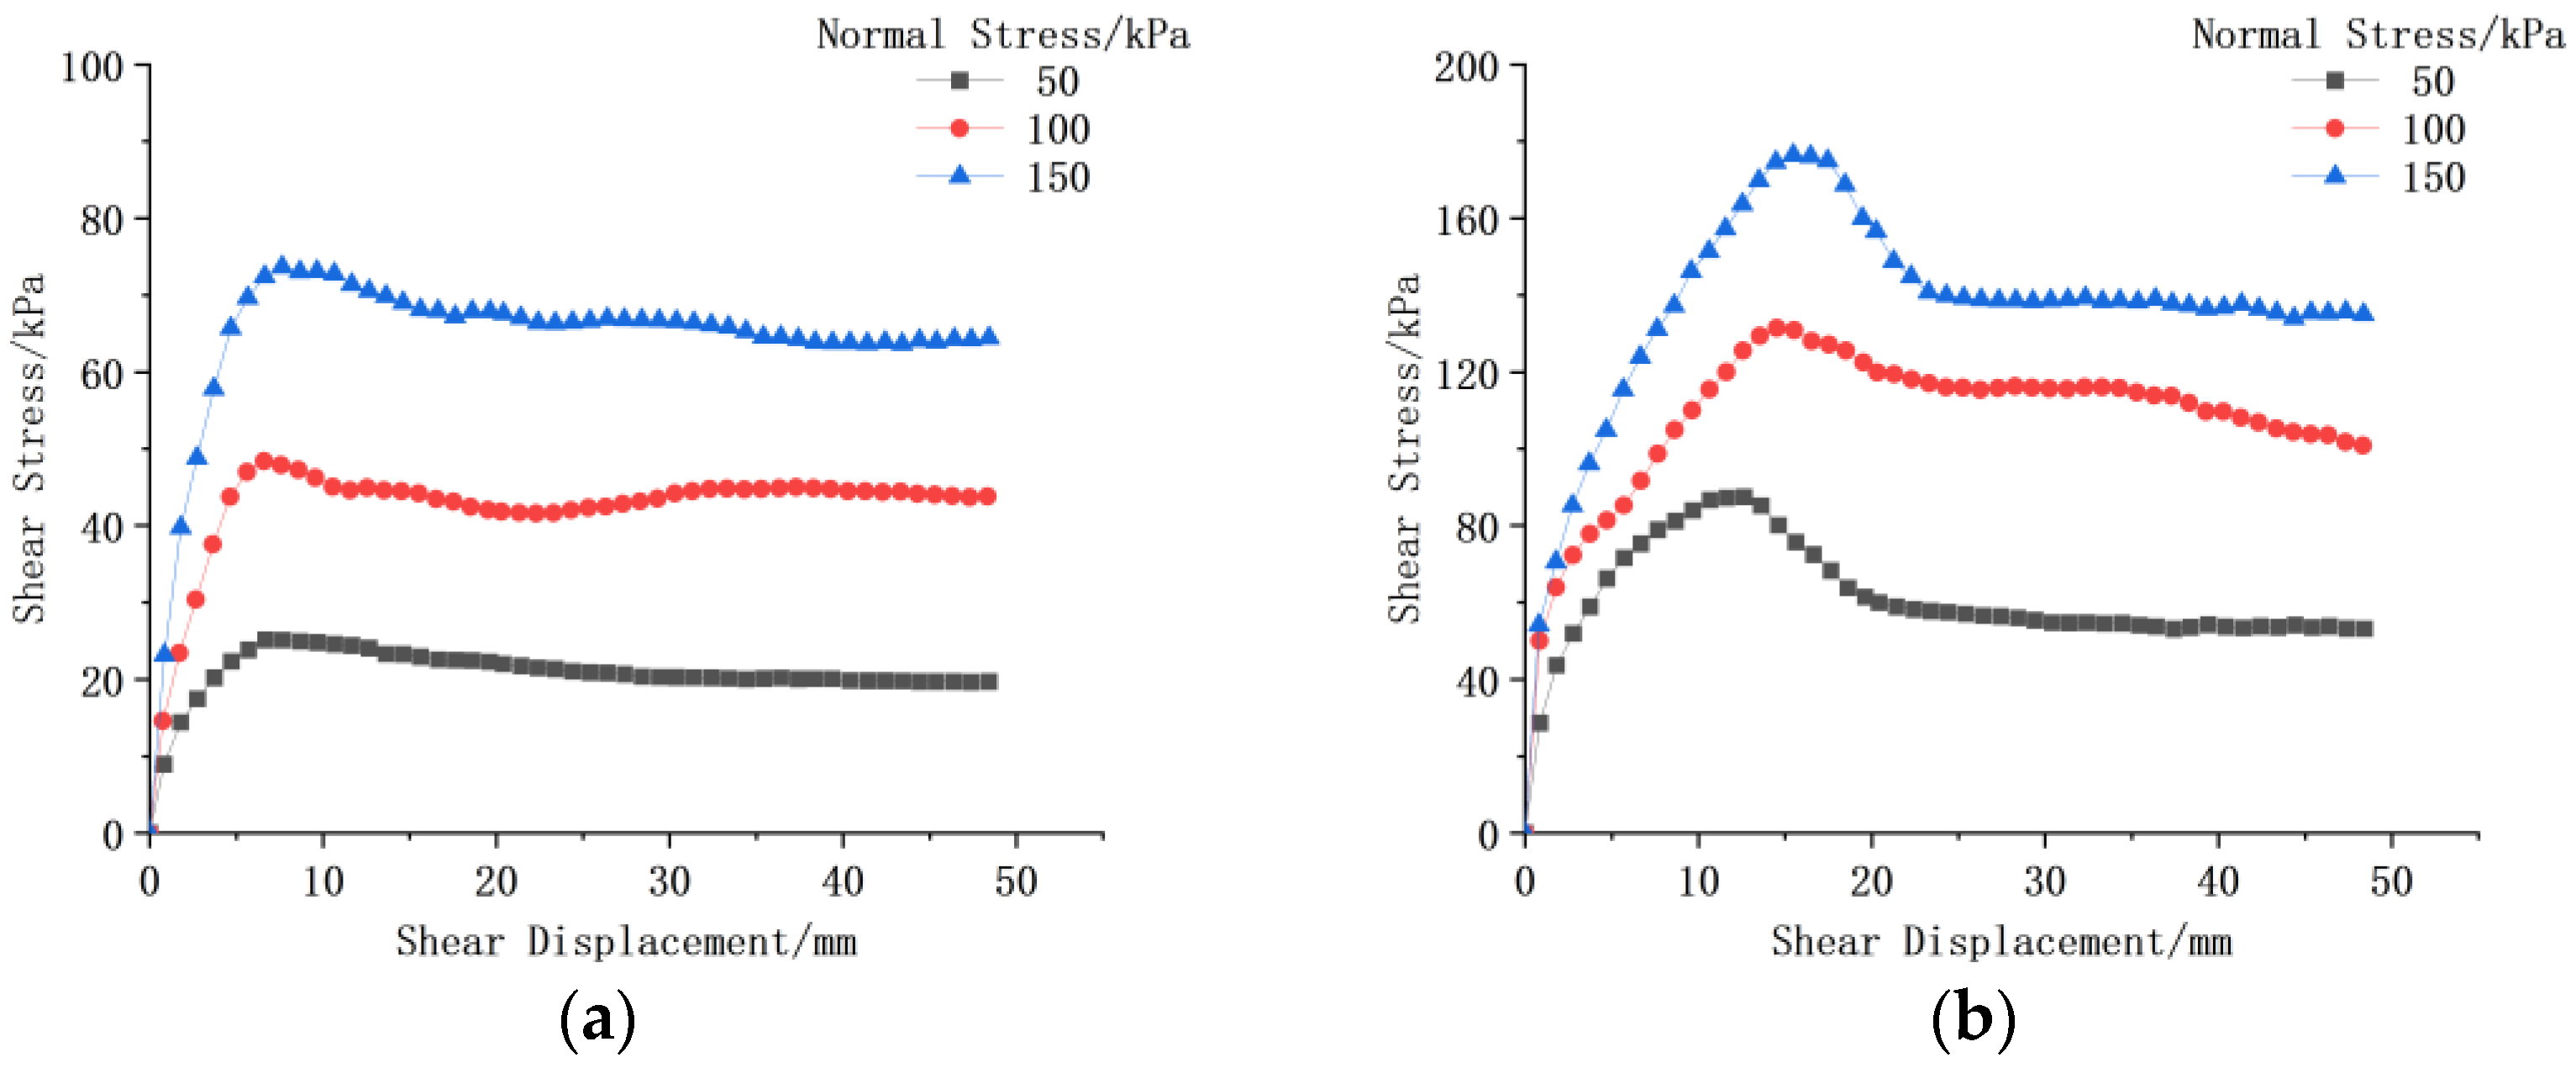
3.1. Effect of Normal Stresses on Geogrid–Soil Interface Characteristics

Taking the test results at the shear rate of 1.0 mm/min as an example, the shear stress-shear displacement relationship curves under three distinct normal stresses are presented in Figure 5.
From Figure 5, the following observations can be made: 1. regardless of the working conditions, a higher normal stress leads to a greater peak shear stress at the geogrid–soil interface. 2. Separate shear tests were conducted for unreinforced sand and geogrid–reinforced soil. The shear stress of the unreinforced sand (Figure 5a) exhibits a continuous increase as the shear process progresses. When the shear displacement reaches approximately 10 mm, the shear stress tends to stabilize, and the specimen enters the plastic deformation stage without a prominent peak. In contrast, the relationship between shear stress and shear displacement for the geogrid-reinforced soil (Figure 5b–e) demonstrates a nonlinear rapid growth. When the shear displacement exceeds 10 mm, the shear stress–shear displacement curves under the three different normal stresses display more conspicuous peaks. Moreover, after reaching the peak, there is a downward segment followed by a tendency to level off, indicating varying degrees of shear softening. This phenomenon occurs because, during the shearing process, the sliding of soil particles induces the deformation of the geogrid, and when the shear displacement exceeds the yield point, the twisting deformation of the geogrid reaches its limit, thereby reducing the shear capacity of the tendon–soil interface. 3. Comparing Figure 5a and Figure 5b reveals that the shear strength of geogrid-reinforced sand is notably enhanced compared to that of unreinforced sand. Additionally, comparing Figure 5b–e indicates that the peak shear stress at the geogrid–soil interface diminishes with the increase in infiltration time during rainfall infiltration, highlighting the detrimental effect of the rainfall on the strength of the soil. Overall, even when affected by rainfall infiltration, at a shear rate of 1.0 mm/min, the peak shear stress at the geogrid–soil interface remains greater than that of the unreinforced soil. Hence, it can be hypothesized that under certain working conditions, the reinforcing effect of the geogrid reinforcement will outweigh the weakening effect of rainfall infiltration on the shear strength.
Figure 6 depicts the dynamic moisture content–shear displacement curves for different working conditions at normal stresses of 50 kPa, 100 kPa, and 150 kPa, respectively. From this figure, that the following is evident: 1. The dynamic moisture content of the soil, as measured by the moisture content sensors placed at two different depths, increases with the increase in the shear displacement and exhibits a gradual stabilization trend. 2. When the normal stresses are 50 kPa, 100 kPa, and 150 kPa, respectively, the final moisture content measured by moisture content sensor 1 (located 30 mm above the interface) in Figure 6a is 15.0%, 15.3%, and 15.4%, respectively, and the final moisture content measured by moisture content sensor 2 (located 10 mm above the interface) is 17.3%, 17.7%, and 18.7%, respectively. By comparing the two different depth conditions, it can be observed that the closer the moisture content sensor is to the shear surface (i.e., the deeper the rainfall infiltration depth), the higher the final moisture content of the soil. The curves obtained from other conditions are consistent, which is attributable to the limitations of the test conditions that prevent the water in the soil samples from being discharged, resulting in water accumulation within the shear box, and a slightly higher final moisture content in the lower soil samples compared to the upper ones. 3. When the infiltration time is 30 min, the final moisture content measured by moisture content sensor 2 in Figure 6c is 20.3%, 20.6%, and 20.7%, respectively, and that measured by moisture content sensor 2 in Figure 6d is 21.4%, 21.6%, and 21.1%, respectively. Upon comparison, it is found that the final moisture content at a shear rate of 1.0 mm/min is slightly higher than that at a shear rate of 1.5 mm/min. This is because a slower shear rate leads to a longer overall shearing process, allowing more rainwater to infiltrate under the same rainfall conditions, which is macroscopically manifested as higher moisture content values measured by the moisture content sensor.
Based on the analysis of the above test results, it can be concluded that the moisture gradient, where the moisture content of the lower soil layer is higher than that of the upper soil layer, has multiple implications for the geotechnical behavior. In terms of shear strength, a higher moisture content reduces the shear strength. Due to the high moisture content in the lower soil layer, the friction and interlocking forces between particles are diminished. When subjected to shear forces, the lower soil layer may be more prone to relative displacement compared to the upper soil layer. For instance, in the context of slope stability, this moisture gradient may cause the soil at the lower part of the slope to exhibit a tendency to slide first, thereby increasing the risk of slope instability. In terms of compressibility, as water occupies the voids between soil particles, the lower soil layer with a high moisture content is more susceptible to compression under pressure. When an external load is applied, the compressive deformation of the lower soil layer may be greater than that of the upper soil layer, resulting in uneven settlement of the ground. From the perspective of permeability, the presence of the moisture gradient causes water to tend to migrate from the lower layer with a high moisture content to the upper layer with a low moisture content. This water migration can alter the pore structure and particle arrangement of the soil, subsequently affecting the overall permeability of the soil.

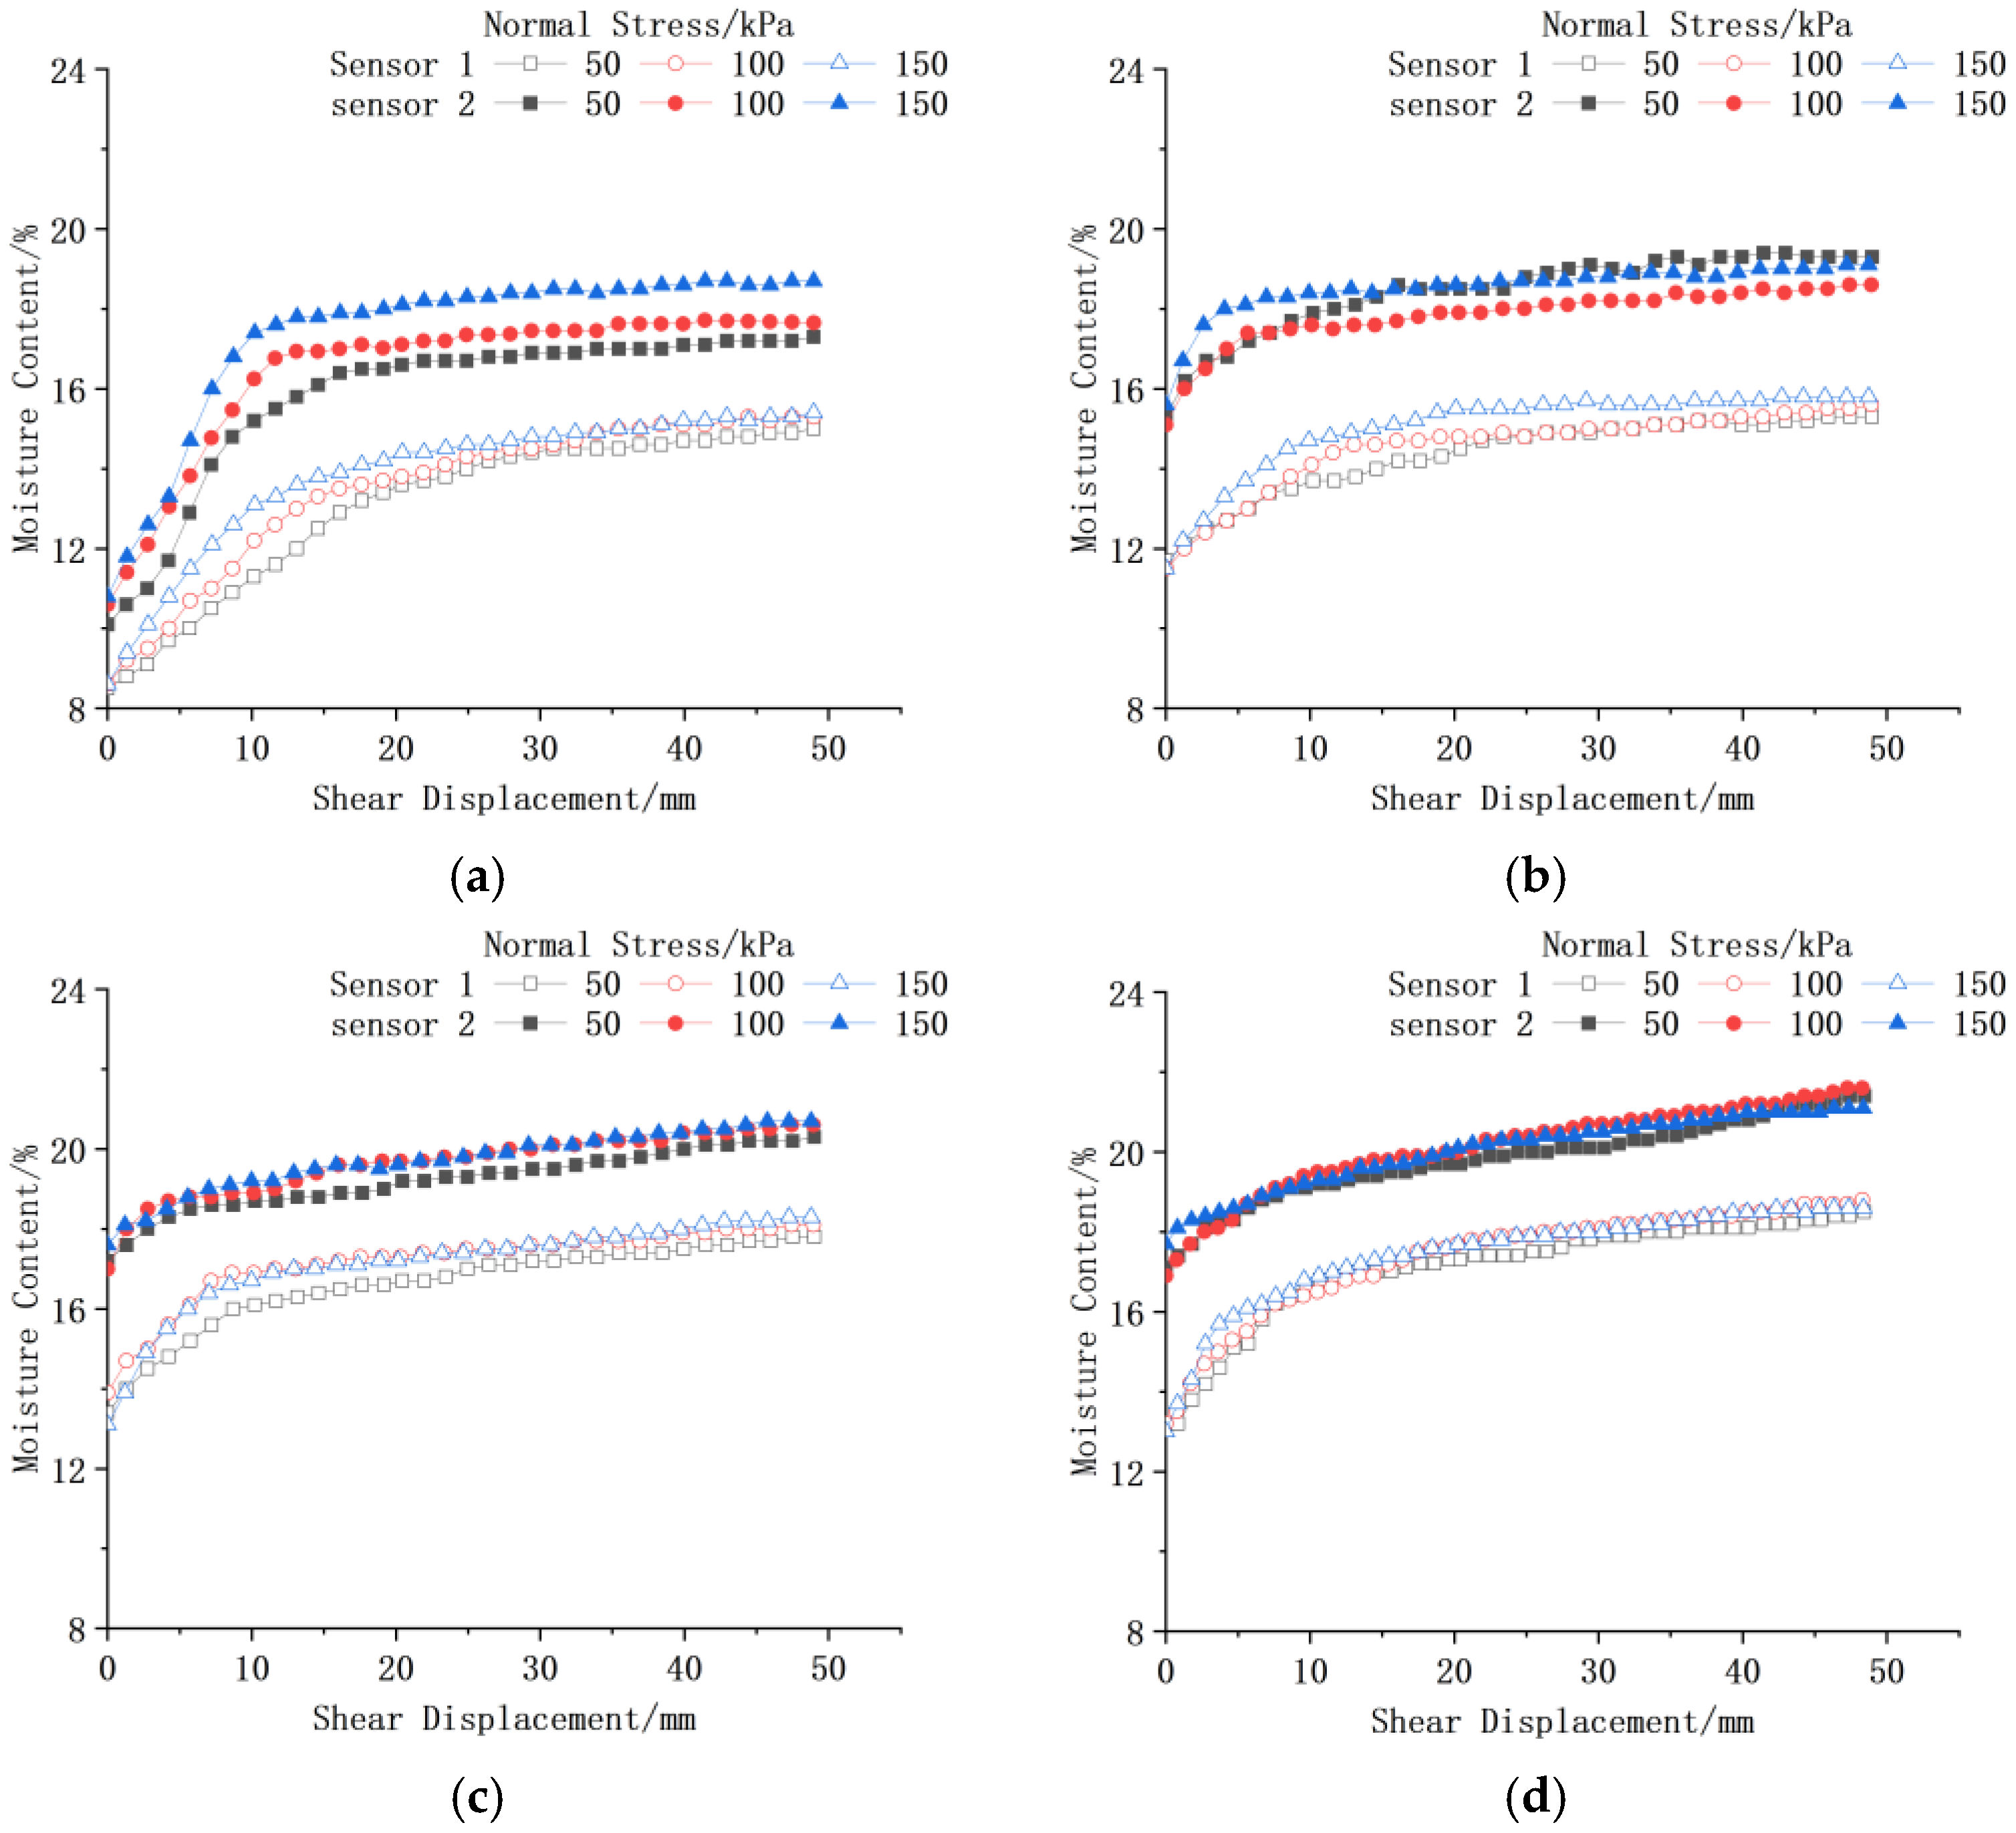
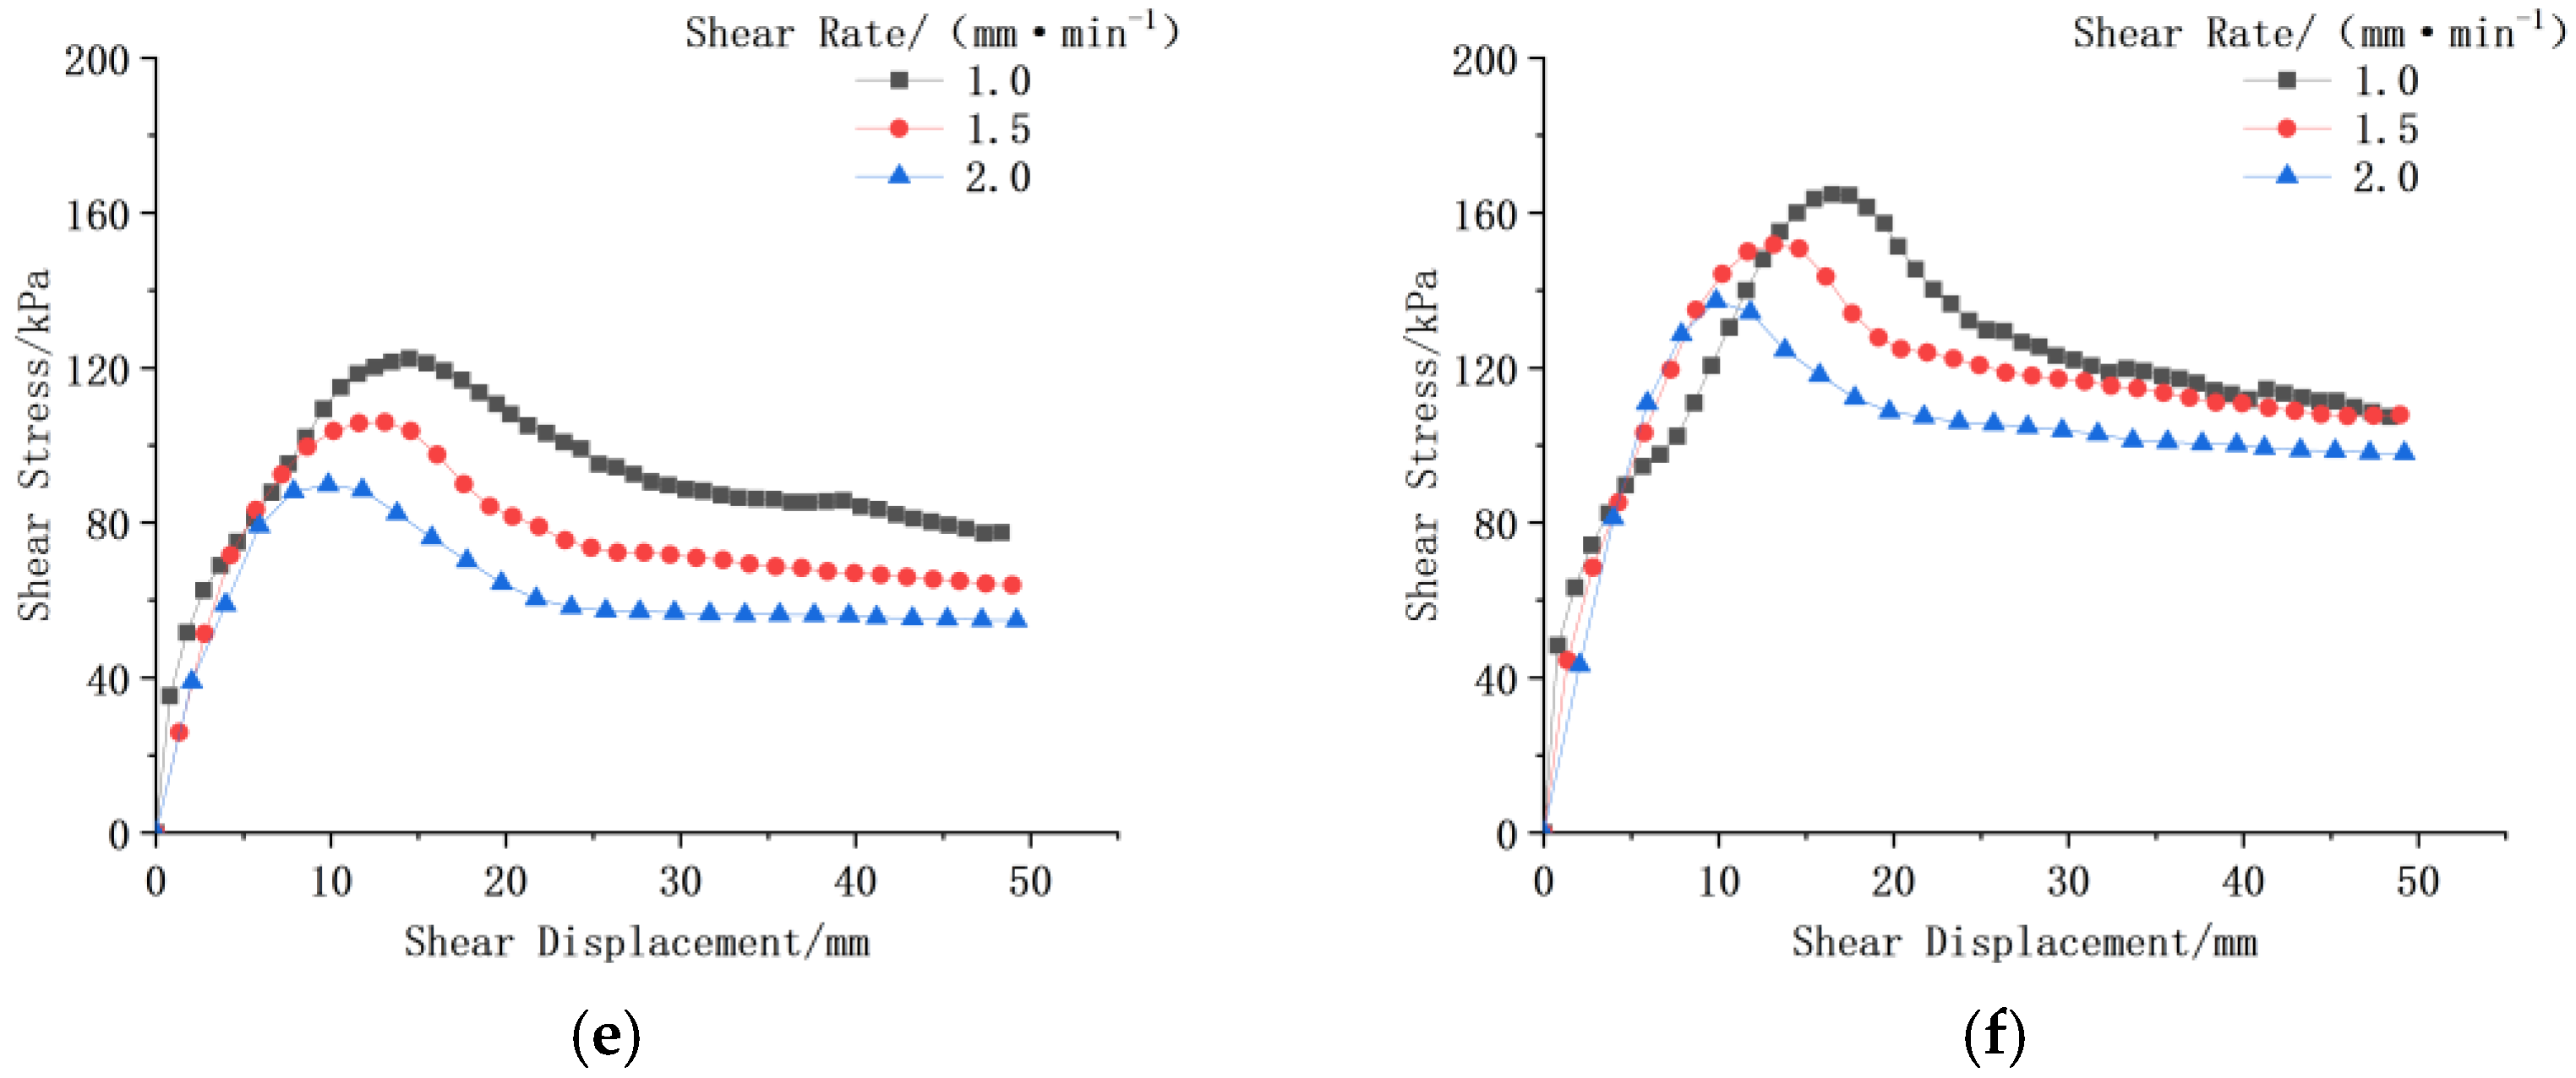
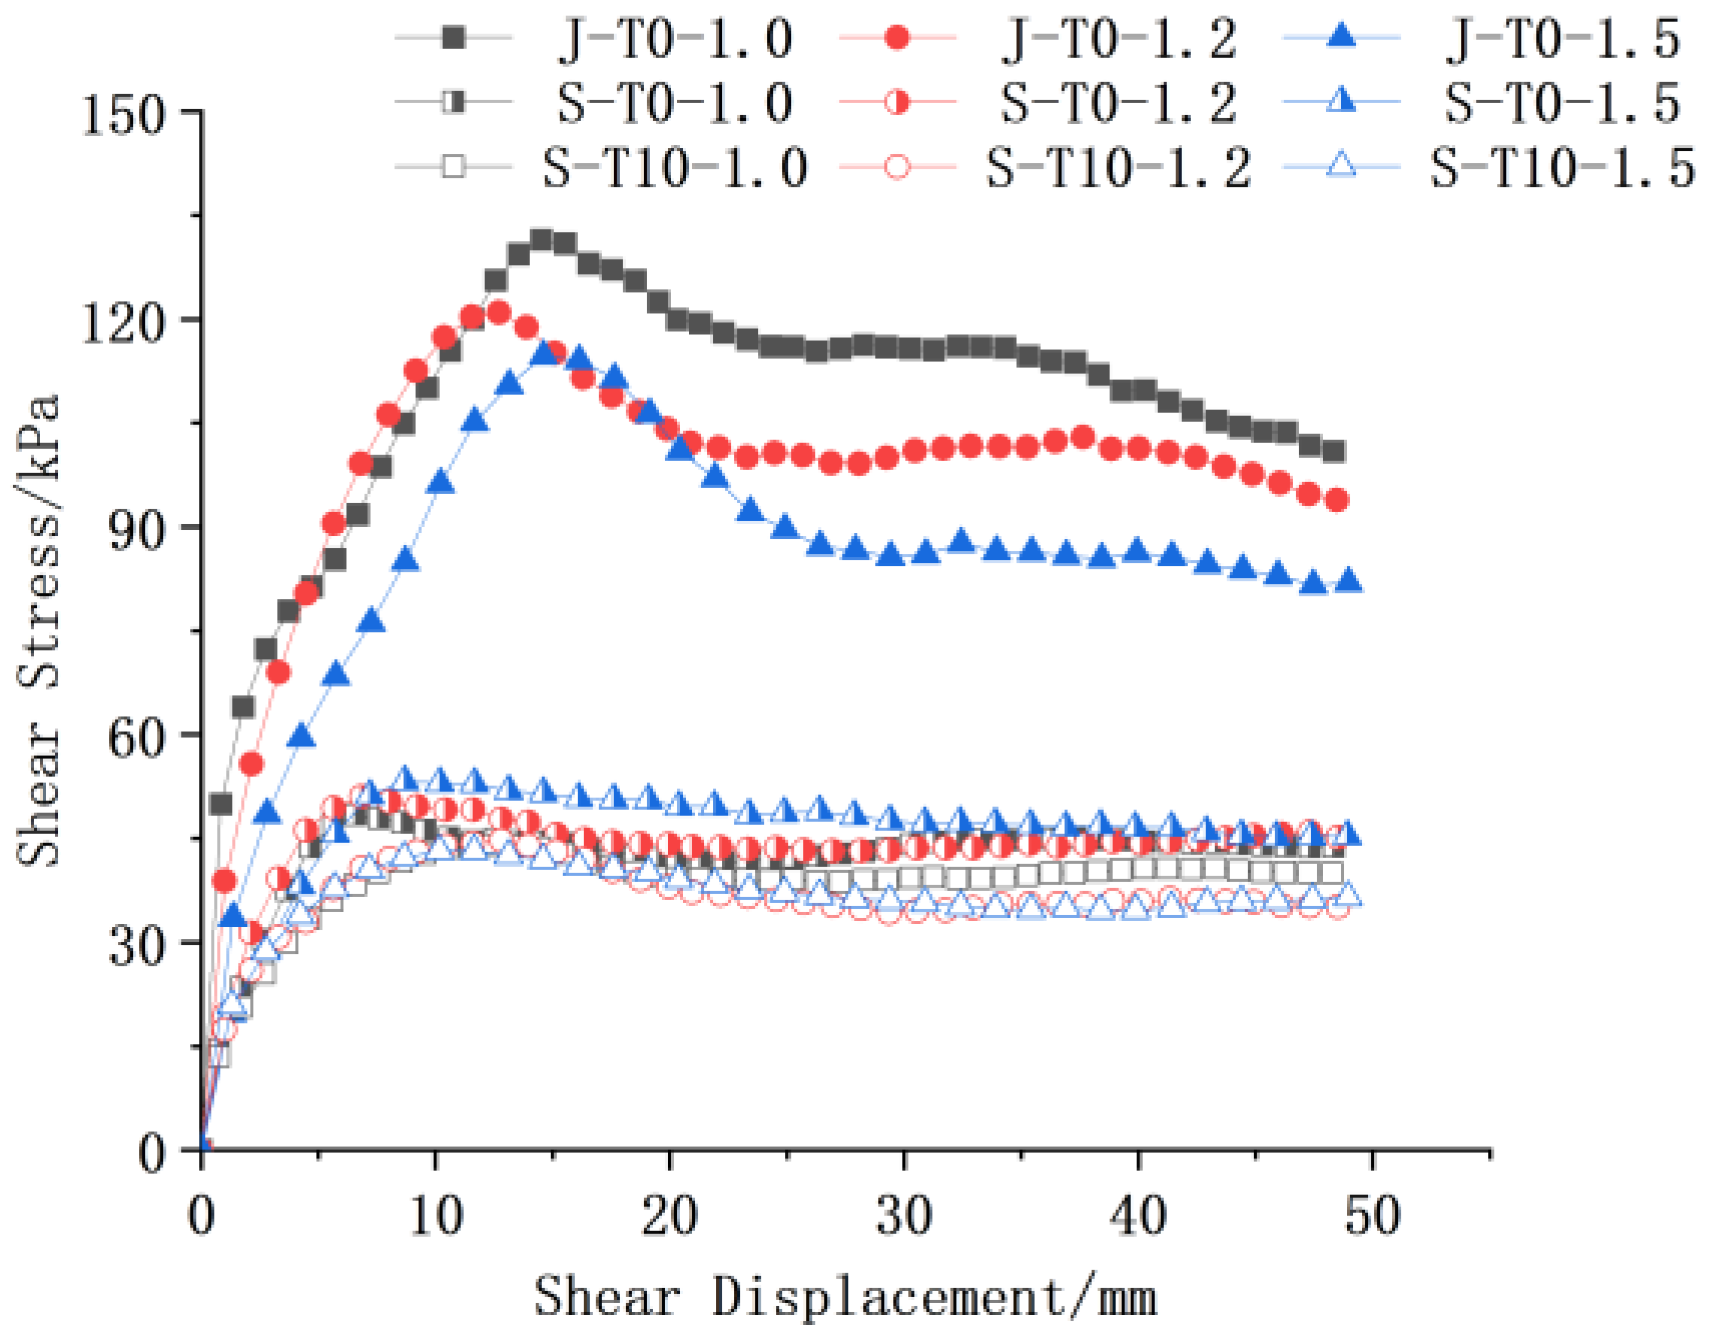
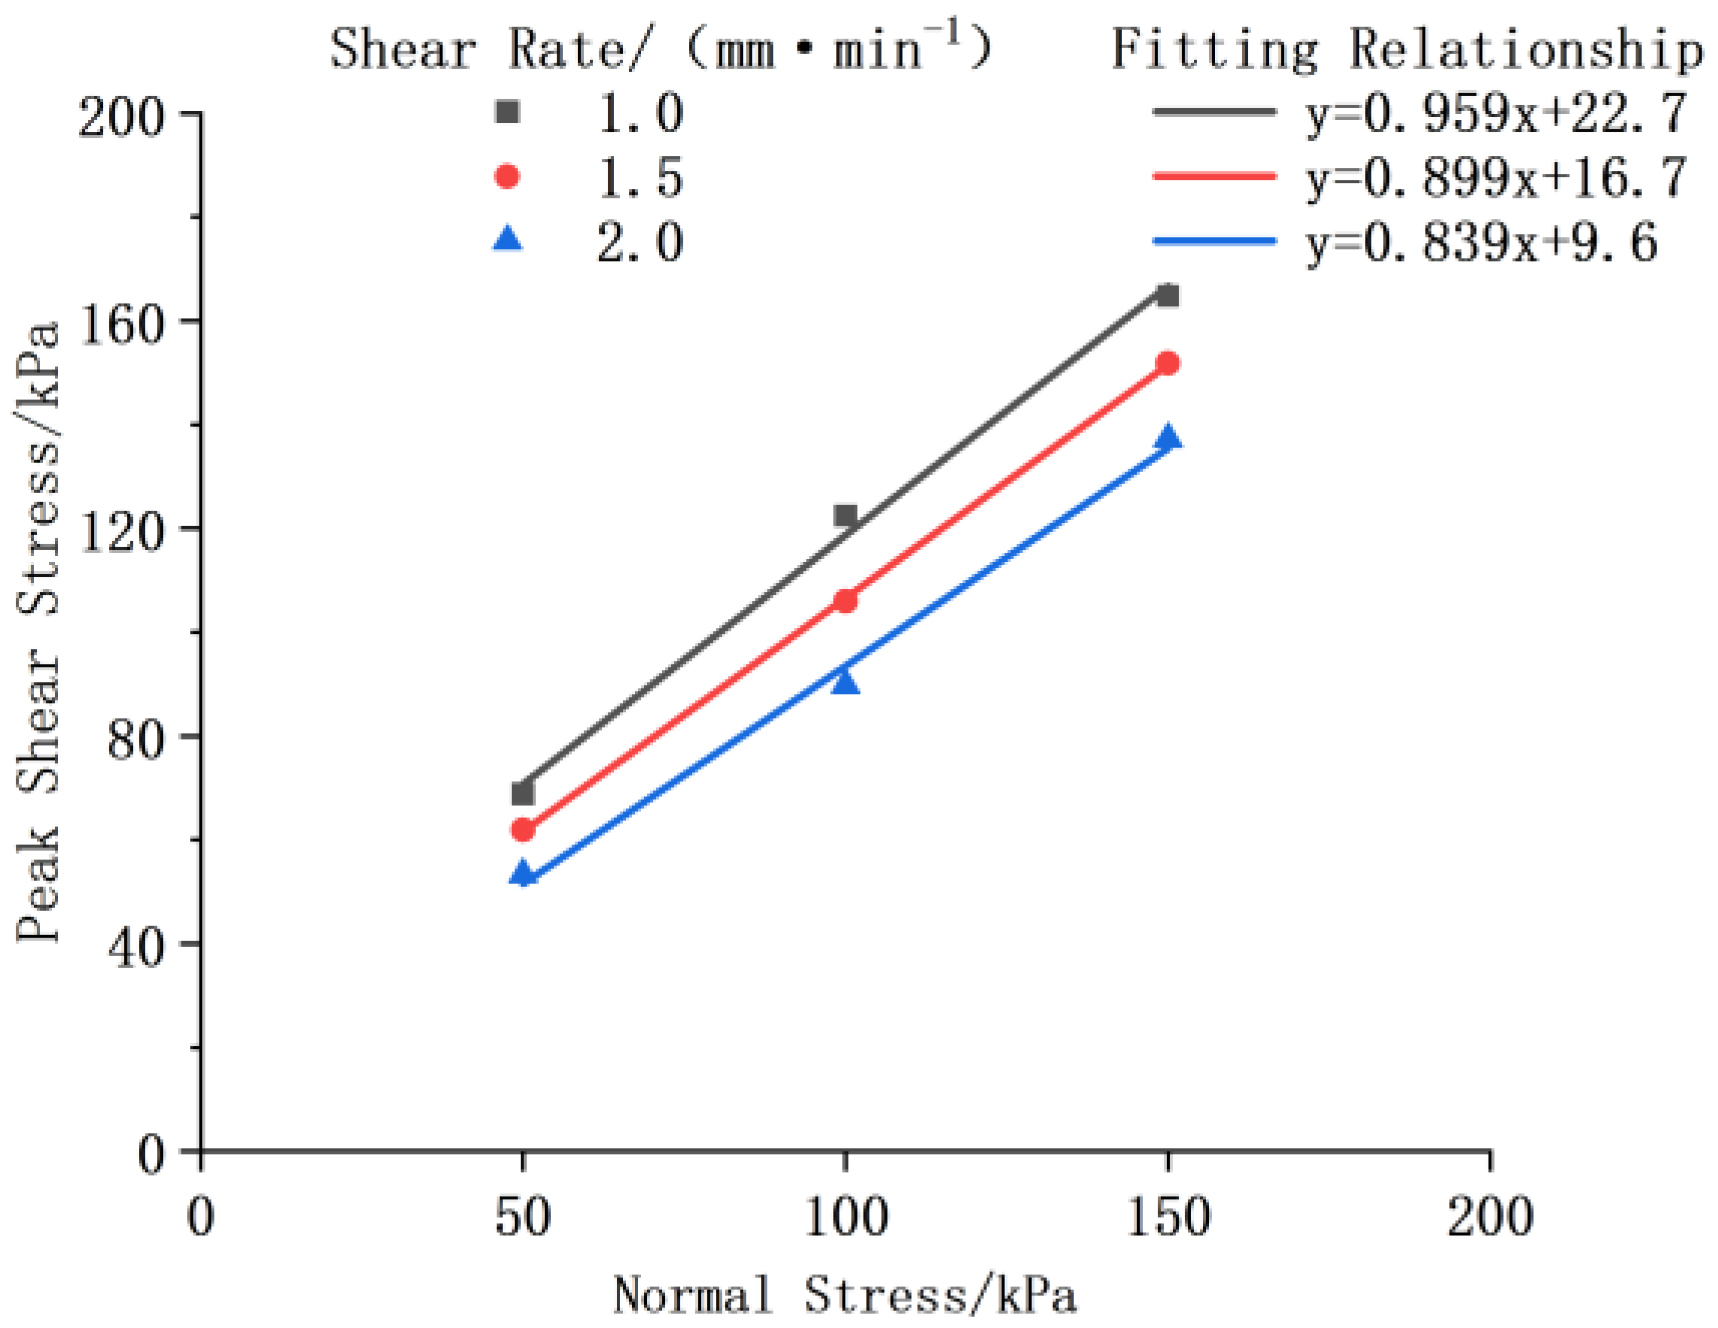
3.2. Effect of Shear Rates on Geogrid–Soil Interface Characteristics

Figure 7 shows the shear stress–shear displacement curves for different working conditions at shear rates of 1.0 mm/min, 1.5 mm/min, and 2.0 mm/min, respectively. As can be seen from Figure: 1. Comparing Figure 7a–c, it can be found that the shear rate basically does not affect the shear strength of unreinforced sand. 2. Comparing Figure 7d–f, it can be found that the shear strength of the geogrid-reinforced soil decreases with the increase in the shear rate, which is due to the fact that the geogrid acts through a certain amount of deformation, and the larger the shear rate, the faster the deformation of soil, so that the geogrid is too late to give full play to its role, which leads to the reduction in the interface shear strength.
Figure 8 shows the comparison of the shear stress–shear displacement curves for different working conditions at a normal stress of 100 kPa and shear rates of 1.0 mm/min, 1.2 mm/min, and 1.5 mm/min. As can be seen from the figure, the peak shear stresses of the geogrid–sand are greater than those of the unreinforced sand, and the peak shear stresses of the dry sand are all greater than those of the sand infiltrated by rainfall for 10 min. Taking the shear rate as 1.0 mm/min, the peak shear stresses under three working conditions are 131.5 kPa, 48.4 kPa, and 44.1 kPa, which satisfied the above conjecture, i.e., under the conditions of the test, the effect of reinforcement is greater than that of rainfall infiltration on the shear strength. It can be seen that the reinforcement has a significant effect on the strength of the soil, and under certain working conditions, the reinforced soil is still able to maintain high strength under rainfall infiltration.
Figure 9 shows the peak shear stress–shear displacement curves of geogrid reinforced specimens at normal stresses of 50 kPa, 100 kPa, and 150 kPa, shear rates of 1.0 mm/min, 1.5 mm/min, and 2.0 mm/min, and a rainfall infiltration time of 10 min. The data from the shear test results are fitted and analyzed, and the results are shown in Table 4.
As shown in Table 4, the direct shear friction characteristics of the geogrid–soil interface varied with the shear rate. The friction angles at three different shear rates are 43.8°, 42.0°, and 40.0°, and the cohesions are 22.7 kPa, 16.7 kPa, and 9.6 kPa, respectively. It can be found that the l friction angles and cohesions both decreased with the increase in shear rates. This is because the faster the shear rate, the shorter the time of shear failure, and the soil particles do not have enough time to rearrange themselves, resulting in the weakening of friction and occlusion, and the reduced friction angle. At the same time, the faster the shear rate, the more the soil’s internal water cannot be discharged in time, which leads to an increase in the pore water pressure and decreases in the effective stress, the shear strength, and the cohesion [26,27].

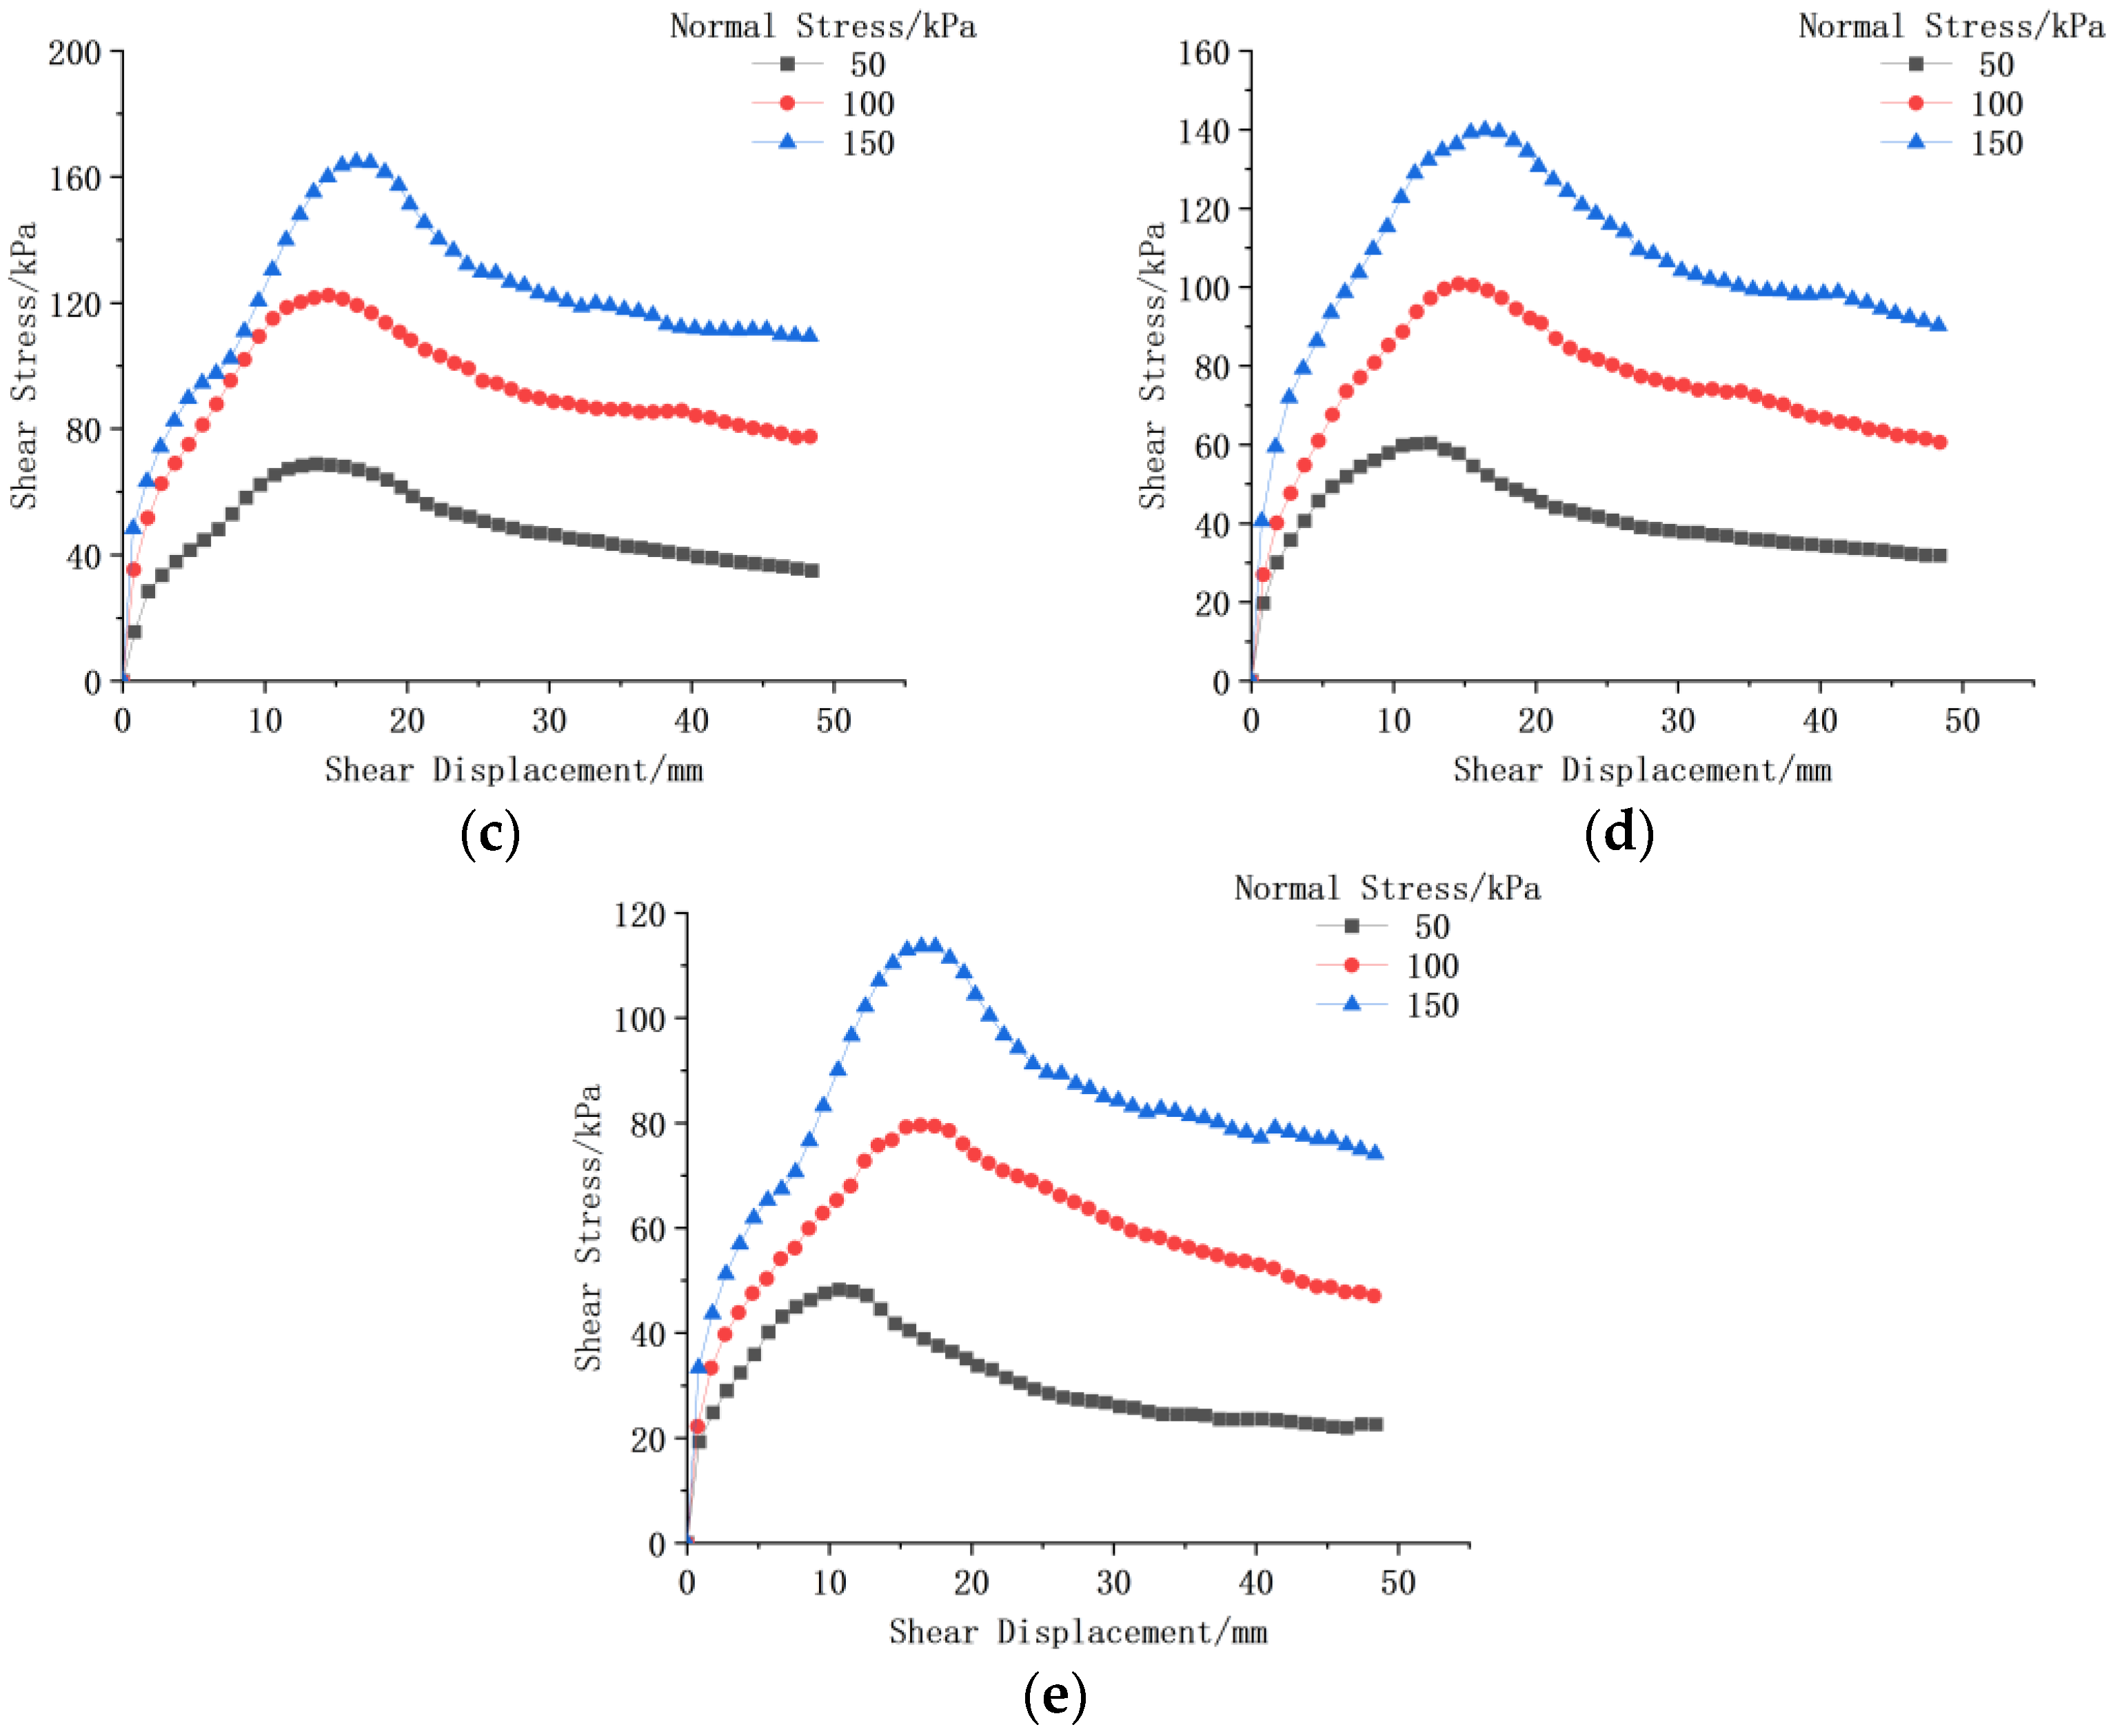
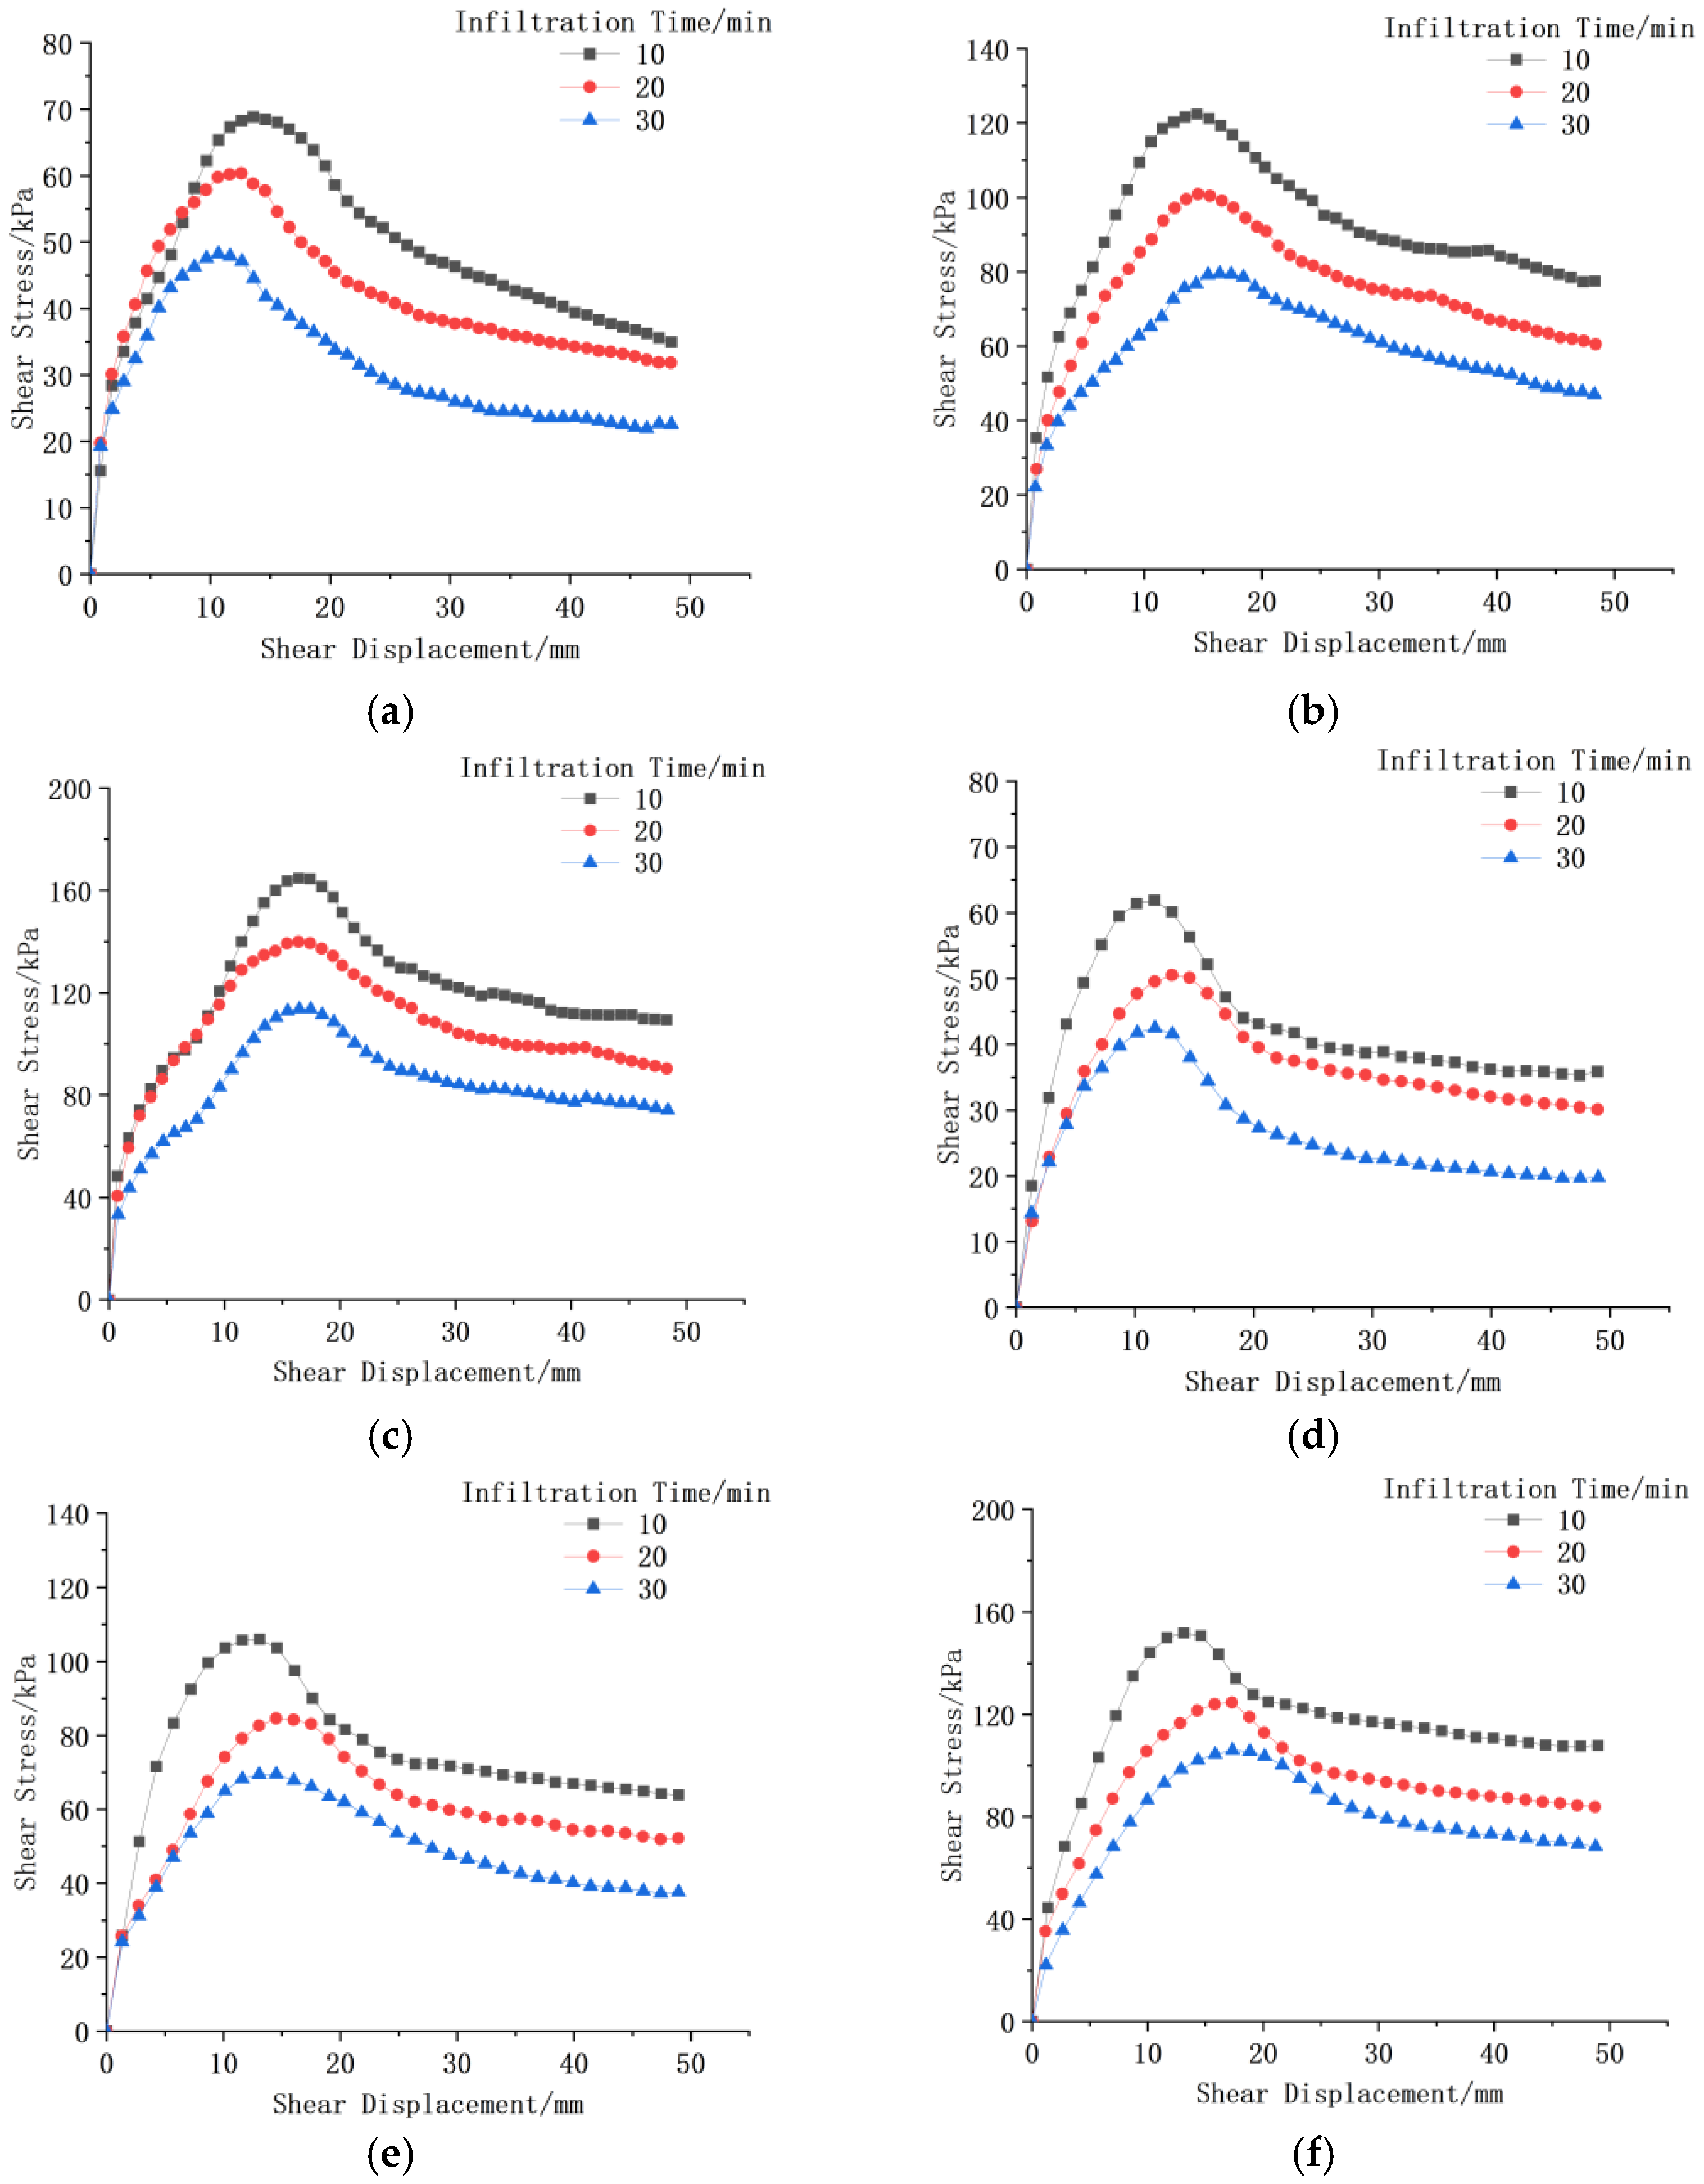
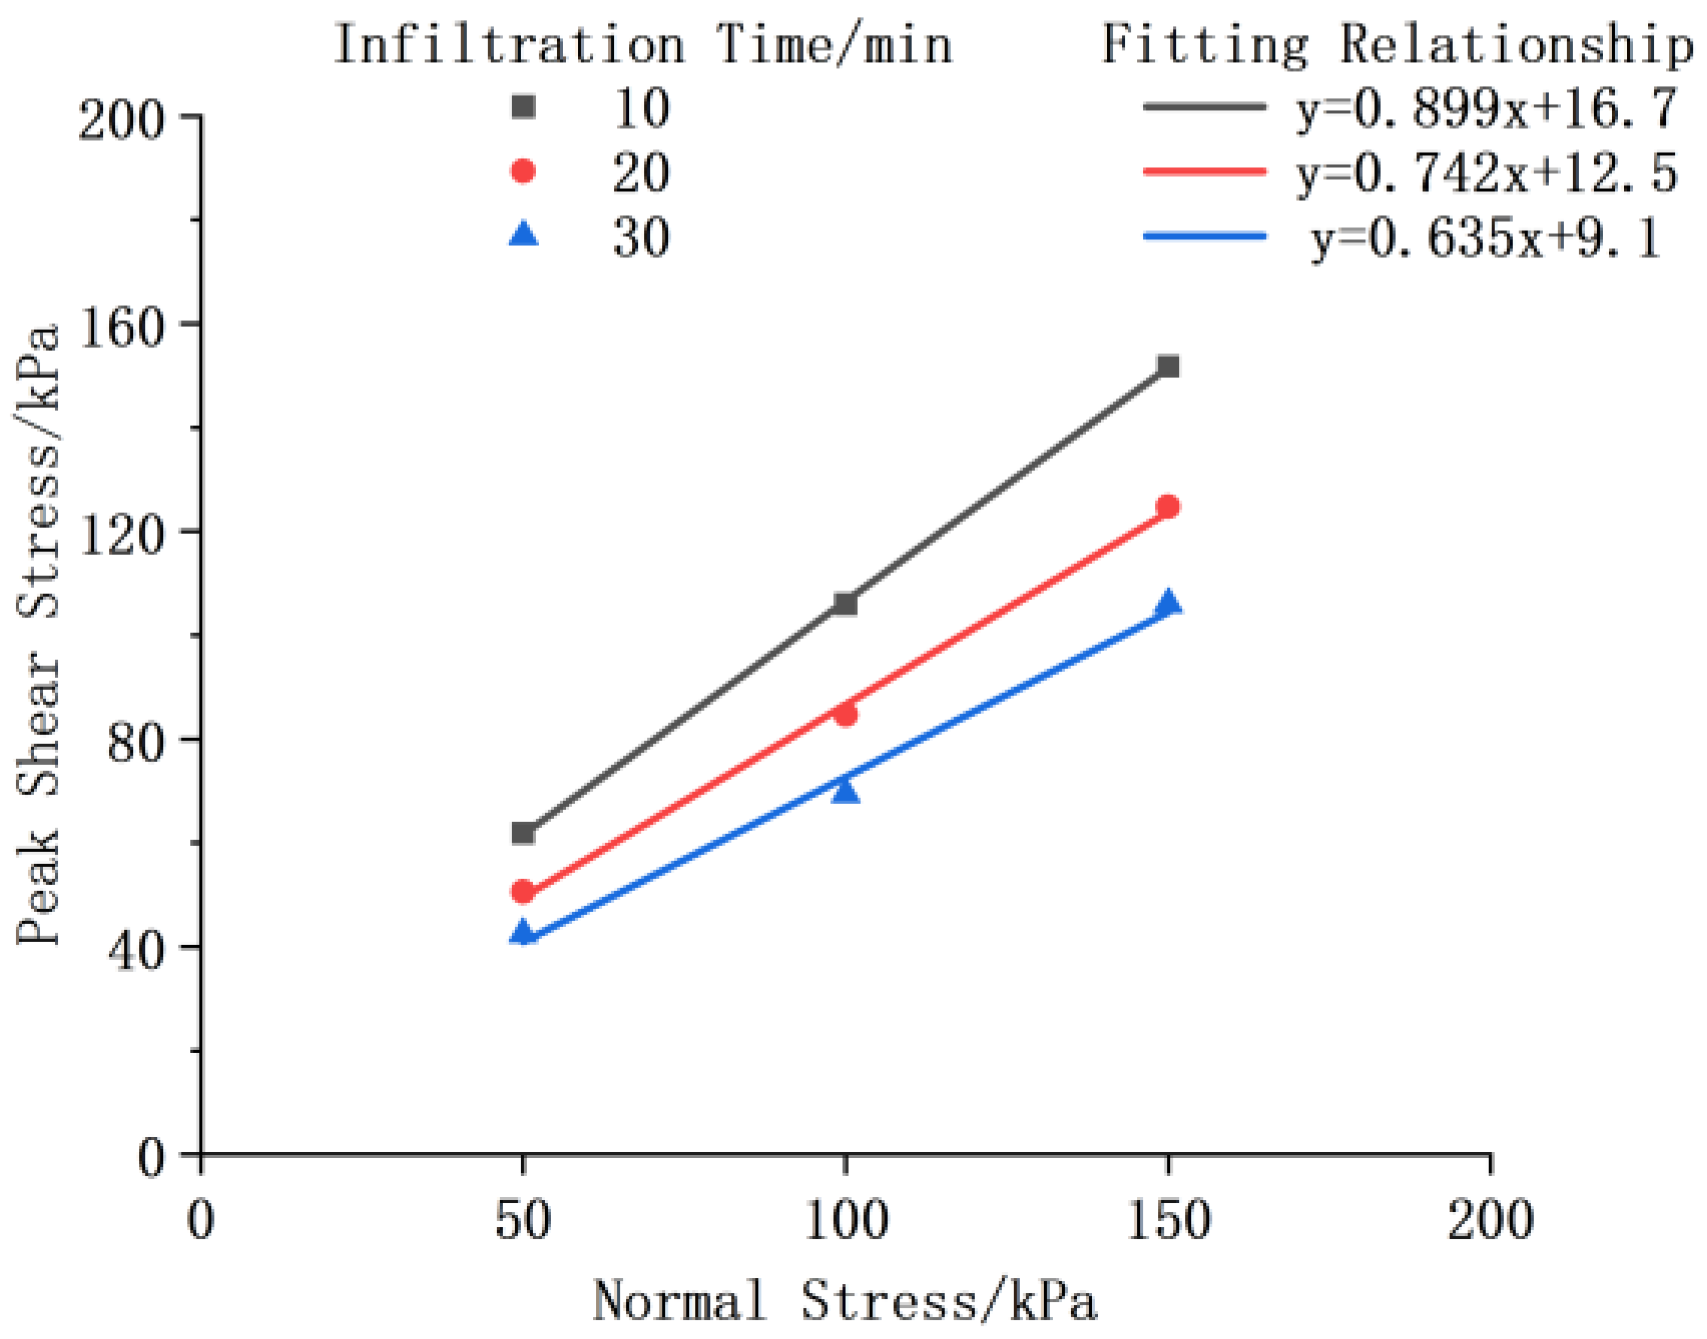
3.3. Effect of Infiltration Time on Geogrid–Soil Interface Characteristics

Figure 10 shows the shear stress–shear displacement curves for different working conditions at rainfall infiltration times of 10 min, 20 min, and 30 min, respectively. It can be seen from the figure: at different infiltration times, geogrid-reinforced soil samples still show the characteristics of shearing strain-softening. The peak shear stress of the shear stress–shear displacement curve is distributed between shear displacement of 10–20 mm, which is about 3% to 7% of the length of the shear surface. This is due to the fact that with the increase in infiltration time, the amount of rainfall infiltration increases, the friction of sand particles decreases, the interaction force between the particles is weakened, and the shear strength decreases.
Figure 11 shows the peak shear stress–shear displacement curves of geogrid reinforced specimens at normal stresses of 50 kPa, 100 kPa, 150 kPa, a shear rate of 1.5 mm/min, and rainfall infiltration times of 10 min, 20 min, 30 min. The data from the shear test results are fitted and analyzed, and the results are shown in Table 5.
As can be seen from Table 5, the length of the infiltration time has an effect on the values of the cohesion (c) and the friction angle (φ). When the shear rate is 1.5 mm/min, the cohesion is reduced by 45.5%, and the friction angle is reduced by 22.9%. The variation shows that the longer the infiltration time, the smaller the values of c and φ. This is because the prolonged rainfall leads to an increase in soil moisture, a thickening of the bonded water film between soil particles, weakened capillary action, and a reduction in substrate suction [28,29,30]. In addition, the lubricating effect of water makes the occlusion between soil particles ineffective, which results in the decrease in cohesion with the increase in infiltration time. The friction angle of soil reflects the frictional properties, including sliding friction, occlusal friction, and particle crushing force [31]. The sliding friction and occlusal friction of the soil decreases with the increase in moisture content.

4. Conclusions

In this paper, direct shear tests were employed to investigate the interface shear characteristics of geogrid–sand under varying normal stresses, shear rates, and infiltration times, leading to the following key conclusions.
  • The normal stress exerts a substantial influence on the shear strength of the geogrid–soil interface, with the shear strength increasing as the normal stress rises. Even in the presence of rainfall infiltration, the soil’s behavior adheres to the Mohr–Coulomb criterion. Consequently, in practical engineering applications, the normal stress at critical locations can be augmented by rationally adjusting the structural configuration or applying external loads. For instance, in the design of the slope of a dam, a suitable increase in the weight at the top of the slope can enhance the normal stress within the soil of the dam slope, thereby improving its shear strength. For the soil affected by rainfall infiltration, careful attention should be paid to the alterations in soil parameters induced by rainfall, and the increased amount of normal stress should be calculated judiciously. In regions with frequent rainfall, a certain safety margin should be reserved and the increased value of normal stress in the design should be appropriately enhanced.
  • The impact of shear rates on the shear stress–shear displacement curve of the unreinforced sand is not pronounced, and the variations in shear strengths and shear strength indicators with respect to the shear rates are relatively minor. In contrast, compared to the unreinforced sand, the effect of shear rates on the geogrid reinforced sand is more conspicuous, with its peak shear stresses decreasing as the shear rates increase. Therefore, during the design of structural reinforcement, it is essential to anticipate the potential shear rate scenarios that may occur. For areas where high shear rates are likely to manifest (such as regions where the bottom of the slope is scoured by water flow or near the flood discharge outlet of the dam), reinforcement measures with enhanced resistance to high shear rates should be implemented. For example, selecting geogrid types with superior shear resistance performance and optimizing their laying patterns can mitigate the risk of peak shear stress reduction under high shear rates. In unreinforced sand areas, although the influence of the shear rate is not prominent, considering that long-term rainfall may lead to alterations in the properties of local soil, appropriate attention should still be paid. For example, incorporating drainage facilities into the design can reduce the accumulation of rainwater in the sand and lower the potential shear failure risk associated with the increased moisture content.
  • Under the influence of rainfall infiltration, the moisture content of the soil undergoes dynamic changes, gradually increasing with the prolongation of infiltration time. Owing to the constraints of the test conditions and apparatus, the final moisture content tends to stabilize. The increase in moisture content leads to a decline in the peak shear stress at the geogrid–soil interface, accompanied by a reduction in both the friction angle and cohesion. Hence, when designing the drainage system, it is crucial to ensure efficient rainwater drainage to control the soil moisture content. For example, installing multiple layers of drainage pipes in slopes and dams, and rationally designing the spacing and diameter of the pipes can be based on the predicted rainfall intensity, and the soil permeability coefficients can maintain the moisture content of the soil at a relatively low level as much as possible, thereby minimizing the reduction in peak shear stress, friction angle, and cohesion caused by increased moisture content. Additionally, measures such as waterproof cover layers can be considered to curtail rainwater infiltration and thus limit the increase in the soil moisture content. For example, laying waterproof geomembranes on the top of the dam and certain dam slope surfaces can prevent rainwater from directly infiltrating into the dam body soil and can maintain the stability of the mechanical properties of the internal soil.
  • In this research, only sand is studied, and only the infiltration time under rainfall conditions is explored. There may be disparities in the relationship between the shear strength and rainfall infiltration time for different soil interfaces, and the rainfall intensity and other rainfall conditions may have varying impacts on the mechanical behavior of the geogrid–soil interface. Therefore, further investigations into the shear strength of other types of soil and different rainfall conditions are warranted.

Author Contributions

Methodology, Y.L.; writing—original draft preparation, Y.W.; writing—review and editing, Y.L and Y.W. All authors have read and agreed to the published version of the manuscript.

Funding

This research was funded by National Natural Science Foundation of China Youth Fund Project, Project number 51209132.

Data Availability Statement

The data presented in this study are available on request from the corresponding author. The data are not publicly available due to privacy.

Conflicts of Interest

The authors declare no conflicts of interest.

References

  1. Chothodi, S.; Kuniyil, S.; Patidar, H.; Parmar, K.; Scaria, R.; Mishra, R. Linkages and Reactions of Geomorphic Processes in Kerala Flood, 2018. Nat. Hazards 2024, 120, 5953–5986. [Google Scholar] [CrossRef]
  2. Susilowati; Kusumastuti, D.I. Hydrometeorological Disaster Mitigation Through Rainfall Intensity Mapping Using IDF in Sumatera Island, Indonesia. IJDNE 2024, 19, 571–579. [Google Scholar] [CrossRef]
  3. Tang, C.; Li, L.; Xu, N.; Ma, K. Microseismic monitoring and numerical simulation on the stability of high-steep rock slopes in hydropower engineering. J. Rock. Mech. Geotech. Eng. 2015, 7, 493–508. [Google Scholar] [CrossRef]
  4. Li, J.; Zeng, J.; Huang, G.; Chen, W. Urban Flood Mitigation Strategies with Coupled Gray–Green Measures: A Case Study in Guangzhou City, China. Int. J. Disaster Risk Sci. 2024, 15, 467–479. [Google Scholar] [CrossRef]
  5. Gebeyehu, A.L.; Manna, B. Recent Design Practice of Reinforced Earth Walls for High-Speed Rail Transportation: A State-of-the-Art and Way Forward. Eng. Sci. Technol. 2024, 55, 101747. [Google Scholar] [CrossRef]
  6. Ettbeb, A.E.; Rahman, Z.A.; Razi Idris, W.M.; Adam, J.; Rahim, S.A.; Ahmad Tarmidzi, S.N.; Lihan, T. Root Tensile Resistance of Selected Pennisetum Species and Shear Strength of Root-Permeated Soil. Appl. Environ. Soil. Sci. 2020, 2020, 1–9. [Google Scholar] [CrossRef]
  7. Boru, Y.T.; Negesa, A.B.; Scaringi, G.; Puła, W. Settlement Analysis of a Sandy Clay Soil Reinforced with Stone Columns. Stud. Geotech. Mech. 2022, 44, 333–342. [Google Scholar] [CrossRef]
  8. Song, G.; Song, X.; He, S.; Kong, D.; Zhang, S. Soil Reinforcement with Geocells and Vegetation for Ecological Mitigation of Shallow Slope Failure. Sustainability 2022, 14, 11911. [Google Scholar] [CrossRef]
  9. Morsy, A.M.; Zornberg, J.G.; Leshchinsky, D.; Han, J. Soil–Reinforcement Interaction: Effect of Reinforcement Spacing and Normal Stress. J. Geotech. Geoenvironmental Eng. 2019, 145, 04019115. [Google Scholar] [CrossRef]
  10. Morsy, A.M.; Zornberg, J.G. Soil-Reinforcement Interaction: Stress Regime Evolution in Geosynthetic-Reinforced Soils. Geotext. Geomembr. 2021, 49, 323–342. [Google Scholar] [CrossRef]
  11. Evaluation of Direct Shear Tests on Geogrid Reinforced Soil. Available online: https://serdigital.com.br/temp/soilsandrocks/article/1668 (accessed on 6 December 2024).
  12. Nhema, C.C.; Ke, H.; Ma, P.; Chen, Y.; Zhao, S. The Influence of Discrete Fibers on Mechanical Responses of Reinforced Sand in Direct Shear Tests. Appl. Sci. 2021, 11, 8845. [Google Scholar] [CrossRef]
  13. Infante, D.J.U.; Martinez, G.M.A.; Arrua, P.A.; Eberhardt, M. Shear Strength Behavior of Different Geosynthetic Reinforced Soil Structure from Direct Shear Test. Int. J. Geosynth. Ground Eng. 2016, 2, 17. [Google Scholar] [CrossRef]
  14. Makkar, F.M.; Chandrakaran, S.; Sankar, N. Experimental Investigation of Response of Different Granular Soil-3D Geogrid Interfaces Using Large-Scale Direct Shear Tests. J. Mater. Civ. Eng. 2019, 31, 04019012. [Google Scholar] [CrossRef]
  15. Linhares, R.M.; Mirmoradi, S.H.; Ehrlich, M. Evaluation of the Effect of Surcharge on the Behavior of Geosynthetic-Reinforced Soil Walls. Transp. Geotech. 2021, 31, 100634. [Google Scholar] [CrossRef]
  16. Liu, F.; Ying, M.; Yuan, G.; Wang, J.; Gao, Z.; Ni, J. Particle Shape Effects on the Cyclic Shear Behaviour of the Soil–Geogrid Interface. Geotext. Geomembr. 2021, 49, 991–1003. [Google Scholar] [CrossRef]
  17. Ying, M.; Liu, F.; Wang, J.; Wang, C.; Li, M. Coupling Effects of Particle Shape and Cyclic Shear History on Shear Properties of Coarse-Grained Soil–Geogrid Interface. Transp. Geotech. 2021, 27, 100504. [Google Scholar] [CrossRef]
  18. Liu, F.; Fu, J.; Lu, Y.; Ying, M. Macro and Micro Analyses of Static and Dynamic Shear Characteristics of Geogrid and Rubber–Sand Mixture Interface. Transp. Geotech. 2023, 43, 101119. [Google Scholar] [CrossRef]
  19. Liu, F.; Ma, K.; Yu, W. Numerical Simulation and Experimental Analysis of Granite Residual Soil-Concrete Interface under Cyclic Shear. Geomech. Eng. 2024, 39, 305–316. [Google Scholar]
  20. Liu, F.; Gao, C.; Xu, J.; Yang, J. Cyclic Shear Behavior and BoBiLSTM-Based Model for Soil-Rock Mixture-Concrete Interfaces. Constr. Build. Mater. 2024, 426, 136031. [Google Scholar] [CrossRef]
  21. Ferreira, F.B.; Vieira, C.S.; Lopes, M.L. Direct Shear Behaviour of Residual Soil–Geosynthetic Interfaces—Influence of Soil Moisture Content, Soil Density and Geosynthetic Type. Geosynth. Int. 2015, 22, 257–272. [Google Scholar] [CrossRef]
  22. Vieira, C.S.; Pereira, P.M.; Lopes, M. de L. Recycled Construction and Demolition Wastes as Filling Material for Geosynthetic Reinforced Structures. Interface Properties. J. Clean. Prod. 2016, 124, 299–311. [Google Scholar] [CrossRef]
  23. Ensani, A.; Razeghi, H.R.; Mamaghanian, J. Effect of Reinforcement Type and Soil Moisture Content on Marginal Soil-Geosynthetic Interactions. Soil. Mech. Found. Eng. 2022, 59, 314–323. [Google Scholar] [CrossRef]
  24. Namjoo, A.M.; Soltani, F.; Toufigh, V. Effects of Moisture on the Mechanical Behavior of Sand-Geogrid: An Experimental Investigation. Int. J. Geosynth. Ground Eng. 2021, 7, 5. [Google Scholar] [CrossRef]
  25. JTGE50-2006; Ministry of Transportation of the People’s Republic of China. Test Methods of Geosynthetics for Highway Engineering. China Communications Press: Beijing, China, 2006; pp. 154–196. (In Chinese)
  26. Ma, T.; Chen, P.; Zhang, Q.; Zhao, J. A Novel Collapse Pressure Model with Mechanical-Chemical Coupling in Shale Gas Formations with Multi-Weakness Planes. J. Nat. Gas. Sci. Eng. 2016, 36, 1151–1177. [Google Scholar] [CrossRef]
  27. Fu, Y.; Cao, Y.; Kong, J.; Zheng, J.; Mu, J.; Wang, J.; Zhuang, J. The Dynamic Characteristics of Saturated Remolded Loess under Cyclic Load. Earthq. Res. Adv. 2024, 4, 100235. [Google Scholar] [CrossRef]
  28. Oh, W.T.; Vanapalli, S.K.; Qi, S.; Han, Z. Estimation of the Variation of Matric Suction with Respect to Depth in a Vertical Unsaturated Soil Trench Associated with Rainfall Infiltration. E3S Web Conf. 2016, 9, 15003. [Google Scholar] [CrossRef]
  29. Liu, H.; Han, J.; Al-Naddaf, M.; Parsons, R.L.; Kakrasul, J.I. Field Monitoring of Wicking Geotextile to Reduce Soil Moisture under a Concrete Pavement Subjected to Precipitations and Temperature Variations. Geotext. Geomembr. 2022, 50, 1004–1019. [Google Scholar] [CrossRef]
  30. Aggelakopoulou, E.; Ksinopoulou, E.; Eleftheriou, V. Evaluation of Mortar Mix Designs for the Conservation of the Acropolis Monuments. J. Cult. Herit. 2022, 55, 300–308. [Google Scholar] [CrossRef]
  31. Zhang, S.; Leng, X.; Zhang, Z. Study on The Mechanism of Deformation and Failure of Expansive Rock and Soil Slope. In Proceedings of the Conference Proceedings of the 8th International Symposium on Project Management, China (ISPM2020), Beijing, China, 4 July 2022. [Google Scholar]
Figure 1. Large direct shear apparatus. The pink line in the figure represents the shear level of this direct shear test. The number represents the moisture content sensor 1 and moisture content sensor 2 installed in the soil sample, respectively.
Applsci 15 00705 g001
Figure 2. The actual test equipment pictures. (a) Front view; (b) side view.
Applsci 15 00705 g002
Figure 3. The grain size distribution curve for the sand used.
Applsci 15 00705 g003
Figure 4. Geogrid specimen.
Applsci 15 00705 g004
Figure 5. Shear stress–shear displacement curves under different normal stresses. (a) S-T0-1.0; (b) J-T0-1.0; (c) J-T10-1.0; (d) J-T20-1.0; (e) J-T30-1.0.
Applsci 15 00705 g005aApplsci 15 00705 g005b
Figure 6. Dynamic moisture content—shear displacement curves under different normal stresses. (a) J-T10-1.5; (b) J-T20-1.5; (c) J-T30-1.5; (d) J-T30-1.0.
Applsci 15 00705 g006
Figure 7. Shear stress–shear displacement curves at different shear rates. (a) S-T0-A; (b) S-T0-B; (c) S-T0-C; (d) J-T10-A; (e) J-T10-B; (f) J-T10-C.
Applsci 15 00705 g007aApplsci 15 00705 g007b
Figure 8. Comparison of shear stress under different working conditions and different shear rates.
Applsci 15 00705 g008
Figure 9. Peak shear stress–shear displacement curves at different shear rates.
Applsci 15 00705 g009
Figure 10. Shear stress–shear displacement curves under different infiltration time. (a) J-A-1.0; (b) J-B-1.0; (c) J-C-1.0; (d) J-A-1.5; (e) J-B-1.5; (f) J-C-1.5.
Applsci 15 00705 g010
Figure 11. Peak shear stress–shear displacement curves under different rainfall infiltration times.
Applsci 15 00705 g011
Table 1. Main technical indicators of the large direct shear apparatus.
Upper Shear Box
Dimension/mm
Lower Shear Box
Dimension/mm
Load Range/kNMaximum
Displacement/mm
Measurement Accuracy/%
HorizontalVerticalHorizontalVertical
305 × 305 × 100405 × 305 × 1004545100500.25
Table 2. Physical properties of testing sand.
SpecimenGrain Size/mmMaximum Void Ratio (emax)Minimum Void Ratio (emin)Specific Gravity (Gs)Coefficient of Uniformity (Cu)Coefficient of Curvature (Cc)
D10D30D60
Quartz sand0.670.881.080.770.512.651.611.07
Table 3. Experimental schemes.
Type of TestReinforced or NotIntensity of Rainfall/(mm·h−1)Infiltration Time/minNormal Stress/kPaShear Rate/(mm·min−1)
Monotonic direct shear test *Unreinforced sand0050, 100, 1501.0, 1.2, 1.5, 2.0
120101001.0, 1.2, 1.5
Geogrid reinforced sand0050
100
150
1.0
1.0, 1.2, 1.5
1.0
1201050, 100, 1501.0, 1.5, 2.0
2050, 100, 1501.0, 1.5
3050
100
150
1.0, 1.5
1.0, 1.2, 1.5
1.0, 1.5
* The unreinforced sand is recorded as S, geogrid reinforced sand is recorded as J, and the normal stresses of 50, 100, and 150 kPa are recorded as A, B, and C, respectively, and then the above test schemes are numbered. For example: No. S-T0-A-1.0 indicates the result of the unreinforced sand at an infiltration time of 0 min, normal stress of 50 kPa, and shear rate of 1.0 mm/min; No. J-T10-B-1.2 indicates the result of the geogrid reinforced sand at an infiltration time of 10 min, normal stress of 100 kPa, and shear rate of 1.2 mm/min, etc.
Table 4. Strength index at different shear rates.
Shear Rate/(mm·min−1)Strength IndexFitting Relationship
Cohesion (c)/kPaFriction
Angle (φ)/°
Correlation
Coefficient (R2)
1.022.743.80.995y = 0.959x + 22.7
1.516.742.00.999y = 0.899x + 16.7
2.09.640.00.994y = 0.839x + 9.6
Table 5. Strength index under different infiltration time.
Infiltration Time/minStrength IndexFitting Relationship
Cohesion (c)/kPaFriction Angle (φ)/°Correlation
Coefficient (R2)
1016.742.00.999y = 0.899x + 16.7
2012.536.60.998y = 0.742x + 12.5
309.132.40.992y = 0.635x + 9.1
Disclaimer/Publisher’s Note: The statements, opinions and data contained in all publications are solely those of the individual author(s) and contributor(s) and not of MDPI and/or the editor(s). MDPI and/or the editor(s) disclaim responsibility for any injury to people or property resulting from any ideas, methods, instructions or products referred to in the content.

