Article

Physico-Chemical Characterization of Sesame/Rapeseed Oil Mixtures

1
Faculty of Physics and Technology, University of Plovdiv “P. Hilendarski”, 4000 Plovdiv, Bulgaria
2
Faculty of Chemistry, University of Plovdiv “P. Hilendarski”, 4000 Plovdiv, Bulgaria
3
Faculty of Pharmacy, Medical University “Prof. Dr. Paraskev Stoyanov”, 9002 Varna, Bulgaria
*
Author to whom correspondence should be addressed.
Appl. Sci. 2025, 15(2), 704; https://doi.org/10.3390/app15020704
Submission received: 21 November 2024 / Revised: 27 December 2024 / Accepted: 9 January 2025 / Published: 12 January 2025

Abstract

:
The production of edible plant seed oil used in the food industry is increasing globally. More than 75% of lipids in the human diet come from edible vegetable oils. Among them, sesame oil has the highest resistance to oxidation, valuable physiological properties, and a unique flavor and aroma. However, sesame oil is more expensive than rapeseed oil, and often both oils are mixed to reduce costs. In this study, we performed a physical and physico-chemical analysis of sesame oil and sesame/rapeseed oil mixtures (5/95, 10/90, 30/70, 50/50, 70/30 and 90/10 w/w). The investigated oils were characterized based on their fatty acid composition, peroxide value, iodine value, phase transitions, refractive indices, color and UV–Vis adsorption. The fatty acid composition of mixtures made from sesame and rapeseed oils depended on the ratio of the two oils. Increasing the content of sesame oil in the mixtures resulted in a decrease in the levels of oleic and linolenic acids, while the levels of linoleic acid increased. A very good linear correlation was observed between the temperatures and enthalpies of crystallization of the mixtures, which could be used to establish the composition of a mixture between sesame and rapeseed oil. Information about these parameters could increase the possibilities for the commercial use of the investigated oils.

1. Introduction

The rapid development of modern science in the fields of medicine and nutrition has led to an equal increase in the demand for more and higher quality food worldwide [1]. Edible plant oils represent a major part of the diet of most of the world’s population, and the global increase in overall technological development has led to an increase in the demand for healthier and sustainable alternatives of the most commonly used vegetable oils [2,3,4,5,6]. Additionally, as the consumption of these oils increases, the environmental impact of their production also becomes more pronounced [7], leading to a need for supplementation and substitution of some of the most utilized products with other, more sustainable alternatives in the form of oil mixtures and additives. Within the global market, three different plant oils have emerged as the most commonly utilized alternatives and additives to the most commonly used vegetable and palm oils, namely sesame, rapeseed oil and soybean oil.
Sesame and rapeseed oil are presented as the main vegetable oils for food production. As one of the most ancient cultivated crops in the world [8], sesame has been found to have a variety of applications around the globe, from food to cosmetic and medicinal applications. As an oil-producing plant, sesame offers higher oil content when compared to most other oilseeds; however its rather difficult production methods limit its wider use and application. Its high stability, despite a high degree of unsaturation, makes its distribution easier, and when combined with the health benefits offered, sesame oil has the potential to spread from its current market in Asia and become a worldwide edible oil alternative [9,10]. Several papers have shown the health benefits of sesame oil in terms of its antimicrobial [11], anti-inflammatory [12,13] and nutraceutical [14] value. In order to compensate for the increase in demand and optimize production, research has been done on improving the extraction process [15], thus offering a higher oil yield.
Developments in agriculture and the food industry led to the rapid establishment of rapeseed oil as the second-largest oil-producing crop on the market [16,17]. With its high nutritional value, this oil is quickly becoming a popular alternative to other types of popular vegetable oils [18]. Rapeseed oil is not only affordable but also offers several health benefits. It is high in unsaturated fats and vitamins E and K. It contains a beneficial ratio of omega-3 to omega-6 fats, which can positively influence heart health [19]. To enhance the health benefits of rapeseed oil, agricultural practices such as selecting high-quality cultivars, using organic methods and optimizing soil and water management are essential. Production techniques like cold pressing, minimal refinement, antioxidant enrichment and proper storage preserve its nutritional profile and extend its shelf life [20]. These factors make rapeseed oil a viable, healthier alternative to other, more popular oils.
One easy and reliable method of modification and enhancement of the beneficial properties of most edible oils is mixing different types of oils at different ratios for both raw consumption and different culinary applications. Research has shown that all three types of discussed oils can be enhanced by adding a variety of other types of oils, with almost all types of mixtures producing a significant increase in the beneficial properties of the mixture [21]. A number of papers also demonstrate the ability of oil mixtures to maintain their health benefits even after thermal treatment [22,23,24]. Even when examining only mixtures of sesame, rapeseed and soybean oils, research has shown that for both raw [25,26] and processed products [27,28,29], mixing of different types increases the beneficial properties in all cases. Thus, further research in the field of mixes of different edible oils is of great interest and can provide new and improved novel products, which can supplement current unhealthy variants and help create a healthy diet for future generations.
Mixing oils allows for a more balanced fatty acid composition, which can improve nutritional value and health benefits; it can enhance the overall oxidative stability and shelf life of the final product and can be a more economical way to achieve desired properties and nutritional profiles compared to using a single oil. The aim of the present study is to characterize as well as evaluate the physico-chemical properties of two edible oils (sesame and rapeseed oil) and different mixtures that have played a major role in human food since ancient times.

2. Materials and Methods

2.1. Materials

Rapeseed oil (RSO) and sesame oil (SO) were bought from local Bulgarian markets in the city of Plovdiv. Before the measurements, the oils were stored in original unopened dark glass bottles and in a refrigerator at a temperature of 5 °C. All other chemicals used in the physical and chemical testing were of analytical grade.

2.2. Oil Mixtures Creations

Set amounts of the used oils were mixed to create six different sesame/rapeseed oil mixtures with ratios of 5/95, 10/90, 30/70, 50/50, 70/30 and 90/10 w/w. The pure sesame and rapeseed oils were used as controls. The samples were analyzed immediately after opening the bottle to avoid accelerated oxidation processes.

2.3. Fatty Acid Composition

Fatty acid composition of the SO, RSO, and SO/RSO ms was determined by gas chromatography (GC) based on the standard ISO 12966-1:2014 [30]. Fatty acid methyl esters (FAMEs) were prepared by pre-esterification of the samples with 2% sulfuric acid in absolute methanol at 50 °C according to standard ISO 12966-2:2017 [31]. Determination of FAMEs was performed on an Agilent 8860 gas chromatograph equipped with a capillary column DB Fast FAME (30 m 0.25 mm 0.25 mm (film thickness)) and a flame ionization detector. The column temperature is from 70 °C (1 min) at 6 °C/min to 180 °C and at 5 °C/min to 250 °C; the temperature of the injector is 270 °C and 300 °C for the detector, respectively; nitrogen is the carrier gas. Identification is carried out by comparison of the retention times of a standard mixture of FAME (Supelco 37 Component FAME Mix C4-C24, certified reference material, Merck, Bellefonte, PA, USA). The limit of detection of GC was 0.05%. Fatty acid content was measured by using a normalization method.

2.4. Determination of Peroxide Value

The peroxide value of the oils was determined by ISO methods and expressed in meqO2/kg [32].

2.5. Determination of Iodine Value

The iodine value (IV), expressed in gI2/100 g, was calculated based on the fatty acid composition of the oil using the formula [33]:
IV = [(90 × % Oleic acid) + (181 × % Linoleic acid) + (274 × % Linolenic acid)]/100, gI2/100 g
where 90, 181 and 274 are the iodine values of pure oleic, linoleic and linolenic acids, respectively.

2.6. Differential Scanning Calorimetry

The crystallization and melting phenomena of pure sesame and rapeseed oils and their mixtures were examined by differential scanning calorimeter (DSC) 204F1 Phoenix (Netzsch Gerätebau GmbH, Selb, Germany). The instrument was calibrated by indium standard (Tm = 156.6 °C, ΔHm = 28.5 J/g) for both heat flow and temperature. About 15 mg of the samples were placed in aluminum pans and sealed. As a reference, an empty pan was used. The analysis was carried out at the following temperature regime: cooling down from 25 °C to −70 °C with a cooling rate of 2 K/min; isothermal step at −70 °C for 10 min; heating from −70 °C up to 100 °C with a heating rate of 5 K/min. The experimental data were processed by NETZSCH Proteus Thermal Analysis software, Version 6.1 (Germany).

2.7. Refractive Index Measurement

The refractive indices were determined by a standard Abbe refractometer. The measurements were performed at a temperature of 20 °C, and the accuracy was ±1 × 10⁻⁴. The refractometer was calibrated with water (nD = 1.3330) and isooctane (nD = 1.3915) at 20 °C. The refractive index of all investigated oils was measured for six samples. The calculated standard deviation was better than 5% from the mean value with a confidence level of 95%.

2.8. UV Spectra

UV spectroscopy was performed on a Metertech UV–Vis Spectrophotometer SP-8001 (Metertech Inc., Taipei, Taiwan). Solutions of 0.2% of isooctane (2,2,4 trimethylpentane) were prepared, mixed well and poured into a quartz cuvette with an optical path length of 10 mm. Linearity, wavelength and photometric accuracy in the UV range were verified before the measurements. The spectra in the UV range (190–300 nm) were recorded with a 1 nm resolution and calibrated by means of a pure solvent spectrum.

2.9. Color Parameters Measurement

The color parameters of the oil samples were determined in a CIELab colorimetric system after preliminary tempering of the samples. Thermo Scientific™ VISIONlite™ 5 Software package and Helios Omega spectrophotometer (American Instrument Exchange, Inc., Haverhill, MA, USA) with 10 mm cuvette were used.
Luminance L and color characteristics a and b in a CIELab colorimetric system, which is more informative for the case of the present study as it is designed for small color differences.

2.10. Statistics

All results were presented as mean and corresponding standard deviation. The significant differences between the results were established using one-way ANOVA (Duncan test) at p < 0.05.

3. Results

3.1. Chemical Characterization of the SO/RSO Mixtures

The fatty acid composition and iodine value of the control oils are presented in Table 1.
Thirteen fatty acids were identified across all analyzed vegetable oils, with varying quantities for each sample. Essential fatty acids (linoleic and α-linolenic) and non-essential oleic and palmitic acids were present in both samples in the largest quantities. The content of oleic acid was higher in rapeseed oil (64.7%) than in sesame oil (36.7%). The data on the oleic acid content in rapeseed oil were similar to the findings reported by Gerlei et al. (2024) at 61.36% [34].
The sesame oil has 48.3% linoleic and 10.4% palmitic acid. In contrast, rapeseed oil was characterized by a lower content of palmitic acid (4.4%) and linoleic acid (18.8%). On the other hand, the level of α-linolenic acid in rapeseed oil was found to be 8.5% and 0.8% in sesame oil. The remaining identified fatty acids in both oils were found to be between 0.1% and 0.5%.
RSO and SO control samples were found to be rich in unsaturated fatty acids, allowing for variations in the ratio between monounsaturated (MUFA) and polyunsaturated fatty acids (PUFA). Rapeseed oil was particularly rich in MUFAs (66.2%), while sesame oil contained 37.1% MUFAs. On the other hand, the content of polyunsaturated fatty acids (PUFAs) was found to be 27.4% in rapeseed oil and 49.1% in sesame oil.
The iodine value indicates the degree of unsaturation in oils and was calculated based on the fatty acid composition of the investigated oils. The results showed that the sesame and rapeseed oils had different values—122.6 and 115.5 gI2/100 g, respectively. This showed that sesame oil was more unsaturated than rapeseed oil. The oils with an iodine value ranging from 100 to 130 gI2/100 g are considered to be ’semi-dry oils’ [35].
Before mixing, the peroxide value (PV) of control oils was determined (Table 2). It is an important indicator of oil oxidation.
The peroxide value of fresh vegetable oils should be less than 10 meqO2/kg, according to Codex-Stan 210-1999 [35]. The oils studied exhibit a relatively low peroxide value (1.1 meqO2/kg for sesame oil and 4.3 meqO2/kg for rapeseed oil), indicating they are stable against oxidative processes.
Some of the most used vegetable oils need to be modified to improve their nutritional benefits. One effective method is by mixing the oils in different ratios [21].
The fatty acid composition and iodine value of mixtures from sesame and rapeseed oil are presented in Table 3.
The major fatty acids in the mixture oils were oleic, linoleic, α-linolenic and palmitic acids. The results showed a gradual decrease in the quantity of oleic acid from 61.7% (mixture 5/95) to 38.6% (mixture 90/10). In the 50/50 mixture, where the quantities of sesame and rapeseed oils were equal, the amount of oleic acid was found to be 11% higher than in the 90/10 mixture and 12% lower than in the 5/95 mixture. A tendency to decrease was also observed in the quantity of α-linolenic acid, from 8.3% in the 5/95 mixture to 1.6% in the 90/10 mixture. On the other hand, the content of the linoleic acid slightly increased with the increase of the amount of sesame oil in the mixtures—from 20% (5/95) to 45.1% (90/10). The content of palmitic acid also increased in the mixtures, but to a lesser extent compared to linoleic acid—from 4.9% (5/95) to 9.6% (90/10). Apparently, the reason behind the decrease in the oleic and α-linolenic acids was the increasing amount of sesame oil in the mixtures.
The same trend of increasing linoleic acid content and decreasing oleic and linolenic acid content was observed by Mohammadi et al. [36], who studied the changes in the fatty acid composition of mixtures of canola and sesame oil in various ratios (20%, 30%, 50% and 60%). The research underscores the importance of understanding how mixing oils can modify their nutritional profile, which has direct implications for dietary recommendations and the food industry. For consumers, the increased linoleic acid content in the mixtures can enhance the anti-inflammatory and cardiovascular benefits of their diet. However, the reduction in linolenic acid calls for a balanced intake to ensure the essential omega-3 fatty acid needs are met [36].
The quantity of saturated (SFA) and unsaturated (UFA) fatty acids was determined, and UFA was presented as a sum from mono- and polyunsaturated fatty acids (MUFA and PUFA). The results showed the biggest amount of MUFA in all analyzed mixtures, followed by the content of PUFA. The content of MUFA decreased (from 63.9% to 39.7%), while that of PUFA increased (from 28.3% to 46.7%). The content of SFA was found to be in order from 7.8% (mixture 5/95) to 13.6% (mixture 90/10). The increase was approximately 1% between the mixtures.
The iodine value of the mixtures was also calculated. The iodine value of the mixtures increased with increasing concentration of the sesame oil from 114.5 gI2/100 g (5/95) to 119.1 gI2/100 g (90/10). There were no significant differences in the iodine values for the examined mixtures, except for the 90/10 mixture, which was notably higher than the others.
In addition to analyzing the fatty acid composition of the mixtures, their peroxide value was also determined (Table 4). The SO/RSO 5:95 mixture had higher peroxide values-4.5 meqO2/kg and 5.0 meqO2/kg, respectively. It has been established that the peroxide value decreased as the concentration of sesame oil in the mixtures increased. The peroxide value of rapeseed oil is higher than that of sesame oil, which naturally leads to a reduction in the peroxide value when the rapeseed oil content in the mixtures decreases. The PV for all mixtures is in agreement with Codex-Stan 210 (1999) < 10 meqO2/kg [35].

3.2. Crystallisation and Melting Phenomena in Sesame Oil/Rapeseed Oil Mixtures

The phase transitions in the investigated plant oil and their mixtures are explored by the method of differential scanning calorimetry (DSC). The DSC curves obtained during the cooling and heating process are presented in Figure 1 and Figure 2. The temperatures and specific enthalpies of the phase transitions are summarized in Table 5.
According to literature data, the crystallization of vegetable oils takes place at three characteristic temperatures, corresponding to the phase transitions of saturated fatty acids (around −10 °C), monounsaturated fatty acids (around −35 °C) and polyunsaturated fatty acids (around −54 °C) [37].
According to the results presented in Figure 1 and Table 5, these three peaks are distinguishable for rapeseed oil and mixtures with a higher concentration of rapeseed oil (up to a ratio of 30/70). These observations may be related to the almost two times higher content of monounsaturated fatty acids in rapeseed oil compared to sesame oil (see Table 1). It is clearly seen from Figure 1 that as the concentration of rapeseed oil increases, the low-temperature peak shifts to higher temperatures from −53.2 °C to −40.9 °C and its enthalpy increases more than twice (from −27.85 J/g to −58.38 J/g). At the same time, the high-temperature peak shifts to lower temperatures (from −9.3 °C to −18.0 °C), and its enthalpy decreases (from −5.575 J/g to −0.308 J/g). These trends may be related to the different fatty acid compositions of the two pure oils.
According to the results presented in Table 5, linear relationships with a very high correlation coefficient were established between the crystallization temperatures of the mixtures and the content of sesame oil, as well as between the enthalpies of crystallization and mixtures’ composition.
During the heating, the DSC curves of both oils and their mixtures show a double endothermic peak, corresponding to the oil melting phenomena—Figure 2. The peak is asymmetric, and its shape changes with sesame oil concentration. At high sesame oil content, a distinct low-temperature peak is observed, which decreases with increasing rapeseed oil concentration. It transforms into a shoulder to the main peak at rapeseed oil concentration above 50%. There is a linear dependence between the melting temperature of the mixtures and their composition with a high correlation coefficient.
The good correlation dependences between the temperatures of the phase transitions of the SO/RSO mixtures and their composition give reason to consider that the DSC method can be used in the identification of the composition of mixtures between sesame oil and rapeseed oil.

3.3. Refractive Index

The refractive indices of two standard oils (sesame and rapeseed oils) and their mixtures were determined by using an Abbe refractometer with an accuracy of ±1 × 10⁻⁴. The measurements were performed at a temperature of 20 °C. The refractive indices of all investigated oils are presented in Table 6.
The results presented in Table 6 show that the refractive index value of the sesame oil is 1.4729, and for the rapeseed oil, 1.4718. The refractive index values of different investigated mixtures are not significantly different from the pure oils, and they are in the range from 1.4711 (mixture 5/95) to 1.4724 (mixture 90/10) [38]. This may be due to the specific gravity, molecular weight, increase in saturation and linear autoxidation stage. Analogous results are obtained in [39]. The refractive index is an indication of the purity of oils. According to [40], the refractive index is mainly used to measure the change in unsaturation as the fat or oil is hydrogenated. The refractive index of oils depends on their molecular weight, fatty acids chain length, degree of unsaturation and degree of conjugation. The determination of the refractive index is indicative of the likelihood of rancidity due to oxidation; it is essential for assessing oil cleanliness and detecting adulteration [41].

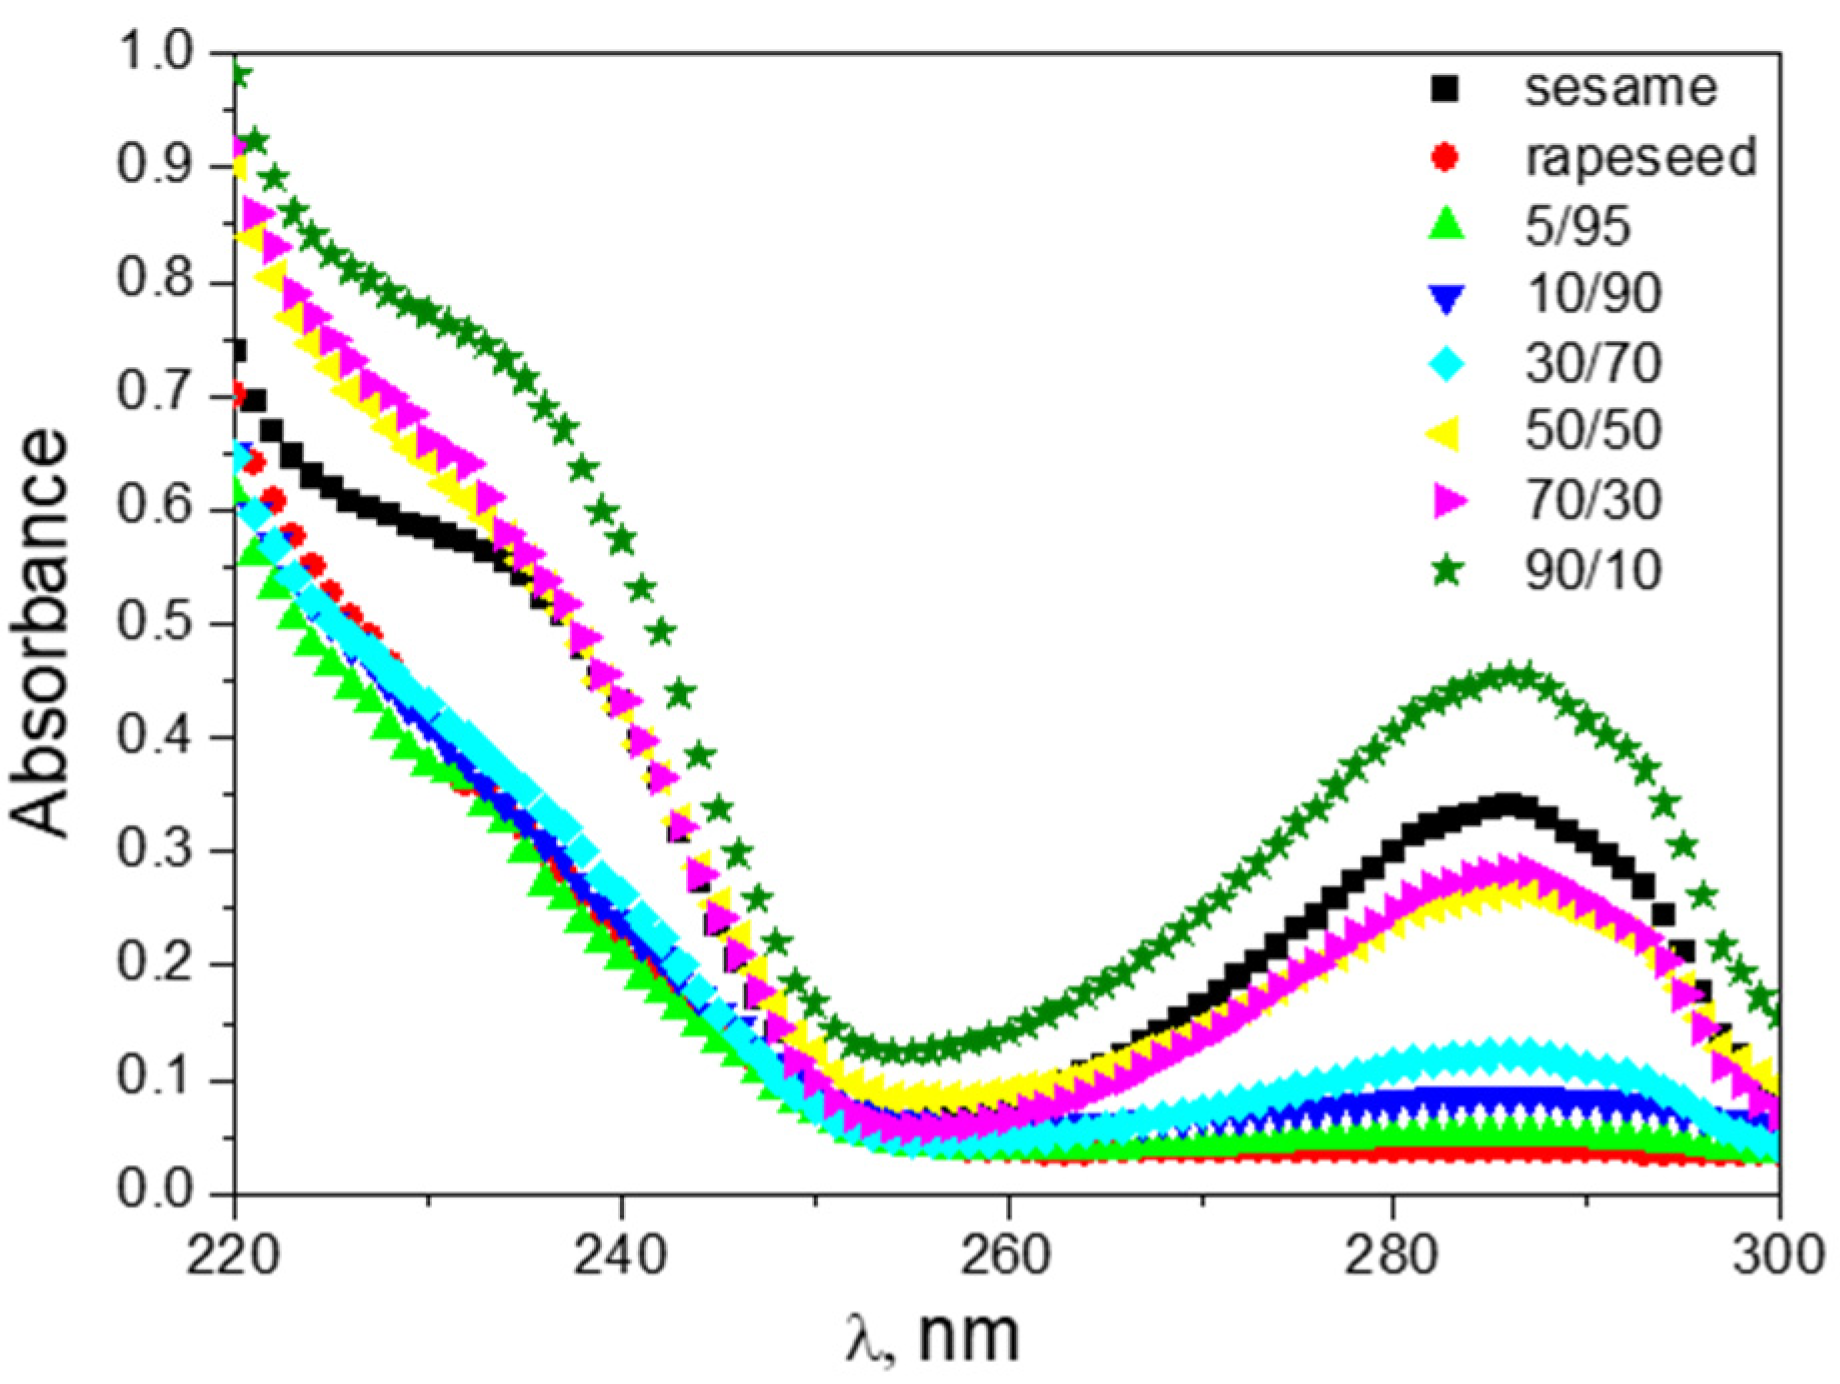
3.4. UV Spectral Analysis

UV spectroscopy can provide information on the quality of the oil, its state of preservation and changes brought about by technological processes. The UV spectra for sesame oil, rapeseed oil and their mixtures used in the study are shown in Figure 3.
It is known from the literature [42] that edible oils were characterized by more pronounced peaks between 230 nm and 290 nm due to the presence of conjugated dienes and trienes of unsaturated fatty acids. They are rich in linoleic and linolenic acids, which are oxidized by isomerized conjugated dienoic and trienoic acids. The conjugated dienes exhibit strong absorption at around 232 nm, while conjugated triene shows an absorption band of approximately 270 nm in vegetable oils.
The results presented in Figure 3 show analog results. It is clearly seen from the figure that UV spectra for all investigated oils are characterized with two peaks at wavelengths 232 nm and approximately 280 nm. The hydroperoxides and the conjugated diene, which may result from its decomposition, show a strong absorption band at approximately 232 nm. The conjugated triene and the secondary oxidation products, particularly diketones, show an absorption band at approximately 280 nm. The similar results are obtained in [43].
The results obtained also show that the values of the absorbance at 232 nm changed from 0.57 (sesame oil) and 0.36 (rapeseed oil) to the following values from studied mixtures: 0.37 (mixture 5/95), 0.38 (mixture 10/90), 0.40 (mixture 30/70), 0.61 (mixture 50/50), 0.64 (mixture 70/30) and 0.76 (mixture 90/10). It was established that the values of the absorbance increased with the mixing of the oils. They increased with increasing concentrations of sesame oil. This behavior occurs because the oxidation of polyunsaturated fatty acids is accompanied by the displacement of isolated double bonds for conjugated double bonds [44].

3.5. SO/RSO Mixtures Color Characteristics

Color measurement in the edible oil industry is essential, as it depends on pigment concentrations, the type of plant and the oil processing method [45]. CIELab color parameters of the studied oils are presented in Table 7. The given values are obtained as an average value from the measurement of 5 samples, with a standard deviation not exceeding 3%.
The mixtures of sesame oil and rapeseed oil have high and nearly constant brightness. The a* parameter of mixtures varies in the range between 0 and 5, which means that the oil’s color is close to greenish. The b* of the mixtures depends on the sesame oil and rapeseed oil concentration ratio in the mixtures. Pure rapeseed oil has the highest b* value—88, which corresponds to yellow color. It may be due to the presence of carotenoids. The sesame oil has the lowest b* value—15, which defines a pale yellow color, which is probably associated with lower carotenoid concentration [46]. The b* for the mixture of oil mixes shows a very good linear dependency on the oil concentrations (R2 = 0.9904).

4. Conclusions

In the present paper, the chemical and physical properties of the mixtures of sesame oil with rapeseed oil were investigated. It was established that the presence of both oils can enhance the nutritional profile, offering a good balance of monounsaturated and polyunsaturated fats. The fatty acid composition of mixtures made from sesame and rapeseed oils can vary depending on the ratio of the two oils. The sesame and rapeseed oil cooling DSC curves are characterized by three exothermic peaks, corresponding to the crystallization of saturated fatty acids, monounsaturated fatty acids and polyunsaturated fatty acids. The established linear dependences between phase transition temperatures and mixtures’ content can be used as a method for identification and quality control of similar systems. UV spectra for all investigated oils are characterized by two peaks at wavelengths 232 nm and approximately 280 nm. The absorption at these wavelengths is due to the presence of conjugated diene and triene systems, respectively, resulting from oxidation processes.
Mixing rapeseed and sesame oils lowers costs, extends shelf life and supports innovation in food technology. Techniques like UV–Vis spectrophotometry and differential scanning calorimetry help detect adulteration in vegetable oils. Understanding the melting points of oil mixtures enables the development of innovative technologies for cold preparations and thermal processing. These findings support competitive manufacturing, promote food technology innovation and contribute to healthier food products.

Author Contributions

Conceptualization, M.M. and G.A.; methodology, K.N. and A.V.; software, Z.P.; validation, A.V., G.A. and O.T.; formal analysis, O.T., K.N., A.V. and M.M.; investigation, O.T., K.N., A.V. and M.M.; resources, G.A.; data curation, Z.P.; writing—original draft preparation, A.V., K.N., M.M. and O.T.; writing—review and editing, M.M. and A.V.; visualization, O.T.; supervision, G.A.; project administration, M.M.; funding acquisition, M.M. All authors have read and agreed to the published version of the manuscript.

Funding

This research was funded by project FP23-FTF-012/25.04.2023, Department of Scientific Research at the University of Plovdiv.

Institutional Review Board Statement

Not applicable.

Informed Consent Statement

Not applicable.

Data Availability Statement

The raw data supporting the conclusions of this article will be made available by the corresponding author upon request.

Conflicts of Interest

The authors declare no conflicts of interest.

References

  1. Wen, C.; Shen, M.; Liu, G.; Liu, X.; Liang, L.; Li, Y.; Zhang, J.; Xu, X. Edible vegetable oils from oil crops: Preparation, refining, authenticity identification and application. Process Biochem. 2023, 124, 168–179. [Google Scholar] [CrossRef]
  2. Tsamesidis, I.; Kalogianni, E.P. The In Vitro, Ex Vivo, and In Vivo Effect of Edible Oils: A Review on Cell Interactions. Pharmaceutics 2023, 15, 869. [Google Scholar] [CrossRef]
  3. Martysiak-Żurowska, D.; Orzołek, M. The correlation between nutritional and health potential and antioxidant properties of raw edible oils from cultivated and wild plants. Int. J. Food Sci. Technol. 2023, 58, 676–685. [Google Scholar] [CrossRef]
  4. Szabó, É.; Csölle, I.; Felső, R.; Kuellenberg de Gaudry, D.; Nyakundi, P.N.; Ibrahim, K.; Metzendorf, M.-I.; Ferenci, T.; Lohner, S. Benefits and Harms of Edible Vegetable Oils and Fats Fortified with Vitamins A and D as a Public Health Intervention in the General Population: A Systematic Review of Interventions. Nutrients 2023, 15, 5135. [Google Scholar] [CrossRef] [PubMed]
  5. Abdollahi, S.; Soltani, S.; Ramezani-Jolfaie, N.; Mohammadi, M.; Sherafatmanesh, S.; Lorzadeh, E.; Salehi-Abargouei, A. The effect of different edible oils on body weight: A systematic review and network meta-analysis of randomized controlled trials. BMC Nutr. 2024, 10, 107. [Google Scholar] [CrossRef]
  6. Voon, P.T.; Ng, C.M.; Ng, Y.T.; Wong, Y.J.; Yap, S.Y.; Leong, S.L.; Yong, X.S.; Lee, S.W.H. Health effects of various edible vegetable oil: An umbrella review. Adv. Nutr. 2024, 15, 100276. [Google Scholar] [CrossRef] [PubMed]
  7. Sadatasl, S.L.; Delavar, A.; Pakbaz, N.; Yavari, G. Evaluation of climate changes and its effects on the performance and well-being of producers and consumers of oilseeds (sesame and rapeseed). J. Clim. Res. 2024, 1402, 85–93. [Google Scholar]
  8. Bedigian, D.; Harlan, J.R. Evidence for cultivation of sesame in the ancient world. Econ. Bot. 1986, 40, 137–154. [Google Scholar] [CrossRef]
  9. Hwang, L.S. Sesame oil. Bailey’s Ind. Oil Fat Prod. 2005, 2, 547–552. [Google Scholar]
  10. Moazzami, A.; Kamal-Eldin, A. Sesame Seed Oil. In Gourmet and Health-Promoting Specialty Oils; Moreau, R.A., Kamal-Eldin, A., Eds.; AOCS Press: Urbana, IL, USA, 2009; pp. 267–282. [Google Scholar]
  11. Narasimhulu, C.A.; Selvarajan, K.; Litvinov, D.; Parthasarathy, S. Anti-atherosclerotic and anti-inflammatory actions of sesame oil. J. Med. Food 2015, 18, 11–20. [Google Scholar] [CrossRef]
  12. Saleem, T.M. Anti-microbial activity of sesame oil. Int. J. Phytochem. Pharmacol. 2011, 1, 21–23. [Google Scholar]
  13. Monteiro, É.M.H.; Chibli, L.A.; Yamamoto, C.H.; Pereira, M.C.S.; Vilela, F.M.P.; Rodarte, M.P.; De Oliveira Pinto, M.A.; Da Penha Henriques do Amaral, M.; Silvério, M.S.; De Matos Araújo, A.L.S.; et al. Antinociceptive and anti-inflammatory activities of the sesame oil and sesamin. Nutrients 2014, 6, 1931–1944. [Google Scholar] [CrossRef] [PubMed]
  14. Gauthaman, K.; Saleem, T.M. Nutraceutical value of sesame oil. Pharmacogn. Rev. 2009, 3, 264. [Google Scholar]
  15. Elkhaleefa, A.; Shigidi, I. Optimization of Sesame Oil Extraction Process Conditions. Adv. Chem. Eng. Sci. 2015, 5, 305–310. [Google Scholar] [CrossRef]
  16. Raymer, P.L. Canola: An emerging oilseed crop. In Trends in New Crops and New Uses; Janick, J., Whipkey, A., Eds.; ASHS Press: Alexandria, VA, USA, 2002; Volume 1, pp. 122–126. [Google Scholar]
  17. Przybylski, R.; Mag, T. Canola/rapeseed oil. In Vegetable Oils in Food Technology: Composition, Properties and Uses; Frank, D., Ed.; CRC Press: Boca Raton, FL, USA, 2002; pp. 107–136. [Google Scholar]
  18. Dupont, J.; White, P.J.; Johnston, K.M.; Heggtveit, H.A.; McDonald, B.E.; Grundy, S.M.; Bonanome, A. Food safety and health effects of canola oil. J. Am. Coll. Nutr. 1989, 8, 360–375. [Google Scholar] [CrossRef]
  19. Lin, L.; Allemekinders, H.; Dansby, A.; Campbell, L.; Durance-Tod, S.; Berger, A.; Jones, P.J. Evidence of health benefits of canola oil. Nutr. Rev. 2013, 71, 370–385. [Google Scholar] [CrossRef] [PubMed]
  20. Banaś, K.; Piwowar, A.; Harasym, J. The potential of rapeseed (canola) oil nutritional benefits wide spreading via oleogelation. Food Biosci. 2023, 56, 103162. [Google Scholar] [CrossRef]
  21. Hashempour-Baltork, F.; Torbati, M.; Azadmard-Damirchi, S.; Savage, G.P. Chemical, Rheological and Nutritional Characteristics of Sesame and Olive Oils Blended with Linseed Oil. Adv. Pharm. Bull. 2018, 8, 107–113. [Google Scholar] [CrossRef]
  22. Oparanti, S.O.; Yapi, K.M.; Fofana, I.; Rao, U.M. Preliminary studies on Improving the Properties of Canola Oil by Addition of Methyl Ester from a Saturated Vegetable Oil. In Proceedings of the 2023 IEEE Electrical Insulation Conference (EIC), Quebec, QC, Canada, 18–21 June 2023. [Google Scholar]
  23. Ramroudi, F.; Yasini Ardakani, S.A.; Dehghani-tafti, A.; Khalili Sadrabad, E. Investigation of the Physicochemical Properties of Vegetable Oils Blended with Sesame Oil and Their Oxidative Stability during Frying. Int. J. Food Sci. 2022. [Google Scholar] [CrossRef] [PubMed]
  24. Ghosh, M.; Upadhyay, R.; Mahato, D.K.; Mishra, H.N. Thermal and oxidative stability assessment of synergistic blends of sunflower and sesame oils tailored for nutritionally stable composition of omega fatty acids. J. Therm. Anal. Calorim. 2019, 135, 2389–2398. [Google Scholar] [CrossRef]
  25. Moghtaderi, F.; Amiri, M.; Raeisi-Dehkordi, H.; Zimorovat, A.; Mohyadini, M.; Salehi-Abargouei, A. The effect of sesame, canola, and sesame-canola oils on cardiometabolic risk factors in overweight adults: A three-way randomized triple-blind crossover clinical trial. Phytother. Res. 2022, 36, 1043–1057. [Google Scholar] [CrossRef]
  26. Amiri, M.; Ghaneian, M.T.; Zare-Sakhvidi, M.J.; Rahmanian, M.; Nadjarzadeh, A.; Moghtaderi, F.; Raeisi-Dehkordi, H.; Zimorovat, A.; Jafari, F.; Zavar-Reza, J.; et al. The effect of canola oil compared with sesame and sesame-canola oil on cardio-metabolic biomarkers in patients with type 2 diabetes: Design and research protocol of a randomized, triple-blind, three-way, crossover clinical trial. ARYA Atheroscler. 2019, 15, 168–178. [Google Scholar] [PubMed]
  27. Chung, J.; Lee, J.; Choe, E. Oxidative Stability of Soybean and Sesame Oil Mixture during Frying of Flour Dough. J. Food Sci. 2004, 69, 574–578. [Google Scholar] [CrossRef]
  28. Heshmati, M.K.; Jafarzadeh-Moghaddam, M.; Pezeshki, A.; Shaddel, R. The oxidative and thermal stability of optimal synergistic mixture of sesame and grapeseed oils as affected by frying process. Food Sci. Nutr. 2022, 10, 1103–1112. [Google Scholar] [CrossRef] [PubMed]
  29. Farhoosh, R.; Esmaeilzadeh Kenari, R. Anti-Rancidity Effects of Sesame and Rice Bran Oils on Canola Oil During Deep Frying. J. Am. Oil Chem. Soc. 2009, 86, 539–544. [Google Scholar] [CrossRef]
  30. ISO 12966-1:2014; Animal and vEgetable Fats and Oils. Gas Chromatography of Fatty acid Methyl Esters—Part 1: Guidelines on Modern Gas Chromatography of Fatty Acid Methyl Esters. ISO: Geneva, Switzerland, 2014.
  31. ISO 12966-2:2017; Animal and Vegetable Fats and Oils. Gas Chromatography of Fatty Acid Methyl Esters—Part 2: Preparation of Methyl Esters of Fatty Acids. ISO: Geneva, Switzerland, 2017.
  32. ISO 3960:2017; Animal and Vegetable Fats and Oils. Determination of Peroxide value—Iodometric (Visual) Endpoint Determination. ISO: Geneva, Switzerland, 2017.
  33. AOCS (American Oil Chemists Society). Official Methods and Recommended Practices of the American Oil Chemists Society, Calculated Iodine Value, 5th ed.; AOCS Press: Champaign, IL, USA, 1999; p. Cd 1c-8. [Google Scholar]
  34. Gerlei, M.; Pierson, H.; Ponçot, M.; Kahn, C.J.; Linder, M. Chemical Composition and Crystallization Behavior of Oil and Fat Blends for Spreadable Fat Applications. Foods 2024, 13, 3305. [Google Scholar] [CrossRef] [PubMed]
  35. Codex-Stan 210-1999; Codex Standard for Named Vegetable Oils. FAO/WHO: Rome, Italy, 2011.
  36. Mohammadi, T.; Hatami, M.; Mirzaee Sisaabad, Y.; Hooshiari, A.; Nejatian, M. Formulation of Blend Oil Containing Canola and Ses-ame Oils without Synthetic Antioxidants. Iranian J. Nutr. Sci. Food Technol. 2014, 9, 83–92. [Google Scholar]
  37. Tan, C.P.; Man, Y.B.C. Differential scanning calorimetric analysis of edible oils: Comparison of thermal properties and chemical composition. J. Am. Oil Chem. Soc. 2000, 77, 143–155. [Google Scholar] [CrossRef]
  38. Minar, M.; Hassanien, M.; Adel, G. Abdel-Razek, Improving the Stability of Edible Oils by Blending With Roasted Sesame Seed Oil as a Source of Natural Antioxidants. J. Asian Sci. Res. 2012, 8, 4074–4083. [Google Scholar]
  39. Aly, A.; Ali, H.; Abdeldaiem, M. Improvement of the sunflower oil stability by blending with moringa or sesame oils. Potravin. Slovak J. Food Sci. 2021, 15, 111–120. [Google Scholar] [CrossRef]
  40. El Khier, M.K.; Ishag, K.E.; Yagoub, A.E. Chemical composition and characteristics of sesame seed cultivars grown in Sudan. Res. J. Agric. Biol. Sci. 2009, 4, 761–766. [Google Scholar]
  41. Alhibshi, E.A.; Ibraheim, J.A.; Hadad, A.S. Effect of Heat Processing and Storage on Characteristic and Stability of Some Edible Oils. In Proceedings of the 6th Int’l Conference on Agriculture, Environment and Biological Sciences, Kuala Lumpur, Malaysia, 21–22 December 2016; pp. 105–109. [Google Scholar]
  42. Malavi, D.; Nikkhah, A.; Raes, K.; Van Haute, S. Hyperspectral Imaging and Chemometrics for Authentication of Extra Virgin Olive Oil: A Comparative Approach with FTIR, UV-VIS, Raman, and GC-MS. Foods 2023, 12, 429. [Google Scholar] [CrossRef]
  43. Hashem, H.; Almoselhy, R.I.; El-Waseif, M.; Magdy, A. Rapid Authentication of Extra Virgin Olive Oil using UV and FTIR Spectroscopy. Middle East J. Appl. Sci. 2020, 10, 263–271. [Google Scholar]
  44. Souza, F.H.; Almeida, L.R.; Batista, F.; Rios, M.A. UV-Visible Spectroscopy Study of Oxidative Degradation of Sunflower Biodiesel. Energy Sci. Technol. 2011, 2, 56–61. [Google Scholar]
  45. Kılıç, K.; Onal-Ulusoy, B.; Boyacı, İ. A novel method for color determination of edible oils in L* a* b* format. Eur. J. Lipid Sci. Technol. 2007, 109, 157–164. [Google Scholar] [CrossRef]
  46. Giacomelli, L.M.; Mattea, M.; Ceballos, C.D. Analysis and characterization of edible oils by chemometric methods. J. Am. Oil Chem. Soc. 2006, 83, 303–308. [Google Scholar] [CrossRef]
Figure 1. Cooling DSC thermograms of sesame and rapeseed oils and their mixtures.
Applsci 15 00704 g001
Figure 2. Heating DSC thermograms of sesame and rapeseed oils and their mixtures.
Applsci 15 00704 g002
Figure 3. Spectra of absorbance of sesame and rapeseed oils and their mixtures.
Applsci 15 00704 g003
Table 1. Fatty acid composition and iodine value of sesame and rapeseed oil.
Title 1Sesame OilRapeseed Oil
C8:0Caprylic0.1 ± 0.0n.d. *
C16:0Palmitic10.4 ± 0.2 a4.4 ± 0.1 b
C16:1Palmitoleic0.2 ± 0.0 a0.2 ± 0.0 a
C17:0Margaric0.1 ± 0.0n.d.
C17:1Heptadecenoic0.1 ± 0.0 a0.2 ± 0.0 b
C18:0Stearic2.7 ± 0.1 a1.4 ± 0.1 b
C18:1Oleic36.7 ± 0.4 a64.7 ± 0.3 b
C18:2Linoleic48.3 ± 0.2 a18.8 ± 0.2 b
C18:3(n−3)α-Linolenic0.8 ± 0.1 a8.5 ± 0.2 b
C20:0Arachidic0.4 ± 0.1 a0.5 ± 0.1 a
C20:1Eicosenoic0.1 ± 0.0 a1.1 ± 0.2 b
C20:2Eicosadienoicn.d.0.1 ± 0.0
C22:0Behenic0.1 ± 0.0 a0.1 ± 0.0 a
Saturated fatty acids, % 13.86.4
Unsaturated fatty acids, % 86.293.6
Monounsaturated fatty acids, % 37.166.2
Polyunsaturated fatty acids, % 49.127.4
Iodine value, gJ2/100 g 122.6 ± 1.0 a115.5 ± 1.2 b
* n.d.—not detected. The results were Mean ± SD (n = 3). The small letters in a row mean differences in the results with a significant level of p < 0.05 (Duncan test).
Table 2. Peroxide value of sesame and rapeseed oil.
Vegetable OilPeroxide Value, meqO2/kg
Sesame1.1 ± 0.2
Rapeseed4.3 ± 0.3
The results were Mean ± SD (n = 3).
Table 3. Fatty acid composition and iodine value of sesame and rapeseed oil mixtures.
Fatty Acid Composition, %5/9510/9030/7050/5070/3090/10
C8:0Caprylic0.3 ± 0.1 a0.3 ± 0.1 a0.3 ± 0.1 a0.2 ± 0.1 a0.3 ± 0.1 a0.2 ± 0.1 a
C10:0Capric0.1 ± 0.0 a0.1 ± 0.0 a0.1 ± 0.0 a0.1 ± 0.0 a0.1 ± 0.0 an.d. *
C14:0Myristic0.1 ± 0.0 a0.1 ± 0.0 an.d.n.d.n.d.n.d.
C15:1Pentadecenic0.4 ± 0.1 a0.3 ± 0.1 a0.3 ± 0.1 a0.2 ± 0.0 b0.3 ± 0.1 a0.2 ± 0.0 b
C16:0Palmitic4.9 ± 0.2 a5.1 ± 0.3 a6.2 ± 0.2 b7.6 ± 0.3 c8.3 ± 0.3 c9.6 ± 0.2 d
C16:1Palmitoleic0.2 ± 0.0 a0.2 ± 0.1 a0.2 ± 0.0 a0.3 ± 0.1 a0.2 ± 0.1 a0.2 ± 0.0 a
C17:0Margaric0.5 ± 0.1 a0.2 ± 0.1 b0.2 ± 0.1 b0.2 ± 0.1 b0.2 ± 0.1 b0.2 ± 0.1 b
C17:1Heptadecenoic0.5 ± 0.1 a0.4 ± 0.1 a b0.4 ± 0.1 a b0.3 ± 0.1 b0.4 ± 0.2 a b0.3 ± 0.1 b
C18:0Stearic1.3 ± 0.1 a1.7 ± 0.2 b2.3 ± 0.1 c2.7 ± 0.2 d3.3 ± 0.3 e3.1 ± 0.1 e
C18:1Oleic61.7 ± 0.4 a60.3 ± 0.3 b55.4 ± 0.4 c49.6 ± 0.5 d45.2 ± 0.2 e38.6 ± 0.3 f
C18:2Linoleic20.0 ± 0.2 a21.5 ± 0.3 b26.6 ± 0.2 c32.9 ± 0.3 d36.8 ± 0.2 e45.1 ± 0.2 f
C18:3(n−3)α-Linolenic8.3 ± 0.1 a8.0 ± 0.2 b6.3 ± 0.1 c4.9 ± 0.3 d3.5 ± 0.2 e1.6 ± 0.1 f
C20:0Arachidic0.5 ± 0.1 a0.5 ± 0.1 a0.5 ± 0.0 a0.4 ± 0.1 a0.5 ± 0.1 a0.4 ± 0.1 a
C20:1Eicosenoic1.0 ± 0.1 a1.0 ± 0.1 a0.9 ± 0.2 a0.5 ± 0.2 b0.5 ± 0.1 b0.3 ± 0.1 b
C20:2Eicosadienoicn.d.0.1 ± 0.0 a0.1 ± 0.0 an.d.0.1 ± 0.0 an.d.
C22:0Behenic0.1 ± 0.0 a0.1 ± 0.0 a0.1 ± 0.0 a0.1 ± 0.0 a0.2 ± 0.1 a0.1 ± 0.0 a
C22:1Erucic0.1 ± 0.0 a0.1 ± 0.0 a0.1 ± 0.0 an.d.0.1 ± 0.0 a0.1 ± 0.0 a
Saturated fatty acids, %7.88.19.711.312.913.6
Unsaturated fatty acids, %92.291.990.388.787.186.4
Monounsaturated fatty acids, %63.962.357.350.946.739.7
Polyunsaturated fatty acids, %28.329.633.037.840.446.7
Iodine value, gJ2/100 g 114.5 ± 1.0 a 115.1 ± 1.4 a 115.3 ± 1.0 a117.6 ± 1.8 ab 116.9 ± 1.1 a 119.1 ± 0.8 b
* n.d.—not detected. The results were Mean ± SD (n = 3). The small letters in a row mean differences in the results with a significant level of p < 0.05 (Duncan test). The limit of detection was 0.05%.
Table 4. Peroxide values of mixtures from sesame/rapeseed oil.
SO/RSOPeroxide Value, meqO2/kg
5/954.5 ± 0.2 d
10/905.0 ± 0.2 e
30/702.7 ± 0.1 c
50/502.2 ± 0.1 b
70/302.5 ± 0.1 c
90/101.6 ± 0.2 a
The results were Mean ± SD (n = 3). The small letters in a column mean differences in the results with a significant level of p < 0.05 (Duncan test).
Table 5. Melting and crystallization phenomena of sesame oil, rapeseed oil and their mixtures.
CrystallizationMelting
SO/RSOT1, °CH1, J/gT2, °CH2, J/gH3, J/gT3, °CT1, °CT2, °CH, J/g
100/0−9.3−5.575--−27.85−53.2−28.8−15.065.48
90/10−9.7−5.625--−29.24−52.3−27.9−14.964.06
70/30−11.3−4.101--−35.29−50.4−26.6−14.966.91
50/50−11.8−2.184--−37.02−47.8−26.0−14.463.99
30/70−14.9−1.444--−46.6−46.1-−13.669.63
10/90−16.9−1.267−35.0−1.140−49.86−44.7-−12.569.38
5/95−17.5−0.652−35.0−2.059−53.6−41.8-−11.871.35
0/100−18.0−0.308−35.1−2.412−58.38−40.9-−12.174.21
R20.98380.9459 0.97410.9655 0.91230.7463
Table 6. Refractive indices measured by Abbe refractometer at 20 °C.
Refractive IndicesSO5/9510/9030/7050/5070/3090/10RSO
1.4729 ±
0.0001 d
1.4711 ±
0.0002 a
1.4711 ±
0.0002 a
1.4711 ±
0.0003 a
1.4713 ±
0.0002 a
1.4720 ±
0.0001 bc
1.4724 ±
0.0001 c
1.4718 ±
0.0002 b
The results were Mean ± SD (n = 6). The small letters in a row mean differences in the results with a significant level of p < 0.05 (Duncan test).
Table 7. CIELab color parameters of sesame oil, rapeseed oil and their mixtures *.
Sesame Oil/Rapeseed OilLa*b*
SO97.3 ± 0.7 a1.1 ± 0.4 g14.7 ± 1.3 i
90/1096.9 ± 0.2 b1.5 ± 0.1 f23.7 ± 2.1 g
70/3096.3 ± 1.2 c5.3 ± 0.2 a33.1 ± 1.6 f
50/5095.9 ± 1.1 d2.9 ± 0.1 e55.5 ± 1.1 e
30/7095.5 ± 0.7 e3.6 ± 0.5 d68.1 ± 0.9 d
10/9095.2 ± 0.5 e4.2 ± 0.4 c78.5 ± 0.7 c
5/9595.3 ± 0.1 e1.1 ± 0.3 g82.8 ± 1.1 b
RSO95.2 ± 0.3 e4.4 ± 0.5 b87.8 ± 0.8 a
*, L scale: Light vs. dark where a low number (0–50) indicates dark and a high number (51–100) indicates light; a* scale: Red vs. green where a positive number indicates red and a negative number indicates green; b* scale: Yellow vs. blue where a positive number indicates yellow and a negative number indicates blue. The results were Mean ± SD (n = 5). The small letters in a row mean differences in the results with a significant level of p < 0.05 (Duncan test).
Disclaimer/Publisher’s Note: The statements, opinions and data contained in all publications are solely those of the individual author(s) and contributor(s) and not of MDPI and/or the editor(s). MDPI and/or the editor(s) disclaim responsibility for any injury to people or property resulting from any ideas, methods, instructions or products referred to in the content.

