Article

Saline–CO2 Solution Effects on the Mechanical Properties of Sandstones: An Experimental Study

1
School of Civil Engineering and Architecture, Southwest University of Science and Technology, Mianyang 621010, China
2
State Key Laboratory of Geomechanics and Geotechnical Engineering, Institute of Rock and Soil Mechanics, Chinese Academy of Sciences, Wuhan 430071, China
3
China Petroleum Exploration and Development Research Institute, China Petroleum & Chemical Corporation, Beijing 102206, China
*
Author to whom correspondence should be addressed.
Appl. Sci. 2025, 15(2), 607; https://doi.org/10.3390/app15020607
Submission received: 2 December 2024 / Revised: 4 January 2025 / Accepted: 8 January 2025 / Published: 10 January 2025
(This article belongs to the Topic Exploitation and Underground Storage of Oil and Gas)

Abstract

:
In deep brine oil and gas injection–production operations, the combined long-term effects of brine and carbon dioxide on rock mechanical properties are not clear. In order to solve this problem, the influence of long-term salt–CO2 environment on the mechanical properties of sandstone is discussed. The mechanism of interaction evolution and fracture propagation was studied in detail by NMR, the triaxial compression test and a CT scan. The results show that the triaxial compressive strength and mass of sandstone decrease first and then increase with the prolonging of soaking time. The proportion of micropores first decreased and then increased, while the proportion of medium and large pores first increased and then decreased. The pores obtained by Avizo’s segmentation of the threshold value of CT sections first increased and then decreased, and the fractal dimensions obtained first increased and then decreased. In particular, the calcium ions in the immersion solution increased first and then decreased. The reaction rate was obtained and verified according to the changes in calcium carbonate mass and calcium ion mineralization at different times. The failure mode of the sample gradually changed from /-shaped failure to V-shaped composite failure, then to local /-shaped failure, and finally to X-shaped composite failure. On this basis, the process of sandstone was divided into the dissolution stage, precipitation stage and secondary dissolution stage, and the rock microstructure change model under a salt–CO2 environment was established. The mechanics, temperature, chemical interaction mechanism and fracture propagation mechanism of sandstone under a salt–CO2 environment are discussed.

1. Introduction

In the process of the oil and gas injection and production cycle, a complex geological environment will be encountered, especially in deep salt water oil and gas operations. Due to the action of carbon dioxide, the mechanical properties of rocks will deteriorate in a short time. This degradation will improve the exploitation and utilization efficiency of oil and gas resources. Hao et al. [1] soaked siltstone in a carbon dioxide solution for 5, 10, 15, 20, 25 and 30 days, respectively, and found that with the increase in soaking time, the uniaxial compressive strength and elastic modulus of siltstone showed a downward trend, and Poisson’s ratio increased to varying degrees. The short-term effect of carbon dioxide will reduce the mechanical properties of rocks [2,3,4,5]. Zhao et al. [6] obtained a T2 spectrum of pore size distribution before and after CO2 injection in sandstone cores by means of nuclear magnetic resonance, and found that the total volume of pores increased significantly after 48 h of a CO2 injection, while the mesopore decreased. The short-term effect of carbon dioxide changes the physical properties of rocks, namely porosity and permeability [7,8,9,10]. An et al. [11] used a self-developed CO2 dynamic alteration device to soak rocks for 1, 3, 5 and 7 days, revealing the alteration damage mechanism of CO2. Suto et al. [12] immersed granite in a carbon dioxide solution for 6 h, 24 h and 168 h, and found that the injection of carbon dioxide promoted the dissolution of granite and the precipitation of secondary minerals. Carbon dioxide dissolves rocks, and thus changes their mineral composition [13,14,15,16,17]. The interaction between a brine solution and rock affects the fracture mechanical properties of reservoir and sealed rock [18,19,20,21,22,23].
Jiang et al. [24] immersed the sandstone of the Three Gorges reservoir in a brine solution for five cycles, and observed two typical macroscopic damage modes, surface spalling and internal cracking, as the cycle increased. A saline solution can affect fracture propagation patterns in rocks. Liang et al. [25] soaked gypsum in salt water for up to 80 days and found that its uniaxial strength decreased to different degrees with time. The saline solution degrades the mechanical properties of the rock [26,27]. A saline solution also has an impact on rock mineral composition [28,29,30]. Feng et al. [31] carried out CT scanning of the triaxially loaded sandstone after immersion in a saline solution, analyzed the damage evolution mechanism of sandstone, and proposed a damage model based on the influence of chemical corrosion and the CT value.
To sum up, as shown in Table 1, although many scholars have conducted in-depth studies on the effects of carbon dioxide and a salt water solution on the mechanical properties of rocks soaked in the short term, it is of great significance for the oil and gas injection and production of deep salt water reservoirs in the short term. But what about long-term oil and gas production? In this case, is it the same as the combined effects of brine, supercritical and carbon dioxide on the mechanical properties of sandstone reservoirs in the short term? Therefore, it is necessary to further study the long-term effects of a salt water and carbon dioxide environment on the mechanical properties of sandstone.

2. Experimental Designs

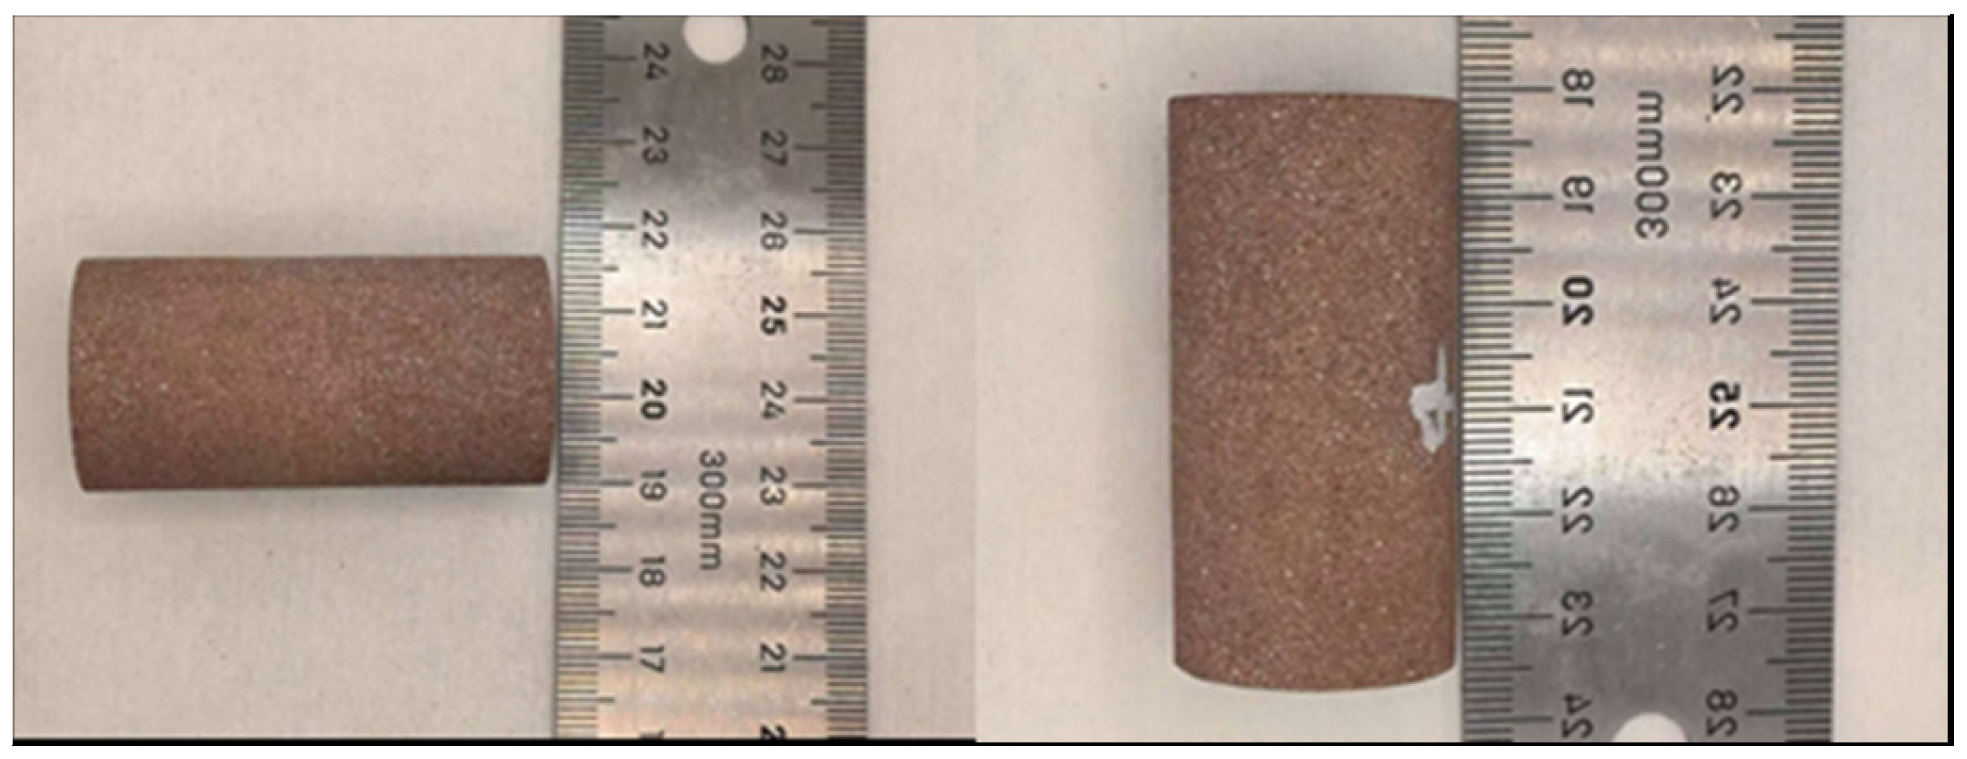
2.1. Sample Preparation

A study of a gas storage project in Hubei Province was selected as the test sample. X-ray diffraction analysis (XRD) revealed that quartz (38.28%) and albite (32.98%) are the primary components of this type of rock, with additional components including potash feldspar (13.85%), kaolinite (7.83%), calcium carbonate (5.47%) and illite (1.58%). Based on the fundamental parameters of various sandstones (as shown in Table 2), such as particle size, density and wave speed, the experimental results indicate that the rocks studied exhibited good homogeneity, as detailed in Figure 1. The research team drilled cores on-site and processed them into cylindrical samples that conform to the standards set by the International Society of Rock Mechanics, measuring φ 25 mm × 100 mm. These experimental samples were uniformly numbered. During the preliminary inspection of the experimental samples, it was observed that the unevenness of the end face and the non-parallelism of the upper and lower ends fell within acceptable limits.

2.2. Test Equipment

Various types of equipment were used in the experiments, including a triaxial compression loading test system, a nuclear magnetic resonance (NMR) analyzer, a CT scanning imaging system, an ion chromatograph and conventional porosity testing equipment. A diagram of the soaking equipment is shown in Figure 2. The triaxial test system adopted the MTS815 testing machine of the Wuhan Institute of Rock and Soil Mechanics, Chinese Academy of Sciences. The methods used to test the microscopic properties of sandstone include nuclear magnetic resonance, CT scanning, and pore permeability. The nuclear magnetic resonance testing equipment adopted the MacroMR12-150H analyzer (Suzhou, China) in the laboratory of the Wuhan Institute of Rock and Soil Mechanics, Chinese Academy of Sciences. The CT scanning equipment adopted the Zeiss Xradia 410Versa micron CT scanner of the Laboratory of the Wuhan Institute of Rock and Soil Mechanics, Chinese Academy of Sciences. The ion concentration was measured by Thermo Scientific ICS-5000 ion chromatograph of the Research Institute of Exploration and Development of Jianghan Oilfield, Sinopec. In order to support the above experiments, electronic balances, vernier calipers and other experimental materials were also equipped.

2.3. Test Methods

In the immersion experiment, the reactor temperature was set at 80 °C and the pressure was maintained at 10 MPa. The soaking time was divided into 5 different stages in January, February, March and April, with 3 samples in each month and 3 samples not soaked; a total of 15 samples were collected. The long-term effect of the saline–CO2–rock reaction was observed. The specific experimental steps were as follows. First, the rock sample was put into the reactor; then, groundwater was added and the lid was sealed. Next, a wrench was used to tighten eight large, high-strength bolts to secure the reactor’s seal. Then, the CO2 inlet pipe valve of the gas injection pressure measuring port of the reactor was opened and the data processing equipment started. Then, the valve of the CO2 cylinder, the cylinder switch of the pressurization system, and the switch of the gas storage tank and its outlet switch were opened. Finally, the air compressor was started to increase the pressure of carbon dioxide gas. After the pressure was stabilized, the carbon dioxide was converted into a liquid under high pressure and flowed into the reactor to soak the internal rock samples. When the CO2 capacity in the reactor reached the required level, the intake valve and other related gas cylinders and storage tanks were switched off. The heater was then activated and the rock sample in the reactor was heated using the heater and a second temperature sensor. At the same time, the first temperature sensor and pressure sensor collected temperature and pressure data from the reactor, and then these data were processed through the data device for calculation and analysis. In order to compare the influence of different soaking time on the strength and failure mode of sandstone under different salt–CO2 environments, triaxial compression tests were carried out on samples with different soaking times under the confining pressure of 15 MPa. In addition, in order to study the effect of saline–CO2 on the micro-interaction mechanism of sandstone, detailed analysis tests such as nuclear magnetic resonance and CT scanning were carried out on sandstone samples before and after immersion.
This study employed Avizo software (2020.1) to convert CT images to grayscale and enhance their quality for improved readability. The specific process is illustrated in Figure 3. Additionally, a median filter was applied to the CT images to effectively reduce noise and enhance image clarity. It is noteworthy that the threshold segmentation method is a widely utilized technique in digital core image processing, capable of effectively extracting significant features from the images.
When the gray value is lower than the set threshold T, the gray value is redefined as 0. After threshold segmentation processing, the slice image is finally obtained.
f ( x ,   y ) = 1 ,   f ( x ,   y ) T 0 ,   f ( x ,   y ) < T
In this study, f ( x ,   y ) represents the original gray value of the pixel at coordinates ( x ,   y ) , while f ( x ,   y ) denotes the gray value of the pixel following binarization. After processing the image, Avizo software was employed to construct a three-dimensional CT scan image.
To investigate the strength, softening, hardening and damage characteristics of sandstone, we conducted CT scans on samples that were subjected to immersion testing for varying durations of corrosion. The central cylindrical area was standardized at 25 mm × 50 mm, and we utilized Avizo software for two-dimensional reconstruction. Within the reconstructed volume, we focused on horizontal sections to analyze the specific details of the damage patterns.
This study employed the box dimension method [32,33] to perform a statistical analysis on the horizontal sections of damaged pores across various soaking months, resulting in the derivation of the two-dimensional fractal dimension D. This parameter effectively quantifies the complexity of damaged pores.
ln   N ( s ) = a D ln ( s )
Among them, s represents the size of the covering grid and N(s) represents the number of grids with non-empty states. Furthermore, a is defined as a constant value.

3. Test Results and Analysis

3.1. Sandstone Mechanical Experimental Results

The analysis of the experimental results revealed that the failure process of the samples could be categorized into four distinct stages: compaction, elastic, plastic and final failure. Figure 4 illustrates the stress–strain curve for the specimen at each stress stage throughout the compression process. Upon processing the sample test data, we derived the mechanical parameters of the samples corresponding to different durations of corrosion, with the specific results presented in Table 3. The findings depicted in Figure 3 indicate that during the corrosion process, the compressive strength of the samples exhibits an increasing trend in the later stages of immersion. Furthermore, the presence of brine–CO2 significantly influenced the rock strength during immersion.

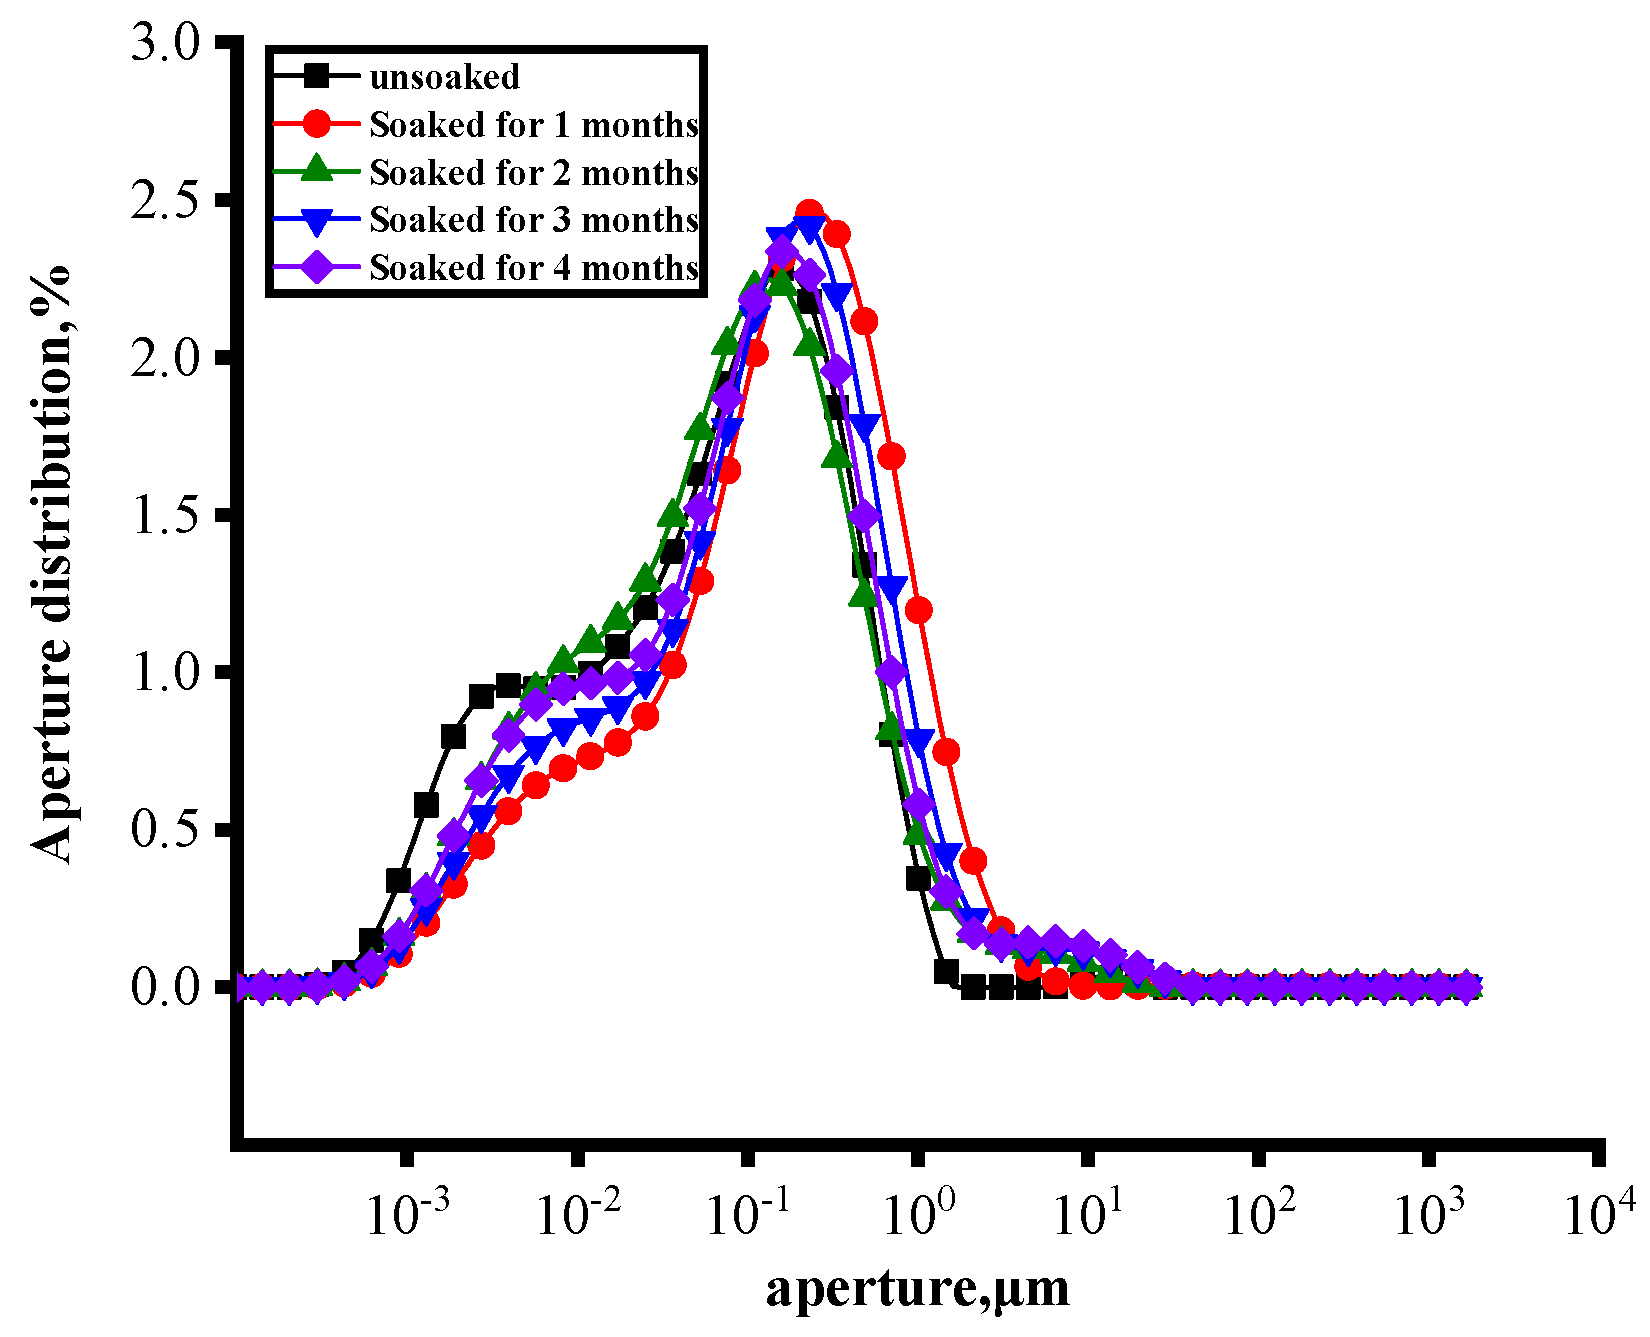
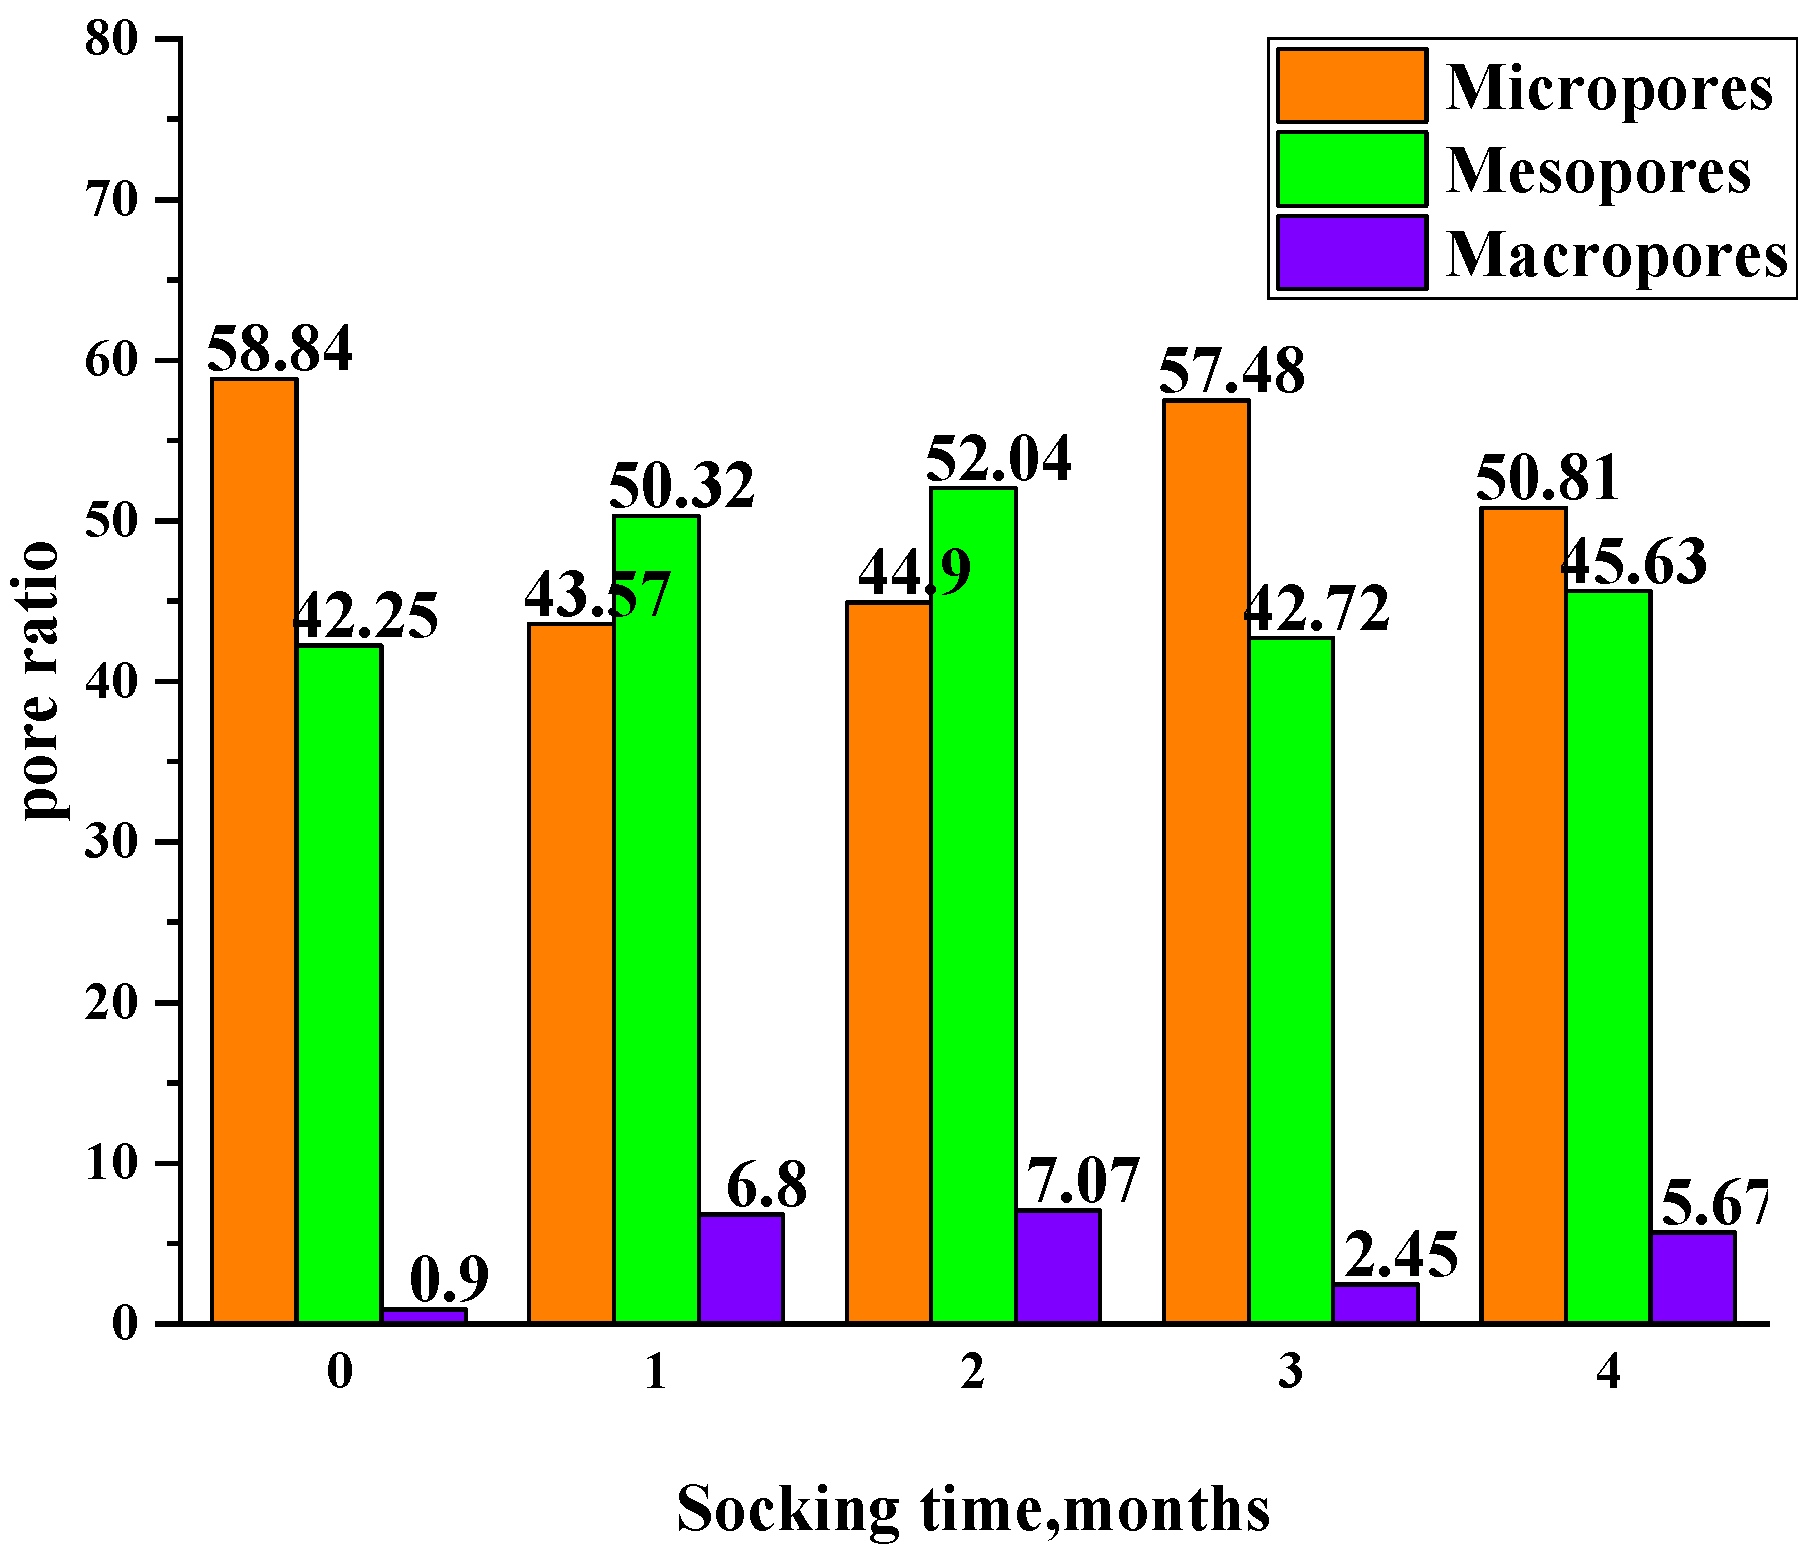
3.2. The Results of the NMR Experiment

As the rock underwent soaking, certain minerals were either dissolved or regenerated. Notably, calcium carbonate was first dissolved and subsequently reformed as a secondary mineral. This process induces alterations in the microscopic pore structure and strength of the sample. Building on this phenomenon, the research team conducted NMR experiments to investigate the corrosion process of the sample. Figure 4 illustrates the T2 spectrum pore size distribution results over different months.
Rock is recognized as a material with porous properties. In the context of NMR experiments, relaxation time refers to the duration required for the magnetization vector of the nucleus to return to an equilibrium state in the presence of an external magnetic field. For fluids contained within rock masses, relaxation times are typically categorized into three types: volume relaxation, surface relaxation and diffusion relaxation [34]. When the rock is subjected to a uniform magnetic field, the influences of volume relaxation and diffusion relaxation can generally be regarded as negligible. Consequently, the transverse relaxation time can be represented in a simplified approximate form [35].
1 T 2 1 T 2 S = ρ 2 S V = ρ 2 F S r
In the equation, ρ 2 represents the transverse relaxation rate, and its units can be either μm/s or nm/s [36]. S denotes the surface area of the pore, while V indicates the volume of the pore. The F S value is closely associated with the shape of the pores. The shape factor for spherical pores is 3, for columnar pores it is 2 and for layered pores it is 1; all of these shape factors are dimensionless. Furthermore, r refers to the characteristic length corresponding to the pore shape [37].
When normalizing the NMR spectral curves of sandstone, it can be inferred from the principle of relaxation time [38] that the transverse relaxation time is approximately equal to the radius of the pore [39,40]. Therefore, in the normalized accumulation curve, the relaxation time can serve as an approximate reflection of the pore radius of coarse sandstone. Based on the results of the NMR T2 spectrum, the pore size range can be categorized into three groups: pores with a diameter ranging from 0.0002 μm to 0.07 μm are termed micropores, those with a diameter from 0.07 μm to 1 μm are referred to as mesopores, and pores with a diameter of 1 μm or larger are classified as macropores, with those up to 26 μm also falling under this classification. Utilizing this classification criterion, coarse sandstone samples subjected to different corrosion times can be categorized accordingly. As illustrated in the results presented in Figure 5, it is observed that as the soaking time increases, the percentage of micropores initially decreases before increasing again, the percentage of mesopores first rises and then declines, while the percentage of macropores shows a preliminary increase followed by a decrease.
The stress change curve of sandstone under varying soaking time conditions can be categorized into three distinct stages: the dissolution stage, the mineralization stage and the secondary dissolution stage, as illustrated in Figure 6. The analysis of the figure reveals that during the dissolution stage, the compressive strength of coarse sandstone decreases rapidly. The proportion of micropores declines from 58.69% to 41.12%, while the proportion of mesopores increases from 40.41% to 52.66%, and the proportion of macropores rises from 0.9% to 6.22%. This indicates that supercritical CO2 solution molecules predominantly enter the mesopores. In the mineralization stage, the compressive strength of coarse sandstone not only stabilizes, but also exhibits an upward trend. At this point, the proportion of micropores decreases from 41.12% to 40.06%, the proportion of mesopores increases from 52.66% to 54.49%, and the proportion of macropores declines from 6.22% to 5.45%. This change suggests that regenerated calcium carbonate molecules primarily fill the micropores and macropores. During the secondary dissolution stage, the compressive strength begins to decrease again, with the proportion of micropores increasing from 40.06% to 45.03%, while the proportion of mesopores decreases to 49.81%, and the proportion of macropores slightly reduces to 5.16%. These results indicate that, at this stage, supercritical CO2 solution molecules predominantly re-enter the micropores.

3.3. Results of the CT

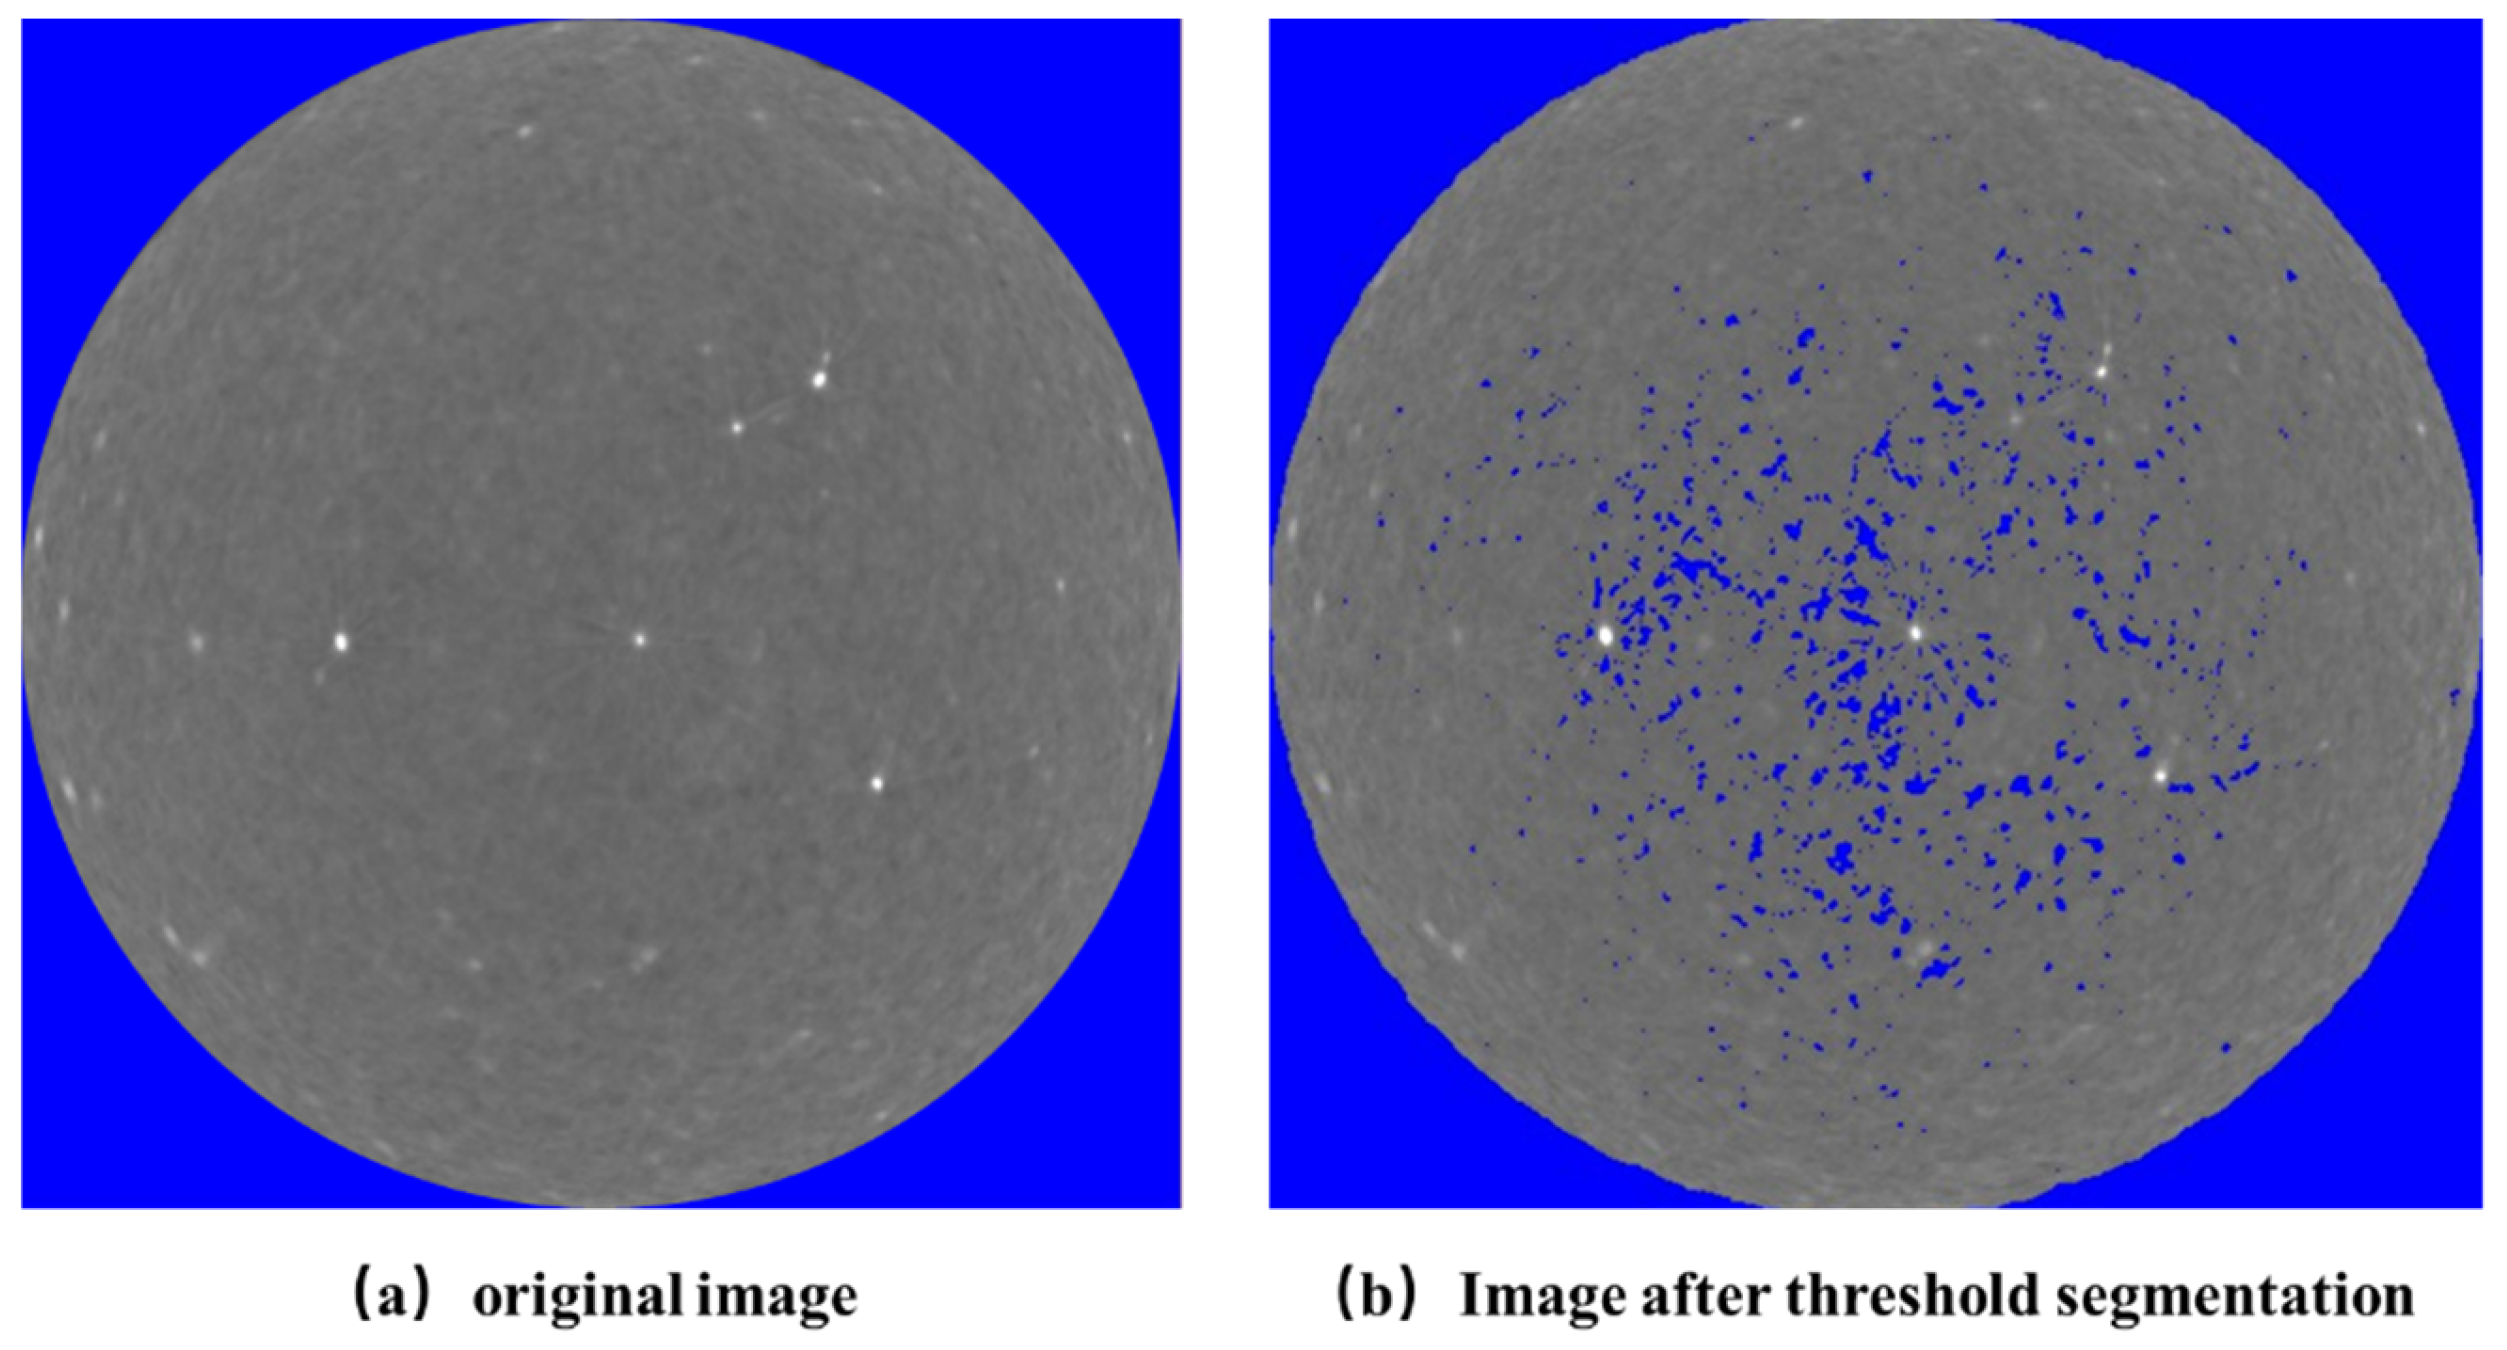
3.3.1. Processing of CT Images

The results obtained from the Avizo software indicate that the porosity of the unimmersed specimen was 19.51%, in contrast to the porosity measured using the conventional gas measurement method, which was 11.059%. This discrepancy between the two measurement results is significant, primarily because the CT scan captures both connected and non-connected pores, whereas the conventional gas measurement method only accounts for connected pores. Consequently, the porosity measurements derived from Avizo software were higher than those obtained through ordinary gas measurement methods. By analyzing the differences between these two measurements, it is possible to deduce the porosity of the non-connected pores.

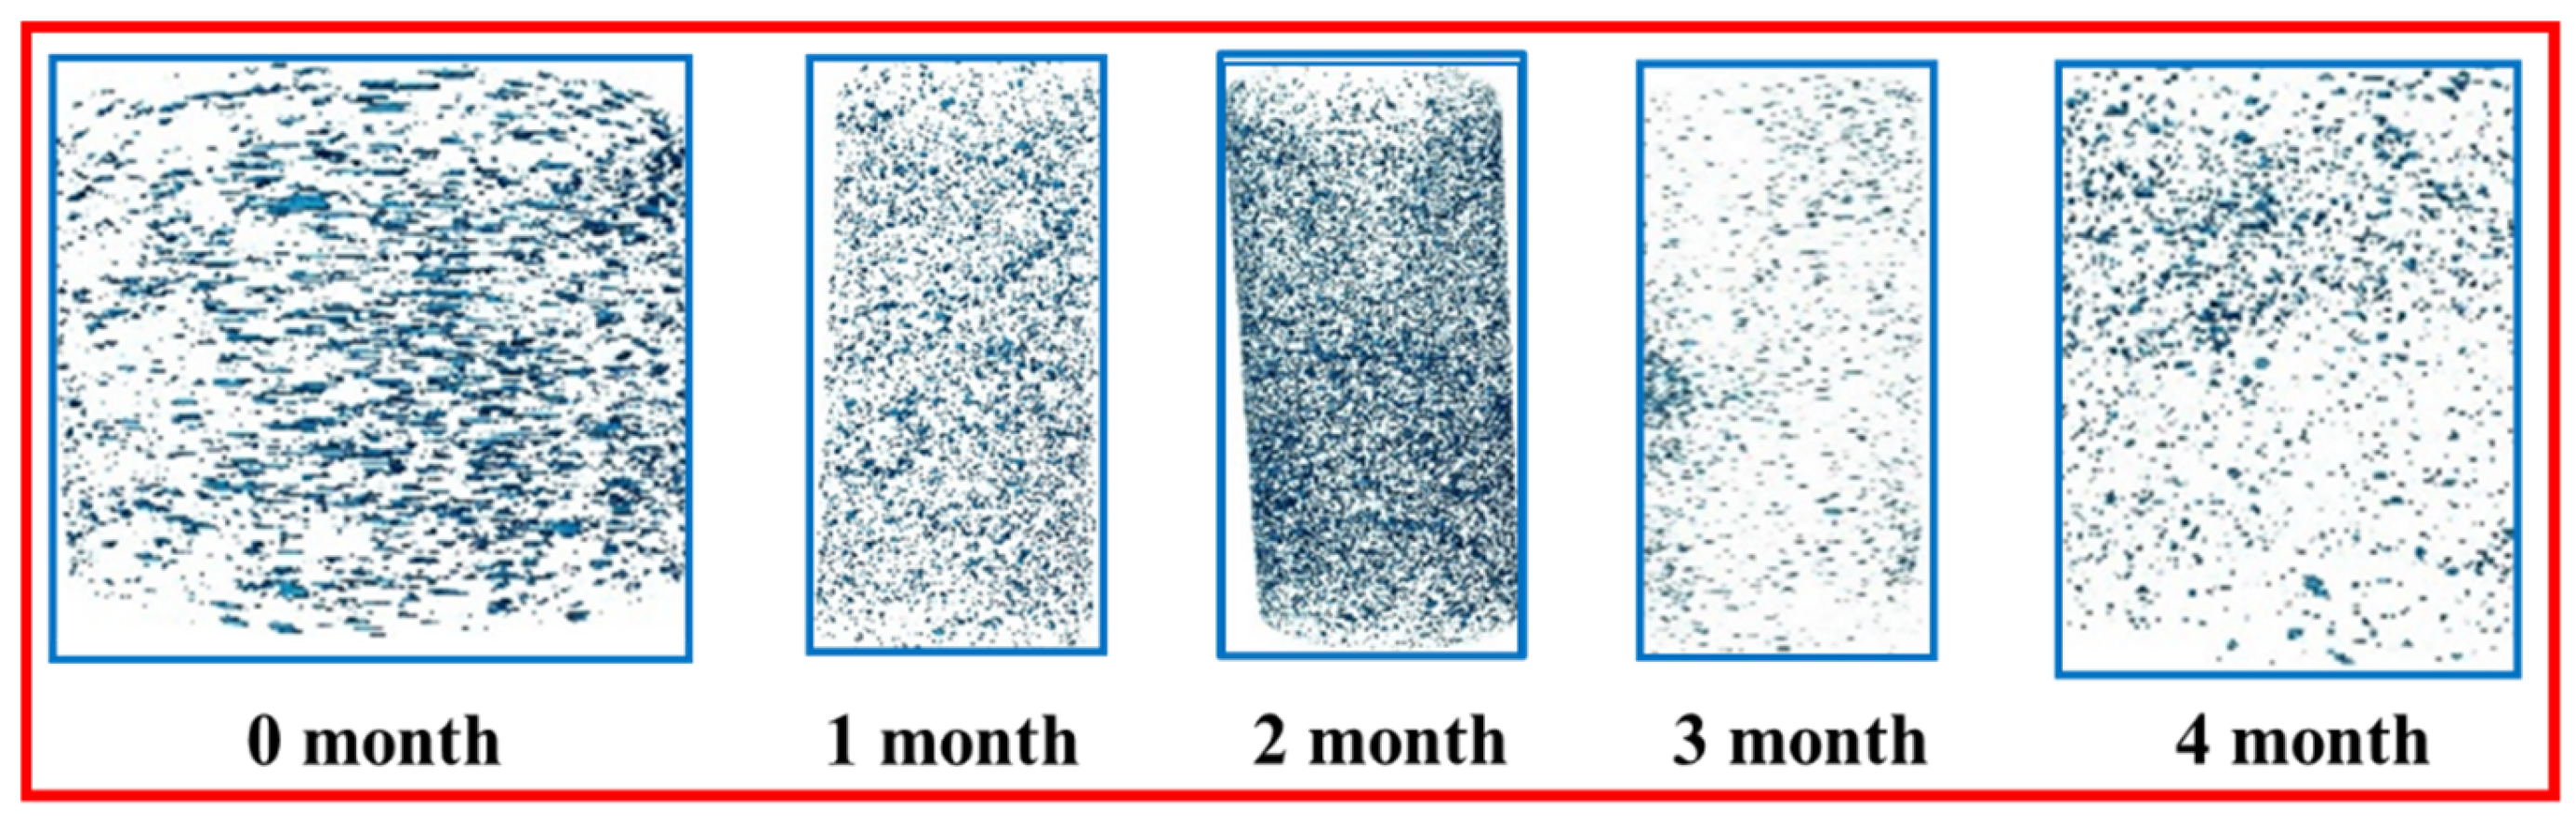
3.3.2. Visualization of Pore Space Under CT Scanning

Figure 7 shows the two-dimensional pore structure of the samples under different corrosion months, in which the blue part represents the pore area.
Porosity is defined as the ratio of pore volume to the original sample volume. By performing nonlinear fitting of the porosity data points, we obtained a relationship curve between soaking months and porosity, as illustrated in Figure 8. Furthermore, the relationship between soaking time and porosity can be derived over time, with the specific expression being
φ = 14.90 3.87 t + 13.05 t 2 6.95 t 3 + 0.97 t 4
In this study, φ represents the porosity obtained from the CT scan of the sample at time t . When the soaking time of the rock sample increased from 0 months to 2 months, the change rate of porosity reached 29.60%. These data indicate that the combination of brine and CO2 significantly enhances the development of damaged pores during the dissolution phase. However, as the soaking time further extended, the porosity of the sandstone decreased rapidly, entering the precipitation stage, during which many pores become filled. Ultimately, the porosity increased slightly, suggesting that the effect of the combination of brine and CO2 in the secondary dissolution stage on the development of damaged pores was relatively diminished.

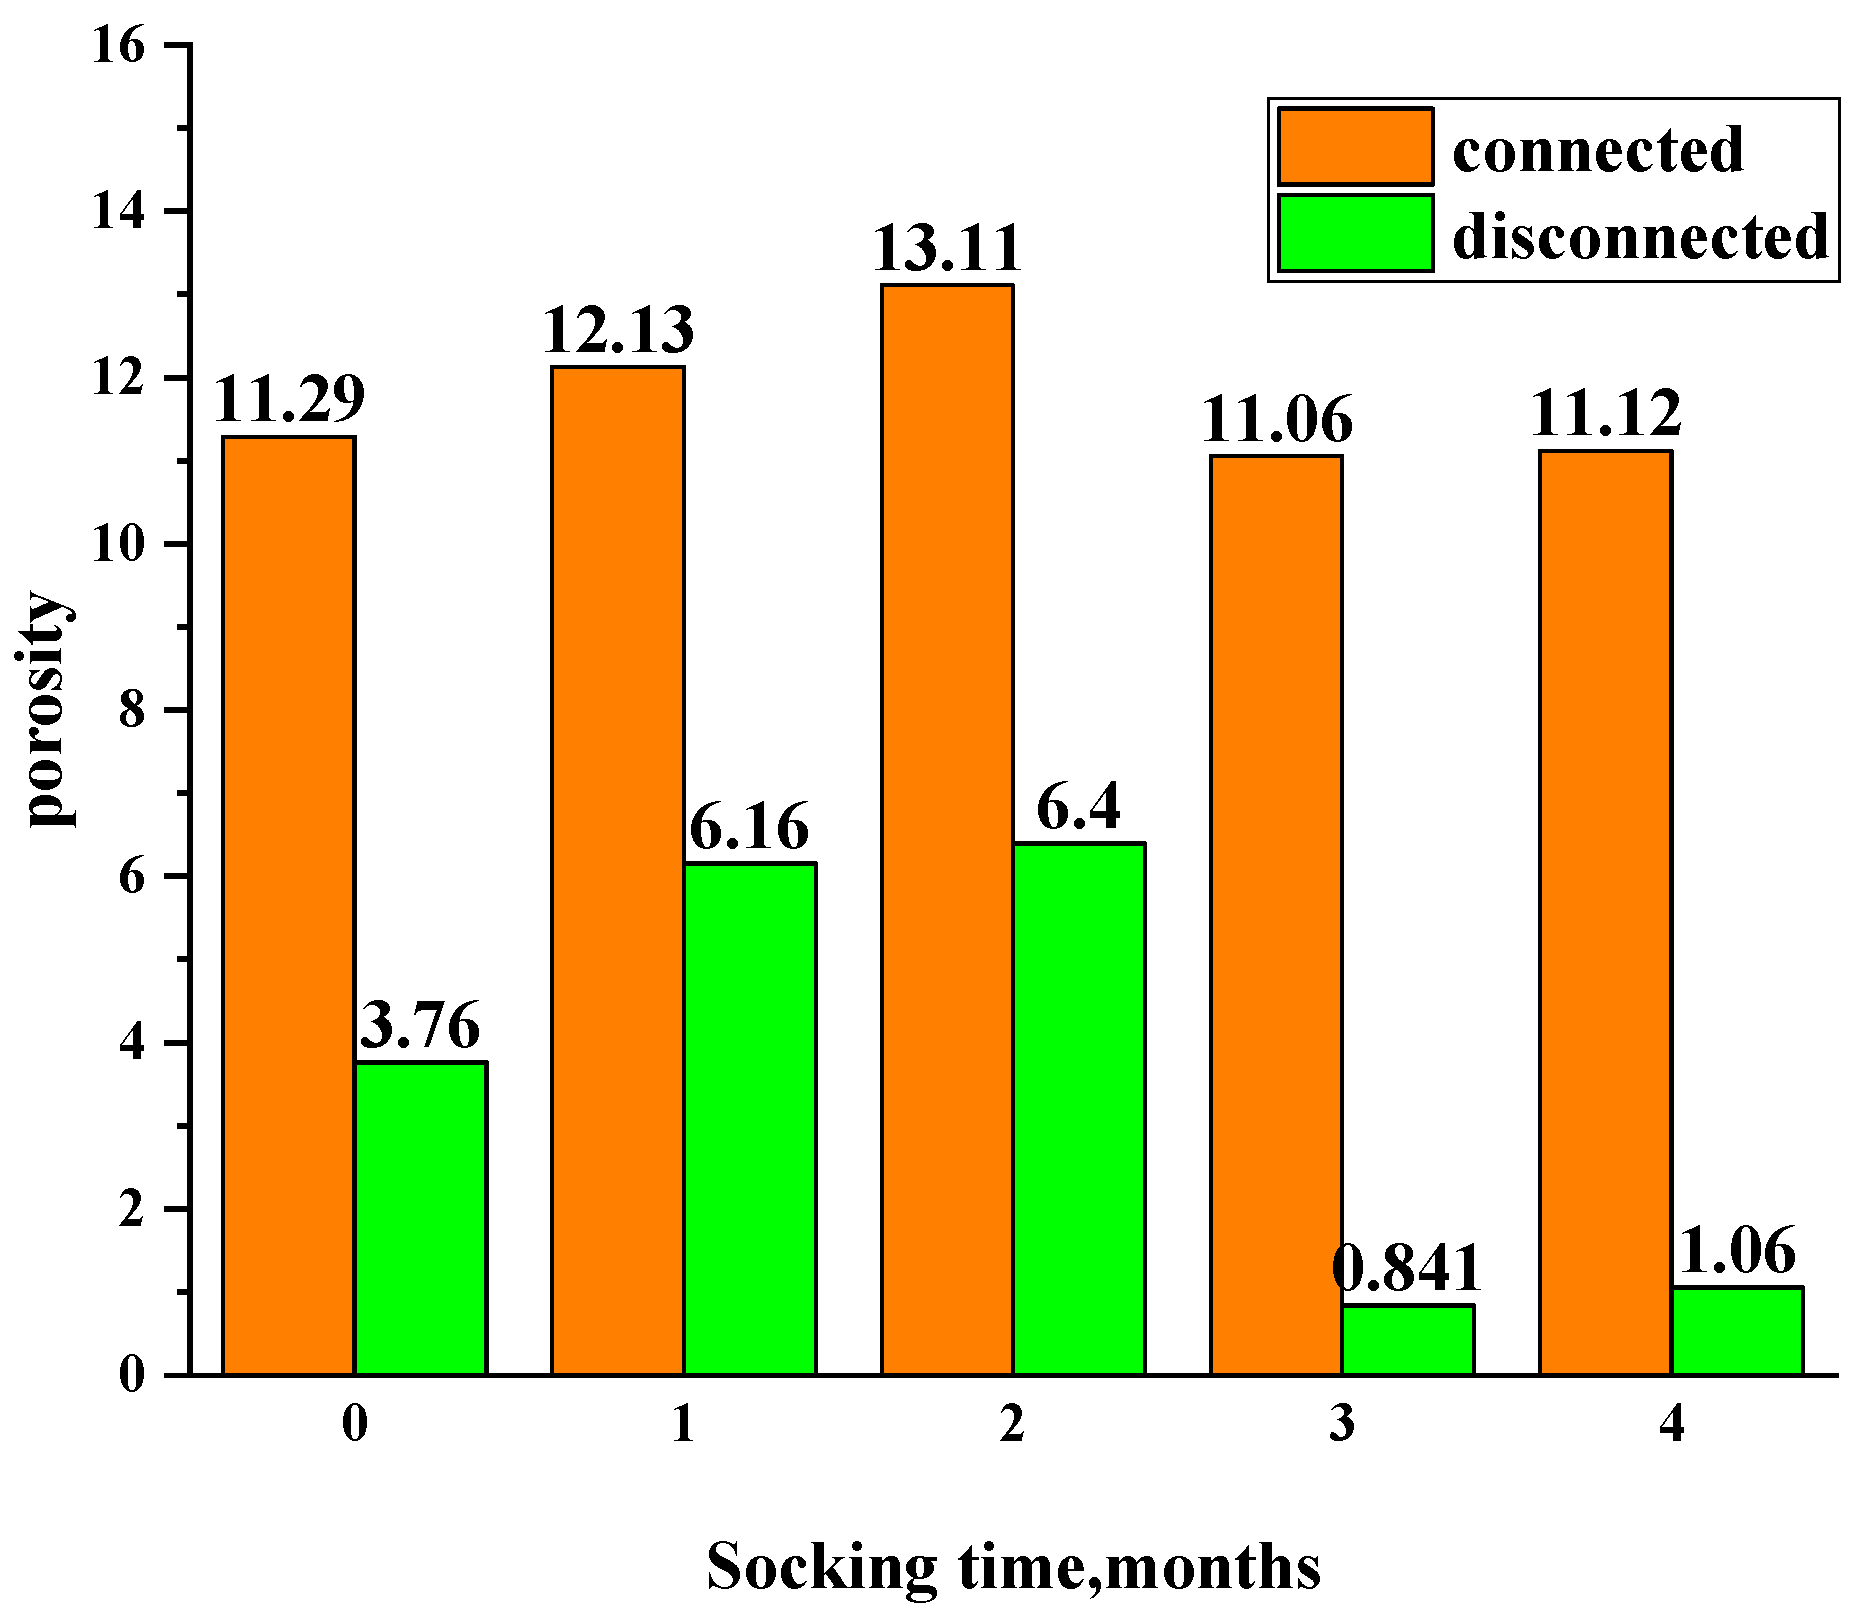
3.3.3. Changes in Non-Connected and Connected Pores at Different Soaking Times

As illustrated in Figure 9, the non-connected pore porosity of sandstone in its unsoaked state is 3.76%. This porosity exhibited significant changes with increasing soaking time. After one month of soaking, the porosity of non-connected pores increased to 6.16%, indicating a substantial rise. However, after two months of soaking, while the porosity further increased to 6.40%, the rate of increase began to slow. As the soaking time continued to extend, the porosity of non-connected pores experienced further alterations. By three months, the porosity reached a notable inflection point, dropping significantly to 0.841%. Following four months of soaking, another inflection point was observed, with the porosity of non-connected pores rising slightly to 1.06%. In the context of ordinary porosity testing, porosity is estimated based on the flow rate of the injected gas, meaning that the actual measured porosity reflects the connected pore porosity. In the unsoaked condition, the connected pore porosity of sandstone was 11.29%. As the soaking time increased, the connected pore porosity also changes. After one month, the connected pore porosity reached 12.13%, demonstrating an upward trend. After two months of immersion, the connected pore porosity was recorded at 13.11%, continuing to increase but at a slower rate. By three months, the connected pore porosity fell to 11.06%, marking the beginning of an inflection point with a decrease of 15.64%. After four months of soaking, the connected pore porosity experienced a slight increase to 11.12%.

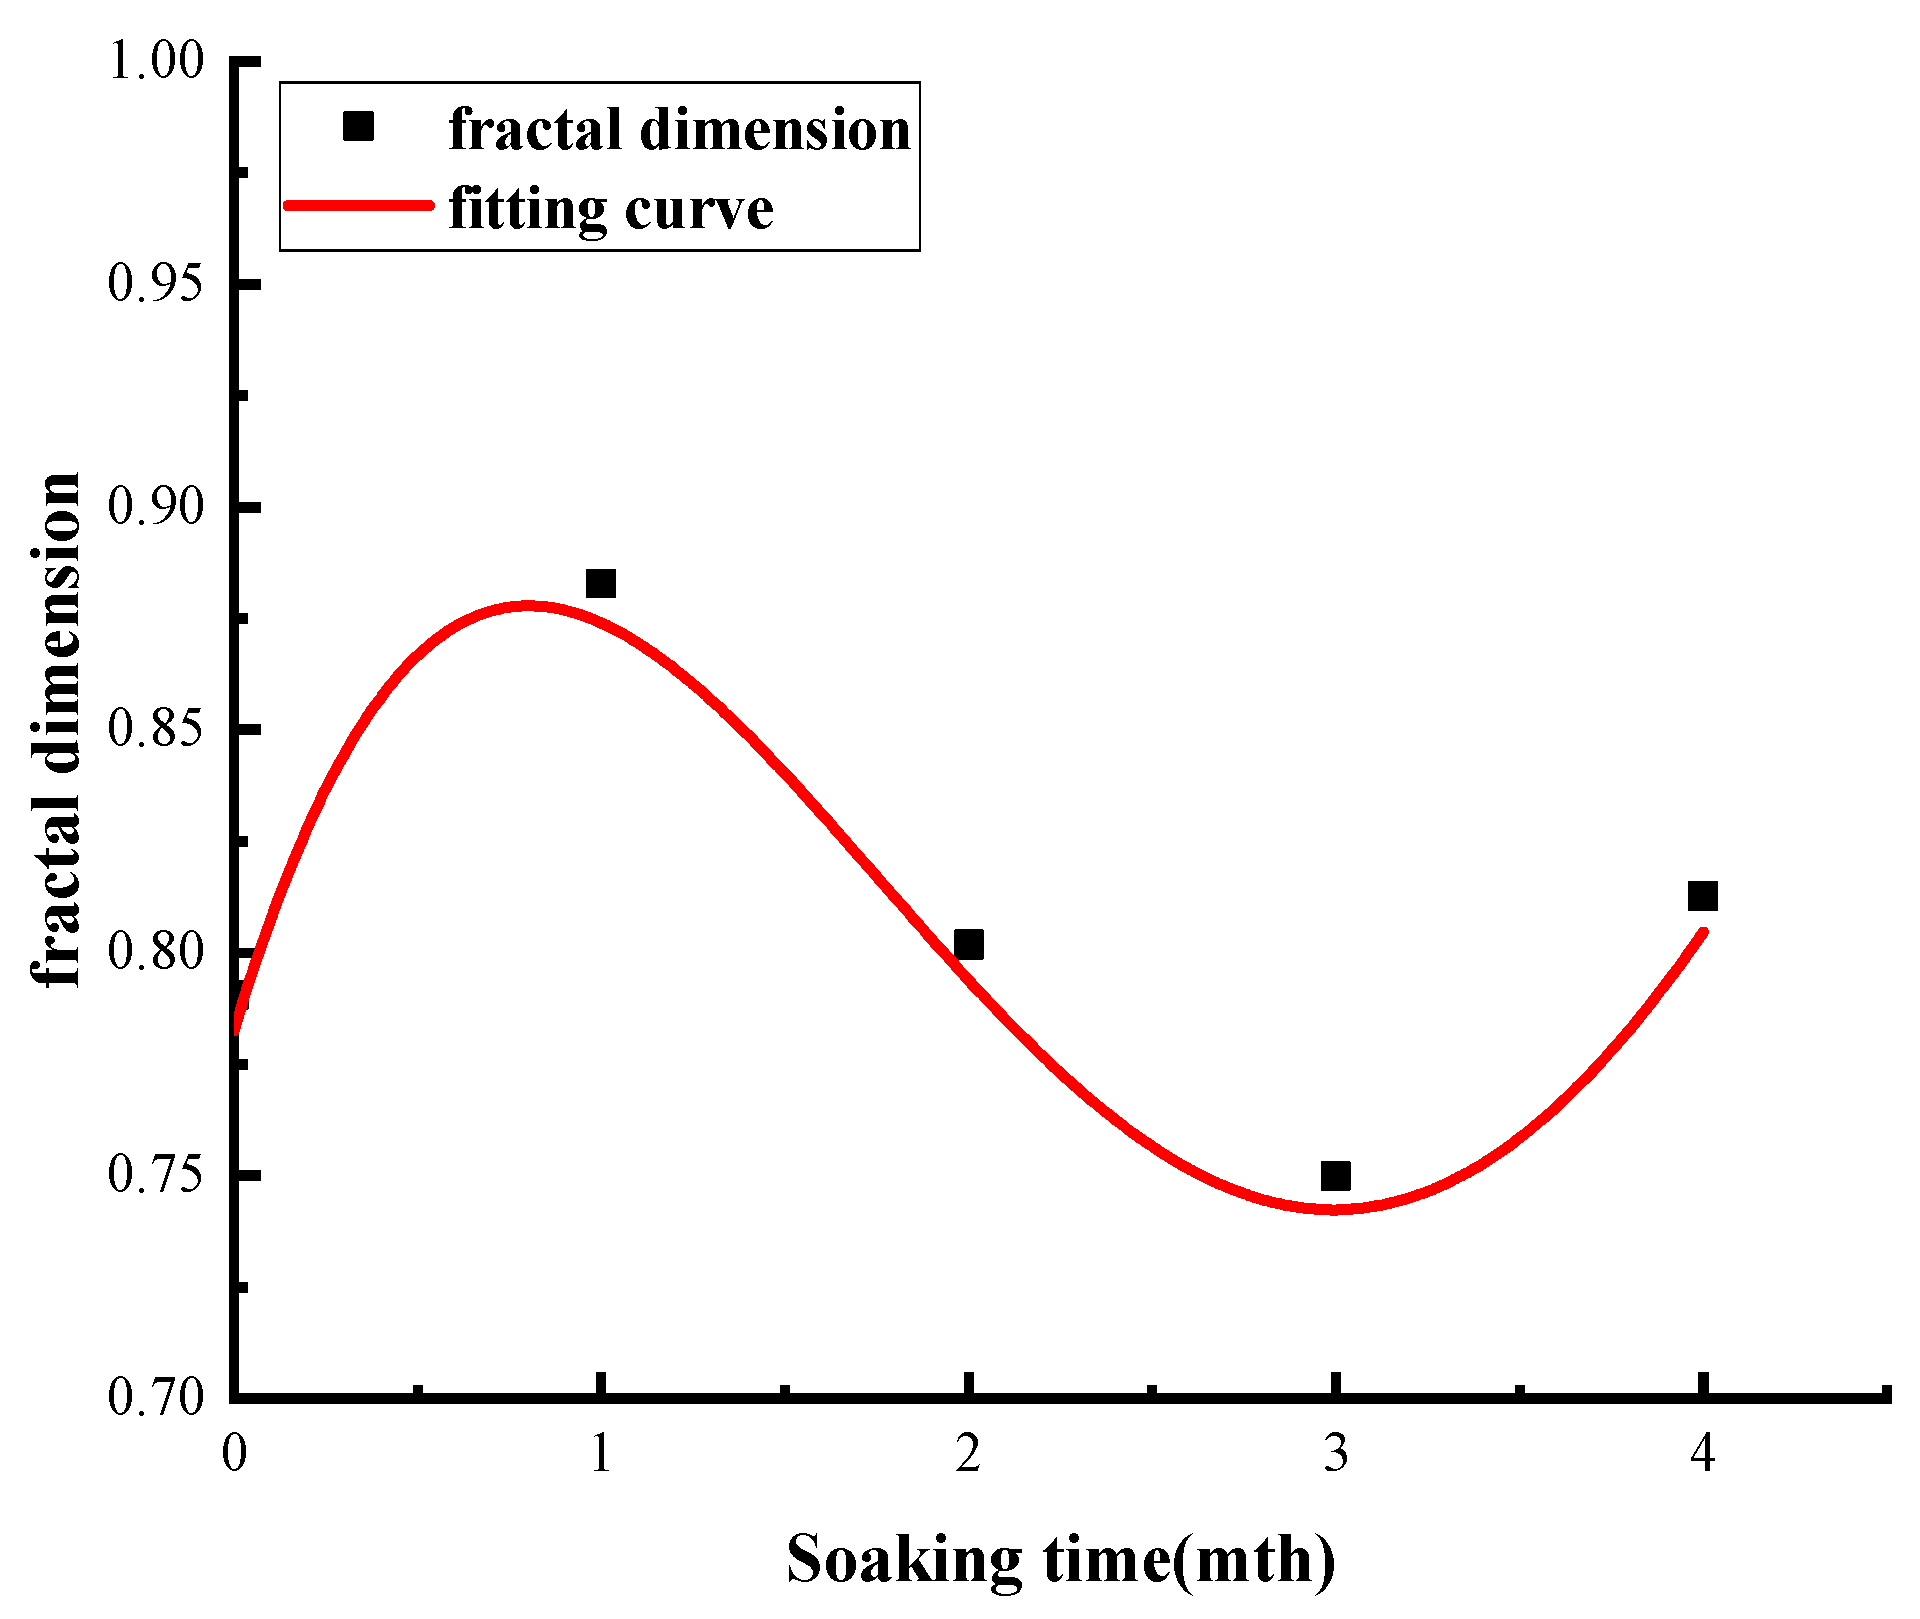
3.3.4. Changes in Pore Fractal Characteristics at Different Soaking Times

By examining the horizontal cross-section pore characteristics of the samples subjected to different corrosion durations and integrating this with the box dimension fractal theory, we determined the fractal dimension of the damaged pores, as illustrated in Figure 9. The calculation results indicate that the correlation coefficient R2 exceeds 0.96, demonstrating the high accuracy and reliability of these findings.
The relationship between the soaking time and fractal dimension is derived from time and is expressed as
D = 0.78 + 0.27 t 0.24 t 2 + 0.06 t 3
In this study, D represents the two-dimensional fractal dimension of the sample at time t . As illustrated in Figure 10, the fractal dimension exhibits a trend of initially increasing, followed by a decrease, and then a subsequent increase as the soaking time extended. This phenomenon indicates that the immersion effect of brine–CO2 initially enhanced the complexity of damaged pores within the sandstone material, which then diminished over time before ultimately increasing again. This process reflects a transformation in the degree of damage within the sample, characterized by an initial increase, followed by a reduction and finally stabilizing. These findings align with the analytical results derived from the three immersion stages outlined in this article.

4. Discussion

4.1. The Influence of Soaking Time on Cracks in Sandstones

In this study, the damage characteristics of sandstone were approached though different experiments. Figure 11 shows photographs of damaged samples at different soaking times, especially at confining pressures of 15 MPa. In the absence of immersion, the through fractures formed in sandstone were mainly composed of a small number of axial tensile fractures and a large number of oblique shear fractures. The main failure mode was inclined shear, with fractures penetrating both the upper and lower sections of the rock simultaneously. This is consistent with the study of Zhang et al. [19], which showed that the fracturing of basalt with water or without soaking produced relatively simple and straight fracture patterns. However, the fracture zigzag degree was greater after the supercritical carbon dioxide carbonization. With the extension of holding time, the crack morphology and failure mode also changed. After soaking for 1 month, the failure was manifested as axial tension cracks and two diagonal shear cracks, mainly distributed in the middle of the rock. The failure mode of this stage is characterized by wedge splitting shear and tensile composite failure, indicating the increase of crack complexity. This is due to carbonization, which makes the cracks more complex. With the extension of soaking time, especially after 2 months, the axial tensile cracks became less obvious when the failure mode remained unchanged, resulting in a decrease in the complexity of cracks, which are mainly concentrated in the lower section of the rock. At this time, carbon dioxide was already saturated, and with the effect of high temperature, carbonization began to decline, resulting in a reduction in fracture complexity. After soaking for 3 months, the damage mode changed to diagonal shear damage. Although fractures continued to be concentrated in the lower part of the rock, the complexity of the fracture morphology showed a decreasing trend. Due to the further weakening of carbonization, the fracture complexity continued to decrease. After 4 months of immersion, the failure mode evolved into an X-shaped conjugation, with another increase in complexity. With the increase in time and the secondary dissolution of carbon dioxide, the carbonization was strengthened and the fracture complexity increased.

4.2. Soaking Rule of Sandstone

During the immersion experiment, the mass of the sample decreased by 0.15 g, resulting in a mass reduction percentage of 0.26%. The entire soaking process can be subdivided into three distinct stages: the dissolution stage, the precipitation stage and the secondary dissolution stage. The quality changes observed in each stage were meticulously calculated, yielding the following results: the increase during the January stage was −0.485%, the decrease during the February stage was −0.9%, the decrease during the March stage was −0.117% and the decrease during the April stage was −0.262%. Furthermore, data fitting was conducted to analyze the relationship between the mass increase of the sample throughout the soaking process and time. The specific results are illustrated in Figure 12, along with the corresponding fitting formula.
m t = 0.38 t 1.14 t 2 + 0.57 t 3 0.08 t 4
In the formula, m t represents the mass increase of the rock sample under specific conditions, measured in grams (g). We conducted detailed measurements and analyses of the mass increase in rock samples, with a particular emphasis on behavior across different stages of corrosion. The samples were tested within the designated immersion time in a supercritical CO2 solution, where t denotes the immersion duration in months (m). Additionally, the R2 value of 0.9998 indicates an excellent fit for our data. By deriving the relationship over time, we established a connection between soaking time and the rate of mass increase.
m t = 0.66 t 2 t 2 + 0.99 t 3 0.13 t 4
m t = m t m t 0 m t 0
r t = m t t
Substituting Equation (8) into Equation (9), we get
r t = m t m t 0 m t 0 t
m t = m t m t 0
Substituting Equation (10) into Equation (11), we get
r t = m t m t 0 t
In the above description, m t 0 represents the mass of the sample in the unimmersed state, and m t represents the mass of the sample at soaking time t . At the same time, m t refers to the mass increase rate of the sample measured at the soaking time t , while r t refers to the reaction rate of the sample at the same soaking time t , and its unit is m−1.
r 1 t = m 1 t m 1 t 0 t
m 1 t = w 1 × m t
m 1 t 0 = w 1 × m t 0
m 1 t = w 1 × m t
r 1 t = w 1 × m t w 1 × m t 0 t = m t m t 0 t = r t
In this context, m 1 t 0 denotes the mass of Ca2+ present in the sample prior to any soaking treatment, while m 1 t indicates the mass increase of Ca2+ in the sample following a soaking duration of t. Furthermore, r 1 t represents the reaction rate of Ca2+ in the sample during the soaking period t, and w 1 signifies the mass proportion of Ca2+ in the sample before soaking. Testing of the mineral components revealed that the calcium carbonate content in the sample before soaking was 5.47%. From this, it can be inferred that the Ca2+ content in the sample is approximately 2.19%.
S t = S 0 m t m t 0 V
In this article, V denotes the volume of the soaking solution, which is approximately 8 L, and it is assumed that this volume remains constant throughout the experiment. Additionally, S 0 represents the initial salinity of the soaking solution, valued at 128.13 milligrams per liter (mg/L). After a soaking duration of time t , S t indicates the salinity of the solution at that time, expressed in grams per liter (g/L).
S 1 t = S 10 m 1 t m 1 t 0 V
Among these variables, S 10 denotes the initial salinity of Ca2+ in the soaking solution, with a value of 128.13 × 10⁻³ g/L, while S 1 t represents the salinity of Ca2+ in the solution at a soaking time of t . Using the provided formula, S 1 t can be calculated as follows: S 1 t = S 10 w 1 × m t w 1 × m t 0 V . For further analysis, it is necessary to divide both sides of this equation by m t 0 × t .
S 1 t m t 0 t = S 10 m t 0 × t w 1 × m t w 1 × m t 0 V × m t 0 × t = 128.13 × 10 3 57 t w 1 × r t V w 1 V × t = S 1 t 57 t
S 1 t = 128.13 × 10 3 57 × w 1 × r t × t V w 1 V = 128.13 × 10 3 1.25 × r t × t 1 V
The reaction is divided into three stages, namely dissolution ( t = 1 and t = 2), precipitation ( t = 3) and secondary dissolution ( t = 4).
r t = 0.485 , t = 1 0.45 , t = 2 0.04 , t = 3 0.07 ,       t = 4
At time points t = 1, 2, 3 and 4, the results obtained were substituted into Equation (22), resulting in Figure 13. It can be observed from Figure 5 that the experimental results are largely consistent with the results derived from the formula. This indicates that the theory employed effectively aligns with the actual conditions of the experimental reactions.

4.3. Model Diagram of the Influence of Soaking Time on Microstructure

Based on the experimental results of NMR, CT scanning and salinity measurements, we constructed a model diagram to illustrate the microstructure changes of the rock during immersion. This diagram contains changes in mineral structure and rock structure, as shown in Figure 14. During the initial soaking stage, as shown in Figure 14a, the distribution of minerals was irregular and the grain arrangement between the different mineral components was also different. In addition to carbon dioxide solutions permeating the connected pores, bound water was also present in the molecular structure of the mineral. When we entered the dissolution stage, due to the corrosion of the CO2 solution and the increase in the acidity of the solution, minerals such as calcium carbonate gradually dissolved, resulting in a significant increase in the number of connecting holes. At the same time, the dissolution of certain minerals also opened channels in the unconnected pores, further increasing the porosity [11,12,13,14,15,16,17]. With long-term exposure to a CO2 solution, the crystal structure of calcium carbonate minerals is gradually destroyed and the rock structure changes, indicating the interaction between molecules of CO2 solution and molecules of solute attractor particles, as shown in Figure 14b. During the precipitation phase, the CO2 solution and minerals (such as calcium bicarbonate) produced secondary minerals, including calcium carbonate, which causes some fluid channels to narrow and subsequently reduces the overall porosity of the rock. At this time, CO2 solution molecules are expelled outward due to the formation of precipitates, as shown in Figure 14c. During the secondary dissolution stage, as the amount of secondary minerals (such as calcium carbonate) increased, the CO2 solution began to corrode these secondary minerals again. At this time, the corrosion effect was weaker than previously observed, resulting in a reduction in the amount of dissolved minerals. At the same time, when the porosity of the rock increased, the increase rate decreased. Under certain reaction conditions, the reaction between the mineral and the CO2 solution molecules continued and tended toward the equilibrium. However, this equilibrium position moved inward, as shown in Figure 14d. Most of the current CO2 injection research has been applied to CO2 geological sequestration and EOR projects in brackish water layers [41,42]. Luo et al. [43] applied the interaction of carbon dioxide, salt water and rock to the long-term storage of minerals in the salt water layer of carbon dioxide, and the analysis showed that both dissolution and chemical precipitation occurred in the long-term storage process of carbon dioxide. Calcite is dissolved in large quantities in low-pH and unsaturated solutions, and as the concentration of calcium ions in the solution increases, the precipitate is regenerated to produce pure secondary calcite. Such precipitation can result in a loss of CO2 injection effectiveness, which depends on the degree to which formation permeability decreases as the brine saturation increases [44]. During long-term CO2 injection and production, CO2, groundwater and reservoir rocks interact with each other, including the dissolution and precipitation processes. The strength of the rock in the dissolution process decreases obviously, and the injection and production efficiency is higher at this time, so the injection and production intensity should be increased. On the contrary, the strength of the rock in the precipitation process increases, and the difficulty of injection and production increases at this time; corresponding measures should be taken to improve the injection and production effect. This study has certain guiding significance for the long-term oil and gas injection and production of carbon dioxide.

5. Conclusions and Prospects

This study employed triaxial compression tests to investigate the effect of reaction time on the compressive strength of sandstone subjected to brine–CO2 treatment. Utilizing technologies such as nuclear magnetic resonance (NMR), and computed tomography (CT) scanning, pore distribution characteristics, porosity and microstructure of samples with varying reaction times were analyzed. This analysis aimed to elucidate the interaction mechanisms between these factors. The study reached the following conclusions:
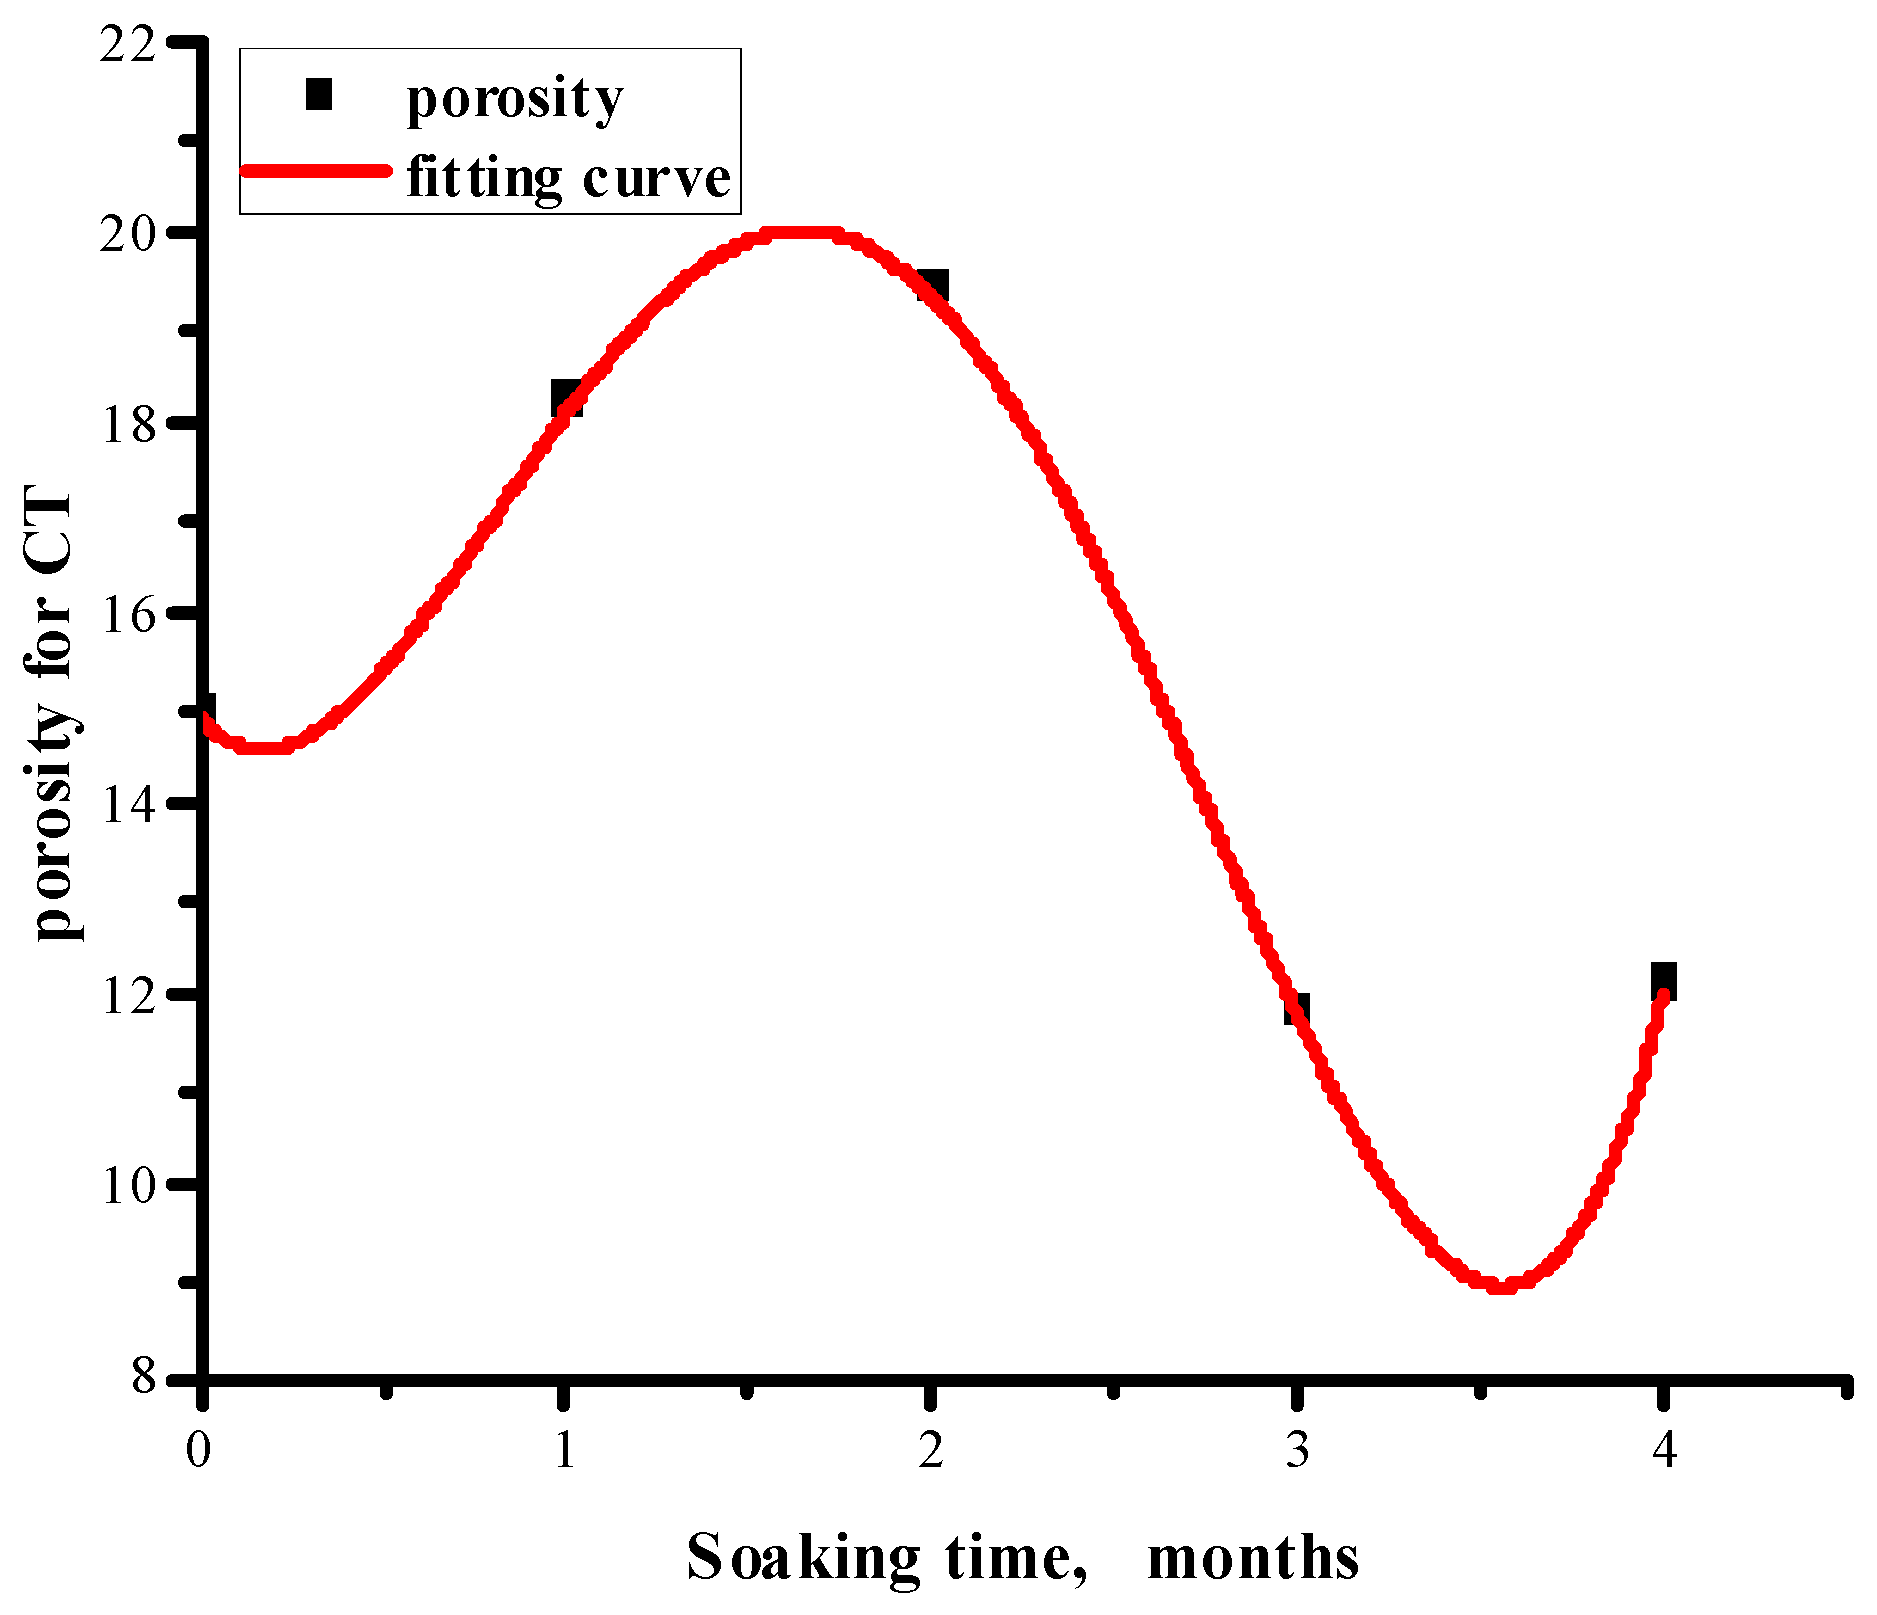
  • In sandstone samples soaked in salt water–CO2 for an extended period, a significant decrease in compressive strength was observed; however, this decline did not persist with prolonged soaking time. Specifically, the compressive strength decreased from 152.7 MPa to 121.8 MPa during the initial months, rebounded to 148.9 MPa by the third month, and subsequently declined again by 16.8 MPa in the fourth month. Concurrently, similar trends were noted in the evolution of porosity and fractal dimension. As the immersion time increased, the failure mode progressively transitioned from simple shear failure to a combination of tension and shear failure.
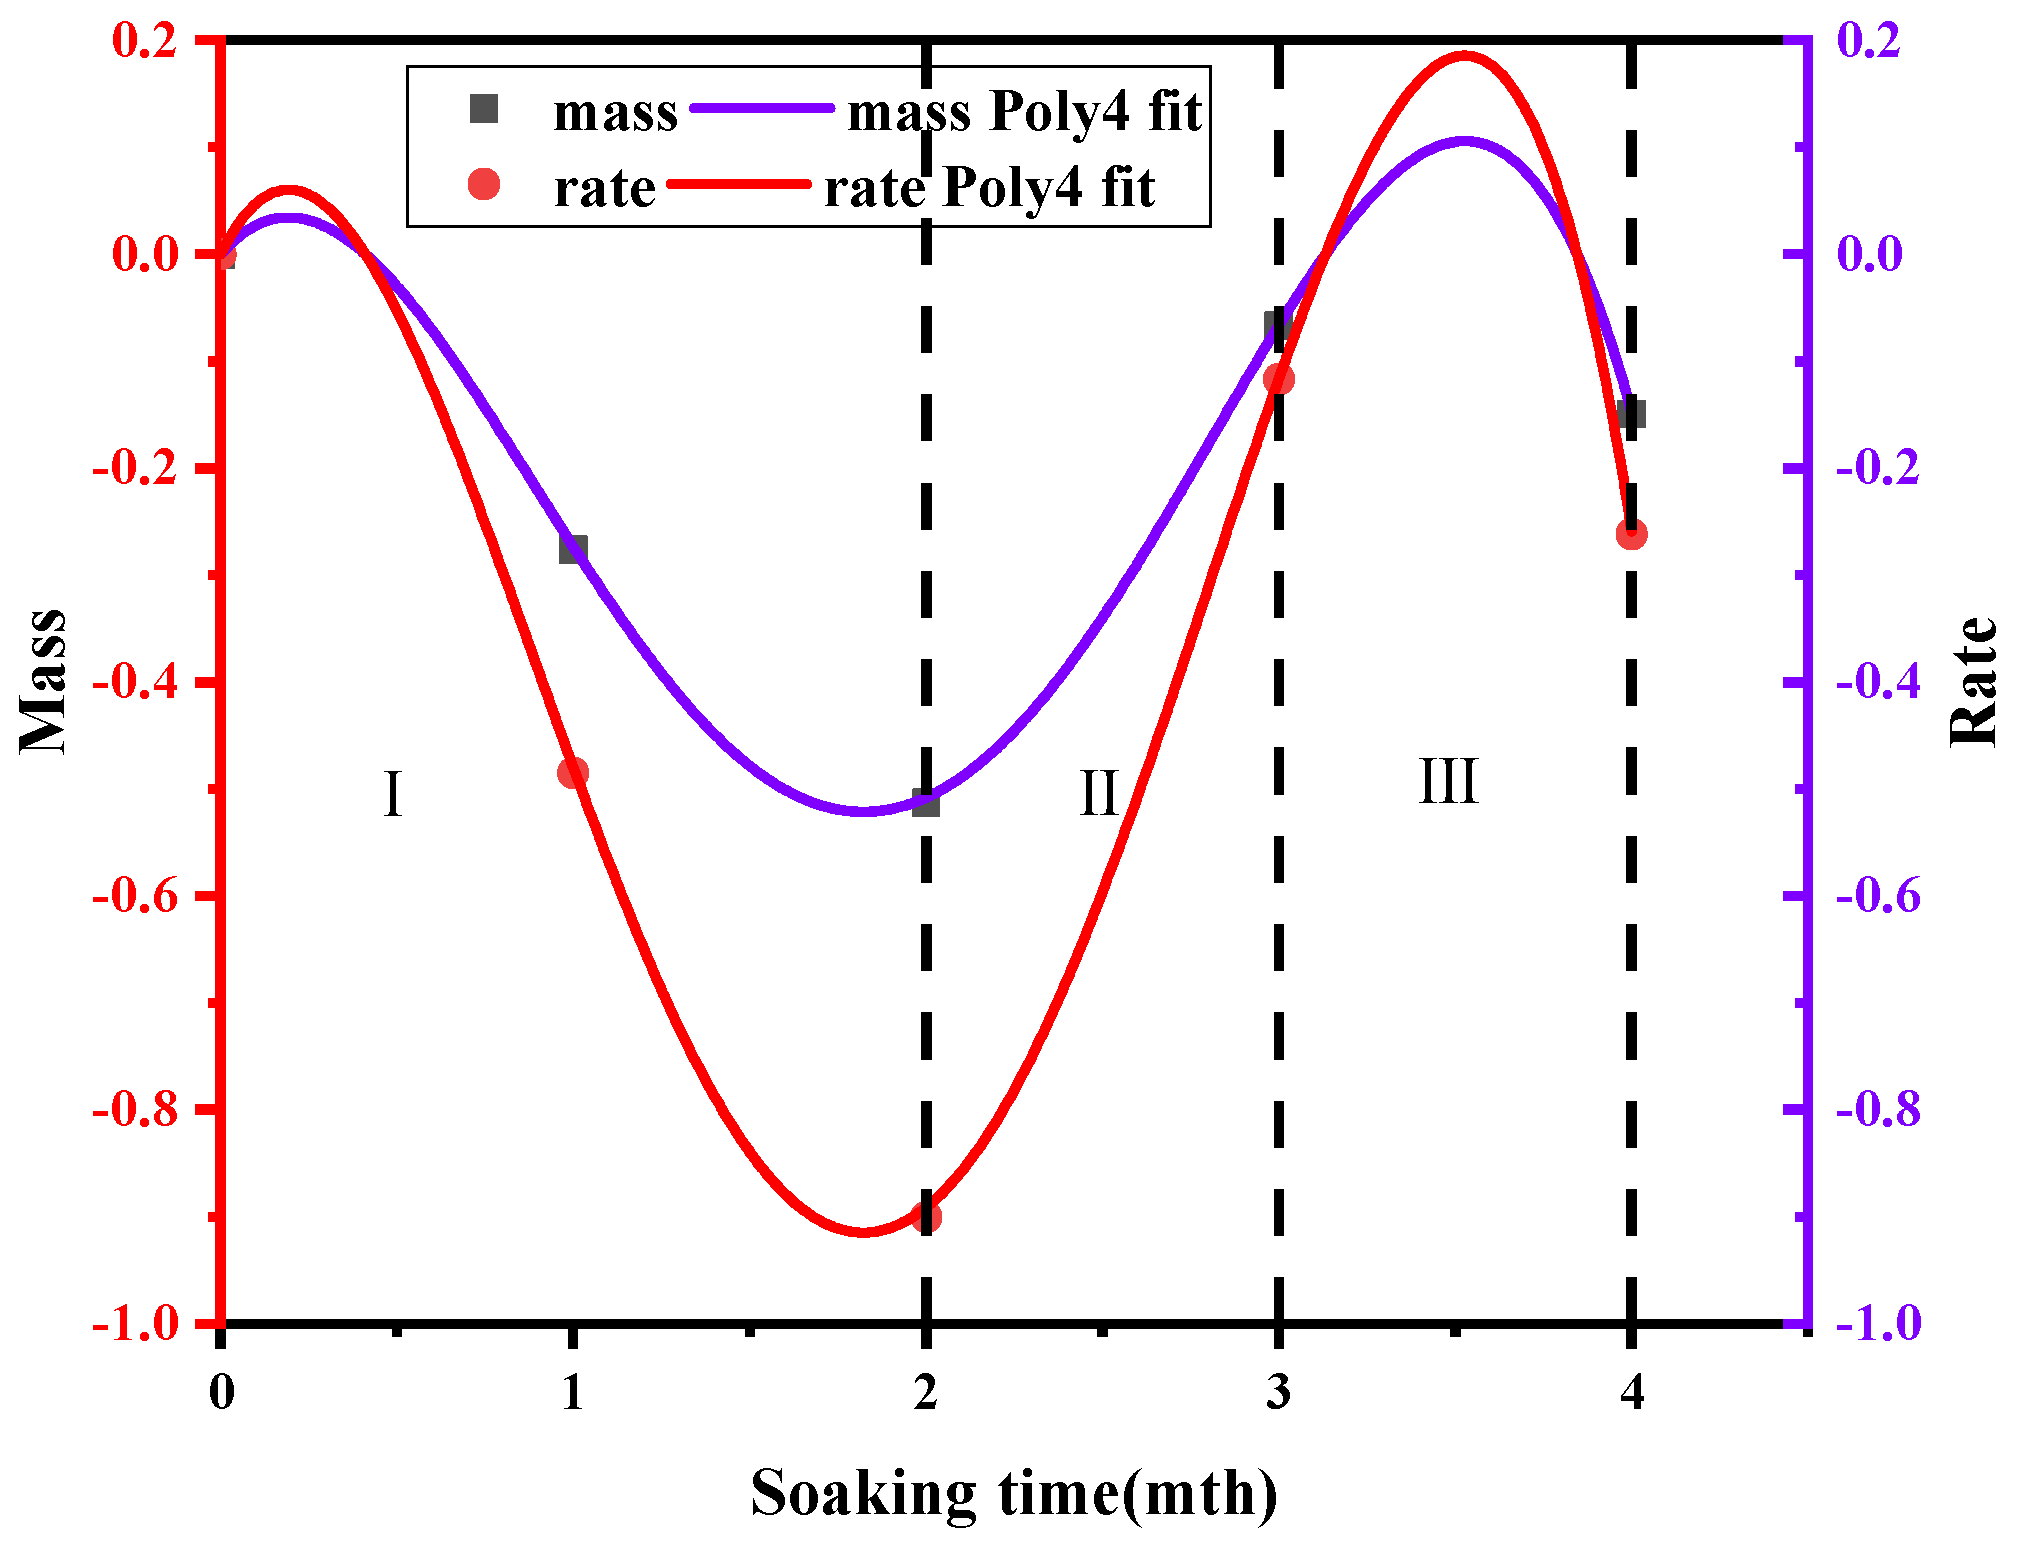
  • In addition, based on the mathematical relationship between sandstone mass reduction and soaking time, the researchers established an exponential relationship curve. Through this curve, they defined the reaction rate of Ca2+ and developed a corresponding formula for salinity.
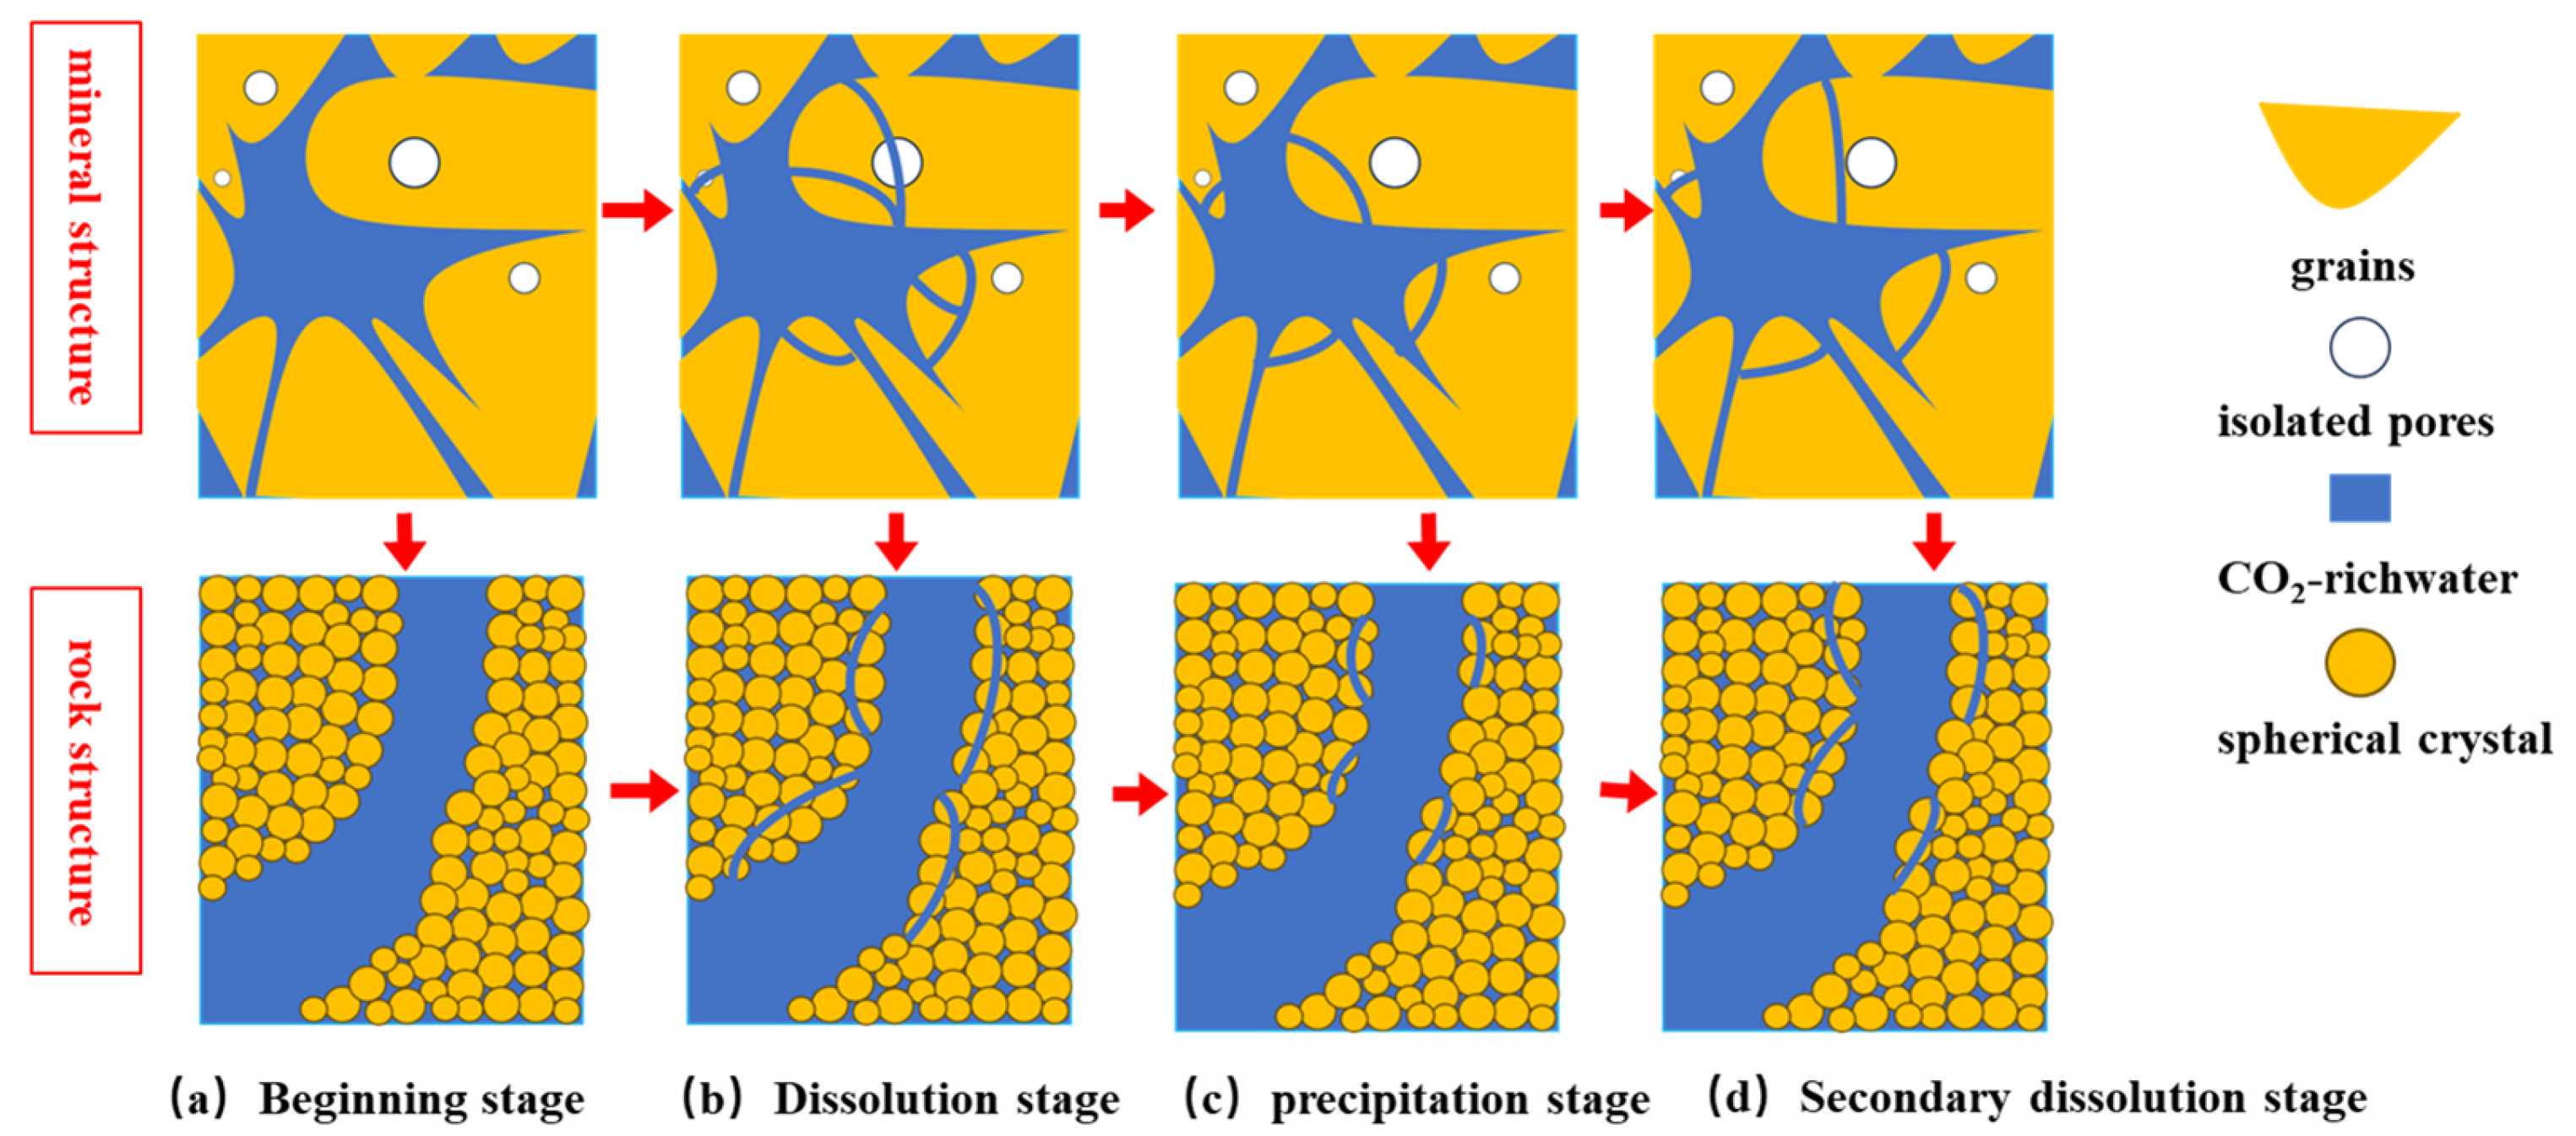
  • The change curve of sandstone mass reduction can be categorized into three distinct reaction stages: the dissolution stage, the precipitation stage and the secondary dissolution stage. An analysis of the variations in the proportion of microscopic pore structures reveals that the dissolution of calcium carbonate predominantly occurs during the dissolution and secondary dissolution stages, whereas the precipitation of Ca minerals is primarily concentrated between the dissolution stages. Building on these findings, a microstructure model diagram of rocks in a saltwater–CO2 environment was established.
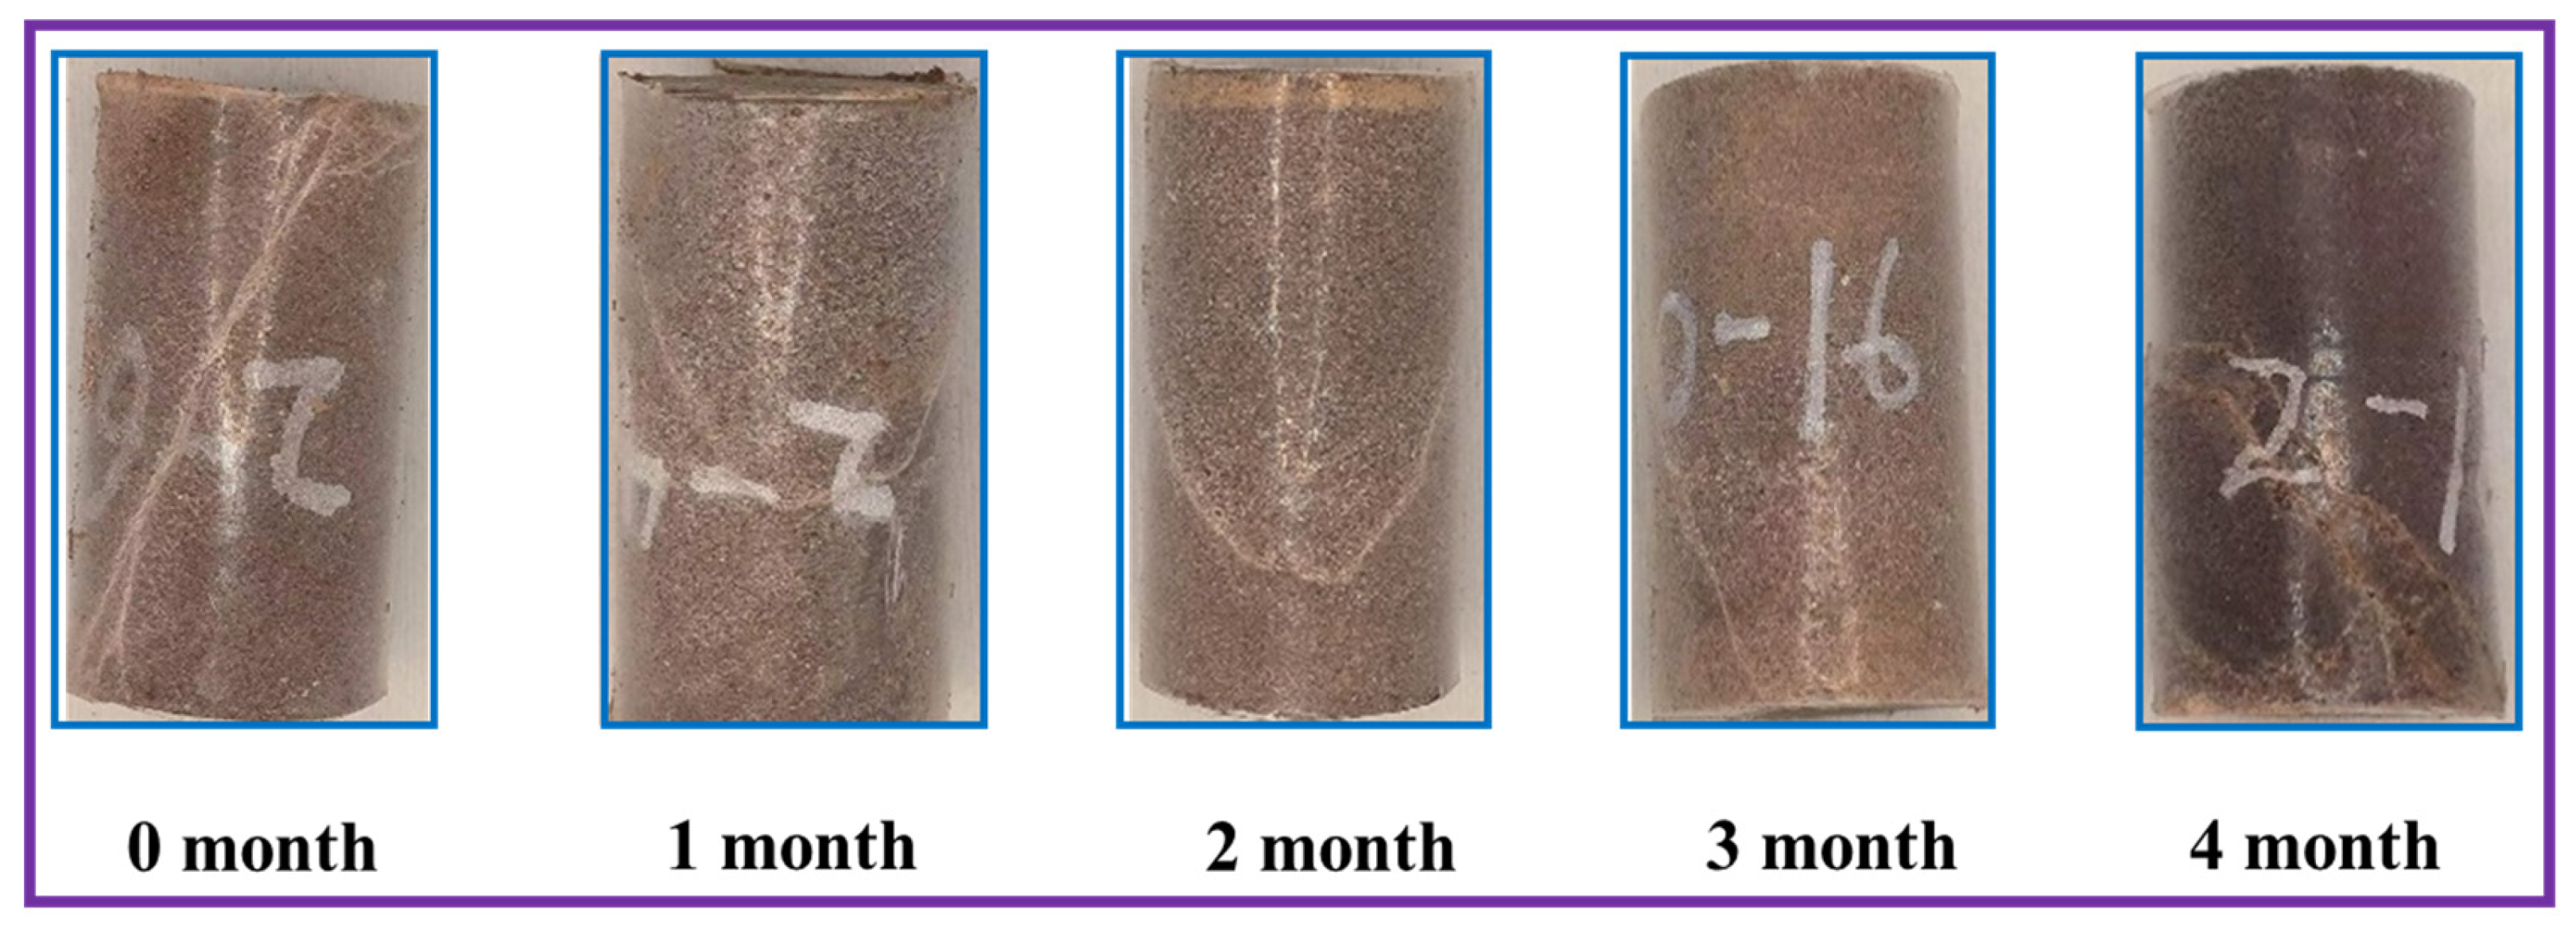
  • Based on the three-dimensional crack expansion shapes of coarse sandstone observed over different corrosion durations, it was found that as the immersion time increased, the complexity of cracks in the reaction samples exhibited a pattern of first increasing, then decreasing, and subsequently increasing again. This variation is primarily concentrated during the dissolution stage, where fracture complexity increases, while a decreasing trend is noted during the precipitation stage.
The long-term oil and gas injection and production process in deep carbon dioxide contains dynamic corrosion, and further experimental and numerical simulation studies are needed to explore the dynamic corrosion mechanism of carbon dioxide and salt water on reservoir rocks. Long-term CO2 injection and production are controlled by many factors, such as reservoir characteristics, interfacial tension between salt water and CO2, and reservoir pore pressure, so it is necessary to control the CO2 injection and production rate according to the actual formation conditions of the reservoir. This long-term chemical interaction will promote the expansion of existing fractures and trigger new ones, and further research on the mechanism of fracture growth is necessary. A variety of numerical simulators have been developed to simulate chemical effects; however, current simulators have taken concentration into account relatively little, and laboratory experiments have not fully addressed actual reservoir conditions. Therefore, relevant experiments and numerical simulations are needed in the future to further study the mechanism of the dynamic corrosion of reservoir rocks by carbon dioxide and salt water, and consider the actual reservoir conditions.

Author Contributions

Conceptualization, Investigation, Formal Analysis, Writing—Original Draft, M.D.; Writing—Review and Editing, H.M.; Investigation, G.Z.; validation, J.L., S.Z. and D.W.; Software, H.X. All authors have read and agreed to the published version of the manuscript.

Funding

This research was funded by Pore pressure growth breeding mechanism and scale effect of high-pile fine tailings under strong seismic load, grant number 2024YFFK0415.

Institutional Review Board Statement

Not applicable.

Informed Consent Statement

Not applicable.

Data Availability Statement

The original contributions presented in the study are included in the article; further inquiries can be directed to the corresponding author.

Conflicts of Interest

Author Guangquan Zhang and Sinan Zhu were employed by the company China Petroleum & Chemical Corporation. The remaining authors declare that the research was conducted in the absence of any commercial or financial relationships that could be construed as a potential conflict of interest.

References

  1. Hao, J.F.; Guo, C.Y.; Sun, W.J.; Liang, B.; Qin, B.; Li, L. Study on the deterioration and damage evolution characteristics of mechanical properties of siltstone after supercritical CO2 treatment. J. CO2 Util. 2024, 89, 2212–9820. [Google Scholar] [CrossRef]
  2. Feng, G.; Kang, Y.; Sun, Z.D.; Wang, X.-C.; Hu, Y.-Q. Effects of supercritical CO2 adsorption on the mechanical characteristics and failure mechanisms of shale. Energy 2019, 173, 0360–5442. [Google Scholar] [CrossRef]
  3. Vafaie, A.; Cama, J.; Soler, J.M.; Kivi, I.R.; Vilarrasa, V. Chemo-hydro-mechanical effects of CO2 injection on reservoir and seal rocks: A review on laboratory experiments. Renew. Sustain. Energy Rev. 2023, 178, 113270. [Google Scholar] [CrossRef]
  4. Bai, B.; Ni, H.J.; Shi, X.; Guo, X.; Ding, L. The experimental investigation of effect of supercritical CO2 immersion on mechanical properties and pore structure of shale. Energy 2021, 228, 0360–5442. [Google Scholar] [CrossRef]
  5. Ao, X.; Lu, Y.Y.; Tang, J.R.; Chen, Y.; Li, H. Investigation on the physics structure and chemical properties of the shale treated by supercritical CO2. J. CO2 Util. 2017, 20, 2212–9820. [Google Scholar] [CrossRef]
  6. Zhao, J.S.; Wang, P.F.; Zhang, Y.M.; Ye, L.; Shi, Y. Influence of CO2 injection on the pore size distribution and petrophysical properties of tight sandstone cores using nuclear magnetic resonance. Energy Sci. Eng. 2020, 8, 2286–2296. [Google Scholar] [CrossRef]
  7. Wang, L.; Zhao, Y.C.; Liu, M.X.; Song, Z.; Sun, Y.; Ni, S.; Fu, S.; Pan, R. Effect of supercritical carbon dioxide on pore structure and methane adsorption of shale with different particle sizes. J. Supercrit. Fluids 2024, 212, 0896–8446. [Google Scholar] [CrossRef]
  8. Pan, Y.; Hui, D.; Luo, P.Y.; Zhang, Y.; Zhang, L.; Sun, L. Influences of subcritical and supercritical CO2 treatment on the pore structure characteristics of marine and terrestrial shales. J. CO2 Util. 2018, 28, 2212–9820. [Google Scholar] [CrossRef]
  9. Yu, C.S.; Deng, H.C.; Jiang, Q.; Fan, Z.; Zhou, X.; Huang, S.; Lin, Q.; Peng, L. Mechanism of pore expansion and fracturing effect of high-temperature ScCO2 on shale. Fuel 2024, 363, 0016–0236. [Google Scholar] [CrossRef]
  10. Jiang, Y.D.; Luo, Y.H.; Lu, Y.Y.; Qin, C.; Liu, H. Effects of supercritical CO2 treatment time, pressure, and temperature on microstructure of shale. Energy 2016, 97, 0360–5442. [Google Scholar] [CrossRef]
  11. An, Q.Y.; Zhang, Q.S.; Li, X.H.; Yu, H.; Zhang, X. Experimental study on alteration kinetics for predicting rock mechanics damage caused by SC-CO2. Energy 2022, 259, 0360–5442. [Google Scholar] [CrossRef]
  12. Suto, Y.; Liu, L.H.; Yamasaki, N.; Hashida, T. Initial behavior of granite in response to injection of CO2-saturated fluid. Appl. Geochem. 2007, 22, 0883–2927. [Google Scholar] [CrossRef]
  13. Kaszuba, J.; Yardley, B.; Andreani, M. Experimental Perspectives of Mineral Dissolution and Precipitation due to Carbon Dioxide-Water-Rock Interactions. Rev. Mineral. Geochem. 2013, 77, 153–188. [Google Scholar] [CrossRef]
  14. Li, Y.; Ma, H.S.; Li, H.T.; Tang, Z.; Li, K.; Luo, H. Dissolution of supercritical CO2 on carbonate reservoirs. Pet. Reserv. Eval. Dev. 2023, 13, 288–295. [Google Scholar] [CrossRef]
  15. Liu, N.; Haugen, M.; Benali, B.; Landa-Marbán, D.; Fernø, M.A. Pore-scale kinetics of calcium dissolution and secondary precipitation during geological carbon storage. Chem. Geol. 2023, 641, 121782. [Google Scholar] [CrossRef]
  16. Lu, Y.Y.; Zhou, J.K.; Li, H.L.; Chen, X.; Tang, J. Different Effect Mechanisms of Supercritical CO2 on the Shale Microscopic Structure. ACS omega 2020, 5, 22568–22577. [Google Scholar] [CrossRef]
  17. Lahann, R.; Mastalerz, M.; Rupp, J.A.; Drobniak, A. Influence of CO2 on New Albany Shale composition and pore structure. Int. J. Coal Geol. 2013, 108, 0166–5162. [Google Scholar] [CrossRef]
  18. Major, J.R.; Eichhubl, P.; Dewers, T.A.; Olson, J.E. Effect of CO2–brine–rock interaction on fracture mechanical properties of CO2 reservoirs and seals. Earth Planet. Sci. Lett. 2018, 499, 0012–0821X. [Google Scholar] [CrossRef]
  19. Zhang, X.F.; Zhang, F.S.; Song, X.H.; Wei, J.; Liu, S.; Wang, J. Stimulation of tight basalt reservoirs using supercritical carbon dioxide: Implications for large-scale carbon sequestration. J. Rock Mech. Geotech. Eng. 2024; in press. [Google Scholar] [CrossRef]
  20. Yan, H.; Zhang, J.X.; Li, B.Y.; Zhu, C. Crack propagation patterns and factors controlling complex crack network formation in coal bodies during tri-axial supercritical carbon dioxide fracturing. Fuel 2021, 286, 0016–2361. [Google Scholar] [CrossRef]
  21. Ma, D.; Wu, Y.; Ma, X.; Hu, D.; Zhou, H.; Li, D. A Preliminary Experimental and Numerical Study on the Applicability of Liquid CO2 Fracturing in Sparse Sandstone. Rock Mech. Rock Eng. 2023, 56, 7315–7332. [Google Scholar] [CrossRef]
  22. Liu, L.; Zhu, W.; Wei, C.; Elsworth, D.; Wang, J. Microcrack-based geomechanical modeling of rock-gas interaction during supercritical CO2 fracturing. J. Pet. Sci. Eng. 2018, 164, 91–102. [Google Scholar] [CrossRef]
  23. Zhao, Z.; Li, X.; He, J.; Mao, T.; Zheng, B.; Li, G. A laboratory investigation of fracture propagation induced by supercritical carbon dioxide fracturing in continental shale with interbeds. J. Pet. Sci. Eng. 2018, 166, 739–746. [Google Scholar] [CrossRef]
  24. Jiang, X.H.; Li, C.D.; Zhou, J.Q.; Zhang, Z.; Yao, W.; Chen, W.; Liu, H.-B. Salt-induced structure damage and permeability enhancement of Three Gorges Reservoir sandstone under wetting-drying cycles. Int. J. Rock Mech. Min. Sci. 2022, 153, 1365–1609. [Google Scholar] [CrossRef]
  25. Liang, W.G.; Yang, X.Q.; Gao, H.B.; Zhang, C.; Zhao, Y.; Dusseault, M.B. Experimental study of mechanical properties of gypsum soaked in brine. Int. J. Rock Mech. Min. Sci. 2012, 53, 1365–1609. [Google Scholar] [CrossRef]
  26. Sun, Q.; Zhang, Y.L. Combined effects of salt, cyclic wetting and drying cycles on the physical and mechanical properties of sandstone. Eng. Geol. 2019, 248, 0013–7952. [Google Scholar] [CrossRef]
  27. Menéndez, B.; Petráňová, V. Effect of mixed vs single brine composition on salt weathering in porous carbonate building stones for different environmental conditions. Eng. Geol. 2016, 210, 0013–7952. [Google Scholar] [CrossRef]
  28. Ruiz-Agudo, E.; Mees, F.; Jacobs, P.; Rodriguez-Navarro, C. The role of saline solution properties on porous limestone salt weathering by magnesium and sodium sulfates. Environ. Geol. Int. J. Geosci. 2007, 52, 269–281. [Google Scholar] [CrossRef]
  29. Espinosa-Marzal, M.R.; Hamilton, A.; McNall, M.; Whitaker, K.; Scherer, G.W. The chemomechanics of crystallization during rewetting of limestone impregnated with sodium sulfate. J. Mater. Res. 2011, 26, 1472–1481. [Google Scholar] [CrossRef]
  30. Yuan, W.; Liu, X.; Fu, Y. Chemical thermodynamics and chemical kinetics analysis of sandstone dissolution under the action of dry–wet cycles in acid and alkaline environments. Bull. Eng. Geol. Environ. 2019, 78, 793–801. [Google Scholar] [CrossRef]
  31. Feng, X.T.; Chen, S.L.; Zhou, H. Real-time computerized tomography (CT) experiments on sandstone damage evolution during triaxial compression with chemical corrosion. Int. J. Rock Mech. Min. Sci. 2004, 41, 1365–1609. [Google Scholar] [CrossRef]
  32. Ai, T.; Zhang, R.; Zhou, H.; Pei, J. Box-counting methods to directly estimate the fractal dimension of a rock surface. Appl. Surf. Sci. 2014, 314, 610–621. [Google Scholar] [CrossRef]
  33. Panigrahy, C.; Seal, A.; Mahato, N.K. Quantitative texture measurement of gray-scale images: Fractal dimension using an improved differential box counting method. Measurement 2019, 147, 106859. [Google Scholar] [CrossRef]
  34. Elsayed, M.; Isah, A.; Hiba, M.; Hassan, A.; Al-Garadi, K.; Mahmoud, M.; El-Husseiny, A.; Radwan, A.E. A review on the applications of nuclear magnetic resonance (NMR) in the oil and gas industry: Laboratory and field-scale measurements. J. Pet. Explor. Prod. Technol. 2022, 12, 2747–2784. [Google Scholar] [CrossRef]
  35. Slijkerman, W.; Hofman, F.J.; Looyestijn, W.J.; Volokitin, Y. A Practical Approach To Obtain Primary Drainage Capillary Pressure Curves From Nmr Core And Log Data. Petrophysics 2001, 42, SPWLA-2001-v42n4a3. [Google Scholar]
  36. Zhao, P.; Wang, L.; Xu, C.; Fu, J.; Shi, Y.; Mao, Z.; Xiao, D. Nuclear magnetic resonance surface relaxivity and its advanced application in calculating pore size distributions. Mar. Pet. Geol. 2020, 111, 66–74. [Google Scholar] [CrossRef]
  37. Xu, Y.L.; Li, X.L.; Wu, X.K.; Zheng, W.; Zhou, B.; Tong, J. Experimental study on pore fluid characteristics of fractured sandstone based on nuclear magnetic resonance technology. J. Pet. Sci. Eng. 2022, 214, 110408. [Google Scholar] [CrossRef]
  38. Matteson, A.; Tomanic, J.; Herron, M.M.; Allen, D.F.; Kenyon, W.E. NMR Relaxation of Clay/Brine Mixtures. SPE Reserv. Eval. Eng. 2000, 3, 408–413. [Google Scholar] [CrossRef]
  39. Bi, J.; Ning, L.; Zhao, Y.; Wu, Z.; Wang, C. Analysis of the microscopic evolution of rock damage based on real-time nuclear magnetic resonance. Rock Mech. Rock Eng. 2023, 56, 3399–3411. [Google Scholar] [CrossRef]
  40. Zheng, S.J.; Yao, Y.B.; Liu, D.M.; Cai, Y.; Liu, Y. Characterizations of full-scale pore size distribution, porosity and permeability of coals: A novel methodology by nuclear magnetic resonance and fractal analysis theory. Int. J. Coal Geol. 2018, 196, 148–158. [Google Scholar] [CrossRef]
  41. Michael, K.; Golab, A.; Shulakova, V.; Ennis-King, J.; Allinson, G.; Sharma, S.; Aiken, T. Geological storage of CO2 in saline aquifers—A review of the experience from existing storage operations. Int. J. Greenh. Gas Control. 2009, 4, 659–667. [Google Scholar] [CrossRef]
  42. Vilarrasa, V.; Silva, O.; Carrera, J.; Olivella, S. Liquid CO2 injection for geological storage in deep saline aquifers. Int. J. Greenh. Gas Control. 2013, 14, 1750–5836. [Google Scholar] [CrossRef]
  43. Luo, A.; Li, Y.M.; Chen, X.; Zhu, Z.; Peng, Y. Review of CO2 sequestration mechanism in saline aquifers. Nat. Gas Ind. B 2022, 9, 2352–8540. [Google Scholar] [CrossRef]
  44. Zeidouni, M.; Pooladi-Darvish, M.; Keith, D. Analytical solution to evaluate salt precipitation during CO2 injection in saline aquifers. Int. J. Greenh. Gas Control. 2009, 3, 1750–5836. [Google Scholar] [CrossRef]
Figure 1. Experimental sample.
Applsci 15 00607 g001
Figure 2. Diagram of the soaking device.
Applsci 15 00607 g002
Figure 3. Comparison before and after the threshold segmentation of CT images. (a) Original image. (b) Imge after threshold segmentation.
Applsci 15 00607 g003
Figure 4. Stress–strain curves for different soaking times.
Applsci 15 00607 g004
Figure 5. Pore size distribution curves of the samples after soaking in different months.
Applsci 15 00607 g005
Figure 6. The change trend for sample porosity after soaking in different months.
Applsci 15 00607 g006
Figure 7. Two-dimensional pore reconstruction of the sample under different soaking times.
Applsci 15 00607 g007
Figure 8. Porosity fitting curves of samples under different soaking times.
Applsci 15 00607 g008
Figure 9. Change trends for the connected and non-connected porosity of samples after soaking in different months.
Applsci 15 00607 g009
Figure 10. Fitting curve of the fractal dimension of specimen pores and soaking time.
Applsci 15 00607 g010
Figure 11. Photos of the cracks in specimens after triaxial compression failure under different immersion times.
Applsci 15 00607 g011
Figure 12. Increased mass and change rate curves of samples after soaking in different months.
Applsci 15 00607 g012
Figure 13. Comparison of test and calculated salinity of samples after soaking in different months.
Applsci 15 00607 g013
Figure 14. Microstructure model diagram of the rock immersion process. (a) Beginning stage. (b) Dissolution stage. (c) Precipitation stage. (d) Secondary dissolution stage.
Applsci 15 00607 g014
Table 1. The previous reference experimental scheme design and comparison of the results with this study (where “/” indicates minor research or very little research and reference “0” represents the content of this study).
Reference Serial Number01–56–1011–1718–242526–30
Soaking mediumBrine–CO2CO2Brine
Maximum soaking time120 days30 days2 days7 daysClose to 5 days80 daysClose to 3 days
Influence of mechanical property parameters (compressive strength, etc.)First decrease, then increase, then decreaseSimple reduction///Simple reduction/
Influence of physical property parameters (total porosity, etc.)First increase, then decrease, then increase/Simple increase////
Influence of mineral compositionDynamic changes of dissolution, precipitation and secondary dissolution//It is mainly minerals that are dissolved//There is an effect, but the mechanism is not completely clear
Influence of the fracture propagation modeThe crack deforms from “/” to “V”, then to a local “/” shape and finally to an “X” shape///Simple surface spalling and internal cracking of the rock/
Table 2. Basic parameters of some sandstone specimens.
IDDiameter/mmAltitude/mmWeight/gDensity/g/cm3Wave Velocity/m/s
0-125.1050.2056.702.283980
0-225.1550.0858.982.373979
0-325.0550.1358.202.363979
1-125.1150.0458.102.344002
1-225.1450.1757.602.313979
2-125.1550.1658.702.363994
2-225.2450.2258.062.313966
3-125.2150.1458.302.333914
3-225.2350.0960.202.403932
4-125.1050.1558.132.343948
4-225.0950.2758.952.373946
Table 3. Mechanical parameters of samples with different soaking times.
Soaking Time/mCompressive Strength/MPaElasticity Modulus/GPaPoisson RatioPermeability/mD
0152.6811.640.3011.00
1134.979.530.2281.32
2121.88.210.2002.09
3148.8611.080.2891.04
4138.9810.710.2441.08
Disclaimer/Publisher’s Note: The statements, opinions and data contained in all publications are solely those of the individual author(s) and contributor(s) and not of MDPI and/or the editor(s). MDPI and/or the editor(s) disclaim responsibility for any injury to people or property resulting from any ideas, methods, instructions or products referred to in the content.

