Featured Application
This study offers insights for civil engineers and geotechnical practitioners involved in the design and construction of composite foundations, particularly in soft soil environments. The methods and findings can be applied to optimize the selection of pile installation techniques—specifically, choosing between cement mixing piles (CMP) and pre-stressed high-strength concrete pipe (PHC) piles—to effectively manage soil disturbance and predict settlement. The research can inform decision-making processes in highway and infrastructure projects, leading to enhanced stability and performance of foundations subjected to varying embankment loads.
Abstract
The disturbance generated during the pile installation process increased the compressibility of the soil between the piles, thereby causing additional settlement of the composite foundation. This study was conducted against the background of a highway soft foundation treatment project in Zhongshan. Before and after the installation of cement mixing piles (CMP) and pre-stressed high-strength concrete pipe pile (PHC), a piezocone penetration test (CPTU) was applied to assess the soil between the piles and quantify the disturbance. Based on this, the settlement of the composite foundation was predicted using the stress modified method and finite element method (FEM). The results indicate that under low embankment load (<2.5 m), the installation of PHC piles reduces the compression modulus of the soil between the piles by approximately 30%, while CMP results in a reduction of about 10%. Disturbance settlement from CMP and PHC piles accounts for approximately 3–10% and 17–28% of the total settlement, respectively. This impact diminishes with the increase of embankment load.
1. Introduction
Composite foundation is a practical and effective method for treating soft foundations. However, the pile installation process can cause structural damage to the soil surrounding the pile, resulting in a significant increase in pore pressures, a degradation in the strength and modulus of the soil [1,2,3]. Especially in low subgrade, the settlement caused by the load is even less than the settlement caused by the reconsolidation of the soil around the piles. For instance, it was reported that, under a vertical load of 500 kN, the settlement caused by the reconsolidation of the soft clay around jacked pile accounts for 5/7 of the total settlement [4]. Moreover, the method of pile installation has a significant impact on the settlement [5,6,7,8]. Sales et al. reported that in sandy soil foundations, the settlement response of non-displacement piles under the same load is only 1/10 to 1/2 that of driven piles [9]. Therefore, determining the impact of the pile installation process on settlement is of great significance for subgrade quality control and cost savings.
Settlement changes caused by pile installation disturbances are commonly discussed in research on the variations in stress and displacement of the pile and the surrounding soil. Common research methods include analytical solutions, numerical simulations, model tests, and full-scale tests.
The analytical solution is to solve the settlement by establishing a coordinated equation of pile-soil interaction. Pile installation causes high pore water pressure around the pile, which, when dissipated, leads to further consolidation of the soil around pile. Under the action of negative skin friction, this results in additional settlement of the pile. Based on the analytical solution method, scholars have studied the characteristics of pile-soil interaction for various types of piles, including jacked piles [4], circular piles [10], and XCC piles [11].
In terms of model testing, strain gauges are attached to the model pile, or stress meters are embedded in the soil layers to record changes in the stress field. Digital image correlation (DIC) was employed to document variations in the displacement field [12]. To enhance visibility of these changes, transparent soil was utilized as an alternative to conventional soil [13].
Through selecting appropriate models and parameters, numerical simulation methods can efficiently implement comparisons of displacement fields and stress fields for different types of piles. For instance, Lin et al. simulated the installation of three pile types, finding that the peak soil horizontal deformation occurs at the surface with normalized values of 15.2 for static pressure piles, 7.5 for bag grouting piles, and 1.1 for bored piles [14]. Additionally, the numerical simulation method is also capable of accounting for the effects of other factors, such as soil layers [15].
In-situ test results excel in authenticity and reliability, and test designs based on standard testing methods are commonly recognized. For example, Zhan et al. discovered that the increase in pore-water pressure caused by high-frequency vibratory pile driving extends to a range of approximately 3.6 times the pile diameter [16]. Research by Shao et al. indicates that both the soil pressure and the maximum lateral displacement caused by PGP pile construction are approximately half of those caused by driven piles [17]. Duffy et al. measured the base residual stress and found that the installation process of driven precast piles causes greater disturbance compared to driven cast-in-situ piles and screw injection piles [18].
In summary, settlement caused by pile installation should not be overlooked, and the piling method is one of the key factors influencing settlement. This article conducts in-situ tests on cement mixing pile (CMP) and hammer-driven pre-stressed high-strength concrete pipe pile (PHC pile), compares the disturbance degree () of soil around the piles, and calculates the settlement caused by pile installation using the stress modified method. It also explains the reasons for the abnormal settlement observed in the case of soft foundation treatment under a low-fill embankment.
2. Materials
2.1. Test Site
The Zhongshan Highway Project is located in the river network area of the Pearl River Delta plain, China (see Figure 1). The stretch from K1 + 111.5 to K3 + 645.3 comprises an embankment section. This section is covered by an average 3 m layer of plain fill soil. The soft soil beneath is mainly composed of mucky soil, and its thickness varies from 17.6 m to 52.30 m.
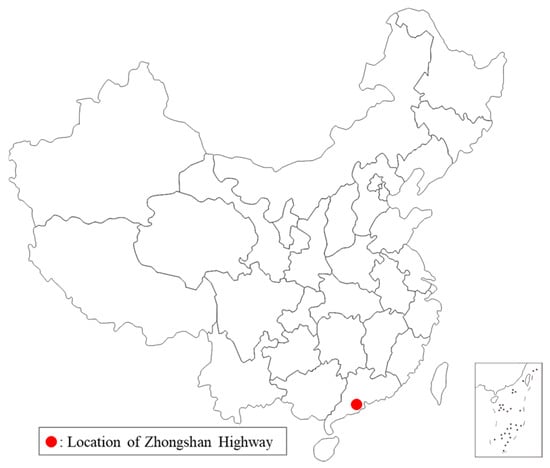
Figure 1.
Location of Zhongshan Highway in China.
The embankment fill height ranges from 0.5 m to 2.3 m, characterized as a low fill embankment, with a road width of 33.5 m and a slope ratio of 1:1.5 for the embankment slope. Besides, the average depth of the groundwater table is −2.0 m.
The original site investigation from K1 + 100 to K2 + 417 indicated that the stratigraphic distribution in this section consists of plain soil (average thickness of 2 m), muddy soil (average thickness of 18 m), and moderately weathered rock layer. Considering the relatively low fill height in this section, CMP was adopted for road foundation treatment. The design length of CMP was 8 m, with a spacing of 1.2 m between piles.
When the CMP construction reached K2 + 350, subsequent supplementary investigations revealed that the actual thickness of the muddy soil from K1 + 800 to K3 + 635 exceeded 35 m. Therefore, the untreated section K2 + 350~K3 + 635 was changed to be improved with 20-m-long PHC pile. The spacing between piles is 1.8 m, arranged in a square pattern.
The physical and mechanical parameters of mucky soil, the main soft soil layer, are shown in Table 1. Besides, the technical parameters of CMP and PHC pile are shown in Table 2.

Table 1.
Physical and mechanical properties of mucky soil from K1 + 100 to K3 + 635.
Table 2.
Technical parameters of CMP and PHC pile.
2.2. In-Situ CPTU
Compression modulus is an essential parameter for settlement calculation and prediction. In order to eliminate disturbances beyond pile installation, in-situ testing is a suitable method for obtaining compression modulus.
The commonly used in-situ methods for testing and estimating soil mechanical properties include standard penetration test (SPT), pressuremeter test, flat dilatometer test (DMT), vane shear test (VBT), and piezocone penetration test (CPTU).
The SPT, DMT, and VBT methods are not suitable for the compression modulus determination. The SPT assesses foundation bearing capacity, the DMT measures lateral pressure and consolidation coefficients, and the VBT determines soil sensitivity. Although the pressuremeter test can directly obtain deformation parameters such as the pressuremeter modulus, the method for deducing the compression modulus is still not mature. While the CPTU cannot directly obtain deformation parameters, numerous studies have shown the correlation between cone resistance and compression modulus [19,20]. Due to its low disturbance and ease of implementation, CPTU is often combined with laboratory tests for compression modulus determination.
Therefore, this paper used CPTU to estimate the compression modulus change of soil between piles before and after pile installation. See Table 3 for the equipment parameters used in CPTU.
Table 3.
Technical parameters of CPTU equipment.
In the section before K2 + 350, CMP was used, and after that, PHC pile was adopted. Four tests were conducted at K2 + 335 and K2 + 365, and the specific location was in the middle of the roadbed cross-section. The first test (A1 & B1) was conducted to determine the parameters of undisturbed soil layer. Then, after the pile installation, a second test (A2 & B2) was carried out. As shown in Figure 2, the distance between first and second test points are less than 5 m. It is aimed at minimizing the impact of actual geological differences. The experimental results will be discussed in the conclusion section.
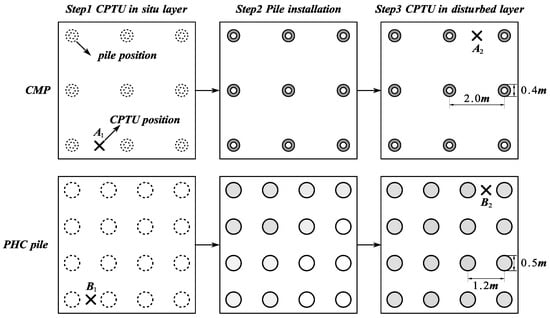
Figure 2.
Conducting CPTU in the soil between CMP and PHC pile.
3. Methodology
This section introduced the methodology for determining the compression modulus based on in-situ CPTU test results and calculating the composite foundation settlement considering pile installation disturbance.
3.1. Determination of Compression Modulus
Quantifying the disturbance in the soil layer solely through changes in CPTU test indicators lacks clear physical significance. Numerous studies have shown that in cohesive soil layers, there is a high linear correlation between the compressibility modulus of the stratum soil and . Therefore, it is necessary to first clarify the relationship.
Sampling was conducted with fixed piston thin-walled sampler in the deep silty soil layer, with a total of three sampling points set up. After vacuum saturation in water for 24 h, the prepared soil samples were installed in a consolidation apparatus. Different levels of axial loads are applied to the sample, specifically 50, 100, 200, 300, 400, and 500 kPa, with each load applied for 24 h before proceeding to the next level. Finally, we got the curve shown in Figure 3.
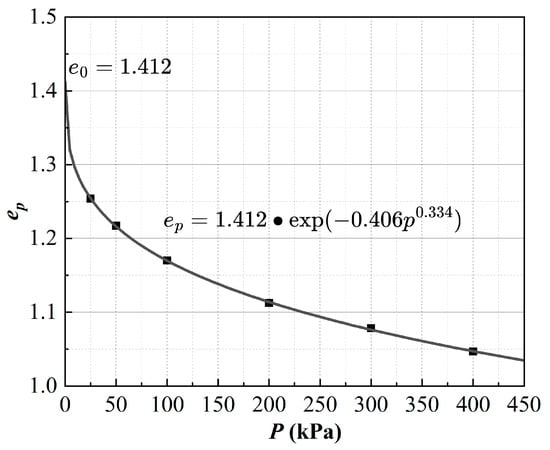
Figure 3.
The curve obtained by fitting the compression test results using .
The fitted result of the curve is:
According to Equation (1), Equation (2) is obtained for the tangent modulus of soil layer along depth.
Based on the CPTU test results and Equation (2), the scatter plot of and , as well as the results of the linear fit were shown in Figure 4.
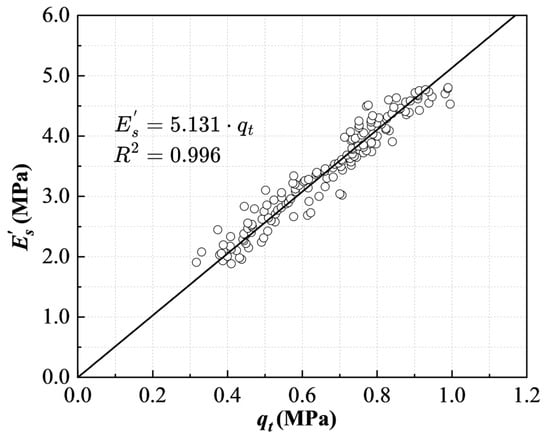
Figure 4.
Linear relationship between and .
Thus, the change in can be quantified based on the CPTU test results.
3.2. Composite Foundation Settlement Calculation
Composite modulus method and stress modified method are commonly used in settlement calculation. When considering the former, can be represented as:
where = pile replacement ratio; = deformation modulus of pile.
of CMP and PHC pile is typically tens of times and hundreds of times, respectively, higher than of the surrounding soil between the piles. According to Equation (3), when calculating , the contribution of is minimal. Therefore, the composite modulus method cannot effectively reflect the impact of pile driving on settlement.
When considering the stress modified method, it determines the load shared by the soil between the piles based on the pile-soil stress ratio. The presence of the reinforced body is ignored, and only the compression of the soil between the piles is calculated.
The load shared by soil between piles, , is:
where = embankment load; = pile-soil stress ratio, which can be obtained through static load test; = disturbance coefficient.
According to layer-wise summation method, the settlement of the reinforced area, , is:
where = additional stress increment of the -th reinforced layer; , = thickness and compression modulus of the -th soil layer between piles after pile driving.
3.3. Pile-Soil Stress Ratio
To determine the pile-soil stress ratio, an in-situ static load test was conducted after pile installation, as shown in Figure 5. The load was applied in 8 stages, each with 35 kPa, resulting in a final load of 280 kPa, over twice the design load of 120 kPa. The curve of CMP and PHC pile is shown in Figure 6.
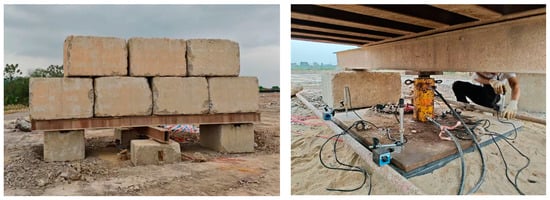
Figure 5.
Static load test in Zhongshan.
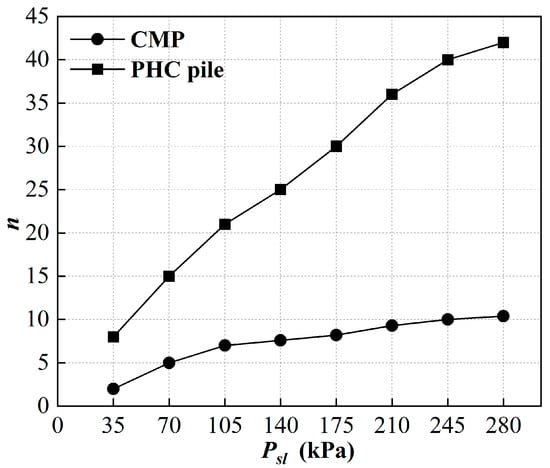
Figure 6.
The pile-soil stress ratio of CMP and PHC varies from 0~280 kPa.
The test result showed that pile-soil stress ratio is positively correlated with the magnitude of the embankment load. The pile-soil stress ratio varies widely, ranging from 8 to 42 for PHC pile and 2 to 10 for CMP. Based on the working conditions in this case, within from 0.5 m to 2.5 m, the stress ratio of pile-soil for pile-composite foundations can be taken as 8 to 20, while for CMP, the stress ratio of pile-soil can be taken as 2 to 7.
According to Equation (4), the can be calculated for different fill heights. Then, based on Equation (5), the total settlement results considering disturbances can be calculated.
3.4. Finite Element Method
To compare with the results of the stress modified method, FEM is also conducted in settlement calculations using PLAXIS 2D 2024 software. An axisymmetric model was built, and 15-node triangular elements were adopted for higher computational accuracy. In order to reduce the influence of model boundaries on the main deformation area, the considered range extends to a depth of 60 m underground and a horizontal width of 85 m. The established model is shown in Figure 7.
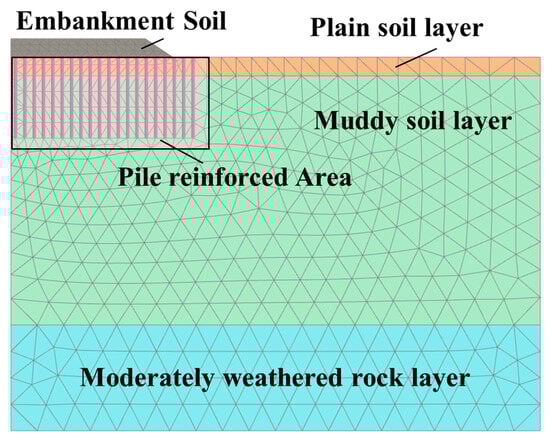
Figure 7.
FEM model of CMP and PHC pile composite foundation.
The model restricts horizontal displacement of left and right boundaries, and limits both horizontal and vertical displacements of the bottom. The pore water pressure in the soil above the water table is set to zero. All soil material is modeled using the Mohr-Coulomb model, while the pile is simulated using the embedded pile element built into the model.
When reducing the compression modulus, layer-by-layer weakening was conducted every 2 m within the pile range.
The physical and mechanical properties of the embankment soil and foundation soil layers in sections K1 + 111.5 to K3 + 645.3 are listed in Table 4, while the calculation parameters for CMP and PHC pile are provided in Table 5.
Table 4.
Physical and mechanical parameters of soil layers.
Table 5.
Physical and mechanical parameters of CMP and PHC.
4. Results
4.1. CPTU Parameters Before and After Pile Installation
The CPTU results before and after pile installation are shown in Figure 8, where is cone tip resistance, is pore water pressure, and is corrected cone tip resistance. The three parameters have the following relationship:
where is the net area ratio, taken as 0.8, and is only related to the shape of the cone tip.
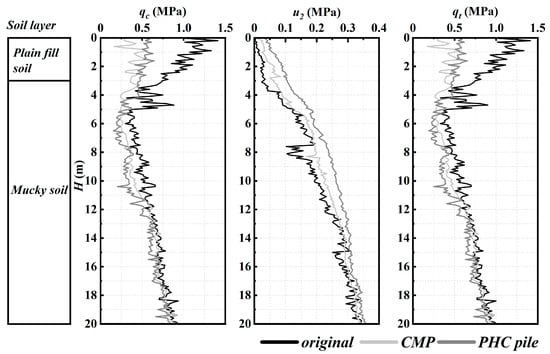
Figure 8.
CPTU on original soil layer and soil layer disturbed by CMP and PHC pile installation.
To quantify the degree of disturbance in the soil layer before and after pile installation, a disturbance index was established based on corrected cone tip resistance from first and second test, which is:
The test results of are shown in Figure 9. is applied to fit the test results. For CMP and PHC pile, respectively, , and , .
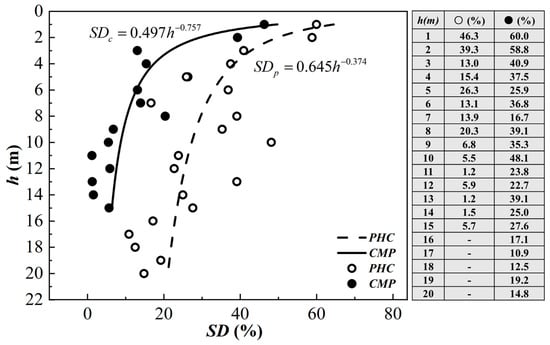
Figure 9.
Composite foundation of CMP and PHC pile.
From the test data, it can be observed that in shallow strata (0 to 3 m), the disturbance generated during the piling process of both types of piles is relatively large, exceeding 50%. However, as the treatment depth increases, the disturbance within the CMP length remains at around 10% to 15%, and there is essentially no disturbance below a depth of 2 m from the pile bottom. The reasons for this pattern in the impact behavior of the surrounding soil during the piling process can be attributed to three factors:
Firstly, in addition to being influenced by cutting in shallow soil layers, the lifting force of the mixing shaft also affects them. Due to the small self-weight stress of shallow soil layers, the lifting force causes significant disturbance, resulting in a disturbance exceeding 60%.
Secondly, as the drilling depth increases, the surrounding soil is increasingly affected by the cutting action of the mixing shaft, but this impact on the disturbance of the surrounding soil is approximately 5% to 10%.
Thirdly, the disturbance experienced by the soil below the pile bottom is mainly caused by the requirement for the drilling shaft to hover for a period and inject slurry after reaching the design depth. According to the test results, the depth of this disturbance is approximately 2 m, with an average disturbance of 5%.
Compared to CMP, the hammer-driven piling process of PHC pile results in greater disturbance to the surrounding soil, with an average disturbance exceeding 30%. This is due to several reasons:
Firstly, during on-site hammer-driven piling, noticeable undulations in the surface soil within a range of 1 m to 2 m around the pile are observed, indicating significant disturbance of the soil. The instantaneous mechanical energy diffusion caused by hammer impacts disrupts the skeleton structure between soil particles, resulting in a disturbance exceeding 60% in shallow soil layers.
Secondly, disturbance in deeper soil layers mainly stems from soil squeezing effects. The disturbance within the pile body gradually attenuates with depth, consistent with the pattern of lateral displacement along the depth. By the time it reaches the pile bottom, the disturbance around the pile is approximately 10% to 20%.
Thirdly, due to limitations in testing depth imposed by on-site equipment, test results below the pile bottom are unavailable. However, based on the trend of disturbance degree curves, the disturbance within the pile bottom area is generally less than 10%.
4.2. Settlement Before and After Pile Installation
The field-measured settlement data for this section are shown in Table 6, where “●” and “○” respectively refer to CMP and PHC pile. And the layout of the observation cross-sections is illustrated in Figure 10.
Table 6.
Measured settlement.
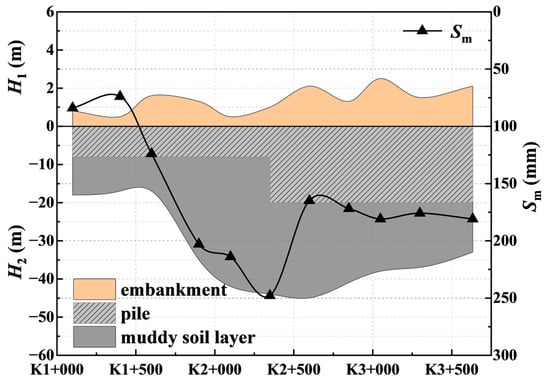
Figure 10.
The embankment height , thickness of muddy soil layer , pile length , and measured settlement from pile installation completion to 3 months after the completion of filling soil in the test section.
For ease of analysis, the cross-sections in Table 1 are classified into three categories based on and : ① shallow soft soil layer treated with short piles, ② shallow treatment of deep soft soil layer treated with short piles, and ③ deep soft soil layer treated with long piles. The measured average settlements for the three sections are 74 mm, 221 mm, and 175 mm, respectively.
In terms of comprehensive cost investment and settlement control effectiveness, the comprehensive cost per meter for PHC is approximately three times that of CMP, and the treatment depth needs to be 12 m deeper. Considering the foundation replacement rate, the estimated treatment cost of PHC composite foundation is about 2.25 times that of CMP. However, the settlement control is not proportional to the cost investment. Comparing the shallow treatment of the deep soft foundation section with that of the deep treatment section, switching to PHC pile composite foundation treatment and increasing the treatment depth by 12 m only resulted in a 20.8% decrease in settlement.
4.3. Comparison Between Measurement Results and Calculated Results
To facilitate the analysis of the proportion of settlement caused by construction disturbances relative to the total settlement, calculation scenarios were established based on the site cross-section conditions, as shown in Table 7: “C” represents CMP, “P” represents PHC pile, and “1” to “5” represent the fill heights ranging from 0.5 m to 2.5 m. Total settlement and disturbance-induced settlement were conducted using the stress modified method (SMM) and finite element method (FEM) proposed in Section 3.
Table 7.
Settlement calculated by stress modified method and finite element method.
- Total settlement after pile installation
Considering the influence of construction disturbances, the total settlement ranges for CMP and PHC pile foundation within fill heights of 0.5~2.5 m are 56~356 mm and 29~207 mm, respectively, using the stress modified method. However, the FEM results are 111~568 mm and 56~265 mm.
As is shown in Figure 11, the FEM results are 30% to 60% larger compared to those obtained using the stress modified method. The results from the stress modified method are closer to the measured settlement, with a difference of 10% to 15%, which falls within an acceptable range.
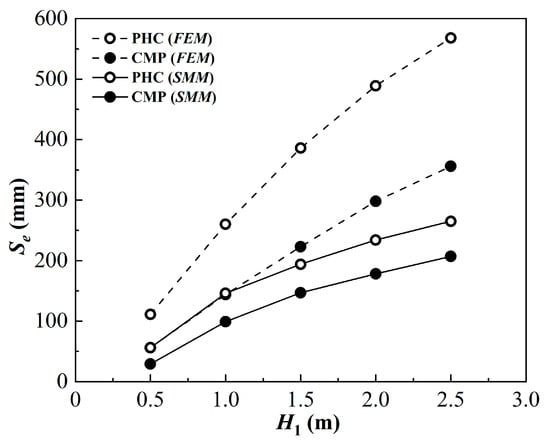
Figure 11.
Total settlement of embankment with filling height from 0.5 m to 2.5 m.
- Disturbance settlement
As illustrated in Figure 12, when the fill height increases, the settlement induced by the pile driving disturbances gradually increases, but the rate of increase slows down. When the embankment fill height is 0.5 m, the settlement, is approximately 6 to 7 mm for CMP composite foundations. With the gradual increase in fill height, the settlement at 2.5 m fill height is approximately 12 to 36 mm. When using PHC pile treatment, with an embankment fill height of 0.5 m, the settlement is approximately 7 to 16 mm, and with an embankment fill height of 2.5 m, the settlement is approximately 16 to 60 mm.
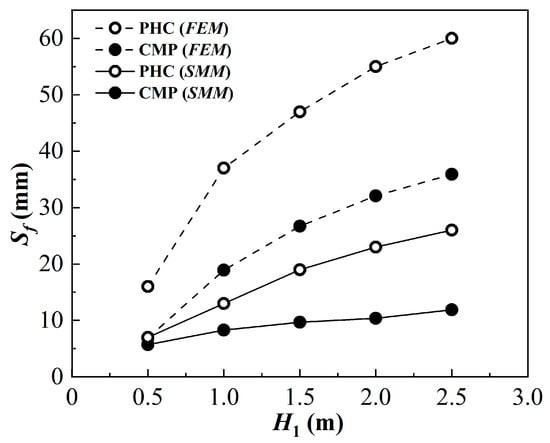
Figure 12.
Disturbance settlement of the embankment with filling height from 0.5 m to 2.5 m.
As illustrated in Figure 13, when the fill height increases, the proportion of disturbance settlement to total settlement gradually decreases. When the fill height is 0.5 m, the proportion of disturbance settlement to total settlement for CMP is . For PHC pile, it is . When the fill height is 2.5 m, the proportion for CMP is , and for PHC pile it is .
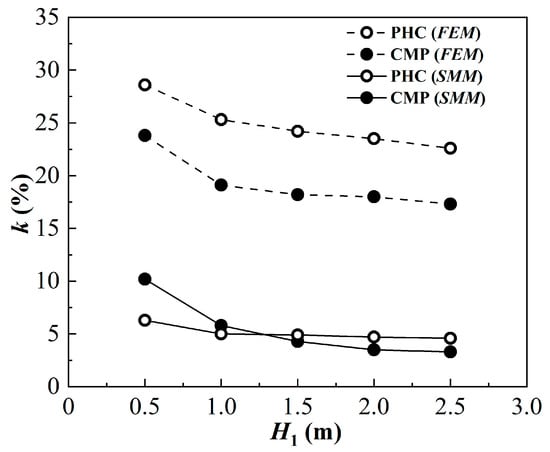
Figure 13.
Proportion of disturbance settlement to total settlement.
The reasons for the above result are as follows:
Firstly, with the increase in upper load, the influence depth of additional stress increases, leading to greater settlement in the lower subsoil layers and a smaller proportion of disturbance settlement.
Secondly, the magnitude of the upper load affects the pile-soil stress ratio. Under low loads, the soil between piles bears more load. Taking into account both the increase in load and the decrease in the ratio of load borne by the soil between piles, the overall disturbance settlement exhibits a trend of decelerated growth.
5. Discussion
In this manuscript, CPTU test was mainly applied to quantify the influence of CMP and PHC pile installation disturbance. The stress modified method was employed for analyzing settlement of soft soil foundation with low embankment (<2.5 m).
The primary conclusion of this study is that pile installation disturbance weakens the compression modulus of the soil between the piles, and the weakening rapidly decreases with depth. The additional settlement generated accounts for an average of 6% (CMP) and 23% (PHC pile) of the total settlement, respectively.
To mitigate the negative impacts of pile disturbance on settlement, several countermeasures will be discussed. Firstly, if the schedule allows, simple surcharge preloading method can be used to improve the consolidation of the foundation before pile installation.
Secondly, in situations where there are cost and time constraints, improvements in installation techniques become quite important. For CMP, in shallow soil layer, reinforcement can be appropriately enhanced by injecting more slurry to strengthen the soil between piles. For PHC pile, it is advisable to reduce the hammering energy in shallow layers, gradually restoring it to the design value as the depth increases, thus minimizing disturbance to the shallow soil layers.
Besides, the application of the settlement analyze method is almost not limited by soil type, because the disturbance can cause changes in soil compression characteristics. However, it should be noted that when installing displacement pile in sandy soil foundation, the soil compaction behavior is usually obvious. The settlement completed by vibration reduces the settlement experienced during the embankment filling process and the post-construction period, which is beneficial. A case [21] noted that at the moment of pile installation completion, the settlement of the sandy soil foundation was 42 mm, about ten times that of soft soil foundation. Thus, regarding the impact of pile installation disturbance on total settlement, the two conditions of sandy soil foundations and soft soil foundations may yield opposing conclusions.
6. Conclusions
Set against the backdrop of a deep and soft soil low-fill embankment project in the Zhongshan area, this study investigated the influence of CMP and PHC piles on settlement during the pile driving process. The main conclusions are as follows:
- 1.
- Under low embankment load (0.5 to 2.5 m), the settlement of embankment treated with PHC pile (20 m) is only 20% less than those reinforced with CMP (8 m). This occurrence is attributed to the greater additional settlement induced by the former’s pile driving process compared to the latter.
- 2.
- The disturbance caused by pile installation decreases with depth. For embankment fill heights ranging from 0.5 to 2.5 m, the average disturbance caused by the pile installation process of CMP and PHC pile are approximately 10% and 30%, respectively.
- 3.
- Compared to finite element analysis, disturbance settlement calculated through stress modified method aligns more closely with field-measured settlement. As the fill height increases, the proportion of disturbance settlement to total settlement gradually decreases. Hence, considering the impact of construction disturbance is more meaningful for low-fill embankment projects.
Author Contributions
Conceptualization, B.H. and Z.S.; methodology, X.L.; software, D.S.; validation, D.S., Z.S. and Y.Y.; formal analysis, Z.S.; investigation, Y.Y.; resources, B.H.; data curation, X.L.; writing—original draft preparation, Z.S.; writing—review and editing, G.W.; visualization, Z.S.; supervision, D.S.; project administration, B.H.; funding acquisition, X.L. All authors have read and agreed to the published version of the manuscript.
Funding
This study was sponsored by the National Natural Science Foundation of China (Grant No. 51609071) and the Fundamental Research Funds for the Central Universities (Grant No. B200202087, B200204032).
Institutional Review Board Statement
Not applicable.
Informed Consent Statement
Not applicable.
Data Availability Statement
The original contributions presented in this study are included in the article. Further inquiries can be directed to the corresponding authors.
Acknowledgments
The authors’ gratitude goes to the reviewers for their helpful comments and constructive suggestions in improving this paper.
Conflicts of Interest
The authors declare no conflict of interest.
References
- Shen, S.-L.; Han, J.; Zhu, H.-H.; Hong, Z.-S. Evaluation of a dike damaged by pile driving in soft clay. J. Perform. Constr. Facil. 2005, 19, 300–307. [Google Scholar] [CrossRef]
- Ottolini, M.; Dijkstra, J.; Van Tol, F. Immediate and long-term installation effects adjacent to an open-ended pile in a layered clay. Can. Geotech. J. 2015, 52, 982–991. [Google Scholar] [CrossRef]
- Zhu, D.L.; Indraratna, B.; Poulos, H.; Rujikiatkamjorn, C. Field study of pile–prefabricated vertical drain (PVD) interaction in soft clay. Can. Geotech. J. 2020, 57, 377–390. [Google Scholar] [CrossRef]
- Wang, Y.; Li, L.; Gong, W.B. An analytical solution for settlement of jacked piles considering pile installation effects. Eur. J. Environ. Civ. Eng. 2022, 26, 200–215. [Google Scholar] [CrossRef]
- Li, J.P.; Li, L. Theoretical analysis of long-term setup of driven piles considering soil anisotropy, destructuration and creep effects. Ocean Eng. 2021, 239, 109821. [Google Scholar] [CrossRef]
- Li, Y.; Zhang, G.; Liu, C.Y. Effects of pile installation simulation on behavior of pile groups in centrifuge model tests. Geotech. Test. J. 2018, 41, 815–820. [Google Scholar] [CrossRef]
- Wu, Y.D.; Liu, J.; Ng, C.W.W. Effects of pile extraction and refilling with cement slurry on ground settlements. Can. Geotech. J. 2013, 50, 343–349. [Google Scholar] [CrossRef]
- Li, L.; Gong, W.B. Prediction of nonlinear vertical settlement of a pile group consisting of new and existing displacement piles in clay strata. Soils Found. 2019, 59, 1336–1348. [Google Scholar] [CrossRef]
- Sales, M.M.; Prezzi, M.; Salgado, R.; Choi, Y.S.; Lee, J. Load-settlement behaviour of model pile groups in sand under vertical load. J. Civ. Eng. Manag. 2017, 23, 1148–1163. [Google Scholar] [CrossRef]
- Zhou, H.; Wang, Z.L.; Liu, H.L. Ultimate lateral pressure of circular pile in undrained clay considering the strength reduction induced by pile installation. Int. J. Geomech. 2022, 22, 04022012. [Google Scholar] [CrossRef]
- Zhou, H.; Liu, H.L.; Kong, G.Q.; Cao, Z. Analytical solution for stress and displacement after X-section cast-in-place pile installation. Math. Probl. Eng. 2013, 2013, 751716. [Google Scholar] [CrossRef]
- El Naggar, M.H. Vertical and torsional soil reactions for radially inhomogeneous soil layer. Struct. Eng. Mech. 2000, 10, 299–312. [Google Scholar] [CrossRef]
- Zhao, Q.; Wang, Y.; Tang, Y.; Ren, G.; Qiu, Z.; Luo, W.; Ye, Z. Numerical analysis of the installation process of screw piles based on the FEM-SPH coupling method. Appl. Sci. 2022, 12, 8508. [Google Scholar] [CrossRef]
- Lin, C.; Wang, R.; Huang, M.; Huang, L.; Tan, Q. Study on disturbance mechanism of squeezed and non-squeezed soil piles on soft soil foundation. Appl. Sci. 2023, 13, 7757. [Google Scholar] [CrossRef]
- Yu, H.; Zhou, H.; Sheil, B.; Liu, H. Finite element modelling of helical pile installation and its influence on uplift capacity in strain softening clay. Can. Geotech. J. 2022, 59, 2050–2066. [Google Scholar] [CrossRef]
- Zhan, J.Y.; Chen, J.J.; Wang, W.D.; Li, M. In situ investigation on pore-water pressure response during vibratory pile driving with high frequency. Acta Geotech. 2024, 19, 2649–2668. [Google Scholar] [CrossRef]
- Shao, F.Y.; Deng, Y.B.; Chen, S.J.; Zheng, R.; Zhang, R. Field test study on construction disturbances of driven pile and PGP pile. Appl. Sci. 2023, 13, 11887. [Google Scholar] [CrossRef]
- Duffy, K.; Gavin, K.; Korff, M.; de Lange, D.; Roubos, A. Influence of installation method on the axial capacity of piles in very dense sand. J. Geotech. Geoenviron. Eng. 2024, 150, 04024043. [Google Scholar] [CrossRef]
- Kulhawy, F.H.; Mayne, P.W. Manual on Estimating Soil Properties for Foundation Design; Cornell University: Ithaca, NY, USA, 1990. [Google Scholar]
- Jian, W.B.; Wu, Z.X.; Liu, H.M.; Chen, Z.B.; Zhang, M.X. Correlation analysis of static sounding parameter of soft soil along coastal area of Southeast Fujian Province. Rock Soil Mech. 2005, 26, 733–738. [Google Scholar]
- Nie, Q.; Hu, J.; Shang, W. Disturbance effect on soft clay foundation due to steel tube driving by use of shaking method. Chin. J. Geotech. Eng. 2008, 30, 128–132. [Google Scholar]
Disclaimer/Publisher’s Note: The statements, opinions and data contained in all publications are solely those of the individual author(s) and contributor(s) and not of MDPI and/or the editor(s). MDPI and/or the editor(s) disclaim responsibility for any injury to people or property resulting from any ideas, methods, instructions or products referred to in the content. |
© 2025 by the authors. Licensee MDPI, Basel, Switzerland. This article is an open access article distributed under the terms and conditions of the Creative Commons Attribution (CC BY) license (https://creativecommons.org/licenses/by/4.0/).