Article

Concatenated Attention: A Novel Method for Regulating Information Structure Based on Sensors

by
Zeyu Zhang
1,
Tianqi Chen
1 and
Yuki Todo
2,*
1
Division of Electrical Engineering and Computer Science, Kanazawa University, Kanazawa 9201192, Japan
2
Faculty of Electrical, Information and Communication Engineering, Kanazawa University, Kanazawa 9201192, Japan
*
Author to whom correspondence should be addressed.
Appl. Sci. 2025, 15(2), 523; https://doi.org/10.3390/app15020523
Submission received: 3 December 2024 / Revised: 6 January 2025 / Accepted: 6 January 2025 / Published: 8 January 2025
(This article belongs to the Special Issue Application of Neural Networks in Sensors and Microwave Antennas)

Abstract

:
This paper addresses the challenges of limited training data and suboptimal environmental conditions in image processing tasks, such as underwater imaging with poor lighting and distortion. Neural networks, including Convolutional Neural Networks (CNNs) and Transformers, have advanced image analysis but remain constrained by computational demands and insufficient data. To overcome these limitations, we propose a novel split-and-concatenate method for self-attention mechanisms. By splitting Query and Key matrices into submatrices, performing cross-multiplications, and applying weighted summation, the method optimizes intermediate variables without increasing computational costs. Experiments on a real-world crack dataset demonstrate its effectiveness in improving network performance.

1. Introduction

With the continuous development of Artificial Intelligence (AI), research in many fields has been significantly optimized by leveraging this technology [1,2,3]. For example, AI can be employed to analyze real-time sensor data, such as temperature, humidity, and gas concentration, to assess air quality and predict weather changes [4,5,6]. Furthermore, AI has the ability to predict environmental trends based on long-term data [7,8]. Many inefficient and unstable monitoring systems have been replaced by AI-based automation systems, improving the efficiency and accuracy of monitoring or forecasting, which is critical for applications such as disaster management and pollution control [9,10]. In smart transportation planning, AI analyzes urban traffic conditions to dynamically allocate road resources, thus alleviating traffic congestion [11,12]. Similarly, in wireless sensor networks, AI evaluates the status and access requirements of communication nodes, enabling the dynamic adjustment of resource allocation to minimize power consumption. Additionally, neural networks are adept at analyzing object image data, thereby completing tasks such as predictive maintenance and anomaly detection [13,14]. For example, in the application of chest X-ray images, neural networks can effectively improve diagnostic efficiency [15,16].
These advantages in efficiency and stability also demonstrate AI’s potential in enabling smarter, more adaptable systems across various industries.
However, the environments in which sensors acquire and analyze images in real time are often less than ideal [17,18]. For instance, underwater monitoring systems lack sufficient lighting, resulting in reduced clarity of images captured by sensors. Even under consistent lighting conditions, factors such as depth and suspended particles can attenuate the light reflected from an object’s surface to the sensor [19,20]. Moreover, water flow can induce object motion or microbial adhesion, further leading to blurred or distorted images. Under these conditions, real-time monitoring systems become unstable, failing to meet the demands for accurate detection and recognition. These limitations not only reduce the clarity of the collected data but also hinder the backpropagation process in neural networks during training. Therefore, developing more robust solutions is crucial.
To address these challenges, many improvements have been made in both hardware and software. From a hardware perspective, low-light cameras, specialized underwater imaging sensors, and enhanced lighting conditions can improve image acquisition [21,22]. On the software side, techniques such as noise reduction, image enhancement, and illumination compensation can significantly improve image clarity. However, while these methods meet practical requirements, they are often unable to adapt to specific tasks or perform effectively in more general scenarios [23,24]. For example, optimization methods may fail when devices operate in highly dynamic environments. At the same time, neural network-based algorithms for feature extraction and detailed classification have become the mainstream approach in image processing [25,26]. Convolutional Neural Networks (CNNs), such as AlexNet, were among the earliest methods proposed for handling image-related tasks [27]. AlexNet pioneered the extraction of image features from the lowest layers of the network, enabling higher-level layers to monitor targets from a global perspective. However, the rigid structure of AlexNet hinders adaptation to task-specific requirements, and issues such as shallow network depth and susceptibility to overfitting remain. These limitations have exceeded the capabilities of existing system architectures, highlighting the need to develop more advanced neural networks to meet the requirements of a broader range of applications.
In pursuit of optimal CNN structures, researchers developed the EfficientNet network, which effectively addresses the issues of overfitting and high data requirements inherent in traditional CNNs [28]. Additionally, the adjustable architecture of EfficientNet enables it to accommodate diverse task requirements. Despite these advantages, the number of parameters generated in the EfficientNet network is higher than that of most CNNs, requiring substantial computational resources. This limitation restricts EfficientNet’s learning ability and scalability in real-time applications involving small tasks or datasets, failing to adequately balance computational efficiency and high accuracy. Moreover, on large datasets, EfficientNet often suffers from the drawback of forgetting earlier objectives. To further enhance neural network performance, researchers adapted the Transformer model, originally designed for natural language processing (NLP), to image processing tasks [29,30]. The core of the Transformer lies in the self-attention mechanism, which identifies key features by calculating relationships among input data. However, Vision Transformer (ViT) requires significant computational resources and time to train on large datasets [31,32]. To alleviate the computational burden of Transformers in image-related tasks, researchers proposed the Swin Transformer (Swin) [33]. By dividing images into smaller regions and processing them in parallel, Swin achieves a substantial reduction in the number of parameters and computational costs while maintaining high accuracy [34]. These advancements indicate a shift in neural networks towards modular and hierarchical approaches, facilitating more efficient processing pipelines while maintaining high levels of accuracy.
Despite the continuous optimization of image processing methods, the performance of networks in real-world applications is often suboptimal due to insufficient actual data. To address the challenges posed by limited training data, we propose a novel method named concatenated attention (CA), which enhances networks by augmenting input data from a computational perspective. Specifically, we introduce a split-and-concatenate approach based on the matrix computation methodology of the self-attention mechanism. This method not only leverages existing feature extraction mechanisms but also enriches the diversity of input data while computing intermediate variables, thereby improving the model’s learning capacity. In detail, the core matrices generated from input data retain identical feature information but are designed to strengthen the learning ability of the neural network when training data is insufficient. In the CA method, the Query and Key matrices are split into two equal-sized submatrices along the same dimension. These submatrices undergo pairwise multiplication, yielding two result matrices of the same size as the original computation. Subsequently, these matrices are combined through a weighted computation to produce a new result matrix. Ultimately, this method enhances the network’s learning process by adjusting the weights of the intermediate variables. Furthermore, since the implementation of the method does not introduce additional trainable parameters, the overall computational demand of the neural network remains unchanged.
The primary contributions of this paper are as follows:
  • A novel split-and-cross-multiplication method is proposed for matrices, enabling control over intermediate variables.
  • A weighted summation mechanism is introduced to optimize the network learning process by tuning intermediate variables.
  • The effectiveness of the proposed method is validated through network training on a crack dataset collected from real-world applications.

2. Methods

2.1. Split and Concatenate

In the self-attention mechanism, the input data, after preprocessing, is transformed into three matrices of identical size, which form the core of the self-attention mechanism. These matrices—commonly referred to as the Query (Q), Key (K), and Value (
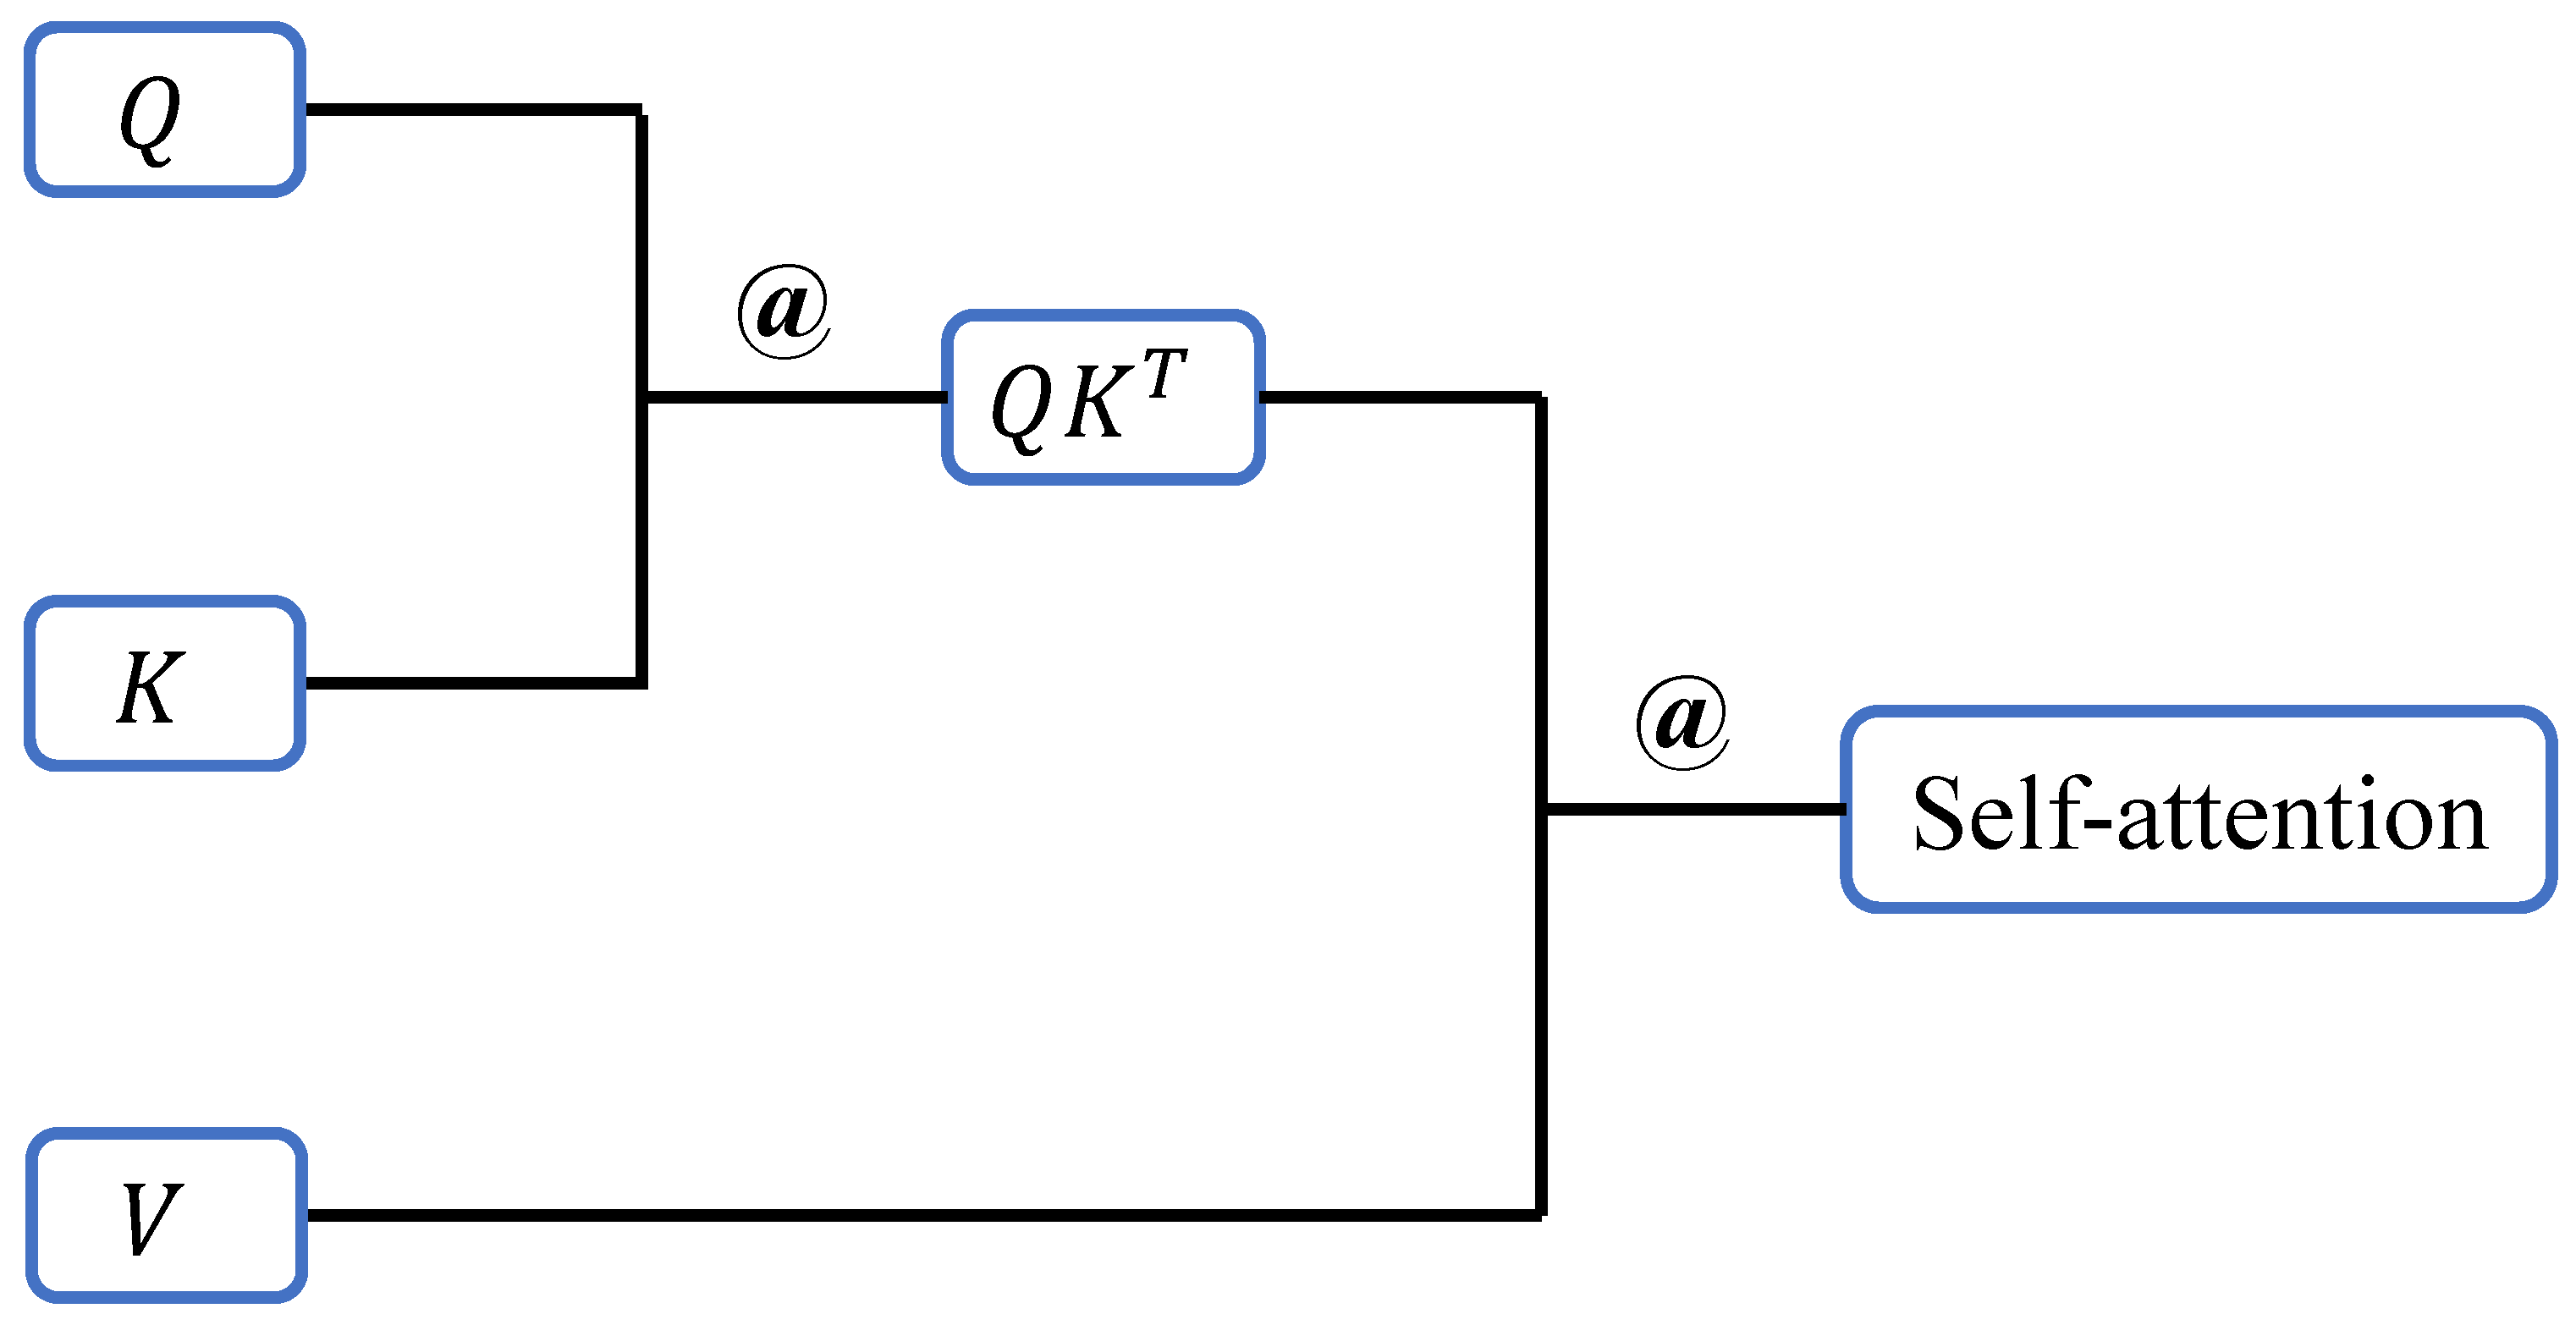
V) matrices—encapsulate the essential features of the input data. The results obtained from matrix multiplication and normalization represent the relationships between individual data elements, enabling the network to identify which parts of the input data are most important for the current task. The matrix computation process is illustrated in Figure 1. Specifically, the Q matrix is multiplied by the K matrix to produce an intermediate matrix, which represents the association scores between units of input data. These scores, after normalization, are transformed into a probability matrix, where higher probabilities indicate a greater likelihood of selecting important information as features. This probability matrix is then applied in a matrix multiplication with the V matrix to generate the self-attention matrix, which encodes the relationships among features. This process strengthens the network’s ability to capture long-range dependencies and contextual relevance, effectively mitigating the issue of the network forgetting initial features.
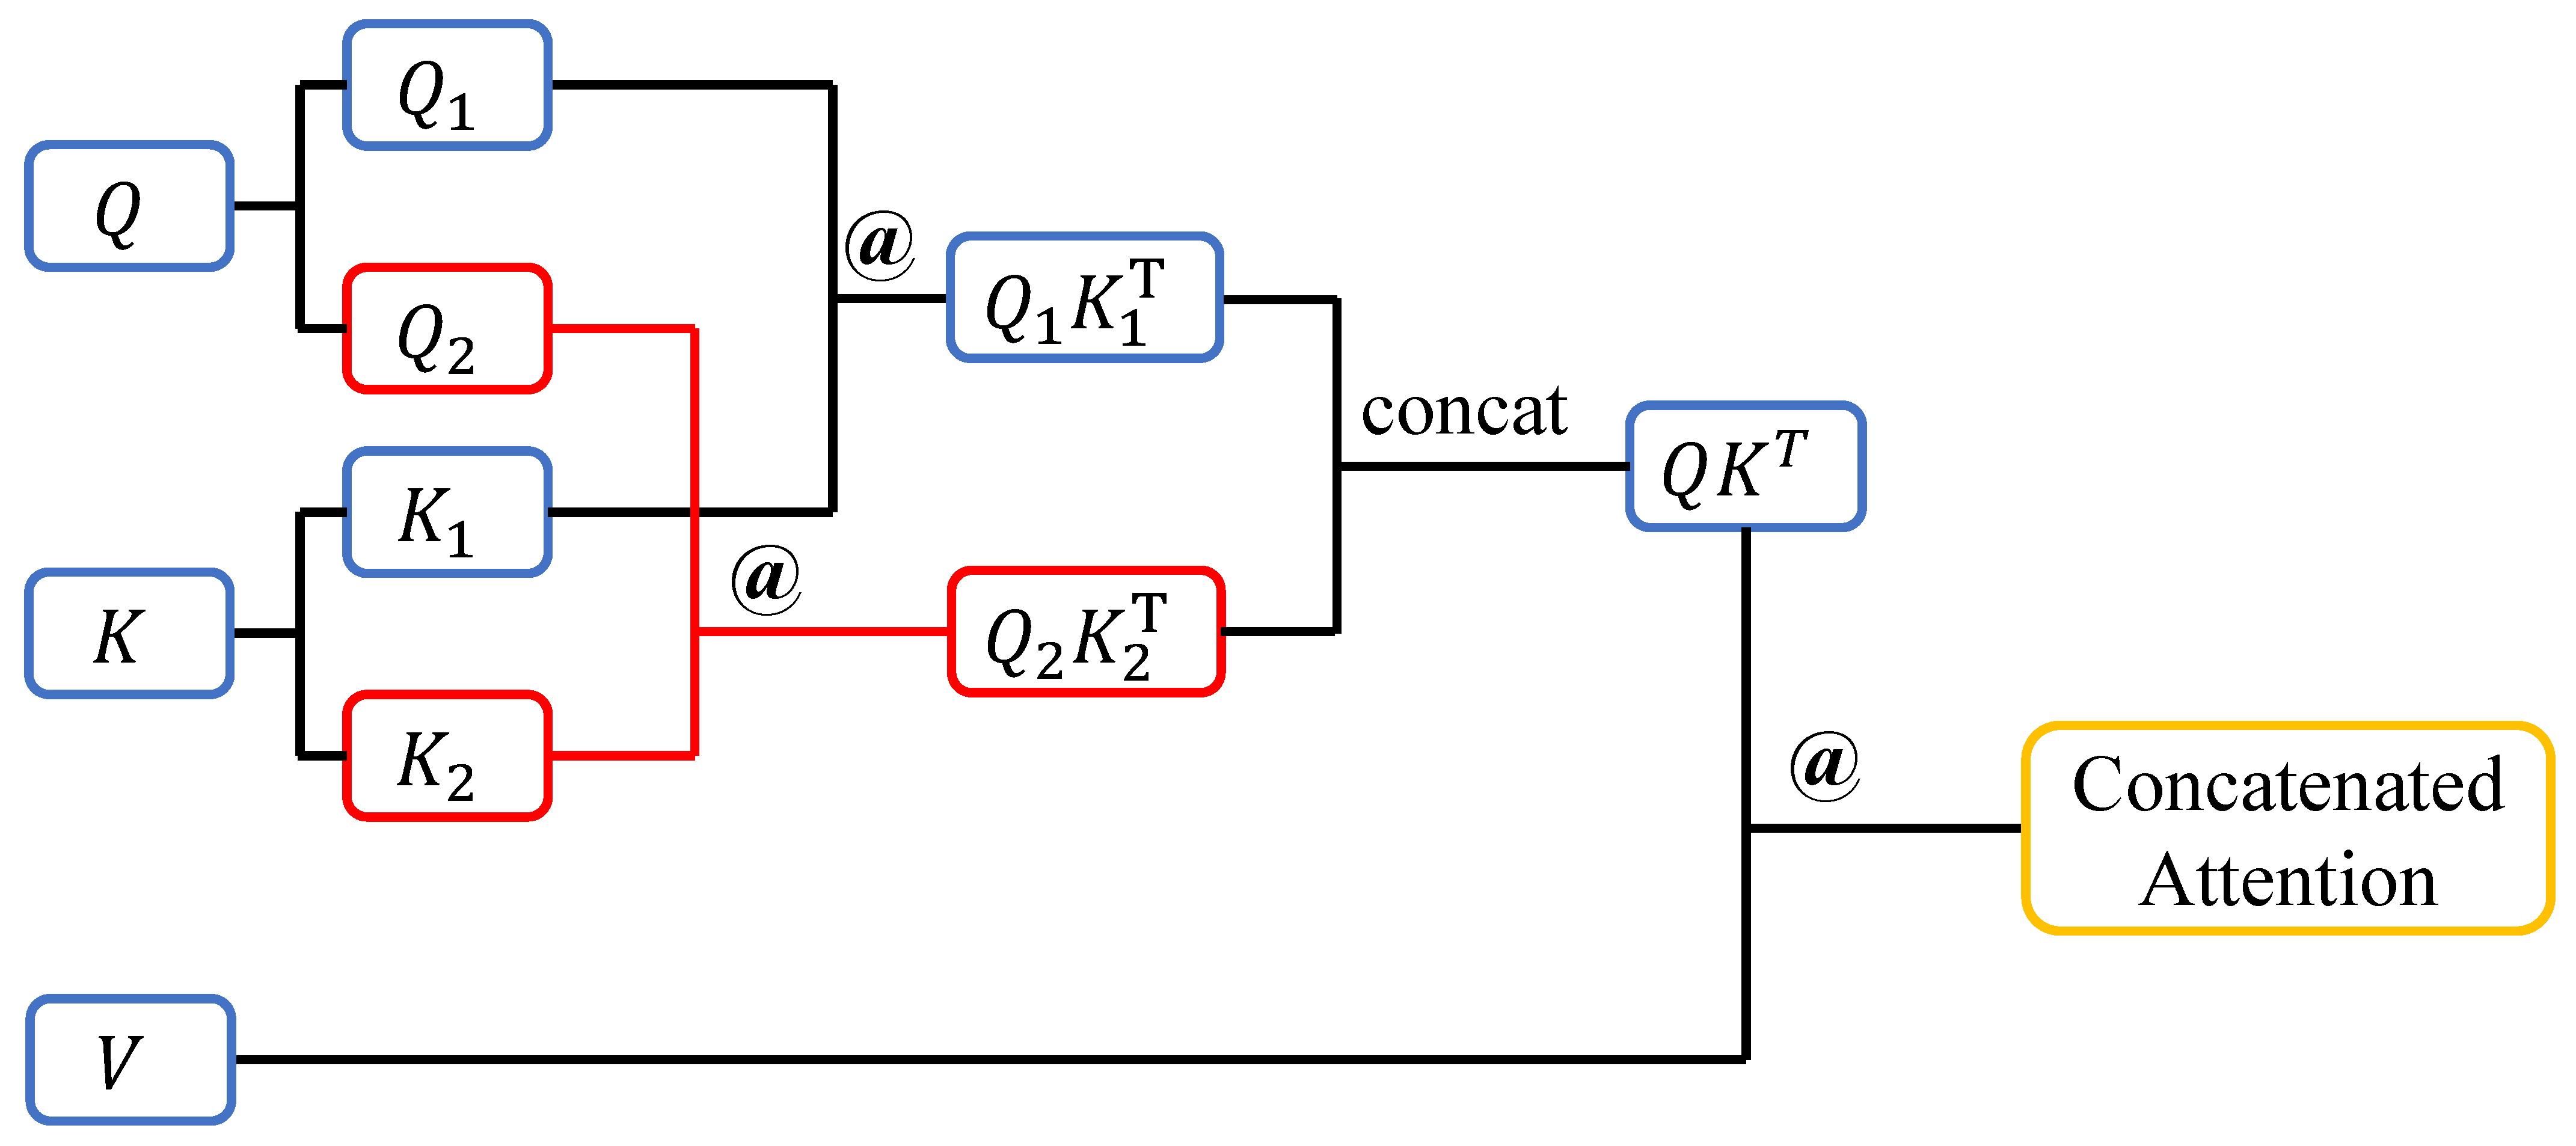
To enhance the diversity of input data features, we propose optimizing the neural network’s feature perception through a split-and-concatenate method. This approach increases the informational richness of the self-attention mechanism by introducing additional flexibility and granularity in the representation of intermediate variables. The detailed process of the proposed CA method is shown in Figure 2. After generating the three core matrices Q, K, and V, the Q and K matrices are first equally split along the same dimension, ensuring that the resulting submatrices are of equal size. This guarantees that the dimensions of the subsequent result matrices will also remain consistent. This splitting operation introduces variability into the computation process, as the submatrices not only focus on different parts of the data’s feature space but also enable fine-tuning when computing  Q K T .
Next, the resulting submatrices are multiplied pairwise along the split dimension, producing two intermediate matrices of the same size as the original result. Compared to traditional methods, these intermediate matrices capture finer-grained relationships between data elements, allowing the network to better differentiate subtle variations in input features. The two matrices are then concatenated and subsequently multiplied by the V matrix to generate the final  C A  matrix. This concatenation step reintroduces the feature diversity captured by the intermediate matrices, ensuring that the final result reflects a richer and more comprehensive representation of the input data.
This approach modifies only the computation order and direction while preserving the original size of the matrices. Consequently, it does not introduce additional computational overhead or increase the number of parameters, making it a computationally efficient solution. Furthermore, the method is fully compatible with existing self-attention mechanisms and can be seamlessly integrated into a wide range of neural network architectures. By enriching the representation of intermediate variables, the proposed method enhances the network’s capacity to learn meaningful features from input data, particularly in scenarios with limited training samples or complex environmental conditions.

2.2. Weighted Calculation

To more precisely adjust the significance of individual data units in the input, we incorporated a weighted computation method into the CA calculation process. After obtaining two intermediate matrices by multiplying  Q 1  with  K 1  and  Q 2  with  K 2 , two distinct scalar weights are applied to these matrices. These weights enable the neural network to more directly prioritize important features, allowing for dynamic adjustments when handling different subtasks or datasets of varying sizes. This approach ensures that the network can effectively identify the most critical features without compromising final accuracy. The weighted computation can be expressed as follows:
C A = a ( Q 1 K 1 ) + b ( Q 2 K 2 ) ,
where a and b are real-valued weights assigned to the two matrices. For robustness and computational efficiency, the weights are constrained by the condition  a + b = 1 . This constraint not only ensures the simplicity of the optimization process but also maintains a balance in feature selection between the  Q 1 K 1  and  Q 2 K 2  matrices during their combination, thereby avoiding excessive emphasis on a single intermediate matrix.
Assuming  Q 1 K 1  and  Q 2 K 2  are one-dimensional variables, this computation represents all points on the line segment connecting these two variables. In such optimization problems, the weighted sum serves as a linear interpolation mechanism, ensuring smooth transitions between the two variables. As the weight a transitions from 0 to 1, the output gradually shifts from  Q 2 K 2  to  Q 1 K 1 . This optimization approach provides the neural network with a highly interpretable mechanism for feature selection and interaction, as it can adjust the output to emphasize features from either  Q 1 K 1  or  Q 2 K 2  based on task requirements.
Moreover, this mechanism allows the network to dynamically adjust the features derived from different parts of the input data, ensuring flexibility and applicability across diverse scenarios. This adaptability proves particularly powerful in complex, dynamic, or noisy data environments, where certain features may shift from being irrelevant to relevant under specific conditions. At the same time, the application of scalar weights preserves computational stability and simplicity, ensuring that the method can be efficiently integrated into existing architectures without introducing significant complexity or additional overhead.

2.3. Neural Network with CA Method

In underwater real-time monitoring, short time intervals between data acquisitions typically result in a large volume of data being generated within a short period. This high data throughput places significant demands on processing systems, making the computational efficiency of the neural network a critical consideration. Among the various neural networks that incorporate self-attention mechanisms, the Swin Transformer stands out for its ability to achieve high training accuracy while maintaining low computational resource consumption. By leveraging a hierarchical design and localized attention, the Swin Transformer effectively balances accuracy and efficiency, making it highly suitable for real-time monitoring of underwater target objects.
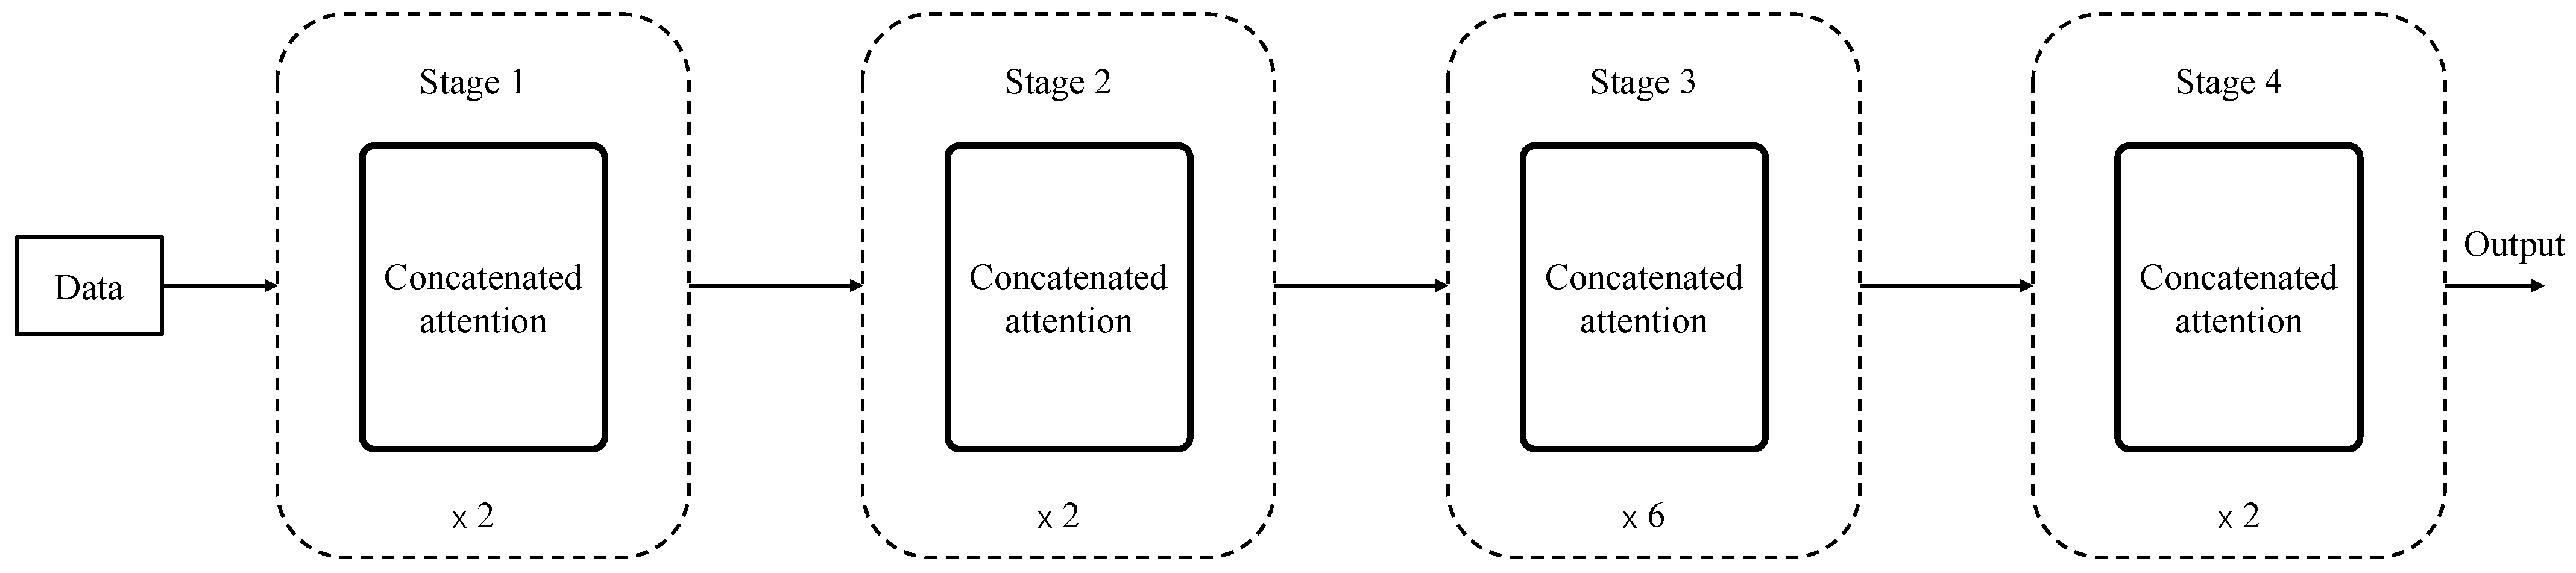
The modified neural network architecture incorporates the proposed CA method, as shown in Figure 3. The network consists of four stages, each containing a specific number of layers required for training. The layers in each stage are trained repeatedly, with repetition counts of 2, 2, 6, and 2, as indicated below the figure. The structures of different stages vary to accommodate the diversity and complexity of features at different levels. The design of repetition within the same stage balances the number of parameters trained and the final accuracy. Additionally, the consistency within each stage simplifies parameter sharing and reduces redundancy, thereby improving computational efficiency. Similarly, the size of the core matrices applied in the CA method varies across stages, dynamically adjusting to the resolution and complexity of the input data at each level.
The application of the CA method, combined with the staged design strategy, ensures scalability and adaptability, enabling the network to handle different computational requirements effectively. Early stages focus on extracting localized and fine-grained features, while later stages progressively integrate the information into high-level representations. This hierarchical approach not only enhances the model’s ability to capture contextual relationships but also optimizes computational efficiency by allocating resources to where they are most needed. Furthermore, the integration of the CA method within the framework adds flexibility, allowing the network to enrich feature representations without increasing computational overhead. This makes the modified architecture particularly suitable for underwater monitoring, where the ability to process large volumes of data quickly and accurately is crucial.

3. Results

3.1. Settings

This section validates the effectiveness of the proposed method through two experimental parts in the image classification subtask. The first part conducts comparative experiments using the controlled variable method on five commonly applied datasets to ensure the reliability of the experimental results. The second part also adopts the controlled variable method but uses a crack dataset captured under varying lighting conditions [35]. To further demonstrate the reliability of the CA method in practical applications, the crack dataset was preprocessed to simulate real-world environments, making the task conditions closer to underwater scenarios. This enables a more accurate evaluation of the proposed method’s robustness and adaptability in adverse conditions.
In the experiment, the Multi-Head Self-Attention (MHSA) method was selected as the control group. MHSA is a key component in Transformer architectures. It operates by projecting input sequences into Query (Q), Key (K), and Value (V) matrices, which are then split into multiple heads. Each head computes attention scores by measuring the compatibility of Q and K, scaled by the square root of the dimension, followed by a softmax to normalize weights. These weights are applied to V, capturing different aspects of the input features in parallel. Outputs from all heads are concatenated and linearly transformed to form the final output. MHSA enhances representational power by attending to multiple features simultaneously.
To maximize the credibility of the results, the same pre-trained model file was employed for every training session. This ensures consistency across experiments and minimizes the potential variability caused by differences in the initial model weights. Since neither the original method nor the proposed method modifies the network’s parameters or structure, the pre-trained file is compatible with both approaches. To ensure representativeness, the experiments were repeated multiple times, and the results were averaged to account for randomness and provide a fair comparison between the methods.
The benchmark datasets applied in the experiments include CIFAR-100 [36,37], CUB-200 [38,39], Stanford Flower-102 [40,41], Pet-37 [42,43,44], and Food-101 [45,46]. These datasets were chosen for their diversity in terms of complexity, class distribution, and feature variations, ensuring that the proposed method is tested across a wide range of scenarios. Each dataset was pre-divided into fixed subsets for training, validation, and testing. The division ratio of the three sub-datasets is determined by the pre-division ratio of the dataset creator. For example, the creator of the Flower-102 dataset has pre-divided the samples into three subsets, so no modification will be made to these three subsets in the experiment. If the dataset is not pre-divided, the dataset will be divided into three subsets according to its size in a ratio of 7:1.5:1.5 or other ratios [47]. Meanwhile, all classes in a single dataset will be divided in the same proportion, so as to eliminate the randomness of the experimental results to the greatest extent.
The final result selection strategy involved training network parameters on the training set during each epoch, followed by evaluating these parameters on the validation set. This iterative approach ensures that the network’s performance on unseen data is continuously monitored and optimized. After a fixed number of training and validation epochs, the parameters achieving the highest accuracy on the validation set were employed to compute results on the test set. This experimental strategy guarantees that the final reported accuracy reflects the model’s ability to generalize to unseen data, thereby ensuring the validity and reliability of the experimental conclusions. The accuracy obtained on the test set represents the final result of the experiment.
In image classification, accuracy is defined as the ratio of correctly predicted images to the total number of images. It is calculated as follows:
A c c u r a c y = N u m b e r o f c o r r e c t p r e d i c t i o n s T o t a l n u m b e r o f s a m p l e s ,
where accuracy measures overall model performance, reflecting its ability to correctly classify instances.

3.2. Comparison on Benchmark

Table 1 lists the average results and computational resources of the network under the two methods on the CUB dataset, obtained through multiple repetitions. Here, “MHSA” and “CA” represent the original method and the proposed method, respectively. The results show that the average accuracy of the original method is  69.70 , while the proposed method achieves an average accuracy of  71.40 . This demonstrates that the split-and-concatenate mechanism in the CA method can improve the learning efficiency of the neural network on the dataset, and the effectiveness of intermediate variables is enhanced through weighted summation. It also confirms that the network structure extracts more critical features from the input data after undergoing the processes of splitting, weighted summation, and recombination. Moreover, the parameter count and floating-point operations per second (FLOPs) remain unchanged for both methods, confirming that the computational overhead introduced by the proposed method is negligible, making it suitable for resource-constrained application scenarios.
Using the bootstrap method, the 95 percent confidence interval for the difference in accuracy between the CA method and the MHSA method is  [ 0.0086 , 0.0262 ] . The mean difference in accuracy is  0.0170 . Since the confidence interval does not include 0, this indicates that the CA method’s improvement over the MHSA method is statistically significant.
To intuitively illustrate the differences between the two methods during training, a line chart was created to show accuracy variations across epochs. The accuracy trends on the training set for both methods are depicted in Figure 4, where the curves exhibit nearly identical trends. This consistency suggests that the proposed method does not disrupt the network’s ability to effectively adjust parameters during training, even when the training set size is small. This is because the training set contains significantly more data than the other subsets, allowing the network parameters to be adequately adjusted. The accuracy trends on the validation set are shown in Figure 5, revealing that the proposed method achieves noticeably higher accuracy than the original method after approximately 10 epochs. The similarity in accuracy trends between the CA and MHSA methods on the training set indicates that both methods are equally capable of fitting the training data. This suggests that the core improvements introduced by the CA method do not negatively affect the network’s ability to learn from the available training data. However, the noticeable differences on the validation set, with the CA method achieving faster and higher accuracy improvements, demonstrate its enhanced generalization capabilities. This can be attributed to the CA method’s ability to extract more diverse and informative features through its split-and-concatenate mechanism. By enriching the representation of intermediate variables and dynamically weighting their contributions, the CA method effectively captures more critical patterns and relationships in the data that are relevant for unseen validation samples. In contrast, the MHSA method may focus more on fitting the training data without adequately capturing the broader feature diversity, leading to a slower improvement in validation accuracy. The superior performance of the CA method on the validation set highlights its robustness and adaptability, making it better suited for handling complex and diverse real-world data distributions.
From the curve trends in Figure 4 and Figure 5, we can see that the accuracy change is always on an upward trend. Although there are small fluctuations, it does not affect the overall change. In addition, the curves in both figures are on an upward trend. At the same time, since the samples of the two subsets do not intersect, this shows that the model is not overfitting or underfitting.
The average accuracies of the two methods on the CIFAR-100 and Flower-102 datasets are shown in Table 2 and Table 3, respectively. The proposed method outperforms the “MHSA” method on both datasets. The performance of the CA method in terms of accuracy and computational efficiency highlights its adaptability, demonstrating that it can maintain high efficiency when dealing with different feature distributions and complex classifications. Using the bootstrap method, the 95 percent confidence interval for the difference in accuracy between the CA method and the MHSA method of CIFAR-100 and Flower-102 are  [ 0.0012 , 0.0084 ]  and  [ 0.0015 , 0.0061 ] . The mean differences in accuracy are  0.0045  and  0.0016 .
Similarly, the results on the Pet-37 and Food-101 datasets, shown in Table 4 and Table 5, also indicate the superior performance of the proposed method. The consistent improvement in accuracy suggests that the proposed method effectively captures complex feature relationships across a range of image classification tasks. These results further validate the generality and effectiveness of the proposed method, emphasizing its broader application potential beyond the datasets tested in this study. In the bootstrap method, the 95 percent confidence interval for the difference in accuracy between the CA method and the MHSA method of Pet-37 and Food-101 are  [ 0.0025 , 0.0064 ]  and  [ 0.0013 , 0.0027 ] . The mean differences in accuracy are  0.0024  and  0.0021 .
In order to further verify the effectiveness of the CA method in crack detection tasks, we selected the Crack-Segmentation dataset on the benchmark. This dataset contains around 11.200 images that are merged from several available crack datasets [48,49,50,51,52,53]. The average experimental results on this dataset are shown in Table 6. It can be seen that the CA method is still better than the MHSA method. Using the bootstrap method, the 95 percent confidence interval for the difference in accuracy between the CA method and the MHSA method on the Crack-Seg dataset is  [ 0.000472 , 0.001888 ] . The mean difference in accuracy is  0.001180 . Since the confidence interval does not include 0, this indicates that the CA method’s improvement over the MHSA method on the Crack-Segmentation dataset is statistically significant.
In order to better observe the difference between the two methods during the training process, ROC curves were drawn. The MHSA method and the CA method correspond to Figure 6 and Figure 7, respectively. By comparison, it can be seen that both methods quickly rose to the level of AUC = 1, which shows that both methods have high efficiency. However, the MHSA method showed some fluctuations during the change process. The CA method did not have such fluctuations, which shows that the training efficiency of the CA method is better.

3.3. Comparison on Crack Dataset

The dataset applied in this section consists of binary classification data captured by sensors under varying environmental conditions [35]. One class represents surfaces with cracks, while the other class represents intact surfaces. Two sample images from the dataset are shown in Figure 8, where the left image shows a cracked surface, and the right image shows a flawless surface. Notably, the intact surface image highlights one of the key challenges in this task: even pristine surfaces may exhibit stains, water marks, or other environmental artifacts that resemble cracks, complicating the classification process. It is evident that even intact surfaces may have stains or other attachments, which can lead to misclassification, particularly in low-light underwater environments. Additionally, varying illumination levels and sensor noise in these environments exacerbate the difficulty, further stressing the need for robust feature extraction and classification mechanisms.
The comparative results of the two methods on the Crack dataset are summarized in Table 7. While both methods achieve very high accuracy, neither reaches 100 percent, which underscores the inherent difficulty of the dataset due to ambiguities and visual similarities between classes. Some challenging images in the dataset feature cracks obscured by shadows or dirt, while others show intact surfaces marred by misleading artifacts. Nonetheless, the proposed method achieves a relatively higher average accuracy compared to the original method, demonstrating the advantage of the CA mechanism in extracting discriminative features even under suboptimal conditions. By enriching intermediate representations through weighted summation and recombination, the proposed method enhances the network’s ability to distinguish subtle differences between the two classes. In the bootstrap method, the confidence interval in accuracy between the CA method and the MHSA method is  [ 0.000075 , 0.000400 ] . The mean difference in accuracy is  0.000175 . Importantly, this improvement is achieved without increasing the number of parameters or FLOPs, ensuring that the computational efficiency remains unaffected. This makes the method particularly suitable for resource-constrained real-time applications such as underwater monitoring systems.
The ROC curve MHSA method and the CA method correspond to Figure 9 and Figure 10, respectively. By comparison, it can be seen that the AUC-ROC of the two methods is 1, which shows that both methods are perfect models. Meanwhile, this also proves that neither model is overfitting or underfitting.

4. Discussion

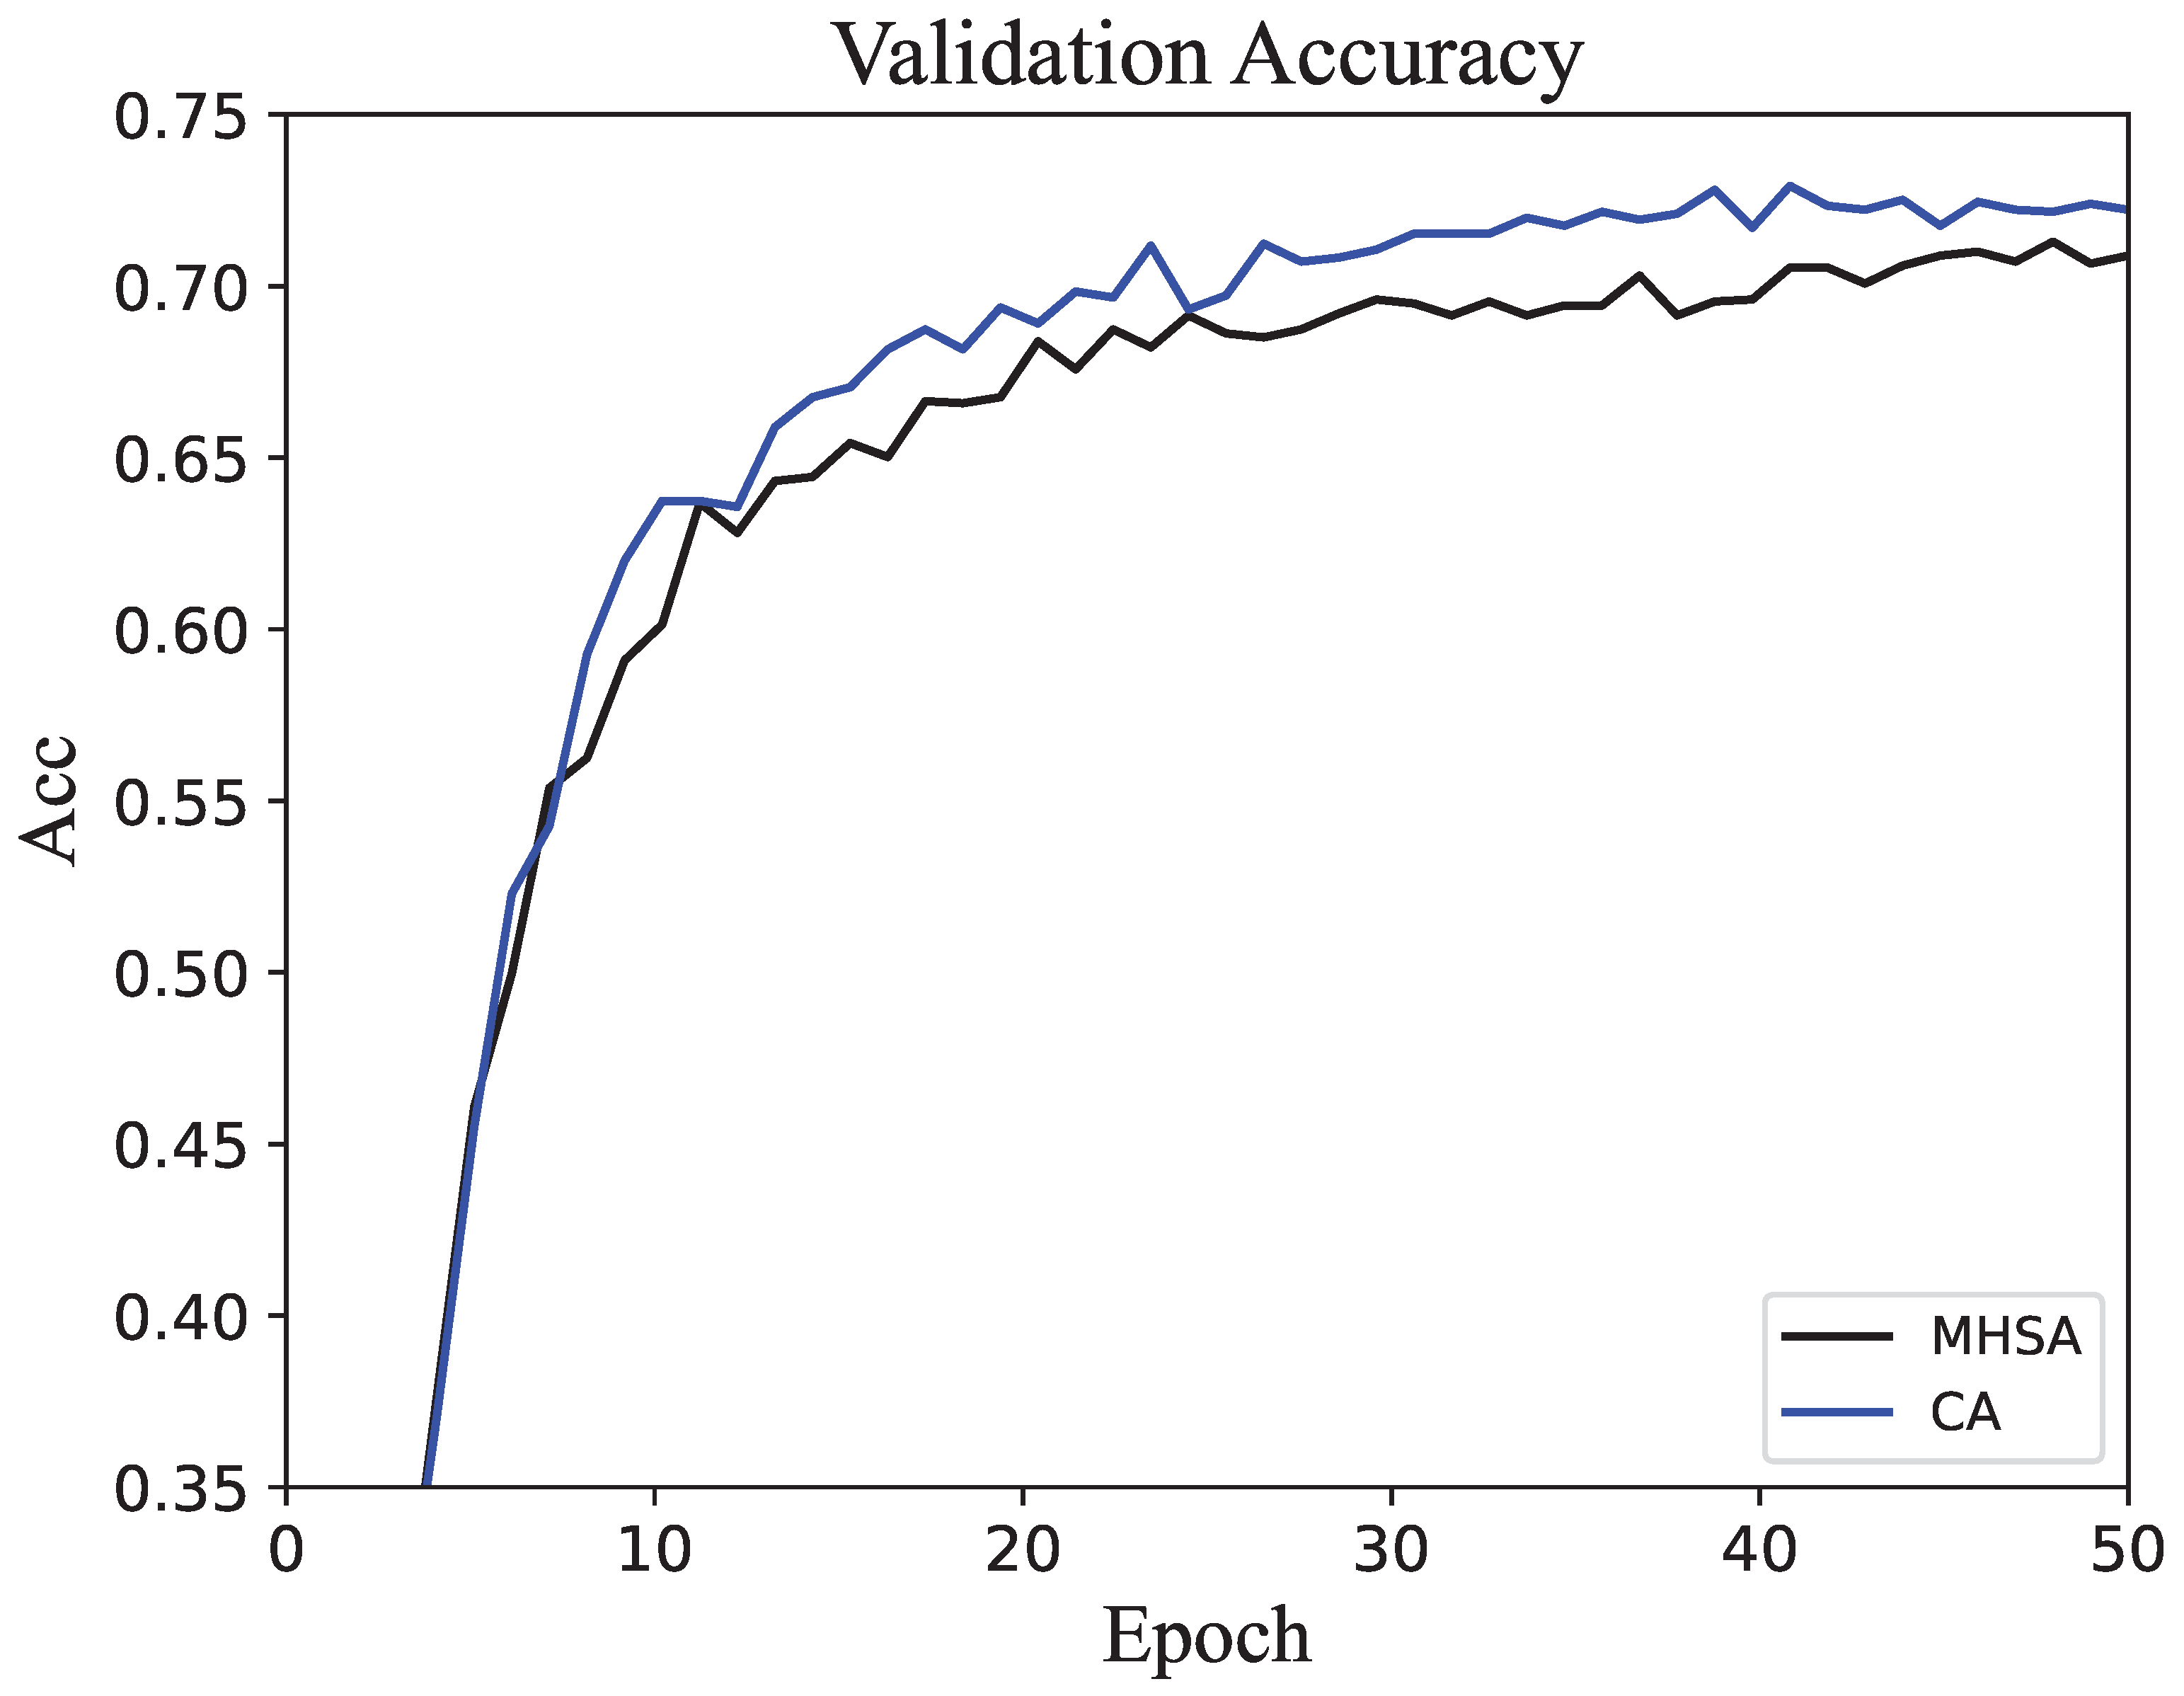
The experimental results validate the effectiveness and generalizability of the proposed method across multiple datasets. Compared to the original MHSA method, the proposed approach achieved higher average accuracy. The improvement is consistent across diverse datasets, ranging from general-purpose image classification benchmarks to specialized datasets captured under challenging conditions, underscoring the versatility of the proposed approach. This demonstrates that the processes of splitting, weighted summation, and recombination within the self-attention mechanism can improve network performance without increasing computational overhead. By introducing finer-grained control over intermediate variable interactions, the CA method enhances the network’s ability to capture subtle relationships in the data, leading to improved feature representation and decision making. The strength of the CA method lies in its ability to enrich the representation of intermediate variables. Furthermore, despite challenging conditions such as low-light environments and surface contaminants in real-world applications, the results on the Crack dataset confirm the robustness of the CA method. The robustness highlights its potential for deployment in environments where data quality or illumination conditions may vary significantly, such as underwater monitoring or industrial inspection systems.
The lack of statistical significance for the CA method’s improvement on the Flower-102, Pet-37, and Crack datasets can be attributed to several factors. First, the small sample size or limited number of repetitions might have led to wider confidence intervals, making it difficult to detect subtle differences. Second, the intrinsic characteristics of these datasets, such as balanced class distributions, high-quality images, or low noise levels, likely reduced the potential for significant performance gains, as the MHSA method already performed effectively in capturing key features. Additionally, on the Crack dataset, the model’s accuracy was near its upper limit, leaving little room for further improvement. Together, these factors suggest that the datasets themselves and the experimental setup may have constrained the measurable advantages of the CA method.
From the perspective of prior research, the CA method aligns with the trend of optimizing neural network architectures to improve accuracy without significantly increasing computational demands. This alignment is particularly evident in its compatibility with existing attention-based architectures, enabling seamless integration without requiring major modifications to network structures or hyperparameters. The method effectively addresses data limitations and environmental challenges, making it a practical and scalable solution for applications that demand both high precision and computational efficiency. It provides a practical solution for real-world applications such as defect detection and image classification under adverse conditions. Moreover, the CA method’s emphasis on maintaining computational efficiency while improving accuracy ensures its applicability in resource-constrained scenarios, paving the way for broader adoption in edge computing and real-time processing tasks.
However, the improvements in CA methods on some datasets, while showing improvements in accuracy, are not statistically satisfactory. This suggests that performance gains may depend on dataset characteristics, such as class balance or intrinsic task difficulty. Future work could focus on understanding and mitigating these dependencies.

5. Conclusions

This paper proposes a novel split-and-concatenate approach to enhance the performance of self-attention mechanisms in neural networks, particularly under challenging conditions such as limited training data and unfavorable environmental factors. The proposed method builds upon the core principles of self-attention by introducing greater flexibility in feature interaction modeling, making it adaptable to diverse datasets and application scenarios. By introducing the steps of splitting, weighted summation, and recombination, the method optimizes intermediate variables. These processes allow the network to better capture subtle feature relationships and reduce the risk of overfitting in data-scarce environments. It achieves improved accuracy and computational efficiency by enriching the learning process without increasing parameter counts or computational costs. This balance between performance and efficiency ensures the scalability of the proposed method in both high-resource environments and edge computing scenarios.
The contributions of this work include optimizing the self-attention mechanism to enhance feature representation and providing a computationally efficient solution for real-world image processing tasks. The method has been rigorously validated across diverse datasets, demonstrating its generalizability and robustness under varying conditions, such as low-light environments and noisy data. Future research could extend the method to object detection, temporal data analysis, and video processing tasks, which would benefit from the enriched feature representation introduced by the proposed approach. Further exploration of adaptive weighting strategies and integration with other attention-based architectures could also enhance its applicability and effectiveness, paving the way for its deployment in increasingly complex AI-driven applications such as real-time monitoring.

Author Contributions

Conceptualization, Z.Z. and Y.T.; methodology, Z.Z. and Y.T.; software, Z.Z. and T.C.; validation, Z.Z. and T.C.; formal analysis, Z.Z. and Y.T.; investigation, Z.Z. and Y.T.; resources, Z.Z. and Y.T.; data curation, T.C. and Y.T.; writing—original draft preparation, Z.Z.; writing—review and editing, Y.T.; visualization, Z.Z. and T.C.; supervision, Y.T.; project administration, Z.Z. and T.C. All authors have read and agreed to the published version of the manuscript.

Funding

This research received no external funding.

Data Availability Statement

The data involved in the experiments are all publicly available and properly referenced in the paper. The source code of the proposed method in the paper can be shared upon request.

Conflicts of Interest

The authors declare no conflicts of interest.

References

  1. Voulodimos, A.; Doulamis, N.; Doulamis, A.; Protopapadakis, E. Deep learning for computer vision: A brief review. Comput. Intell. Neurosci. 2018, 2018, 7068349. [Google Scholar] [CrossRef]
  2. Zhao, X.; Wang, L.; Zhang, Y.; Han, X.; Deveci, M.; Parmar, M. A review of convolutional neural networks in computer vision. Artif. Intell. Rev. 2024, 57, 99. [Google Scholar] [CrossRef]
  3. González-Sabbagh, S.P.; Robles-Kelly, A. A survey on underwater computer vision. ACM Comput. Surv. 2023, 55, 1–39. [Google Scholar] [CrossRef]
  4. Mukhopadhyay, S.C.; Tyagi, S.K.S.; Suryadevara, N.K.; Piuri, V.; Scotti, F.; Zeadally, S. Artificial intelligence-based sensors for next generation IoT applications: A review. IEEE Sens. J. 2021, 21, 24920–24932. [Google Scholar] [CrossRef]
  5. Blasch, E.; Pham, T.; Chong, C.Y.; Koch, W.; Leung, H.; Braines, D.; Abdelzaher, T. Machine learning/artificial intelligence for sensor data fusion–opportunities and challenges. IEEE Aerosp. Electron. Syst. Mag. 2021, 36, 80–93. [Google Scholar] [CrossRef]
  6. Fabre, W.; Haroun, K.; Lorrain, V.; Lepecq, M.; Sicard, G. From Near-Sensor to In-Sensor: A State-of-the-Art Review of Embedded AI Vision Systems. Sensors 2024, 24, 5446. [Google Scholar] [CrossRef]
  7. Wu, C.J.; Raghavendra, R.; Gupta, U.; Acun, B.; Ardalani, N.; Maeng, K.; Chang, G.; Aga, F.; Huang, J.; Bai, C.; et al. Sustainable ai: Environmental implications, challenges and opportunities. Proc. Mach. Learn. Syst. 2022, 4, 795–813. [Google Scholar]
  8. Verdecchia, R.; Sallou, J.; Cruz, L. A systematic review of Green AI. Wiley Interdiscip. Rev. Data Min. Knowl. Discov. 2023, 13, e1507. [Google Scholar] [CrossRef]
  9. Cui, Z.; Fang, Y.; Mei, L.; Zhang, B.; Yu, B.; Liu, J.; Jiang, C.; Sun, Y.; Ma, L.; Huang, J.; et al. A fully automatic AI system for tooth and alveolar bone segmentation from cone-beam CT images. Nat. Commun. 2022, 13, 2096. [Google Scholar] [CrossRef]
  10. Huang, H.; Zheng, O.; Wang, D.; Yin, J.; Wang, Z.; Ding, S.; Yin, H.; Xu, C.; Yang, R.; Zheng, Q.; et al. ChatGPT for shaping the future of dentistry: The potential of multi-modal large language model. Int. J. Oral Sci. 2023, 15, 29. [Google Scholar] [CrossRef] [PubMed]
  11. Akhtar, M.; Moridpour, S. A review of traffic congestion prediction using artificial intelligence. J. Adv. Transp. 2021, 2021, 8878011. [Google Scholar] [CrossRef]
  12. Pan, Z.; Sharma, A.; Hu, J.Y.C.; Liu, Z.; Li, A.; Liu, H.; Huang, M.; Geng, T. Ising-traffic: Using ising machine learning to predict traffic congestion under uncertainty. In Proceedings of the AAAI Conference on Artificial Intelligence, Montréal, QC, Canada, 8–10 August 2023; Volume 37, pp. 9354–9363. [Google Scholar]
  13. Collins, G.S.; Moons, K.G. Reporting of artificial intelligence prediction models. Lancet 2019, 393, 1577–1579. [Google Scholar] [CrossRef]
  14. Vasey, B.; Nagendran, M.; Campbell, B.; Clifton, D.A.; Collins, G.S.; Denaxas, S.; Denniston, A.K.; Faes, L.; Geerts, B.; Ibrahim, M.; et al. Reporting guideline for the early stage clinical evaluation of decision support systems driven by artificial intelligence: DECIDE-AI. BMJ 2022, 377, e070904. [Google Scholar] [CrossRef]
  15. Devnath, L.; Luo, S.; Summons, P.; Wang, D. Tuberculosis (TB) classification in chest radiographs using deep convolutional neural networks. Int. J. Adv. Sci. Eng. Technol 2018, 6, 68–74. [Google Scholar]
  16. Devnath, L.; Fan, Z.; Luo, S.; Summons, P.; Wang, D. Detection and visualisation of pneumoconiosis using an ensemble of multi-dimensional deep features learned from Chest X-rays. Int. J. Environ. Res. Public Health 2022, 19, 11193. [Google Scholar] [CrossRef] [PubMed]
  17. Ketu, S.; Mishra, P.K. Internet of Healthcare Things: A contemporary survey. J. Netw. Comput. Appl. 2021, 192, 103179. [Google Scholar] [CrossRef]
  18. Mahmood, T.; Li, J.; Pei, Y.; Akhtar, F.; Butt, S.A.; Ditta, A.; Qureshi, S. An intelligent fault detection approach based on reinforcement learning system in wireless sensor network. J. Supercomput. 2022, 78, 3646–3675. [Google Scholar] [CrossRef]
  19. Wei, K.; Fu, Y.; Yang, J.; Huang, H. A physics-based noise formation model for extreme low-light raw denoising. In Proceedings of the IEEE/CVF Conference on Computer Vision and Pattern Recognition, Seattle, WA, USA, 13–19 June 2020; pp. 2758–2767. [Google Scholar]
  20. Hofmann, K.P.; Lamb, T.D. Rhodopsin, light-sensor of vision. Prog. Retin. Eye Res. 2023, 93, 101116. [Google Scholar] [CrossRef] [PubMed]
  21. Ai, S.; Kwon, J. Extreme low-light image enhancement for surveillance cameras using attention U-Net. Sensors 2020, 20, 495. [Google Scholar] [CrossRef] [PubMed]
  22. Jung, M.; Cho, J. Enhancing Detection of Pedestrians in Low-Light Conditions by Accentuating Gaussian–Sobel Edge Features from Depth Maps. Appl. Sci. 2024, 14, 8326. [Google Scholar] [CrossRef]
  23. Kline, A.; Wang, H.; Li, Y.; Dennis, S.; Hutch, M.; Xu, Z.; Wang, F.; Cheng, F.; Luo, Y. Multimodal machine learning in precision health: A scoping review. Npj Digit. Med. 2022, 5, 171. [Google Scholar] [CrossRef] [PubMed]
  24. Wornow, M.; Xu, Y.; Thapa, R.; Patel, B.; Steinberg, E.; Fleming, S.; Pfeffer, M.A.; Fries, J.; Shah, N.H. The shaky foundations of large language models and foundation models for electronic health records. Npj Digit. Med. 2023, 6, 135. [Google Scholar] [CrossRef] [PubMed]
  25. Marton, S.; Lüdtke, S.; Bartelt, C. Explanations for neural networks by neural networks. Appl. Sci. 2022, 12, 980. [Google Scholar] [CrossRef]
  26. Le, A.T.; Shakiba, M.; Ardekani, I.; Abdulla, W.H. Optimizing Plant Disease Classification with Hybrid Convolutional Neural Network–Recurrent Neural Network and Liquid Time-Constant Network. Appl. Sci. 2024, 14, 9118. [Google Scholar] [CrossRef]
  27. Krizhevsky, A.; Sutskever, I.; Hinton, G.E. Imagenet classification with deep convolutional neural networks. Commun. ACM 2017, 60, 84–90. [Google Scholar] [CrossRef]
  28. Tan, M. Efficientnet: Rethinking model scaling for convolutional neural networks. arXiv 2019, arXiv:1905.11946. [Google Scholar]
  29. Chiruzzo, L.; Jiménez-Zafra, S.M.; Rangel, F. Overview of IberLEF 2024: Natural Language Processing Challenges for Spanish and other Iberian Languages. In Proceedings of the Iberian Languages Evaluation Forum (IberLEF 2024), co-located with the 40th Conference of the Spanish Society for Natural Language Processing (SEPLN 2024), Valladolid, Spain, 24 September 2024. [Google Scholar]
  30. Chen, S.; Zhang, Y.; Yang, Q. Multi-task learning in natural language processing: An overview. ACM Comput. Surv. 2024, 56, 1–32. [Google Scholar] [CrossRef]
  31. Dosovitskiy, A.; Beyer, L.; Kolesnikov, A.; Weissenborn, D.; Zhai, X.; Unterthiner, T.; Dehghani, M.; Minderer, M.; Heigold, G.; Gelly, S.; et al. An image is worth 16x16 words: Transformers for image recognition at scale. arXiv 2020, arXiv:2010.11929. [Google Scholar]
  32. Li, B.; Hu, Y.; Nie, X.; Han, C.; Jiang, X.; Guo, T.; Liu, L. Dropkey for vision transformer. In Proceedings of the IEEE/CVF Conference on Computer Vision and Pattern Recognition, Vancouver, BC, Canada, 17–24 June 2023; pp. 22700–22709. [Google Scholar]
  33. Liu, Z.; Lin, Y.; Cao, Y.; Hu, H.; Wei, Y.; Zhang, Z.; Lin, S.; Guo, B. Swin transformer: Hierarchical vision transformer using shifted windows. In Proceedings of the IEEE/CVF International Conference on Computer Vision, Montreal, BC, Canada, 11–17 October 2021; pp. 10012–10022. [Google Scholar]
  34. Gui, J.; Chen, T.; Zhang, J.; Cao, Q.; Sun, Z.; Luo, H.; Tao, D. A Survey on Self-supervised Learning: Algorithms, Applications, and Future Trends. IEEE Trans. Pattern Anal. Mach. Intell. 2024, 46, 9052–9071. [Google Scholar] [CrossRef] [PubMed]
  35. Özgenel, Ç.F.; Sorguç, A.G. Performance comparison of pretrained convolutional neural networks on crack detection in buildings. In Proceedings of the International Symposium on Automation and Robotics in Construction, Berlin, Germany, 20–25 July 2018; IAARC Publications: Berlin, Germany, 2018; Volume 35, pp. 1–8. [Google Scholar]
  36. Krizhevsky, A. Learning Multiple Layers of Features from Tiny Images. 2009. Available online: https://www.cs.utoronto.ca/~kriz/learning-features-2009-TR.pdf (accessed on 5 January 2025).
  37. Ikotun, A.M.; Ezugwu, A.E.; Abualigah, L.; Abuhaija, B.; Heming, J. K-means clustering algorithms: A comprehensive review, variants analysis, and advances in the era of big data. Inf. Sci. 2023, 622, 178–210. [Google Scholar] [CrossRef]
  38. Wah, C.; Branson, S.; Welinder, P.; Perona, P.; Belongie, S. The Caltech-Ucsd Birds-200-2011 Dataset; California Institute of Technology: Pasadena, CA, USA, 2011. [Google Scholar]
  39. Song, Y.; Wang, T.; Cai, P.; Mondal, S.K.; Sahoo, J.P. A comprehensive survey of few-shot learning: Evolution, applications, challenges, and opportunities. ACM Comput. Surv. 2023, 55, 1–40. [Google Scholar] [CrossRef]
  40. Nilsback, M.E.; Zisserman, A. Automated flower classification over a large number of classes. In Proceedings of the 2008 Sixth Indian Conference on Computer Vision, Graphics & Image Processing, Bhubaneswar, India, 16–19 December 2008; pp. 722–729. [Google Scholar]
  41. Stefanini, M.; Cornia, M.; Baraldi, L.; Cascianelli, S.; Fiameni, G.; Cucchiara, R. From show to tell: A survey on deep learning-based image captioning. IEEE Trans. Pattern Anal. Mach. Intell. 2022, 45, 539–559. [Google Scholar] [CrossRef]
  42. Parkhi, O.M.; Vedaldi, A.; Zisserman, A.; Jawahar, C. Cats and dogs. In Proceedings of the 2012 IEEE Conference on Computer Vision and Pattern Recognition, Providence, RI, USA, 16–21 June 2012; pp. 3498–3505. [Google Scholar]
  43. Kaya, M.; Bilge, H.Ş. Deep metric learning: A survey. Symmetry 2019, 11, 1066. [Google Scholar] [CrossRef]
  44. Peral-García, D.; Cruz-Benito, J.; García-Peñalvo, F.J. Systematic literature review: Quantum machine learning and its applications. Comput. Sci. Rev. 2024, 51, 100619. [Google Scholar] [CrossRef]
  45. Bossard, L.; Guillaumin, M.; Van Gool, L. Food-101–mining discriminative components with random forests. In Proceedings of the Computer Vision–ECCV 2014: 13th European Conference, Zurich, Switzerland, 6–12 September 2014; Proceedings, Part VI 13. Springer: Berlin/Heidelberg, Germany, 2014; pp. 446–461. [Google Scholar]
  46. Khattak, M.U.; Rasheed, H.; Maaz, M.; Khan, S.; Khan, F.S. Maple: Multi-modal prompt learning. In Proceedings of the IEEE/CVF Conference on Computer Vision and Pattern Recognition, Vancouver, BC, Canada, 17–24 June 2023; pp. 19113–19122. [Google Scholar]
  47. Bishop, C.M.; Nasrabadi, N.M. Pattern Recognition and Machine Learning; Springer: Berlin/Heidelberg, Germany, 2006; Volume 4. [Google Scholar]
  48. Zhang, L.; Yang, F.; Zhang, Y.D.; Zhu, Y.J. Road crack detection using deep convolutional neural network. In Proceedings of the 2016 IEEE International Conference on Image Processing (ICIP), Phoenix, AZ, USA, 25–28 September 2016; pp. 3708–3712. [Google Scholar]
  49. Yang, F.; Zhang, L.; Yu, S.; Prokhorov, D.; Mei, X.; Ling, H. Feature Pyramid and Hierarchical Boosting Network for Pavement Crack Detection. arXiv 2019, arXiv:1901.06340. [Google Scholar] [CrossRef]
  50. Eisenbach, M.; Stricker, R.; Seichter, D.; Amende, K.; Debes, K.; Sesselmann, M.; Ebersbach, D.; Stoeckert, U.; Gross, H.M. How to Get Pavement Distress Detection Ready for Deep Learning? A Systematic Approach. In Proceedings of the International Joint Conference on Neural Networks (IJCNN), Anchorage, AK, USA, 14–19 May 2017; pp. 2039–2047. [Google Scholar]
  51. Shi, Y.; Cui, L.; Qi, Z.; Meng, F.; Chen, Z. Automatic road crack detection using random structured forests. IEEE Trans. Intell. Transp. Syst. 2016, 17, 3434–3445. [Google Scholar] [CrossRef]
  52. Amhaz, R.; Chambon, S.; Idier, J.; Baltazart, V. Automatic Crack Detection on Two-Dimensional Pavement Images: An Algorithm Based on Minimal Path Selection. IEEE Trans. Intell. Transp. Syst. 2016, 17, 2718–2729. [Google Scholar] [CrossRef]
  53. Zou, Q.; Cao, Y.; Li, Q.; Mao, Q.; Wang, S. CrackTree: Automatic crack detection from pavement images. Pattern Recognit. Lett. 2012, 33, 227–238. [Google Scholar] [CrossRef]
Figure 1. The computational structure of the self-attention mechanism.
Applsci 15 00523 g001
Figure 2. The computational structure of the concatenated attention method.
Applsci 15 00523 g002
Figure 3. Neural network with CA method.
Applsci 15 00523 g003
Figure 4. The accuracy changes in the network on the training set during the training process.
Applsci 15 00523 g004
Figure 5. The accuracy changes in the network on the validation set during the training process.
Applsci 15 00523 g005
Figure 6. The ROC curve of the MHSA method on the Crack-Segmentation dataset.
Applsci 15 00523 g006
Figure 7. The ROC curve of the CA method on the Crack-Segmentation dataset.
Applsci 15 00523 g007
Figure 8. Samples from the Crack dataset, photos with cracks (left) and photos without cracks (right).
Applsci 15 00523 g008
Figure 9. The ROC curve of the MHSA method on the Crack dataset.
Applsci 15 00523 g009
Figure 10. The ROC curve of the CA method on the Crack dataset.
Applsci 15 00523 g010
Table 1. The average accuracy of the comparative experiments on the CUB-200 dataset.
MethodAccuracyFLOPs (G)Param. (M)
MHSA69.704.3727.65
CA71.404.3727.65
Table 2. The average accuracy of the comparative experiments on the CIFAR-100 dataset.
MethodAccuracyFLOPs (G)Param. (M)
MHSA67.604.3727.57
CA68.054.3727.57
Table 3. The average accuracy of the comparative experiments on the Flower-102 dataset.
MethodAccuracyFLOPs (G)Param. (M)
MHSA91.124.3727.57
CA91.274.3727.57
Table 4. The average accuracy of the comparative experiments on the Pet-37 dataset.
MethodAccuracyFLOPs (G)Param. (M)
MHSA72.494.3727.59
CA72.734.3727.59
Table 5. The average accuracy of the comparative experiments on the Food-101 dataset.
MethodAccuracyFLOPs (G)Param. (M)
MHSA84.224.3727.59
CA84.434.3727.59
Table 6. The average accuracy of the comparative experiments on the Crack-Segmentation dataset.
MethodAccuracyFLOPs (G)Param. (M)
MHSA99.854.3727.50
CA99.964.3727.50
Table 7. The average accuracy of the comparative experiments on the Crack dataset.
MethodAccuracyFLOPs (G)Param. (M)
MHSA99.874.3727.59
CA99.894.3727.59
Disclaimer/Publisher’s Note: The statements, opinions and data contained in all publications are solely those of the individual author(s) and contributor(s) and not of MDPI and/or the editor(s). MDPI and/or the editor(s) disclaim responsibility for any injury to people or property resulting from any ideas, methods, instructions or products referred to in the content.

