
Identification Method of Highway Accident Prone Sections Under Adverse Meteorological Conditions Based on Meteorological Responsiveness


Abstract
1. Introduction
2. Methodology
2.1. Meteorological Event Responsiveness
- (1)
- Meteorological event carrier. The event carrier of the meteorological event response degree is the route unit. According to the current status quo, there is no clear regulation on route division, and most consider the method of route division mainly based on experience and simplicity. Common road segmentation methods [29] include the average road segment method, uneven road segment method, fixed step method, dynamic step method, etc.
- (2)
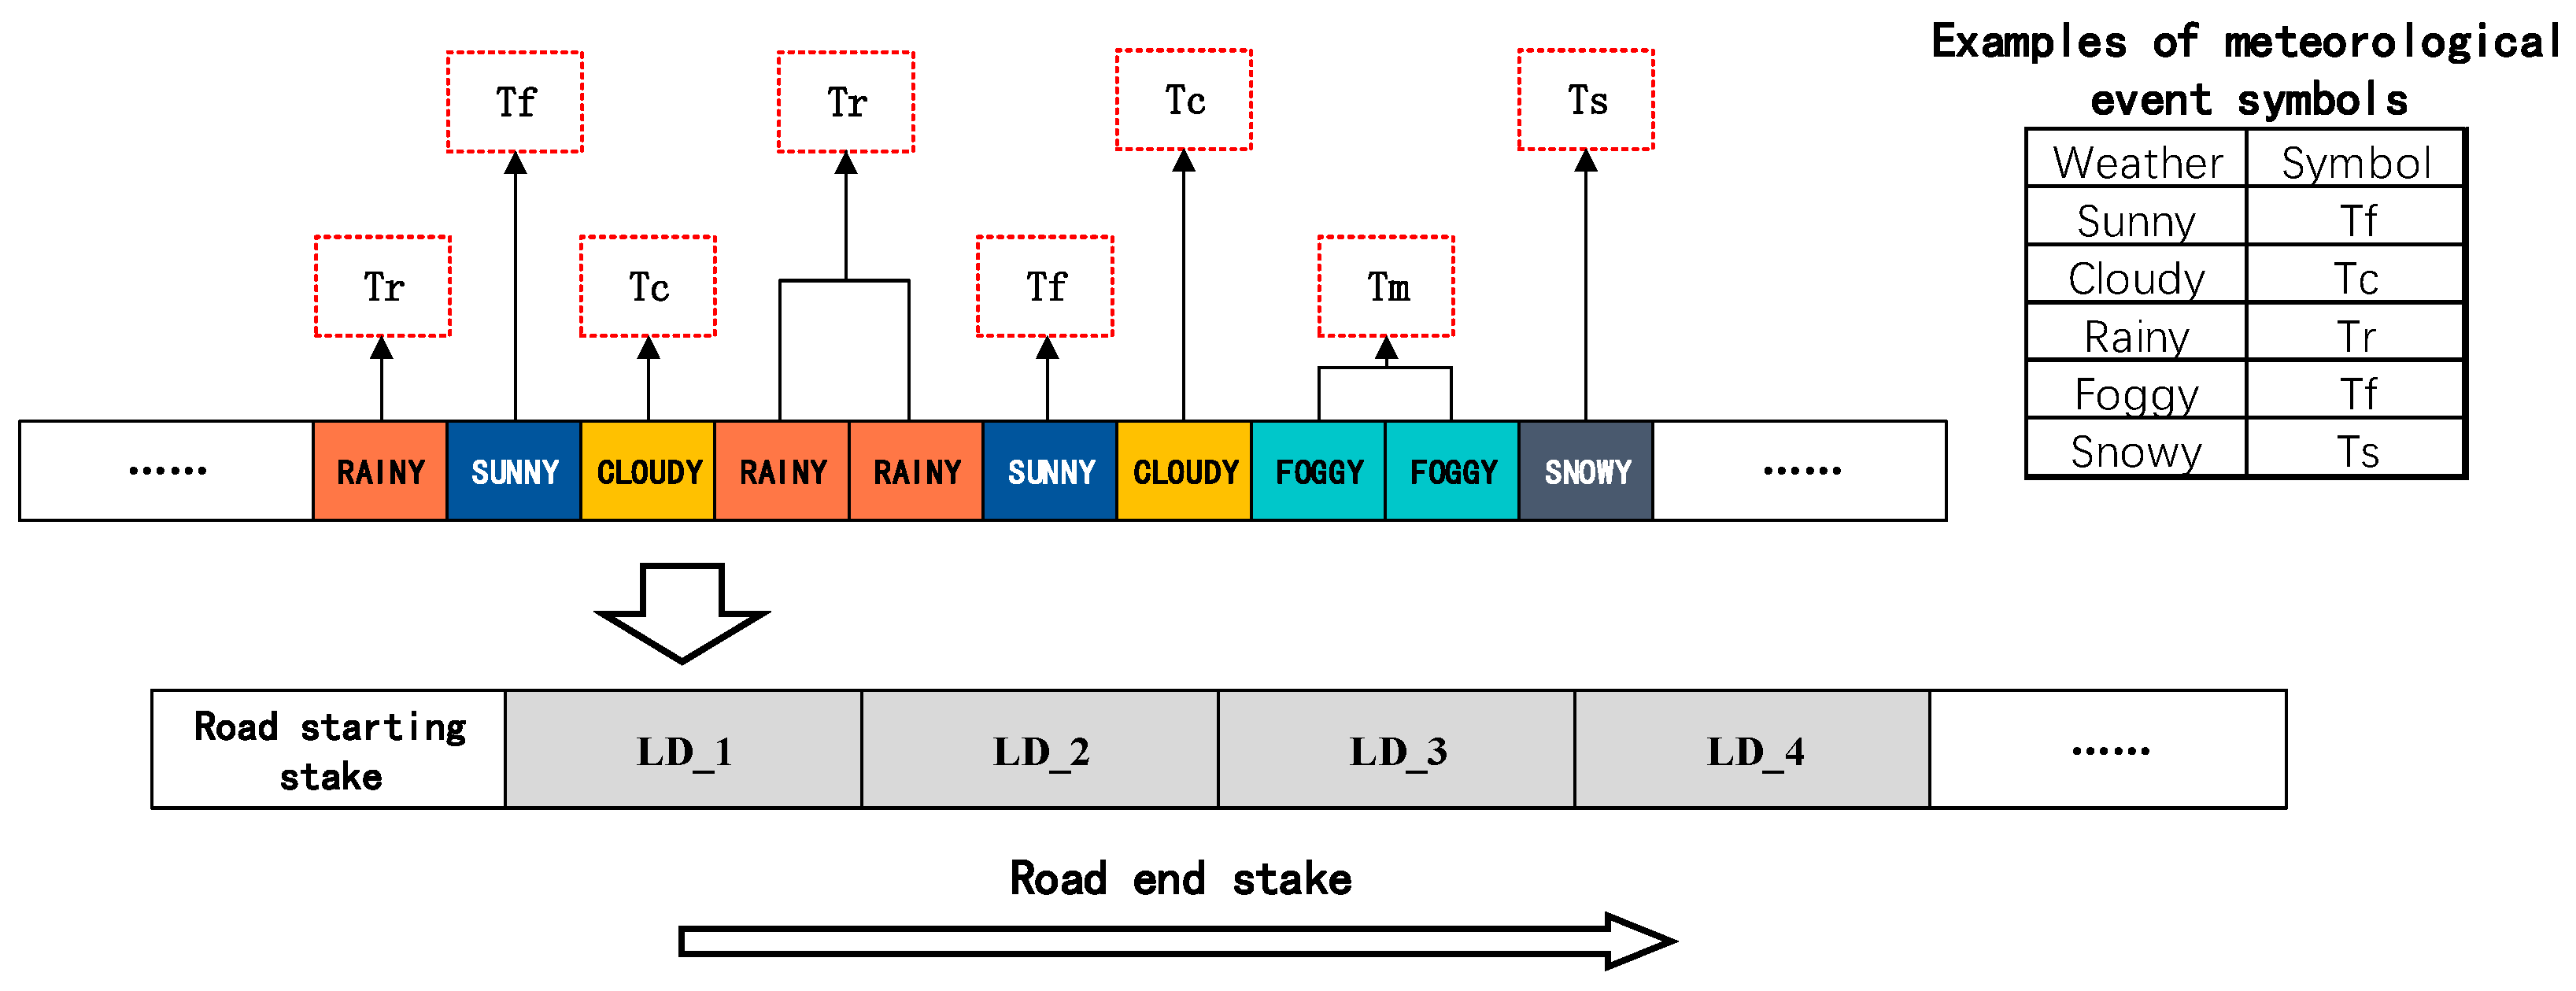
- Meteorological events. That is, the basic unit of meteorological risk responsiveness composition; its essence is the meteorological conditions as the basis for division of the meteorological event carrier on the accident division of the traffic accident set obtained, and the core of the meteorological event responsiveness is through the calculation of the number of responses to meteorological events to respond to the degree of impact of different weather on the roadway.
- (3)
- Weather event response mechanism
2.2. Calculation of Meteorological Risk Responsiveness
3. Identification of Accident-Prone Roadways
3.1. Definition of Adverse Meteorological Conditions
3.2. Impact of Adverse Meteorological Conditions
3.3. Methods of Identifying Accident-Prone Road Sections
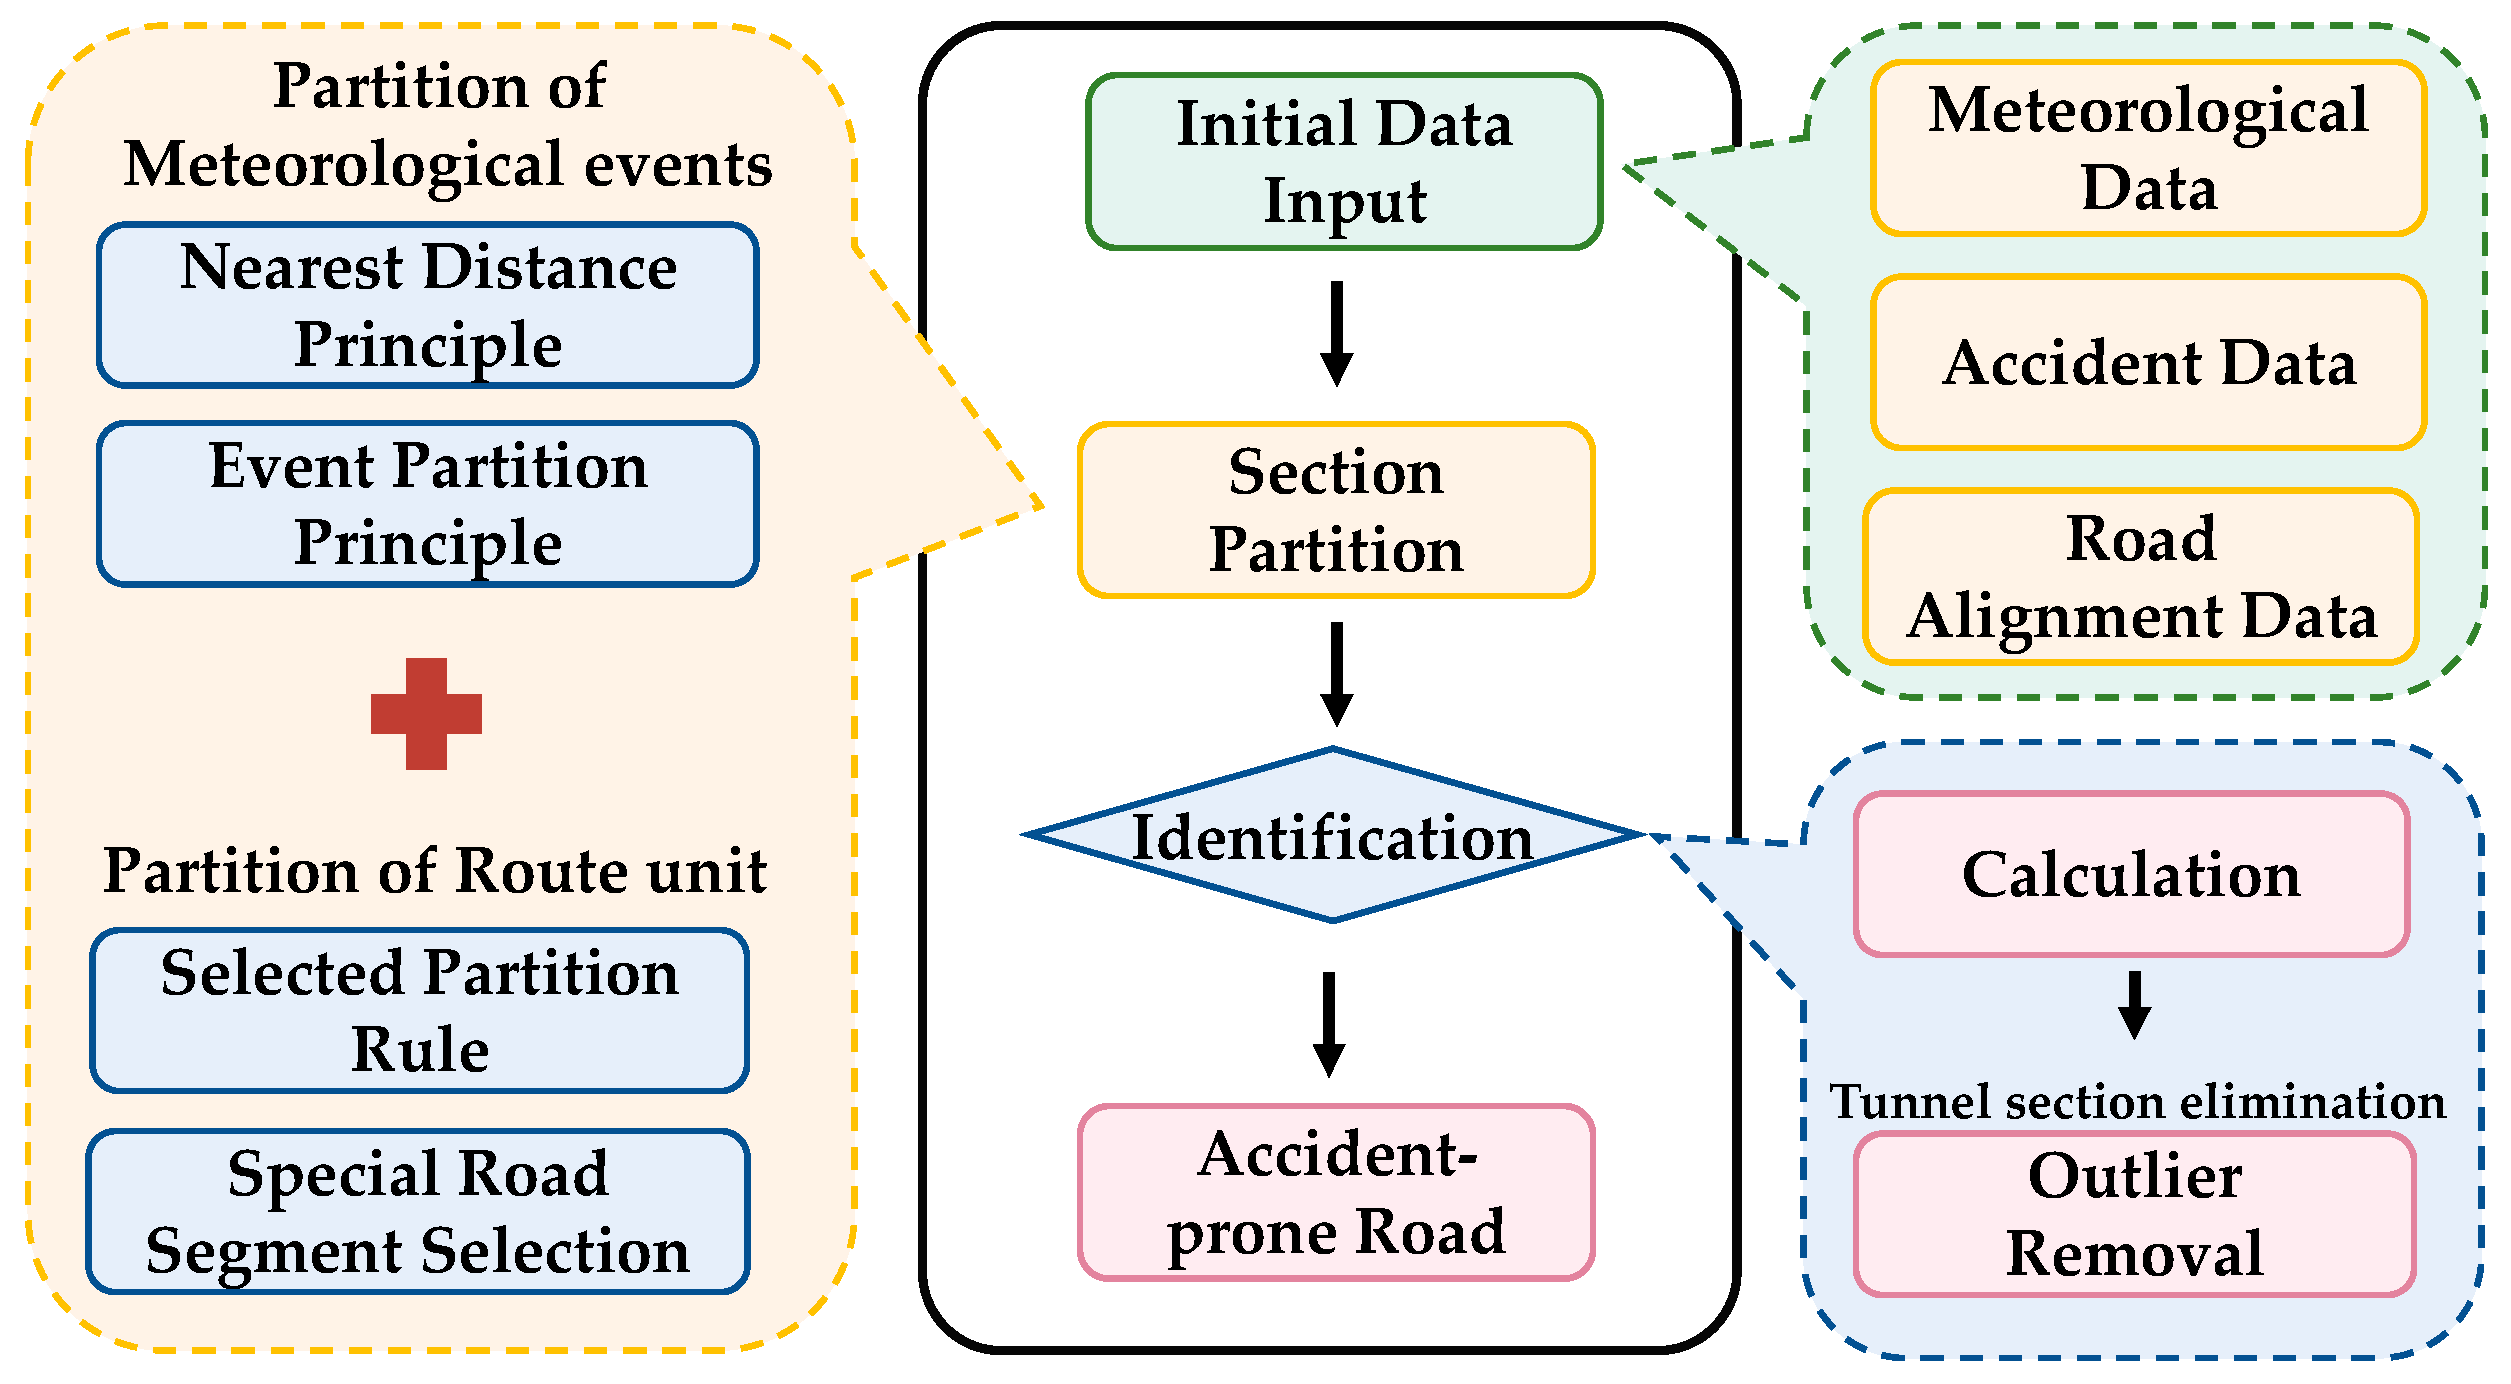
- The input layer is the data collection and organization stage of the identification model. The data collected and organized in the input layer are required to be accurate, and the data to be collected are mainly divided into three parts: meteorological data, traffic accident data, and road design data.
- The division layer is to classify and process the data collected and organized in the input layer and divide the meteorological time and meteorological event carriers required for the calculation of meteorological risk responsiveness, and the specific division methods and principles are as follows.
- Division of meteorological event carriers. According to the characteristics of the target road and the purpose of the study, the target road can be divided according to the average road section method; for longer road sections and more structures, the road section can be divided according to the combination of the length of the span of the structure and the uneven road section method.
- Meteorological event division. Process the meteorological data and traffic accident data, organize and classify the meteorological and accident data into each meteorological event carrier; then, according to the principles and methods of meteorological event division, divide the weather events into each meteorological event carrier, and finally calculate the number of adverse meteorological events on each meteorological event carrier.
- The identification layer carries out meteorological risk responsiveness calculation for each meteorological event carrier and identifies accident-prone road sections on target roads through a meteorological risk responsiveness, which is mainly divided into two parts.
- Meteorological risk responsiveness calculation. Based on the finished data, the number of meteorological events and meteorological event carriers, the adverse meteorological events on each meteorological carrier are calculated through the meteorological event response mechanism, the number of meteorological events that have responded to each adverse meteorological event is obtained, and the adverse meteorological risk responsiveness is calculated on each meteorological event carrier through Equation (6).
- Processing of road sections with abnormal values of meteorological responsiveness. We organize the calculated undesirable weather risk responsiveness, check whether there are abnormal prominent values, and when there are abnormal prominent values of weather risk responsiveness, check for these specific road sections.
- The output layer collects and organizes the results calculated in the identification layer and analyzes the results.
- Road section screening. Screening excludes tunnels and other special road sections that are less affected by adverse weather conditions.
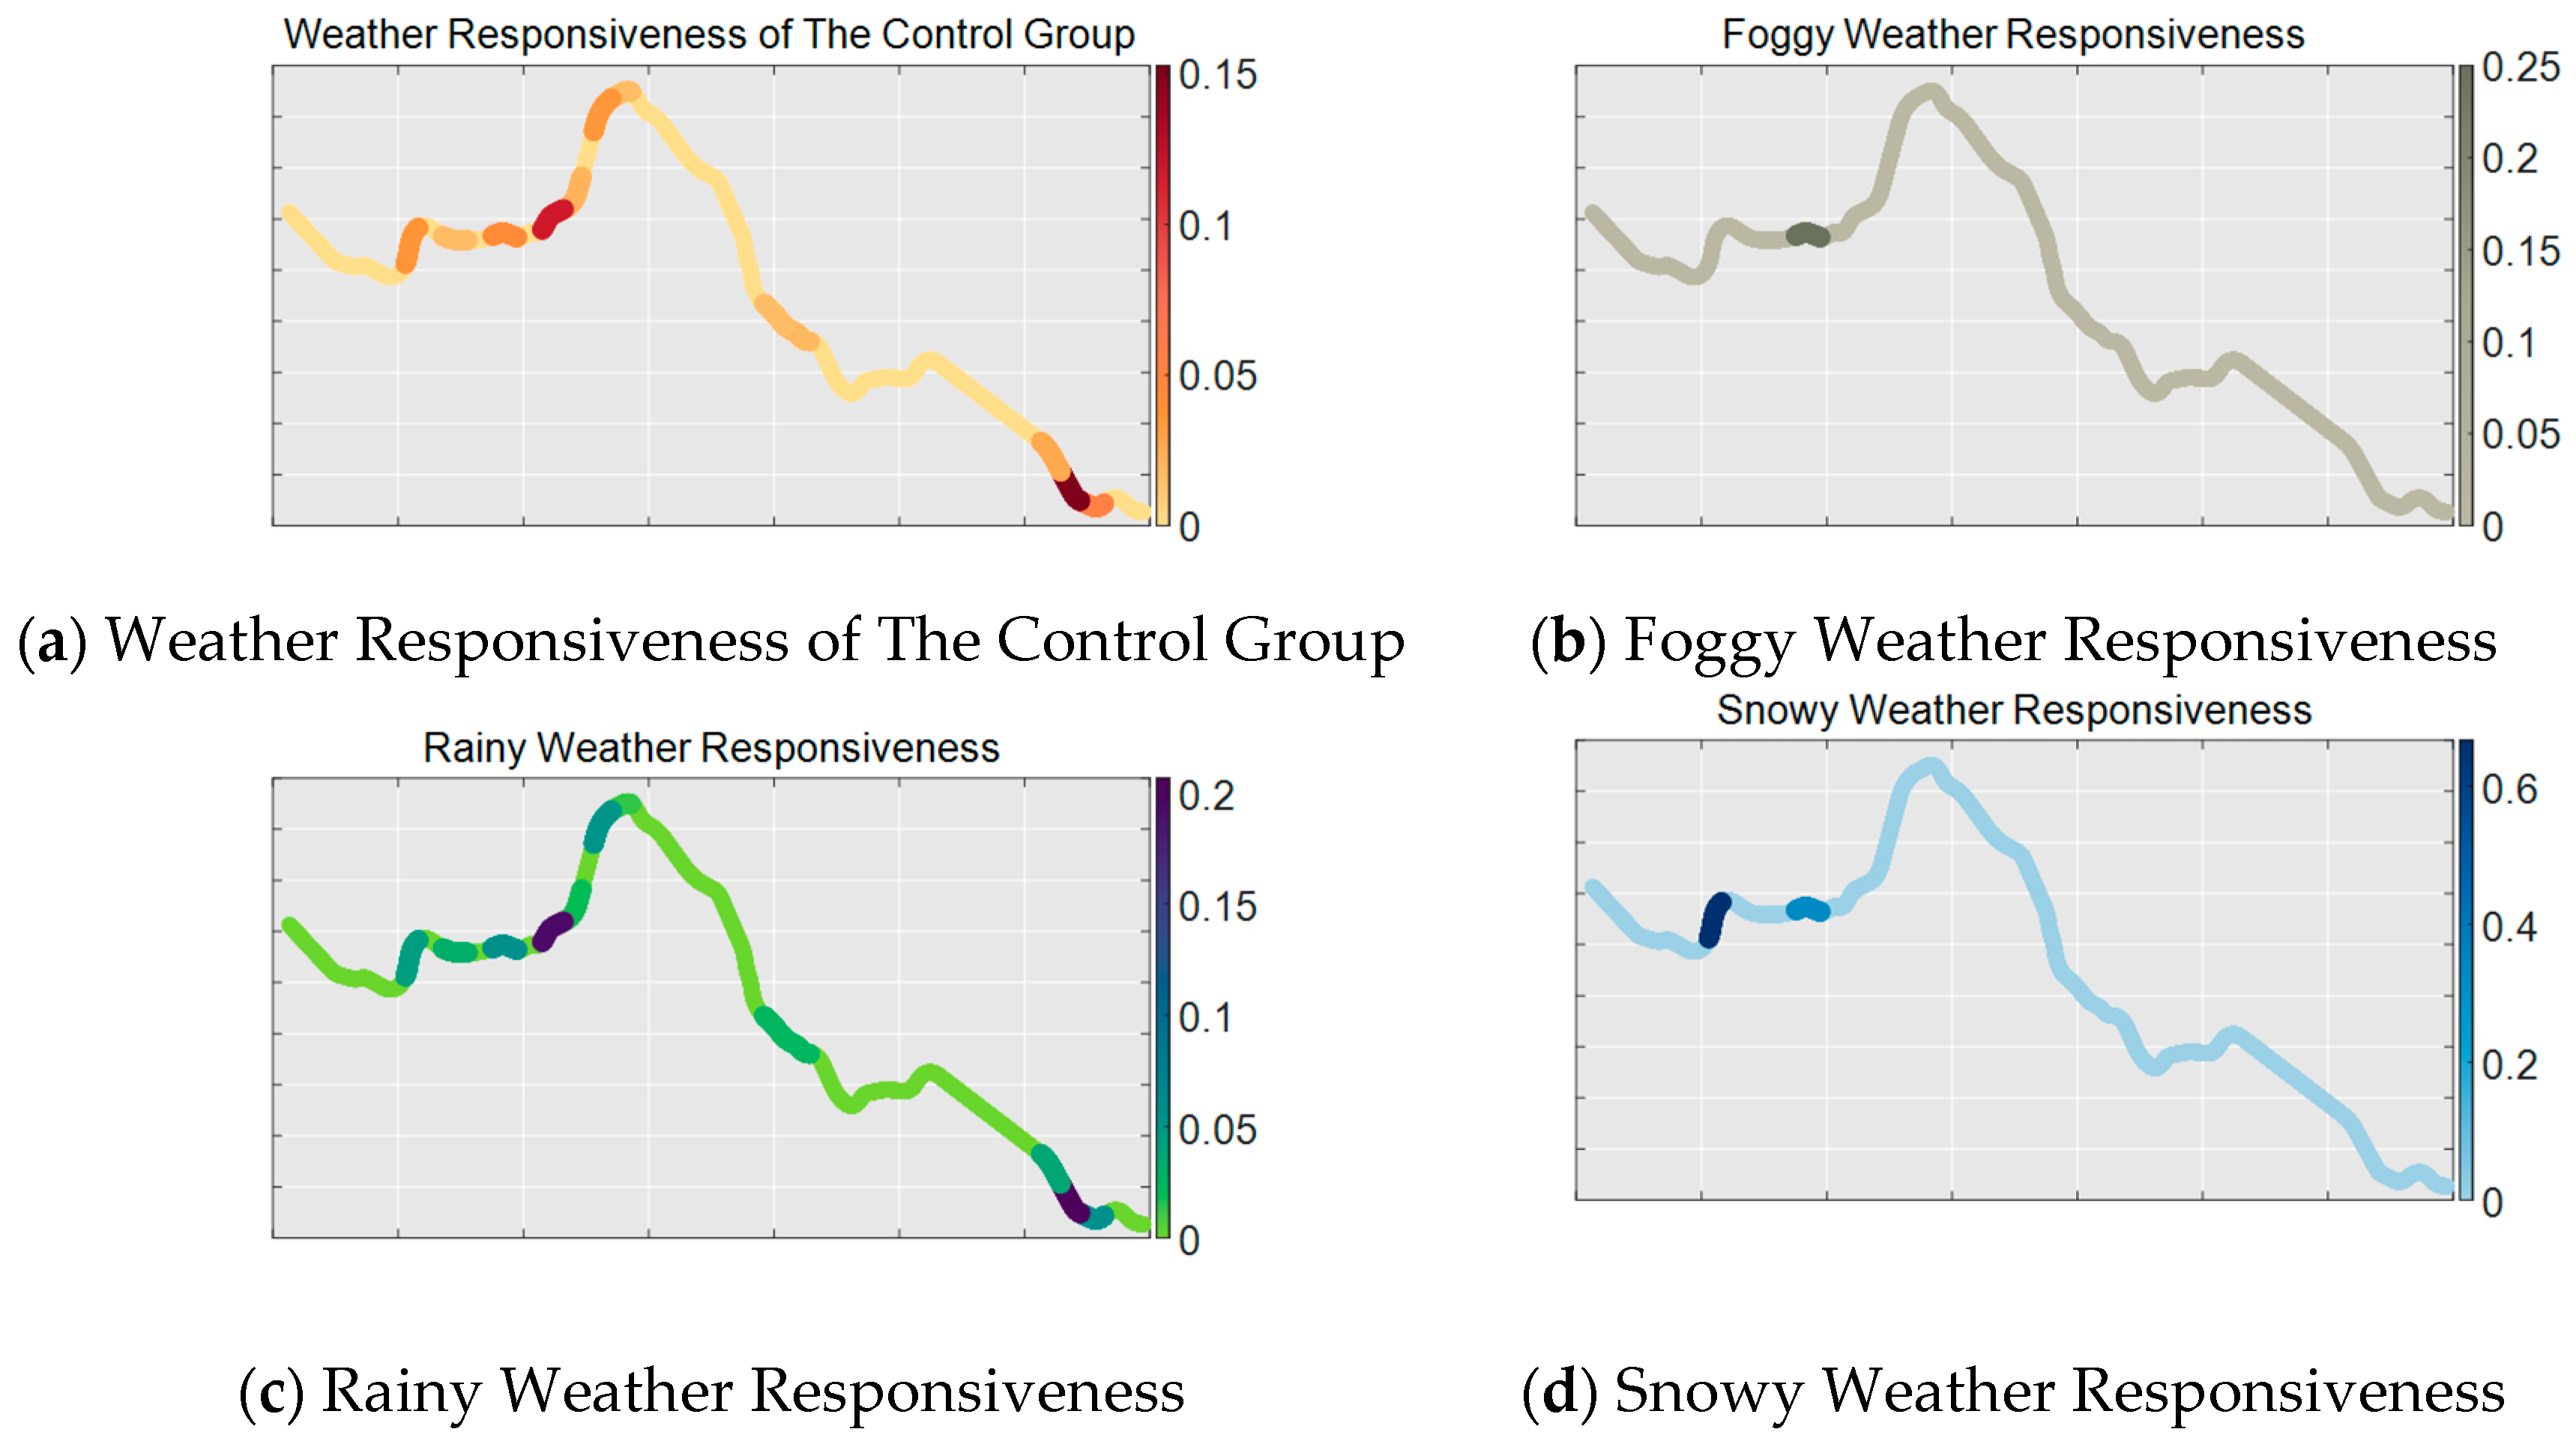
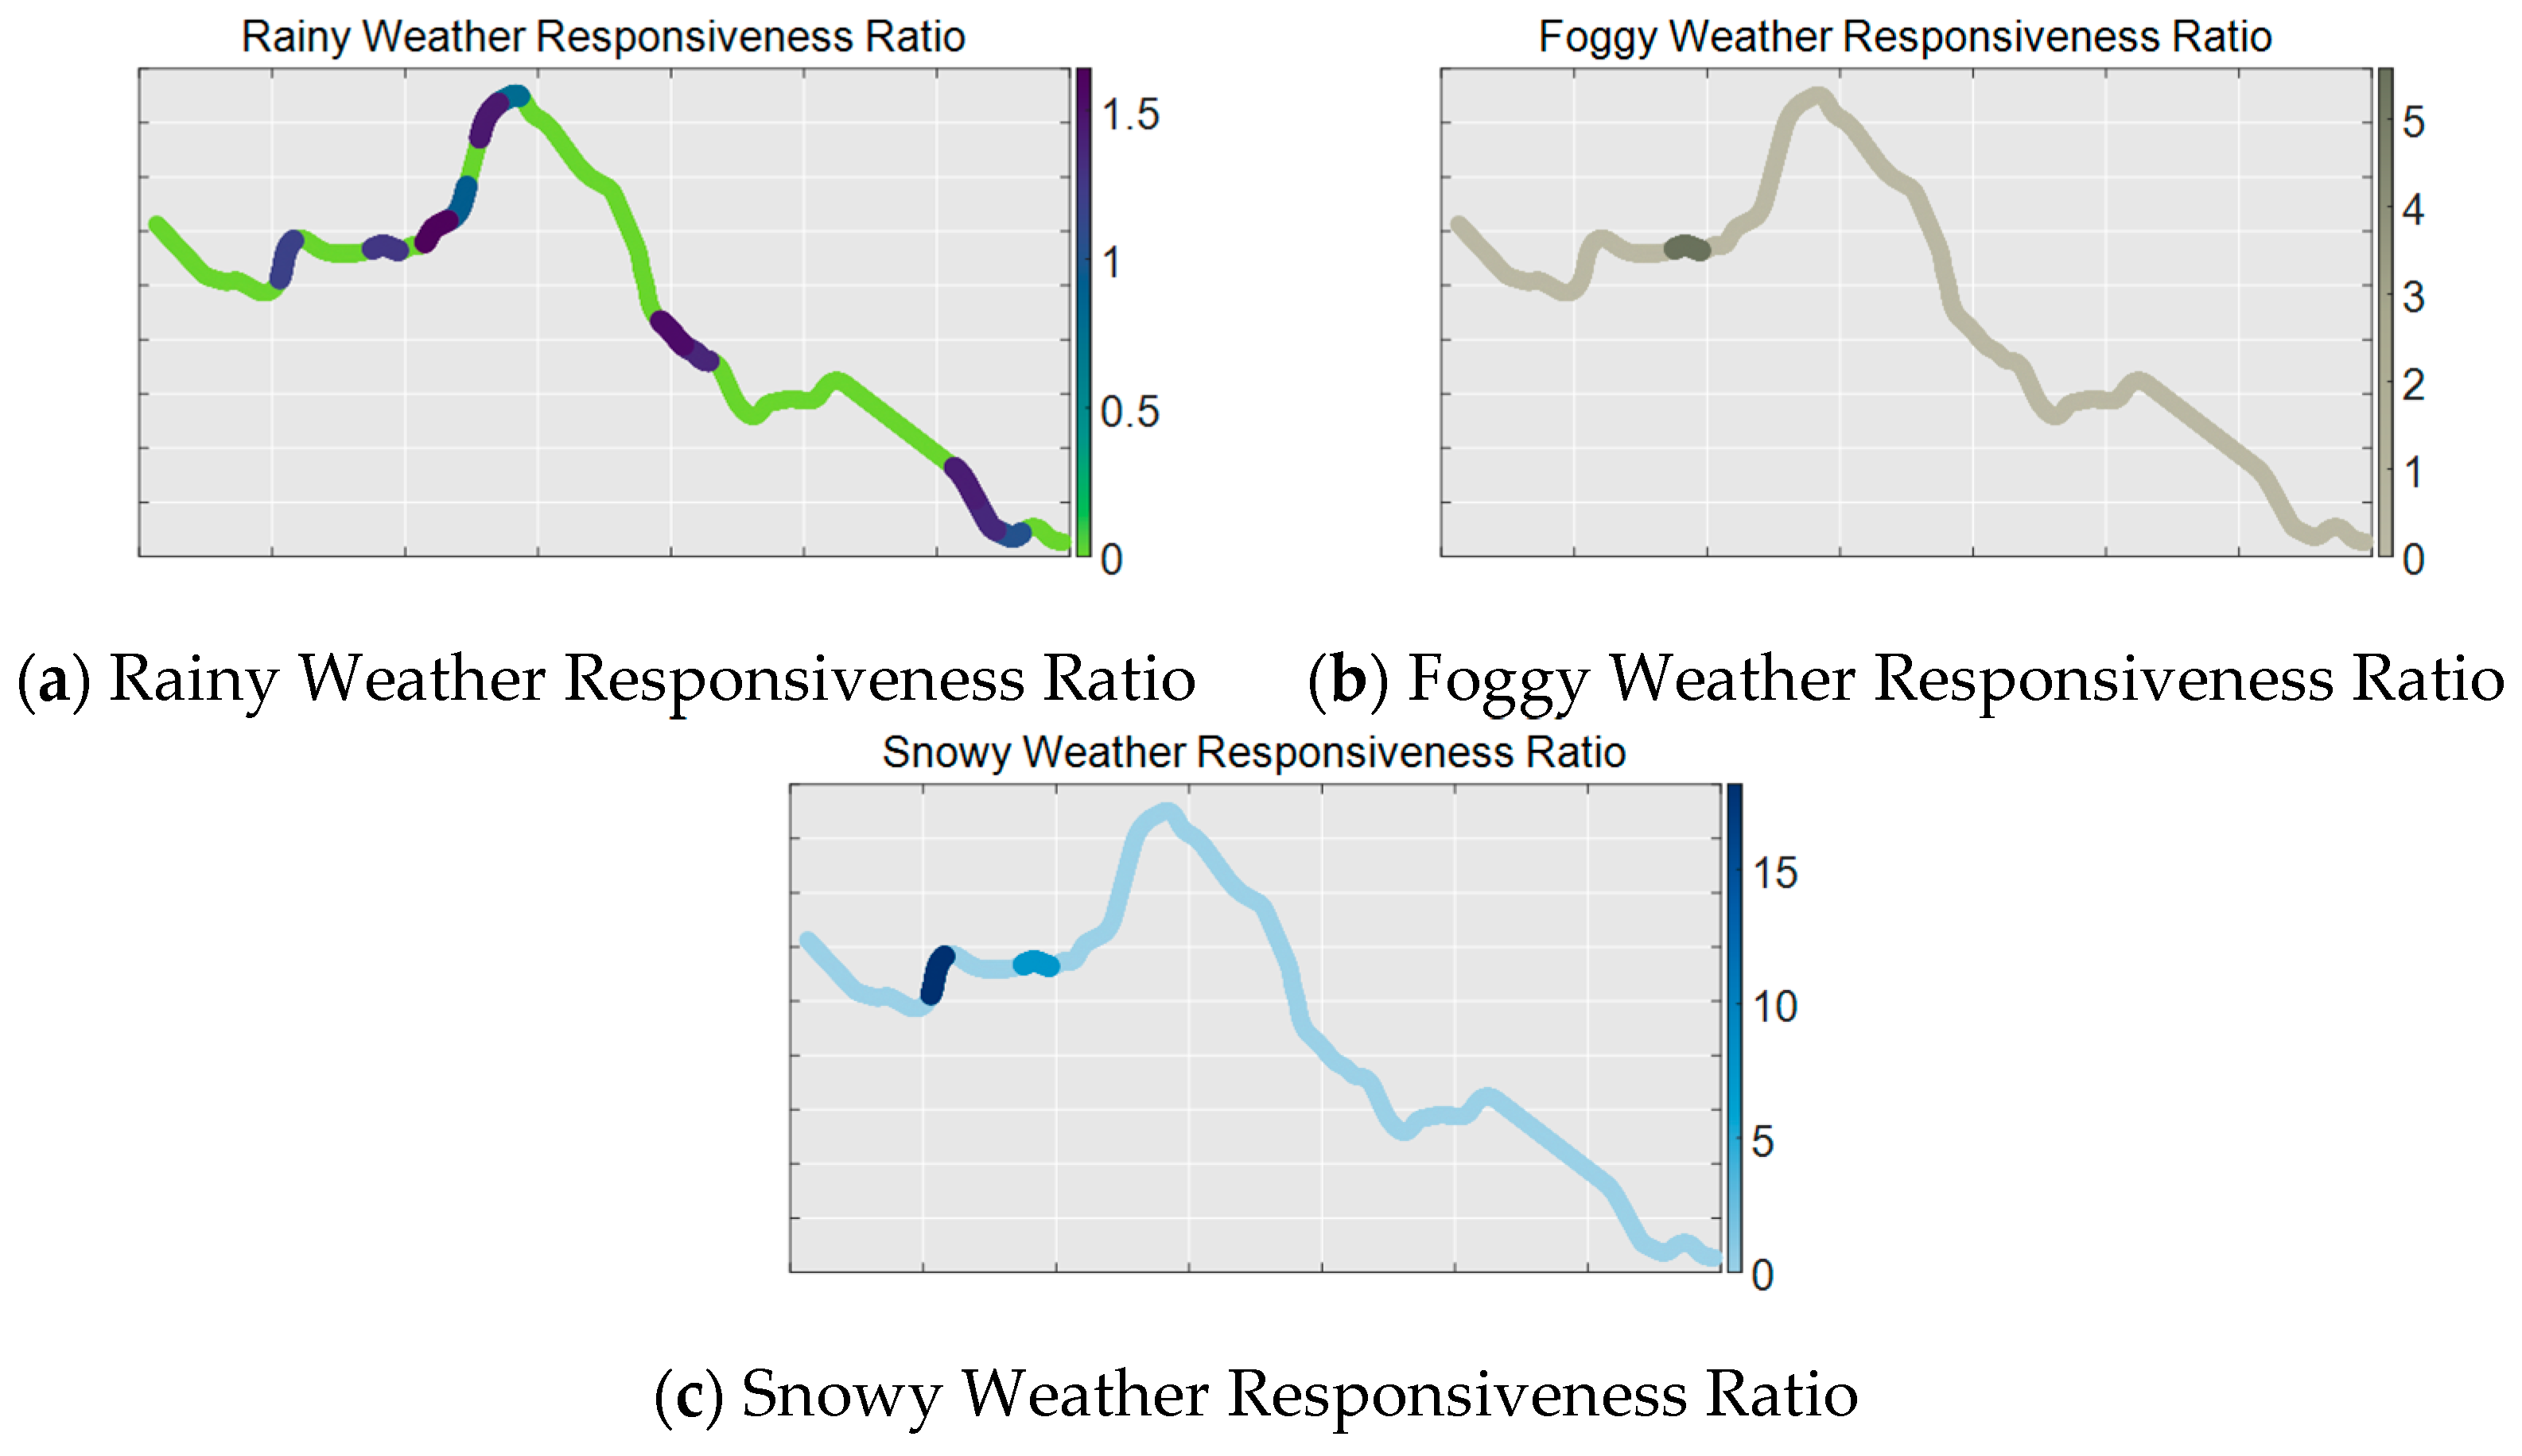
- Meteorological risk response ratio calculation. As the value of the meteorological risk response degree is a reaction to the degree of macro-impact of different weather on road safety, in order to amplify and effectively analyze the degree of impact of adverse weather on road safety, the concept of the meteorological risk response ratio is proposed, and the meteorological risk response degree of sunny, cloudy, and other road sections with lower impact on road safety is set up as a control group, and the meteorological risk response ratio is the ratio of the risk response degree of the adverse meteorological group to the risk response degree of the control group. The meteorological risk response ratio is the ratio of the risk response of the adverse weather group to the risk response of the control group. When the ratio is less than 1, it means that the influence on the road section by adverse weather is almost negligible; when the ratio is greater than 1, it indicates that the adverse weather has an influence on the target road section. The formula is shown in Equation (7):In Equation (7), represents the meteorological risk responsiveness ratio of qx meteorological event on the kth meteorological event carrier; dz represents the meteorological event with less impact on traffic safety, and represents the meteorological risk responsiveness of the control meteorological event on the kth meteorological event carrier.
- Result analysis: Based on the screened accident-prone road sections under adverse meteorological conditions, meteorological risk responsiveness and meteorological risk responsiveness ratio, accident-prone road sections are classified and analyzed, and the accident-prone road sections under meteorological conditions are derived in terms of the range of accident-prone road section stakes, and accident-prone road section accident-affecting factors and characteristics.
4. Engineering Example Validation
4.1. Data Collection
4.1.1. Data Input
4.1.2. Data Segmentation
- (1)
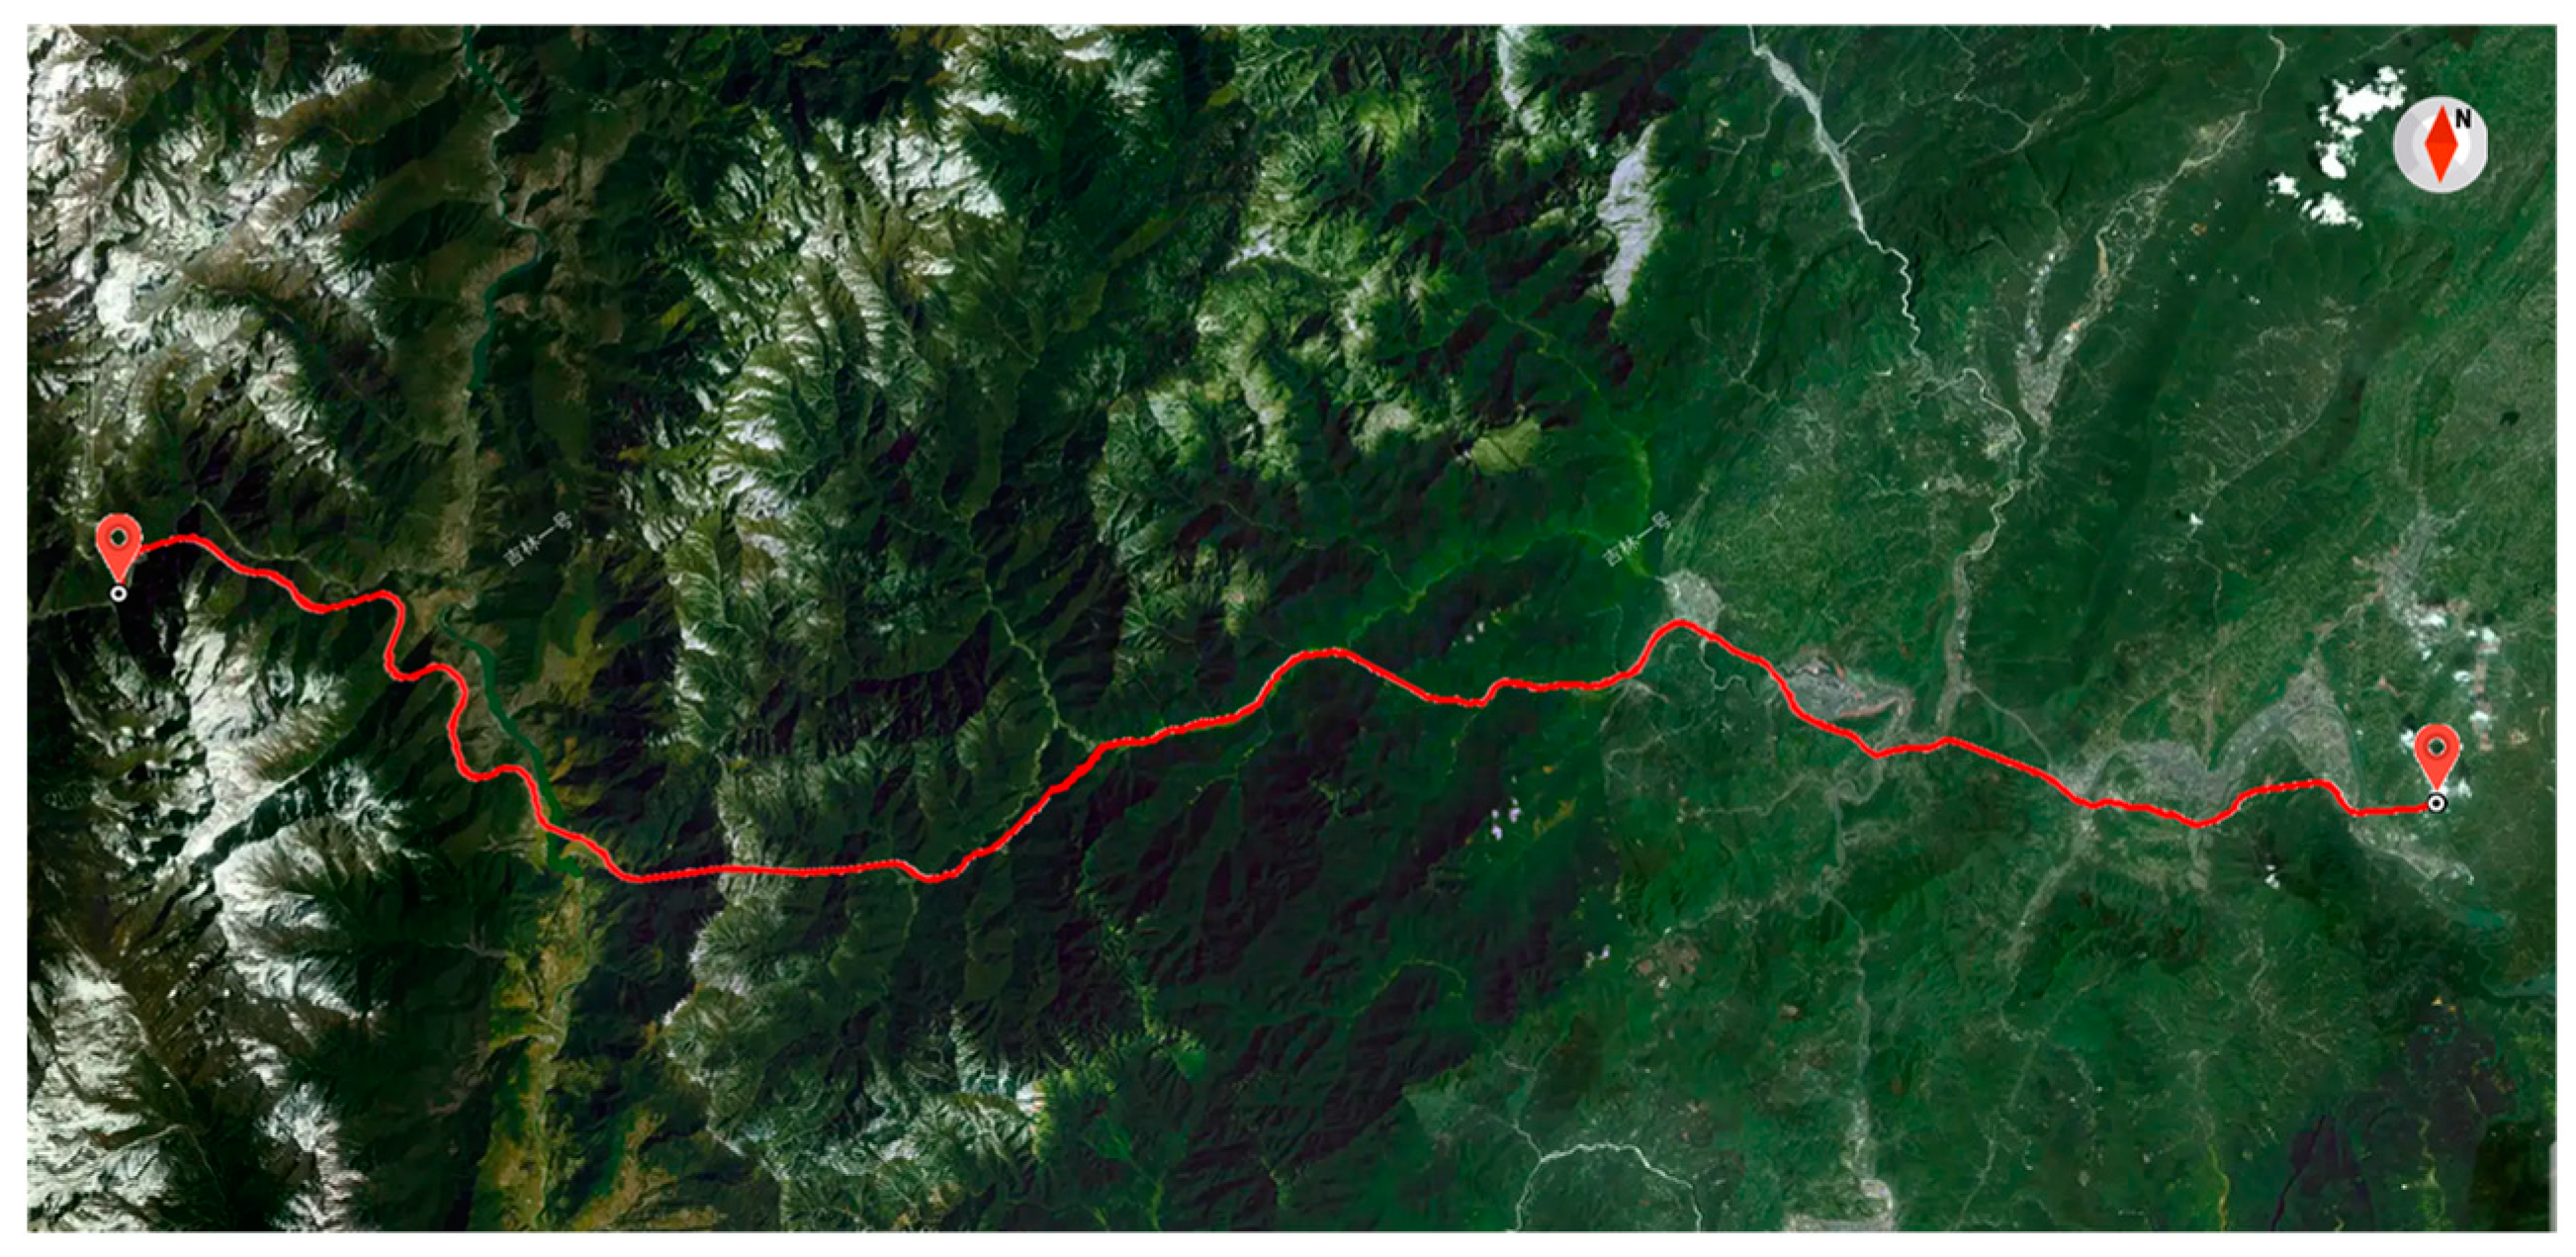
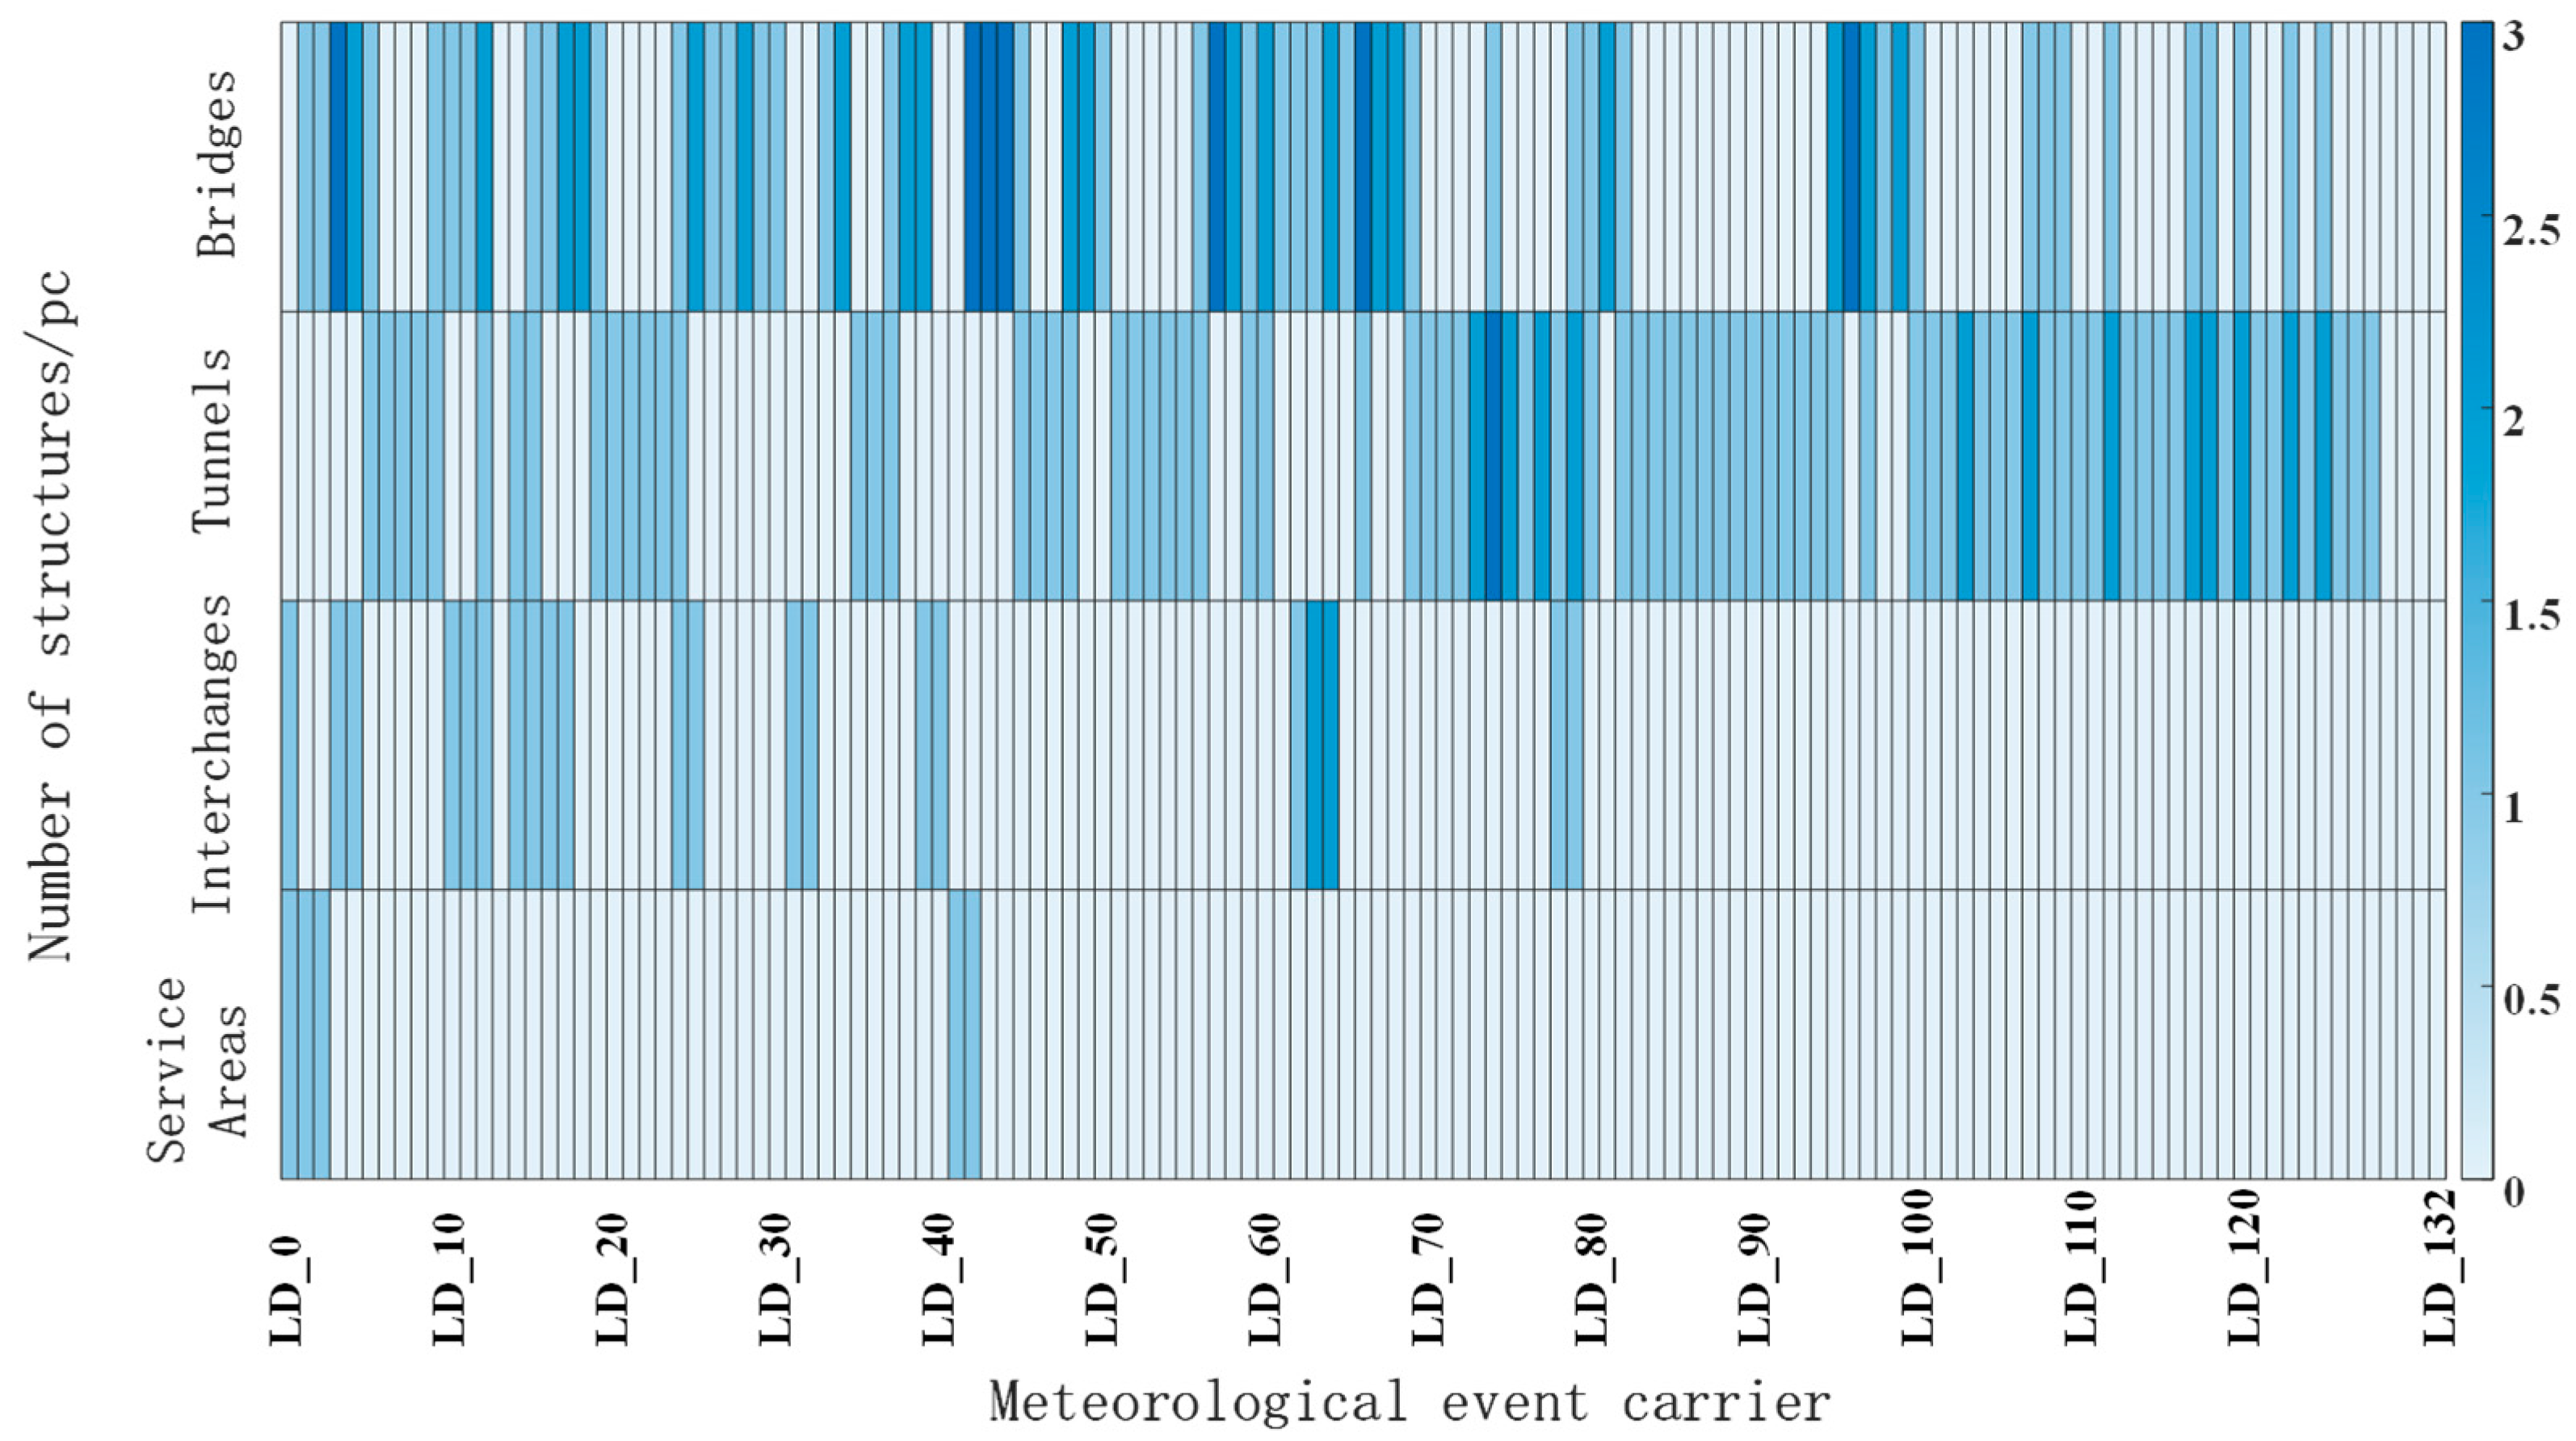
- Meteorological event carrier division. Considering the domestic previous research and calculation needs, the average road section method is selected as the weather event carrier division method, and 1 km is selected as the length of the weather event carrier [34], with a total of 131 weather event carriers, numbered as LD_i, where i is the number of the route carrier, which is arranged sequentially from the starting point to the end point of the route. Based on the division mode of the average section method, the meteorological event carriers of SC2 highway are obtained, and the division results are shown in Figure 5.
- (2)
- Meteorological event division. Based on the meteorological data, each meteorological event carrier has been divided into meteorological events. Since weather conditions such as sunny, cloudy, and foggy are not the main meteorological factors affecting driving safety, meteorological events such as sunny, cloudy, and cloudy that pose less risk to driving are uniformly set up as a control meteorological event group.
4.2. Calculation and Identification
4.2.1. Risk Identification
4.2.2. Results
4.3. Analysis of Results
4.4. Method Validation
5. Discussion
6. Conclusions
Author Contributions
Funding
Institutional Review Board Statement
Informed Consent Statement
Data Availability Statement
Acknowledgments
Conflicts of Interest
References
- Ministry of Transportation and Communications. Statistical Bulletin of Transportation Industry Development in 2022. China Transportation News, 16 June 2023. [Google Scholar]
- Song, J.Y.; Li, Y.; Zhang, H.T.; Tian, H.; Chen, Z.Y.; Yin, X.H. Analysis of the impact of severe weather on highway traffic blocking. Highway 2021, 66, 248–256. [Google Scholar]
- Bhattachan, A.; Okin, G.S.; Zhang, J.; Vimal, S.; Lettenmaier, D.P. Characterizing the Role of Wind and Dust in Traffic Accidents in California. GeoHealth 2019, 3, 328–336. [Google Scholar] [CrossRef] [PubMed]
- Ziakopoulos, A.; Yannis, G. A review of spatial approaches in road safety. Accid. Anal. Prev. 2019, 135, 105323. [Google Scholar] [CrossRef] [PubMed]
- Smith, K. How seasonal and weather conditions influence road accidents in Glasgow. Scott. Geogr. Mag. 1982, 98, 103–114. [Google Scholar] [CrossRef]
- Zhu, X.L.; Fang, S.E.; Wang, J.H. Analysis and evaluation of meteorological impact on highway traffic safety in Xinjiang. J. Nat. Disasters 2009, 18, 57–63. [Google Scholar]
- Baker, C.; Reynolds, S. Wind-induced accidents of road vehicles. Accid. Anal. Prev. 1992, 24, 559–575. [Google Scholar] [CrossRef]
- Shi, M.Q. Study on Road Traffic Safety in Terrible Weather. Commun. Stand. 2005, 8, 30–33. [Google Scholar]
- Pan, Y.Y.; Chen, W. Analysis of meteorological conditions causing highway traffic accidents. Meteorol. Sci. Technol. 2006, 34, 778–782. [Google Scholar]
- Shankar, V.; Mannering, F.; Barfield, W. Effect of roadway geometrics and environmental factors on rural freeway accident frequencies. Accid. Anal. Prev. 1995, 27, 371–389. [Google Scholar] [CrossRef]
- Zhang, C.; Guo, X.X.; Cui, B.X. Influence of uneven water accumulation on Road Safety. Highw. Transp. Sci. Technol. 2014, 31, 104–111. [Google Scholar]
- Zhao, L.; Liu, H.X.; Wang, L.; Wei, H. Relationship between driver physiological response and Driving safety in inclement weather. China J. Highw. Transp. 2016, 29, 147–152. [Google Scholar]
- Li, X.L.; Tang, B.M.; Song, Q.H. Probabilistic risk analysis of multi-climate coupling section in expressway fog region. J. Southwest Jiaotong Univ. 2018, 53, 1039–1047. [Google Scholar]
- Abdel-Aty, M.; Pande, A. Crash data analysis: Collective vs. individual crash level approach. J. Saf. Res. 2007, 38, 581–587. [Google Scholar] [CrossRef]
- So, J.; Dedes, G.; Park, B.B.; HosseinyAlamdary, S.; Grejner-Brzezinsk, D. Development and evaluation of an enhanced surrogate safety assessment framework. Transp. Res. Part C Emerg. Technol. 2015, 50, 51–67. [Google Scholar] [CrossRef]
- Stipancic, J.; Zangenehpour, S.; Miranda-Moreno, L.; Saunier, N.; Granié, M.-A. Investigating the gender differences on bicycle-vehicle conflicts at urban intersections using an ordered logit methodology. Accid. Anal. Prev. 2016, 97, 19–27. [Google Scholar] [CrossRef]
- Mahmud, S.M.S.; Ferreira, L.; Hoque, M.S.; Tavassoli, A. Using a surrogate safety approach to prioritize hazardous segments in a rural highway in a developing country. IATSS Res. 2020, 44, 132–141. [Google Scholar] [CrossRef]
- Fan, Z.; Liu, C.; Cai, D.; Yue, S. Research on black spot identification of safety in urban traffic accidents based on machine learning method. Saf. Sci. 2019, 118, 607–616. [Google Scholar] [CrossRef]
- Geng, C.; Peng, Y.H. Traffic accident black spot roadway identification method based on dynamic segmentation and DBSCAN algorithm. J. Chang. Univ. (Nat. Sci. Ed.) 2018, 38, 131–138. [Google Scholar]
- Chen, Y.; Huang, C.C.; Liu, Y. An accident-prone segment discrimination method based on finite mixture zero-tailgating accident prediction model. China Highw. J. 2022, 35, 331–340. [Google Scholar]
- Ye, Y. Study on Traffic Accident Characteristics and Speed Limit in Accident-Prone Sections of Shuima Expressway on Rainy Days. Master’s Thesis, Chang’an University, Xi’an, China, 2020. [Google Scholar]
- Ning, H.; Zhao, X.M.; Nan, C.L.; Yang, L.; Li, J. Accident-prone Road prediction Model for Intelligent Vehicle based on Road alignment. China J. Highw. Transp. 2021, 34, 183–192. [Google Scholar]
- Chen, E.Y.; Chen, J.S.; Guo, J.G.; Li, L.; Lin, H. Research on risky road sections in mountainous areas based on the natural traveling state of small vehicles. J. East China Jiaotong Univ. 2020, 37, 22–29. [Google Scholar]
- Wright, C.; Abbess, C.; Jarrett, D. Estimating the regression-to-mean effect associated with road accident black spot treatment: Towards a more realistic approach. Accid. Anal. Prev. 1988, 20, 199–214. [Google Scholar] [CrossRef] [PubMed]
- Satria, R.; Tsoi, K.H.; Castro, M.; Loo, B.P.Y. A combined approach to address road traffic crashes beyond cities: Hot zone identification and countermeasures in Indonesia. Sustainability 2020, 12, 1801. [Google Scholar] [CrossRef]
- Jiang, H.; Fang, S.E.; Chen, Y.R.; Ma, Z. Urban road accident spot identification based on spatial autocorrelation. J. Tongji Univ. (Nat. Sci.) 2013, 41, 664–669. [Google Scholar]
- Chen, Y.; Chen, Y.R. Research on the evaluation technology of driving environment coordination of low-grade highway. J. Wuhan Univ. Technol. (Transp. Sci. Eng. Ed.) 2019, 43, 183–187. [Google Scholar]
- Xie, L.; Wu, C.Z.; Lu, N.C.; Lu, D. Research on road accident-prone sections identification method based on improved clustering algorithm. J. Wuhan Univ. Technol. (Traffic Sci. Eng.) 2014, 38, 904–908. [Google Scholar]
- Jin, X.; Lei, G.R.; Liu, F.; Wang, H.; Zhu, S.Y. Research on identification and improvement sequencing of traffic accident black spots. Highw. Automot. Appl. 2018, 2, 45–48. [Google Scholar]
- Li, L.Y.; Chen, S.Y. Multi-sensor accuracy estimation method based on statistical vector. Comput. Digit. Eng. 2019, 47, 2467–2472. [Google Scholar]
- Chen, P.Y.; Yu, H.M.; Shi, H.P. Rock burst combination prediction method based on data fusion algorithm. Mod. Tunn. Technol. 2016, 53, 38–44. [Google Scholar]
- Li, Y.; Tang, Y. Research on data mining algorithms based on association rules and similarity. J. South China Norm. Univ. (Nat. Sci. Ed.) 2021, 53, 121–127. [Google Scholar]
- Wu, Y.; Qian, Z.B.; Wang, J.J.; Deng, Y.J.; Lu, Y. Risk assessment and sensitivity analysis of expressway Traffic Safety. J. Chang’an Univ. (Nat. Sci. Ed.) 2014, 34, 134–141. [Google Scholar]
- GB/T 28592-2012; Grade of precipitation. Standards Press of China: Beijing, China, 2012.
- QX/T 111-2010; Grade of weather conditions for freeway transportation. China Meteorological Press: Beijing, China, 2010.
- Traffic Management Bureau, Ministry of Public Security. Annual Report of Traffic Accident Statistics of the People’s Republic of China (2018); Research Institute of Traffic Management Science, Ministry of Public Security: Beijing, China, 2019. [Google Scholar]

| Identification Method | Merit | Weakness | Application Condition |
|---|---|---|---|
| Absolute Accident Number | ① Concise and intuitive; ② Computationally simple | ① Single evaluation factors; ② Traffic accident data requirements are relatively high | ① Road sections with more comprehensive traffic accident data; ② Intersection section |
| Equivalent Accident Number | ① The severity of the accident was considered | ① Subjective; ② Evaluation factors are not comprehensive enough | ① Section with more comprehensive traffic accident data |
| Accident Rate | ① Traffic volume and road length are considered; ② Accuracy | ① The particularity of some accidents is not considered | ① Road conditions, traffic conditions change compared with the path section |
| Safety Coefficient | ① Traffic accident data requirements are low; ② Computationally simple | ① Lack of consideration of the accident attributes; ② Need for vehicle driving measured data, operability is not high | ① Road section with more comprehensive vehicle driving data |
| Quality Control | ① High accuracy; ② Traffic volume considered | ① Large calculation volume; ② Lacks the consideration of the severity of the accident | ① Various sections |
| Cumulative Frequency | ① Concise and intuitive, intelligible ② Simple operation, strong practicability | ① Factors such as traffic volume are not considered; ② Route division mode has a great influence on the results | ① Road sections with obvious differences in accident conditions |
| Matrix | ① Comprehensive accident rate method and accident number method | ① The “low frequency high frequency” and “low frequency high frequency” sections cannot be directly judged | ① Road conditions, traffic conditions change compared with the path section |
| Discriminating Indicators | Influence Degree | |
|---|---|---|
| Rainfall | Rainfall within 24 h/mm ≥ 10 mm | Certain impact |
| Fog | VisibilityL ≤ 200 m | Certain impact |
| Snowfall | Snow cover thickness of 1.0 cm ≤ H < 2.9 cm | Certain impact |
| Serial Number | Stake Number | Horizontal Alignment Elements | Vertical Alignment Elements | Roadway Structure Elements |
|---|---|---|---|---|
| 1 | K1+000 | Circular Curve | Sag Curve | Standard Section |
| 2 | K2+000 | Straight | Crest Curve | Bridge |
| … | … | … | … | … |
| 132 | K132+000 | Spiral Curve | Straight | Highway Tunnel |
| Serial Number | Time of Accident | Location of Accident | Weather | Accident Pattern | Accident Vehicle Type |
|---|---|---|---|---|---|
| 1 | 2018/6/3 | K26+200 | Rainy | Collision Vehicle | Small Car |
| 2 | 2018/6/3 | K49+000 | Rainy | Collision Objects | Small Car |
| … | … | … | … | … | … |
| 1001 | 2018/8/11 | K38+500 | Cloudy | No Records | Small Car |
| Route Unit | Rainy Weather Risk Response/Ratio | Foggy Weather Risk Response/Ratio | Snowy Weather Risk Response/Ratio |
|---|---|---|---|
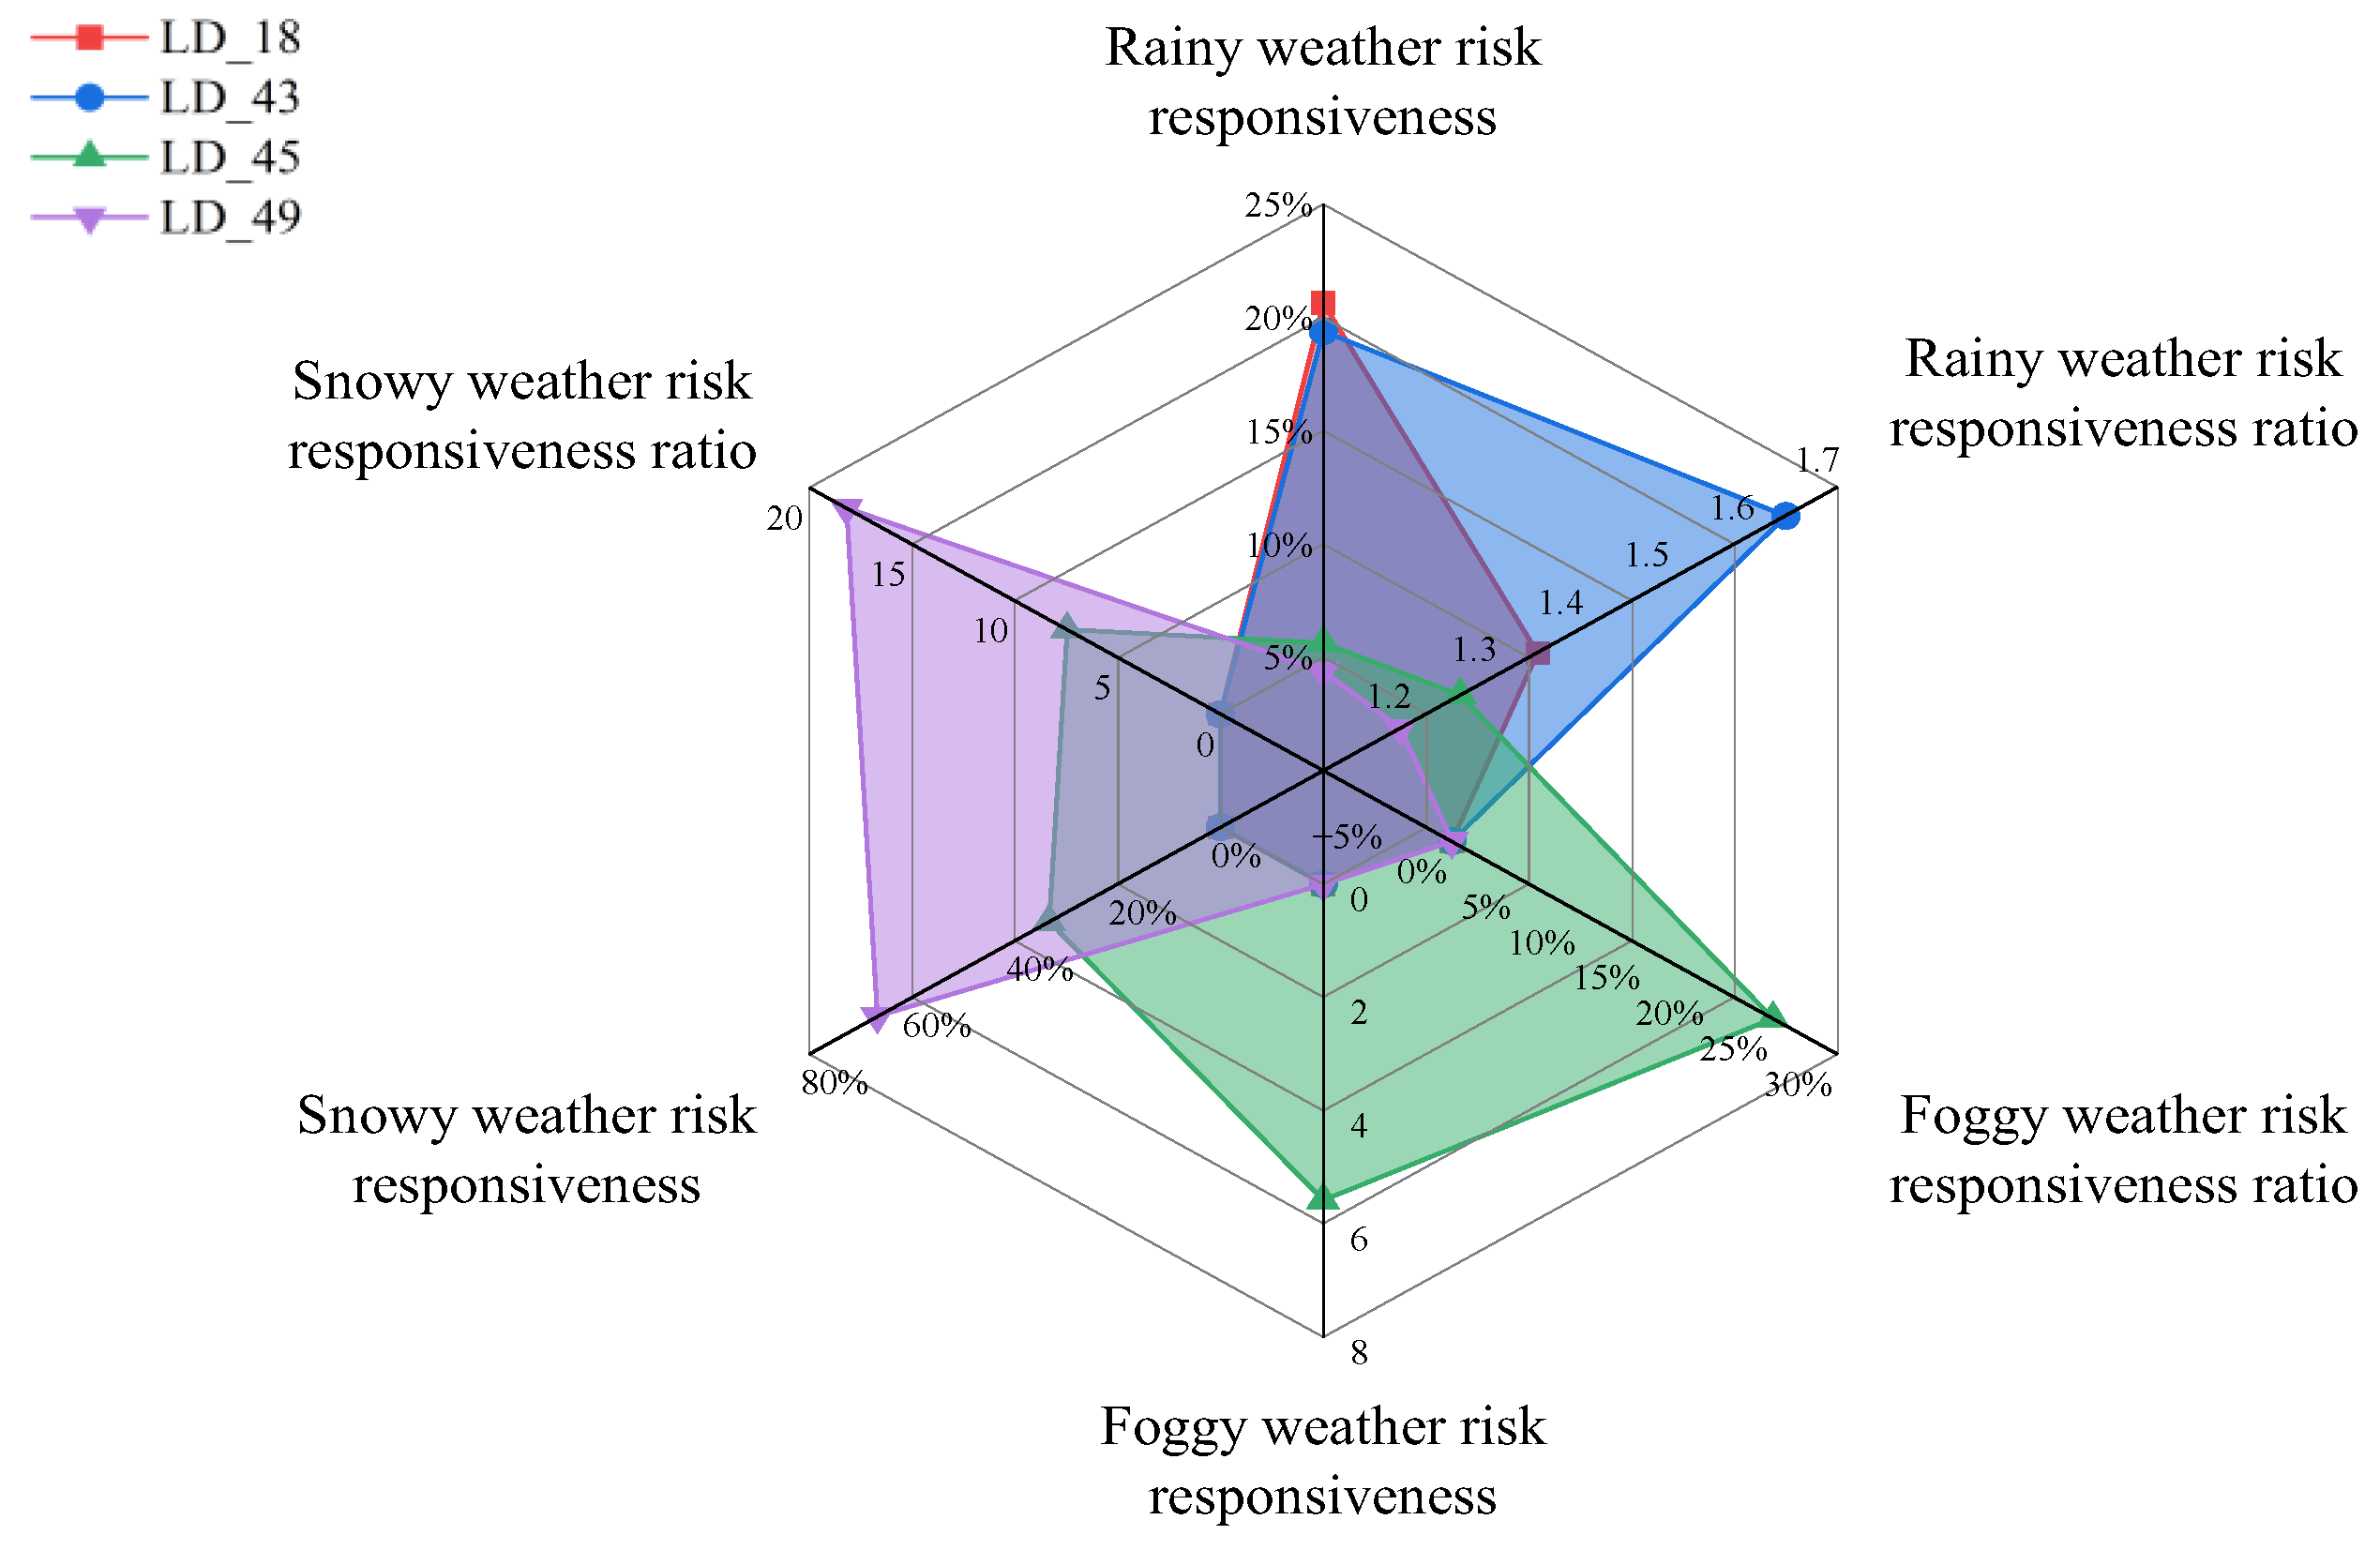
| LD_18 | 20.63%/1.35 | 0.00%/0.00 | 0.00%/0.00 |
| LD_19 | 3.75%/1.42 | 0.00%/0.00 | 0.00%/0.00 |
| LD_30 | 2.50%/1.37 | 0.00%/0.00 | 0.00%/0.00 |
| LD_31 | 2.50%/1.53 | 0.00%/0.00 | 0.00%/0.00 |
| LD_40 | 5.00%/1.45 | 0.00%/0.00 | 0.00%/0.00 |
| LD_43 | 19.38%/1.64 | 0.00%/0.00 | 0.00%/0.00 |
| LD_45 | 5.63%/1.26 | 25.00%/5.58 | 33.33%/7.44 |
| LD_49 | 4.38%/1.19 | 0.00%/0.00 | 66.67%/18.17 |
Disclaimer/Publisher’s Note: The statements, opinions and data contained in all publications are solely those of the individual author(s) and contributor(s) and not of MDPI and/or the editor(s). MDPI and/or the editor(s) disclaim responsibility for any injury to people or property resulting from any ideas, methods, instructions or products referred to in the content. |
© 2025 by the authors. Licensee MDPI, Basel, Switzerland. This article is an open access article distributed under the terms and conditions of the Creative Commons Attribution (CC BY) license (https://creativecommons.org/licenses/by/4.0/).
Share and Cite
Gao, Y.; Zhang, C.; Ye, M.; Wang, B. Identification Method of Highway Accident Prone Sections Under Adverse Meteorological Conditions Based on Meteorological Responsiveness. Appl. Sci. 2025, 15, 521. https://doi.org/10.3390/app15020521
Gao Y, Zhang C, Ye M, Wang B. Identification Method of Highway Accident Prone Sections Under Adverse Meteorological Conditions Based on Meteorological Responsiveness. Applied Sciences. 2025; 15(2):521. https://doi.org/10.3390/app15020521
Chicago/Turabian StyleGao, Yanyang, Chi Zhang, Maojie Ye, and Bo Wang. 2025. "Identification Method of Highway Accident Prone Sections Under Adverse Meteorological Conditions Based on Meteorological Responsiveness" Applied Sciences 15, no. 2: 521. https://doi.org/10.3390/app15020521
APA StyleGao, Y., Zhang, C., Ye, M., & Wang, B. (2025). Identification Method of Highway Accident Prone Sections Under Adverse Meteorological Conditions Based on Meteorological Responsiveness. Applied Sciences, 15(2), 521. https://doi.org/10.3390/app15020521