Article

GMNIA-Based Evaluation of Cable-Prestressed H-Shaped Steel Columns

1
Laboratory of Structures and Advanced Materials in Civil Engineering and Public Works, University of Sidi Bel Abbes, Sidi Bel Abbes 22000, Algeria
2
Department of Structural and Geotechnical Engineering, University “La Sapienza”, 00184 Rome, Italy
*
Author to whom correspondence should be addressed.
Appl. Sci. 2025, 15(19), 10826; https://doi.org/10.3390/app151910826
Submission received: 5 September 2025 / Revised: 3 October 2025 / Accepted: 4 October 2025 / Published: 9 October 2025
(This article belongs to the Section Civil Engineering)

Abstract

The strengthening technique by external cable prestressing, until now limited to columns with circular hollow sections (CHSs), is here extended to H-shaped steel columns. To provide an innovative general treatment, an initial imperfection, obtained from the analytical equivalence between Eurocode 3 and Ayrton–Perry formulations, is introduced. By this, a geometrically and materially nonlinear imperfection analysis (GMNIA) is performed by the finite element commercial code Abaqus. A parametric analysis identifies the deviator length, cable tension, and slenderness ratio as key parameters. Results confirm that, on the one hand, cable prestressing yields a critical load that is approximately twice that for non-prestressed elements (680 kN against 340 kN for a beam 8 m long); this effect grows with the column length. On the other hand, a simulation on a two-story frame supported by 12 columns, each 4 m long, spaced by 4 and 6 m in the two directions, under vertical ‘dead’ load shows that prestressed HEA200 columns perform as non-prestressed larger HEA220 profiles; thus, their use in this case leads to saving approximately 1.18 tons of steel; both these results are of practical interest in design of steel structures.

1. Introduction

Prior to the establishment of modern standards for compressed metal members, the design of metallic structures relied mainly on empirical formulas derived from construction experience. Early metal frameworks, particularly those incorporating wrought iron, were developed according to simplified empirical rules informed by rudimentary experimental observations. In the absence of theoretical models, builders adjusted member dimensions based on structural failures observed in existing constructions.
The emergence of scientific theories marked a significant advancement, providing a more rigorous understanding of buckling, or static instability of compressed members. Leonhard Euler [1] first established a comprehensive theory of buckling, providing the renowned formula for the critical load of an ideal compressed column. Euler’s formula, as we use it now, accounts for the modulus of elasticity of the material, the second moment of area of the cross-section about the major inertia axis normal to the plane of buckling, the length of the element, and an effective length factor that accounts for the end constraints of the element. However, it assumes perfect elements without imperfections or plasticity, limiting its applicability to real-world scenarios.
With the rise of metallic structures, refined theories incorporated more realistic features: Ayrton and Perry [2] assume that real columns have geometric imperfections and find a critical load lower than Euler’s theoretical one. Engesser [3] and Tetmajer [4] refine Euler’s formula considering both geometric imperfections and plasticity. Experimental tests proved that even small geometric deviations from the case of pure bending significantly reduce the critical load. Von Kármán [5] further explored the influence of imperfections and plasticity, showing that the yield strength of metallic materials also plays a role. These studies led to the development of more realistic nonlinear models of buckling.
The evolution of verification methods for compressed metal elements was marked by the introduction of empirical buckling curves that represent the actual structural behavior better, accounting for initial imperfections, variations in material properties, and various loadings. This advancement, achieved during the 20th century, paved the way for the standardization of verification techniques. Design reliability was further enhanced through the development of standards, supported by extensive experimental testing.
Standards organizations, such as the American Institute of Steel Construction (AISC) and the American Concrete Institute (ACI), introduced reduction factors to match theoretical models and experimental results, correlating the critical buckling stress with the material yield strength. Compression tests also revealed distinct failure mechanisms depending on the elements’ slenderness. These findings shaped the formulation of modern design standards; Eurocode 3 [6] consolidated these advancements by proposing a unified approach incorporating experimentally validated buckling curves and advanced numerical analyses, thereby improving both the accuracy and reliability of structural design.
However, the adoption of standards such as Eurocode 3 [6] and AISC 360 [7] for the verification of compressed elements may limit the range of solutions when resistance requirements are not met. Further, conventional approaches, such as increasing the cross-section of elements, can be costly and sometimes suboptimal. To overcome these limitations, researchers explored alternative solutions to enhance the stability of compression members: Wen et al. [8], Chen et al. [9], and Manigandan and Kumar [10] investigated the use of concrete-filled steel tubes; Xi et al. [11] focused on self-stressing techniques in concrete members, where prestressing is achieved through the material’s own expansive properties, thus improving stiffness and reducing lateral displacements.
Among other methods aimed at reducing the lateral displacement of steel compression members, we may quote the work of Andrade et al. [12,13], who prove that CHSs are effective as very slender columns for supporting lightweight structures. For example, in the construction of the “Rock in Rio III” stadium in Brazil, CHS columns were built and prestressed on-site to support the stadium roof. This approach eliminated the need for expensive shoring systems, greatly reducing both construction time and cost. More recent studies have further expanded the field. Saito and Wadee [14] showed that for a given configuration, defined by the dimensions of the deviator, main member, and cable, there exists an optimal prestressing force that maximizes the critical buckling load, for which the post-buckling behavior becomes highly complex and nonlinear. Hoveidae and Ragezy [15] described Buckling-Restrained Braces (BRBs), which consist of an inner core tube and an external restraining mechanism of larger diameter, both CHSs. The external restraint provides lateral confinement, allowing the inner core to yield fully under compression without inducing global instability. Takeuchi et al. [16] carried out numerical and experimental investigations to evaluate the local buckling restraint conditions in BRBs. Mirtaheri et al. [17] optimized the core member length through experimental tests. Zhao et al. [18] introduced a novel steel BRB design and experimentally studied its mechanical response and failure modes. Guo et al. [19,20] and Zhu et al. [21,22] developed a core-separated BRB system, in which multiple spaced cores enhance both bending stiffness and load-bearing capacity and are interconnected using steel plates. Serra et al. [23] proved that a slender CHS main member, reinforced with transverse stiffening elements and prestressed cables, can overcome the challenge of low buckling loads. This system, combining structural efficiency and architectural appeal, was notably applied in the Algarve Stadium in Portugal (2004). Based on this concept, Liu and Zhang [24] carried out numerical and experimental investigations to assess the effect of prestress levels on the nonlinear post-buckling interaction behavior of the deviators. Wu et al. [25] examined the nonlinear stability of prestressed stayed columns under fire, showing the impact of non-uniform temperature distributions. Mehdi et al. [26] developed a spatial stability theory for thin-walled steel beams prestressed by inclined unbonded cables, supported by finite element formulations. Li et al. [27] introduced a multi-dimensional global optimization algorithm for determining the crossarm length of prestressed stayed columns, achieving higher efficiency than traditional parametric approaches.
Most studies on cable-reinforced steel columns focus on CHSs, often analyzed as isolated elements for local reinforcement, such as those in the Nanjing International Exhibition Centre in China. In contrast, open cross-sections like H-shaped profiles, widely used in practice, have received little attention in the context of cable prestressing.
Another limitation lies in dealing with imperfections: while a few experimental investigations exist, most numerical and analytical studies rely on fixed imperfection amplitudes, typically L/200 or L/300, as a simplified representation of initial defects. Although such assumptions are convenient and widely used, they may not fully capture the combined effects of member geometry defects and residual stresses. Indeed, these combined effects can be effectively captured in compressed members by Eurocode 3 formulations in the absence of prestress, but in its presence, the same approach cannot be directly applied, since the prestress alters the structural response.
Thus, this study has two objectives: first, to widen the research on compressed members prestressed by cables, considering H-shaped elements and frames consisting thereof; on the other hand, to propose an equivalent initial imperfection, obtained from the analytical equivalence between Eurocode 3 and Ayrton–Perry formulations. Unlike fixed ratios, the proposed expression depends explicitly on section geometry, slenderness, and an imperfection factor that reflects both geometric defects and residual stresses. This provides a more rational framework for GMNIA simulations with Abaqus [28] and extends the applicability of imperfection modeling beyond the CHS-focused literature.

2. Present Standards, Novel Suggestions

When the strength of a compressed element is found insufficient, standards such as Eurocode 3 [6] and AISC 360 [7] typically recommend conventional but often costly solutions, e.g., increasing the cross-sectional dimensions. Here, we outline the key factors motivating these recommendations and supporting the proposed alternative solution.
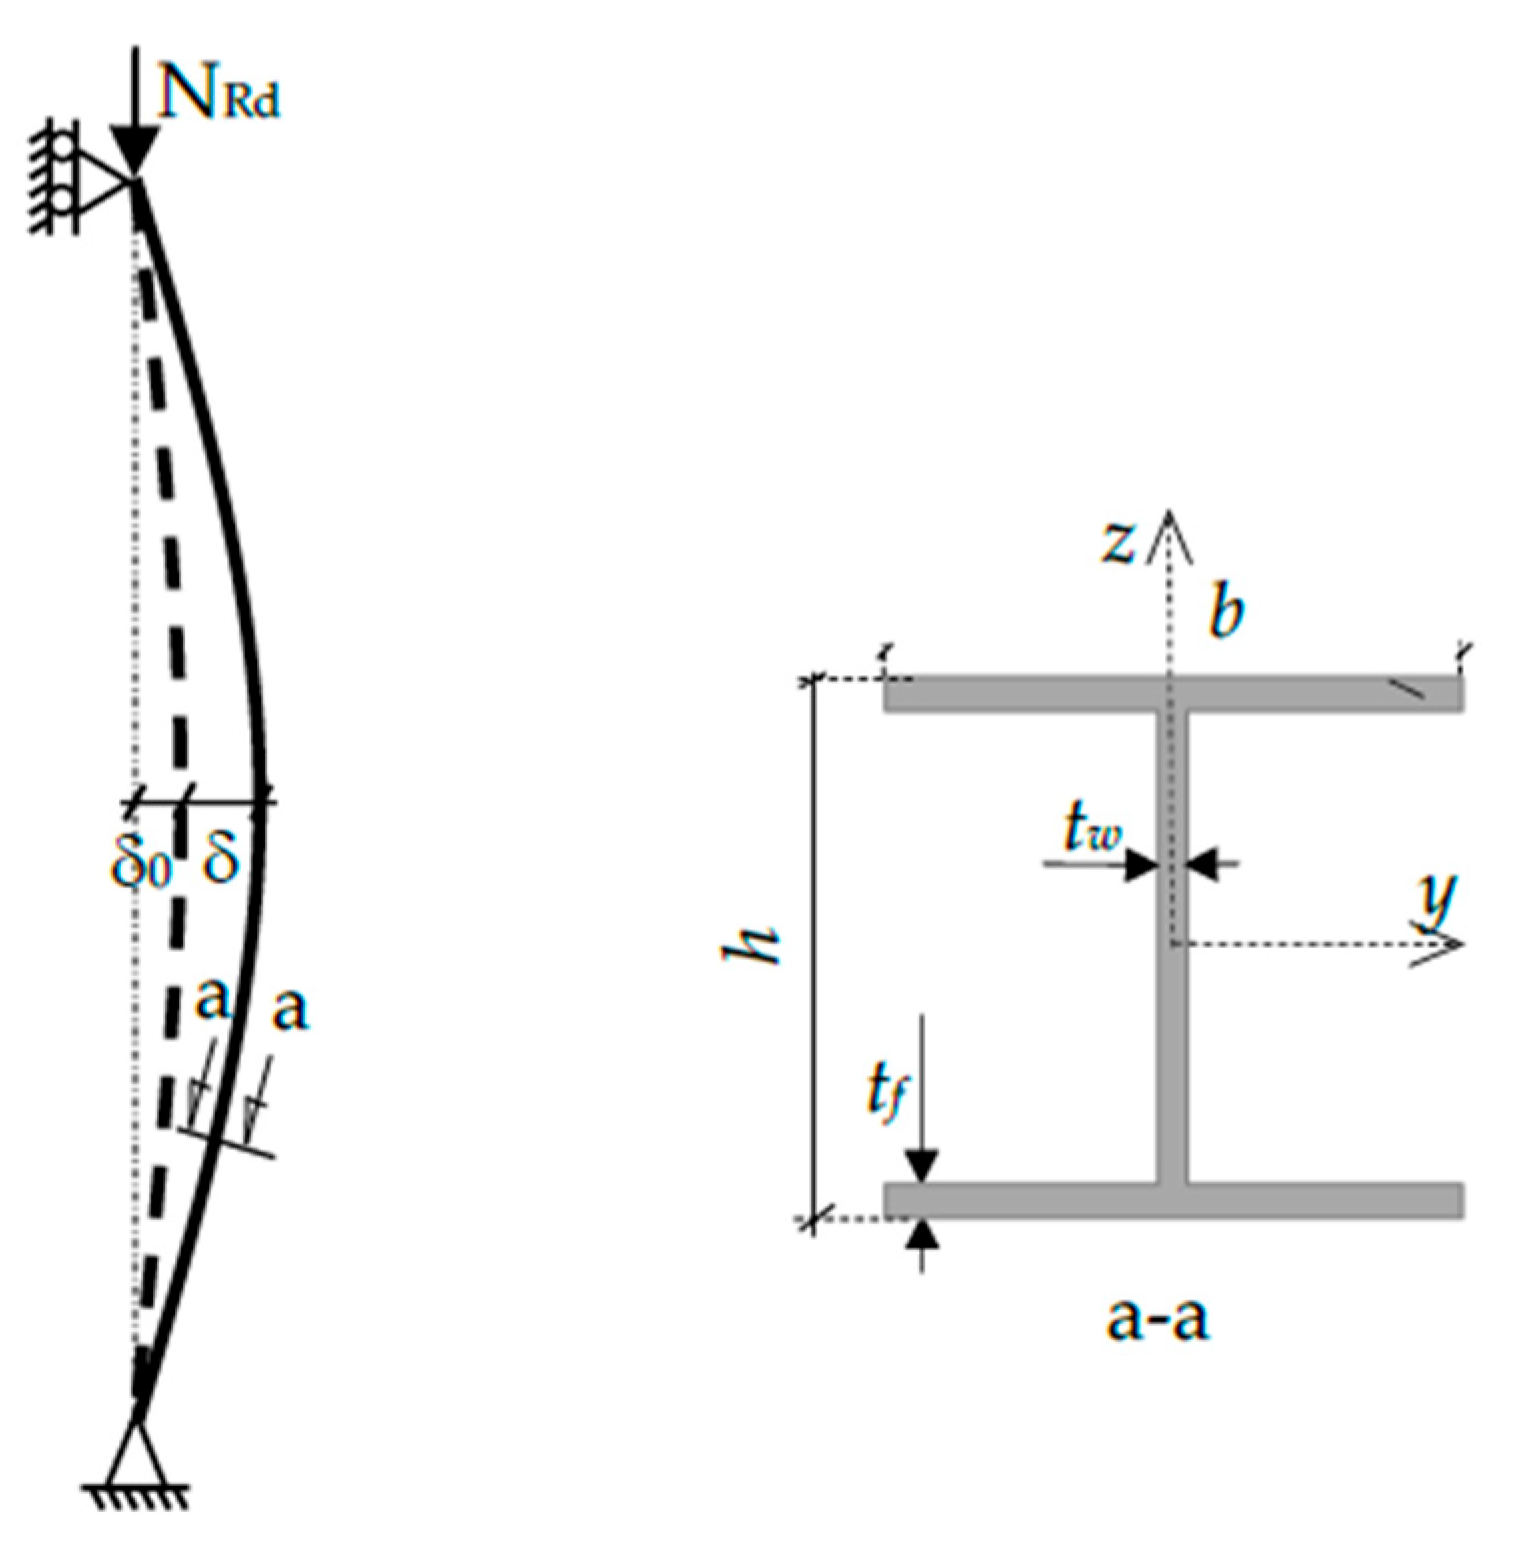
To this end, Geometrically and Materially Nonlinear Imperfection Analysis (GMNIA) of a compressed simply supported HEA200 column with initial imperfection δ0 (see Figure 1) is performed by Abaqus software; the column properties (the cross-sectional dimensions b ,   h ,   t f , t w are shown in Figure 2, the cross-section area, elastic modulus, Young’s modulus, and yield stress, A ,   W e l ,   E , and f y , respectively) are given in Table 1.
The design resistance of a compressed member is given analytically by
N R d = A f y
which is adopted in principal standards such as Eurocode 3 [6] and AISC 360 [7]. The reduction factor χ was first introduced in the Ayrton–Perry formulation [2] as
χ = 1 φ + φ 2 λ 2 ,
φ = 0.5 1 + η + λ 2 ,
η , λ being the imperfection parameter and the non-dimensional slenderness, respectively; the first is defined by
λ = A f y N c r
with N c r being Euler’s critical load. Ayrton and Perry (whence the subscripts) take η as
η A P = A δ 0 W e l
where δ 0 is the maximum amplitude of the initial geometric imperfection. Eurocode 3 [6] follows the same framework but replaces this purely geometric parameter with
η E C = α ( λ 0.2 )
where α is the imperfection factor characterizing the buckling curve and the subscripts recall the Eurocode, and Ayrton–Perry’s approach is extended by adding the effects of residual stresses to geometric imperfections. For practical analytical or numerical studies, Eurocode 3 further proposes simplified alternatives in the form of fixed imperfection amplitudes (e.g., L/200, L/250, etc.). Here, we suggest an equivalence between the two formulations, i.e., we pose η A P = η E C :
α ( λ 0.2 ) = A δ 0 W e l
which leads to an explicit expression for δ 0 :
δ 0 = α ( λ 0.2 ) W e l A
This δ 0 no longer represents a purely geometric imperfection, but an equivalent one that reflects both geometric deviations and residual stresses through the Eurocode imperfection factor α. Thus, it depends explicitly on the cross-section geometry, the slenderness λ , and the buckling curve, rather than on fixed ratios. Previous works relied on simplified alternatives instead: Serra et al. [23] adopted imperfections close to L/200 and validated them experimentally on prestressed columns; Liu and Zhang [24] used mode-shape imperfections with a fixed amplitude of L/300 in GMNIA simulations. These studies confirm the reliability of the Eurocode imperfection approach, while the present work extends it by providing an explicit expression for the equivalent initial imperfection.
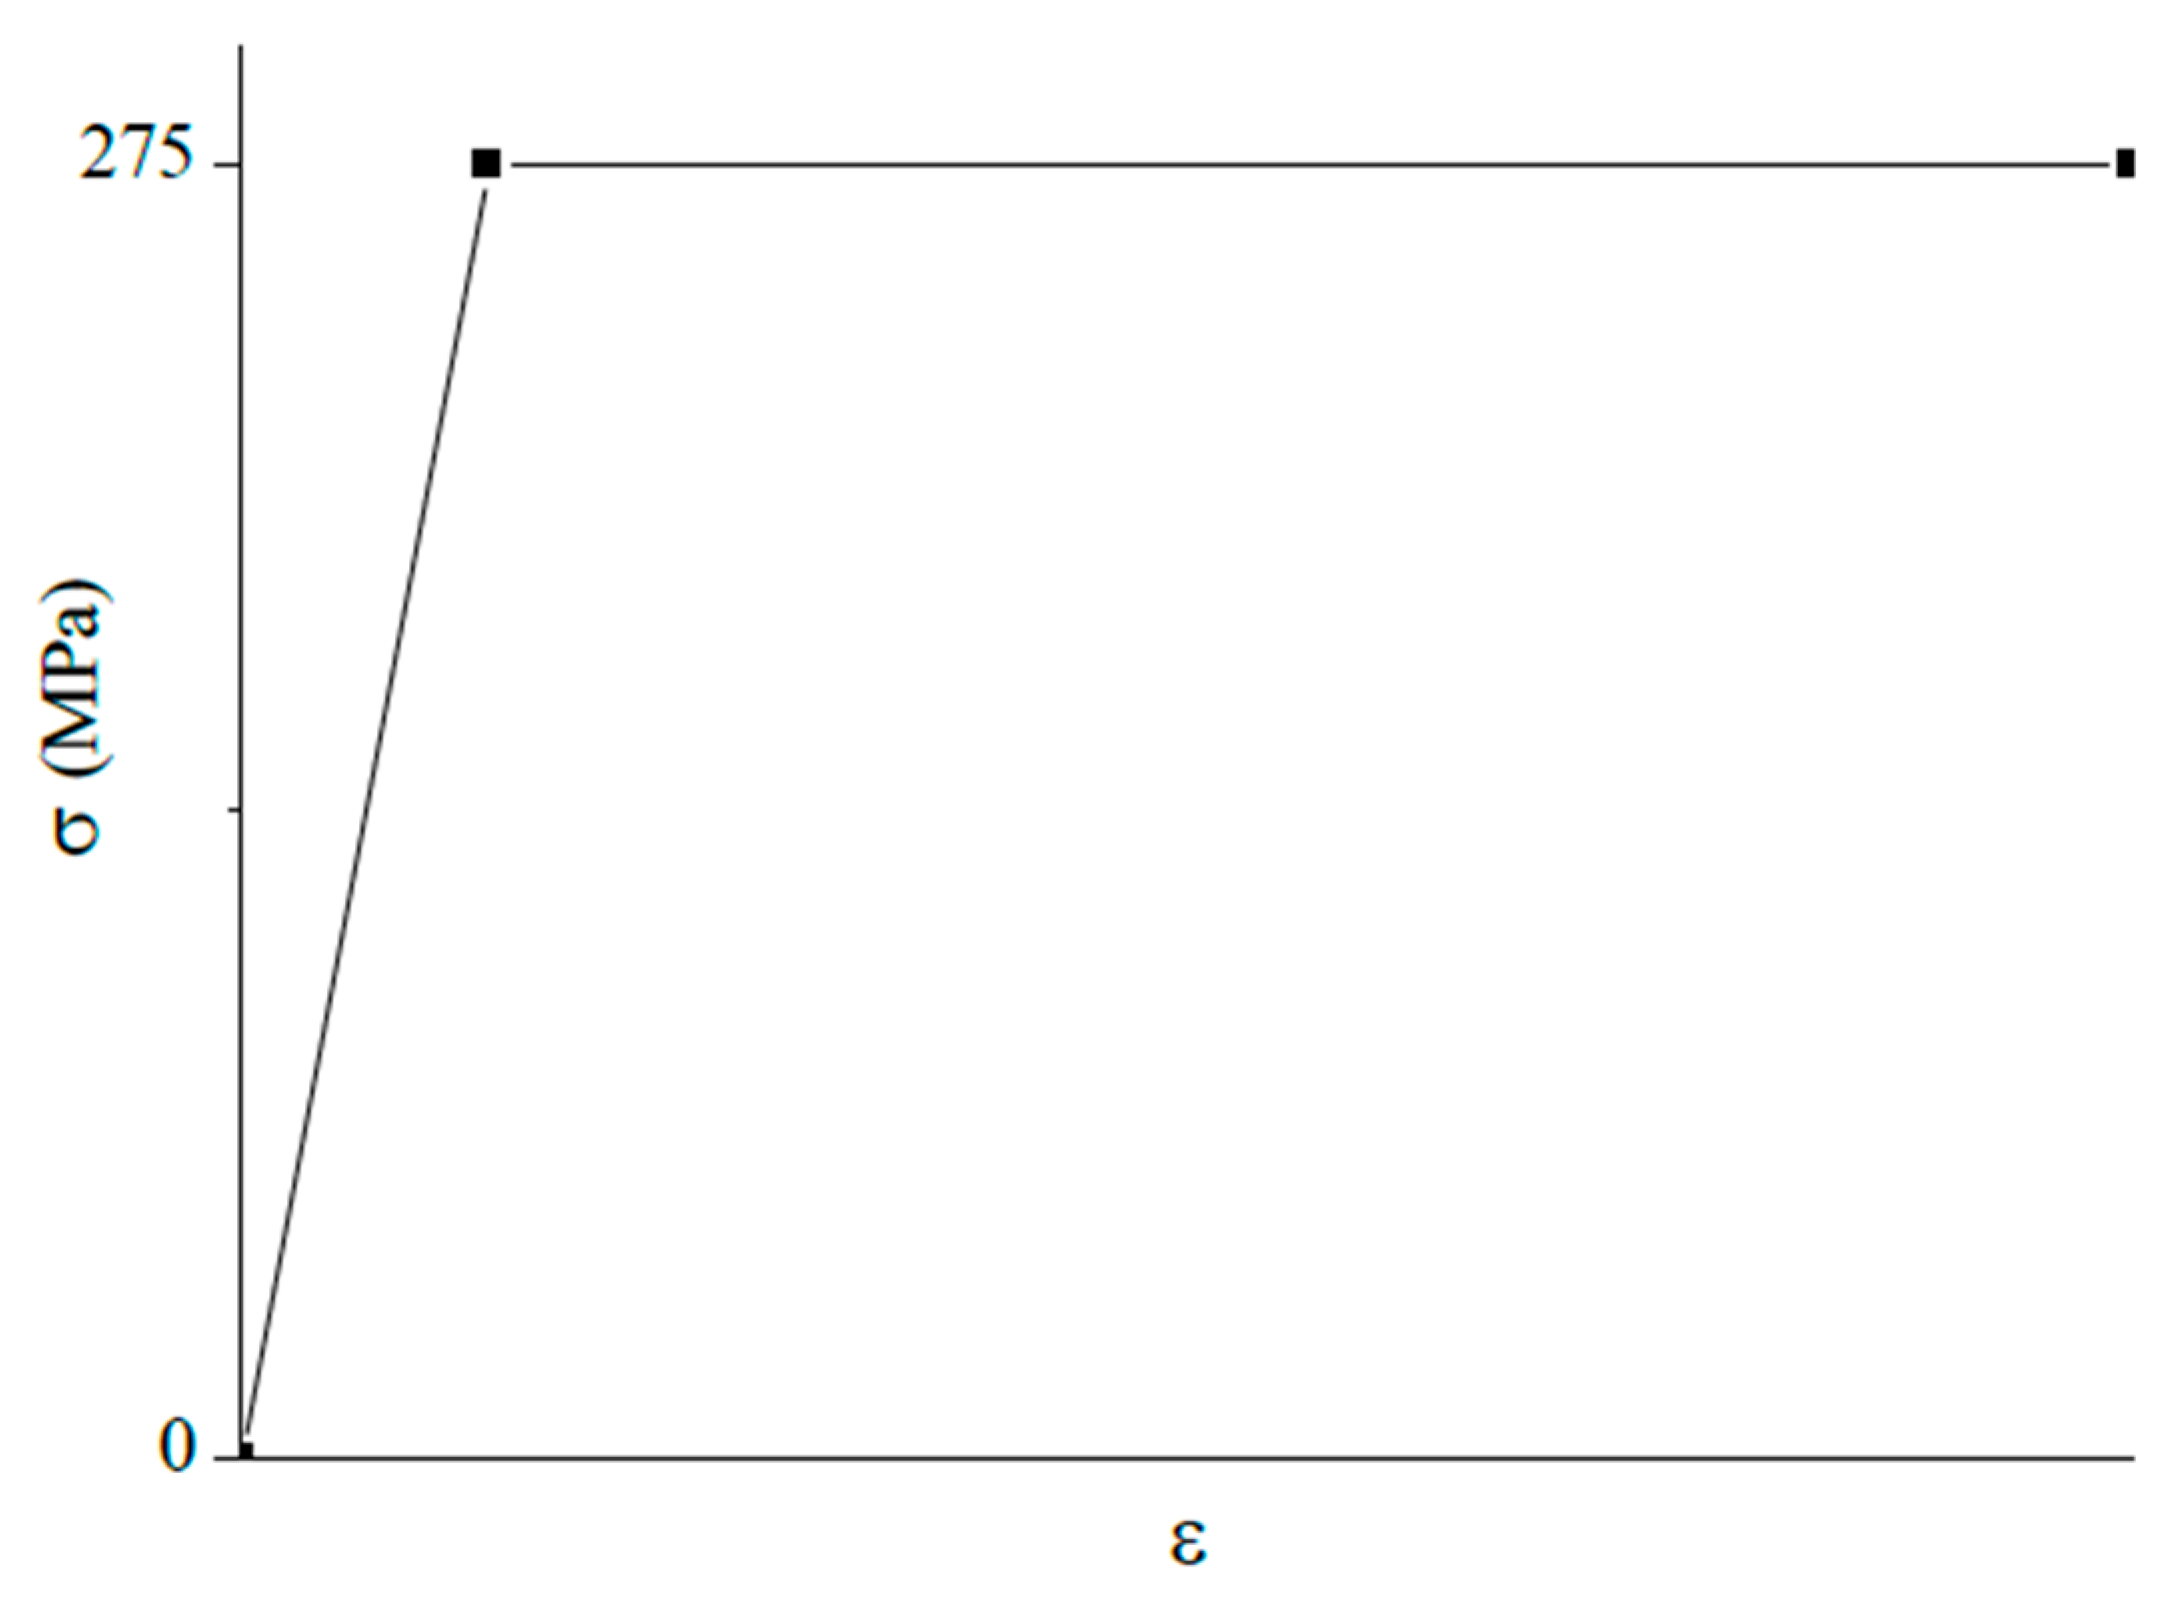
In FEM, it is well known that the accuracy of results increases as the mesh size decreases, within the limits of applicability of the element formulation. According to Mahieddine et al. [29,30], convergence for beam elements is achieved more rapidly compared to shell or solid elements. In this study, quadratic beam elements (B32OS) were employed for the main H-shaped member. The maximum element length was controlled within 100 mm to ensure adequate representation of buckling modes. The column was modeled as bi-articulated, with all translations and the torsion rotation restrained at the base (U1 = U2 = U3 = UR3 = 0) and translations parallel to the flanges and torsion rotation restrained at the loaded head (U1 = U2 = UR3 = 0). The analysis was carried out in two steps: In the first, a linear buckling analysis (“Buckle”) was performed by applying a unit concentrated load at the column head to identify the buckling modes. Mesh sensitivity was verified by halving the element size; the variation in critical loads remained below 2%, confirming convergence. The fundamental buckling mode was then scaled by the equivalent initial imperfection δ 0 , as given in Equation (8), and introduced into the duplicated model. In the second step, this modified model was analyzed using the GMNIA procedure with the “Static Riks” method. The steel was modeled as elastic–perfectly plastic (see Figure 2), and the nonlinear equilibrium path was traced.
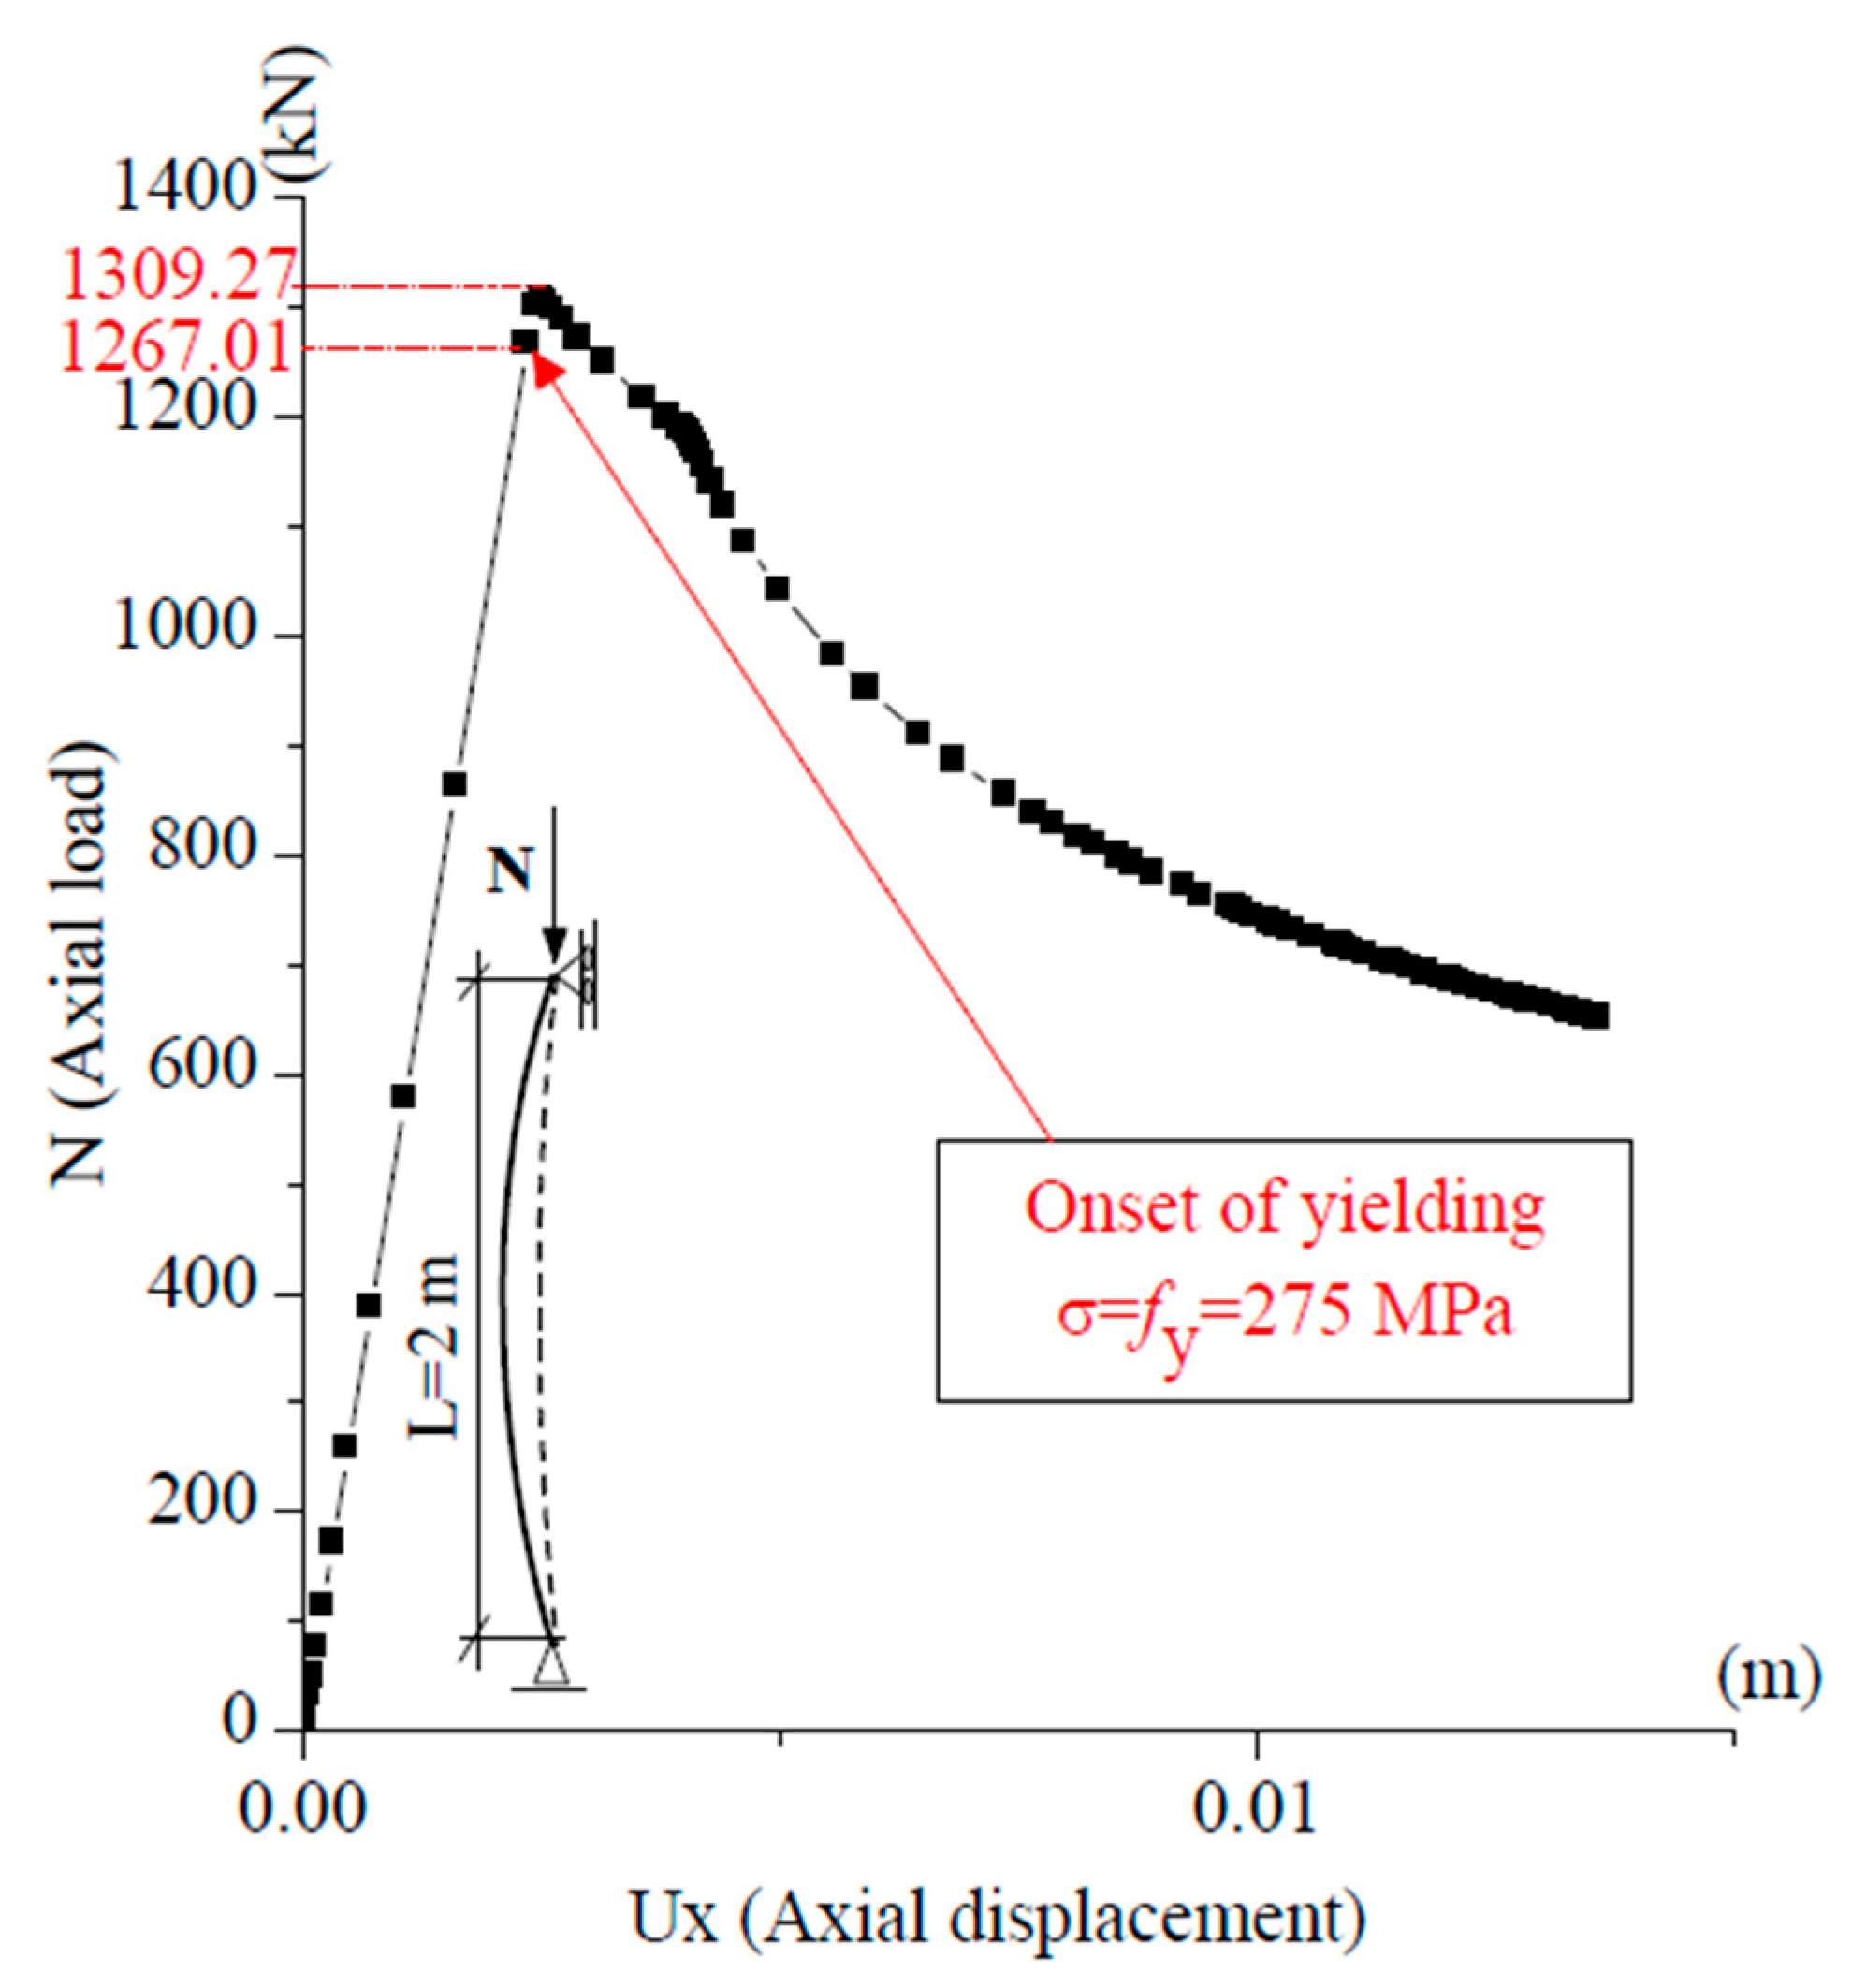
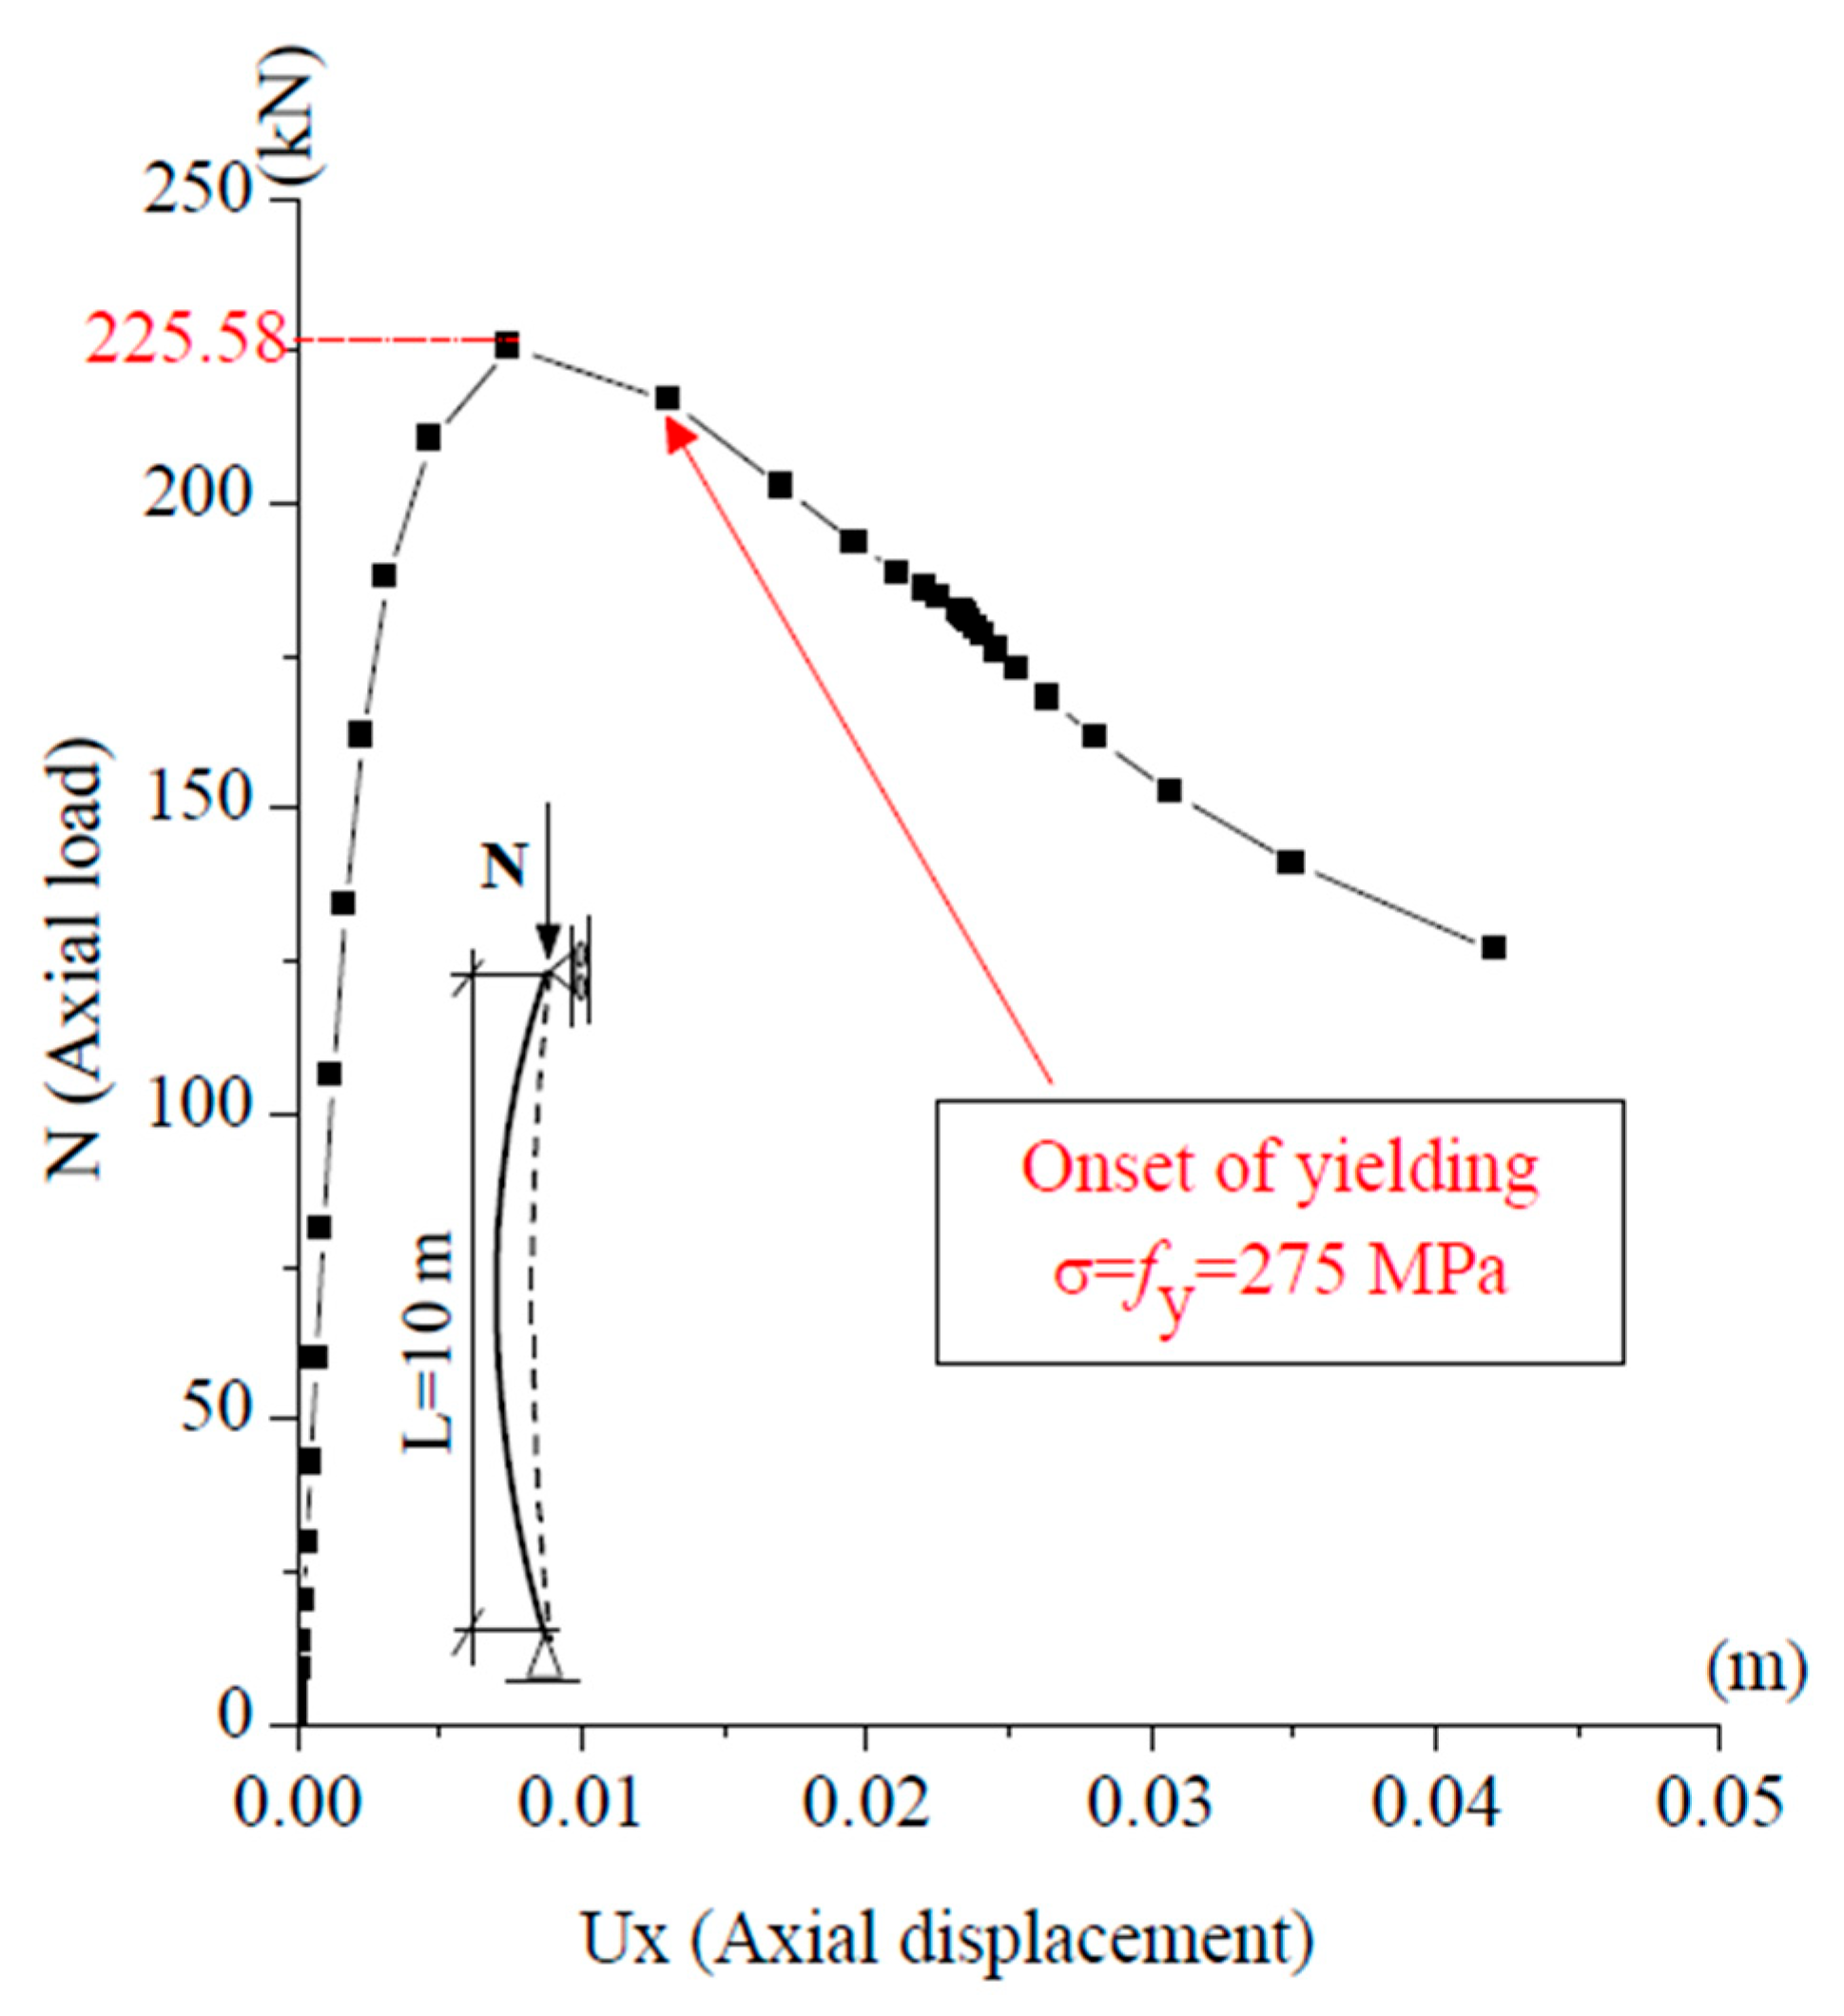
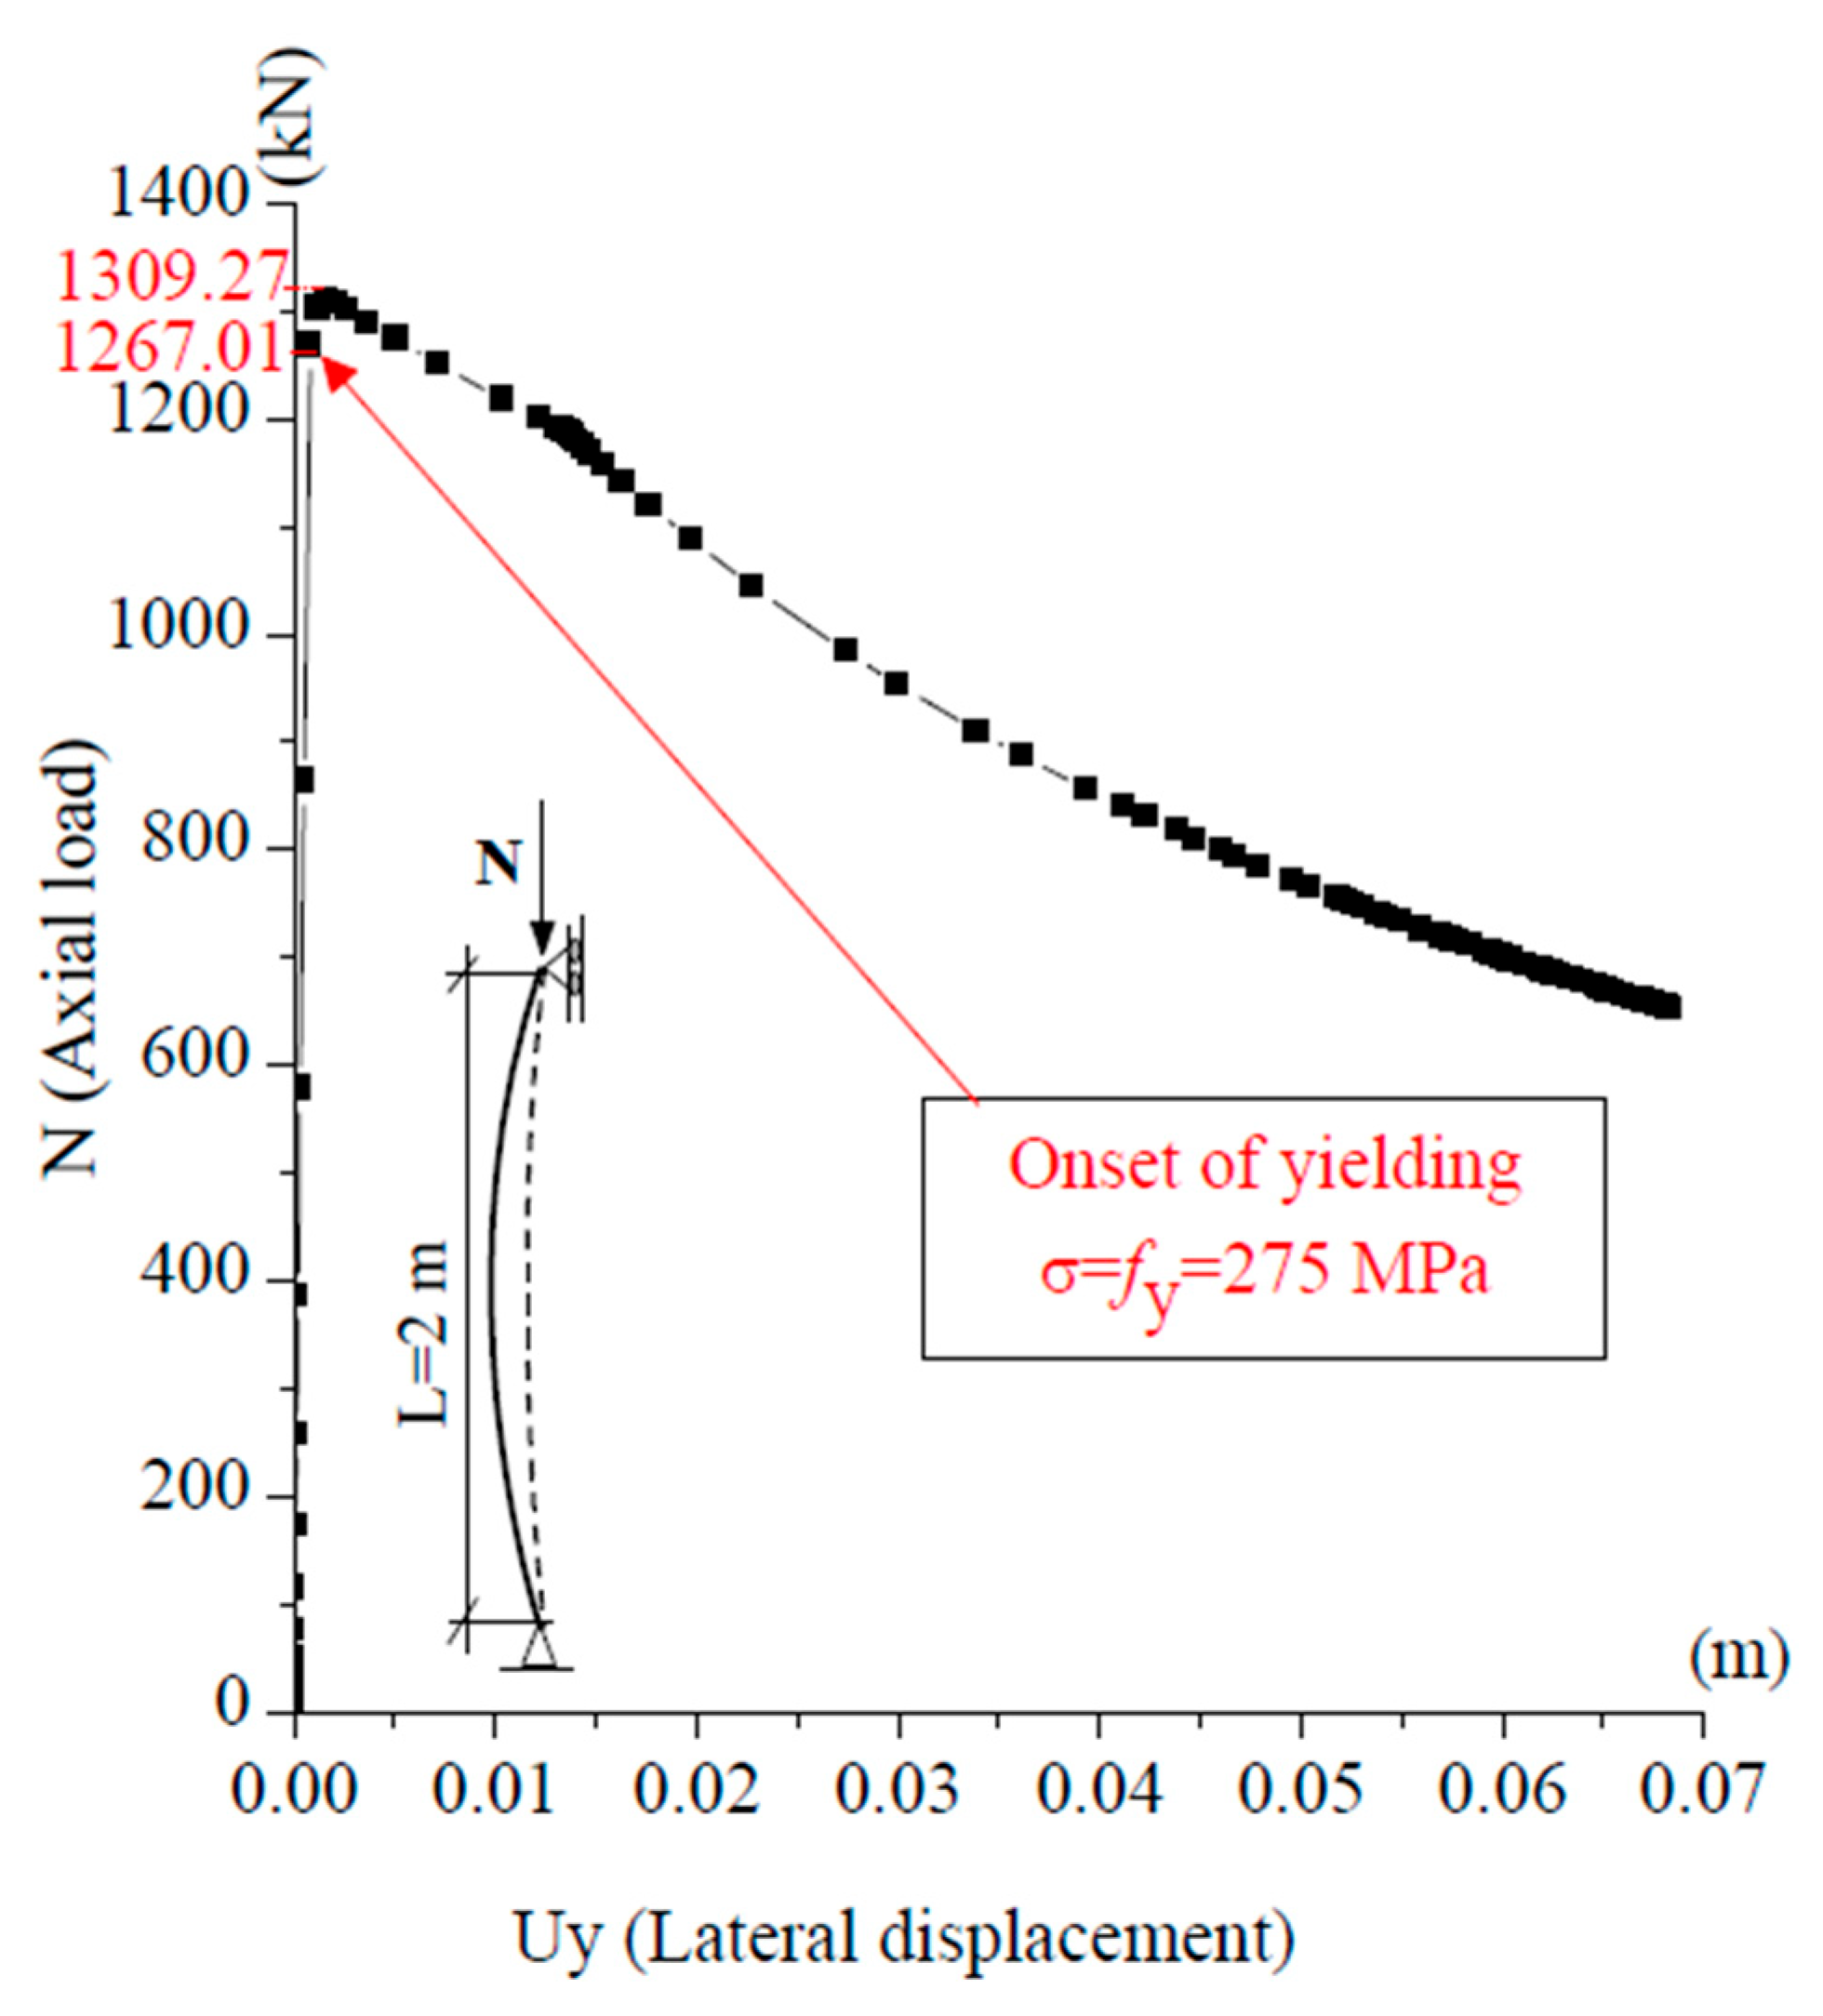
As shown in Table 2, the GMNIA peak loads, i.e., the maxima of the load–displacement curves in Figure 3, Figure 4, Figure 5 and Figure 6, are in very good agreement with the design resistance predicted by Eurocode 3 (Equation (6)), according to the standard procedure described above. The relative error between GMNIA and Eurocode 3 does not exceed 4.80%, which is fully consistent with the fact that Eurocode 3 is already a reliable reference for simple non-prestressed columns. In contrast, predictions based on the Ayrton–Perry formulation (Equation (5)) are highly sensitive to the assumed initial imperfection δ 0 . For the short column, close agreement with GMNIA is achieved only for δ 0 = L / 1000 , while larger values, such as δ 0 = L / 200 , lead to significant underestimation. For the slender column, the best match occurs for δ 0 = L / 400 , whereas other assumptions either under- or overestimate the resistance. These comparisons highlight the limitation of prescribing fixed imperfection amplitudes and stress the need for a more rational definition of an equivalent initial imperfection.
The GMNIA results in Table 2 and Figure 3Figure 4Figure 5 and Figure 6 provide physical insight into the structural response. For the short column (L = 2 m), yield initiates in the outer fibers before the maximum load is reached, reflecting a material-driven limit state. In contrast, the slender column (L = 10 m) reaches its peak load while staying elastic, and yield occurs after buckling. In both cases, yield initiates at the outer fibers of the cross-section ( x = L / 2 , y = b / 2 ). These numerical and physical observations confirm the consistency of Eurocode 3 for ordinary columns; however, no corresponding formulas exist for prestressed steel ones. This motivates the introduction of the equivalent initial imperfection in Equation (8), providing a rational alternative to fixed imperfection ratios and forming the basis for our study.
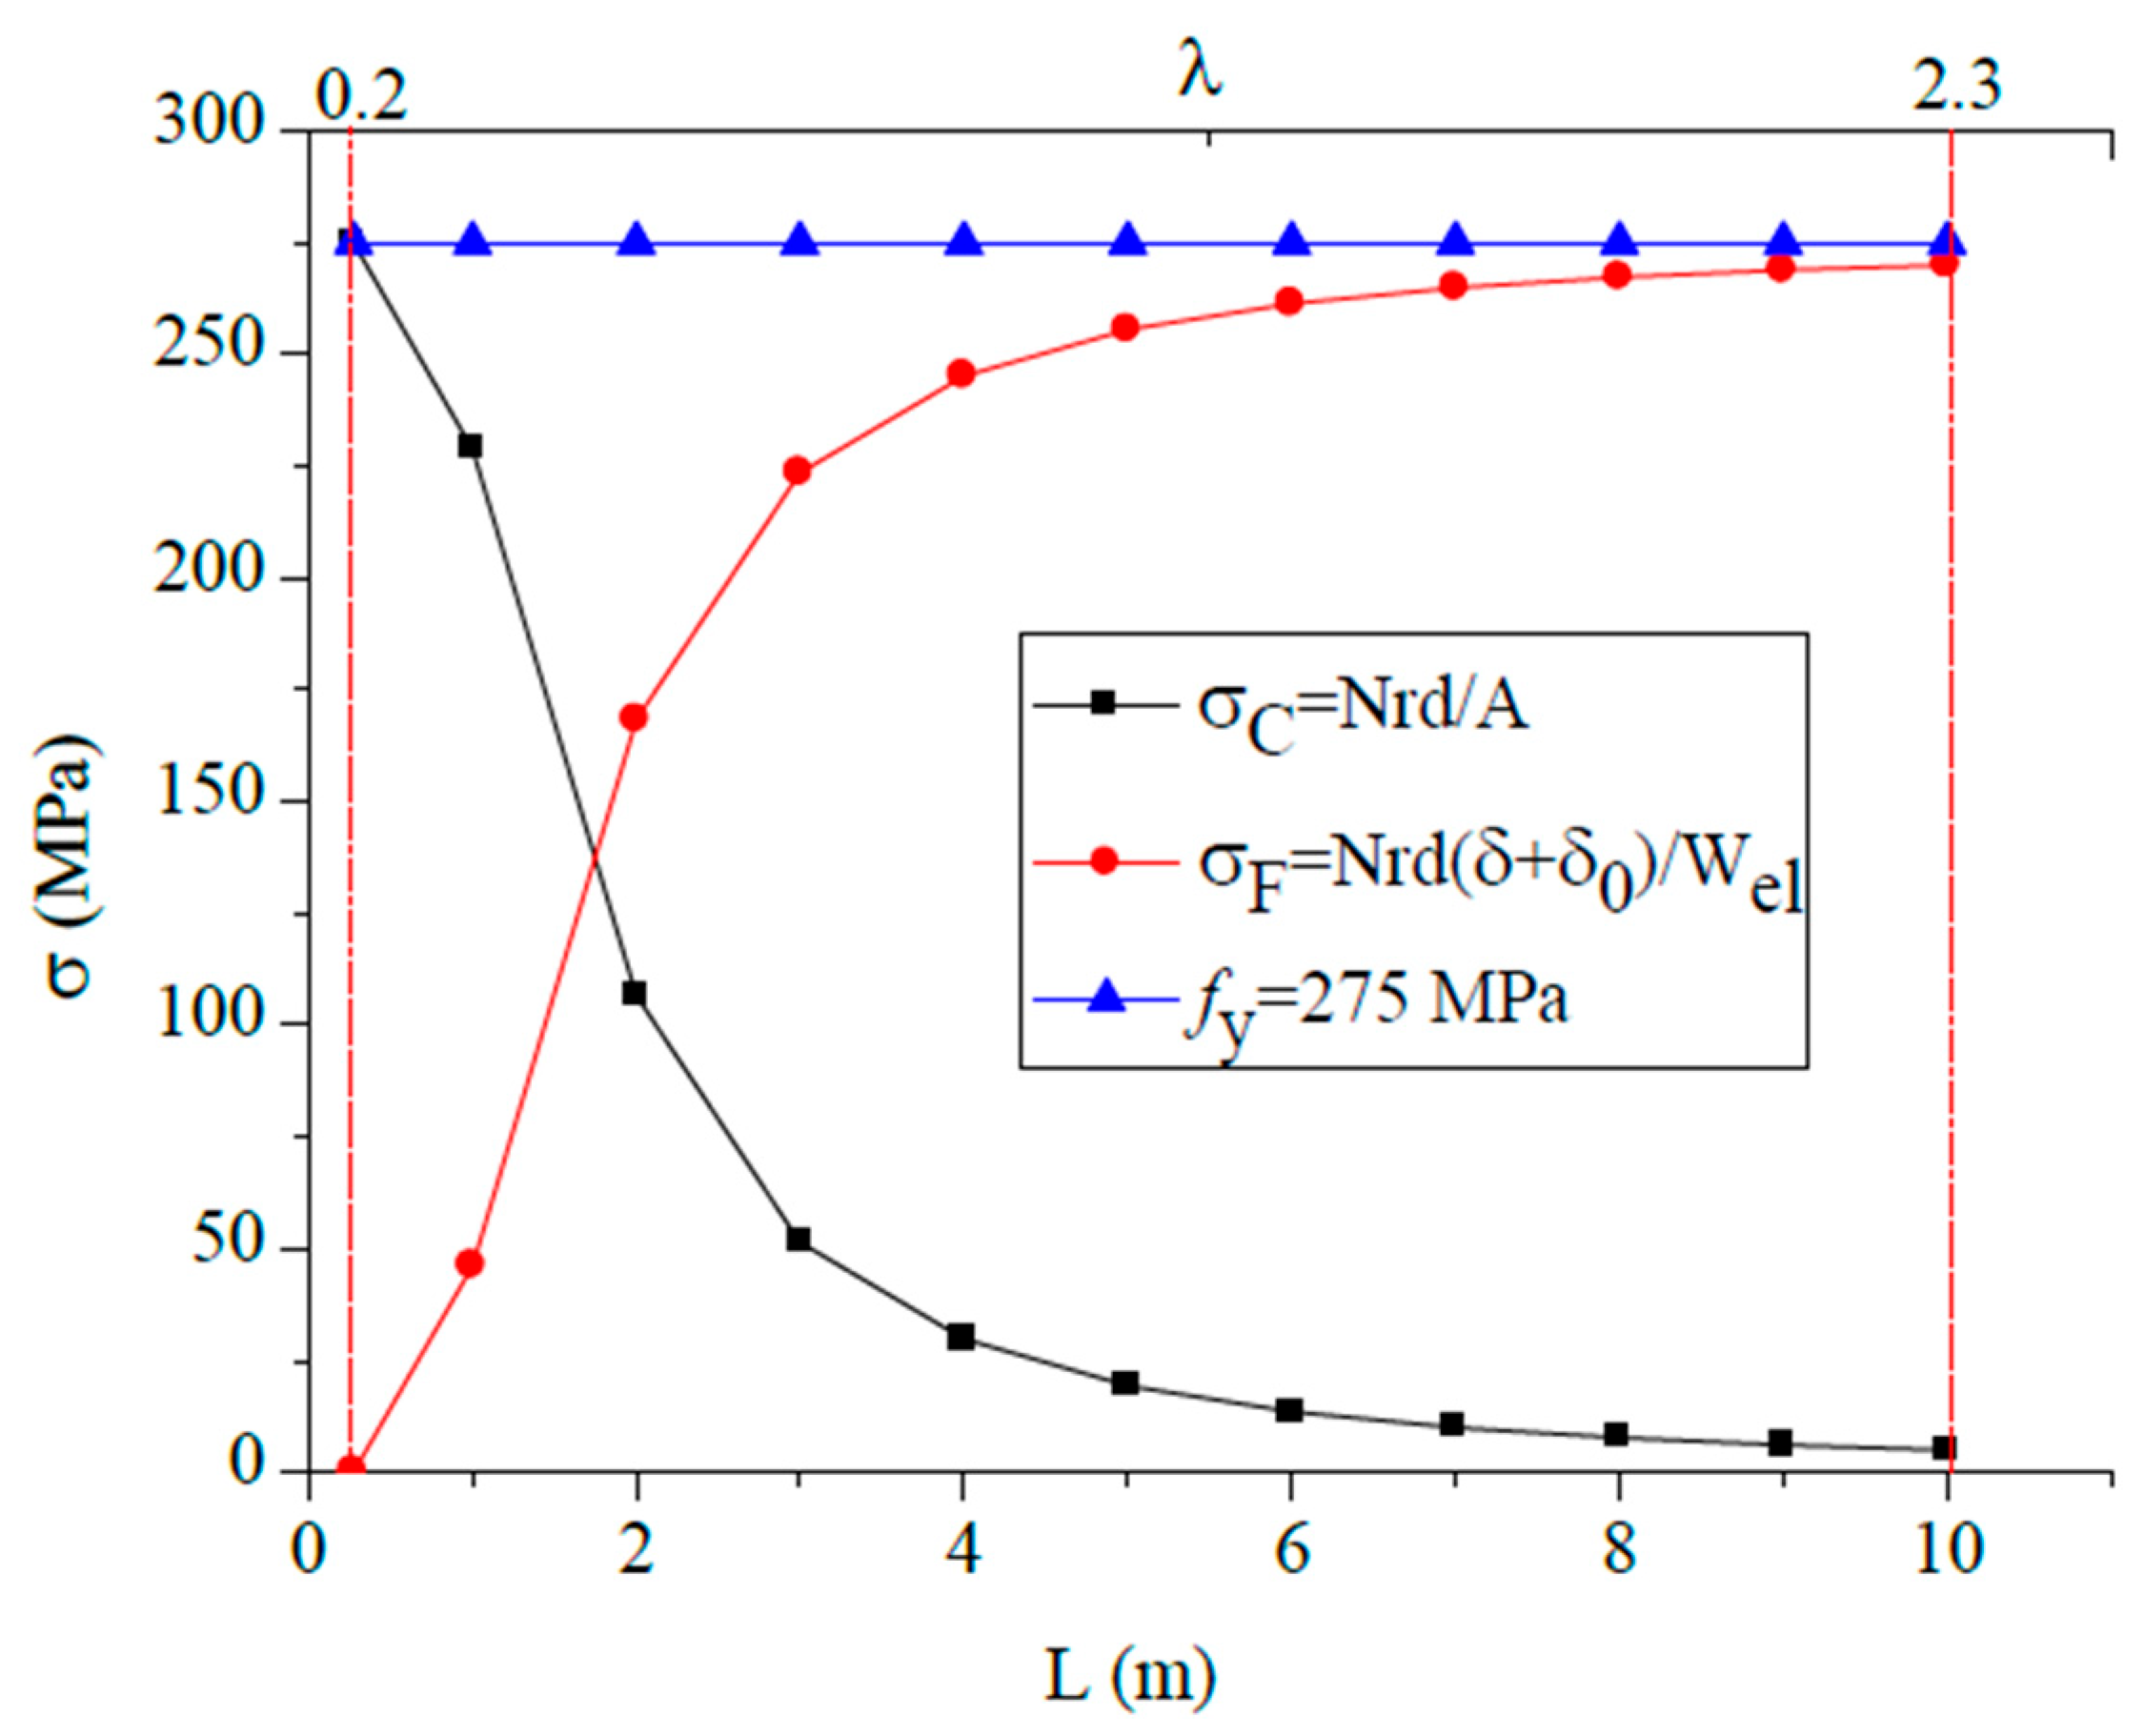
Note that HEA200 columns with L < 2 m were excluded from the analysis, as for such short members the instability is governed by torsion and their behavior is thus outside the scope of this study on slender compressed columns, for which the flexural instability is dominant and critical. In these cases, the maximum normal stress σ m a x does not exceed the yield stress f y and can be expressed as the sum of a compressive stress σ C and a bending stress σ F when the axial load N approaches the design resistance N R d :
σ m a x = σ C + σ F = N R d A + N R d ( δ + δ 0 ) W e l = f y
Here, the expression for the maximum lateral displacement δ is taken from a simplified geometrically nonlinear elastic analysis [31] and, if N c r is Euler’s critical load, is
δ =   N R d δ 0 N c r N R d
Figure 7, based on Equations (9) and (10), illustrates the evolution of stresses as a function of the length of an HEA element and shows that for short columns, the compressive stresses σ C dominate. However, as the column becomes slenderer, the bending stresses σ F become increasingly significant, eventually exceeding 90% of the yield stress f y . In such cases, it becomes reasonable to neglect compressive stresses and focus only on the bending stresses, which are mainly influenced by the elastic section modulus W e l and the maximum lateral displacement δ .
This highlights a key challenge in the design of slender columns: when the resistance N R d is much lower than the applied load N E d , standards such as Eurocode 3 [6] and AISC 360 [7] recommend increasing the cross-section dimensions to improve resistance, with the above-mentioned drawbacks. To be more efficient, here we propose an alternative approach: instead of increasing the cross-section, we propose to reduce the maximum lateral displacement δ by reinforcing the structural elements with prestressed cables. This method aims to improve performance while limiting material use and cost.

3. The Effect of Prestressing on Isolated Compressed Elements

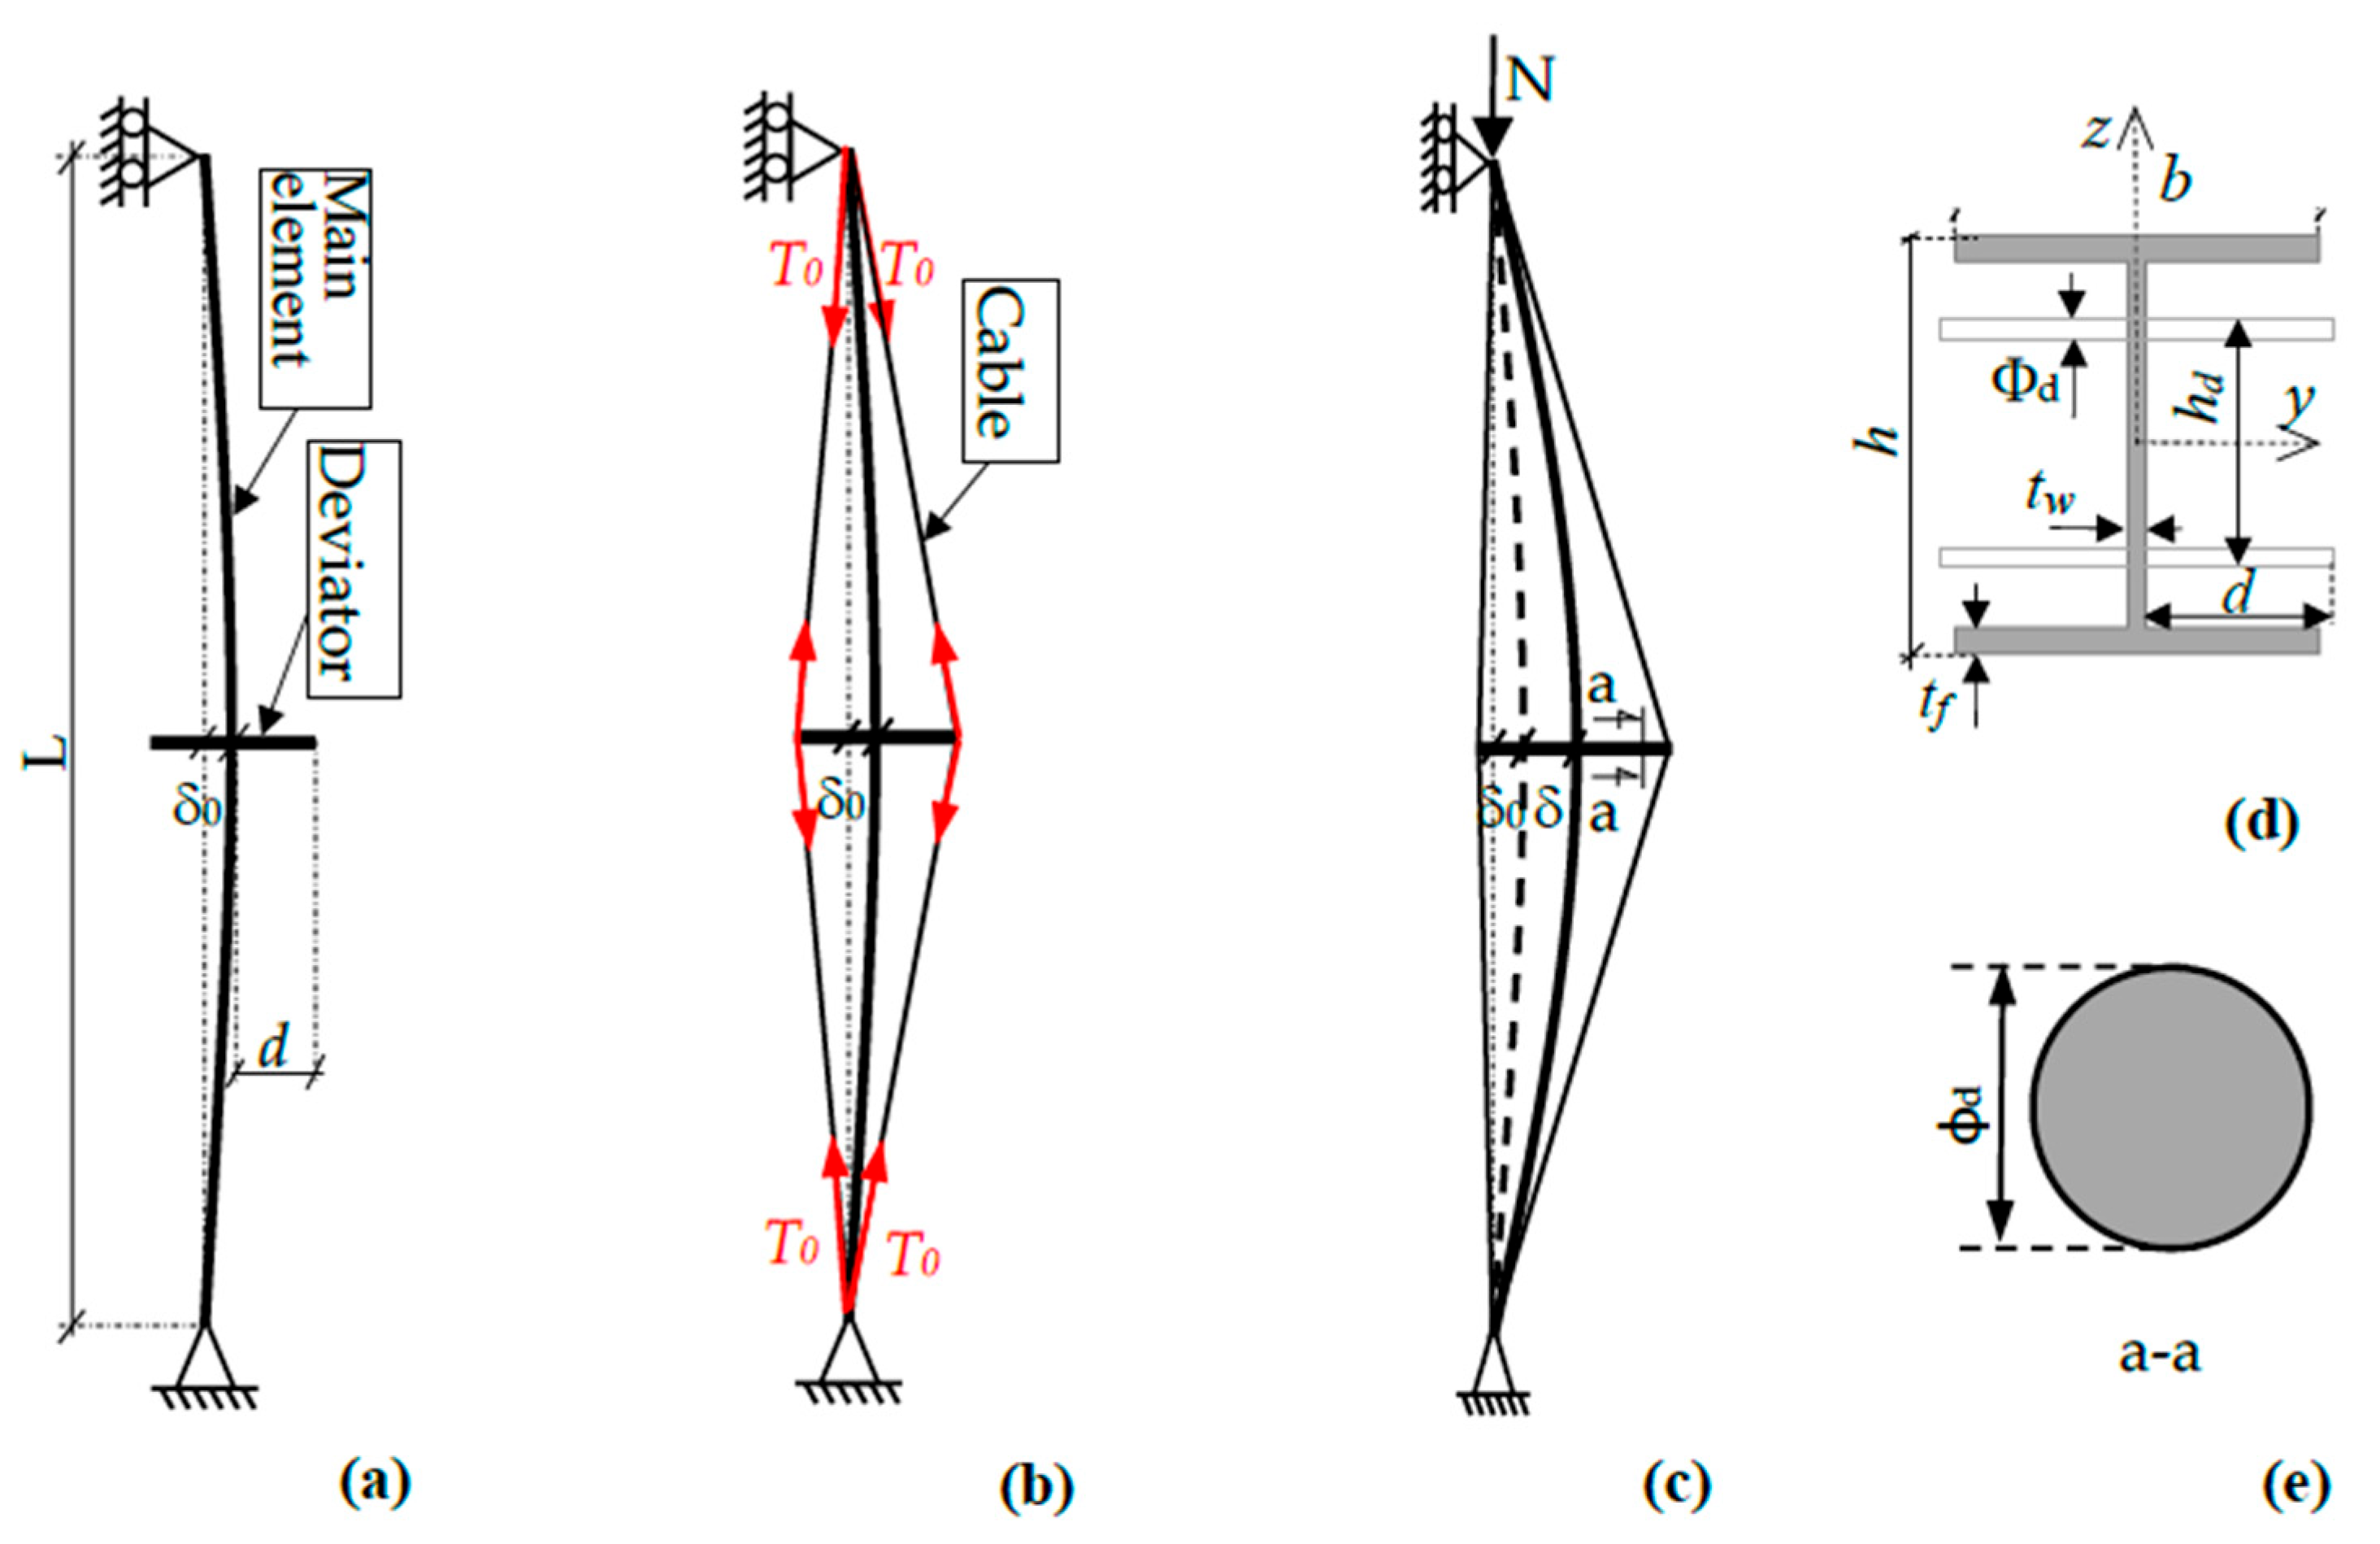
We consider the previously introduced HEA200 profile as prestressed and hereafter refer to it as the main element, outfitted with deviators acting as supports for the prestressing cables; see Table 3 and Figure 8. There, ϕ d ,   d ,   E ,     f y , and   h d are the diameter, length, elastic modulus, and yield strength of the deviator and the distance between deviators, respectively; ϕ c ,   A c ,   α c ,     E c , and f p r g are the diameter, cross-section area, coefficient of thermal expansion, elastic modulus, and ultimate strength of the cable, respectively.
In this preliminary study, the parametric analysis focused on deviator length and initial prestressing force, as they directly influence the efficiency of prestressing. Other factors such as the column slenderness ratio λ , cable diameter, and deviator material were kept constant and will be the subject of future investigations.

3.1. The Effect of Deviator Length on Buckling Modes of the Prestressed Element

To determine the buckling modes of compressed prestressed elements, a linear instability FEM simulation was conducted using Abaqus. The same element types as in Section 2 were used for the main members (B32OS), while B32 elements were adopted for the deviators, and a single T2D3 element was assigned to each cable, which is sufficient since cables are straight and carry only axial forces. The same boundary conditions described in Section 2, i.e., bi-articulated supports at the base and restrained displacements/rotations at the loaded head, were adopted here. To account for the prestressing of the cables, the initial prestress T 0 was introduced as an equivalent thermal load. This approach relies on equating the mechanical strain in the cable   ε m with the thermal strain ε t :
ε m = T 0 A C E C = ε t = α C T
which yields the equivalent temperature:
T = T 0 A C E C α C
This technique lets the prestress be modeled in Abaqus by considering T a Predefined Field, as successfully adopted in earlier works by Mahieddine et al. [29,30]. Thus, the critical loads are obtained in two steps: first, a “Static, General” step is performed using the temperatures in Equation (12); a second step, “Buckling” provides the eigenvalues. The meshing and convergence procedure was the same as that described in Section 2.
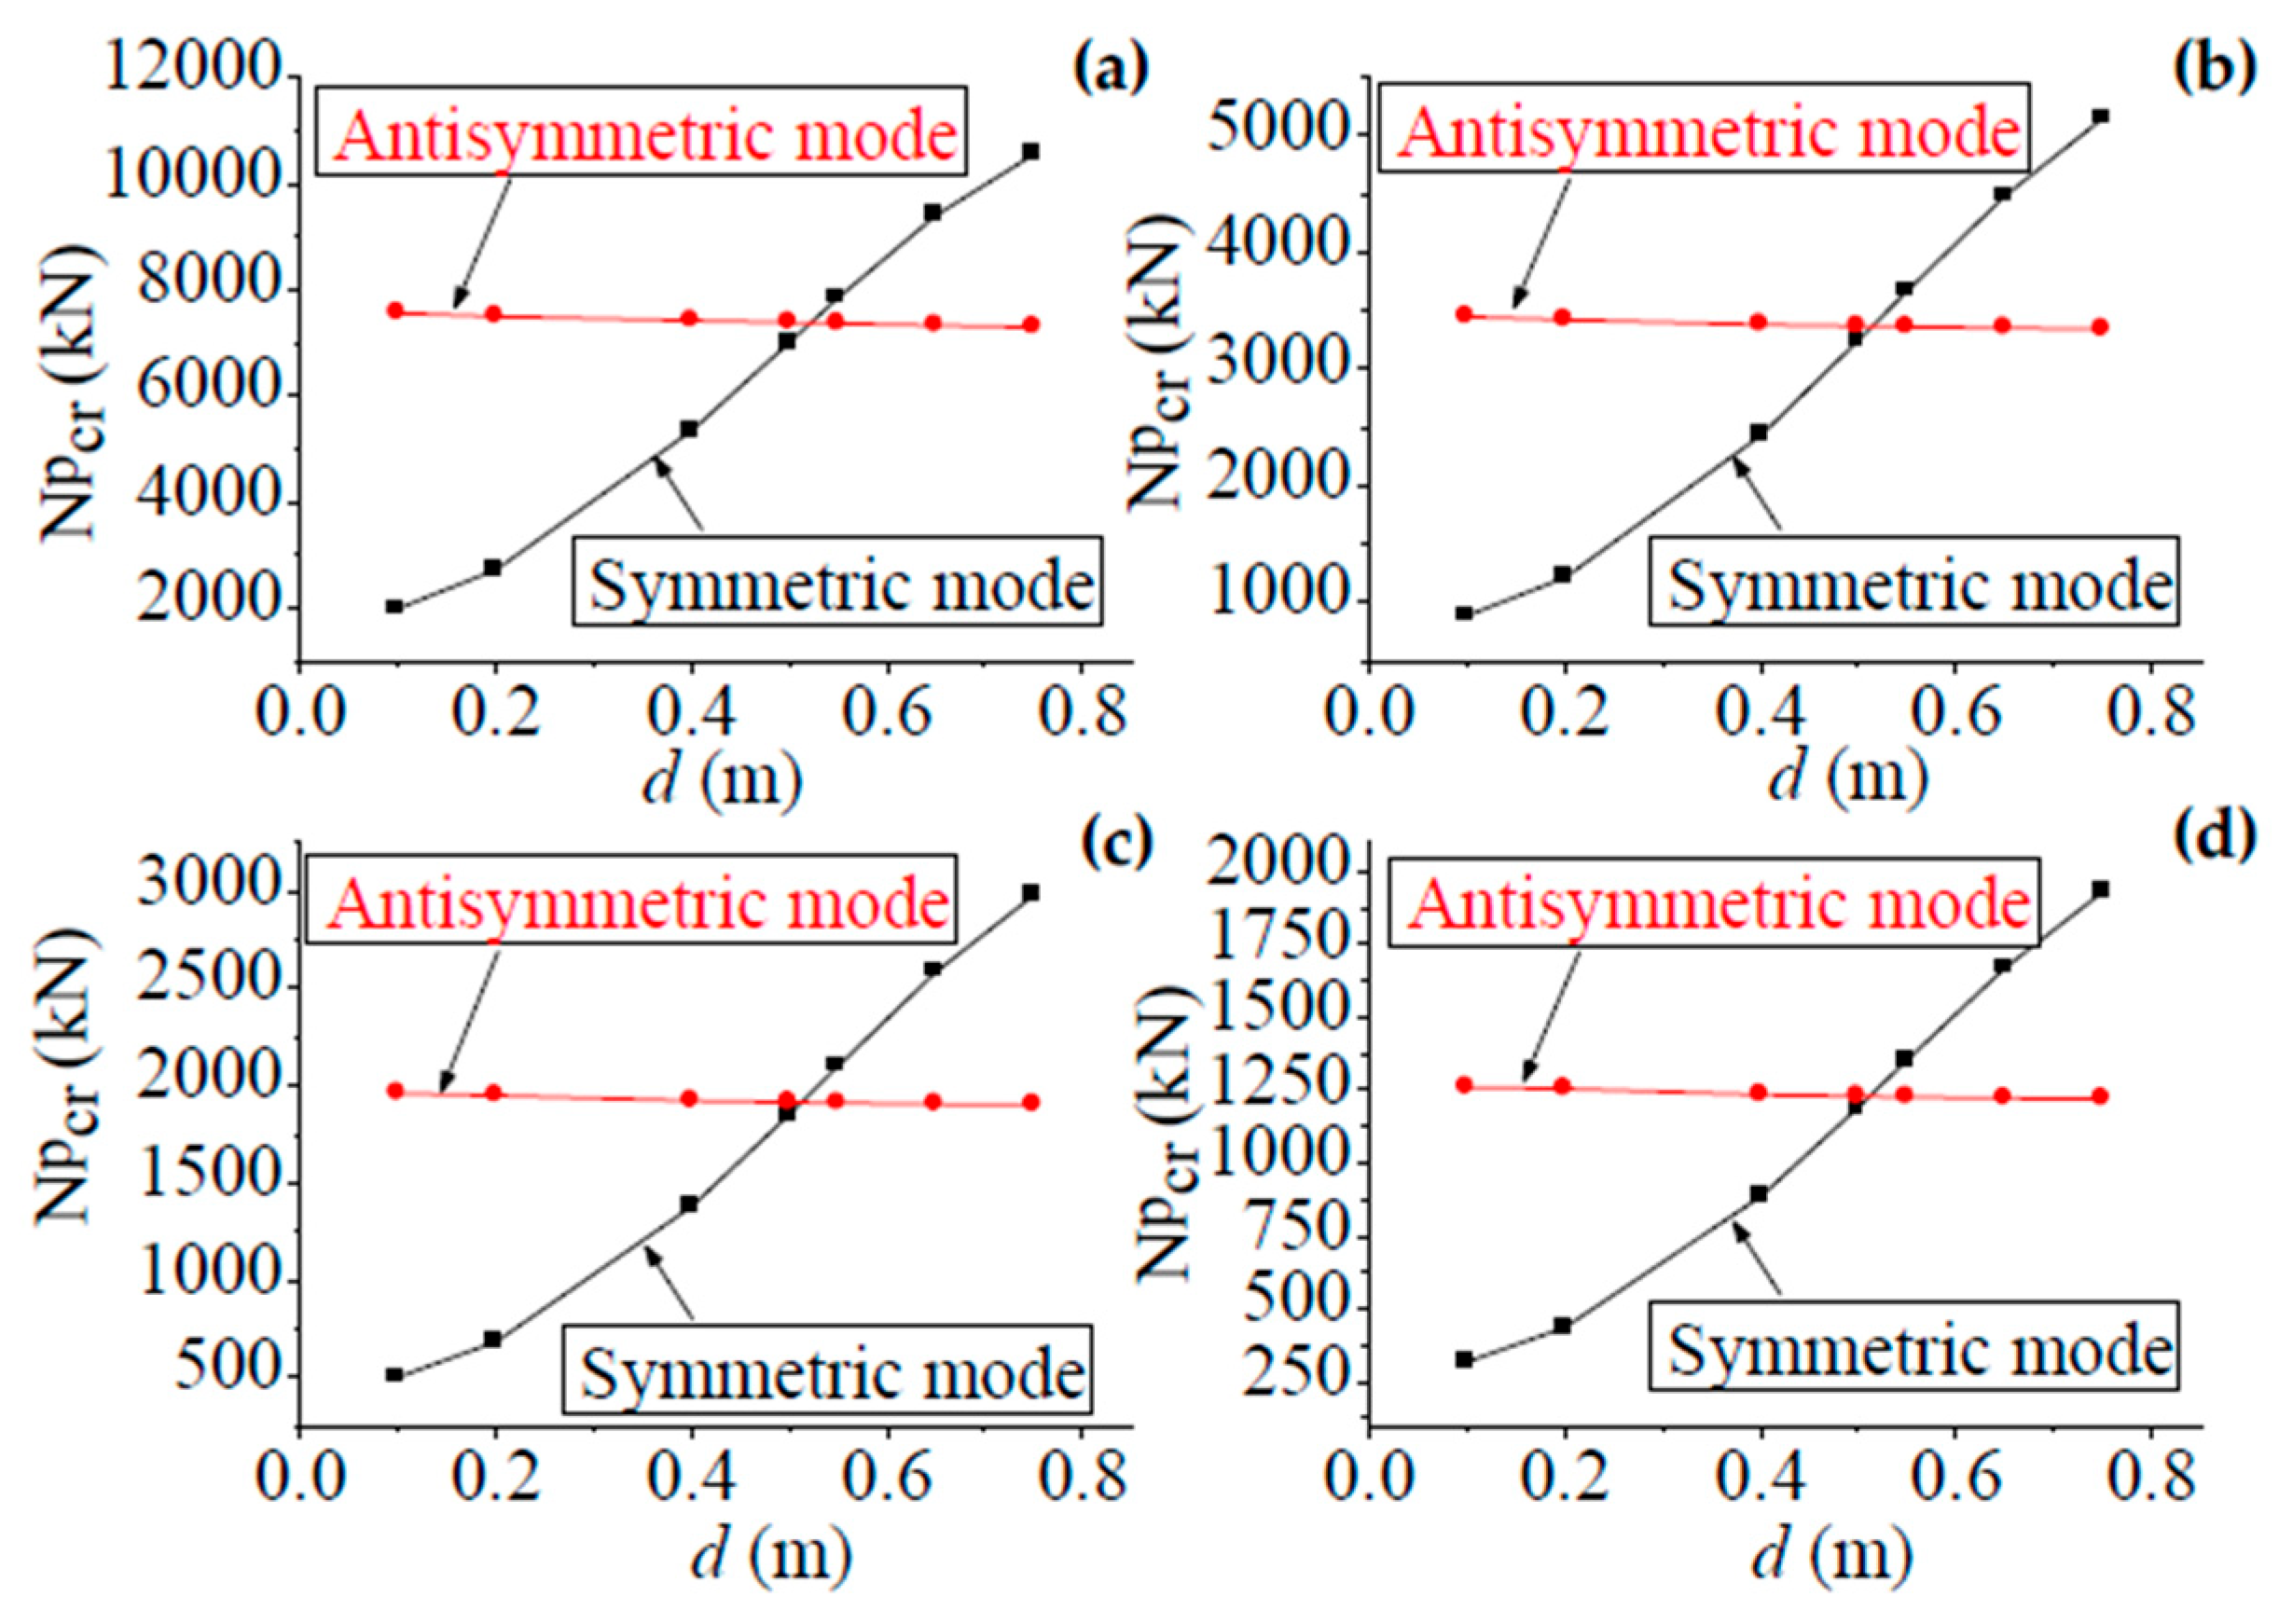
Figure 9 illustrates the evolution of the critical load N c r P for the first two modes of the prestressed elements as a function of the deviator length d . This figure shows that the fundamental mode remains symmetric as long as d is less than the approximate value d 0.53 m. Beyond this value, the fundamental mode becomes antisymmetric.
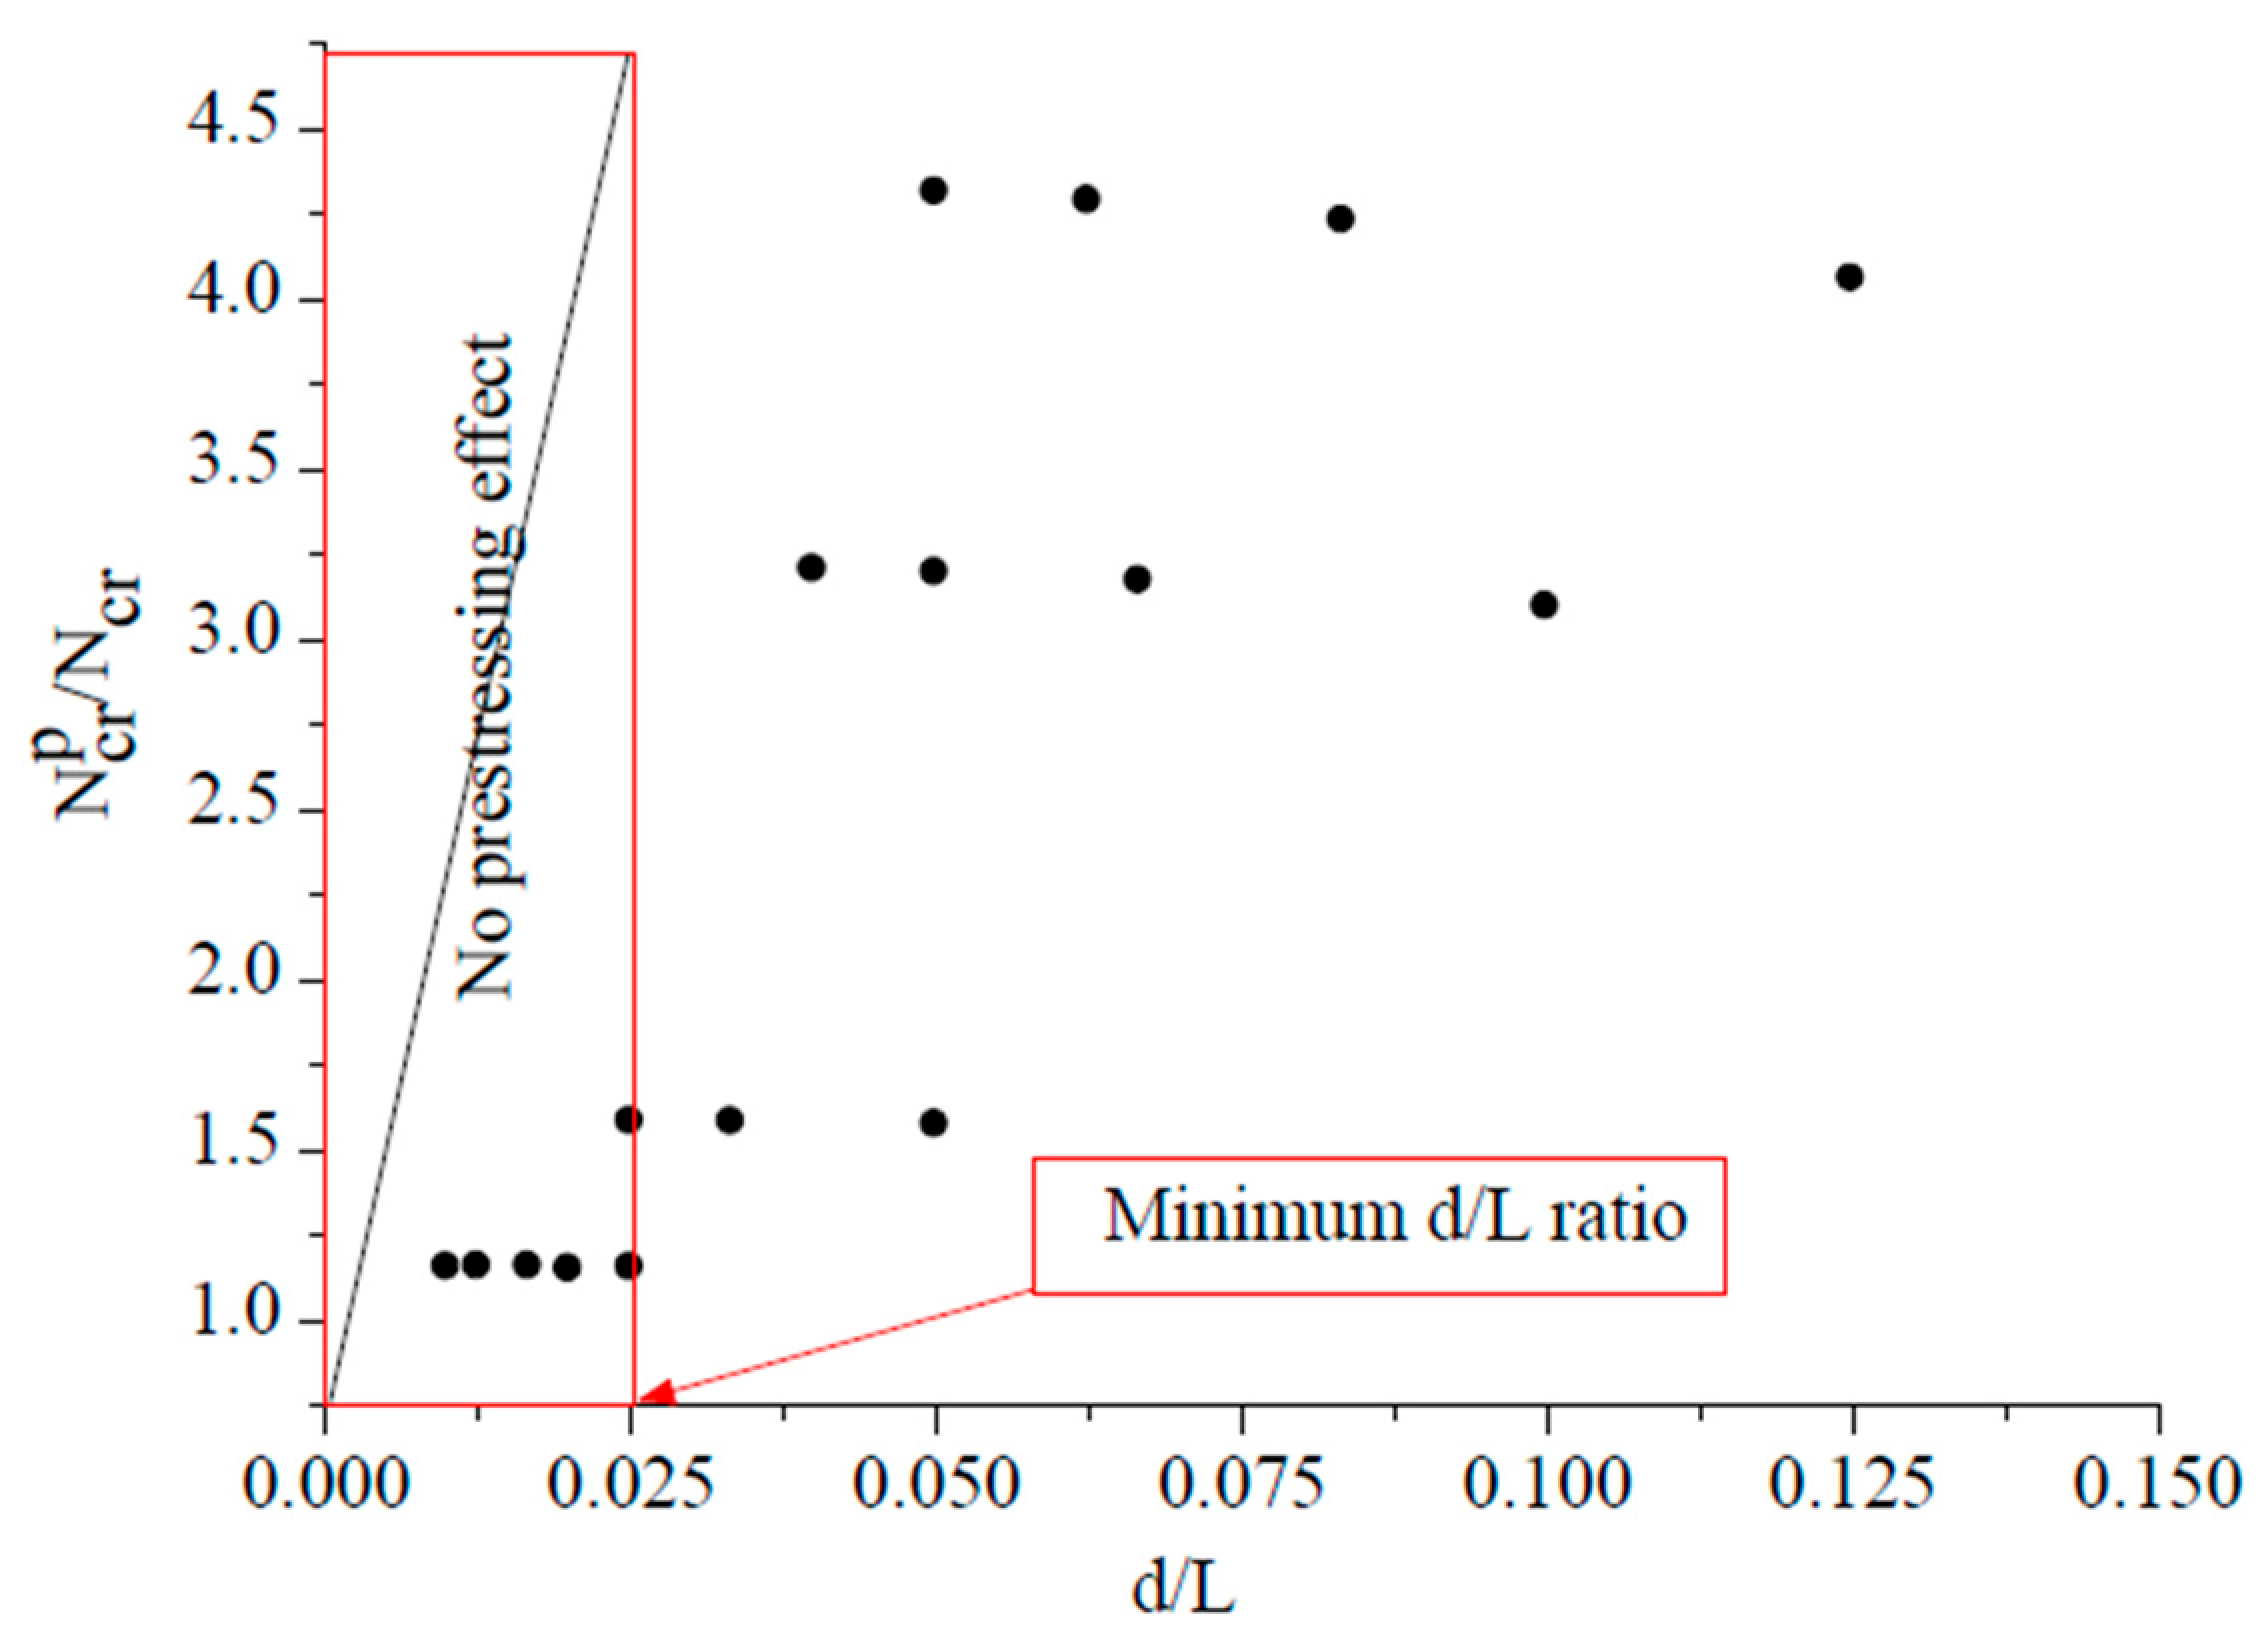
The evolution of the ratio N c r P / N c r with d / L for a prestressed HEA200 element is shown in Figure 10: when d / L 0.025 , the critical load N c r P remains close to that of the same element without prestress, i.e., Euler’s critical load Ncr, and N c r P / N c r 1 .
This behavior is explained by decomposing the cable tension T 1 at the deviator into two components: a vertical and a horizontal force T v , T h (see Figure 11). When the length d L , i.e., d / L [ 0,0.025 ] , the horizontal component T h remains negligible during buckling, thereby minimizing the impact of prestress on the critical load. Note that the boundaries of this interval depend on the geometric and material properties specified in Table 1 and Table 3. In a general case, an optimization study is necessary to refine these values.

3.2. The Effect of Initial Prestressing Force on the Critical Load of the Prestressed Element

Figure 12 illustrates the influence of the initial prestressing force T 0 on the critical load N c r P of a prestressed element, revealing three distinct zones defined by the threshold values T m i n and T m a x . In the first zone, T 0 T m i n , the critical load of the prestressed element N c r P remains identical to Euler’s N c r . In this range, the prestress is primarily consumed by the pre-buckling shortening of the element, making the same prestress ineffective (Ineffective Prestressing Zone). In the second zone, T m i n T 0 T m a x , prestress becomes effective (Effective Prestressing Zone), and to achieve the maximum critical load N c r , m a x P , it is recommended to apply a prestress equal to T m a x . Finally, in the third zone, T 0 T m a x , the critical load surpasses Euler’s load but remains lower than the maximum achievable value N c r , m a x P , thus defining the Unfavorable Prestressing Zone.

3.3. The Effect of Prestress on the Maximum Axial Force of a Prestressed Compressed Element

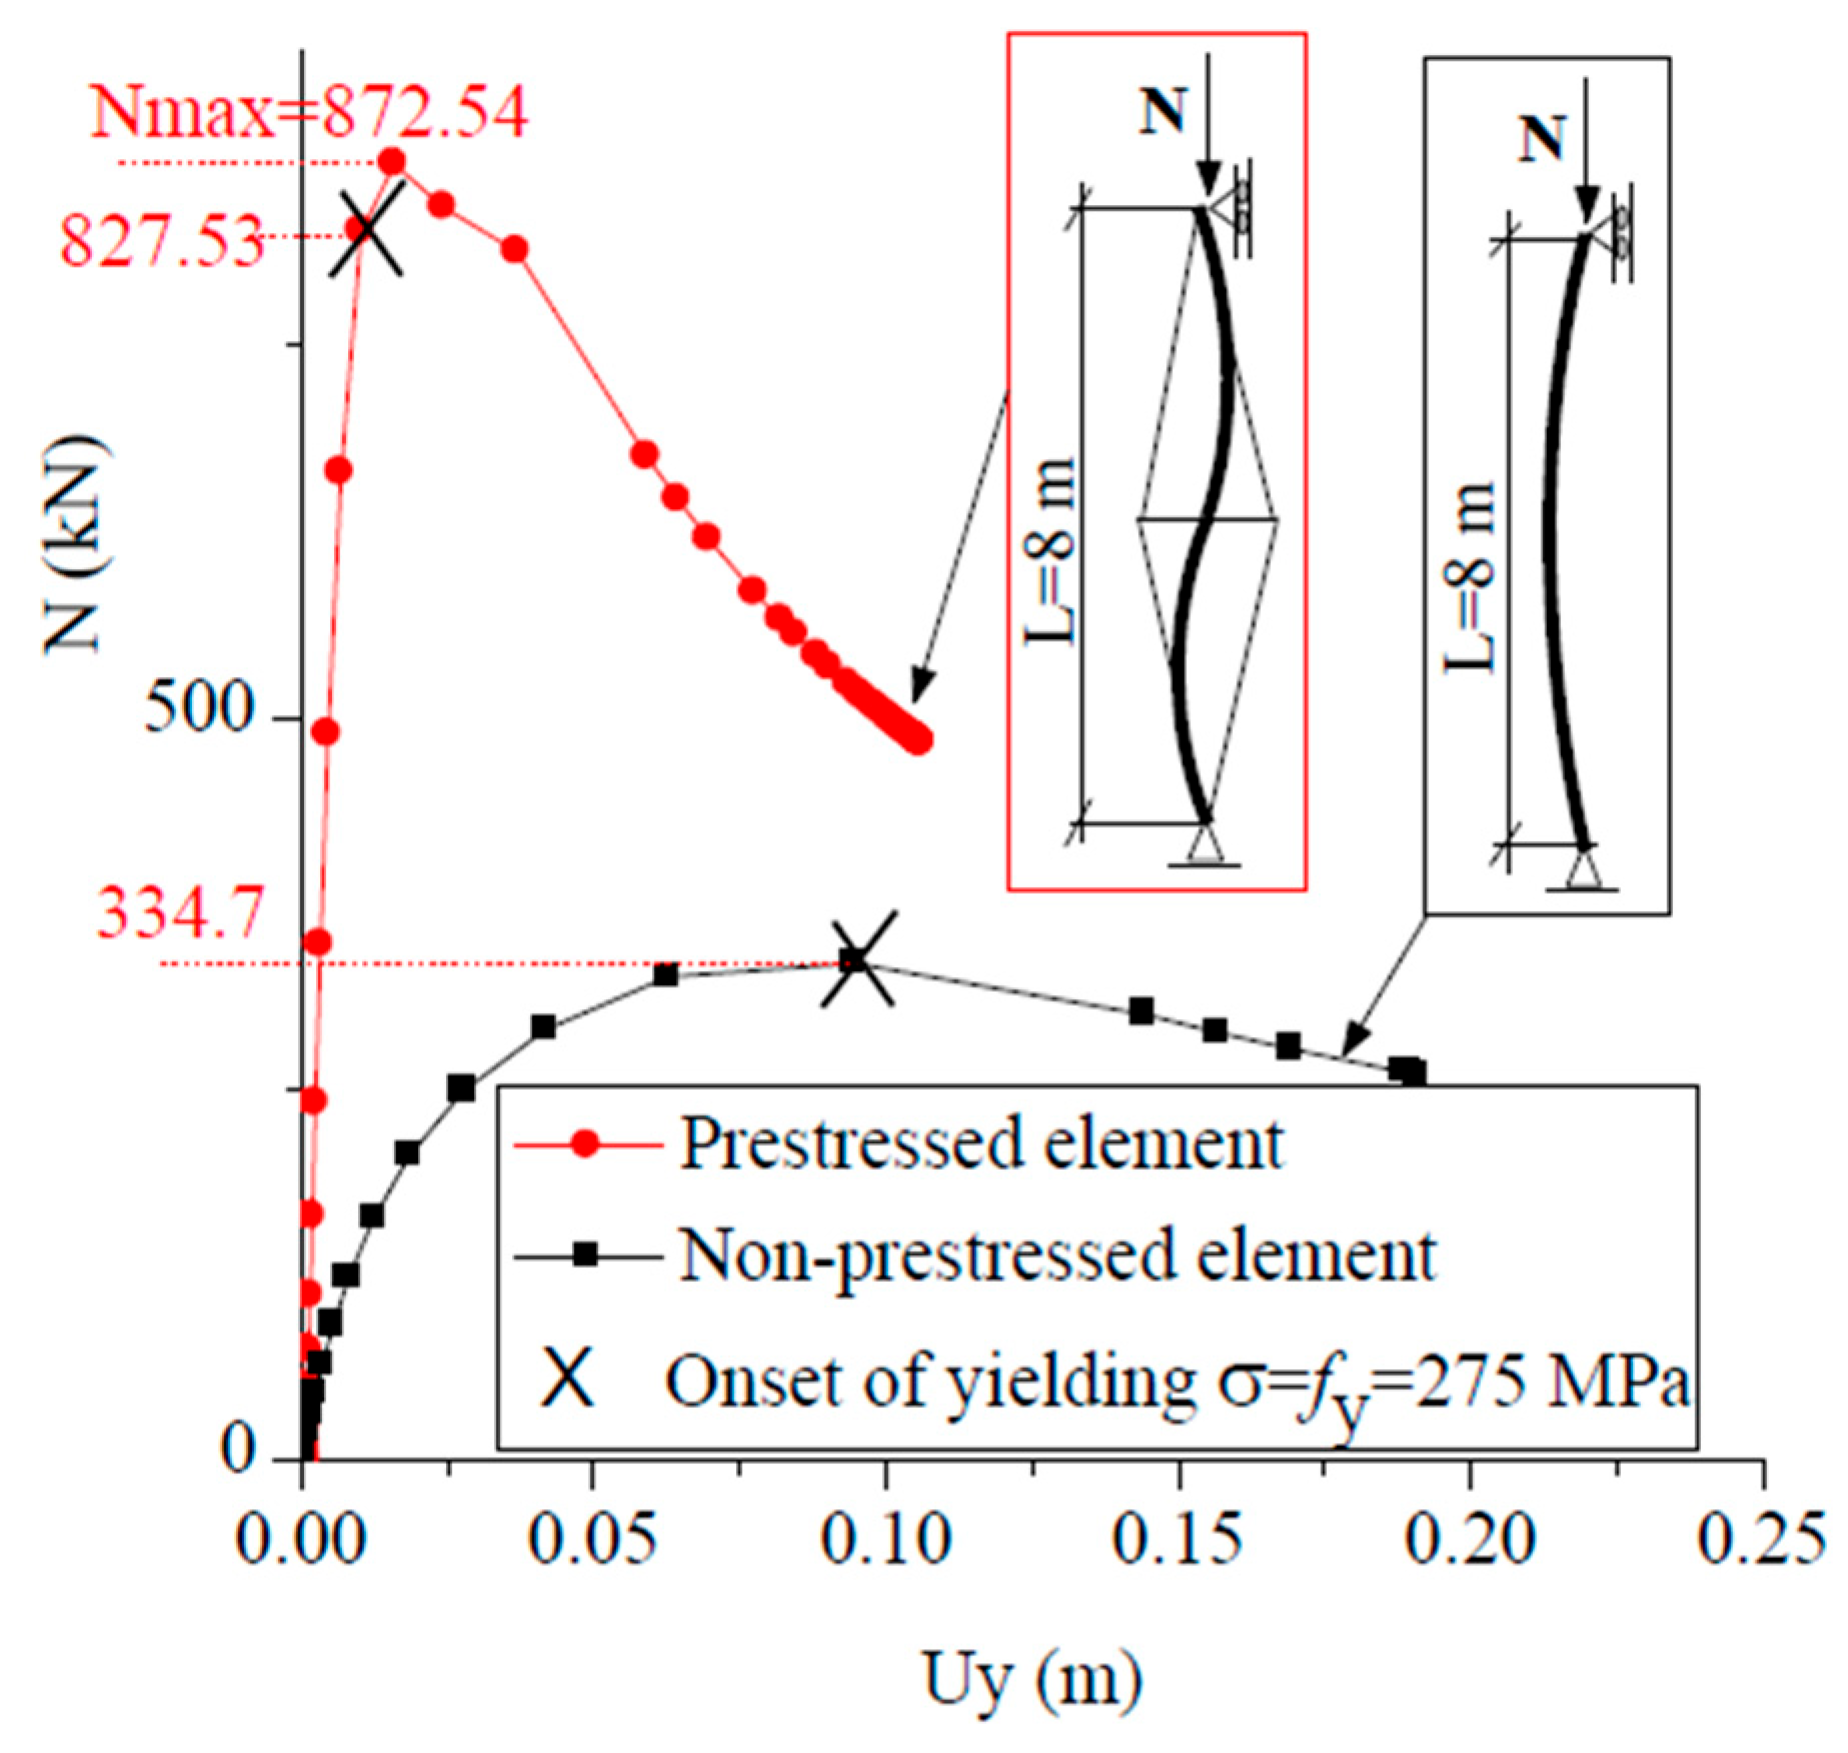
Figure 13, Figure 14, Figure 15 and Figure 16 show the axial force N of a prestressed HEA member as a function of lateral and axial displacements. They are obtained by a GMNIA analysis that follows the same procedure described in Section 2 for the non-prestressed column: it uses finite elements B32OS (quadratic open-section beam) for the main member, B32 (quadratic beam) for the deviators, and T2D3 (3D cable) for the cables. Each of the two stages consists of two steps: the “Predefined Field” step, followed by a mechanical analysis step. In the first stage, a linear buckling analysis (“Buckle”) is performed with the prestress applied as a predefined temperature field to identify the buckling modes. In the second stage, a “Predefined Field” is followed by a nonlinear analysis (“Static Riks”), where the maximum displacement of the buckling mode is scaled according to the initial imperfection δ 0 in Equation (8) to initiate the nonlinear response under prestress.
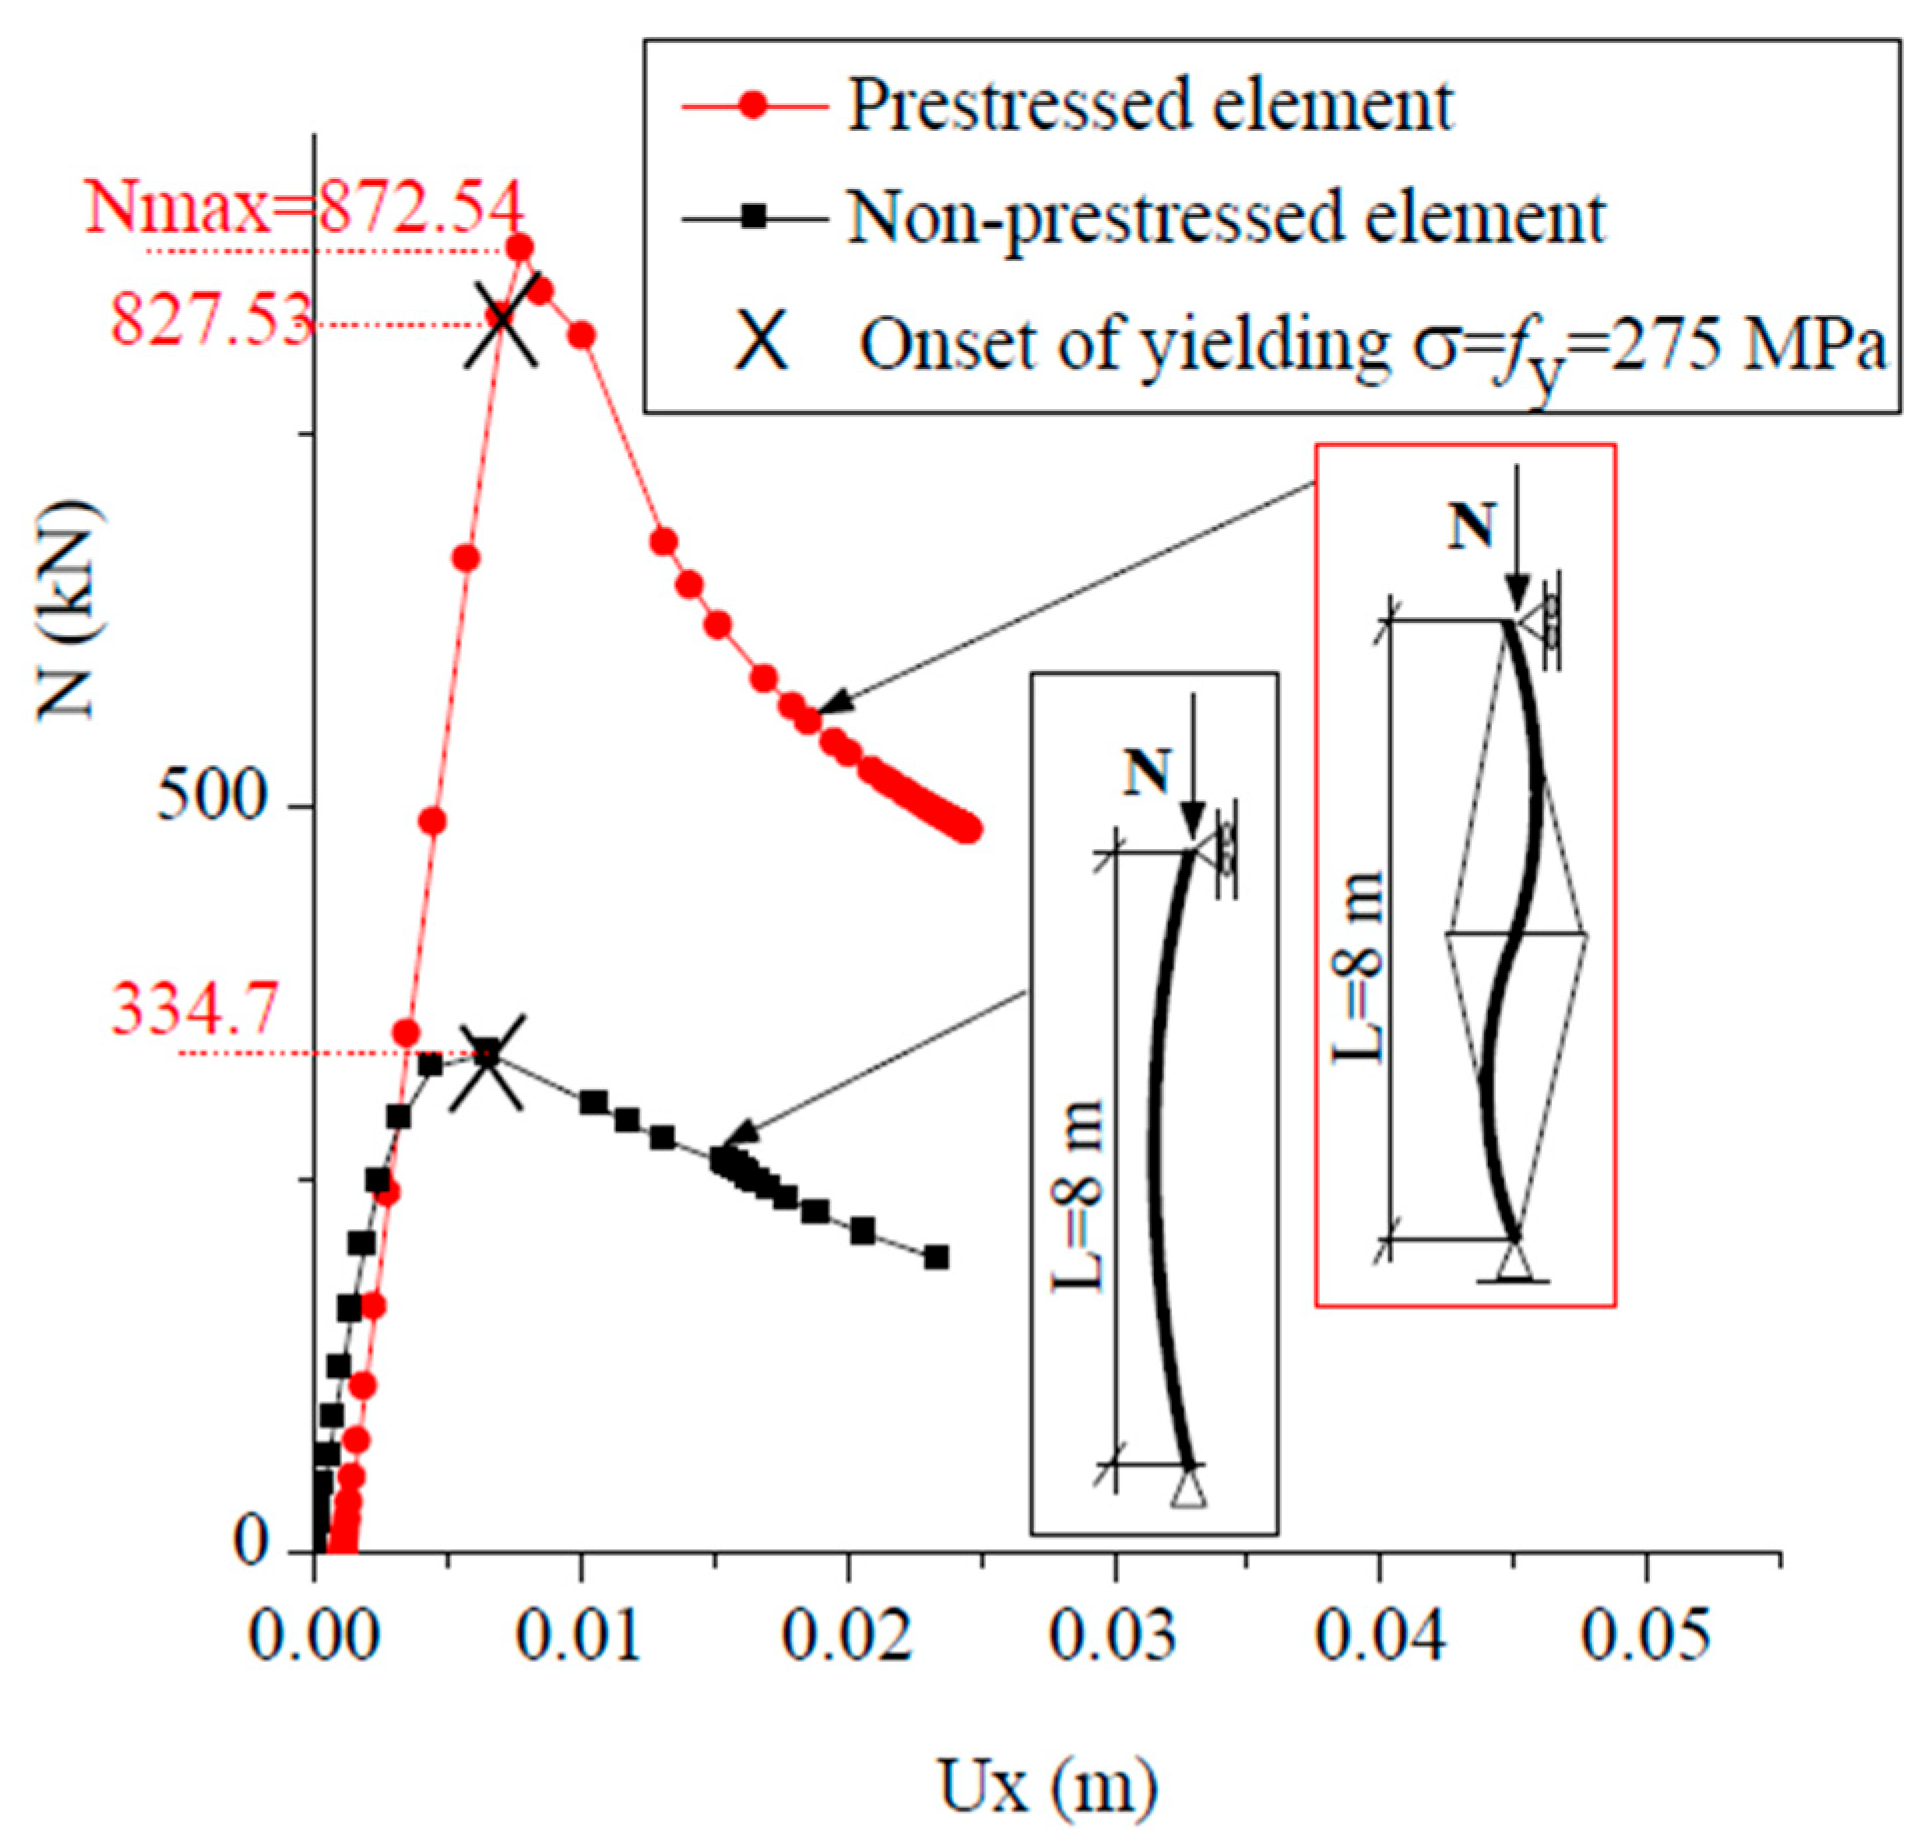
Figure 13 and Figure 14 show that the maximum axial force N m a x of a prestressed element, determined by GMNIA for L = 8  m and d = 0.4  m, is approximately twice that of a non-prestressed element, i.e., 684.42 kN compared to 334.7 kN. When the deviator length d grows to 0.55 m, as shown in Figure 15 and Figure 16, plasticization occurs at N = 827.53 kN, before the element reaches its maximum load. Nevertheless, the maximum load N m a x = 872.54  kN, which is about 2.6 times the capacity of the non-prestressed element, can still be considered, given that the HEA200 cross-section is classified as Class 1 and thus capable of redistributing stresses post-yielding. Note that these results were obtained with an initial prestressing force T 0 = 84.6 kN, corresponding to 0.16   f p r g . In all cases studied, the final prestress associated with the maximum load remains below 0.3 f p r g .
Thus, based on the previous analyses, Figure 17 outlines the full procedure for determining the design resistance N R d of a prestressed compressed element, from the definition of the element properties and deviator length, through the buckling analysis and prestress calibration, to the final nonlinear analysis and stress verification.

4. Effect of Prestress on the Axial Resistance of Rigid Frames

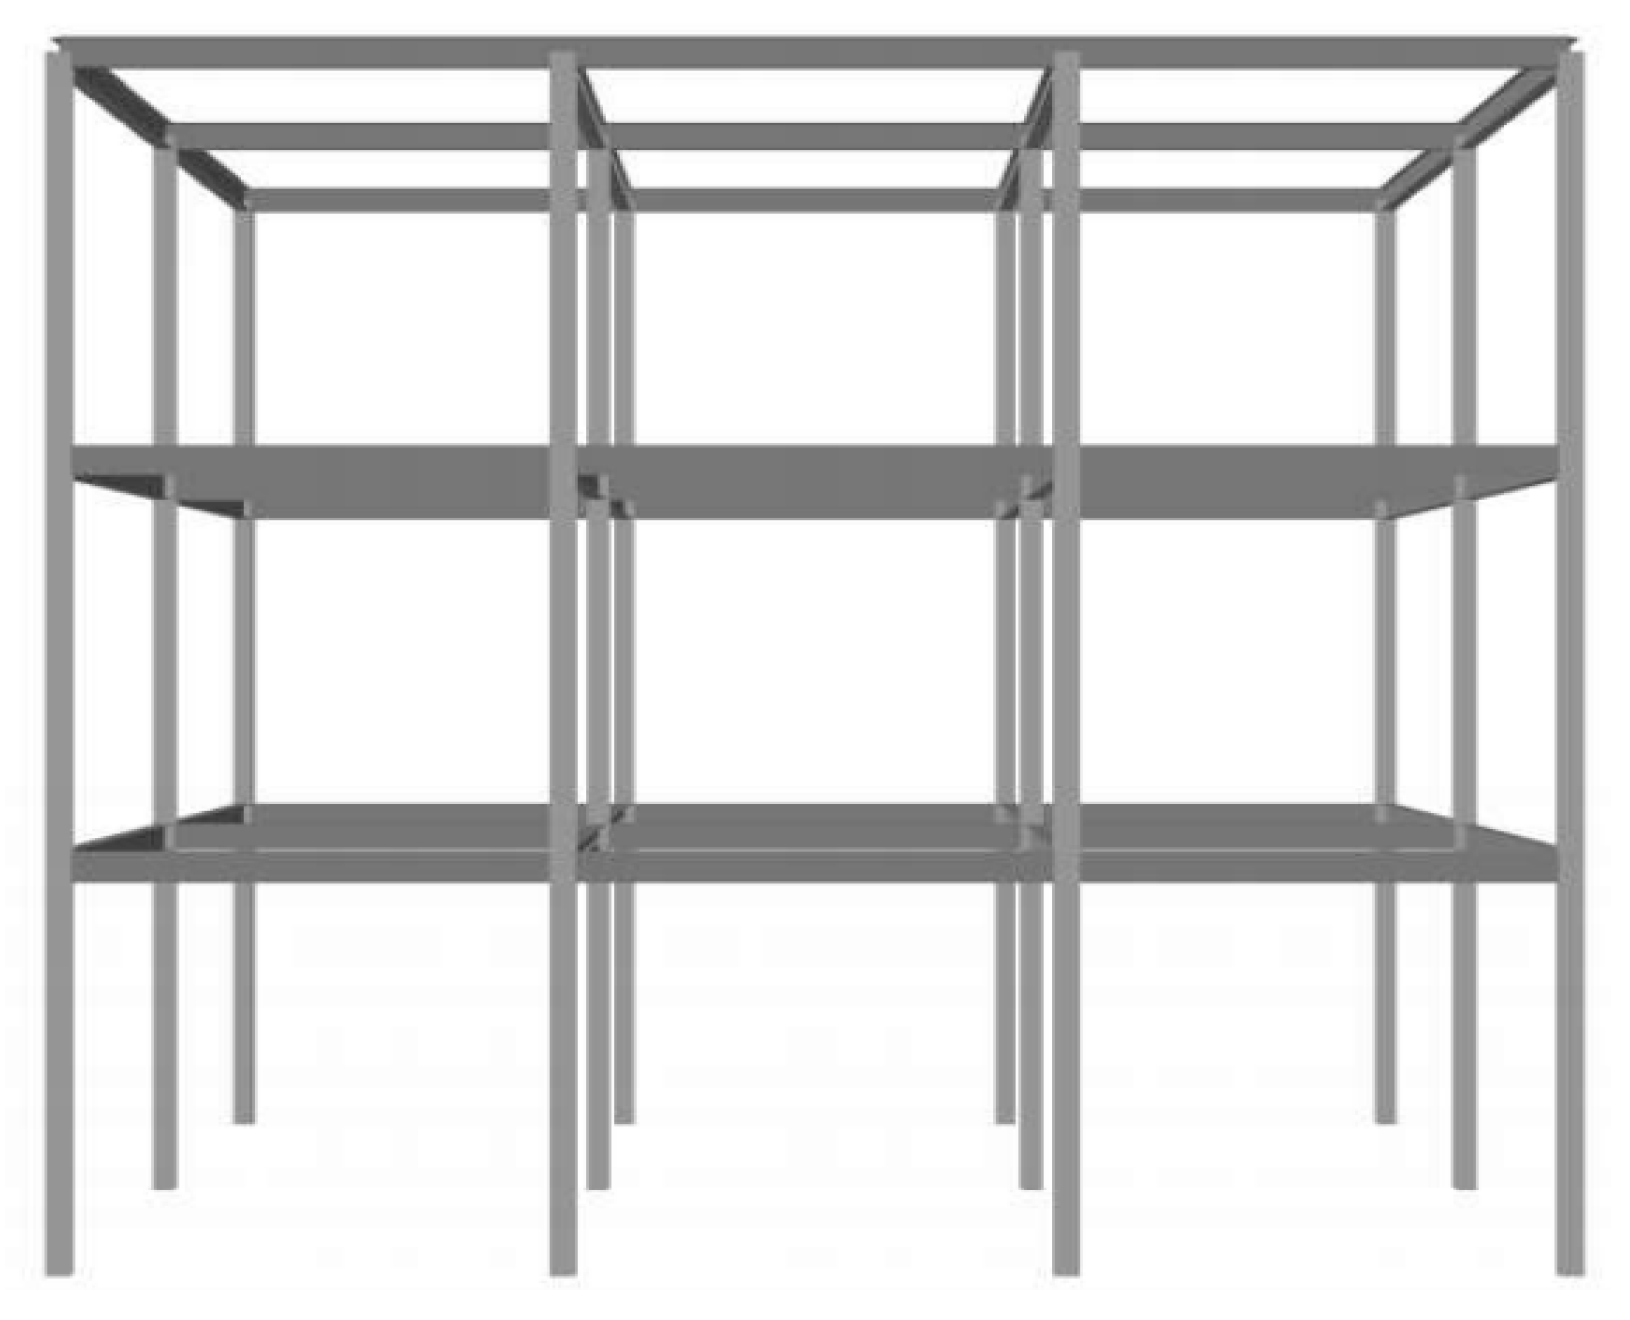
In this section, we investigate the effect of prestress, focusing on the columns of a two-story building subjected only to axial (vertical) force; horizontal actions (wind, seismic) were not considered. A comparative analysis is performed to examine how prestress influences the axial load-bearing capacity of the columns. The GMNIA procedure described in Section 2 was adopted here, consistent with approaches previously used in the literature (e.g., by Xu et al. [32] for short rhombic tubes). This rigid frame was modeled as fixed at the base (U1 = U2 = U3 = UR1 = UR2 = UR3 = 0), with rigid beam–column connections. The prestressing system was represented by cables connected rigidly to the steering devices, ensuring both force transfer and compatibility. It should be noted that this study focuses on the global behavior of the columns; local behavior and the corresponding verification are not addressed here. The data from this analysis are presented in Figure 18, Figure 19 and Figure 20 and Table 4.
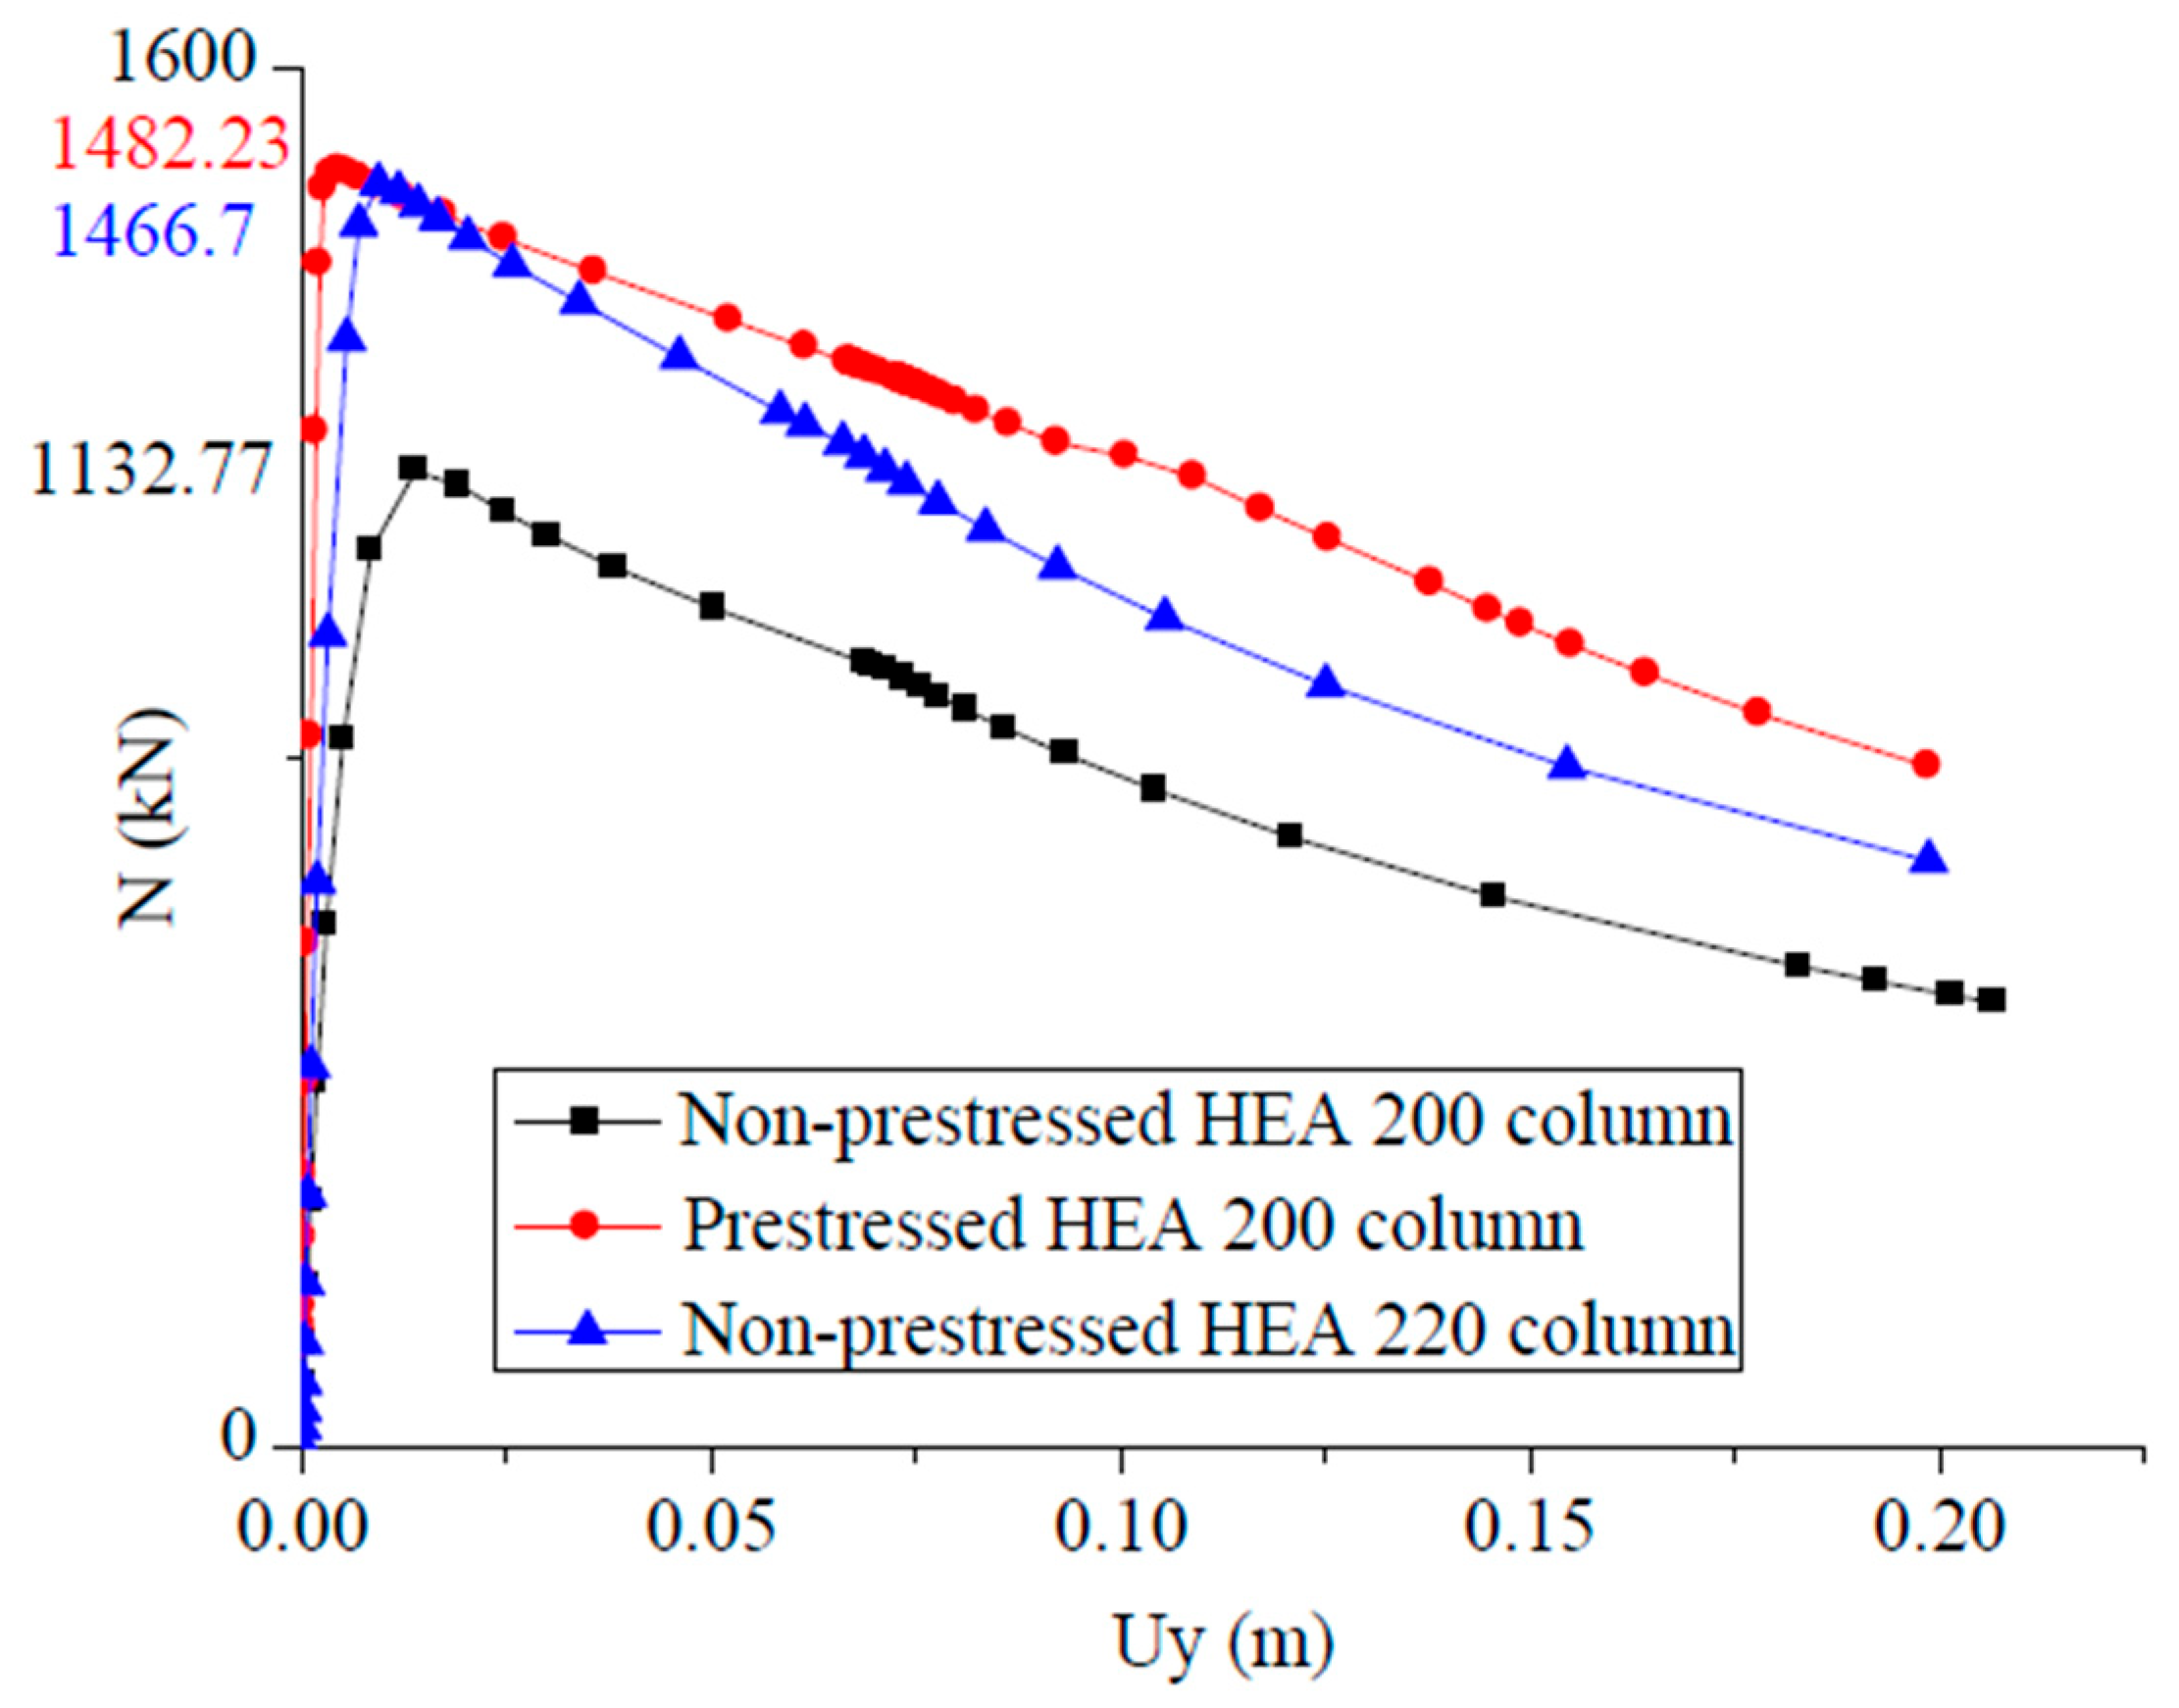
As part of this comparative study, the influence of column selection on the structural strength was analyzed through three distinct configurations, as illustrated in Figure 21. In the first case, the structure was designed with HEA200 columns, capable of resisting a maximum axial force of 1132.77 kN. For example, considering a design axial force N E d estimated at 1400 kN, these columns are found to be insufficient. According to the current standards (i.e., Eurocode-3 and AISC 360), the conventional solution involves increasing the column section. Thus, in the second case, the use of HEA220 columns allows a maximum axial force of 1466.7 kN to be achieved, thereby ensuring greater resistance.
However, an alternative solution was proposed, involving the use of HEA200 columns prestressed with cables. This technique enhances resistance, raising the maximum axial force to 1482.23 kN, a value slightly higher than that achieved with the HEA220 columns. In addition to meeting the required structural performance, this approach offers a significant economic advantage, allowing for a reduction of approximately 1.18 tons of steel.
Further, Figure 22 presents the results obtained by GMNIA for von Mises equivalent stress for the considered frame when base columns are reinforced by prestressing cables. It is apparent that, apart from the better performance against buckling in compression highlighted above and in the previous figure, the proposed technique improves the stress distribution in the frame, once again in favor of an improved performance.
5. Final Remarks

In this paper, we presented a novel formulation of design recommendations for compressed steel columns that is an alternative to the traditional approaches by Ayrton and Perry and in Eurocode 3. Indeed, we proposed an equivalent thermal coefficient that unites the advantages of both the previous approaches, while remaining with simple tools for practical design. Further, with the aim of improving the performances of these structural elements for cross-sections other than the traditional circular hollow one, we proposed considering the application of external prestressing cables to the steel profile. In this paper, we have thus proved the significant impact of prestressing on the strength and stability of compressed elements in structural systems. Through a detailed analysis using GMNIA, it was confirmed that bending stresses become critical for slender elements, limiting their axial load resistance. By incorporating prestressing techniques, particularly with cables, a notable enhancement in the critical load and overall resistance is achieved, proving the effectiveness of this technique. The parametric analysis further highlights the importance of optimizing factors such as deviator length and initial cable tension, which directly influence the efficiency of prestress. These findings were successfully applied to a two-story building structure (R + 2), where prestressed HEA200 columns outperformed their non-prestressed counterparts, offering equivalent strength to HEA220 columns while reducing material usage. This approach not only presents a practical solution for improving structural performance but also provides a cost-effective alternative to traditional reinforcement methods, underscoring the potential for prestressing to revolutionize the design and construction of compression-loaded steel structures. Future developments may consider a) the influence of other geometrical and physical parameters (e.g., the connection of cables and deviators, the possible insurgence of creep and/or relaxation); b) other common profiles from the viewpoint of the numerical investigation; c) the search for funds for a vast experimental campaign.

Author Contributions

Conceptualization, N.Z. and G.R.; methodology, N.Z. and G.R.; software, N.Z.; validation, N.Z. and G.R.; formal analysis, N.Z.; investigation, N.Z. and G.R.; resources, N.Z. and G.R.; data curation, N.Z.; writing—original draft preparation, N.Z.; writing—review and editing, G.R.; visualization, N.Z. and G.R.; supervision, G.R.; project administration, N.Z. and G.R.; funding acquisition, G.R. All authors have read and agreed to the published version of the manuscript.

Funding

this research was funded by the Italian Ministry of University and Research, grants PRIN 2022 2022Y2RHHT_002 and PRIN PNRR P2022ATTAR.

Institutional Review Board Statement

Not applicable.

Informed Consent Statement

Not applicable.

Data Availability Statement

The data in this paper are publicly available or can be derived by the described numerical procedure by the Abaqus commercial code.

Acknowledgments

N. Ziane gratefully acknowledges the hospitality of the Department of Structural and Geotechnical Engineering of ‘Sapienza’ University of Rome. G. Ruta gratefully acknowledges the financial support of the Italian Ministry of University and Research, as above.

Conflicts of Interest

The authors declare that no conflict of interest exists.

References

  1. Euler, L. Sur la force des colonnes. Mémoires L’académie R. Des Sci. Belles Lett. Berl. 1759, 13, 252–282. [Google Scholar]
  2. Ayrton, W.E.; Perry, J. On Struts; The Engineer: London, UK, 1886. [Google Scholar]
  3. Engesser, F. Die Knickfestigkeit gerader Stäbe. Z. Des Archit. Und Ing. Ver. Zu Hann. 1889, 35, 455. [Google Scholar]
  4. Tetmajer, L. Mittheilungen der Anstalt zur Prüfung von Baumaterialen am Eidgenössische Polytechnikum in Zürich Bd; 4: Methode und Resultate; Meyer & Zeller: Zürich, Germany, 1890. [Google Scholar]
  5. von Kármán, T.; Sechler, E.E.; Donnell, L.H. The Strength of Thin Plates in Compression. Trans. ASME 1932, 54, 54–55. [Google Scholar] [CrossRef]
  6. EN 1993-1-1; Eurocode 3 (2005): Design of Steel Structures. European Committee for Standardization: Brussels, Belgium, 2005.
  7. ANSI/AISC 360-22; Specification for Structural Steel Buildings. American Institute of Steel Construction: 2022. Available online: https://www.aisc.org/Specification-for-Structural-Steel-Buildings-ANSIAISC-360-22-Download (accessed on 10 March 2025).
  8. Wen, Y.; Xu, G.; Wu, X.; Li, Z. Performance control analysis of concrete-filled steel tube separated spherical joint wind power tower. Struct. Eng. Mech. 2023, 87, 137–149. [Google Scholar] [CrossRef]
  9. Chen, M.; Cao, Y.; Yao, Y. Axial compressive behavior of high strength concrete-filled circular thin-walled steel tube columns with reinforcements. Struct. Eng. Mech. 2023, 88, 95–107. [Google Scholar] [CrossRef]
  10. Manigandan, R.; Manoj, K. Tests and numerical behavior of circular concrete-filled double skin steel tubular stub columns under eccentric loads. Struct. Eng. Mech. 2023, 88, 287–299. [Google Scholar] [CrossRef]
  11. Xi, Y.-F.; Ren, S.-J.; Chen, B.-L.; Yang, B.; Lee, J.; Zhu, G.-H.; Zhou, T.-C.; Xu, H. Application of Steel-Fiber-Reinforced Self-Stressing Concrete in Prefabricated Pavement Joints. Buildings 2023, 13, 2129. [Google Scholar] [CrossRef]
  12. Andrade, S.A.L.; da Silva Vellasco, P.C.G.; da Silva, J.G.S. Conceição e projeto estrutural do palco principal do Rock in Rio III. Constr. Mag. 2003, 6, 4–11. [Google Scholar]
  13. Andrade, S.A.L.; da Silva Vellasco, P.C.G.; da Silva, J.G.S. Sistema construtivo e montagem estrutural do palco principal do Rock in Rio III. Constr. Mag. 2003, 7, 30–35. [Google Scholar]
  14. Saito, D.; Wadee, M.A. Post buckling behaviour of prestressed steel stayed columns. Eng. Struct. 2008, 30, 1224–1239. [Google Scholar] [CrossRef]
  15. Hoveidae, N.; Ragezy, B. Overall buckling behaviour of all-steel buckling restrained braces. J. Constr. Steel Res. 2012, 79, 151–158. [Google Scholar] [CrossRef]
  16. Takeuchi, T.; Hajjar, J.F.; Matsui, R.; Nishimoto, K.; Aiken, I.D. Local buckling restraint condition for core plates in buckling restrained braces. J. Constr. Steel Res. 2010, 66, 139–149. [Google Scholar] [CrossRef]
  17. Mirtaheri, M.; Gheidi, A.; Zandi, A.P.; Alanjari, P.; Samani, H.R. Experimental optimization studies on steel core lengths in buckling restrained braces. J. Constr. Steel Res. 2011, 67, 1244–1253. [Google Scholar] [CrossRef]
  18. Zhao, J.X.; Wu, B.; Ou, J.P. A novel type of angle steel buckling-restrained brace: Cyclic behaviour and failure mechanism. Earthq. Eng. Struct. Dyn. 2011, 40, 1083–1102. [Google Scholar] [CrossRef]
  19. Guo, Y.L.; Zhang, B.H.; Jiang, Z.Q.; Chen, H. Critical load and application of core separated buckling-restrained braces. J. Constr. Steel Res. 2015, 106, 1–10. [Google Scholar] [CrossRef]
  20. Guo, Y.L.; Zhang, B.H.; Zhu, B.L.; Zhou, P.; Zhang, Y.H.; Tong, J.Z. Theoretical and experimental studies of battened buckling-restrained braces. Eng. Struct. 2017, 136, 312–328. [Google Scholar] [CrossRef]
  21. Zhu, B.L.; Guo, Y.L.; Zhou, P.; Bradford, M.A.; Pi, Y.L. Numerical and experimental studies of corrugated-web-connected buckling-restrained braces. Eng. Struct. 2017, 134, 107–124. [Google Scholar] [CrossRef]
  22. Guo, Y.L.; Tong, J.Z.; Zhang, B.H.; Zhu, B.L.; Pi, Y.L. Theoretical and experimental investigation of core-separated buckling-restrained braces. J. Constr. Steel Res. 2017, 135, 137–149. [Google Scholar] [CrossRef]
  23. Serra, M.; Shahbazian, A.; da Silva, L.S.; Marques, L.; Rebelo, C.; da Silva Vellasco, P.C.G. A full scale experimental study of prestressed stayed columns. Eng. Struct. 2015, 100, 490–510. [Google Scholar] [CrossRef]
  24. Li, P.; Liu, X.; Zhang, C. Interactive buckling of cable-stiffened steel columns with pin–connected crossarms. J. Constr. Steel Res. 2018, 146, 97–108. [Google Scholar] [CrossRef]
  25. Wu, K.; Xing, Z.; Li, H. Nonlinear stability and design of prestressed stayed columns in fire considering non-uniform temperature distribution. J. Build. Eng. 2023, 79, 107807. [Google Scholar] [CrossRef]
  26. Mehdi, A.I.; Zhang, F.; Kim, M.Y. A spatial stability theory of thin-walled steel beams pre-stressed by spatially inclined un-bonded cables and its FE formulation. Thin-Walled Struct. 2024, 194, 111308. [Google Scholar] [CrossRef]
  27. Li, P.; Chu, S.; Qin, S.; Ding, H.; Luo, N.; Yu, Y.; Zhang, T.; Xiong, G. Optimisation of prestressed stayed steel columns based on strengthen elitist genetic algorithm. J. Constr. Steel Res. 2025, 227, 109324. [Google Scholar] [CrossRef]
  28. VV.AA. Abaqus Standard User’s Manual; Version 6.4; Hibbit: Karlsson and Sorensen Inc.: Pawtucket, RI, USA, 2003. [Google Scholar]
  29. Trahair, N.S.; Bradford, M.A.; Nethercot, D.A.; Gardner, L. The Behaviour and Design of Steel Structures to EC3, 4th ed.; Taylor & Francis: New York, NY, USA, 2008. [Google Scholar]
  30. Mahieddine, A.; Ziane, N.; Ruta, G.; Zahi, R.; Zidi, M.; Meftah, S.A. Stability of prestressed steel I beams subjected to fire. Struct. Eng. Mech. 2024, 92, 53–64. [Google Scholar] [CrossRef]
  31. Mahieddine, A.; Ziane, N.; Ruta, G.; Zahi, R.; Zidi, M.; Meftah, S.A. Lateral–Torsional Buckling of Externally Prestressed I-Section Steel Beams Subjected to Fire. Civil Eng. 2024, 5, 1110–1134. [Google Scholar] [CrossRef]
  32. Xu, B.; Wang, L.; Liu, Q.; Wang, R.; Kong, B.; Xu, B. A Method for the Coefficient Superposition Buckling Bearing Capacity of Thin-Walled Members. Buildings 2024, 14, 3236. [Google Scholar] [CrossRef]
Figure 1. Deformed shape and cross-section of a compressed element.
Applsci 15 10826 g001
Figure 2. Stress–strain curve of an elastic–perfectly plastic S275 steel.
Applsci 15 10826 g002
Figure 3. Axial load N vs. axial displacement U x , compressed HEA200 column, L = 2 m, GMNIA.
Applsci 15 10826 g003
Figure 4. Axial load N vs. axial displacement U x , compressed HEA200 column, L = 10 m, GMNIA.
Applsci 15 10826 g004
Figure 5. Axial load N vs. lateral displacement U y , compressed HEA200 column, L = 2 m, GMNIA.
Applsci 15 10826 g005
Figure 6. Axial load N vs. lateral displacement U y , compressed HEA200 column, L = 10 m, GMNIA.
Applsci 15 10826 g006
Figure 7. Evolution of compressive stresses σ C and bending stresses σ F as a function of length L and slenderness λ for a simply supported compressed HEA200 element.
Applsci 15 10826 g007
Figure 8. Different stage configurations of a prestressed element: (a) main element with deviator in the initial state; (b) prestressed element; (c) deformed shape of a loaded prestressed element; (d) cross-section at mid-span with deviators; (e) cross-section of the deviator.
Applsci 15 10826 g008
Figure 9. Evolution of the critical load N c r P for the first two modes of an HEA200 column prestressed by T0 = 6 kN with the length of the deviator d: (a) L = 4 m; (b) L = 6 m; (c) L = 8 m; (d) L = 10 m.
Applsci 15 10826 g009
Figure 10. Evolution of the ratio N c r P / N c r vs. the ratio d / L for a prestressed HEA200 element.
Applsci 15 10826 g010
Figure 11. Shapes of a prestressed compressed element: (a) symmetric and (b) antisymmetric mode.
Applsci 15 10826 g011
Figure 12. Effect of the initial prestress T 0 on the critical load of a prestressed element: (a) general case; (b) case of an HEA200 section with d / L =0.066.
Applsci 15 10826 g012
Figure 13. Axial force vs. lateral displacement by GMNIA for prestressed and non-prestressed elements, L = 8 m, d = 0.4 m.
Applsci 15 10826 g013
Figure 14. Axial force vs. axial displacement by GMNIA for prestressed and non-prestressed elements, L = 8 m, d = 0.4 m.
Applsci 15 10826 g014
Figure 15. Axial force vs. lateral displacement by GMNIA for prestressed and non-prestressed elements, L = 8 m, d = 0.55 m.
Applsci 15 10826 g015
Figure 16. Axial force vs. axial displacement by GMNIA for prestressed and non-prestressed elements, L = 8 m, d = 0.55.
Applsci 15 10826 g016
Figure 17. Procedure for determining the design resistance N R d of a prestressed compressed element.
Applsci 15 10826 g017
Figure 18. Rigid two-story frame.
Applsci 15 10826 g018
Figure 19. Rigid two-story frame reinforced by prestressing cables (added in blue here).
Applsci 15 10826 g019
Figure 20. Planar view of the framed structure.
Applsci 15 10826 g020
Figure 21. Axial force vs. lateral displacement of the central ground floor column.
Applsci 15 10826 g021
Figure 22. Rigid two-story frame reinforced by prestressing cables after GMNIA.
Applsci 15 10826 g022
Table 1. Geometric and material properties of the HEA200 profile.
b (mm) h (mm) t f (mm) t w (mm) A (mm2) W e l (mm3) E (GPa)fy (MPa)
200190106.505235133,600210275
Table 2. Comparison between the peak load N m a x from GMNIA (with equivalent imperfection, Equation (8)) and the design resistance N R d obtained from Eurocode 3 (Equation (6)) and from Ayrton–Perry (Equation (5)) with different assumed initial imperfections δ 0 for a non-prestressed HEA200 column. The values in brackets give the percentage difference with respect to GMNIA.
L (m) N m a x , kN, GMNIA with Equation (8) N R d , kN
Eurocode3 with Equation (6)
N R d , kN, Ayrton–Perry with Equation (5)
δ 0 = L 200 δ 0 = L 400 δ 0 = L 600 δ 0 = L 1000
2.001309.271248.23
(−4.80)
987.97
(−32.52)
1165.11
(−12.37)
1241.91
(−5.42)
1312.65
(0.26)
10.00225.58224.37
(−0.54)
192.81
(−17.00)
226.13
(0.24)
240.40
(6.16)
253.46
(11.00)
Table 3. Properties of deviator and cables.
Deviator φd (mm)hd (mm)E (GPa)fy (MPa)
2 × 15100210275
Cable
T15S
φc (mm)Ac (mm2)αc (C−1)Ec (GPa)fprg (MPa)
2 × 15.72 × 15010−52001770
Table 4. Geometrical and material properties of the structural elements.
ElementType L (m) d (m) E (GPa) f y (MPa) f p r g (MPa)
ColumnsHEA200, HEA2204-210275-
Primary beamsIPE3006-210275-
Secondary beamsIPE3004-210275-
DeviatorIPE300-0.5210275-
CableT15S8.075-200-1770
Disclaimer/Publisher’s Note: The statements, opinions and data contained in all publications are solely those of the individual author(s) and contributor(s) and not of MDPI and/or the editor(s). MDPI and/or the editor(s) disclaim responsibility for any injury to people or property resulting from any ideas, methods, instructions or products referred to in the content.