Article

Development of Numerical Models of Degraded Pedestrian Footbridges Based on the Cable-Stayed Footbridge over the Wisłok River in Rzeszów

by
Dominika Ziaja
1,* and
Ewa Błazik-Borowa
2
1
Department of Structural Mechanics, Rzeszow University of Technology, ul. Poznańska 2, 35-084 Rzeszów, Poland
2
Faculty of Civil Engineering and Architecture, Lublin University of Technology, Nadbystrzycka 38D, 20-618 Lublin, Poland
*
Author to whom correspondence should be addressed.
Appl. Sci. 2025, 15(19), 10798; https://doi.org/10.3390/app151910798
Submission received: 29 August 2025 / Revised: 30 September 2025 / Accepted: 1 October 2025 / Published: 8 October 2025
(This article belongs to the Special Issue Advanced Structural Health Monitoring in Civil Engineering)

Abstract

This article aims to perform system identification of a nearly 30-year-old cable-stayed steel footbridge over the Wisłok River in Rzeszów (Poland). The design documentation of the bridge has been lost, and since its construction, the footbridge has been subject to renovations. The structure is highly susceptible to pedestrian traffic, and before any actions are taken to improve the comfort of use, it is necessary to create and validate a numerical model and assess the force distribution in the structure. Models are often built as mappings of an ideal structure. However, real structures are not ideal. The comparison of numerical and measured data can allow for an indication of potential damage areas. Two main purposes of the article have been formulated: (1)Development of a numerical model of an old footbridge, whose components have been degraded due to long-term use. Changes, compared to the ‘original’, focused on elongation of the cables due to rheology and a decrease in their tension. (2) Demonstrate the challenges in modeling and validating this type of bridge. In the article, the result of the numerical simulation (Finite Element Method and Ansys2024 R2 was applied, the verification was made in RFEM6) for models with different boundary conditions and varied pre-tension in cables was compared with the results of static and dynamic examination of a real object. The dynamic tests showed an uneven distribution of pre-tension in cables. The ratio of the first natural frequencies of inner cables on the north side is as high as 16%. The novelty demonstrated in the article is that static tests are insufficient for proper system identification; the same value of vertical displacement can be obtained for a selected static load, with varied tension in cables. Therefore, dynamic testing is essential. Full model updating requires a multicriteria approach, which will be made in the future.

1. Introduction

The maintenance of existing civil engineering structures in good condition, especially important ones like bridges, is a necessity from the point of view of safe usage. Despite this awareness, ensuring safety is difficult due to the cost of maintenance, inspections, and repairs. As shown in [1] many structures should be withdrawn from use and dismantled. In practice, however, these structures are still in use, accepting the risk of failure or disaster, which is reported by the media from time to time.
The condition monitoring of the structure is still a complicated and expensive process. It requires the selection of suitable measurement techniques, which can operate on the structure under normal exploitation (non-destructive testing, NDT). In the case of permanent attachment of sensors, continuous data recording and evaluation, the structural health monitoring (SHM) systems are considered. Due to the high costs of SHM systems implementation, only the most important, large, and complex structures are equipped with them [2,3]. One of the phenomenon widely used in SHM are vibrations [2,4,5,6,7,8], especially in low frequencies. Vibration-based global monitoring techniques were described by Yon and Min in [9]. Typical sensors used for these measurements are accelerometers. They can be connected to the recording unit with cables or work wirelessly. As an alternative to dedicated laboratory equipment, smartphones are used more and more often [10].
Three main approaches for damage detection based on vibration analysis are used, namely studying changes in the following: (1) natural frequencies [11,12,13], (2) natural frequencies and forms [14,15], and (3) the shape of the frequency response function (FRF) [16]. Despite many researchers showing that changes in natural frequencies of vibrating structures are correlated with damage [14,16], they are also dependent on environmental factors (e.g., temperature) [11,12,17], and in the case of local, small-sized damage, insensitive [15]. Rudzik et al. showed that in the case of local damages, global natural frequencies did not vary significantly; instead, new local modal shapes appeared. In this context, the location of sensors is crucial. The optimization of data that can be obtained in itself is a separate scientific problem [18,19,20,21]. Tan and Zhang [19] formulated the problem, possible evaluation criteria, and compiled the accessible methods. Regardless of the optimization method (genetic algorithms, modal strain energy, particle swarm optimization, etc.), the process needs the numerical model of the structure.
As time passes, materials degrade and change their properties, which influences the behavior of structures [22]. Many objects were built in the past centuries or decades [23], and lack numerical models that can be used to predict their behavior under today’s conditions [24]. The technical documentation of some of them is also lost [25]. In such cases, maintenance decisions first require additional activities related to system identification [4].
Footbridges are a special type of structure. Among the static systems used in footbridges, the following can be distinguished: beam [26,27], arch [4], cable-stayed [26], or suspension structures [28]. Many of them are long-span. Taking into account the main construction material, footbridges are made from steel [27], wood [29], reinforced concrete [30], as well as Glass Fiber Reinforced Polymers (GFRPs) [22], and their combinations [31]. They are mainly the lightweight and slender objects, for which dynamic phenomena cannot be ignored.
In addition to loads caused by gravity or environmental conditions (temperature [32], wind [28] ), footbridges must carry loads generated by their users. Dynamic loads generated by pedestrians or runners are typical for footbridges [32,33] and have to be taken into account in the design and assessment process of these facilities. Humans interact with the vibrating structure, both exciting the vibrations and reacting to them [34,35,36]. Their mass changes the properties of footbridges, making them part of the whole system rather than only an external load [28,37,38].
In recent years, research on human-induced vibrations and human–structure interaction has become both popular and necessary. Excessive vibrations not only cause user discomfort but can also lead to potential structural fatigue and damage. Bedon et al. [39] used the spring-mass-damper to model the pedestrian-induced loading. The results obtained using this model match the in situ tests on cable-stayed steel–concrete composite bridge. Vertical human-induced vibration was modeled by Li et al. [30] based on the statistical data collected during observation of pedestrian movement on the suspension footbridge. The parameters used in the model were as follows: the step frequency, step length, and walking velocity. The vertical walking force induced by a single pedestrian was the subject of study shown in [40]. One of the conclusions from this paper is the necessity of accounting for the variability in human walking for a proper assessment of the structure’s vibration response. Chen et al. [41] studied the mechanism of lateral pedestrian–footbridge interaction. They pointed out that the response amplitude depends on the ratio between pedestrian mass and footbridge mass and varies with different pedestrian walking frequencies. Other examinations of the lateral vibration of slender footbridges are shown in [42]. The authors proposed a method that, based on a frequency domain approach, allows for the estimation of the lateral response of slender footbridges under critical crowded density. This is the loading case in which the auto-induced component of the load must be included. The description of the crowd’s influence on the footbridges can also be found in [43]. It is worth noting that people in crowds behave differently than individuals [44], especially when their movement is restricted.
Many existing pedestrian bridges do not meet serviceability criteria under dynamic pedestrian loads [45]. Pedestrian-induced footbridge vibration, as shown in [46], leads to feelings of discomfort and insecurity. Seeing inconsistencies in serviceability assessments in traditional evaluation methods, researchers try to find objective ones [47].
The limitation of human-induced vibration can and should be addressed at the design stage by properly shaping the structure and adjusting its stiffness and/or mass. An example of such an approach, where two variants of fiber-reinforced polymer cable-stayed pedestrian bridges were discussed based on data from numerical simulation, is shown in [48]. The problem of resonance induced by human walking in footbridges with deck slabs made with reinforced concrete and GFRP was discussed in [26]. Shifting the lowest natural frequency of the object above 5 Hz (which is the limited value for the footbridges) in the case of GFRP slab was observed. However, it did not guarantee resonance avoiding.
In the case of exceeding the permissible vibrations in existing structures under operation, some modifications are still possible. In [27] it is shown that the addition of non-structural elements, e.g., vinyl flooring, can increase damping ratios, thus reducing the vibration. The lack of usage comfort due to vibrations can be reduced with dampers, e.g., tuned mass damper (TMD) [49]. However, all structure modifications should be preceded by thorough analysis and numerical simulations.
The most popular method for numerical modeling of pedestrian bridges is the Finite Element Method (FEM). Today’s hardware and software enable building the numerical models for static, dynamic, and transient analysis of even complicated structures. The FEM models were used in [31] for both the global analysis of timber–steel footbridge and its separated components. The authors pointed out that adopted joint stiffness parameters are crucial in dynamic behavior analysis.
Numerical models are simplifications of reality and often use the ideal geometry, boundary conditions, and material properties. In reality, all properties can vary, and a combination of these variations affects discrepancies between models and structural response. Each model has to be validated. In the case of footbridges, the validation is made based on data obtained in static and dynamic tests [4]. Different measurement techniques are used for dynamic tests, as described in [50]. The authors showed their advantages and disadvantages and the types of data that can be obtained. The simplest and, at the same time, the most popular technique is the acceleration measurement. The recorded signals can be analyzed in the time and frequency domains to obtain parameters such as natural frequencies, damping ratios, and, with appropriate measurement configuration, natural forms.
Examples of model validations for different footbridges based on data from dynamic measurements can be found in [24,26,29,51,52]. Modeling of the structure is a difficult process; it often requires finding the parameters crucial for the structure’s behavior and their updating [53,54]. However, a model with satisfactory agreement with reality can be used for predicting human–structure interaction [22], prediction of structure response in the case of extraordinary loading [32], and structure diagnostics [45,53,55].
Discrepancies between the model and reality, especially in the case of old structures, may indicate deterioration of materials or connections. Examples of short- and long-term monitoring of footbridges can be found in [56,57], and the SHM systems used FEM models in [4,50]. It has to be noted that the process of going from measurements and FEM models to evaluating the structural condition status is long. Many times it requires the application of statistical tools [11] or machine learning (e.g., shallow or deep neural network [12,17]).
This article aims to perform system identification of a nearly 30-year-old steel footbridge over the Wisłok River in Rzeszów (Poland). The design documentation of the bridge has been lost, and since its construction, the footbridge has been subject to renovations. The structure is highly susceptible to pedestrian traffic, and before any actions are taken to improve the comfort of use, it is necessary to create and validate a numerical model and assess the force distribution in the structure. Two main purposes of the article have been formulated:
  • Development of a numerical model of an old footbridge, whose components have been degraded due to long-term use. Changes, compared to the ‘original’, focused on elongation of the cables due to rheology and a decrease in their tension.
  • Demonstrate the challenges in modeling and validating this type of bridge, especially in the lack of complete documentation.
The excessive vibrations of the structure are not just a matter of comfort of use; they can be both a result of existing damage or lead to faster destruction of the structure due to fatigue. The article presents the initial stage of the way to develop a footbridge monitoring system for old cable-stayed structures.

2. Materials and Methods

2.1. Examined Footbridge

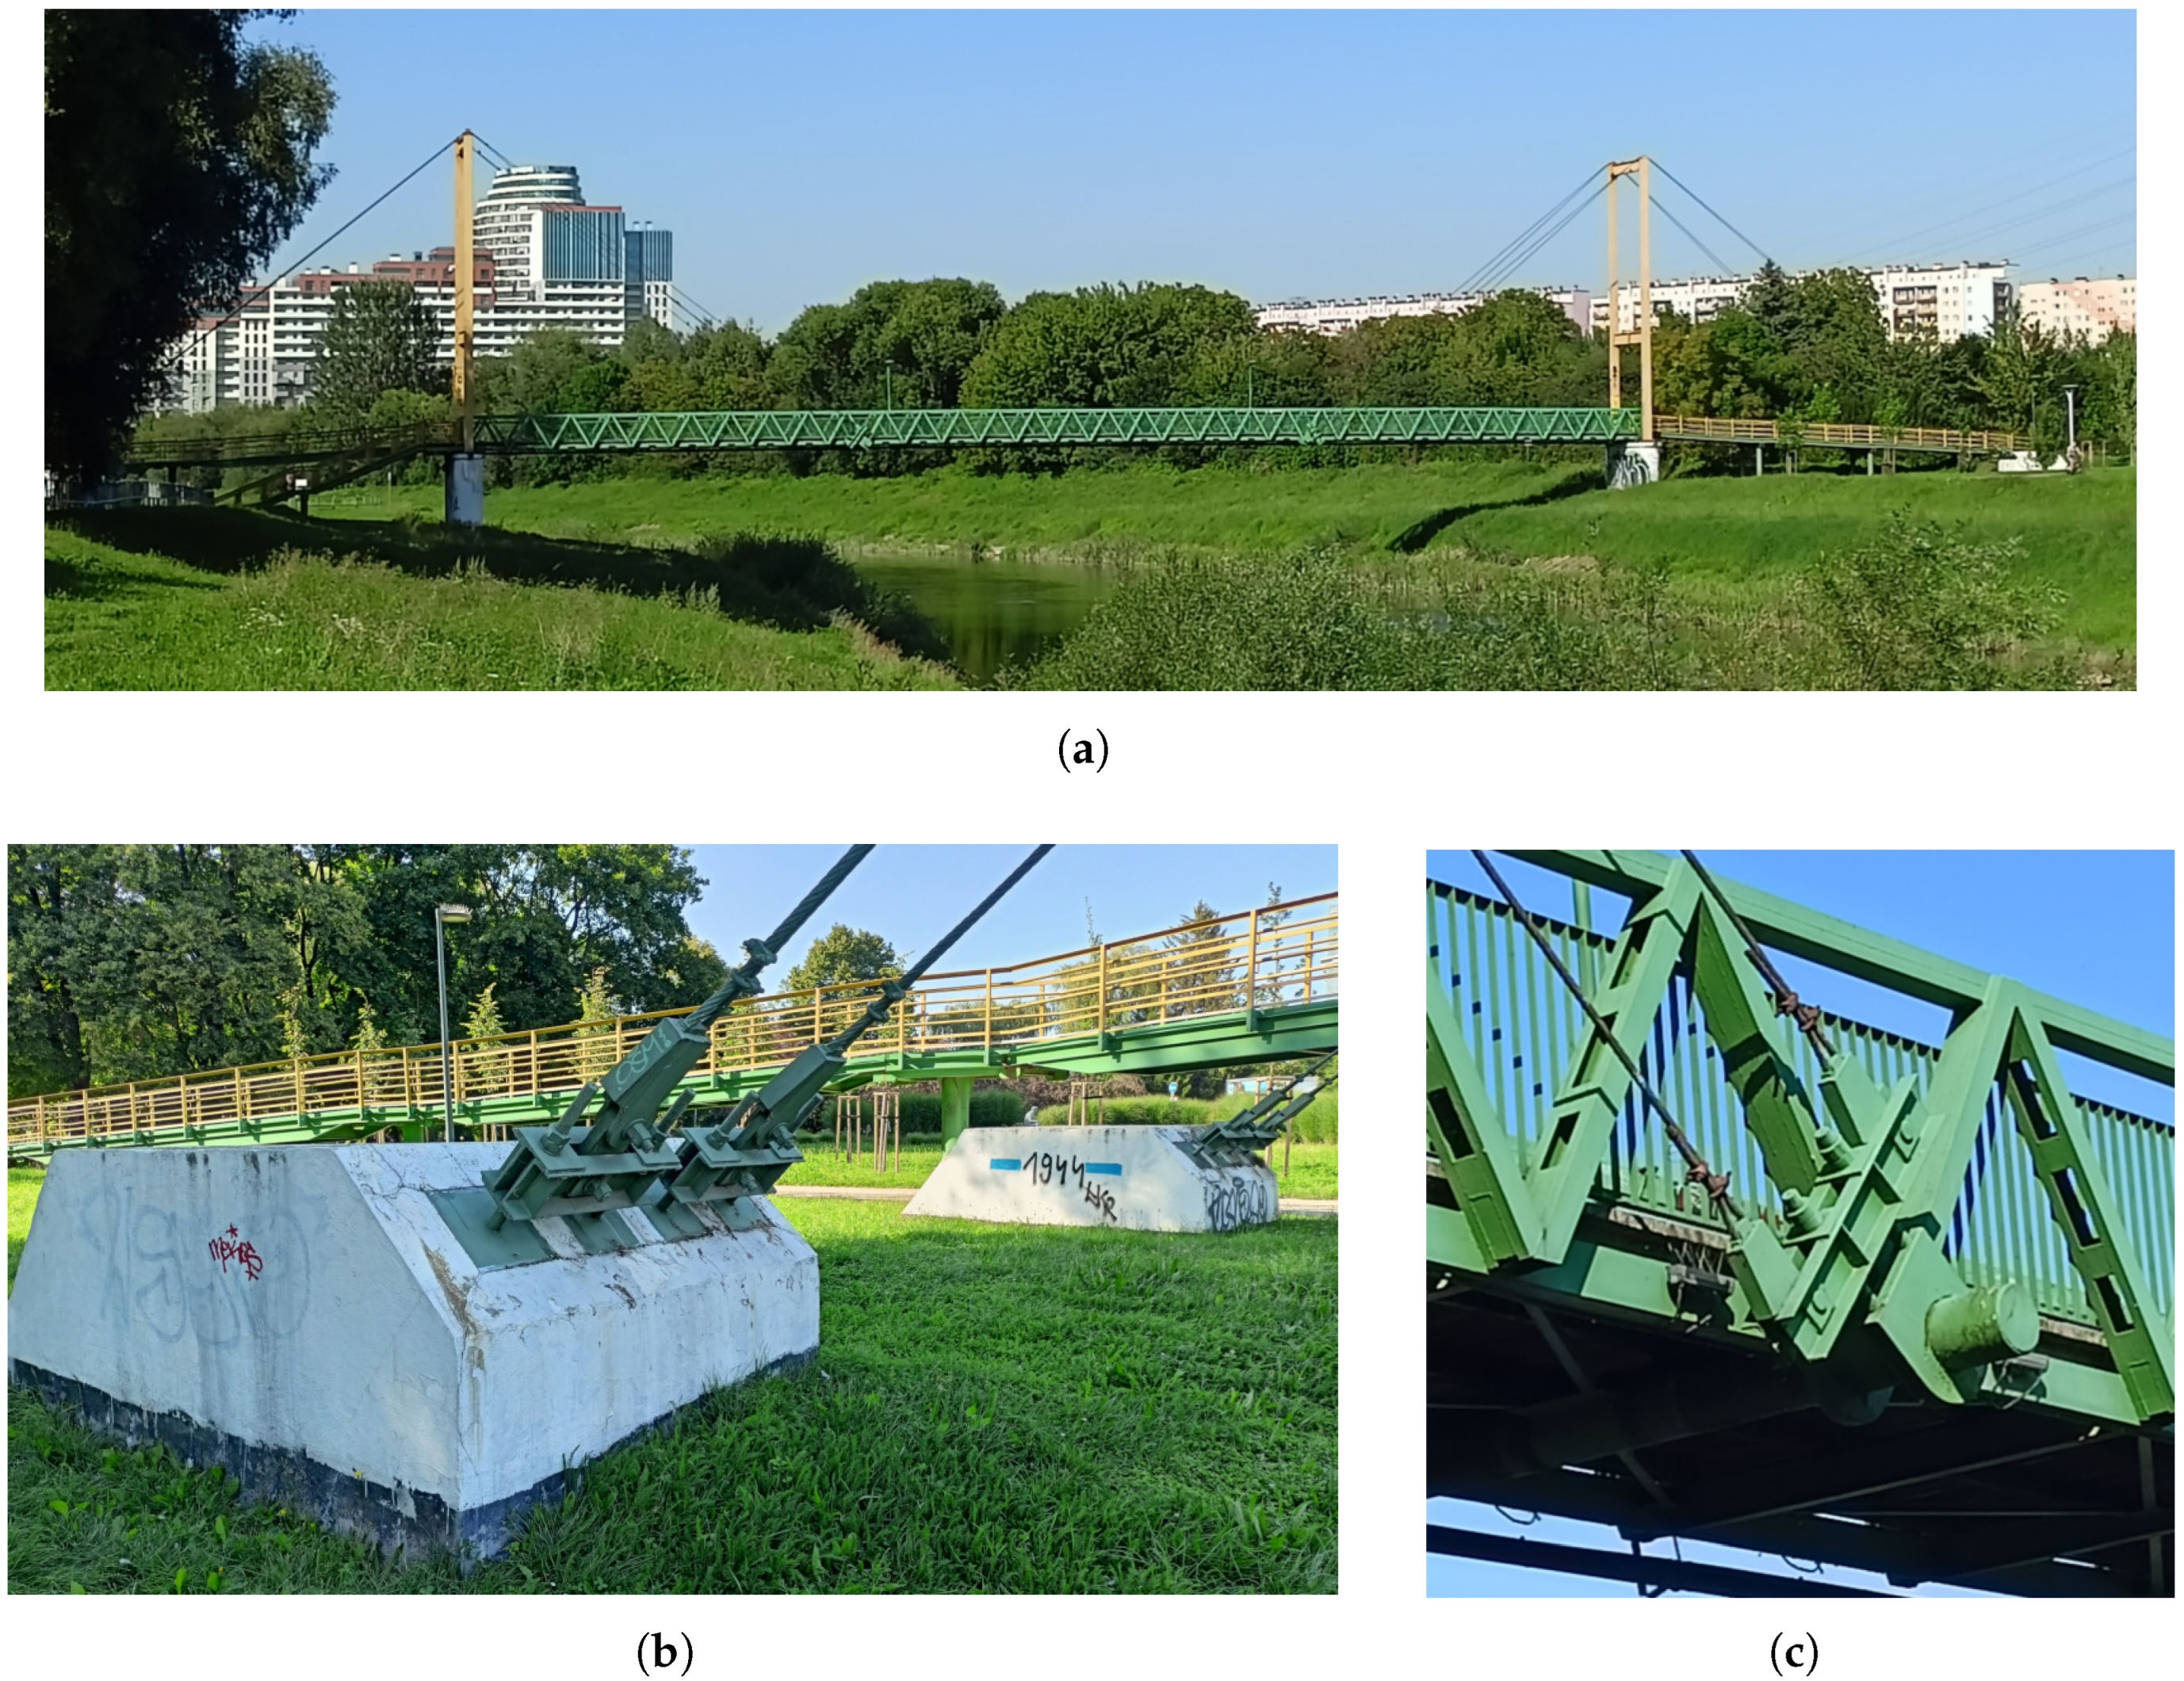
For the study, the cable-stayed footbridge over the Wisłok River along Podwisłocze Street in Rzeszów (Poland) was selected (Figure 1). The structure is very commonly used by pedestrians and bicyclists; it connects a residential estate of several thousand inhabitants (on the east side of the river) with the city center (on the west side). Additionally, it is located in the green recreational areas, which makes it attractive for people who would like to take a rest away from the hustle and bustle of the streets. Unfortunately, the footbridge is highly susceptible to dynamic excitations caused by pedestrians, which makes the structure interesting from a scientific point of view; however, the comfort of usage for many pedestrians is very low.
The footbridge, developed by ‘Mostostal–Projekt. Centralny Ośrodek Badawczo–Projektowy Konstrukcji Metalowych. Mostostal–Pracownia w Krakowie’, was built in 1997. During high water flow, part of the structure on the western bank was flooded, so the western ramp was rebuilt in 2002. In 2005, a technical examination was performed [58], and it is the oldest document about the structure that we managed to obtain. The facility manager informed us that the previous documentation had been lost, and a search for it was commissioned in the archives. In 2008, the dynamic test was performed, and its result was described in [59]. Since then, the structure has undergone renovation, and the wooden deck has been replaced. The last renovation was finished in 2017.
The analyzed pedestrian bridge is a steel structure with a wooden deck, supported by two reinforced concrete supports. The bridge can be divided into three main parts: the left-bank ramp, the river crossing, and the right-bank ramp. The total length of the facility is 175.42 m (including ramps).
The river crossing span length is 64.0 m. It is a steel frame with a structural height of 1.73 m. The lower chords of the girders are made of a 200 mm C-section, the upper chords of two 160 mm C-sections, and the diagonals are made of a 120 mm C-section. All members of the two girders are connected by welding, and the middle surface of the diagonals is offset from the middle surfaces of the chords (Figure 1c). The crossbeams are made of a 200 mm I-section spaced 2.0 m apart and are braced (X-type) with 60 mm × 60 mm × 6 mm angle sections. The total width of the space frame is 3.08 m. The structure of the deck has been modified from the originally designed version. Currently, four timber beams lie along the footbridge on the crossbeams, with 5 cm-thick boards placed on them perpendicular to their axis. Steel handrails are mounted to the diagonals.
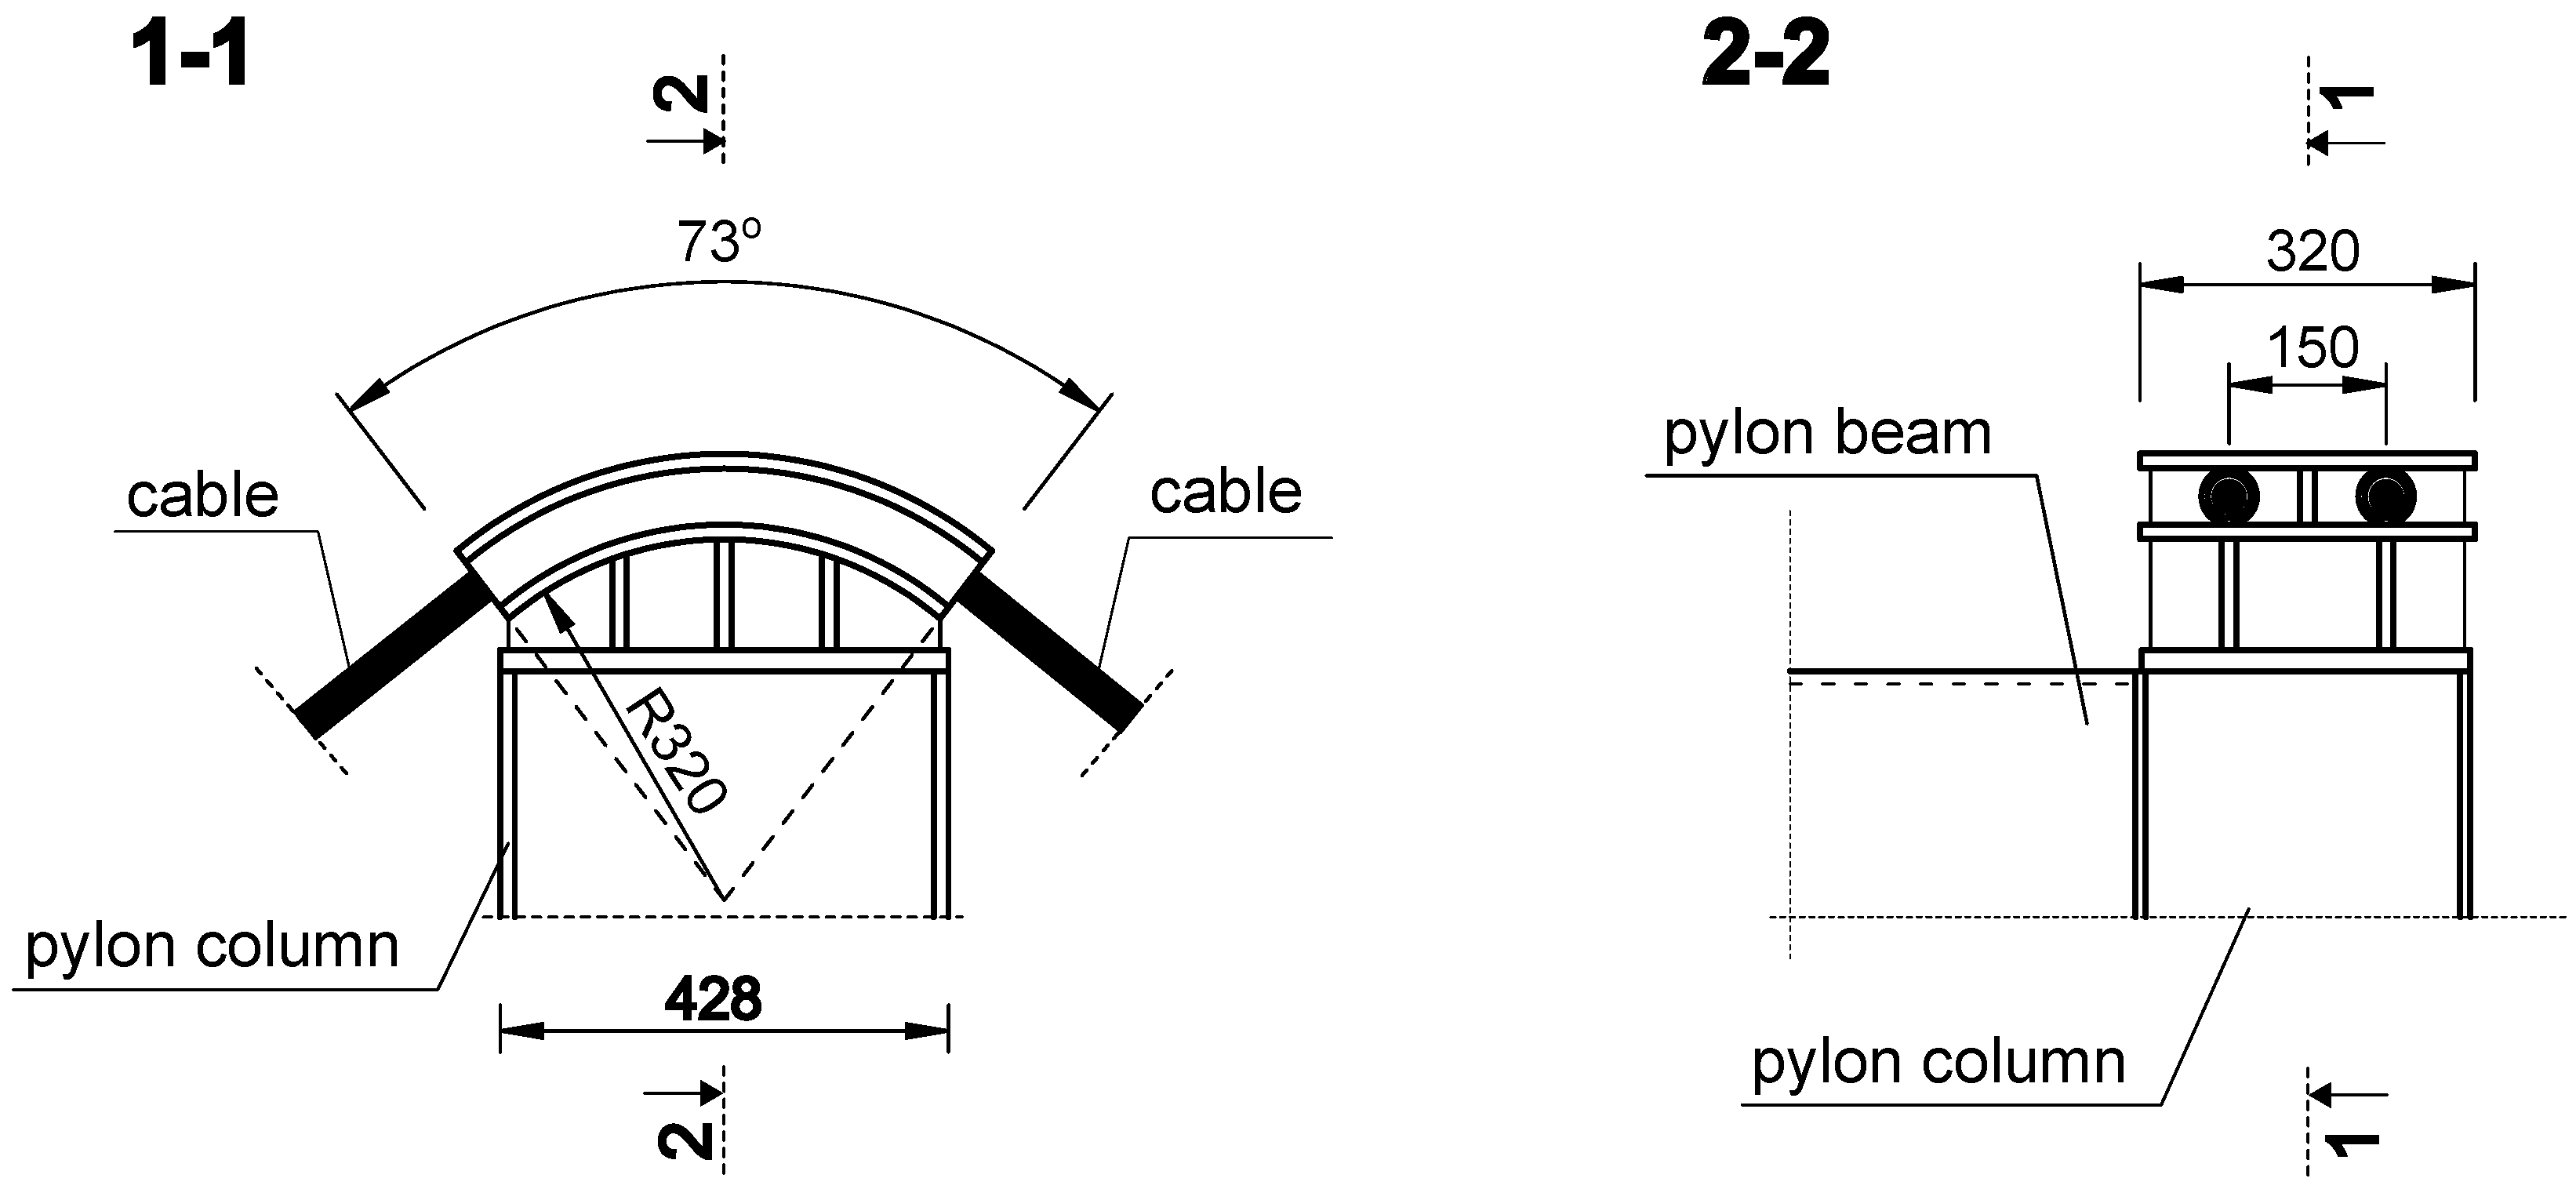
The river crossing is suspended on eight steel cables (T6x19+A Ø 32 mm). The cables are anchored in two places on the lower chord (Figure 1c), run through slides (Figure 2) on the heads of the steel pylons (16.0 m high), and are anchored in concrete anchor blocks (Figure 1b). There are two blocks on each bank.
The pylons are composed of two 320 mm × 428 mm rectangular columns connected to spandrel beams.

2.2. Numerical Model

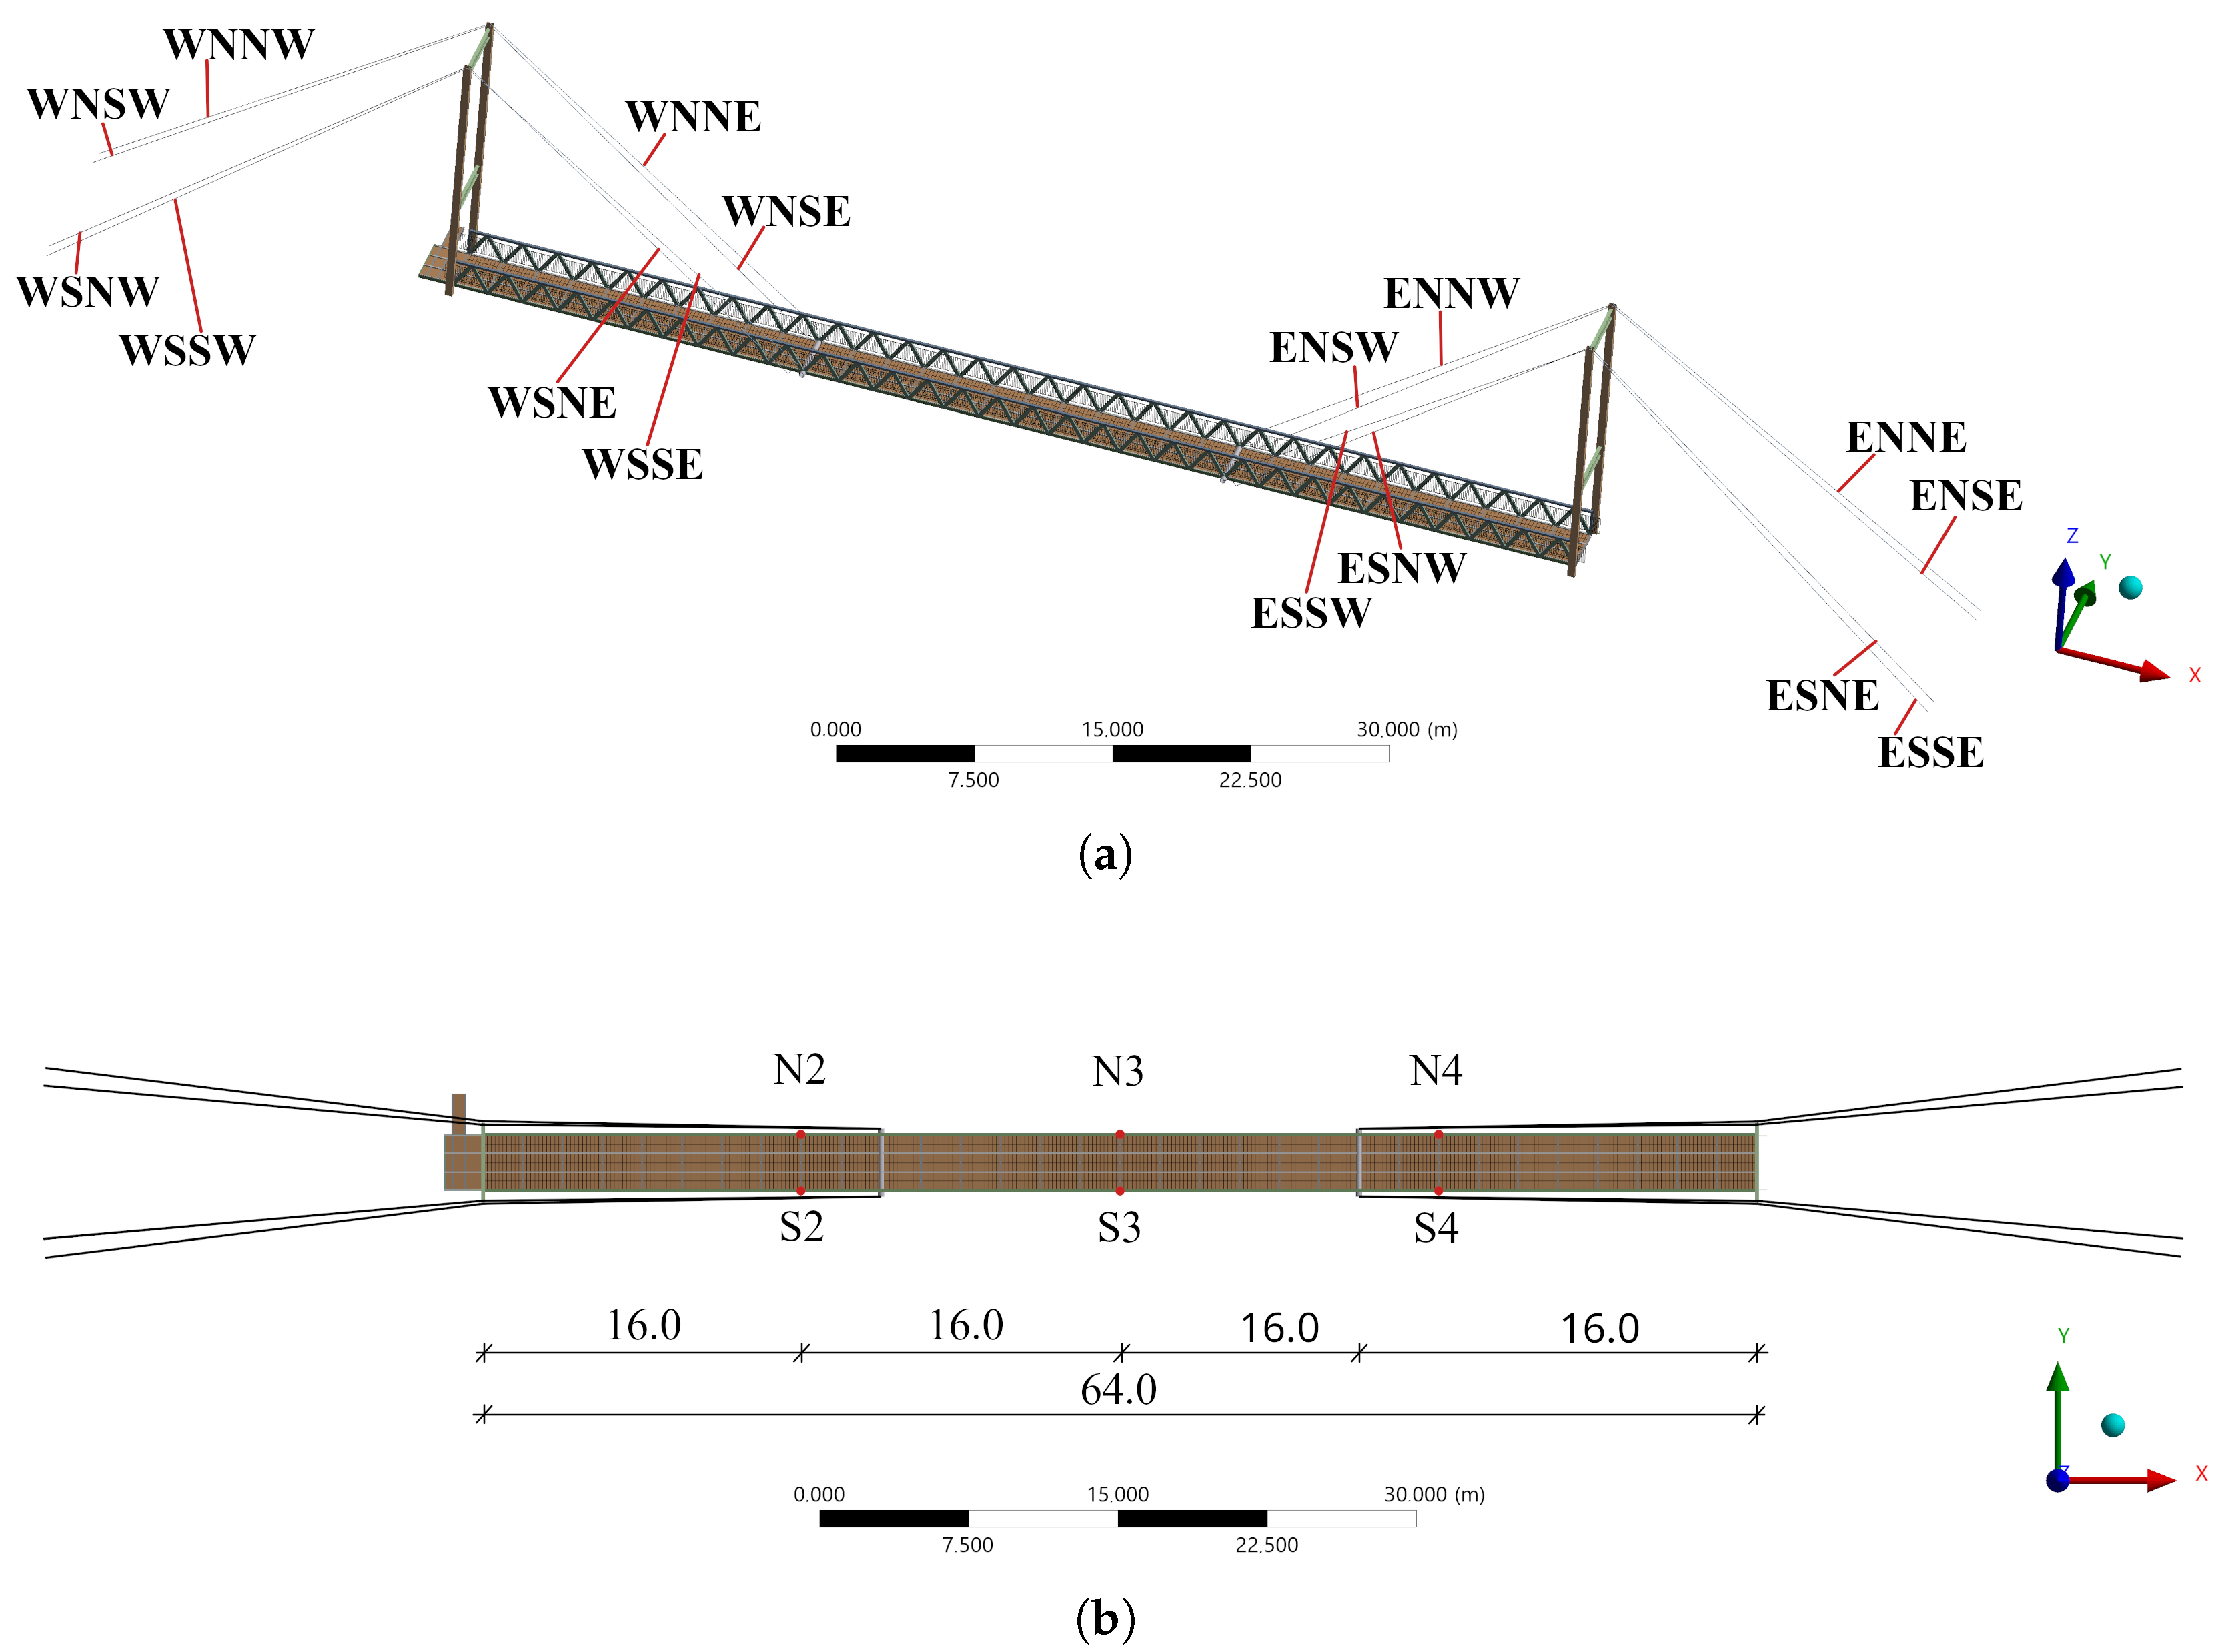
The geometry of the footbridge was modeled in ANSYS SpaceClaim 2024 R2, and then uploaded to ANSYS Mechanical 2024 R2 (ANSYS, Inc., Canonsburg, PA, USA), where the numerical model for mechanical calculation was built. The detailed analysis included the river crossing (with handrails and barriers), pylons, and cables. The visualization of the modeled object is shown in Figure 3a. In this scheme, the markings of cables are specified, which will be used in the further description of results. The Finite Element Method (FEM) with large displacement was used.
The FEM model contains 93,800 nodes and 13,893 linear frame elements (six degrees of freedom in each node, in Ansys Mechanical called ‘BEAM188’ [60]) for bars, 80 uniaxial quadratic elements in 3D space (three-noded, three degrees of freedom in each node, tensile stress to provide adequate transverse stiffness is required; in Ansys Mechanical this element is called ‘CABLE280’ [61]) for cables, and 71,694 shell elements for the bridge deck. The connections between the cables and the span were simplified; each of them is modeled with three elements in type ‘BEAM188’, with infinitely high stiffness defined for these elements. An additional mass of 140 kg (approximated mass based on the documentation) was added to each connection of this type (Figure 4).
The model included fixed supports for pylons, joint supports for the girders on the west pier, joint supports with the possibility of movement along the bridge axis for the girders on the east pier, and displacement restraint in all three directions for cable anchorages in the anchor blocks. The boundary conditions are schematically shown in Figure 4.
Based on the available documentation, in which the slides on the heads of the pylons are mentioned, and the visual assessment of the span suspension in the first model, the end releases are applied (Figure 4): (1) On the pylons, the movement of cables along the foobridge axis (X in GCS) as well as the rotation around the pylons (Y in GCS), and (2) on suspension, rotation around the suspension beam (Y in GCS). However, during the examination, free movement in the mentioned directions appeared to be limited, and finally, both situations—with and without end releases—were considered as shown in Table 1, upper row.
The properties of materials used in the models are shown in Table 2. Due to the lack of exact information about the materials applied in the structure, the parameters were assumed based on the information in technical expertise [58] and archival press releases [62] (probable type of timber—larch). Linear isotropic models were adopted for steel (both for the structure elements and cables as well as for timber deck crossbeams). The timber used for footbridge deck was orthotropic. Its properties were assumed based on [63]. In the real structure, the deck is made of separate boards; this was the reason why the Young’s modulus in the direction of the footbridge deck (in local coordinate systems it is the Y direction) was reduced.
The tension in cables was modeled using thermal conditions added only to the cables. The cable tension modeling method was verified using RFEM6 (version 6.09, Dlubal Software GmbH, Tiefenbach, Germany), the second software used, where the pre-tension was modeled independently by (a) increment in temperature application and (b) cable shortening. In both FEM software, the same static (displacement) and final dynamic responses (free vibration) were obtained. The pre-tension modeling with temperature changes is a purely mathematical procedure. In the analyzed cases, the structure is not subject to temperature loading. At this stage, a simplification was assumed—the structure operates under stable temperature conditions.
The lack of information about the initially applied tension in cables made the simulation difficult. It was assumed that all cables were pre-stressed with the same magnitude of force, so the thermal conditions were changed for all cables in the same manner. As the initial state of a properly modeled bridge, the situation was recognized in which the grade line of the footbridge, caused by dead weight and tension in cables, was the same as in 2005. Obviously, due to the renovation of the footbridge, replacement of the deck, and the aging of materials (especially in the cables), this value could now differ in the real structure. The influence of the tension in cables on the static displacement and the dynamic properties of the footbridge was the main goal of the current studies, so different values of thermal loading were applied. Two variants of thermal conditions, and consequently pre-tension, were selected for presentation: (a) the pre-tension causes the footbridge grade line as in 2005, and (b) the pre-tension causes the natural vibration of cables on the level obtained in the dynamic test on a real object; they are collected in Table 1.

2.3. Static and Dynamics Measurements

To determine the vertical displacement of the pedestrian bridge, a static loading test was conducted. The measurement was conducted in a local reference system using trigonometric leveling and tachymetry methods using Trimble M3 instruments (Trimble Inc., Westminster, CO, USA) with a distance measurement accuracy of 2 mm + 2 ppm and an angle measurement accuracy of 1″ (for measuring points located on the object’s south side on bottom chord) and 3″ (for measuring points located on the object’s north side on bottom chord). The locations of the measuring points are shown in Figure 3b with red dots. Heavy wooden tripods and rangefinder reflectors with target plates were used. The monitored points on the object were marked with reflective plates with a clearly visible target point marking.
Due to the poor condition of the bridge deck and the impossibility of entering the footbridge by car, the group of pedestrians was asked to stay in the middle of the footbridge span (Figure 5a). The total mass of group of 21 people was 1735 kg. Its impact was modeled using a load uniformly distributed over an area of 2 m × the width of the bridge (the area on which the group of people was concentrated); the resultant of this load is equal to 17.35 kN. The measured displacements are discussed in Section 3.1.
Two additional situations were studied, during which the same group of pedestrians stayed on the level of bridge pylon. The aim of these scenarios was to exclude bearing flexibility. In both situations, the measured values were lower than or equal to the measurement accuracy, so the bearings were assumed to be non-deformable.
After the first few numerical simulations, a decision was made to perform dynamic measurements of natural frequencies in the cables (as can be found in [13,64], it is one of the methods that can estimate the tensile force in cables). For this purpose, the LAN-XI system Brüel & Kjær (Hottinger Brüel & Kjaer GmbH, Darmstadt, Germany) (multi-channel analyzer—12-channel basic module type 3053 with PULSE™ Time Data Recorder Type 7708 software) and 4 triaxial accelerometers of type 4506-B-003 (Figure 5b) were used. The vibration excitation was applied manually and repeated three times on each cable. The vibrations of the cables were recorded simultaneously at four points (one on each cable), in four configurations: (1) west pylon, west parts (W**W), (2) west pylon, east parts (W**E), (3) east pylon, west parts (E**W), and (4) east pylon, east parts (E**E), where asterisks means the letter ‘N’ or ‘S’ according to the scheme in Figure 3a. An exemplary registered raw signal is shown in Figure 6a.
Collected signals were filtered and transformed into the frequency domain using the Fast Fourier transform (fft). The transformed signals for the cable WNNW, taking into account the excitation variant, are shown in Figure 6b. The main peaks, which correspond to the natural frequencies, were identified for all cables and discussed in Section 3.3.

3. Results

3.1. Results of Numerical Simulation

Numerical calculation at each pre-tension level were performed in three stages: (St1) the dead load was applied and thermal conditions were imposed on the cables; (St2) the structure deformed in St1 was subjected to a static pedestrian load; and (St3) modal shapes and frequencies were calculated using the pre-tension state from St1. The results of the numerical simulations were first compared in terms of static parameters, such as displacements (Table 3) and internal forces distribution (Table 4). The vertical displacement caused by the static load ( Δ w ) was calculated as the difference in vertical displacement in St2 ( w ( S t 2 ) ) and vertical displacement in St1 ( w ( S t 1 ) ).
Vertical displacements corresponding to higher and lower magnitudes of applied pre-tension differed significantly (e.g., Model 1 vs. Model 1A and Model 2 vs. Model 2A). The difference between Model 1A and Model 2A (models with lower pre-tension and different stiffness of connections) was also evident. Despite this, the displacements caused by the static load applied during the static test were identical for all analyzed models.These results indicate that for the applied load magnitude, the initial cable tension and the pylon–cable connection model did not affect the static response; the structure behaved linearly. Compared with displacements measured on the real structure, the numerically calculated displacements were larger. However, considering measurement accuracy, they can be regarded as consistent.
The axial forces in the cables, which are the focus of this study, are presented in Table 4 (St1 results). For Model 2, which is stiffer than Model 1, axial forces in the cables were generally lower (except for internal cables between the pylons). The main difference was in force redistribution. In the case of Model 2 and Model 2A, the axial forces in cables connected to the anchor blocks were similar. These parts of the four cables (between the west pylon and anchor blocks on the west bank of the river: WNNW, WNSW, WSNW, WSSW) had nearly identical lengths and slopes. A similar situation was observed at the east side of the pedestrian bridge. The cables between the pylons had different slopes in pairs (e.g., WNNE and WNSE, or WSNE and WSSE). This explains the differences in axial force values. In Models 1 and 1A, the situation differed: the axial force magnitudes in both parts of each cable (e.g., WNNW and WNNE; WNSW and WNSE) were almost the same. However, differences existed when comparing two cables coming through one side of the pylon.
Thus, the static test did not provide sufficient information to determine which model from the analyzed set was correct. The missing information must be obtained from dynamic parameters.

3.2. Dynamic Properties of the Footbridge

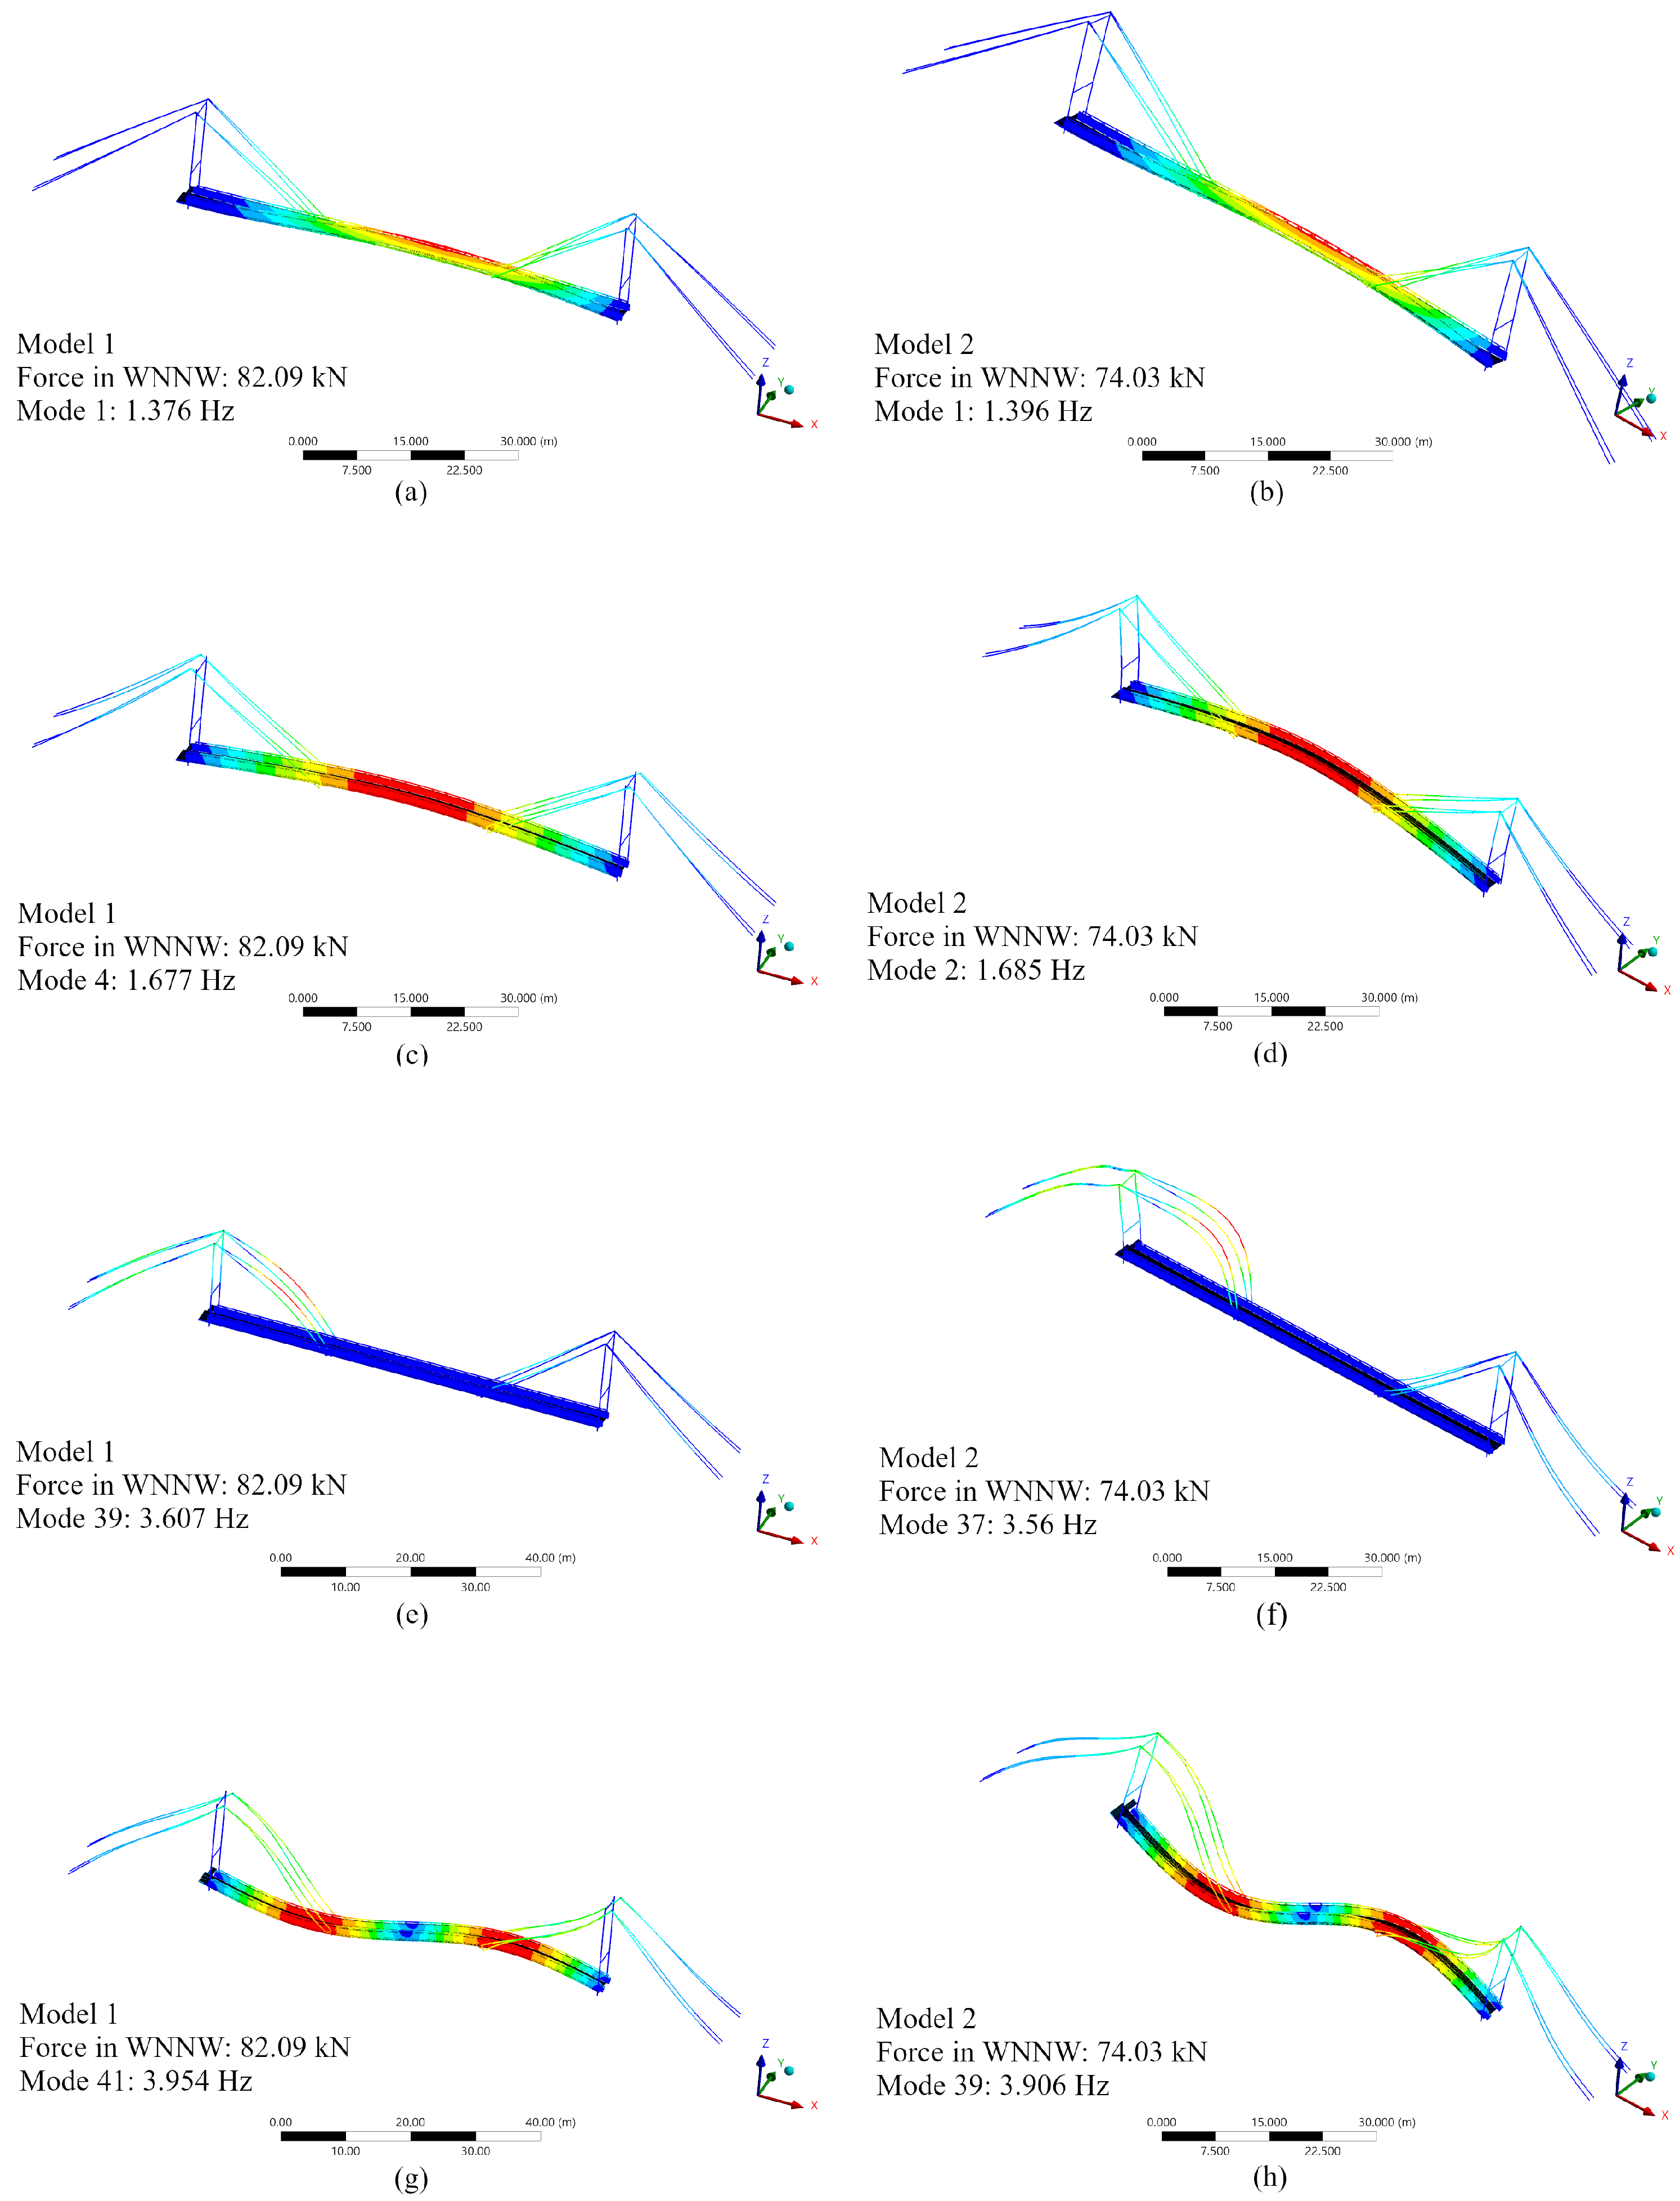
Modal frequencies and mode shapes were calculated. In total, 26 cases were analyzed: two model types and thirteen pre-tension states for each. Selected global mode shapes for systems with cable tensions corresponding to the footbridge grade line are shown in Figure 7a,c,e,g for Model 1, and in Figure 7b,d,f,h for Model 2. All global modes for the main span were identified; however, their modal ordering differed between models. This was due to different pylon behavior. In Model 1, local modal forms associated with the pylons appeared (e.g., Figure 8), which were not present in Models 2 and 2A. Modal similarity was assessed visually and using the Modal Assurance Criterion (MAC) [52]. The correlations of forms shown in Figure 7 are presented in Table 5. As shown, the global forms for the main span were nearly identical (MAC ≈ 1.0), whereas similarity decreased for local modes.
Frequencies corresponding to the global modes of the main span did not differ significantly regardless of cable force. The frequencies of the first two modal forms are shown in Table 6. Compared with the natural frequencies reported in [59], the numerical values differed within ± 15 % . It should be noted that those measurements were taken before renovation and deck replacement, which may have altered the structure’s mass and hence its natural frequencies.

3.3. Dynamic Properties of the Cables

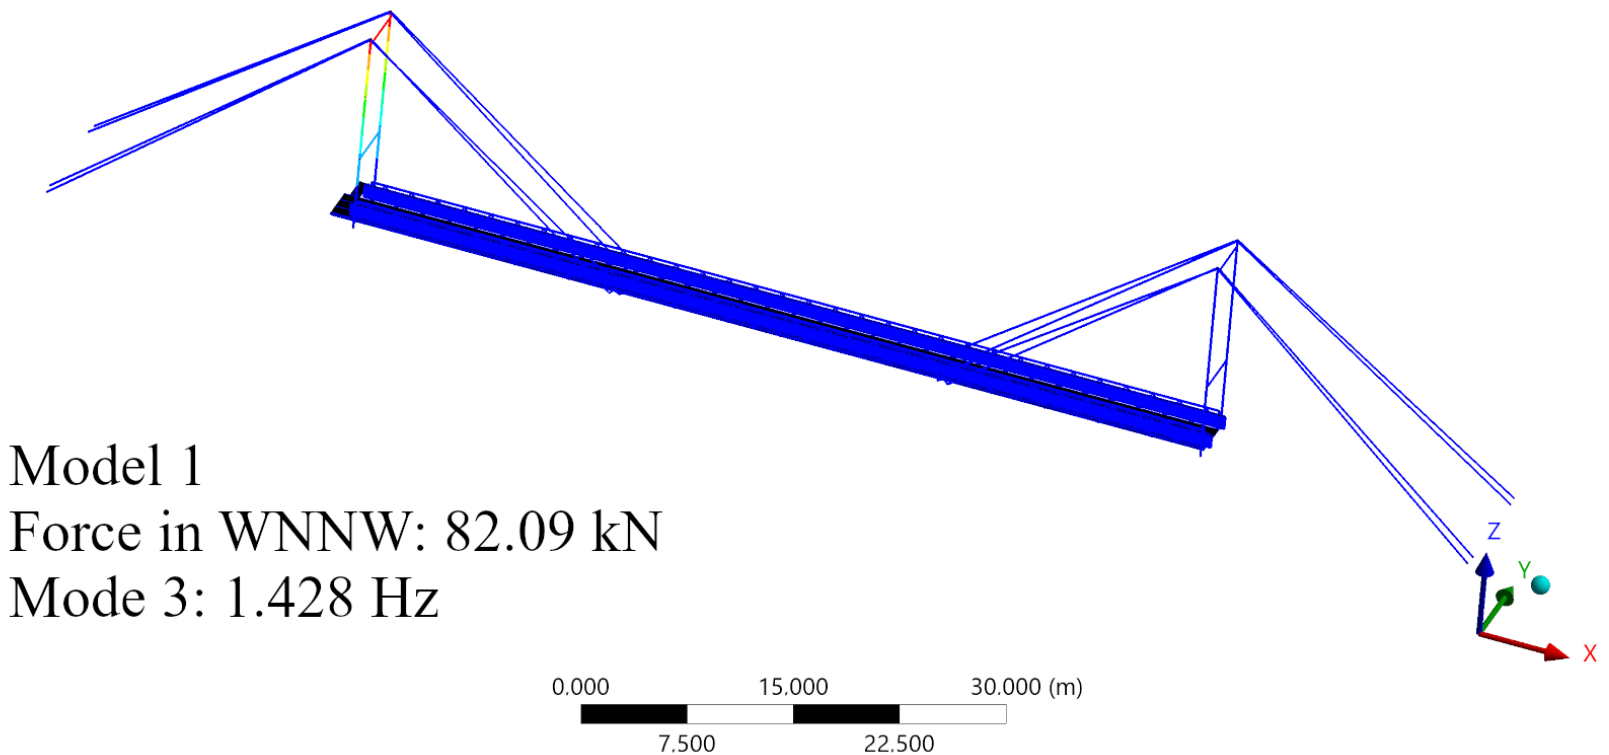
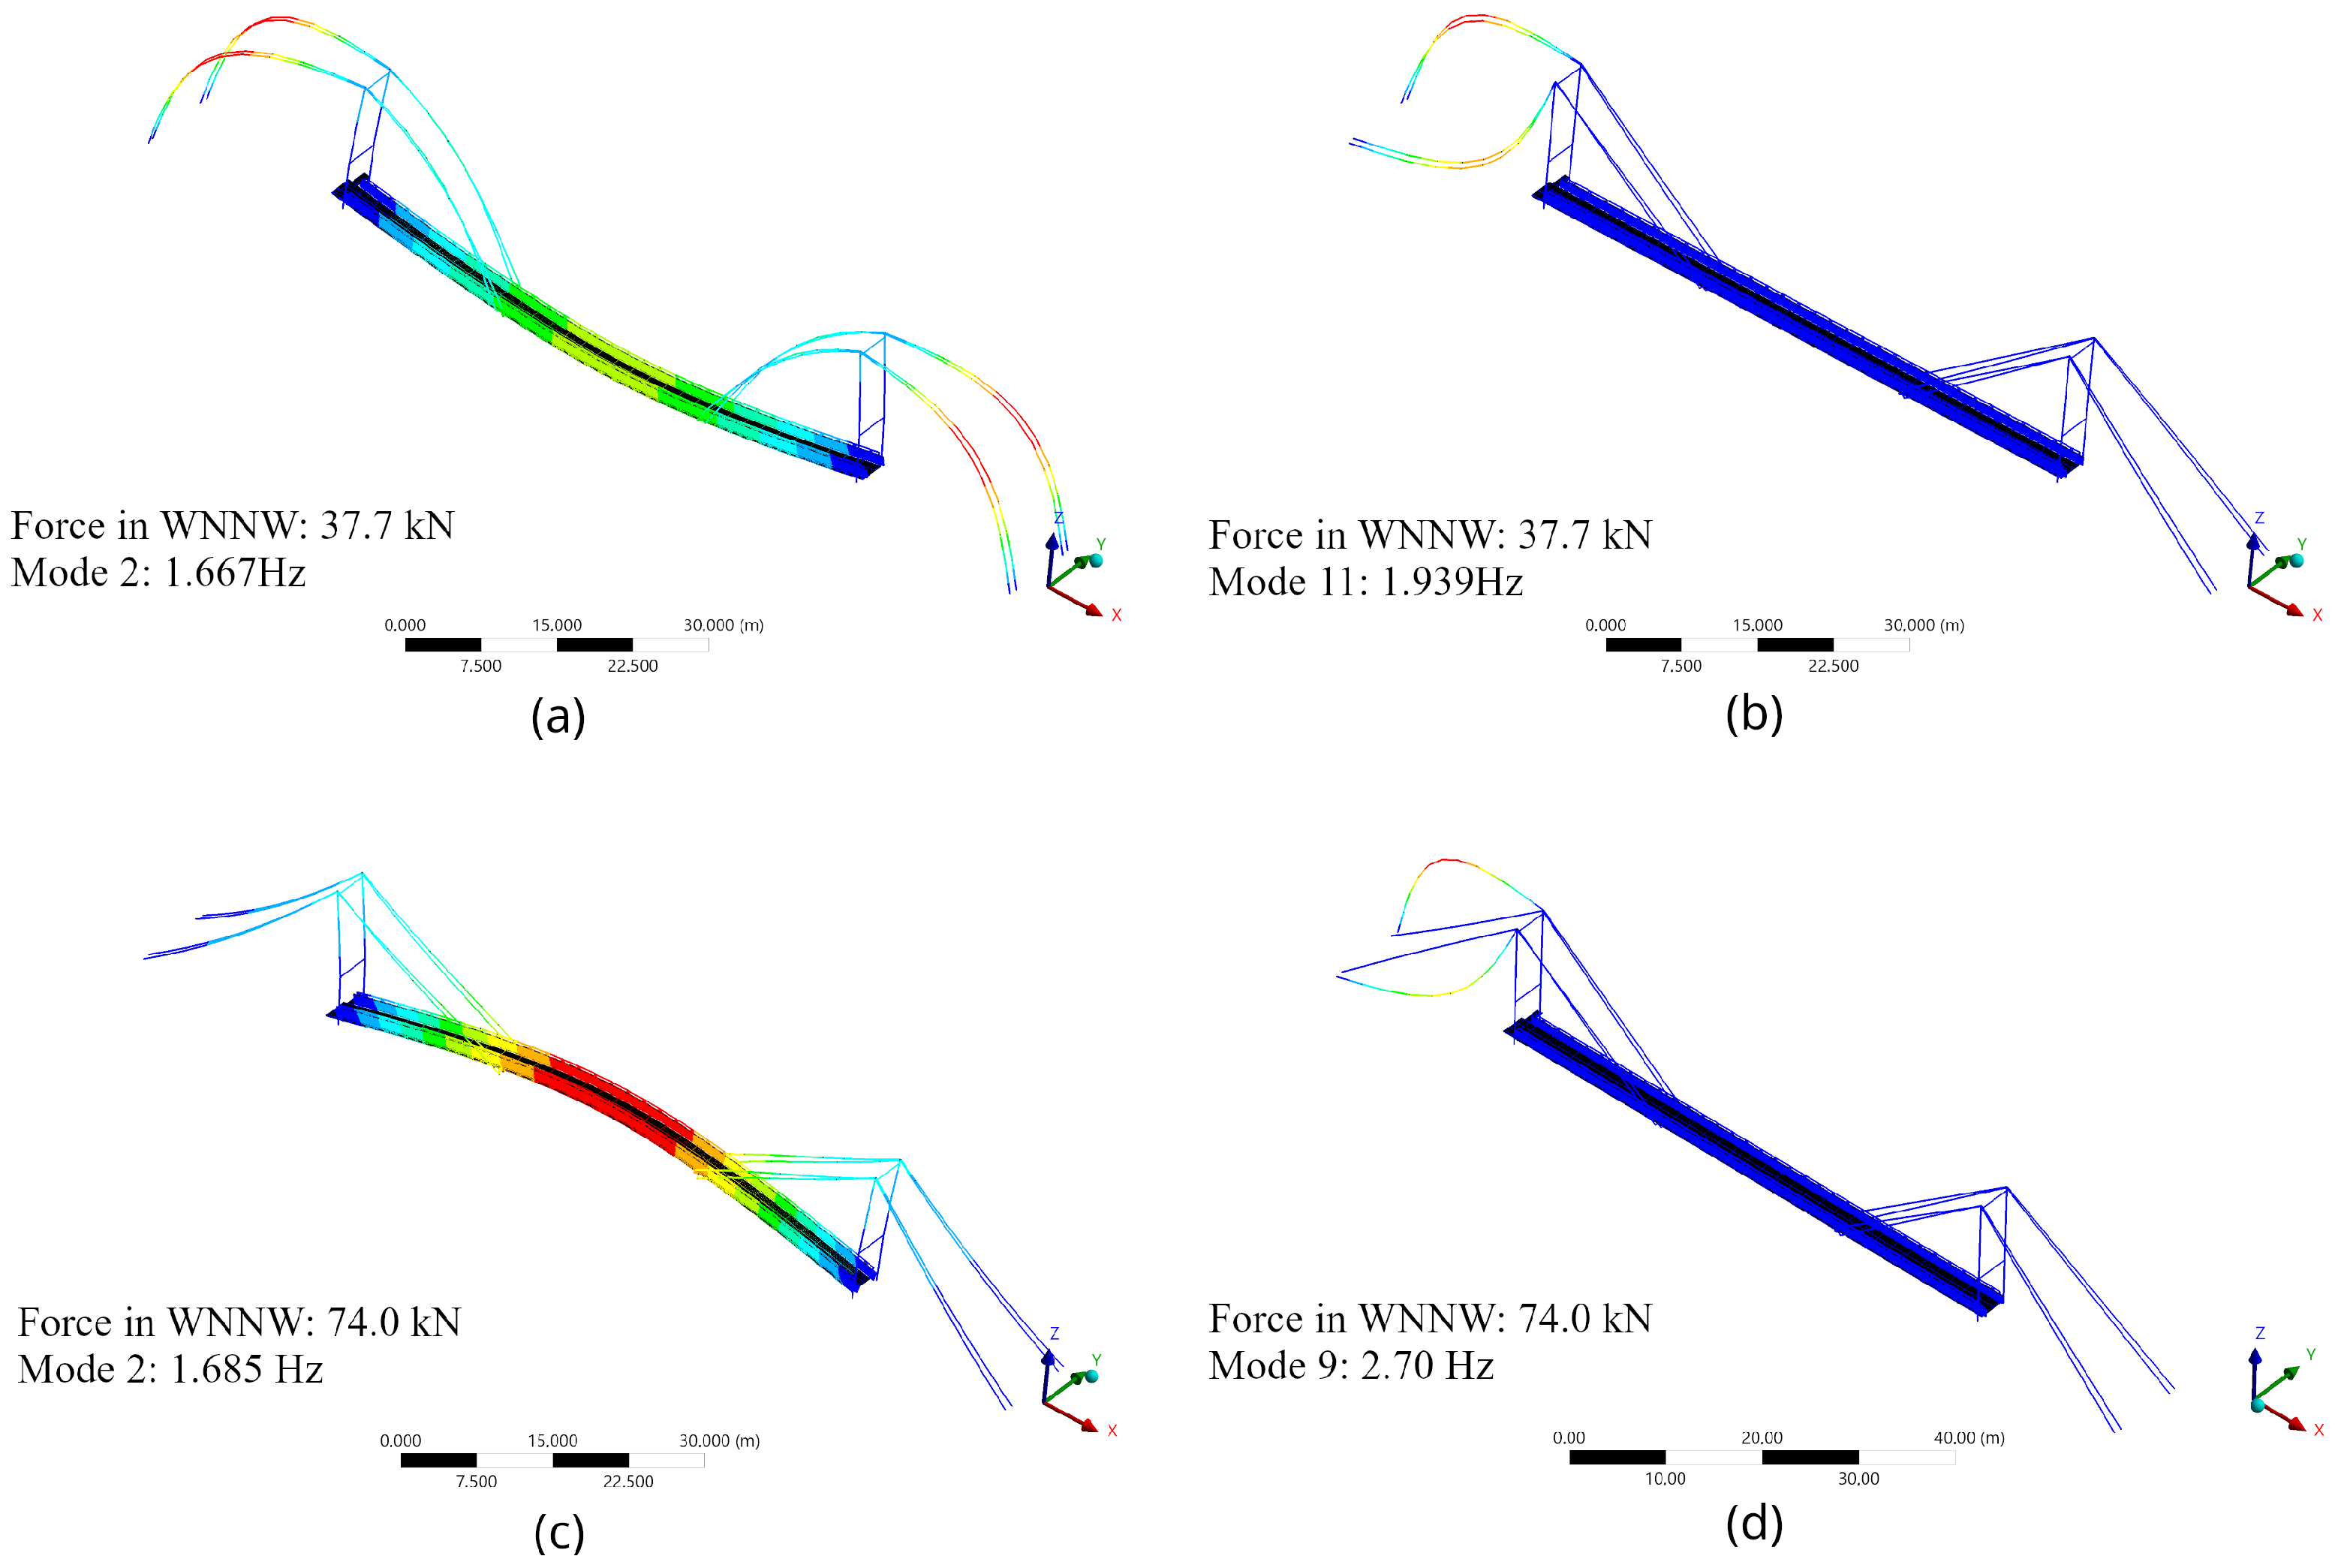
Cable pre-tension had the strongest impact on cable mode shapes and corresponding frequencies. Figure 9 illustrates this effect for the model without end releases on pylons and suspension elements. Figure 9a,c show the first global vertical form. The mode shapes appear similar despite opposite phases. However, closer inspection reveals that for low pre-tension (Model 2A, Figure 9a) dominant amplitudes occur in the cables, whereas for higher pre-tension (Model 2, Figure 9c), the maximum vertical displacement is near the midspan of the main span.
Interestingly, cable vibration mode shapes varied significantly at the global level (for the whole structure) and were not identical across analyzed pre-tension levels. For example, the first modal form typical for a pre-tensioned string was observed in Model 2A as pairs of cables vibrating in consistent phase (Figure 9b). This form was not observed in Model 2. Instead, in Model 2 the first string-like modal form appears with paired cables vibrating out of phase on the two sides of a pylon (Figure 9d). The frequencies of vibrations corresponding to the typical first form for a string changed significantly. For all forms analyzed for all considered models, the frequencies corresponding to the first, second, and third modal forms of string for all cables in the bridge were collected in Table 7. The table also includes experimental test results (EXP).
Studying the experimental data collected in Table 7, attention is drawn to the fact that the ratio of obtained frequencies for cables in the northern side is different from that for cables in the south (e.g., considering only the first natural frequencies WNNE/ENNW = 2.46/2.12 = 1.16 while WSSE/ESSW = 2.22/2.16 = 1.03, and WNSE/ENSW = 2.18/1.99 = 1.10 while WSNE/ESNW = 2.23/2.11 = 1.06). Cable pairs have the same geometry, and given the symmetry of the system, such discrepancies are puzzling; they require explanation, because they may indicate damage in the cable [64]. Unfortunately, the dynamic tests do not reveal the cause of the observed frequency variations. To identify causes precisely, the condition of cable connections and their internal structure should be inspected. This requires additional inspections; for example, using non-destructive testing (NDT) techniques.

4. Discussion

Comparison of the data in Table 7 shows that frequencies measured on the real structure were much lower than those calculated for pre-tensioned models that matched the assumed grade line. While the pre-tension in cables was reduced (Model 1A or Model 2A), the natural frequencies in numerical and experimental data reached greater compliance. However, the grade line location then deviated significantly from the assumption based on archival documentation (Table 3).
Determining whether Model 1 or Model 2 assumptions (allowing or restricting cable and suspension movement) are correct remains ambiguous. In Models 1 and 1A the ratio of the frequencies for inner cables (near the footbridge axis) and outer ones was approximately 15 % . In the case of Models 2 and 2A, only the frequencies for the cables between pylons varied, by about 5–7%. These tendencies were not observed in experimental data, suggesting that cable forces were lower than expected and unevenly distributed. This suggests that individual cables may age differently, which is possible. Connection conditions (e.g., sleeves) may also differ between cables.
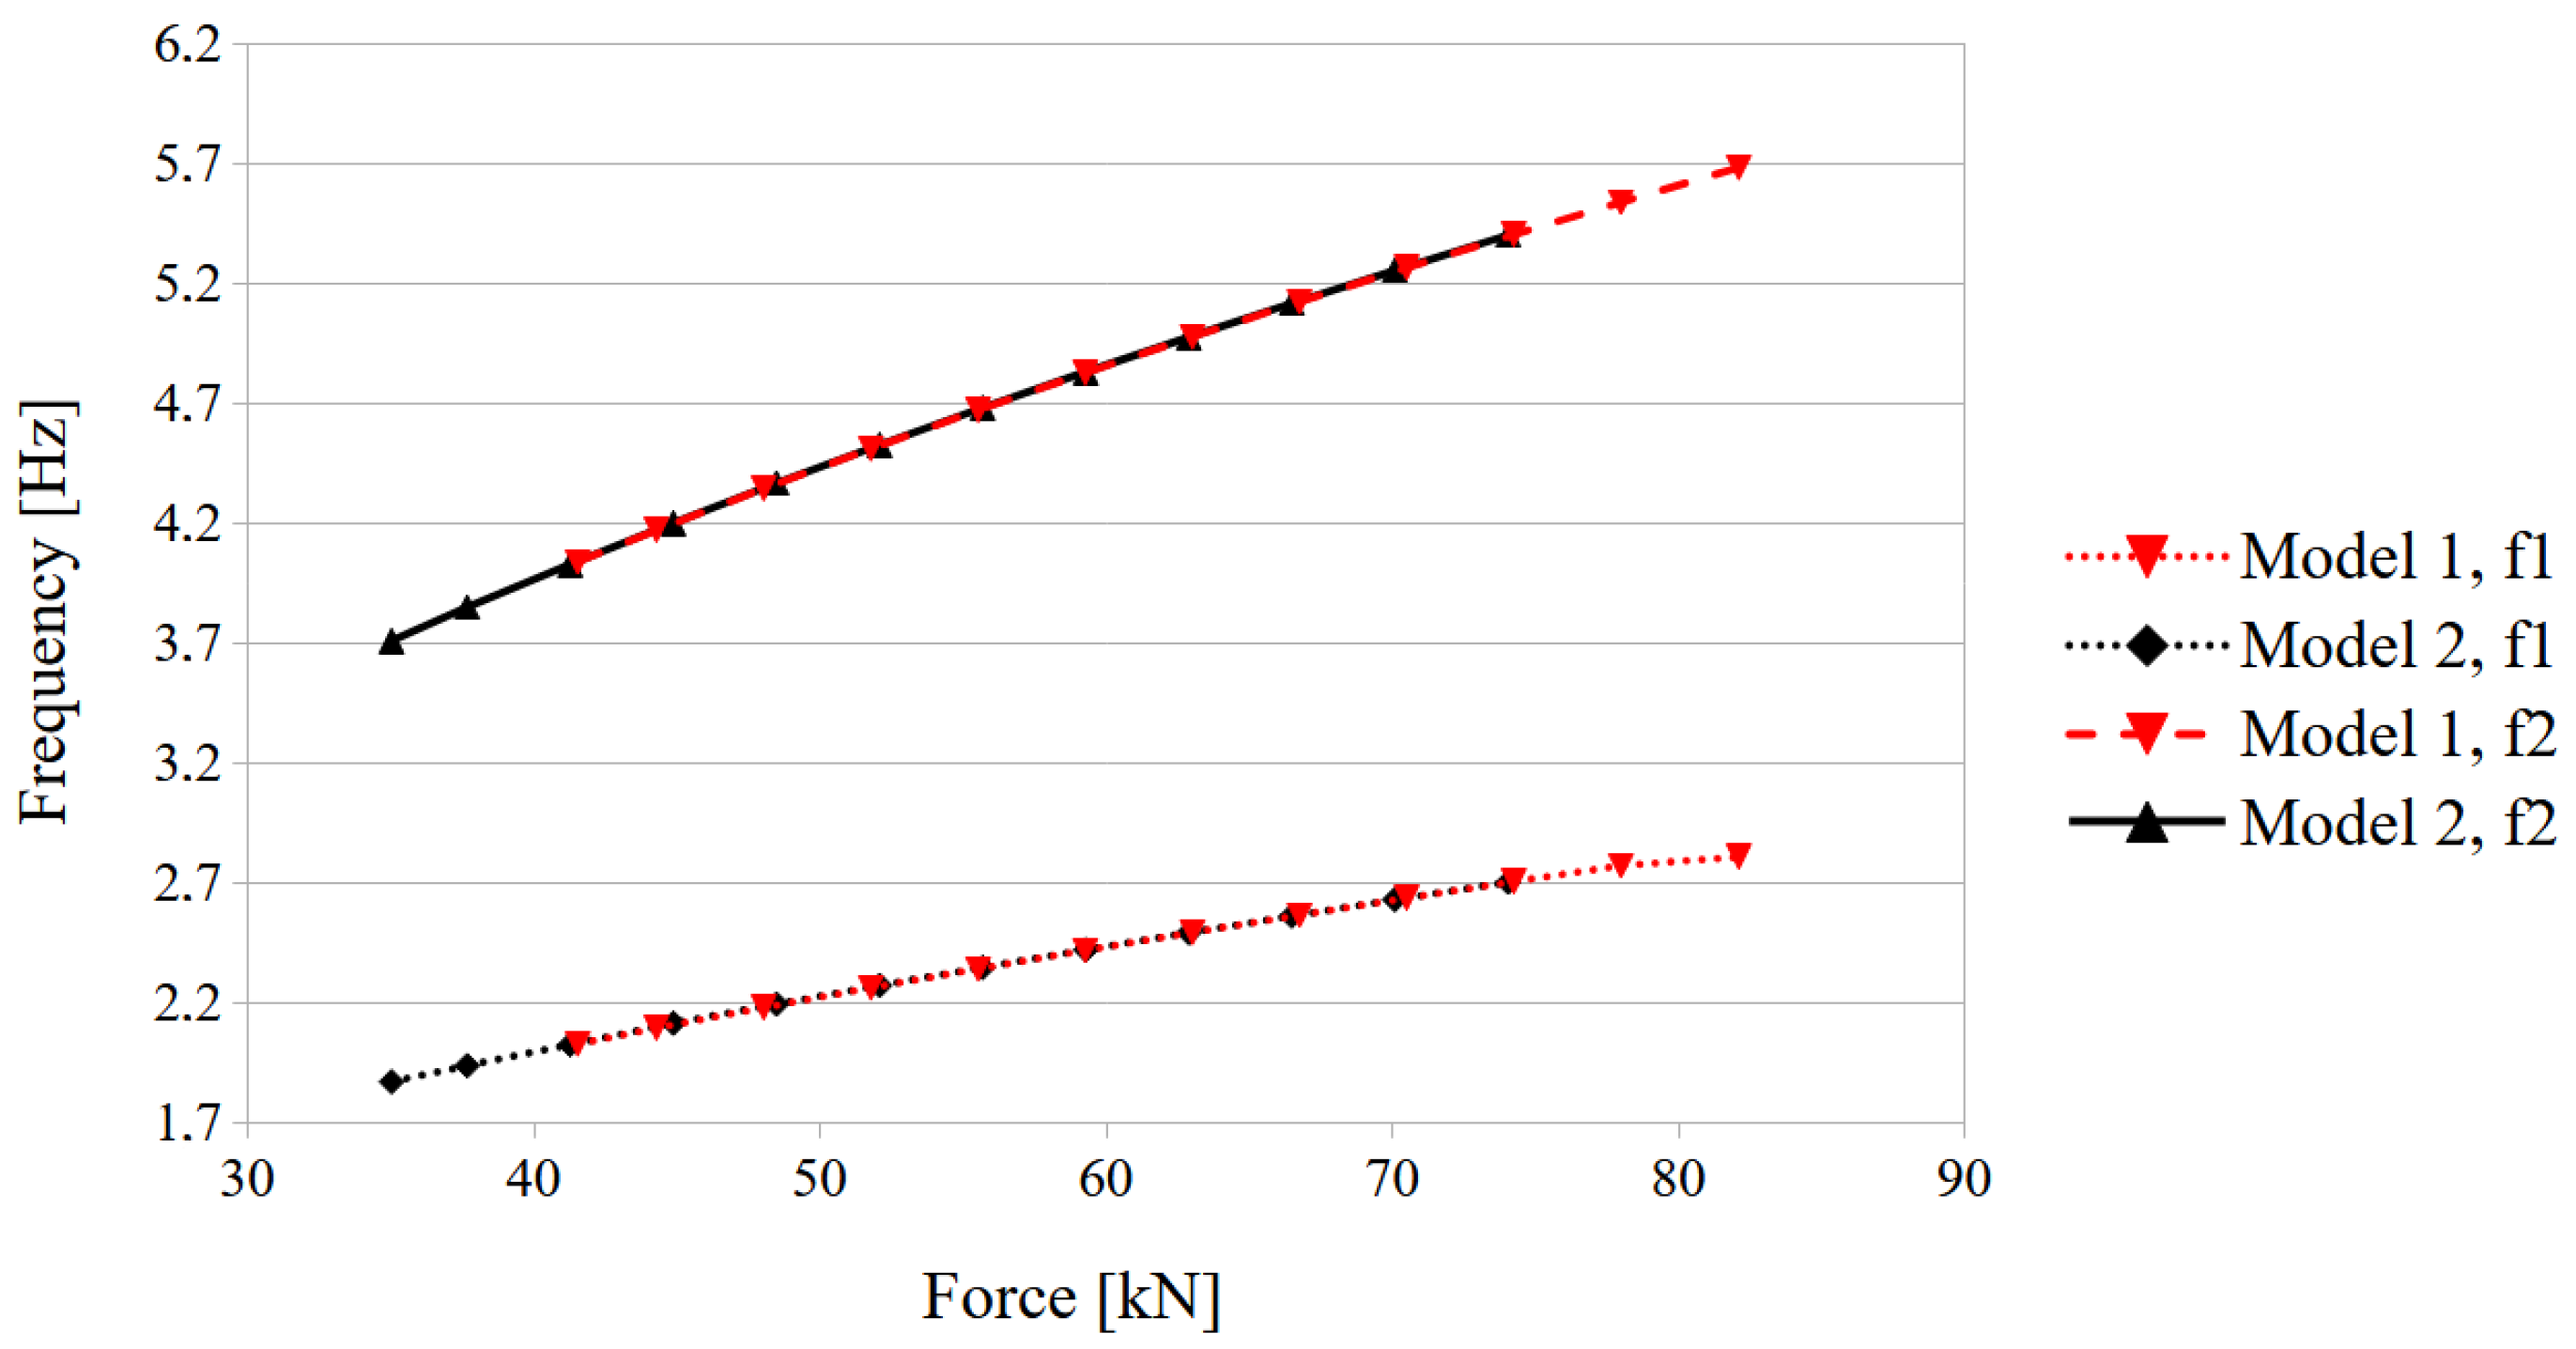
The influence of force increment on the first two natural frequencies in the case of cable WNNW and the model with and without end releases is shown in Figure 10. Forces in cables result from imposed temperature changes used to simulate pre-tension and the adopted static scheme (see Section 2.2 and Table 1). In a certain range of axial force in the cable, both models produced the same natural frequency value. This may explain why the precise identification of the proper numerical model is so difficult. It is still important to remember that these relations are prepared for a uniform increase in force in all cables. This issue requires further research, especially taking into account the conclusions from the previous paragraph.
The attempt to establish a valid numerical model for the analyzed pedestrian bridge can be summarized as follows:
  • The static test did not provide sufficient information to determine the appropriate model (see Table 3; identical vertical displacements were obtained for different boundary conditions and pre-tension). Missing information must be obtained from dynamic parameters.
  • Determining the condition (allowed movement) of connections between cables, pylons, and the span requires simultaneous vibration measurements of all these elements.
  • If force changes are proportional across all cables, the axial force magnitude (within the analyzed range) has negligible impact on the main-span modal shapes and frequencies, but it does affect global modal shapes. Therefore, global modal similarity should also be assessed when evaluating system condition alongside main-span dynamics.
  • Cable axial forces strongly influence cable natural frequencies. This study considered only uniform increases in cable tension; future work will assess the effects of uneven force changes on the bridge’s modal forms.
  • Precise determination of axial cable forces from dynamic parameters requires simultaneous measurements on many (ideally all) cables and identification of their mode shapes.
  • In the case of the measurement on a single cable, some of the identified natural frequencies for cables can be mistaken for the global natural frequencies of the pedestrian bridge.
  • The results of dynamic measurement of cables suggest that the real structure works like in Model 2—the rigidity of the connection is higher than in Model 1, and as a consequence, the axial force distribution is uniform. Axial forces in internal and external cables (e.g., WNNW and WNSW) were nearly equal.
  • Cable force magnitudes inferred from experimental free vibration frequencies were much lower than those obtained by matching the numerical model to archival grade-line displacements. Possible reasons include the following:
    • The unknown construction technology of the facility due to the lack of documentation; in particular, the value of the possible execution lift and the tension force applied to the cables. In the analyzed model, the execution lift was not applied;
    • The exact parameters of cables are unknown; the model was prepared based on assumptions set in archival technical expertise;
    • Renovations and component replacements may have altered current structural behavior;
    • Aging mechanisms over nearly 30 years (e.g., rheological effects) likely reduced cable forces;
    • Flood events submerged anchor blocks and could have modified anchorage conditions, thereby affecting cable forces.
  • Further examinations are planned (e.g., simultaneous vibration measurements of cables, pylons, and main span), and a search for archival documentation has been commissioned.
  • In the area of model verification and validation, the application of multicriteria optimization techniques is planned to tune the individual tension in each cable to the data obtained from the dynamic experiment, as well as including eventual initial elevation, changes in the mass (losses caused by corrosion, excesses related to a thick layer of paint), and degradation of the supports’ elements.
Dynamic measurement of the analyzed footbridge should be preceded by preliminary computer modal analyses to obtain, from numerical calculation, points at which the first and second modes of the bridge have nodes (no vibrations) or the largest displacements. Based on this, the first point should be determined where the second mode has nodes, and the second point where the second mode has the largest displacements. Measurement in these points will allow for the identification of the first (symmetric) and second (antisymmetric) modes of free vibration of the bridge. Additionally, simultaneous measurements should be taken on the cables at a height accessible to the researchers and on the pylon at mid-height or a height accessible to the researchers. Ideally, measurements should be taken on both sides of the bridge. However, in the case of a lack of sufficient sensors (measured directions), measurements on one side of the bridge are acceptable (main span, one pylon, and each of the parts of cables passing through the pylon). In this case, analogous measurements for the other side of the bridge should be repeated. Finally, the number of points where accelerations are measured during free vibration depends on the researcher’s capabilities.
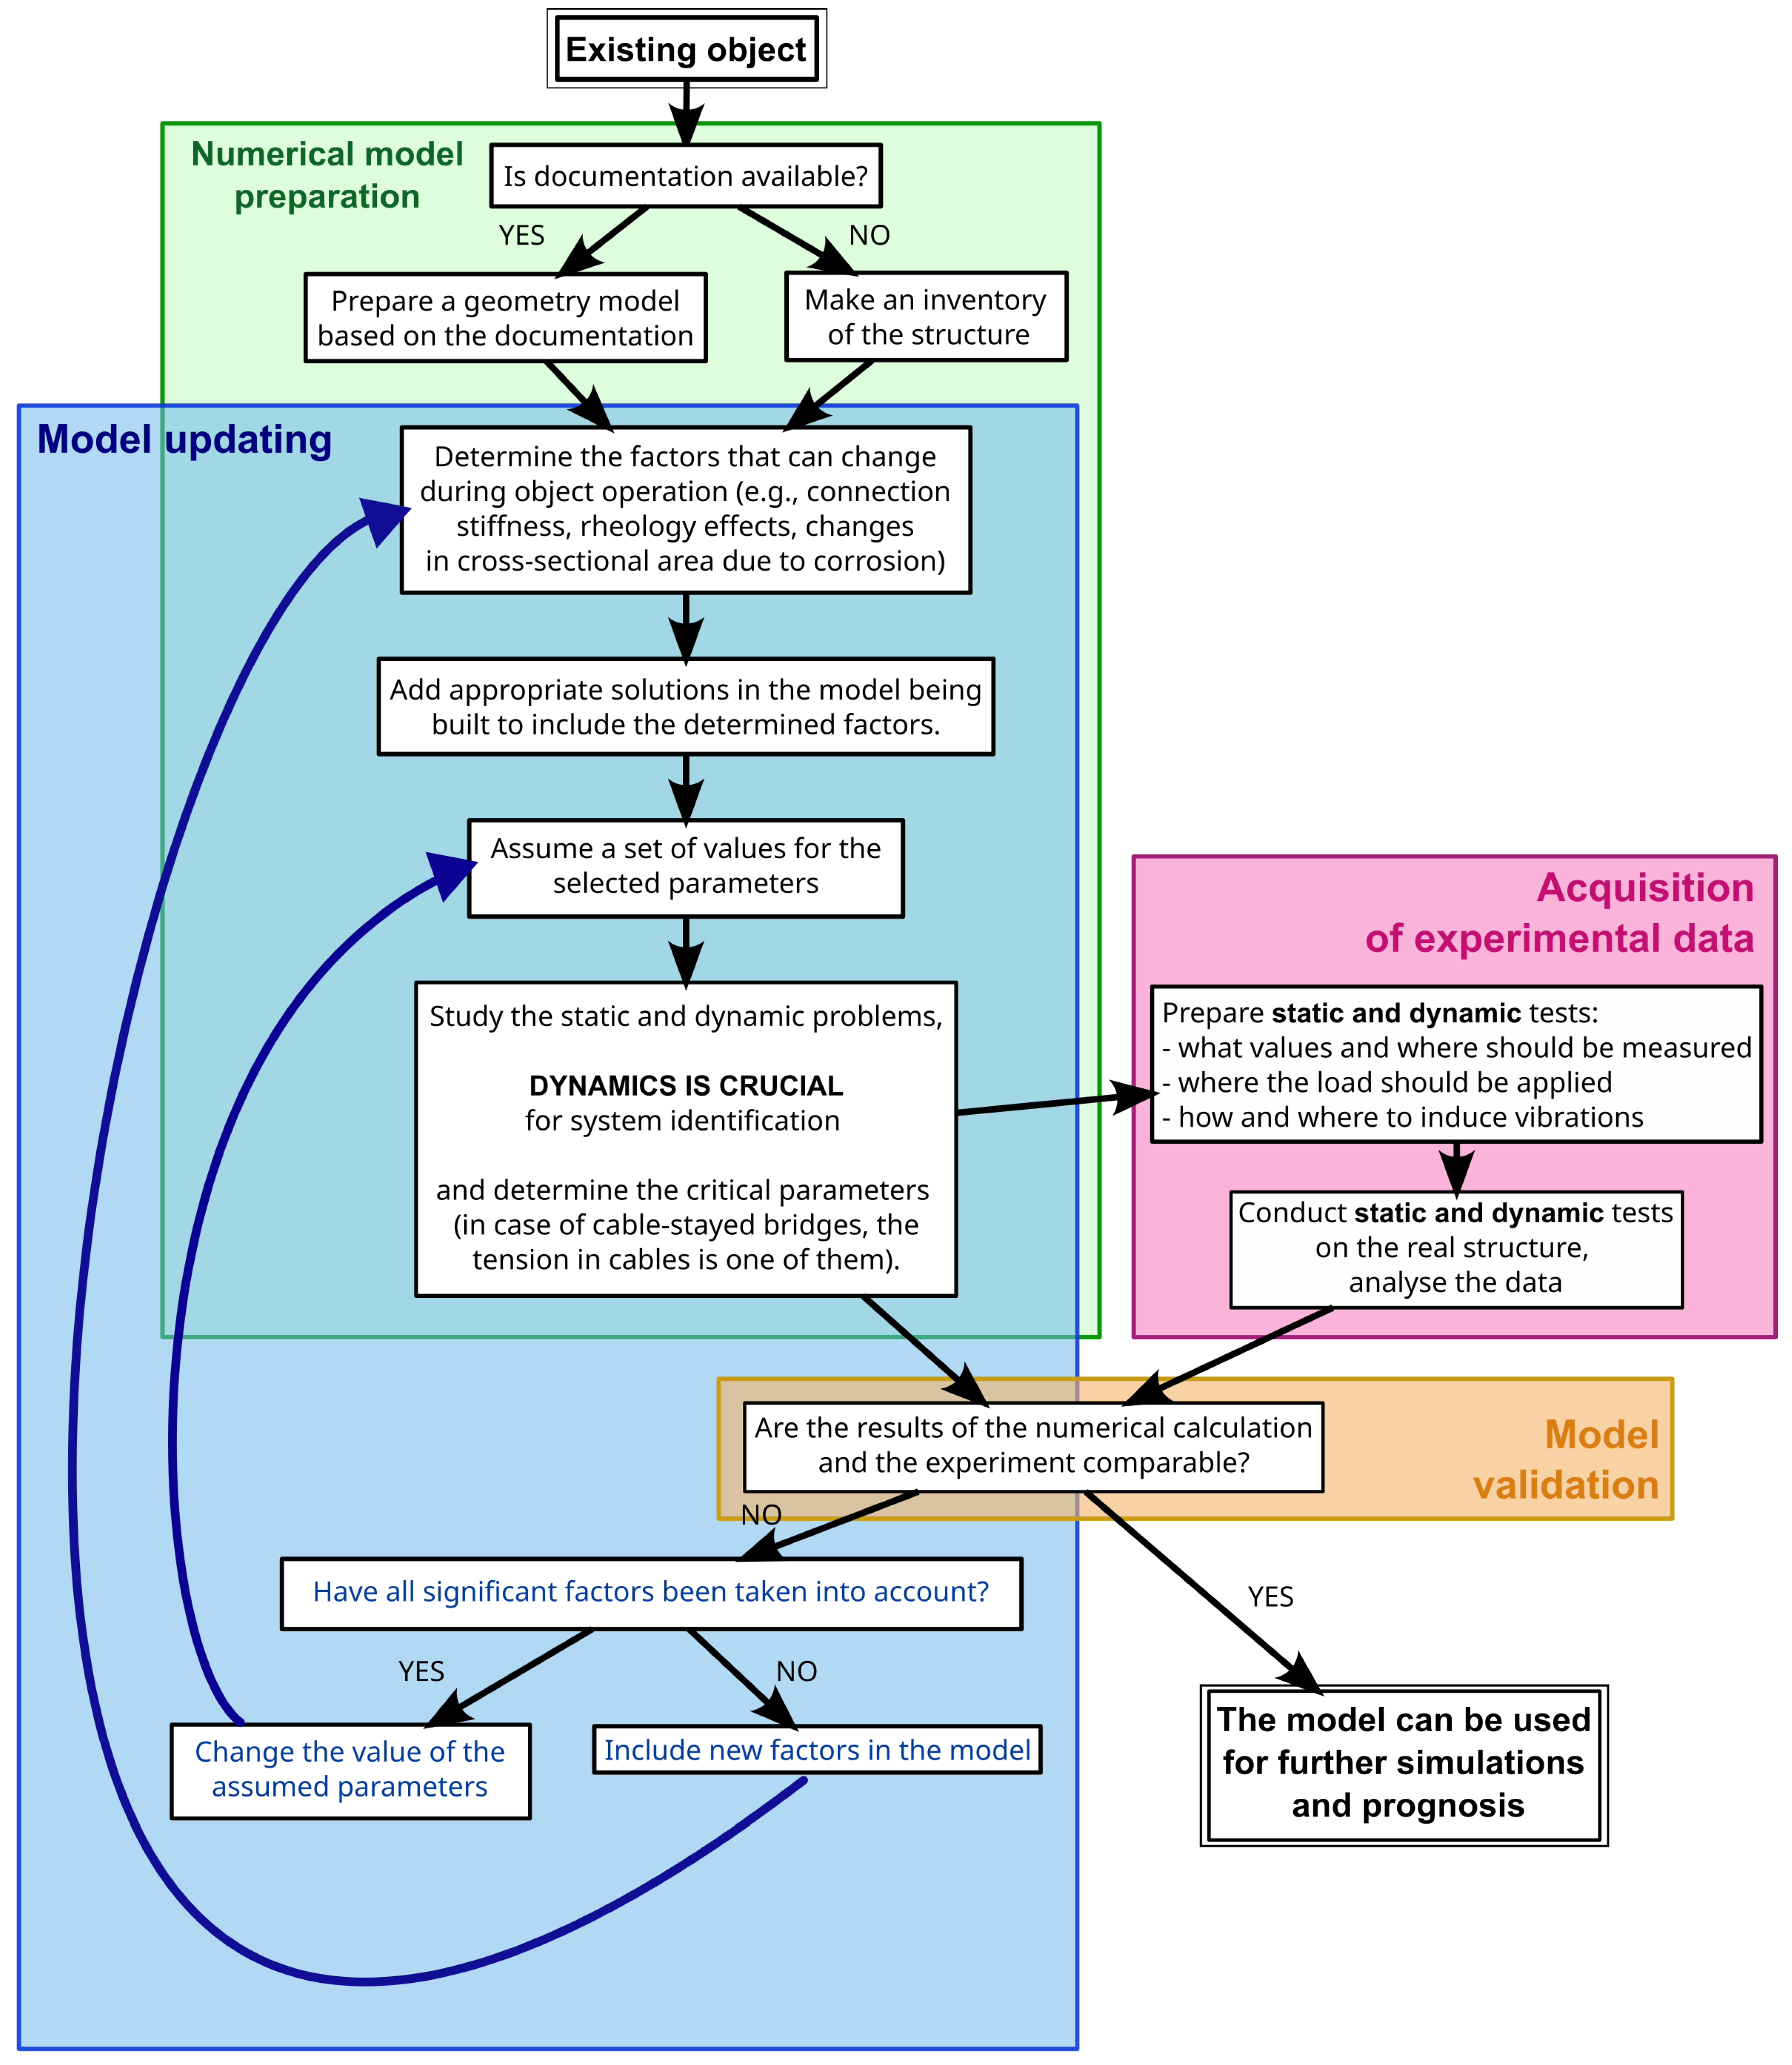
Every structure is a unique system (at least due to the real boundary conditions in supports, or material structure, which is not perfect). There is no one rigid procedure to successfully develop numerical models of a degraded footbridge, but some universal recommendations are specified in the flowchart (Figure 11). All the steps from the first numerical model preparation, planning, and conducting the experiment, model validation, and updating have to consider both static and dynamic parameters (which are crucial for cable-stayed pedestrian footbridges). Various updating techniques exist in the literature; for FEM models of cable-stayed footbridges, methods such as evolutionary game theory [65] or polynomial chaos expansion-driven Bayesian inference [66] may be helpful.

5. Conclusions

Civil engineering structures that have been in service for decades require careful periodic inspections. The absence of precise project documentation and records of completed renovations makes it difficult to understand structural behavior and, consequently, to model the structure. Even the assumption regarding structural connections based on engineering experience could be wrong. Over time, service conditions may alter connection stiffnesses. The nodes in which the specified type of movement should be possible in real structure can be stiffer than those adopted at the design stage and vice versa. For the analyzed bridge, numerical results matched dynamic measurements better when pylon–cable connections were modeled as rigid (i.e., without cable movement in the pylon sleeve). Cable tensions may change over time due to rheological effects, and cross-sections may be reduced because of corrosion. Validating numerical models against real structures is always challenging, and these aging-related factors complicate the process for older bridges.
General recommendations for structural health monitoring using numerical models, particularly for cable-stayed footbridges, are as follows:
  • Over time, boundary conditions, material properties, geometry, and connections may change in all structures; in cable-stayed or suspension bridges, cable tension may also change.
  • The structure should be measured as a whole; interactions among elements can be assessed via correlations of measured properties.
  • Static tests alone may not suffice to validate a numerical model; missing information can often be obtained from dynamic parameters.
  • Numerical calculations can assist structural diagnosis. Models are often idealized, but real structures are not; comparing numerical and measured data can indicate potential damage locations.
The conclusions highlighted in points 2 and 3 represent the main scientific novelty of this work.

Author Contributions

Conceptualization, D.Z. and E.B.-B.; Methodology, D.Z. and E.B.-B.; Software, D.Z. and E.B.-B.; Investigation, D.Z. and E.B.-B.; Writing—original draft, D.Z. and E.B.-B.; Visualization, D.Z.; Supervision, E.B.-B. All authors have read and agreed to the published version of the manuscript.

Funding

The research leading to these results has received funding from the commissioned task entitled “VIA CARPATIA Universities of Technology Network named after the President of the Republic of Poland Lech Kaczyński”, under the special purpose grant from the Minister of Science, contract no. MEiN/2022/DPI/2578 action entitled “In the neighborhood—inter-university research internships and study visits”.

Institutional Review Board Statement

Not applicable.

Informed Consent Statement

Not applicable.

Data Availability Statement

The raw data supporting the conclusions of this article will be made available by the authors on request.

Acknowledgments

The authors would like to thank Jarosław Bęc from the Department of Structural Mechanics, Lublin University of Technology for the participation in cable dynamic tests; Grzegorz Oleniacz and Students of the Student Scientific Club ‘GLOB’: Sebastian Konieczny, Sabina Jochymek, Bartłomiej Rzeszytyło, and Tomasz Wach for the taking measurements of the footbridge vertical displacement under the static load; members of the Department of Structural Mechanics, Rzeszów University of Technology, who were involved in static and dynamic examination of the footbridge; and students, who helped with loading the object as well as Municipal Road Authority in Rzeszów for the making the facility available for research.

Conflicts of Interest

The authors declare no conflicts of interest. The funders had no role in the design of the study; in the collection, analyses, or interpretation of data; in the writing of the manuscript; or in the decision to publish the results.

Abbreviations

The following abbreviations are used in this manuscript:
FEMFinite Element Method
GCSGlobal Coordinate System
SHMStructural Health Monitoring

References

  1. 2025 Report Card for America’s Infrastructure. Bridges. American Society of Civil Engineers. 2025. Available online: https://infrastructurereportcard.org/cat-item/bridges-infrastructure/ (accessed on 30 June 2025).
  2. Li, H.N.; Ren, L.; Jia, Z.G.; Yi, T.H.; Li, D.S. State-of-the-art in structural health monitoring of large and complex civil infrastructures. J. Civ. Struct. Health Monit. 2015, 6, 3–16. [Google Scholar] [CrossRef]
  3. Inaudi, D.; Walder, R. Integrated Structural Health Monitoring Systems for High-Rise Buildings. In Proceedings of the First Middle East Conference on Smart Monitoring, Assessment and Rehabilitation of Civil Structures, Dubai, United Arab Emirates, 8–10 February 2011. [Google Scholar]
  4. Liew, J.; Rashidi, M.; Le, K.; Nazar, A.; Sorooshnia, E. Reviewing a Decade of Structural Health Monitoring in Footbridges: Advances, Challenges, and Future Directions. Remote Sens. 2025, 17, 2807. [Google Scholar] [CrossRef]
  5. Ko, J.M.; Ni, Y.Q. Technology developments in structural health monitoring of large-scale bridges. Eng. Struct. 2005, 27, 1715–1725. [Google Scholar] [CrossRef]
  6. Cunha, A.; Caetano, E. Experimental Vibration Analysis for Civil Engineering Structures: EVACES 2025—Volume 1; Springer Nature: Cham, Switzerland, 2025. [Google Scholar] [CrossRef]
  7. Cunha, A.; Caetano, E. Experimental Vibration Analysis for Civil Engineering Structures: EVACES 2025—Volume 2; Springer Nature: Cham, Switzerland, 2025. [Google Scholar] [CrossRef]
  8. Cunha, A.; Caetano, E. Experimental Vibration Analysis for Civil Engineering Structures: EVACES 2025—Volume 3; Springer Nature: Cham, Switzerland, 2025. [Google Scholar] [CrossRef]
  9. Yun, C.B.; Min, J. Smart sensing, monitoring, and damage detection for civil infrastructures. KSCE J. Civ. Eng. 2010, 15, 1–14. [Google Scholar] [CrossRef]
  10. Figueiredo, E.; Moldovan, I.; Peres, N.; Pinto, S.S.; Alves, P.; Cabral, P. Smartphone application for structural health monitoring of stay cables: Edgar Cardoso Bridge. In Proceedings of the EWSHM 2024, 11th European Workshop on Structural Health Monitoring, Potsdam, Germany, 10–13 June 2024. [Google Scholar]
  11. Jin, S.S.; Jung, H.J. Vibration-based damage detection using online learning algorithm for output-only structural health monitoring. Struct. Health Monit. 2017, 17, 727–746. [Google Scholar] [CrossRef]
  12. Silva, M.; Santos, A.; Figueiredo, E.; Santos, R.; Sales, C.; Costa, J.C. A novel unsupervised approach based on a genetic algorithm for structural damage detection in bridges. Eng. Appl. Artif. Intell. 2016, 52, 168–180. [Google Scholar] [CrossRef]
  13. Zhang, X.; Cao, M.; Solodov, I.; Zhang, Y.; Peng, J.; Xu, W. Real-time Recognition of Time-varying Tension from Dynamic Response by Synchrosqueezing Technique for Prestressed Cable-supported Bridges. In Proceedings of the International Symposium on Structural Health Monitoring and Nondestructive Testing, Saarbruecken, Germany, 4–5 October 2018. [Google Scholar]
  14. Izham, M.H.N.; Sani, M.S.M.; Rani, M.N.A.; Yunus, M.A. Damage assessment on frame structure with bolted joints based on experimental modal analysis. IOP Conf. Ser. Mater. Sci. Eng. 2019, 469, 012102. [Google Scholar] [CrossRef]
  15. Rudzik, A.; Pradelok, S.; Poprawa, G. Zmiany częstotliwości drgañ własnych kratownicowego mostu kolejowego w wyniku postępującego uszkodzenia. J. Civ. Eng. Environ. Archit. 2014, XXXI, 179–191. [Google Scholar] [CrossRef]
  16. Sulaiman, M.S.A.; Yunus, M.A.; Bahari, A.R.; Rani, M.N.A. Identification of damage based on frequency response function (FRF) data. In Proceedings of the 2nd International Conference on Automotive Innovation and Green Vehicle (AiGEV 2016), Cyberjaya, Malaysia, 3–4 August 2016; EDP Sciences: Les Ulis, France, 2016; Volume 90, p. 01025. [Google Scholar] [CrossRef]
  17. Jin, C.; Jang, S.; Sun, X.; Li, J.; Christenson, R. Damage detection of a highway bridge under severe temperature changes using extended Kalman filter trained neural network. J. Civ. Struct. Health Monit. 2016, 6, 545–560. [Google Scholar] [CrossRef]
  18. Yi, T.H.; Li, H.N.; Gu, M. Optimal sensor placement for structural health monitoring based on multiple optimization strategies. Struct. Des. Tall Spec. Build. 2011, 20, 881–900. [Google Scholar] [CrossRef]
  19. Tan, Y.; Zhang, L. Computational methodologies for optimal sensor placement in structural health monitoring: A review. Struct. Health Monit. 2019, 19, 1287–1308. [Google Scholar] [CrossRef]
  20. Zhao, J.; Wu, X.; Sun, Q.; Zhang, L. Optimal Sensor Placement for a Truss Structure Using Particle Swarm Optimisation Algorithm. Int. J. Acoust. Vib. 2017, 22, 439–447. [Google Scholar] [CrossRef]
  21. Sun, H.; Büyüköztürk, O. Optimal sensor placement in structural health monitoring using discrete optimization. Smart Mater. Struct. 2016, 24, 125034. [Google Scholar] [CrossRef]
  22. Drygala, I.J.; Dulińska, J.M.; Nisticò, N. Vibration Serviceability of the Aberfeldy Footbridge under Various Human-Induced Loadings. Materials 2023, 16, 2890. [Google Scholar] [CrossRef]
  23. Bayat, E.; Milone, A.; Tubino, F.; Venuti, F. Vibration Serviceability Assessment of a Historic Suspension Footbridge. Buildings 2022, 12, 732. [Google Scholar] [CrossRef]
  24. Jukowski, M.; Błazik-Borowa, E.; Bęc, J.; Bohatkiewicz, J. Dynamic structural parameters verification on the example of theoretical analysis and in situ tests of suspension footbridge. MATEC Web Conf. 2019, 262, 10007. [Google Scholar] [CrossRef]
  25. Wolert, P.J.; Kolodziejczyk, M.K.; Stallings, J.M.; Nowak, A.S. Non-destructive Testing of a 100-Year-Old Reinforced Concrete Flat Slab Bridge. Front. Built Environ. 2020, 6, 31. [Google Scholar] [CrossRef]
  26. Drygala, I.J.; Dulinska, J.M.; Ciura, R.; Lachawiec, K. Vibration Serviceability of Footbridges: Classical vs. Innovative Material Solutions for Deck Slabs. Materials 2020, 13, 3009. [Google Scholar] [CrossRef]
  27. Jiménez-Alonso, J.F.; Pérez-Aracil, J.; Hernández Díaz, A.M.; Sáez, A. Effect of Vinyl Flooring on the Modal Properties of a Steel Footbridge. Appl. Sci. 2019, 9, 1374. [Google Scholar] [CrossRef]
  28. Li, Y.; Xiao, J.X.; Li, C.; Li, J.W. Investigations on the Influence of Pedestrians on the Buffeting of a Long-Span Suspension Footbridge. Int. J. Steel Struct. 2023, 23, 844–859. [Google Scholar] [CrossRef]
  29. Hawryszków, P.; Biliszczuk, J. Vibration Serviceability of Footbridges Made of the Sustainable and Eco Structural Material: Glued-Laminated Wood. Materials 2022, 15, 1529. [Google Scholar] [CrossRef]
  30. Li, Y.; Yin, D.S.; Wang, J.H.; Li, J.W. Framework for Calculating the Vertical Human-Induced Vibration of the Suspension Footbridge Under the Random Pedestrian Flow. Int. J. Steel Struct. 2022, 22, 1322–1340. [Google Scholar] [CrossRef]
  31. Gocál, J.; Vičan, J.; Odrobiňák, J.; Hlinka, R.; Bahleda, F.; Wdowiak-Postulak, A. Experimental and Numerical Analyses of Timber–Steel Footbridges. Appl. Sci. 2024, 14, 3070. [Google Scholar] [CrossRef]
  32. Venuti, F.; Domaneschi, M.; Lizana, M.; Glisic, B. Finite Element Models of a Benchmark Footbridge. Appl. Sci. 2021, 11, 9024. [Google Scholar] [CrossRef]
  33. Pańtak, M. Ground Reaction Forces Generated by Runners—Harmonic Analyses and Modelling. Appl. Sci. 2020, 10, 1575. [Google Scholar] [CrossRef]
  34. Van Nimmen, K.; Vanwanseele, B.; Van den Broeck, P. Reconstruction of the Vertical Dynamic Running Load from the Registered Body Motion. Vibration 2022, 5, 464–482. [Google Scholar] [CrossRef]
  35. Lucà, F.; Berardengo, M.; Manzoni, S.; Scaccabarozzi, D.; Vanali, M.; Drago, L. Experimental Evaluation of the Driving Parameters in Human–Structure Interaction. Vibration 2022, 5, 121–140. [Google Scholar] [CrossRef]
  36. García-Diéguez, M.; Zapico-Valle, J.L. Sensitivity of the Vertical Response of Footbridges to the Frequency Variability of Crossing Pedestrians. Vibration 2018, 1, 290–311. [Google Scholar] [CrossRef]
  37. Hawryszków, P.; Pimentel, R.; Silva, R.; Silva, F. Vertical Vibrations of Footbridges Due to Group Loading: Effect of Pedestrian–Structure Interaction. Appl. Sci. 2021, 11, 1355. [Google Scholar] [CrossRef]
  38. Gallegos-Calderón, C.; Naranjo-Pérez, J.; Díaz, I.M.; Goicolea, J.M. Identification of a Human-Structure Interaction Model on an Ultra-Lightweight FRP Footbridge. Appl. Sci. 2021, 11, 6654. [Google Scholar] [CrossRef]
  39. Bedon, C.; Drygala, I.J.; Dulinska, J.M.; Jasińska, D. Application of optimized spring–mass–damper pedestrian load models for vibration assessment of footbridges: Numerical and experimental investigation of a cable-stayed system. Arch. Civ. Mech. Eng. 2025, 25, 86. [Google Scholar] [CrossRef]
  40. Pancaldi, F.; Bassoli, E.; Milani, M.; Vincenzi, L. A Statistical Approach for Modeling Individual Vertical Walking Forces. Appl. Sci. 2021, 11, 10207. [Google Scholar] [CrossRef]
  41. Chen, Z.; Chen, S.; Ye, X.; Zhou, Y. A Study on a Mechanism of Lateral Pedestrian-Footbridge Interaction. Appl. Sci. 2019, 9, 5257. [Google Scholar] [CrossRef]
  42. Cuevas, R.G.; Jiménez-Alonso, J.F.; Martínez, F.; Díaz, I.M. Assessment of the Lateral Vibration Serviceability Limit State of Slender Footbridges Including the Postlock-in Behaviour. Appl. Sci. 2020, 10, 967. [Google Scholar] [CrossRef]
  43. Gao, Y.-a.; Wang, J.; Liu, M. The Vertical Dynamic Properties of Flexible Footbridges under Bipedal Crowd Induced Excitation. Appl. Sci. 2017, 7, 677. [Google Scholar] [CrossRef]
  44. Campisi, T.; Canale, A.; Tesoriere, G.; Lovric, I.; Čutura, B. The Importance of Assessing the Level of Service in Confined Infrastructures: Some Considerations of the Old Ottoman Pedestrian Bridge of Mostar. Appl. Sci. 2019, 9, 1630. [Google Scholar] [CrossRef]
  45. Tank, Y.R.; Vesmawala, G.R. Serviceability assessment of lively skywalk footbridge under dynamic loadings of human motions in the vadodara metropolitan area. Asian J. Civ. Eng. 2024, 26, 617–634. [Google Scholar] [CrossRef]
  46. Chen, D.; Huang, S.; Wang, Z. A theory of pedestrian-induced footbridge vibration comfortability based on sensitivity model. Adv. Bridge Eng. 2021, 2, 24. [Google Scholar] [CrossRef]
  47. Kim, D.K.; Kim, S.Y. Probabilistic Serviceability Assessment for Pedestrian Walkways: A Case Study on a 52-m Span Footbridge. Int. J. Steel Struct. 2025, 25, 974–989. [Google Scholar] [CrossRef]
  48. Drygala, I.J.; Nisticò, N. Design and Validation of a Fiber-Reinforced Polymer Cable-Stayed Pedestrian Bridge: Human-Induced Actions vs. Comfort Levels. Materials 2024, 17, 2842. [Google Scholar] [CrossRef]
  49. Rezende, F.; Brunet, O.; Diniz Varela, W.; Pereira, A.; Carvalho, E. Evaluation of TMD Performance in Footbridges Using Human Walking Probabilistic Models. Vibration 2021, 4, 323–340. [Google Scholar] [CrossRef]
  50. Saidin, S.S.; Jamadin, A.; Abdul Kudus, S.; Mohd Amin, N.; Anuar, M.A. An Overview: The Application of Vibration-Based Techniques in Bridge Structural Health Monitoring. Int. J. Concr. Struct. Mater. 2022, 16, 69. [Google Scholar] [CrossRef]
  51. Banas, A.; Jankowski, R. Experimental and Numerical Study on Dynamics of Two Footbridges with Different Shapes of Girders. Appl. Sci. 2020, 10, 4505. [Google Scholar] [CrossRef]
  52. Ali, A.; Sandhu, T.; Usman, M. Ambient Vibration Testing of a Pedestrian Bridge Using Low-Cost Accelerometers for SHM Applications. Smart Cities 2019, 2, 20–30. [Google Scholar] [CrossRef]
  53. Ngoc-Nguyen, L.; Ngoc-Tran, H.; Khatir, S.; Le-Xuan, T.; Huu-Nguyen, Q.; De Roeck, G.; Bui-Tien, T.; Abdel Wahab, M. Damage assessment of suspension footbridge using vibration measurement data combined with a hybrid bee-genetic algorithm. Sci. Rep. 2022, 12, 20143. [Google Scholar] [CrossRef]
  54. Jin, S.S.; Cho, S.; Jung, H.J.; Lee, J.J.; Yun, C.B. A new multi-objective approach to finite element model updating. J. Sound Vib. 2014, 333, 2323–2338. [Google Scholar] [CrossRef]
  55. Dong, L.; Qi, G.; Bo, G.; Zishu, Z.; Zheng, L. Mechanical performance assessment of self-anchored suspension footbridge based on integral configuration. J. Civ. Struct. Health Monit. 2023, 13, 1683–1693. [Google Scholar] [CrossRef]
  56. Miśkiewicz, M.; Pyrzowski, L.; Sobczyk, B. Short and Long Term Measurements in Assessment of FRP Composite Footbridge Behavior. Materials 2020, 13, 525. [Google Scholar] [CrossRef]
  57. Ao, W.K.; Hester, D.; O’Higgins, C.; Brownjohn, J. Tracking long-term modal behaviour of a footbridge and identifying potential SHM approaches. J. Civ. Struct. Health Monit. 2024, 14, 1311–1337. [Google Scholar] [CrossRef]
  58. Mostek, P.; Patruś, P.; Miąsik, I.; Siwowski, T. Technical Expertise of the Pedestrian Bridge over the Wisłok River Along Podwisłocze Street in Rzeszów; Technical report; PP “Promost Consulting”: Rzeszów, Poland, 2005. (In Polish) [Google Scholar]
  59. Janas, L.; Basiaga, R. Badania dynamiczne podwieszonej kładki dla pieszych w Rzeszowie. Zesz. Nauk. Politech. Rzesz. Bud. Inżynieria Środowiska 2010, 57, 5–19. [Google Scholar]
  60. BEAM188. ANSYS, Inc. Available online: https://ansyshelp.ansys.com/public/account/secured?returnurl=/Views/Secured/corp/v251/en/ans_elem/Hlp_E_BEAM188.html?q=Beam188/ (accessed on 10 May 2025).
  61. CABLE280. ANSYS, Inc. Available online: https://ansyshelp.ansys.com/public/account/secured?returnurl=/Views/Secured/corp/v251/en/ans_elem/Hlp_E_CABLE280.html (accessed on 10 May 2025).
  62. Kładka na Rzeszowskich Bulwarach Będzie Jak Nowa, ale bez Miłości. Rzeszów News, 21 February 2017. Available online: https://rzeszow-news.pl/kladka-rzeszowskich-bulwarach-bedzie-nowa-bez-milosci/ (accessed on 10 May 2025). (In Polish)
  63. Obara, P. Verification of Orthotropic Model of Wood. Arch. Civ. Eng. 2018, 64, 31–44. [Google Scholar] [CrossRef]
  64. Jarominiak, A. Nieniszczące metody kontroli stanu kabli mostów kablobetonowych i podwieszonych. Drogownictwo 2019, 354, 339–346. (In Polish) [Google Scholar]
  65. Jiménez-Alonso, J.F.; Suzana, E.; Duvnjak, I.; de Sá Caetano, E. Evolutionary game theory-based finite element model updating of a moveable cable-stayed footbridge. J. Civ. Struct. Health Monit. 2024, 15, 355–370. [Google Scholar] [CrossRef]
  66. Han, Z.; Li, Y.; Abdel Wahab, M. Polynomial chaos expansion-driven Bayesian inference for multi-parameter identification of large-span curved footbridge. Structures 2025, 80, 110035. [Google Scholar] [CrossRef]
Figure 1. Pedestrian bridge via the Wisłok River in Rzeszów, (a) view from the north, (b) anchor blocks on the west side, (c) bridge deck suspension system.
Applsci 15 10798 g001
Figure 2. Scheme of the pylon column head.
Applsci 15 10798 g002
Figure 3. Scheme of pedestrian bridge over the Wisłok River in Rzeszów modeled in ANSYS. (a) General view with the description of cables names (WNNW, WNSW, etc.), and the directions of the Global Coordinate System (GCS). (b) Top view of the modeled object with the location of red points for displacement measurement in the static loading test.
Applsci 15 10798 g003
Figure 4. Applied boundary conditions, UX, UY, and UZ displacements appropriately along X, Y, and Z axes of GCS, RX, RY, RZ rotations appropriately around X, Y, and Z axes of GCS.
Applsci 15 10798 g004
Figure 5. (a) Pedestrian bridge during static measurements; view from the northeast. (b) Triaxail accelerometer.
Applsci 15 10798 g005
Figure 6. (a) Raw acceleration signal registered on WNNW, excitation—background. (b) Signals registered for WNNW after transformation into the frequency domain, taking into account the location of the source of excitation; e.1, e.2, e.3 refers to the excitation number on the selected cable.
Applsci 15 10798 g006
Figure 7. The selected global mode shapes obtained for the systems with the tension in cables suitable for the footbridge grade line (a,c,e,g) for Model 1, and for Model 2 (b,d,f,h).
Applsci 15 10798 g007
Figure 8. First local modal form for the western pylon.
Applsci 15 10798 g008
Figure 9. Comparison of selected modal forms taking into account the pre-tension in cables (a,b) Model 2A, and (c,d) Model 2.
Applsci 15 10798 g009
Figure 10. Force–frequency relation for first (f1) and second (f2) modal frequency for cable WNNW for both models with (Model 1) and without releases (Model 2).
Applsci 15 10798 g010
Figure 11. Flowchart of the development procedure of numerical models of degraded pedestrian footbridges.
Applsci 15 10798 g011
Table 1. Applied numerical models—summary of differences.
Level of Tension in the Cables to Obtain:Connection Between the Cable and the Pylon or Main Span
End Releases AppliedNo End Releases
Vertical displacement for the grade lineModel 1Model 2
Natural frequencies for the cablesModel 1AModel 2A
Table 2. Properties of materials used in numerical model.
MaterialYoung’s ModulusPoisson’s RatioShear ModulusDensity
E ν G ρ
[GPa][-][GPa][kg/m3]
Steel2000.376.97850
Steel for cables1000.338.47850
Timber for booms12.90.2765.0550
Timber for bridge deck E x = 12.9 ν x y = 0.276 G x y = 0.9 550
E y = 0.4 ν y z = 0.352 G y z = 0.09
E z = 10.2 ν x z = 0.355 G x z = 0.8
Table 3. Comparison of numerically obtained displacements and the measured values (EXP).
Compared Property:Model 1Model 1AModel 2Model 2AEXP
Vertical displacements caused by dead weight and tension applied to cables, w ( S t 1 ) [mm]
N2 | S2129 | 129−63 | −63130| 130−60 | −60not measured
N3 | S3179 | 179−92 | −92180 | 180−88 | −88not measured
N4 | S4132 | 132−64 | −64133 | 133−62 | −62not measured
Vertical displacements caused by static load, Δ w = w ( S t 2 ) w ( S t 1 ) , [mm]
N2 | S2−7 | −7−7 | −7−7 |−7−7 |−7−5 |−5 ± 2
N3 | S3−11 | −11−11 | −11−11 |−11−11 |−11−9 |−9 ± 2
N4 | S4−7 | −7−7 | −7−7 | −7−7 | −7−4 | −5 ± 2
Table 4. Comparison of numerical results—forces in cables [kN].
Compared Property:Model 1Model 1AModel 2Model 2A
WNNW82.144.374.037.7
WNSW60.732.373.737.8
WSNW60.732.373.737.8
WSSW82.144.374.037.7
WNNE79.143.174.440.4
WNSE60.532.565.336.1
WSNE60.532.565.336.2
WSSE79.143.174.440.4
ENNW84.240.479.537.8
ENSW30.564.569.733.9
ESNW30.564.569.734.0
ESSW84.240.479.637.8
ENNE86.641.177.935.1
ENSE64.130.077.635.1
ESNE64.130.077.635.1
ESSE86.641.177.935.1
Table 5. Comparison of MAC for the selected modal forms for Model 1 and Model 2 (presented visually in Figure 7).
Model 2
Mode 1Mode 2Mode 37Mode 39
Model 1Mode 10.99960.00000.13550.0000
Mode 40.00001.00000.00000.0000
Mode 390.14000.00000.97550.0000
Mode 410.00000.00000.00000.9999
Table 6. Comparison of numerical and experimental (EXP) results—natural frequencies for the footbridge deck [Hz].
Compared Property:Model 1Model 1AModel 2Model 2AEXP 1EXP 2
first horizontal mode (no.)1.3758 (1)1.3703 (1)1.3962 (1)1.3944 (1)1.311.16
first vertical mode (no.)1.6769 (4)1.6521 (4)1.6851 (2)1.667 (2)1.961.75
1 based on [59], 2 based on current measurements.
Table 7. Comparison of first three natural frequenccies ([Hz]) for the cables.
Cable NameModel 1Model 1AModel 2Model 2AEXP
f 1 f 2 f 3 f 1 f 2 f 3 f 1 f 2 f 3 f 1 f 2 f 3 f 1 ¯ σ f 1 f 2 ¯ σ f 2 f 3 ¯ σ f 3
[Hz][Hz][Hz][Hz][Hz][Hz][Hz][Hz][Hz][Hz][Hz][Hz][Hz][Hz][Hz][Hz][Hz][Hz]
WNNW2.845.688.592.104.176.302.705.408.171.943.845.81 1.97 0.12 3.92 0.11 5.86 0.12
WNSW2.454.897.391.793.565.382.705.388.141.943.845.81 1.97 0.12 3.92 0.13 5.86 0.13
WSNW2.454.897.391.793.565.382.705.388.141.943.845.81 1.83 0.15 3.55 0.11 5.31 0.11
WSSW2.845.688.592.104.186.302.705.408.171.943.845.81 1.91 0.08 3.78 0.05 5.71 0.06
WNNE3.176.379.492.344.707.073.096.199.352.284.556.86 2.46 0.12 5.06 0.18 7.21 0.22
WNSE2.795.558.452.054.086.202.905.808.802.164.316.54 2.18 0.12 4.39 0.07 6.69 0.15
WSNE2.795.558.452.054.086.202.905.808.802.164.316.54 2.23 0.07 4.13 0.09 6.32 0.17
WSSE3.176.379.492.344.707.073.096.199.352.284.556.86 2.22 0.08 4.17 0.12 6.30 0.20
ENNW3.276.569.782.274.556.853.196.409.662.214.416.65 2.12 0.10 4.05 0.13 6.14 0.17
ENSW2.885.748.721.993.916.003.006.009.092.104.186.34 1.99 0.10 3.70 0.14 5.45 0.12
ESNW2.885.748.721.993.916.003.006.009.092.104.186.34 2.11 0.07 4.17 0.15 6.12 0.17
ESSW3.276.569.782.274.556.853.196.409.662.214.416.65 2.16 0.08 4.28 0.06 6.39 0.17
ENNE3.046.099.192.114.196.342.895.788.741.953.875.86 1.83 0.10 3.49 0.12 5.24 0.16
ENSE2.625.247.921.803.585.412.885.768.711.953.875.86 1.92 0.11 3.64 0.18 5.36 0.13
ESNE2.625.247.921.803.585.412.885.768.711.953.875.86 1.94 0.11 3.60 0.20 5.37 0.15
ESSE3.046.099.192.114.206.342.895.788.731.953.875.86 2.00 0.09 3.90 0.11 5.72 0.10
Disclaimer/Publisher’s Note: The statements, opinions and data contained in all publications are solely those of the individual author(s) and contributor(s) and not of MDPI and/or the editor(s). MDPI and/or the editor(s) disclaim responsibility for any injury to people or property resulting from any ideas, methods, instructions or products referred to in the content.