Article

Detecting and Exploring Homogeneous Dense Groups via k-Core Decomposition and Core Member Filtering in Social Networks

1
College of Information and Cyber Security, People’s Public Security University of China, Beijing 100038, China
2
Science and Technology and Informatization Corps of Sichuan Provincial Public Security Department, Chengdu 610031, China
3
School of Cyber Security and Defense, Anhui Police College, Hefei 238076, China
*
Authors to whom correspondence should be addressed.
These authors contributed equally to this work.
Appl. Sci. 2025, 15(19), 10753; https://doi.org/10.3390/app151910753
Submission received: 13 September 2025 / Revised: 30 September 2025 / Accepted: 3 October 2025 / Published: 6 October 2025

Abstract

Exploring homogeneous dense groups is one of the important issues in social network structure measurement. k-core decomposition and core member filtering are common methods to uncover homogeneous dense groups in a network. However, existing methods of k-core decomposition struggle to support in-depth exploration of homogeneous dense groups. To address this issue, we store social networks in a graph database, taking advantage of its characteristics such as property indexes and batch queries. Based on this storage, we propose a k-core decomposition algorithm to improve the efficiency of homogeneous dense group detection. Subsequently, we introduce a core member filtering algorithm for identifying core members, a key exploration goal of this study. In experiments, we verify the efficiency of the k-core decomposition algorithm. Finally, we conduct an in-depth analysis of the characteristics of k-cores and their core members, yielding several important conclusions. For example, the relationship between the core number and the number of nodes obeys the power law distribution. In addition, we find that despite the strong connection of the core members, they do not play an important role in the information spreading of social networks.

1. Introduction

Graph theory provides a mathematical framework for modeling relationships among entities, which has a wide range of applications in many fields, such as social networks [1], biology [2], and financial analysis [3]. In different fields, analyzing the global or local structural characteristics of graphs helps us understand complex systems.
Among different characteristics, it is important to explore homogeneous dense groups within a graph. A homogeneous dense group is a group within a graph defined by the followers two key aspects. It is structurally cohesive with dense internal connections relative to external ones, and its members share a high degree of similarity across one or more key properties [4]. Numerous concepts facilitate the identification of homogeneous dense groups in a graph. For example, a clique [5] is a type of homogeneous dense groups, which is defined as a complete subgraph. In a clique, all vertices are connected with each other, thus making the group sufficiently cohesive. However, determining a clique of maximum cardinality in a graph, i.e., the maximum clique problem (MCP), is an NP-hard problem. The inefficient algorithms limit the application of cliques in many problems.
On the contrary, the concept of k-core is used to efficiently identify homogeneous dense groups, avoiding the use of more complex and computationally intensive algorithmic techniques [6]. The k-core of a graph is the maximum induced subgraph where the number of neighbors of every vertex is greater than a certain number. The process of core decomposition determines the core number of all vertices in the graph. Batagelj et al. [7] proposed the first algorithm for k-core decomposition. This algorithm completes the core decomposition of a graph in linear time relative to the number of edges. However, this type of method relies on in-memory computation, which has two major limitations. (1) It consumes a large amount of memory when processing large-scale graphs. When the size of the graph becomes sufficiently large, it cannot support k-core decomposition. For example, using the method of Khaouid et al. [8], the relationship between memory usage and the number of edges is shown in Figure 1. (2) The results are required to be persisted to secondary storage. However, subsequent analyses necessitate an in-memory reorganization of the graph structure. This process involves intensive I/O scheduling and creates significant disk fragmentation, which in turn degrades the performance of these analyses. This is a key reason why other existing methods struggle to support subsequent analyses.
To address the above issues, we need to employ an appropriate approach for the storage of social networks. The storage method should support computation on large-scale graph data and facilitate multiple subsequent analyses. The graph database is capable of fulfilling these requirements. There are two advantages of graph databases in k-core computation. (1) Due to the unique storage structure of graph databases, data and their related relationships can be quickly retrieved. (2) Since graph databases support real-time writing, computational results can be written into the graph database, avoiding the consumption of a large amount of memory and facilitating subsequent relationship analysis. However, existing methods [7,9,10] are inefficient when performed in graph databases because they use adjacency lists to store the graph, which is not suitable for graph databases. Therefore, we propose a k-core decomposition algorithm based on graph databases, which obtains the core number of all nodes and writes the results into the graph database. Overall, our work represents the first implementation of the k-core decomposition process in JanusGraph. Leveraging the features of this graph database, our method is 11.3 times faster than the baseline method on average.
After performing k-core decomposition, some nodes exhibit higher core numbers. We refer to these nodes as ’core members’. Core members are the ones that get more attention when analyzing social networks. Although the core number of all nodes has been calculated in most studies, due to the aforementioned problem of graph reorganization, it is still not possible to quickly identify and analyze core members. Therefore, with the help of a graph database and the proposed k-core decomposition algorithm, we provide a core member filtering method to efficiently find the high core number nodes. This approach transforms the task of identifying core members from a complex data reorganization problem into a simple and efficient database query, by leveraging the k-core results persisted as an indexed node property.
Additionally, we examine homogeneous dense groups derived from k-core decomposition and core member filtering, approaching our analysis from three perspectives. First, we investigate the relationship between node degree and core number, which enables the identification of key individuals in the network. Second, we explore the statistical properties of core numbers and core members, highlighting the distribution among them. In this context, we also analyze how the size of these core members correlates with various fundamental graph characteristics (e.g., density, the number of nodes, the number of edges, or the average node degree). Third, we focus on the information diffusion process within these cores, illustrating the homogeneous nature of these groups.
The remainder of this paper is organized as follows. Section 2 reviews related works on k-core decomposition algorithms and their applications. Section 3 provides the formal definitions of k-core, core number, and core decomposition. In Section 4, we detail our proposed k-core decomposition algorithm and the core member filtering method. Section 5 presents the experimental setup and evaluates the efficiency of our proposed method. In Section 6, we conduct a comprehensive analysis of the results, discussing the relationship between core number and degree, the statistical characteristics of core members, and their effect on information spreading. Finally, Section 7 concludes the paper.

2. Related Works

The concept of k-core was first proposed by Seidman [11]. The k-core of a graph is the maximum induced subgraph where the number of neighbors of every vertex is greater than a certain number. The computation of the k-core decomposition has attracted much attention. Batagelj et al. [7] proposed the first computation algorithm, where we recursively delete all vertices of degree less than a certain number to discover k-core. This algorithm achieves linear time complexity by sorting the vertices with the help of auxiliary arrays. However, this algorithm requires reading the entire network into memory and cannot be applied to large-scale networks. To solve this problem, algorithmic techniques utilizing both primary storage and secondary storage as computational resources were proposed. Cheng et al. [12] proposed the EMcore algorithm. In this algorithm, only part of the network is read into memory during computation, while the rest of the network is sorted on disk. Later on, Wen et al. [10] improved the EMcore algorithm by only using the relationship between the current degree of the vertex and the degrees of the neighboring vertices, which further reduces the size of memory used. Although these methods store the results of k-core decomposition on disk, the graph structure is required to be reorganized during multiple subsequent analyses, involving multiple I/O scheduling and generating a large amount of disk fragmentation, which affects the analyses.
As the scale of networks in the real world continues to expand, some researchers turn their attention to distributed and parallel algorithms for k-core decomposition. Montresor et al. [13] proposed the first distributed algorithm where each vertex updates its core number based on its neighbors’ estimates until convergence. Mandal et al. [14] implemented this algorithm on Spark. The proposed method utilizes a message-passing paradigm for k-core decomposition to reduce the I/O cost. Likewise, Esfandiari et al. [15] presented a sketching technique for k-core decomposition, which can be computed in both streaming and MapReduce. Gao et al. [16] employed a divide-and-conquer strategy to enhance existing algorithms, reducing the required computational resources and improving stability when dealing with large networks. Dasari et al. [17] proposed Park, a pioneering parallel algorithm for k-core decomposition. This algorithm mainly consists of two steps. In the scan phase, all vertices in the graph are scanned in parallel, and then the degree of each vertex is stored in the global buffer. In the loop phase, each thread continuously removes vertices from the global cache and correspondingly updates the positions of their neighboring vertices in the global cache. Kabir et al. [18] improved on this algorithm by removing the need for sub-level synchronization within the loop phase of each round, allowing each thread to only access its local buffer. However, these distributed and parallel algorithms did not consider subsequent relationship analysis. To address this issue, we implement a k-core decomposition algorithm based on graph databases to improve computational efficiency and support subsequent relationship analysis.
The k-core decomposition has been extensively used in several applications. For instance, Shin et al. [19,20] examined the characteristics of the k-core decomposition in a wide range of real-world networks. They found that the core number of the nodes of a graph has a strong positive correlation with the degree. Based on this foundation, they proceeded to perform anomaly detection on the nodes. Brown et al. [21] investigated the relationship between k-shell values and user numbers in Twitter networks. They modified k-shell decomposition to assign a logarithmic k-shell value to the users, resulting in a user metric that is well distributed in a well-fitted bell curve. Some researchers focused on the impact of k-core on the information spreading process in social networks. Kitsak et al. [22] found that the core number of a node is a good predictor of its spreading capabilities. Thus, the core number of a node can serve as a crucial indicator for identifying influential spreaders in a social network. Garas et al. [23] simulated the spreading process using a susceptible infectious recovery model in four different weighted real-world networks. They showed that the nodes with higher spreading potential are closer to the top cores.

3. Preliminaries

An undirected and unweighted graph is denoted as G ( V , E ) , where V ( G ) is the set of vertices and E ( G ) is the set of edges. Given a vertex v in a subgraph G s , deg ( v , G s ) denotes the number of neighbors of a vertex v in the subgraph G s .
Definition 1
(k-core). Given a graph G and an integer k, a k-core of graph G, denoted by G k , is a maximum subgraph of G in which the degree of every vertex is at least k, i.e.,  v V ( G k ) , deg ( v , G k ) k [11].
Definition 2
(Core number). Given a graph G, for each vertex v satisfying v V ( G ) , the core number of a vertex v, denoted by c ( v ) , is the largest k such that the vertex v is contained in the k-core, i.e.,  c ( v ) = max ( { k v V ( G k ) } ) [10].
Definition 3
(Core decomposition). Given a graph G, core decomposition is the process of computing the core number for each vertex v satisfying v V ( G ) [24].
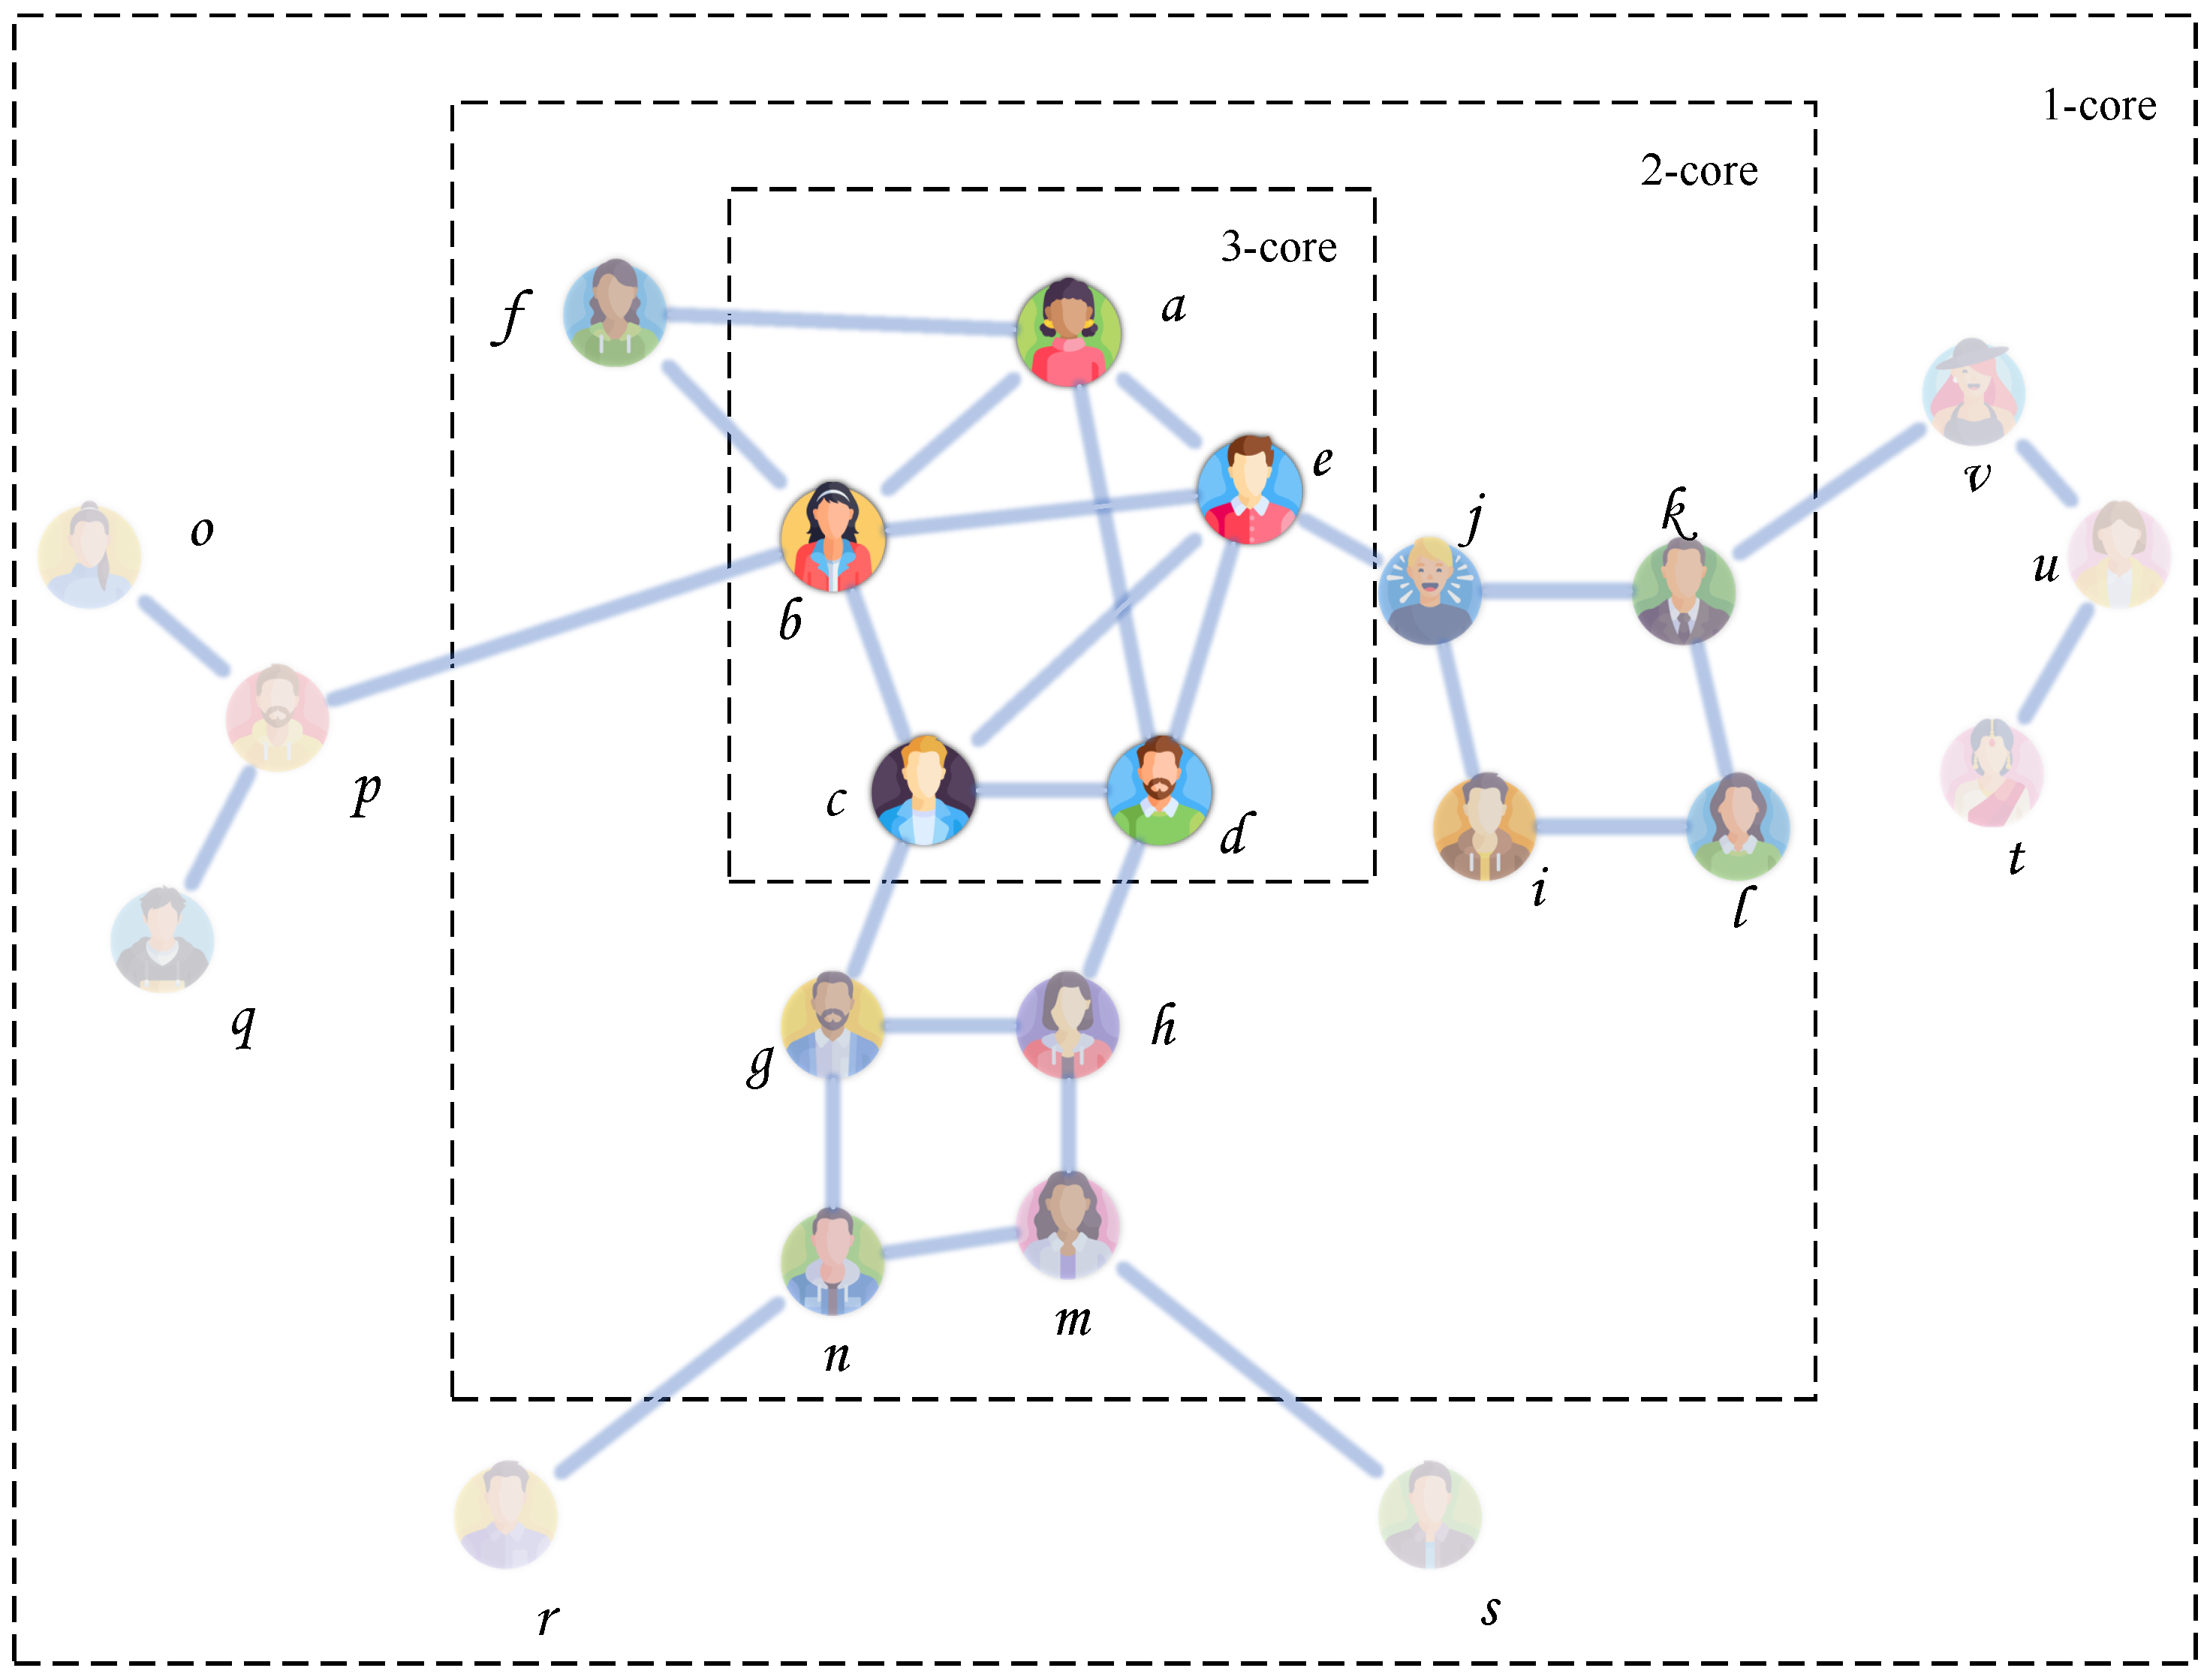
Figure 2 shows a toy graph with 22 vertices. The 1-core, 2-core, and 3-core in the graph are respectively marked in purple, gray, and blue. The 3-core consists of five vertices, a, b, c, d, and e, each of which has at least three neighboring vertices within the subgraph. The 2-core consists of all vertices in the 3-core, in addition to nine other vertices, i.e., f, g, h, i, j, k, l, m, n. Similarly, the 1-core consists of all vertices in the 2-core, in addition to eight other vertices, i.e., o, p, q, r, s, t, u, v. The process of determining the core number for each vertex in this way is called core decomposition.

4. Our Methods

4.1. k-Core Decomposition

To enable persistent storage of results and support subsequent analyses, we utilize graph databases to implement k-core decomposition. However, existing methods have low efficiency when performed in graph databases. Therefore, an improved k-core decomposition algorithm based on graph databases is proposed. This method takes advantage of two characteristics of graph databases.
The first characteristic is with regard to node properties. Each node is able to store multiple properties to record intermediate and final results, supporting subsequent analysis. Additionally, the efficiency of queries is enhanced through the indexes of properties, which is similar to relational databases.
The Twitch-Gamers [25] dataset is used as an example. This dataset is a social network of Twitch users. Vertices are Twitch users and edges are mutual follower relationships between them. We implement the storage of this dataset in a graph database and add some properties to the vertices, as shown in Table 1.
Among all these properties, the properties of views, created_at, life_time are provided in the dataset, which is used to support subsequent analysis. The properties of degree, core, status, and member are additional properties that represent the intermediate and final results of k-core decomposition and core member filtering. Specifically, the degree and status properties are used to record intermediate results during k-core decomposition. The degree property stores the number of neighboring vertices for each node, while the status property reflects whether the core number of the vertex has been determined. Due to the indexes of these properties, they can be efficiently queried during k-core decomposition, which boosts algorithm efficiency. The property of core records the final result of the k-core decomposition, i.e., the core number of each vertex. In addition, the property of member marks the core members, which is the final result of core member filtering. The method for querying core members is described in detail in the next section. This property will be used for subsequent core member analyses.
The second characteristic is with regard to batch queries. Graph databases provide batch queries that avoid the complexity of multiple traversals. We are able to obtain multiple results of a single query in k-core decomposition. The detailed process of k-core decomposition in a graph database is shown in Algorithm 1.
Algorithm 1 Algorithm for k-core decomposition in a graph database
  • Require: The graph G = ( V , E ) in a graph database with the provided properties in a dataset
  • Ensure: The graph G = ( V , E ) in a graph database with the properties related to k-core and the maximum core number l
     1:
    G G , k 1
     2:
    for each v i V  do
     3:
           status ( v i , G ) false
     4:
           degree ( v i , G ) | { u ( v i , u ) E } |
     5:
    end for
     6:
    while   { v status ( v , G ) = false }  do
     7:
            V c
     8:
           for  j = 1 to k do
     9:
                 V c V c { v degree ( v , G ) = j status ( v , G ) = false }
    10:
          end for
    11:
          if  V c  then
    12:
                for all  v m V c  do
    13:
                  core ( v m ) k
    14:
                  status ( v m ) true
    15:
                  U a d j { u ( u , v m ) E }
    16:
                 for all  u n U a d j  do
    17:
                      degree ( u n , G ) degree ( u n , G ) 1
    18:
                 end for
    19:
                end for
    20:
          else
    21:
                 k k + 1
    22:
          end if
    23:
           l k 1
    24:
    end while
    25:
    return   G , l
Lines 1–5 perform the initialization process. During this process, each node is assigned the properties of status and degree in Table 1. Specifically, the property of status of each node is allocated the value of false in line 4, which indicates that the core number of each node is not determined. In line 5, the number of neighboring vertices for each node is calculated, which is easily performed in graph databases, since graph databases store the relationships of each vertex, i.e., the adjacent vertices of each vertex.
Lines 6–19 represent the k-core decomposition process. In the loop spanning lines 8–10, nodes are identified based on their exact degree. For each value of j from 1 to k, the algorithm queries for nodes where the degree is exactly j and the status is false. These nodes belong to the k-core with a core number of k according to Definitions 1 and 2. Due to the first characteristic of graph databases mentioned before, these nodes can be quickly queried through the indexes of the properties in graph databases. Moreover, these nodes are queried in batches to enhance efficiency, which is the second characteristic mentioned before. Lines 11–16 record the intermediate and final results of k-core decomposition in the properties. Meanwhile, the neighboring nodes of each node are queried in graph databases, and the property of degree of these nodes is reduced by 1.
Compared to the existing k-core decomposition methods [7,10,12], the proposed method leverages the two characteristics of graph databases mentioned earlier to improve overall efficiency and to support subsequent analysis. Namely, we utilize the indexes of node properties and batch queries to replace traversal queries. Meanwhile, the intermediate and final results are recorded in the properties of each node. For example, in lines 8–10, instead of a single, slow range query to find all nodes with a degree less than or equal to k (which cannot use a composite index and would require a full graph scan), we perform a series of fast, exact-match queries on the indexed degree property within a loop. This is a direct application of using property indexes and batch queries to replace a much slower traversal-based operation.
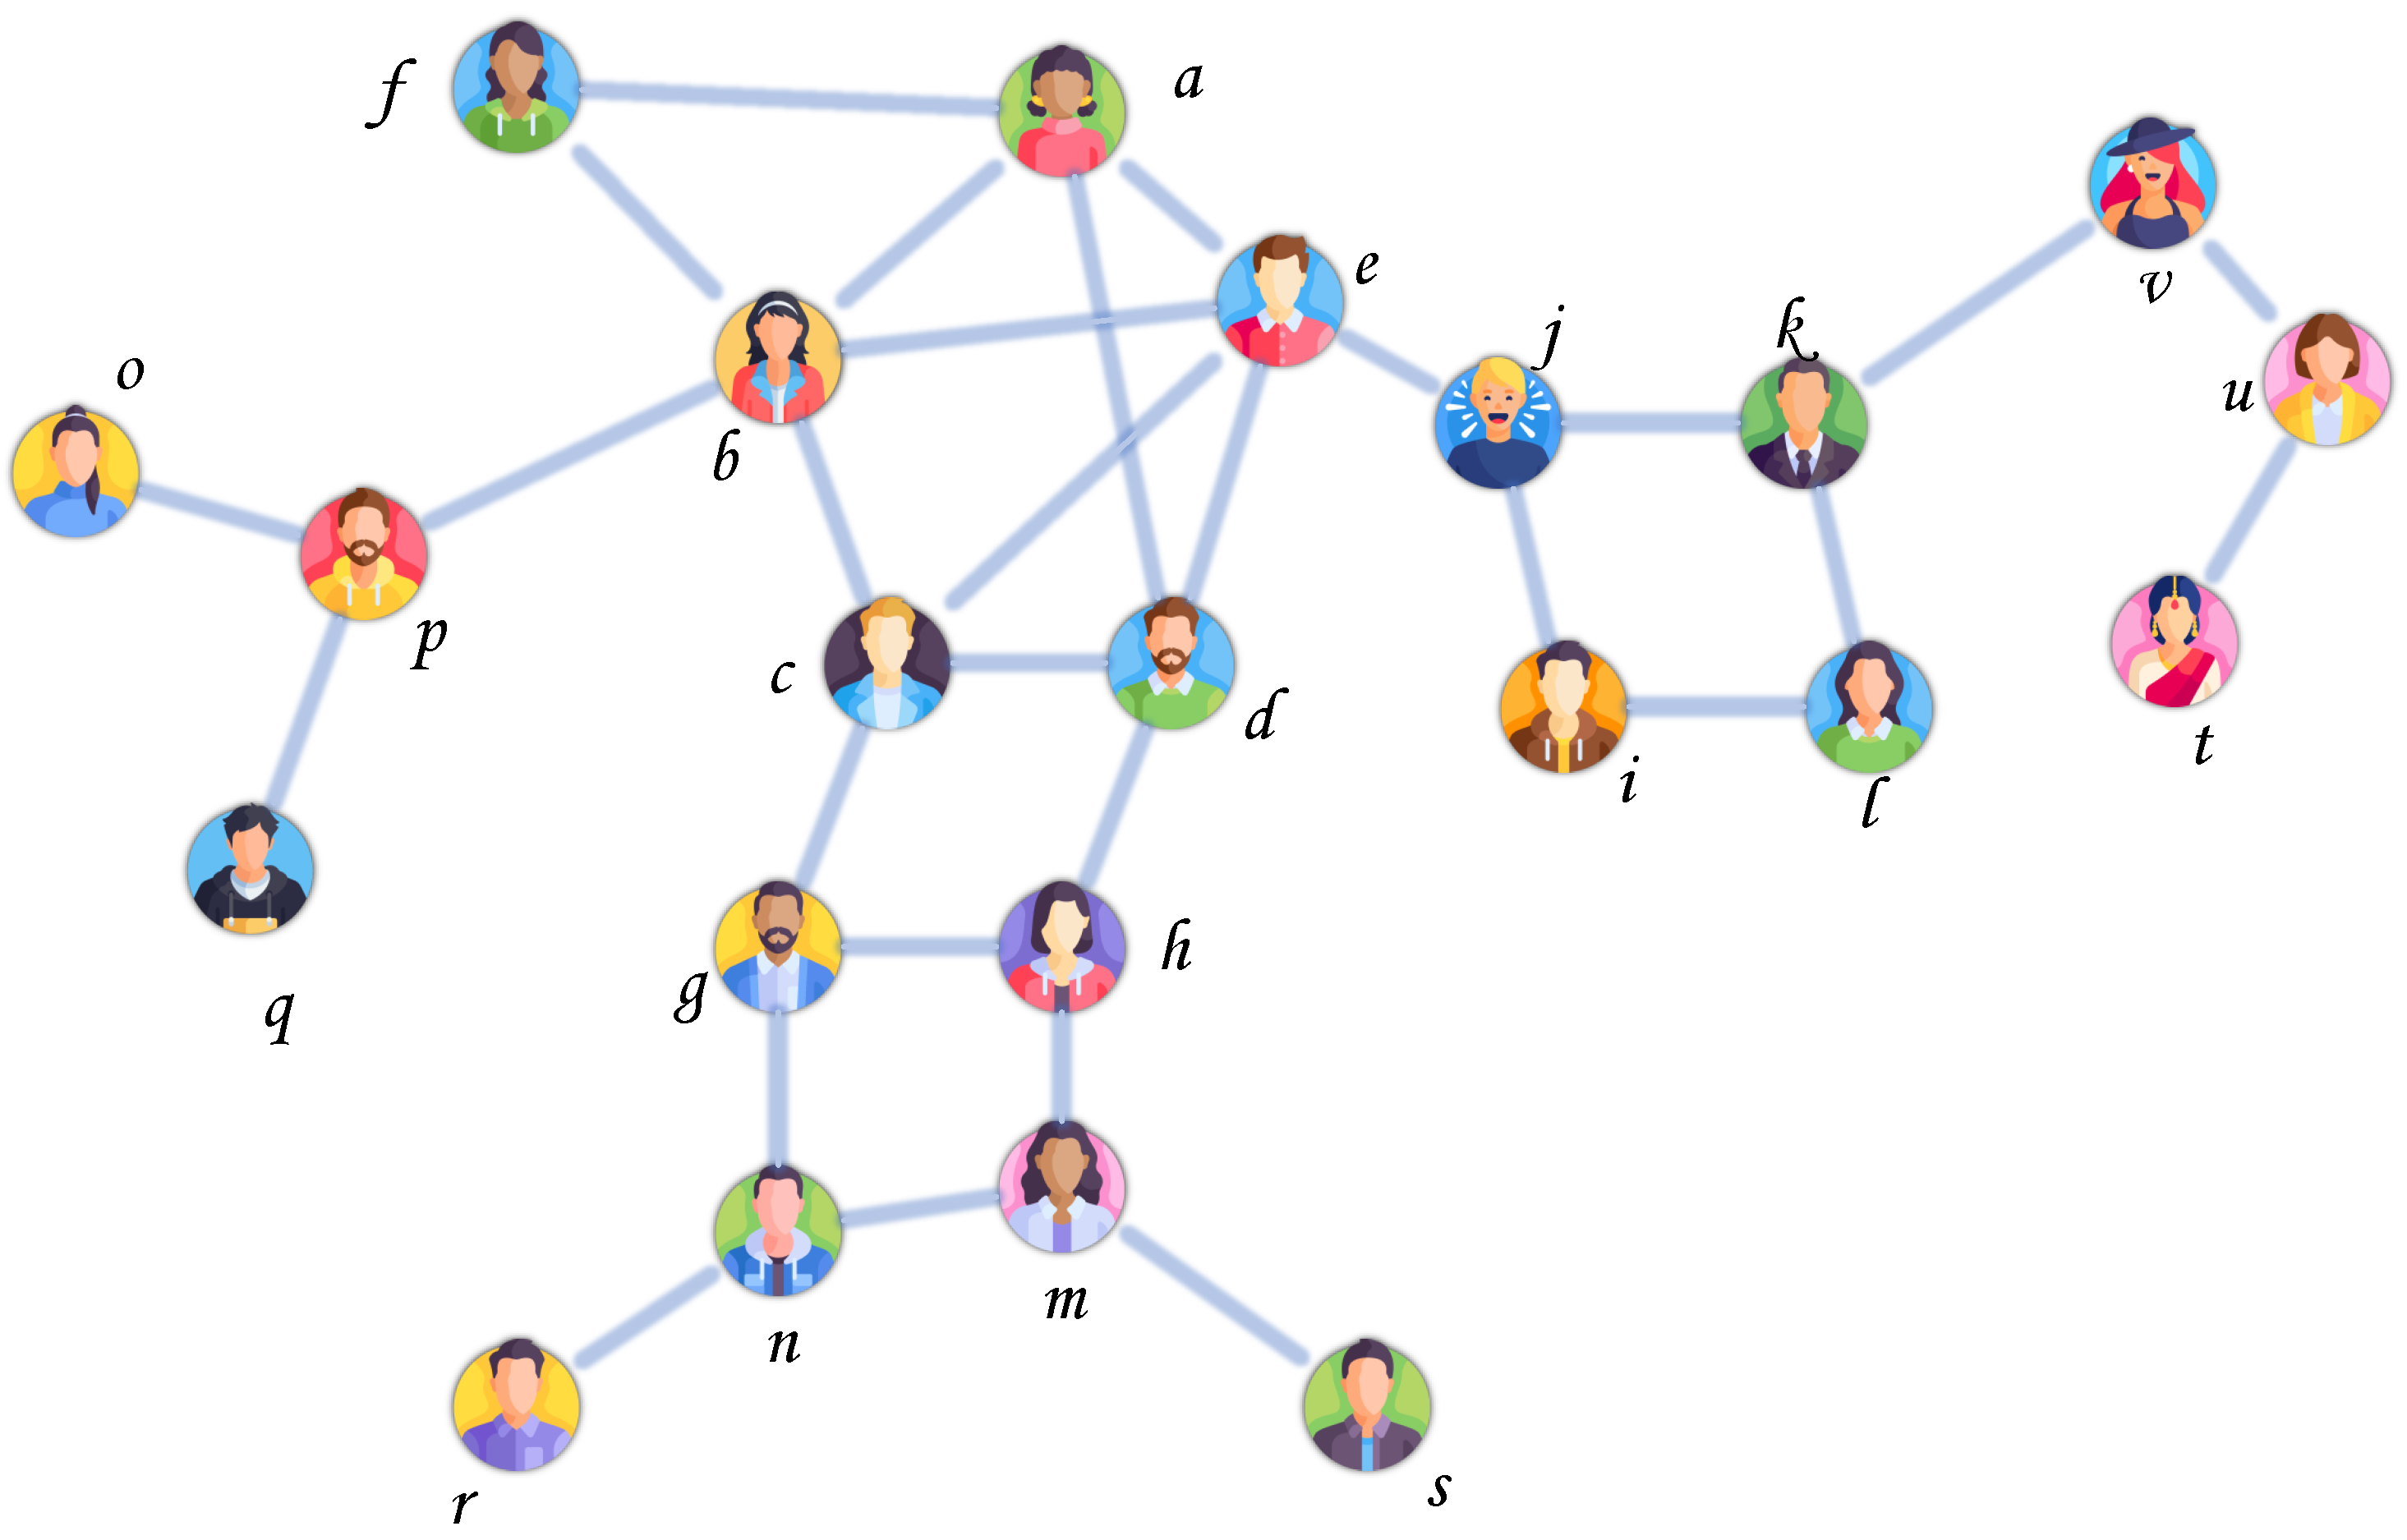
Figure 3 shows a subgraph of the Twitch-Gamers dataset. We will use this subgraph to illustrate the process of Algorithm 1 in a social network.
First, during the initialization process, each node is assigned the properties of degree and status, as shown in lines 1–5 of Algorithm 1. For example, the property of status is set to false and the property of degree is set to 4 for vertex a.
During the k-core decomposition process, the nodes are batch queried based on the core number k in current iteration. When k is 1, the nodes o, q, r, s, t are batch queried according to lines 6–9 of Algorithm 1. Then, the property of status in these nodes is set to true, and the property of core is set to 1 according to lines 10–16 of Algorithm 1. Meanwhile, the degree of their neighboring nodes p, n, m, u is decremented by 1. Since the property of degree in these neighboring nodes is modified, some of these nodes can be queried in lines 8–9 of Algorithm 1 and the core number k remains 1. Therefore, the property of core in the nodes p, u, v will also be determined. As a result, when k is 1, the core number of the nodes o, p, q, r, s, t, u and v is determined. At this point, no nodes that satisfy the condition can be found, so the k value is incremented by 1.
By analogy, when k is greater than 1, all nodes with the property of status set to false and the property of degree less than k are performed similarly. Finally, in the social network shown in Figure 3, the nodes with core number of 1 are o, p, q, r, s, t, u, v; the nodes with core number of 2 are f, g, h, i, j, k, l, m, n, and the nodes with core number of 3 are a, b, c, d, e. The entire k-core decomposition process is executed in graph databases.

4.2. Core Member Filtering

After computing the core number for all nodes, a critical subsequent step in exploring homogeneous dense groups is to identify and analyze the core members—nodes with higher core numbers. With conventional k-core decomposition methods, this process is cumbersome, often requiring the export of k-core results and subsequent loading into a separate analysis tool, which introduces significant I/O and data restructuring overhead. However, in our graph database based approach, the core number is already persisted as an indexed property. Consequently, the task of filtering core members is transformed from a complex data processing problem into simple and fast database queries. The detailed process of core member filtering in a graph database is shown in Algorithm 2.
Algorithm 2 Algorithm for core member filtering in a graph database
  • Require: The graph G = ( V , E ) in a graph database with the properties related to k-core, the given minimum core number s based on the datasets and the maximum core number l returned from Algorithm 1
  • Ensure: The graph G = ( V , E ) in a graph database with the properties related to core members and the set of core members C
     1:
    C , G G
     2:
    for each v i V  do
     3:
         member ( v i , G ) false
     4:
    end for
     5:
    for  i = s to l do
     6:
         C C { v core ( v , G ) = i }
     7:
        for all  v j { v core ( v , G ) = i }  do
     8:
              member ( v j , G ) true
     9:
        end for
    10:
    end for
    11:
    return  G , C
In the initialisation process, the property of member of each node is assigned to false in lines 2–3. In the filtering process, lines 4–7 iterate core number from the given minimum value to the maximum value to identify the nodes whose core number meets the current condition in line 6. These nodes are set as the core members. Since the nodes have the indexed property of core, these nodes can be queried efficiently in line 6 due to the first characteristic of graph databases mentioned before. Similarly, due to the second characteristic of graph databases mentioned before, these nodes are also queried in batches to improve efficiency. Finally, the property of member that indicates whether the node is a core member is persistently stored in the graph database to support the subsequent in-depth analysis.
Taking Figure 4 as an example, we have labelled the core number of each node according to Algorithm 1. It is assumed that the given minimum core number of core members is 2. Then, we query the nodes with the core number being 2 and mark these nodes as core members based on the indexed property of the graph database according to Algorithm 2. Specifically, we query the nodes in the set { f , g , h , i , j , k , l , m , n } , and mark these nodes. In the same way, we continue to query the nodes with the core number being 3 and mark these nodes, i.e., the nodes in set { a , b , c , e , d } .

4.3. Complexity Analysis

Classic in-memory algorithms for k-core decomposition, such as the BZ algorithm [26,27], achieve an optimal time complexity of O(|E|). However, this model is ill-suited for a graph database environment. It presumes near-instantaneous data access via memory pointers, a condition that does not hold when data resides on disk. The primary discrepancy arises because the performance bottleneck shifts from computation to I/O operations. In a graph database, every action—including reading a property, traversing an edge, or updating a vertex—is a query that incurs significant I/O latency and is managed within a transaction that adds its own overhead for consistency. Therefore, a meaningful analysis must prioritize the I/O complexity of these database-specific operations over the computational steps assumed by traditional models.
The complexity of Algorithm 1 can be analyzed in two phases: initialization and the iterative core decomposition loop. The initialization phase (Lines 1–5) computes the initial degree for every vertex, which requires a full scan of the graph structure. In a graph database, this corresponds to an I/O complexity proportional to O(|V| + |E|), as every vertex and its incident edges must be accessed. The subsequent core decomposition loop (Lines 6–24) is where our primary optimizations yield significant performance gains. Instead of repeatedly scanning all vertices, our algorithm leverages two key features of the graph database: indexed properties and batch queries. The query to find vertices for removal (Lines 8–10) is an exact-match query on an indexed degree property, which avoids a costly full graph scan and is significantly more efficient. Furthermore, these queries are batched to minimize network overhead and enhance throughput. While the query cost is low, the dominant I/O cost of the algorithm comes from the update operations. Over the entire process, the degree property of a vertex is decremented once for each of its edges, leading to a total of 2|E| write operations. Therefore, the algorithm’s I/O complexity is dominated by O(|E|) indexed writes.

5. Experiment

5.1. Experimental Environment

Our experimental environment consists of a six-server cluster where each server has identical CPU and memory specifications as detailed in Table 2. The servers are interconnected via InfiniBand and share the 256 TB of storage mentioned in Table 2. This storage is configured as a Parastor Parallel Storage System, which achieves high throughput by striping data across multiple storage servers, enabling parallel I/O operations from all nodes in the cluster.
Building upon the hardware platform described in Table 2, we configured a distributed software stack designed for large-scale graph processing. As detailed in Table 3, this environment is centered around JanusGraph 0.5.2, utilizing HBase 2.1.5 as the storage backend and its default embedded engine for composite indexing. The stack also includes the necessary underlying components such as Hadoop and ZooKeeper to ensure stability and scalability for our experiments.
In our implementation, we interact with JanusGraph in embedded mode, programmatically opening the database within our Java code to perform the necessary queries and modifications. The key configuration parameters for this process are summarized in Table 4. Other parameters not listed, such as consistency and TTL, were left at their default JanusGraph settings. For full transparency, the complete configuration files can be viewed in our open-source repository.

5.2. Experimental Datasets and Metrics

For our experiments, we selected seven datasets from the Network Repository [28]. These datasets originate from Facebook page networks, where nodes represent pages and edges signify mutual ’like’ relationships between them. As per their native format, all graphs are undirected, and the edges inherently represent mutual connections. The seven specific networks analyzed are: artist, company, government, media, politician, public figure, and sport. The number of vertices and edges for each graph is detailed in Table 5.
We introduce the concept of top-k cores to identify the most central and cohesive groups of nodes within a graph. The “top-k cores” refer to the set of all nodes belonging to the k highest core number values present in the graph. For instance, the “top-1 cores” consist of all nodes that share the single maximum core number, while the “top-3 cores” encompass all nodes belonging to the three highest distinct core numbers. This approach allows us to systematically filter and analyze the nodes that are most deeply embedded in the densest parts of the graph.

5.3. Efficiency of k-Core Decomposition

We compare the efficiency of the proposed method and the baseline method in a graph database. It is important to clarify the context of this comparison: our goal is to evaluate the efficiency of our algorithm within a graph database environment, rather than competing on raw execution time with specialized in-memory or external-memory algorithms.
We implement the BZ algorithm [26,27] in JanusGraph to serve as a baseline method. The specific implementation of this baseline can be found in our open-source repository. To ensure a fair comparison, both our proposed method and the baseline were executed using the identical configuration parameters detailed in Section 5.1. In particular, both methods were executed in a single-threaded mode to ensure that performance measurements reflect the core logic of the algorithms. Therefore, the resulting differences in execution time can be attributed to the intrinsic characteristics of the algorithms themselves.
The comparison of running time between our method and the baseline method on seven datasets is shown in Figure 5. The values presented are the average of three runs for each algorithm on each dataset.
To ensure a comprehensive performance evaluation that accounts for the overhead of I/O and database transactions, the reported execution time for both our proposed method and the baseline represents the complete end-to-end duration. The measurement begins at the start of the algorithm and concludes only after all results have been fully written and committed to the graph database. Therefore, the total time recorded explicitly includes the costs of all stages: reading properties from the database, performing the necessary computations, and writing the resulting properties back. This measurement methodology aligns with our primary objective: to perform k-core decomposition within a graph database and achieve persistent storage of the results for subsequent analysis.
Our method is faster than the baseline method as shown in Figure 5. It can be seen that our method can achieve the k-core decomposition in all datasets within 10 4 s. However, the baseline method takes over 10 5 s and still did not produce the final result in the artist and media datasets. In the remaining five datasets, the smallest difference between the two methods is in the government dataset, where our method takes 1025 s, which is about 20% of that taken by the baseline method. The largest difference between the two methods is in the company dataset, where our method takes 632 s, which is about 4% of that taken by the baseline. On average, the execution time of our method is about 8% of that of the baseline method. These results demonstrate that the effectiveness of our method is higher than that of the baseline method.
After obtaining the results, we analyze the reasons for the improvement in efficiency. The efficiency of our proposed algorithm is improved because the algorithm combines two characteristic of graph databases, i.e., efficiently utilizing property indexes and batch queries.
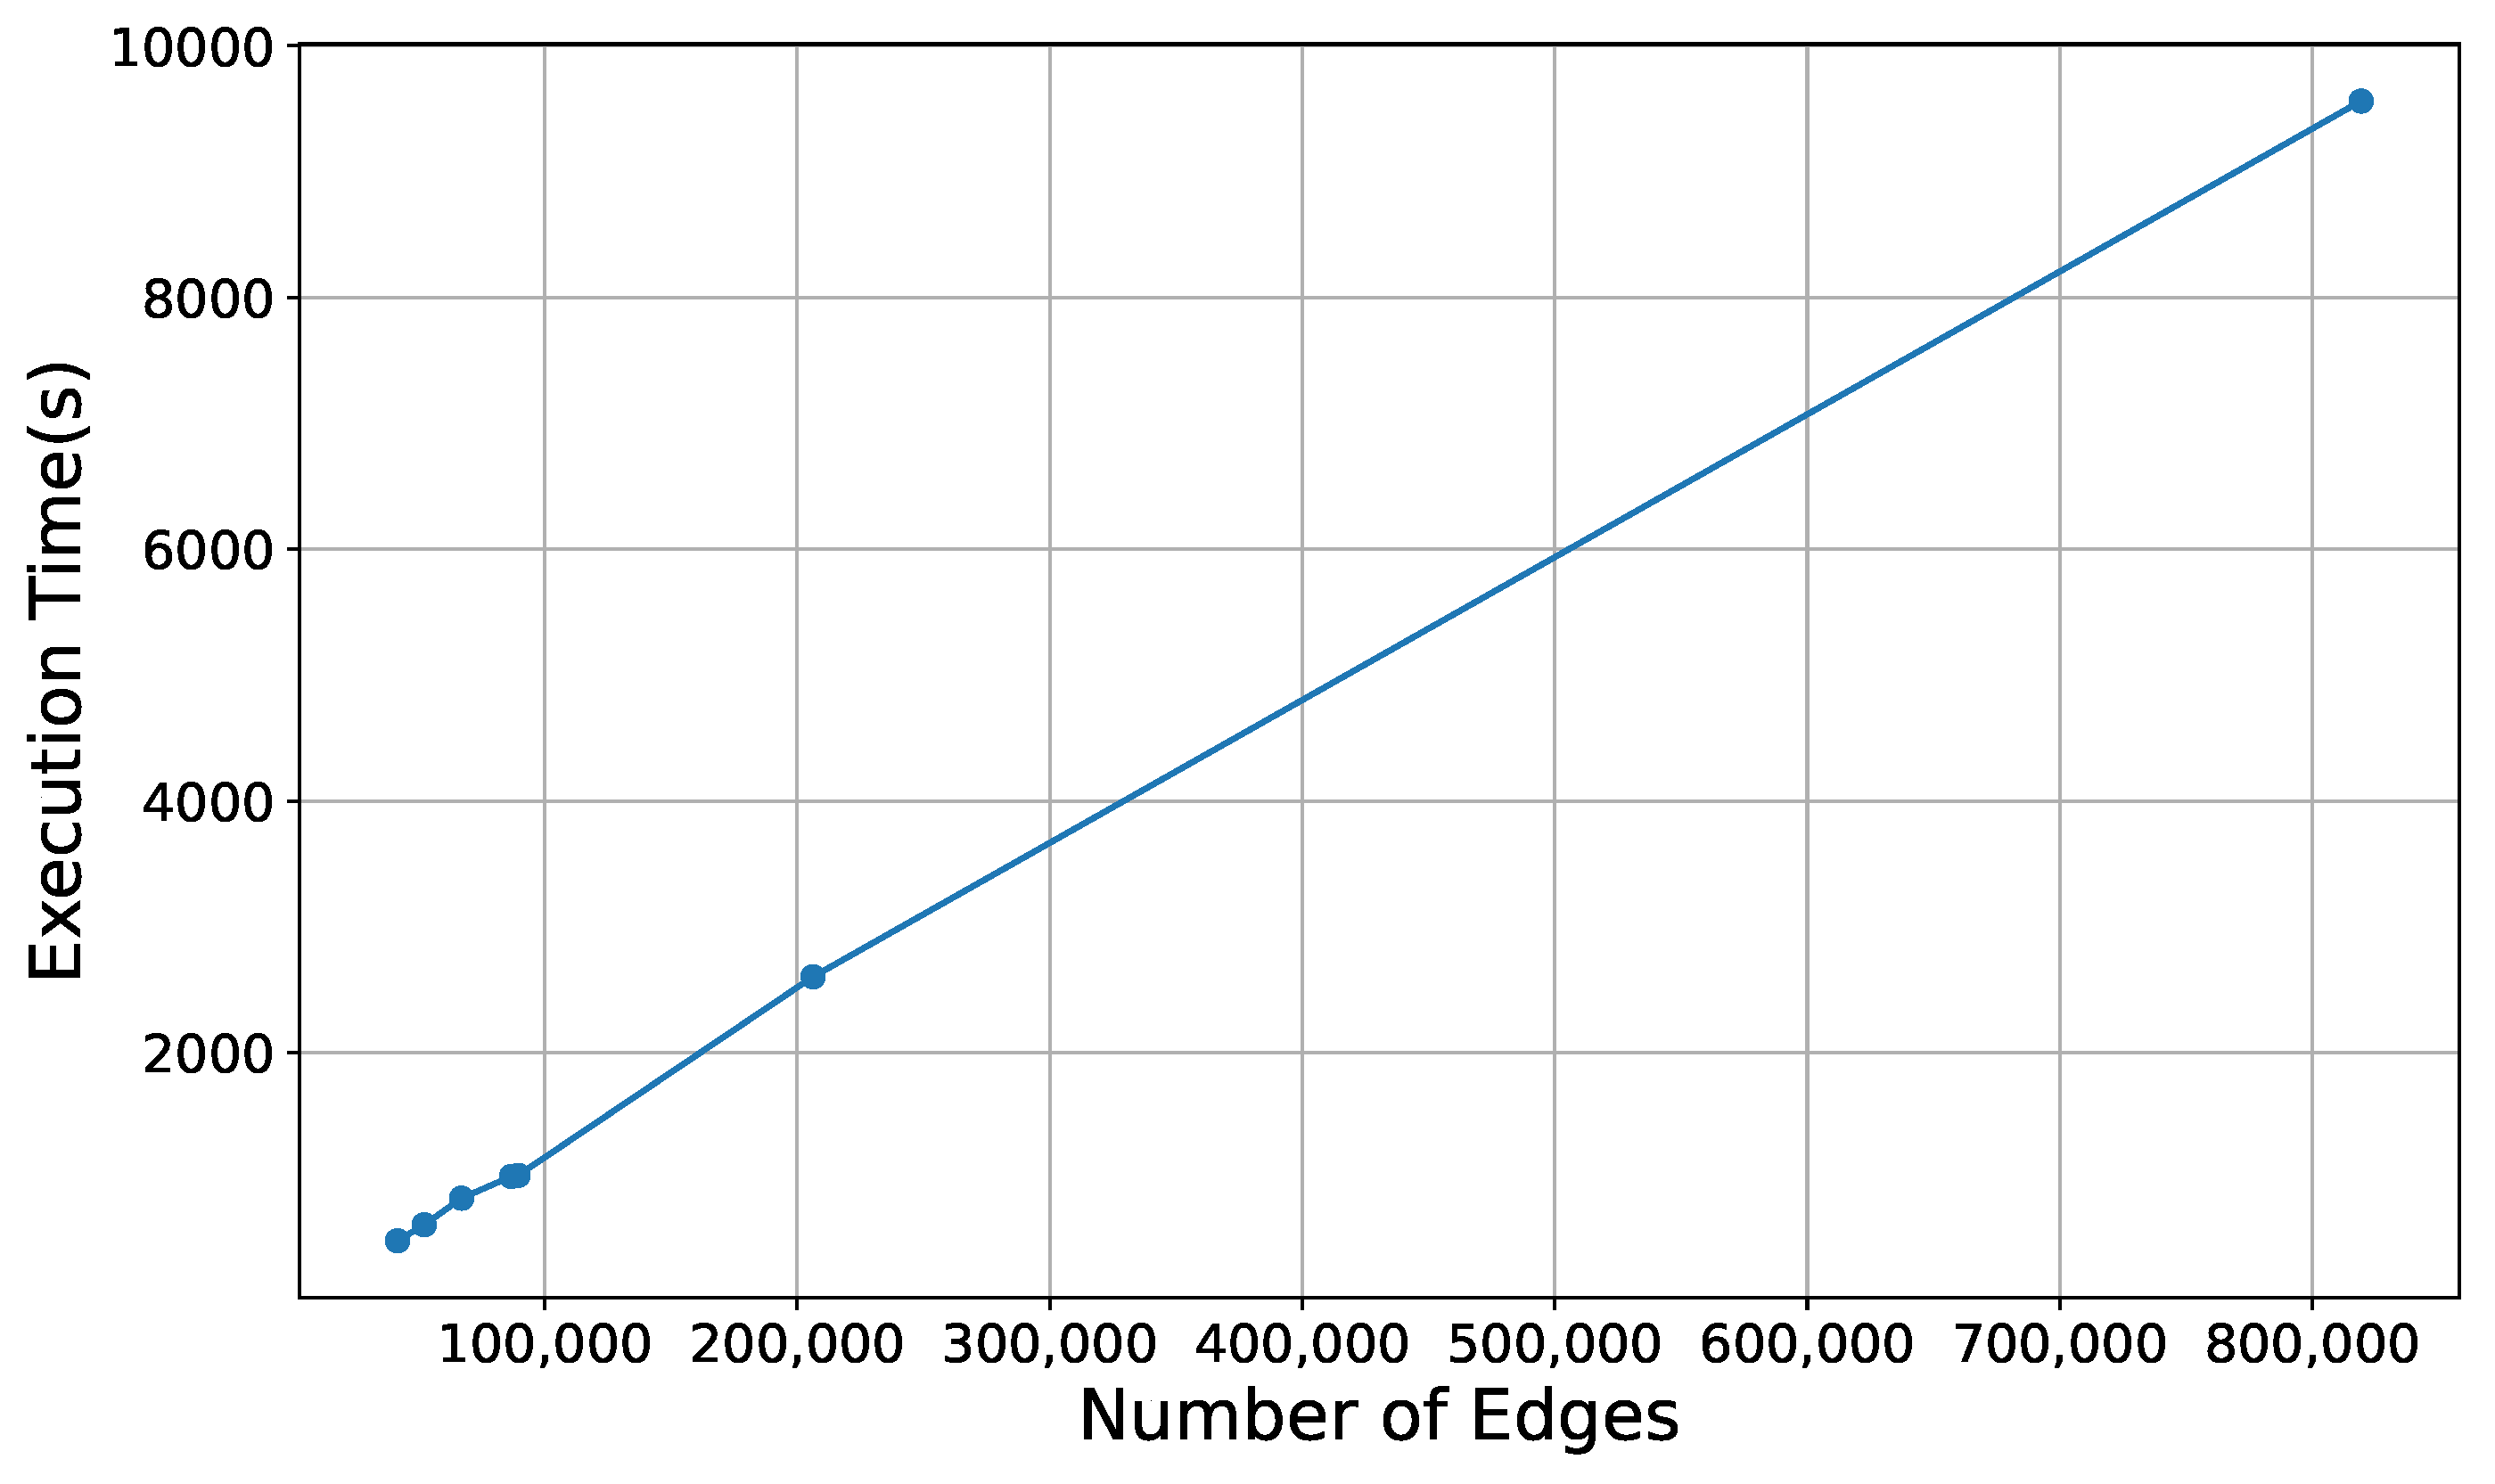
Meanwhile, we plot a curve of the running time against the number of edges in seven datasets, with the result shown in Figure 6. As can be seen from Figure 6, the running time and the number of edges exhibit a nearly linear relationship. This finding is consistent with our analysis in Section 4.3, which concluded that the algorithm’s I/O complexity is dominated by a number of operations proportional to the number of edges.

5.4. Basic Results of Core Members

Based on the obtained k-core results, we apply the proposed Algorithm 2 to identify the core members. The number and ratio of the core members are recorded. To investigate the ratio of these groups, we define a formula to quantify the ratio of the subgraph in which the core members are located, which is defined as the core ratio, i.e., Ratio ( G ) .
Ratio ( G ) = | V ( S ( k , G ) ) | | V ( G ) |
where V ( S ( k , G ) ) represents the number of nodes in the top-k cores S ( k , G ) , and V ( G ) represents the total number of nodes in the entire graph G. This ratio indicates the proportion of nodes in the subgraph relative to the total number of nodes in the graph.
For the seven datasets, we select the top-1 cores, the top-3 cores and the top-5 cores as core members, respectively. The result is shown in Table 6.
Table 6 shows that the number and ratio of the core members vary across datasets. The number of core members is relatively large in the artist dataset. The ratio of dense groups is relatively large in the public figure dataset and the politician dataset. A detailed analysis of the number and proportion of core members will be discussed in the next section.

6. Further Applications and Discussion

k-core is an effective method to discover homogeneous dense groups in graphs. However, the existing research related to the computation of k-core decomposition ignores the practical significance of the computation results [8,14,16]. We fully utilize the characteristic of graph databases that allows nodes to store multiple properties, enabling the storage of the intermediate and final results of k-core decomposition. Based on these properties, we apply the proposed Algorithm 2 to search the core members. After that, the impact of core members is analysed on the entire network from different perspectives in this section.

6.1. Relationship Between the Core Number and Degree

In this section, we conduct an in-depth analysis of the relationship between degree and core number to understand general patterns and characteristics of the important individuals.
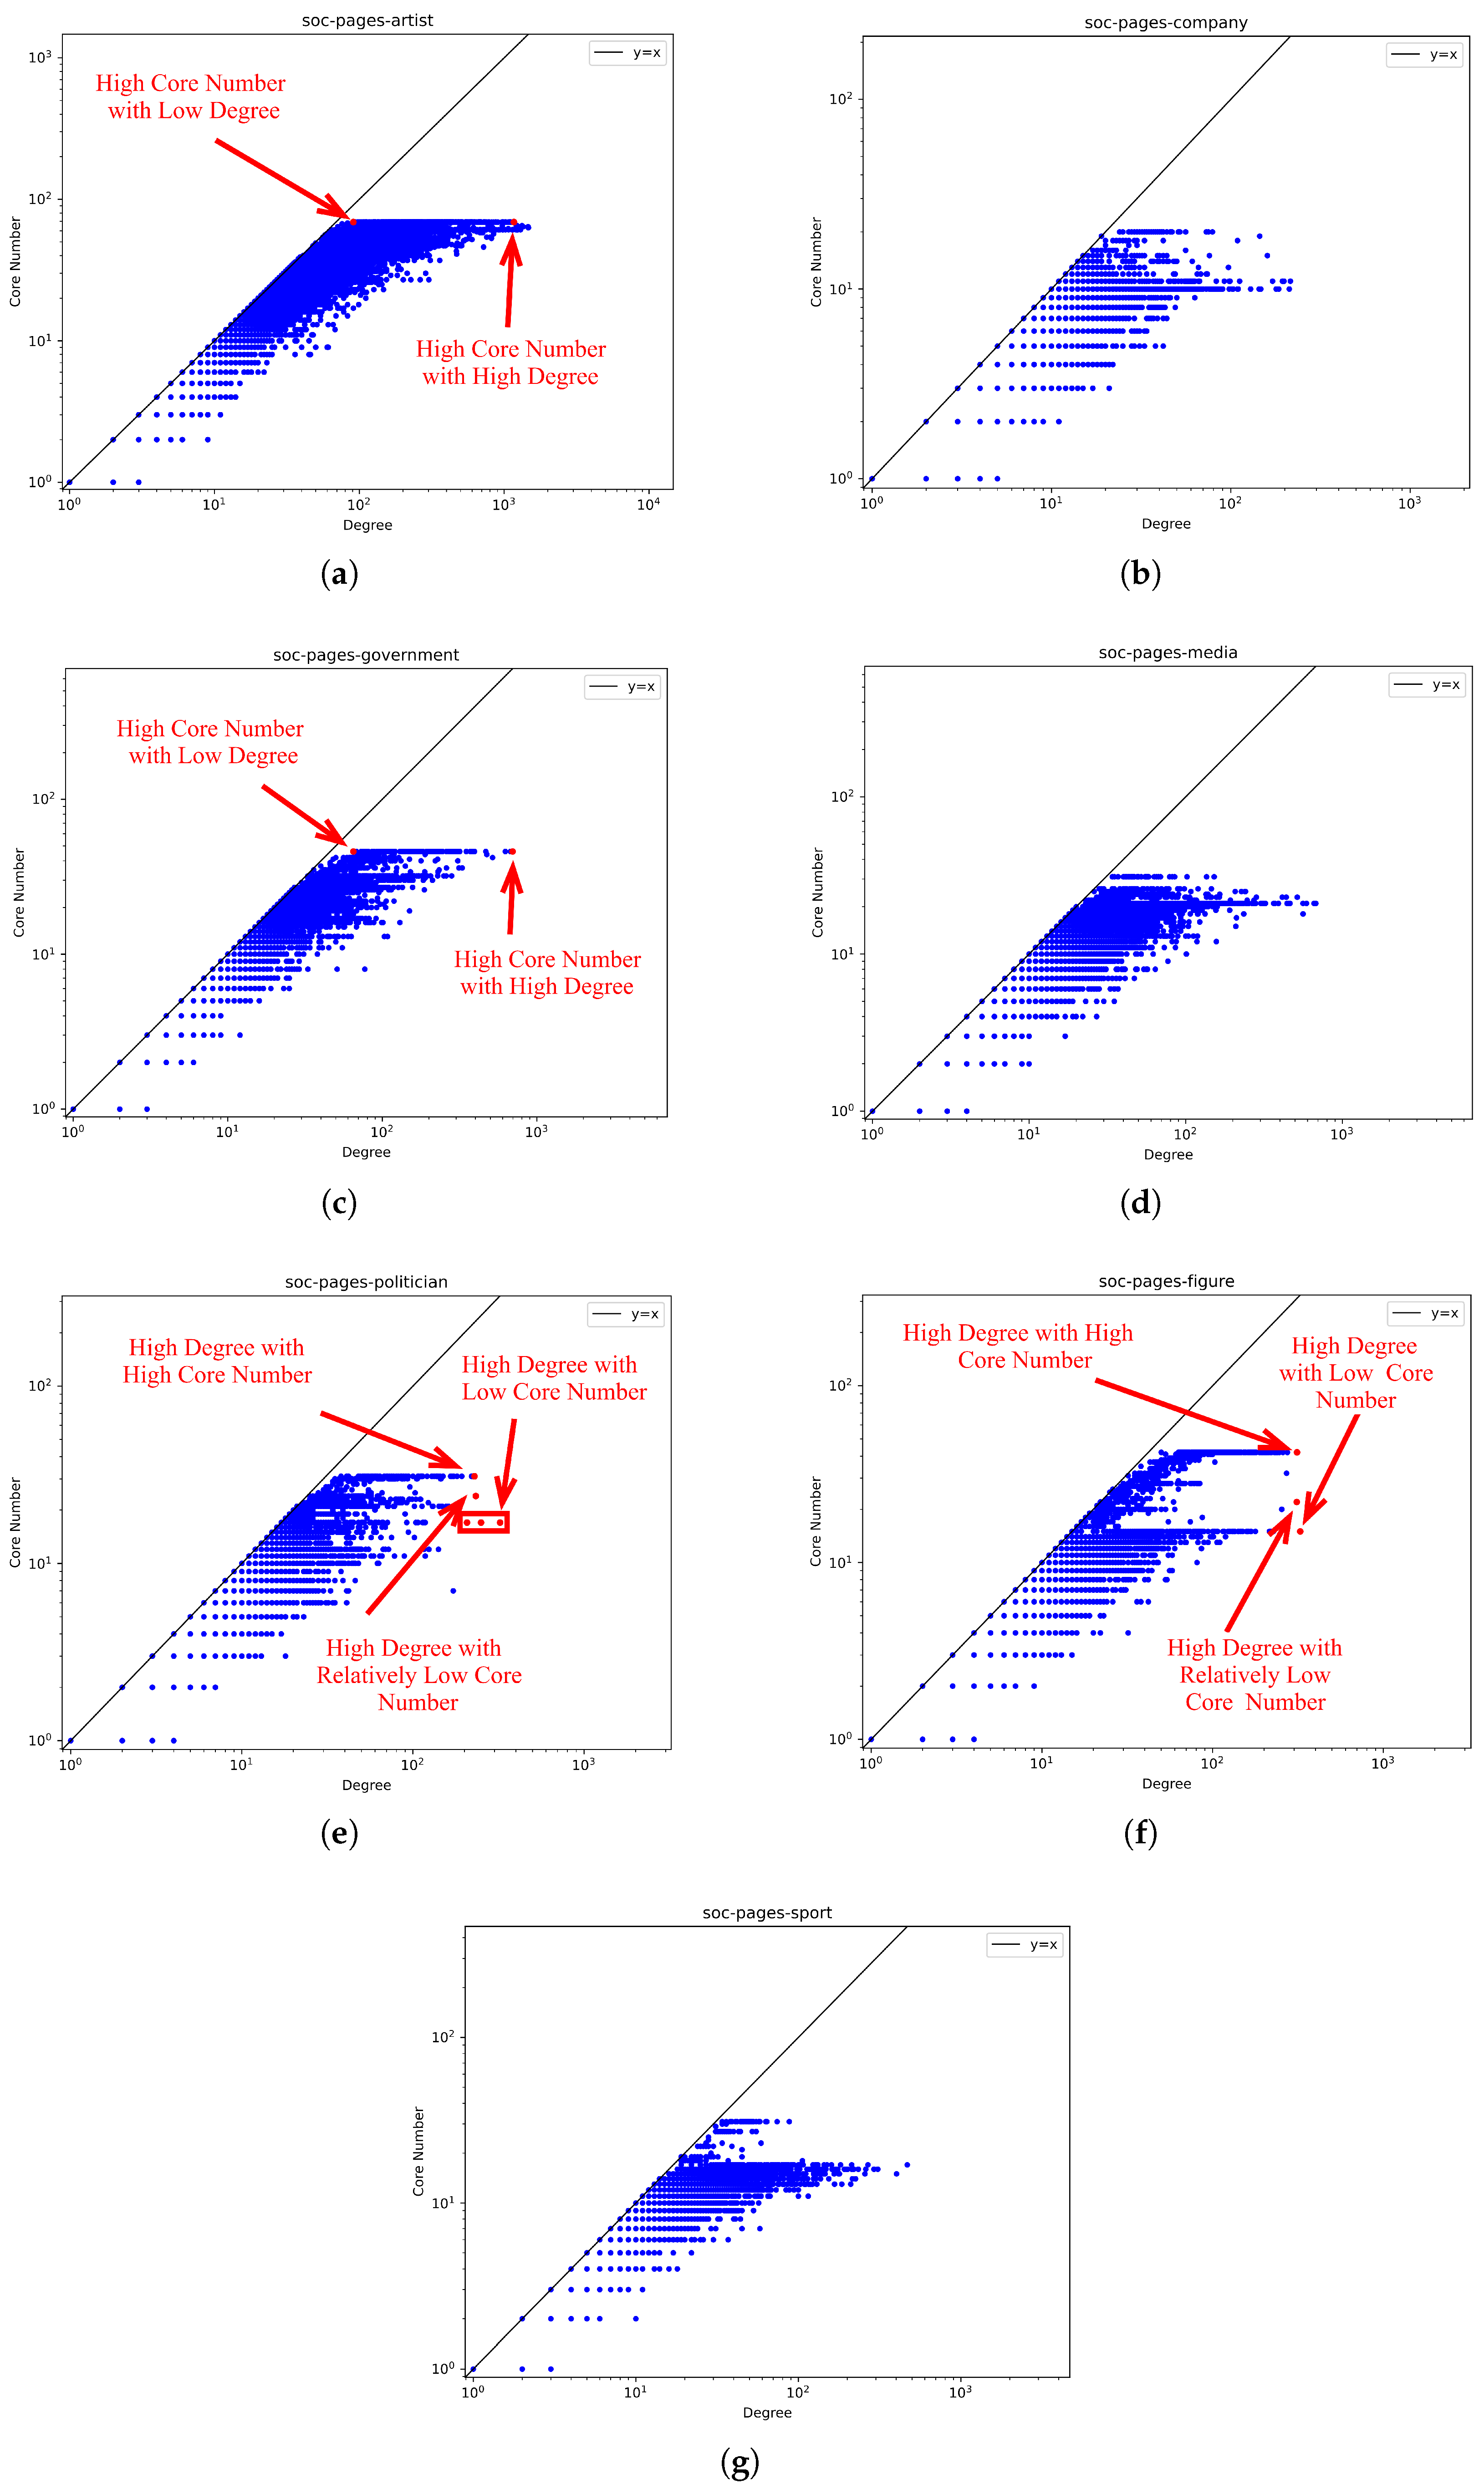
Degree is one of the main methods traditionally used to assess the importance of nodes in terms of the local structure. Core number measures the closeness of the structure of the subgraph. There is a certain consistency between these two methods in a realistic sense. We would like to explore their relationship to discover general patterns and find important individuals through both of them. Under the seven datasets, we calculate the degree and core number of each node to form a scatterplot, as shown in Figure 7.
In general, Figure 7 shows that there is a relatively strong correlation between the degree and the core number. In order to further prove this conclusion, we calculate the Spearman correlation coefficient in these datasets. All resulting ρ are larger than 0.95 . It suggests that the conclusion is consistent to the existing research [19,20]. Meanwhile, in Figure 7, we find that the degree of most nodes is equal to or slightly larger than their core number. We believe it is relevant to the definition of k-core. According to the definition, the core number (k) is the lower limit of the degree. Meanwhile, a member with high degree denotes that it is more connected and tends to be located in denser groups, indicating a larger core number. Therefore, at a certain core number for some nodes, the degree of these nodes is equal to or slightly greater than the core number.
In Figure 7, we find two regular shapes. One shape is T-shaped, as shown in Figure 7a,c. This shape is characterized by a larger range of degrees when the core number is higher. Namely, in dense groups, some individuals interact with many people in the social network, and some individuals interact almost exclusively with the members in dense groups. To figure out the difference between these people, we check on Facebook for the people with high degree and high core number, and the people with low degree and high core number. The examples are shown in Figure 7a,c. We find that there is a large difference in their numbers of followers. Those people with high degree have more than 10 million followers, while those people with low degree have less than 50 thousand followers. Through observing the overall data of these individuals, we find that individuals with a high degree and high core number tend to hold more important positions in social networks, whereas those with a low degree but high core number typically hold less significant roles.
The other shape is F-shaped, as shown in Figure 7e,f. This shape is characterized by some individuals with high degrees, but with larger or smaller core numbers. Namely, some individuals are in the dense groups, some are not, and all of them are in contact with many people in the social networks. Similarly, we check on Facebook for the people with high core number and high degree, and the people with low core number and high degree. The examples are shown in Figure 7e,f. To our surprise, the individuals who are in or away from the dense groups are less important, while the individuals who are not in but close to the dense groups are more important. Specifically, these individuals who are not in but close to the dense groups have more than 50 million followers. In the politician dataset, those individuals who are in or away from the dense groups have less than 100 thousand followers. In the public figure dataset, these individuals have less than 25 million followers. After analyzing the reasons in depth, we find that individuals with high core numbers and high degrees tend to hold positions in the network that require frequent communication with others, leading them to be part of dense groups. Meanwhile, those important individuals receive a lot of attention and have a lot of followers. However, they pay less attention to others, leading them not to be in dense groups.

6.2. Statistical Characteristics of the Core Numbers and Core Members

In this section, we conduct an in-depth analysis of the statistical characteristics of the core number and core members. Different core numbers may have different number of nodes in a defined dataset. The size of homogeneous dense groups of core members may be different in different datasets. In order to discover general statistical patterns, these general characteristics are studied.
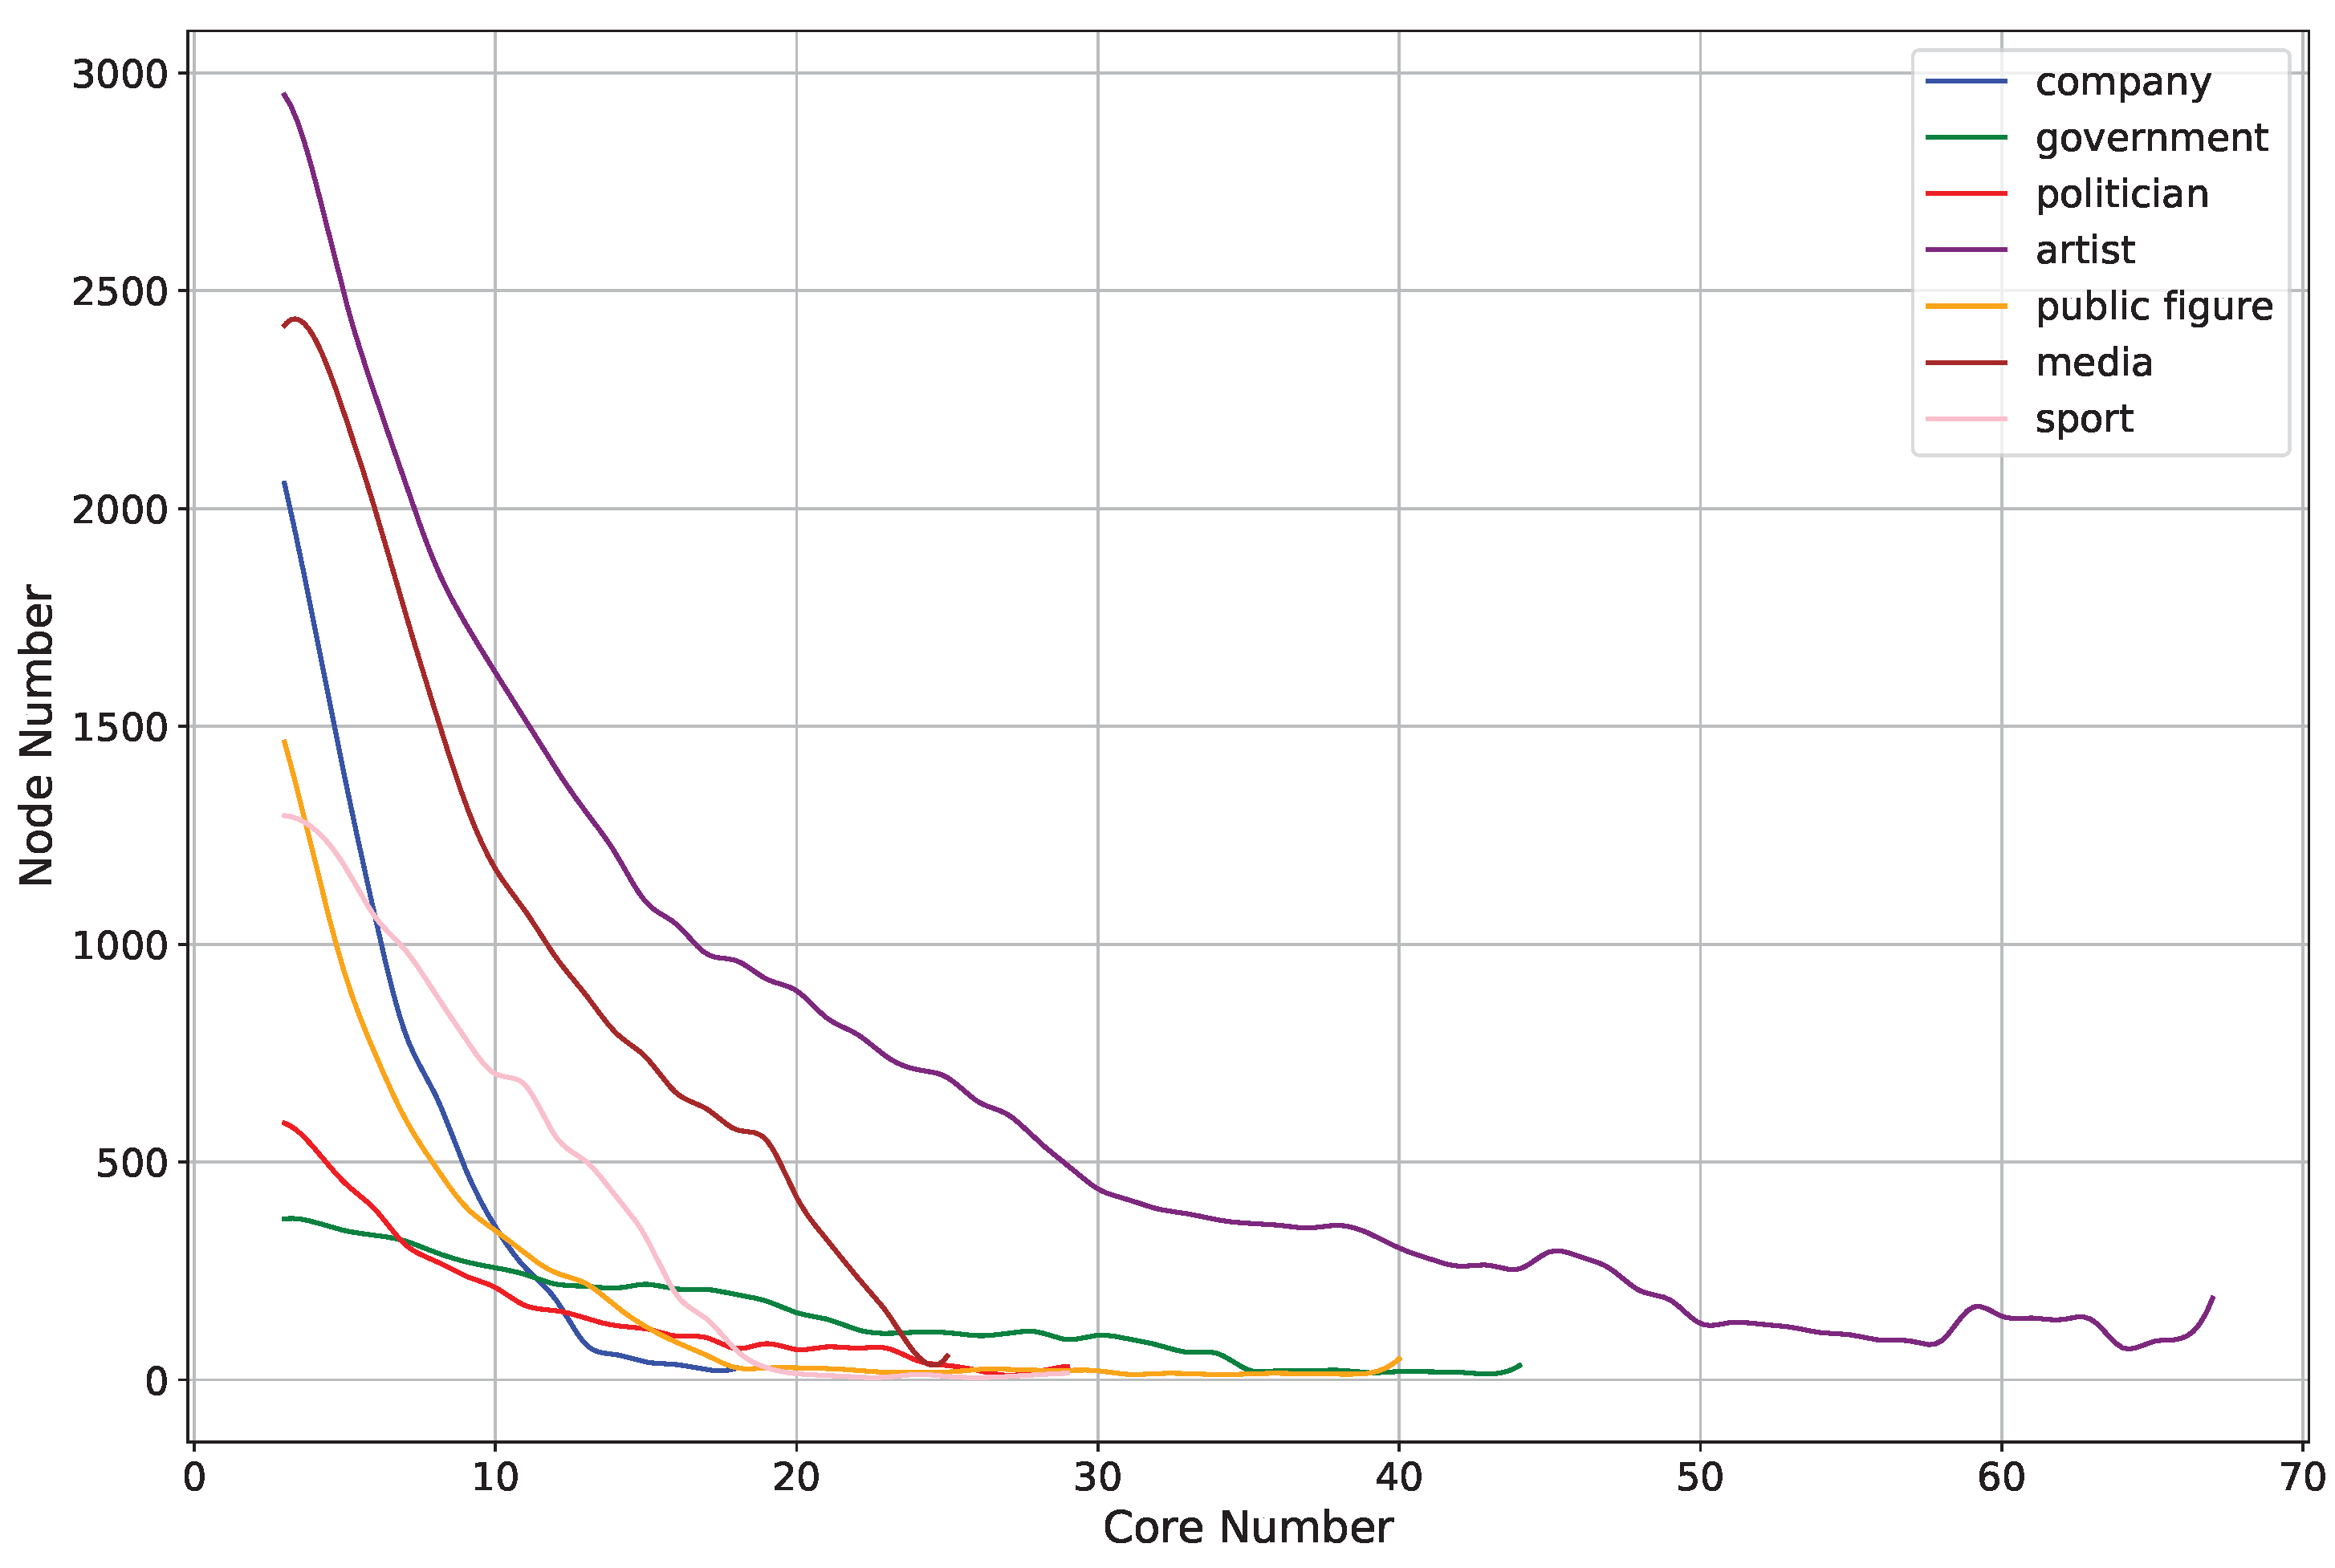
It is well known that in scale-free networks, the relationship between the core number and the number of nodes obeys a power law distribution. In a realistic sense, there is some similarity between the core number and the degree. In order to study the relationship between the core number and the degree, we calculate the number of nodes with the same core number, and the results are shown in Figure 8.
Figure 8 shows the relationship between the core number and the number of nodes. We find that the relationship between them is similar to the relationship between degree and the number of nodes, which seems to obey the power law distribution. However, the difference is that the number of nodes with a very high core number is greater than the trend suggests. It indicates that despite the fat-tailed phenomenon, where the number of homogeneous dense groups is relatively small, there are still large-scale homogeneous dense groups with very high core numbers in the real social network.
Disregarding this fraction of nodes, we detail whether they truly conform to the power law distribution. Therefore, we fit these curves with a function of the power law distribution, which is defined as,
P ( x ) = c x α
where x represents the core number, and P ( x ) is the number of nodes.
We use the powerlaw (version 1.5) package in Python (version 3.8) to fit these curves. The fitting results are shown in Table 7. In Table 7, α is the exponent of the power-law distribution, and x min is the minimum value of x for which the power-law behavior holds. The best fit model is determined by comparing the power-law distribution with the log-normal and stretched exponential distributions, using likelihood ratio tests.
The results summarized in Table 7, reveal a key finding: no single distribution is the best fit for the core number distributions across all seven datasets. This contrasts with the common assumption that such distributions universally follow a simple power-law.
Specifically, the power-law model is the most suitable for four of the datasets (company, media, public figure, and sport). For the other three datasets (artist, government, and politician), the stretched exponential distribution was found to be a statistically significantly better model. Furthermore, the parameters of the best-fit power-law tails vary considerably, with the exponent α ranging from 2.82 to 17.82 and the tail-start point x min ranging from 8 to 29. These findings suggest that while the core number distributions in these social networks consistently exhibit heavy-tailed behavior, their specific statistical character varies, indicating structural differences between the networks.
Therefore, we would like to clarify which basic characteristics of the social network the scale of core members are associated with. We consider several basic characteristics of social networks, i.e., the number of nodes, the number of edges, density, and average degree. The formulas for density and average degree are as follows.
Density ( G ) = 2 | E ( G ) | | V ( G ) | ( | V ( G ) | 1 )
where | E ( G ) | represents the number of edges in the graph G, and | V ( G ) | represents the number of nodes. This formula reflects the proportion of existing edges relative to the maximum possible edges in the graph.
AvgDegree ( G ) = 2 | E ( G ) | | V ( G ) |
where shows the average connectivity of each node by relating the total number of edges to the number of nodes in the graph.
At the same time, we calculate the Pearson correlation coefficient between each basic characteristic and the core ratio across these datasets to reflect their correlation. The formula for the Pearson correlation coefficient is as follows.
ρ ( X , Y ) = i = 1 n ( X i X ¯ ) ( Y i Y ¯ ) i = 1 n ( X i X ¯ ) 2 i = 1 n ( Y i Y ¯ ) 2
The calculation results for these characteristics and their corresponding Pearson correlation coefficients across the seven datasets are shown in Table 8. In Table 8, ρ i j denotes the Pearson correlation coefficient. The subscript i refers to the core ratio type (1 for top-1, 2 for top-3, 3 for top-5), and the subscript j refers to the basic characteristic (1 for nodes, 2 for edges, 3 for density, 4 for degree).
According to the results shown in Table 8, we observe a strong correlation between the density and the core ratio. Generally, the larger the density, the higher the core ratio, and vice versa. Meanwhile, the correlation coefficient between them under these seven datasets is larger than 0.6, which is a relatively strong correlation compared to the other characteristics. In contrast, the correlation between the number of nodes or edges and core ratio is weak, and the absolute value of their correlation coefficients is smaller than 0.3. The correlation coefficient between the average degree and core ratio is around 0.35, which suggests that there is a correlation between them, but the correlation is not strong.
There is a realistic explanation for such results. Members of a social network interact with each other more frequently when density is relatively high, which is more likely to create groups with strong ties. Thus, the correlation between the density and the core ratio is high. The number of nodes and the number of edges do not determine the closeness of this network, nor do they determine the scale of the core members. In terms of the average degree, it is similar to the formula for density which are both proportional to the number of edges and inversely proportional to the number of nodes. It affects the closeness of the network and the size of the core members. On the other hand, in large-scale networks, if the density is smaller, the average degree may still be larger. It leads to a looser structure of the social network where the average degree is still large, and leads to a smaller scale of the core members.

6.3. Effect of Core Members on Information Spreading

The information spreading of networks is a classic problem in social network analysis. We further analyze the information spreading process of the core members in the network to understand the impact of these groups on this process.
An ultra-small-world network is one of the important examples of information spreading in social networks. There is a short chain of social connections between any two people in the ultra-small-world network. The core members are the more tightly connected members, and we hypothesize that we can find all the members faster through these members. To investigate the role of core members in the ultra-small-world network, we compute the average of the path length needed for each core member to find out all nodes. Also, we compute similar average path lengths for all nodes to compare with core members. The results are shown in Table 9.
To our surprise, the core members do not have excellent ability to spread the information demonstrated in Table 9. The path length needed by these core members to find all nodes is slightly less than the average value of all nodes in the social networks. These core nodes do not play an important role in the information spreading of the entire social network.
On the other hand, an interesting question is whether the information spread in the groups of core members tends to transmit to the nodes outside the groups. Namely, whether the core members tend to be homogeneous or heterogeneous in the information spreading of social networks is discussed in detail. In order to quantify the ability of the core members to disseminate information outward, the information dissemination capacity is defined as,
IDC ( k , G ) = k i j A i j δ ( v i , v j ) σ ( v i , k ) i j A i j σ ( v i , k )
where k is the top-k core numbers of the graph, A i j is the adjacency matrix of the graph G. δ ( v i , v j ) is an indicator function that equals 1 if node v i is connected to an external node v j outside the dense group, otherwise it is 0. σ ( v i , k ) is another indicator function, which equals 1 if the core number of the node v i is k, and 0 otherwise. This ratio represents the outward dissemination capability of the core members. In addition, we calculate the average information dissemination capacity in the social network as a baseline for comparing the information dissemination capacity of the core members, which is defined as,
AvgIDC ( G ) = k i j A i j δ ( v i , v j ) σ ( v i , k ) i j A i j σ ( v i , k ) C a r d ( { k v V ( G k ) } ) = k i j A i j δ ( v i , v j ) σ ( v i , k ) C a r d ( { k v V ( G k ) } ) i j A i j σ ( v i , k )
where C a r d ( { k v V ( G k ) } ) represents the number of values that k can take in the graph G. The calculation results are shown in Table 10.
In Table 10, it can be found that the core members have a poor ability to disseminate information outwardly under the seven datasets. This suggests that they are more homogeneous. Meanwhile, it explains the fact that in Table 9 the path length needed for them to reach all nodes does not decrease though they are tightly connected.
Our finding that core members exhibit a limited outward dissemination capability may initially seem to contradict the well-known results of Kitsak et al. [22], who identified nodes in the innermost core (highest k-shell) as the most influential spreaders. However, this apparent contradiction stems from a fundamental difference in methodological goals and metrics.
Kitsak et al. measure spreading influence using dynamic simulations (like the SIR model) to identify nodes that can trigger the largest network-wide cascades. Their metric quantifies a node’s global spreading efficiency by simulating an actual diffusion process over time. In their context, a core member is influential because they are optimally positioned within the network’s backbone to propagate information throughout the entire system, leading to the largest final outbreak size.
In contrast, our study does not simulate a dynamic process. Instead, we use static structural metrics—average path length and the Information Dissemination Capacity (IDC)—to assess the structural cohesion and homogeneity of the core group. Our IDC metric, in particular, is designed to measure the proportion of a group’s connections that are directed outward versus inward. Our finding of a low IDC for core members indicates that this group is highly cohesive and inwardly focused, a key characteristic of a homogeneous dense group.
Therefore, the conclusions are not mutually exclusive but rather describe two different aspects of the same phenomenon. Kitsak et al. show that the core is the most efficient starting point for global, network-wide diffusion. Our findings reveal that this same core is structurally characterized by strong internal cohesion and limited direct outward connectivity. In essence, while they are the most effective “igniters” for a viral spread, their immediate connections are predominantly with each other, which is the very definition of a highly cohesive group.

7. Conclusions

In this paper, we proposed a k-core decomposition method based on graph databases to detect homogeneous dense groups. This method efficiently obtains all the k-cores in a graph by leveraging the advantages of graph databases. It recorded the property of core number in graph databases, which supported convenient subsequent filtering and analysis. Then, we proposed a core member filtering method based on the results of the proposed k-core decomposition method. It helps filter out nodes with high core numbers, which is another exploration target of this paper. Meanwhile, experiments demonstrated the efficiency of the k-core decomposition method in seven real-world networks.
Additionally, we conducted a comprehensive analysis of k-cores and their core members in social networks. We identified general patterns in the relationship between node degree and core number, as well as notable individuals through their connectedness. We further examined statistical patterns concerning core number and core members, finding that the correlation between core number and the number of nodes approximately follows a power law distribution. Lastly, our investigation into information diffusion revealed that these core members have limited capacity to spread information outwardly.
While this work successfully demonstrates an efficient method for detecting dense groups within a graph database, several avenues for future research remain. Our future work will focus on utilizing the proposed k-core decomposition method to perform community detection and facilitate the visualization of large-scale graphs. Another promising direction is to extend our method to incorporate node attributes. By integrating property similarity into the k-core decomposition process, we could identify groups that are not only structurally cohesive but also truly homogeneous based on their characteristics.

Author Contributions

Conceptualization, Z.Z. and Z.L.; methodology, Z.Z.; software, Z.Z.; validation, Z.Z.; formal analysis, Z.Z.; investigation, Z.Z.; resources, D.Y.; data curation, Z.Z.; writing—original draft preparation, Z.Z.; writing—review and editing, Z.L., H.H., Y.G. (Yuan Gao), Y.G. (Yijun Gu), D.Y., X.L. and S.F.; visualization, Z.Z.; supervision, D.Y.; project administration, D.Y.; funding acquisition, D.Y. and S.F. All authors have read and agreed to the published version of the manuscript.

Funding

This research was funded by the Anhui Province Outstanding Young Teachers Training Program of 2025 (grant number YQYB2025210), the Key Research Project of Anhui Provincial Department of Education, China (grant number 2022AH053089), and the Outstanding Scientific Research and Innovation Team of Anhui Police College (grant number 2023GADT06).

Data Availability Statement

The source code presented in the study are openly available in GitHub commit (d2d0a23) at https://github.com/jianzhang-1046/kcore_analyses (accessed on 3 October 2025).

Conflicts of Interest

The authors declare no conflicts of interest.

References

  1. Yu, J.; Yin, H.; Li, J.; Gao, M.; Huang, Z.; Cui, L. Enhancing social recommendation with adversarial graph convolutional networks. IEEE Trans. Knowl. Data Eng. 2020, 34, 3727–3739. [Google Scholar] [CrossRef]
  2. Santiago, R.; Martins, M.A.; Figueiredo, D. Introducing fuzzy reactive graphs: A simple application on biology. Soft Comput. 2021, 25, 6759–6774. [Google Scholar] [CrossRef]
  3. Nishikawa, Y.; Yoshino, T.; Sugie, T.; Nakata, Y.; Itou, K.; Ohsawa, Y. Explanatory Change Detection in Financial Markets by Graph-Based Entropy and Inter-Domain Linkage. Entropy 2022, 24, 1726. [Google Scholar] [CrossRef] [PubMed]
  4. McPherson, M.; Smith-Lovin, L.; Cook, J.M. Birds of a feather: Homophily in social networks. Annu. Rev. Sociol. 2001, 27, 415–444. [Google Scholar] [CrossRef]
  5. Wu, Q.; Hao, J.K. A review on algorithms for maximum clique problems. Eur. J. Oper. Res. 2015, 242, 693–709. [Google Scholar] [CrossRef]
  6. Malliaros, F.D.; Giatsidis, C.; Papadopoulos, A.N.; Vazirgiannis, M. The core decomposition of networks: Theory, algorithms and applications. VLDB J. 2020, 29, 61–92. [Google Scholar] [CrossRef]
  7. Batagelj, V.; Zaversnik, M. An o (m) algorithm for cores decomposition of networks. arXiv 2003, arXiv:cs/0310049. [Google Scholar] [CrossRef]
  8. Khaouid, W.; Barsky, M.; Srinivasan, V.; Thomo, A. K-core decomposition of large networks on a single PC. Proc. VLDB Endow. 2015, 9, 13–23. [Google Scholar] [CrossRef]
  9. Ahmad, A.; Yuan, L.; Yan, D.; Guo, G.; Chen, J.; Zhang, C. Accelerating k-Core Decomposition by a GPU. In Proceedings of the 2023 IEEE 39th International Conference on Data Engineering (ICDE), Anaheim, CA, USA, 3–7 April 2023; pp. 1818–1831. [Google Scholar]
  10. Wen, D.; Qin, L.; Zhang, Y.; Lin, X.; Yu, J.X. I/o efficient core graph decomposition: Application to degeneracy ordering. IEEE Trans. Knowl. Data Eng. 2018, 31, 75–90. [Google Scholar] [CrossRef]
  11. Seidman, S.B. Network structure and minimum degree. Soc. Netw. 1983, 5, 269–287. [Google Scholar] [CrossRef]
  12. Cheng, J.; Ke, Y.; Chu, S.; Özsu, M.T. Efficient core decomposition in massive networks. In Proceedings of the 2011 IEEE 27th International Conference on Data Engineering, Hannover, Germany, 11–16 April 2011; pp. 51–62. [Google Scholar]
  13. Montresor, A.; De Pellegrini, F.; Miorandi, D. Distributed k-core decomposition. In Proceedings of the 30th Annual ACM SIGACT-SIGOPS Symposium on Principles of Distributed Computing, San Jose, CA, USA, 6–8 June 2011; pp. 207–208. [Google Scholar]
  14. Mandal, A.; Al Hasan, M. A distributed k-core decomposition algorithm on spark. In Proceedings of the 2017 IEEE International Conference on Big Data (Big Data), Boston, MA, USA, 11–14 December 2017; pp. 976–981. [Google Scholar]
  15. Esfandiari, H.; Lattanzi, S.; Mirrokni, V. Parallel and streaming algorithms for k-core decomposition. In Proceedings of the International Conference on Machine Learning. PMLR, Stockholm, Sweden, 10–15 July 2018; pp. 1397–1406. [Google Scholar]
  16. Gao, S.; Xu, J.; Li, X.; Fu, F.; Zhang, W.; Ouyang, W.; Tao, Y.; Cui, B. K-core decomposition on super large graphs with limited resources. In Proceedings of the 37th ACM/SIGAPP Symposium on Applied Computing, Virtual, 25–29 April 2022; pp. 413–422. [Google Scholar]
  17. Dasari, N.S.; Desh, R.; Zubair, M. Park: An efficient algorithm for k-core decomposition on multicore processors. In Proceedings of the 2014 IEEE International Conference on Big Data (Big Data), Washington, DC, USA, 27–30 October 2014 2014; pp. 9–16. [Google Scholar]
  18. Kabir, H.; Madduri, K. Parallel k-core decomposition on multicore platforms. In Proceedings of the 2017 IEEE International Parallel and Distributed Processing Symposium Workshops (IPDPSW), Lake Buena Vista, FL, USA, 29 May–2 June 2017; pp. 1482–1491. [Google Scholar]
  19. Shin, K.; Eliassi-Rad, T.; Faloutsos, C. Corescope: Graph mining using k-core analysis—Patterns, anomalies and algorithms. In Proceedings of the 2016 IEEE 16th International Conference on Data Mining (ICDM), Barcelona, Spain, 12–15 December 2016; pp. 469–478. [Google Scholar]
  20. Shin, K.; Eliassi-Rad, T.; Faloutsos, C. Patterns and anomalies in k-cores of real-world graphs with applications. Knowl. Inf. Syst. 2018, 54, 677–710. [Google Scholar] [CrossRef]
  21. Feng, P. Measuring user influence on twitter using modified k-shell decomposition. Int. AAAI Conf. Web Soc. Media 2011, 5, 18–23. [Google Scholar]
  22. Kitsak, M.; Gallos, L.K.; Havlin, S.; Liljeros, F.; Muchnik, L.; Stanley, H.E.; Makse, H.A. Identification of influential spreaders in complex networks. Nat. Phys. 2010, 6, 888–893. [Google Scholar] [CrossRef]
  23. Garas, A.; Schweitzer, F.; Havlin, S. A k-shell decomposition method for weighted networks. New J. Phys. 2012, 14, 083030. [Google Scholar] [CrossRef]
  24. Chu, D.; Zhang, F.; Lin, X.; Zhang, W.; Zhang, Y.; Xia, Y.; Zhang, C. Finding the best k in core decomposition: A time and space optimal solution. In Proceedings of the 2020 IEEE 36th International Conference on Data Engineering (ICDE), Dallas, TX, USA, 20–24 April 2020; pp. 685–696. [Google Scholar]
  25. Rozemberczki, B.; Sarkar, R. Twitch Gamers: A Dataset for Evaluating Proximity Preserving and Structural Role-based Node Embeddings. arXiv 2021, arXiv:2101.03091. [Google Scholar] [CrossRef]
  26. Mei, G.; Tu, J.; Xiao, L.; Piccialli, F. An efficient graph clustering algorithm by exploiting k-core decomposition and motifs. Comput. Electr. Eng. 2021, 96, 107564. [Google Scholar] [CrossRef]
  27. Tu, J.; Mei, G.; Piccialli, F. An improved Nyström spectral graph clustering using k-core decomposition as a sampling strategy for large networks. J. King Saud Univ.-Comput. Inf. Sci. 2022, 34, 3673–3684. [Google Scholar] [CrossRef]
  28. Rossi, R.A.; Ahmed, N.K. The Network Data Repository with Interactive Graph Analytics and Visualization. In Proceedings of the AAAI Conference on Artificial Intelligence, Austin, TX, USA, 25–30 January 2015. [Google Scholar]
Figure 1. Relationship between memory usage and the number of edges.
Applsci 15 10753 g001
Figure 2. A sample graph with maximum core number 3.
Applsci 15 10753 g002
Figure 3. A sample of social network.
Applsci 15 10753 g003
Figure 4. A sample social network with a maximum core number of 3.
Applsci 15 10753 g004
Figure 5. Running time comparison.
Applsci 15 10753 g005
Figure 6. Relationship between execution time and the number of edges.
Applsci 15 10753 g006
Figure 7. Scatterplot of the core number and degree for different datasets: (a) soc-pages-artist, (b) soc-pages-company, (c) soc-pages-government, (d) soc-pages-media, (e) soc-pages-politician, (f) soc-pages-public-figure, and (g) soc-pages-sport.
Applsci 15 10753 g007
Figure 8. Relationship between the core number and the number of nodes.
Applsci 15 10753 g008
Table 1. Description of vertices in a graph database.
PropertyMeaningType
viewsNumber of views on the channelinteger
created_atJoining datestring
life_timeDays between first and last streaminteger
degreeNumber of neighborsinteger
statusFlag of the core number statusboolean
coreCore number of each vertexinteger
memberFlag of core memberboolean
Table 2. Hardware Specifications.
ComponentSpecification
Server ModelNettrix BX50 G40
CPU2 × Intel(R) Xeon(R) Gold 6326 @ 2.90 GHz (Total 32 Cores)
Memory (RAM)256 GB DDR4 3200 MT/s
Storage256 TiB Parastor Parallel Storage System
Network200 Gb/s InfiniBand
Table 3. Software Environment.
SoftwareVersion
Operating SystemCentOS 7.9
Java EnvironmentJDK 1.8.0_371
Graph DatabaseJanusGraph 0.5.2
Storage BackendHBase 2.1.5
Index BackendDefault (Embedded)
Distributed FilesystemHadoop 2.7.7
Coordination ServiceZooKeeper 3.4.6
Analysis EngineSpark 2.4.0 (with Scala 2.12.13)
Table 4. Key Configuration Parameters.
ParameterSetting/Value
JVM Heap Size30 GB
GC SettingsParallel GC
Index TypeComposite (via embedded backend)
Transaction Cache Size500,000
Database Cache Enabledtrue
Table 5. Description of datasets.
DatasetVerticesEdges
artist50,515819,306
company14,11352,310
government705789,456
media27,917206,260
politician590841,729
public-figure11,56567,114
sport13,86686,858
Table 6. Number of core members and core ratio.
DatasetTop-1 CoresTop-1 RatioTop-3 CoresTop-3 RatioTop-5 CoresTop-5 Ratio
artist5331.1%7401.4%9361.8%
company650.5%920.7%1332.3%
government1111.6%1301.8%1662.6%
media360.1%1420.5%2740.9%
politician681.2%1382.3%1542.6%
public figure1911.7%2141.8%2412.1%
sport390.3%420.3%760.5%
Table 7. Results of the power-law fit and model comparison.
Dataset α x min Best Fit Model
artist2.9420Stretched Exponential
company7.6610Power-Law
government6.6129Stretched Exponential
media17.8221Power-Law
politician2.828Stretched Exponential
public figure2.958Power-Law
sport9.4315Power-Law
Table 8. Correlation coefficients of core ratio and other characteristics.
ArtistCompanyGovernmentMediaPoliticianPublic FigureSport
nodes50,51514,113705727,917590811,56513,866
edges819,30652,31089,456206,26041,72967,11486,858
density0.0006420.0005250.0035930.0005290.0023910.0010040.000904
Average degree3272515141213
top-1 ratio1.1%0.5%1.6%0.1%1.2%1.7%0.3%
ρ 11 −0.232829
ρ 12 0.014692
ρ 13 0.606877
ρ 14 0.358689
top-3 ratio1.4%0.7%1.8%0.5%2.3%1.8%0.3%
ρ 21 −0.260089
ρ 22 −0.017800
ρ 23 0.654329
ρ 24 0.293671
top-5 ratio1.8%0.8%2.3%0.9%2.6%2.1%0.5%
ρ 31 −0.199264
ρ 32 0.042251
ρ 33 0.689463
ρ 34 0.395250
Table 9. Small-world network characteristic for core members.
Top-1 Path LengthTop-3 Path LengthTop-5 Path LengthAverage Path Length
artist7.077.097.097.67
company10.4310.3010.6010.78
government6.806.766.817.36
media9.339.169.129.90
politician9.049.339.3410.17
public figure9.379.409.4110.18
sport7.007.007.398.15
Table 10. Information dissemination capacity of the core members.
IDC ( 1 , G ) IDC ( 3 , G ) IDC ( 5 , G ) AvgIDC ( G )
artist0.0730.0630.0630.503
company0.0880.1370.1230.366
government0.0870.0860.0800.428
media0.2210.2120.2100.385
politician0.0740.0660.0640.362
figure0.0470.0440.0400.519
sport0.0880.3490.2520.480
Disclaimer/Publisher’s Note: The statements, opinions and data contained in all publications are solely those of the individual author(s) and contributor(s) and not of MDPI and/or the editor(s). MDPI and/or the editor(s) disclaim responsibility for any injury to people or property resulting from any ideas, methods, instructions or products referred to in the content.