Article

C5LS: An Enhanced YOLOv8-Based Model for Detecting Densely Distributed Small Insulators in Complex Railway Environments

Institute of Computing Technology, China Academy of Railway Sciences, Beijing 100081, China
*
Author to whom correspondence should be addressed.
Appl. Sci. 2025, 15(19), 10694; https://doi.org/10.3390/app151910694
Submission received: 4 September 2025 / Revised: 26 September 2025 / Accepted: 29 September 2025 / Published: 3 October 2025

Abstract

The complex environment along railway lines, characterized by low imaging quality, strong background interference, and densely distributed small objects, causes existing detection models to suffer from low accuracy in practical applications. To tackle these challenges, this study aims to develop a robust and lightweight insulator detection model specifically optimized for these challenging railway scenarios. To this end, we release a dedicated comprehensive dataset named complexRailway that covers typical railway scenarios to address the limitations of existing insulator datasets, such as the lack of small-scale objects in high-interference backgrounds. On this basis, we present CutP5-LargeKernelAttention-SIoU (C5LS), an improved YOLOv8 variant with three key improvements: (1) optimized YOLOv8’s detection head by removing the P5 branch to improve feature extraction for small- and medium-sized targets while reducing computational redundancy, (2) integrating a lightweight Large Separable Kernel Attention (LSKA) module to expand the receptive field and improve contextual modeling, (3) and replacing CIoU with SIoU loss to refine localization accuracy and accelerate convergence. Experimental results demonstrate that it reaches 94.7% in mAP@0.5 and 65.5% in mAP@0.5–0.95, outperforming the baseline model by 1.9% and 3.5%, respectively. With an inference speed of 104 FPS and a model size of 13.9 MB, the model balances high precision and lightweight deployment. By providing stable and accurate insulator detection, C5LS not only offers reliable spatial positioning basis for subsequent defect identification but also builds an efficient and feasible intelligent monitoring solution for these failure-prone insulators, thereby effectively enhancing the operational safety and maintenance efficiency of the railway power system.

1. Introduction

With the rapid development of high-speed railways, rising operation and maintenance demands have made “planned inspection and maintenance” insufficient, creating an urgent need for more efficient and precise solutions. Building an intelligent railway operation and maintenance system is becoming a key path to promoting high-quality railway development [1,2]. Among various equipment systems, the traction power supply system is critical for stable train operation. As its core component, the catenary system undertakes the dual functions of wire support and high-voltage insulation, so its operating status directly affects railway transportation safety [3]. Although catenary masts are relatively stable, insulators connecting towers and conductors are more prone to aging and damage due to long-term environmental exposure. Their high fault frequency and dense distribution make them essential targets for monitoring in intelligent operation and maintenance systems.
For a long time, insulator defect identification has been carried out through on-site inspections and helicopter inspections. Although this method is effective in small-scale monitoring, in railway scenarios, due to the complex environment and the generation of massive high-dimensional operation data [4], these traditional methods face significant limitations. Manual approaches struggle to process the large volume of diverse, high-resolution data required for intelligent railway systems. This challenge is intensified for catenary insulators, which are often densely distributed on a single cable, leading to increased missed or false detections and thus affecting maintenance decisions. Therefore, achieving efficient and accurate defect identification has become a core objective of intelligent railway inspection systems, making it necessary to leverage advanced data collection and image recognition technologies to overcome these bottlenecks.
In recent years, the rapid development of Unmanned Aerial Vehicle (UAV) technology has provided an efficient method for the information acquisition of railway traction equipment [5,6]. By obtaining high-resolution aerial images, status collection of insulators can be rapidly completed. However, the large-scale and diverse data collected by UAVs across various environments pose significant challenges for insulator defect detection, particularly in classifying and localizing such key targets. Precise defect detection is therefore required to effectively extract defect information from the UAV images. Centering on this core task, deep learning-based methods have achieved significant breakthroughs. These object detection algorithms are categorized into two-stage and one-stage methods. Two-stage models, such as R-CNN [7], Fast R-CNN [8], and Faster R-CNN [9], generate region proposals followed by bounding-box regression, achieving high accuracy but incurring heavy computation and slow inference. In contrast, one-stage models, including the YOLO series [10,11,12,13,14], SSD [15], and RetinaNet [16], perform end-to-end detection. Compared with two-stage detection, the YOLO series is widely applied in insulator detection tasks due to its end-to-end detection, decent real-time performance, and efficient deployment.
Numerous studies have successfully applied these advanced models to traction equipment detection, enhancing insulator identification through strategies such as lightweight network design and attention mechanisms. For instance, Zhang et al. [17] employed a multi-scale large kernel attention (MLKA) module to enhance the model’s ability to extract insulator defect features on the CPLID dataset [18], ultimately achieving an accuracy of 99.22%. The LDIDD method proposed by Liu et al. [19] reduced the model size by introducing the MobileNetv3 lightweight backbone network, resulting in a 46.6% reduction in the number of parameters. Hu et al. [20] effectively enhanced the model’s ability to extract insulator features in high-reflective scenarios by introducing a deformable convolutional module (DCNv2) and a global attention mechanism (GAM), achieving an accuracy of 99.4% on the SFID dataset [21]. Xu et al. [22] introduced the MAP-CA attention mechanism combining average pooling and max pooling strategies to enhance the model’s perception in complex backgrounds, achieving an accuracy of 96.6% on CLPID. Although these models display decent detection capabilities under some ideal conditions, they are mainly designed for object detection in generic scenarios and trained on general insulator datasets, but have not yet been optimized for the complex conditions encountered in railway inspection.
In actual railway inspection, the complex and dynamic working environment has put much higher requirements for the detection accuracy and stability of insulators, which can be categorized into the following three aspects:
  • Small targets and feature loss: due to long-distance UAV imaging and limited imaging angles, insulators often occupy less than 0.25% of the image area, with frequent edge truncation and partial occlusion by obstacles.
  • Dense distribution and background interference: closely arranged insulators, overlapping boundaries, and complex backgrounds such as vegetation and building shadows make feature extraction more difficult.
  • Low-quality imaging and adverse weather conditions: inadequate lighting near tunnel entrances, UAV vibrations, and unfavorable weather (rain, snow, smog) cause image blur and detection instability.
These ubiquitous interferences pose a key challenge to railway insulator detection. However, existing public datasets such as CPLID [18], IDID [23], and SFID [21] are mostly collected from transmission lines with stable lighting and fail to cover these complexities, leading to a significant degradation of detection models in real railway scenarios.
In addition, all recent work mentioned above attempted to directly build defect detection models that classify insulators in the original image and perform end-to-end detection. While effective on public datasets, detection stability degrades in railway scenarios with long-distance imaging, complex backgrounds, and blurred images, where insulators appear as small, blurry targets with weaker defect features that are harder to extract. Inspired by [24], this paper proposes a two-stage detection framework: first detect and localize insulators and then perform defect analysis on cropped regions, effectively reducing background interference and improving defect detection accuracy.
This study focuses on the insulator detection and localization. As the results directly serve as inputs for subsequent defect identification, higher accuracy is preferable. To fully address these challenges, this study categorizes them into three key aspects: the detection of small-scale targets, dense distribution and background interference, low-quality imaging, and various weather conditions. Solving these interrelated issues is the key to achieving stable and robust detection in railway environments. Thus, the core objective of this research is to enhance the accuracy and robustness of insulator detection in these complex railway settings, while ensuring model efficiency and deployability for practical applications. The core contributions are as follows:
  • Construct the first comprehensive insulator detection dataset complexRailway for real railway scenarios: Collected from actual railway operational environments in Jinan, Guangzhou, and Xi’an, the dataset consists of 2500 high-resolution UAV aerial images. It systematically covers the above-mentioned real-world challenges.
  • Propose the CutP5-LargeKernelAttention-SIoU (C5LS) detection framework and make three model improvements based on YOLOv8 to enhance detection accuracy and deployment efficiency:
    • Lightweight detection head design: Remove the P5 detection branch to reduce the computation load and high-level feature noise, making it suitable for resource-constrained UAV edge computing devices.
    • Enhanced feature extraction via Large Kernel Attention (LSKA): Incorporate LSKA to enlarge the receptive field and enhance channel perception under low-quality images, leading to a 1% increase in mAP@0.5.
    • Enhanced localization accuracy via SIoU Loss: Replace CIoU with SIoU loss to strengthen geometric modeling and improve bounding-box regression accuracy for small objects, leading to an approximate 0.6% increase in mAP@0.5.
  • Conduct ablation experiments to evaluate the effects of the above three improvements quantitatively. The results show that the proposed method exhibits higher localization accuracy than mainstream models in complex scenarios. Compared with the baseline, mAP@0.5 improves by 1.9%, mAP@0.5–0.95 improves by 3.5%, the inference time is within 9.6 ms, and the number of parameters is 13 M, indicating strong deployment potential.

2. Materials and Methods

2.1. Database Construction and Augmentation

2.1.1. Image Acquisition

To construct a high-quality image dataset suitable for insulator detection along railway lines, an Unmanned Aerial Vehicle (UAV) was used to inspect actual railway operation conditions. Images were collected in a multi-region manner, covering the railway lines in Jinan, Xi’an, and Lanzhou. The cruising altitude of the UAV was controlled at approximately 40 m. The actual imaging angles mainly collected for insulator detection include both direct and top-down perspectives, truly reproducing the imaging effect in real railway scenarios. A total of approximately 10,000 original images were collected this acquisition, with each image resolution ranging from 7500 × 5500 to 8500 × 6500 pixels. Based on all the collected images, 1500 images with insulators were finally selected as the original images, most of which were distant imaging photos. To ensure the challenge and diversity of the dataset, the image content covers the following five typical railway scene challenges. The number of samples selected for each category is shown in Table 1:
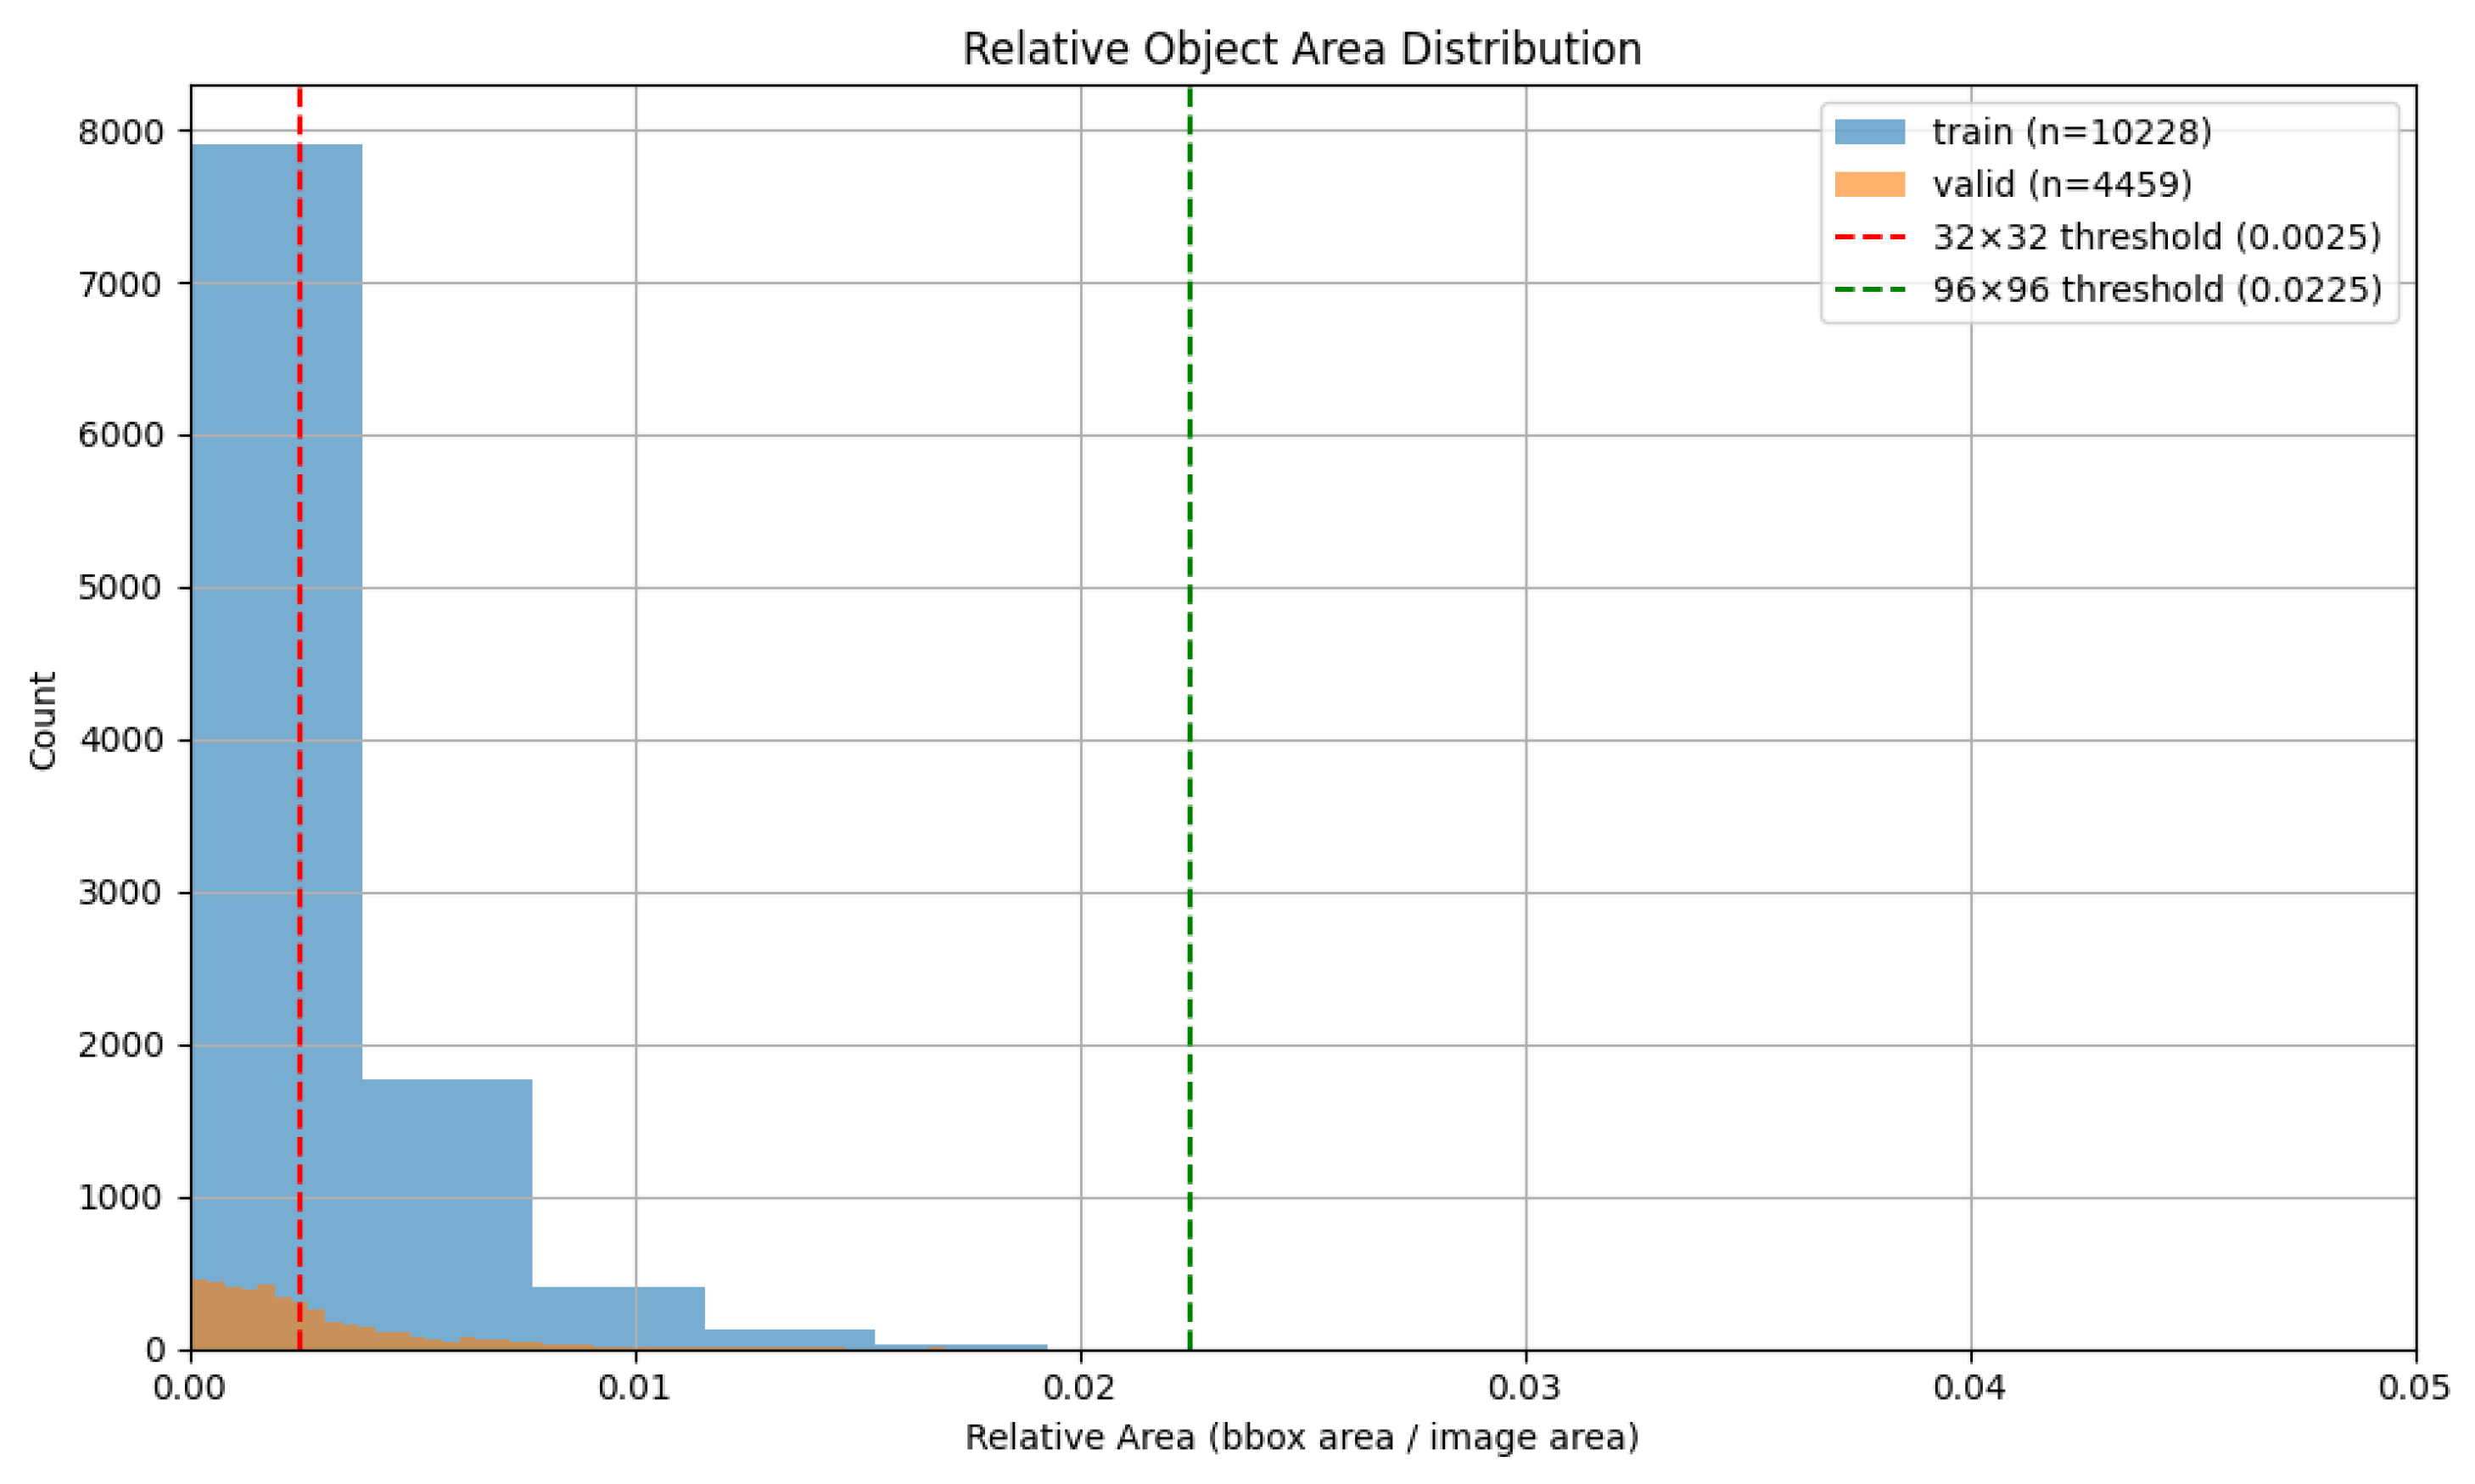
All images were manually labeled using Labelme, covering all insulators. Each target position is marked with a rectangular bounding box, and the result is saved in JSON format. After the annotation was completed, we calculated the relative area proportion of the target box in the image, and the statistical result is shown in Figure 1. Among the total of over 14,600 annotation boxes, more than 75% of the targets have a relative area less than 0.36%, meeting the MS-COCO standard definition of small targets (relative area 0.25 % ) [25]. The relative area of the remaining targets is below 2.25%, falling within the medium target category according to the COCO standard. The entire dataset was divided into training, validation, and test sets in a 5:2:1 ratio.

2.1.2. Data Augmentation

To enhance the model’s robustness and generalization capability under diverse weather conditions, this study utilized the Albumentations image augmentation library [26] to synthetically simulate severe weather scenarios on the original images, generating five categories of weather-simulated images:
  • The RandomRain algorithm was applied on 200 images to add simulated slanted raindrops and blur effects, simulating continuous rainfall.
  • The RandomSnow algorithm was applied on 200 images to add snowflake textures to simulate snow coverage.
  • The RandomFog algorithm was applied on 200 images to add a foggy layer, with the fog coefficient fog_coef_range set to [0.1, 0.3] to reproduce low-visibility scenes.
  • A total of 200 “rain + fog” images and 200 “snow + fog” images were synthesized to simulate the multiple severe weather conditions commonly encountered in southern or plateau regions.
A total of 1000 images with weather augmentation effects were also divided in a 5:2:1 ratio and integrated into the original dataset. Together with the original images, they participated in model training and evaluation to improve robustness and generalization under complex weather conditions. The final complexRailway dataset consists of a total of 2500 images, with the training set, validation set, and test set containing 1600, 700, and 200 images respectively.
To better illustrate the diversity and complexity of the complexRailway dataset, Figure 2 presents a representative image grid. Figure 2a–e correspond to the five typical scene types defined in Table 1, such as long-distance imaging, background interference, and weak-light conditions. Figure 2f,g demonstrate weather-augmented images under fog, rain, and snow. Notably, each image may reflect multiple concurrent challenges. For example, Figure 2h involves densely distributed targets, background interference caused by cables, and rain; while Figure 2i illustrates a combination of long-distance imaging and densely distributed insulators. This visualization highlights the need for robust detection under these real-world disturbances.
Together, these samples provide sufficient data support for typical railway environmental disturbances, variable climates, and long-distance small-target detection, laying a foundation for developing and optimizing well-adapted and robust insulator detection models.

2.2. YOLOv8s Introduction

Although the YOLO series has been updated to YOLOv13, YOLOv8 remains widely adopted in industrial applications due to its well-balanced performance in accuracy, speed, and deployment flexibility. For this reason, this study selects YOLOv8s as the baseline model, as it contains only 11M parameters, achieving a favorable trade-off between detection accuracy and computational efficiency [13]. Compared to other versions such as YOLOv8n and YOLOv8m, YOLOv8s achieves a better balance among model size, inference speed, and detection accuracy, making it suitable for railway aerial image detection tasks characterized by limited computational resources and complex backgrounds.
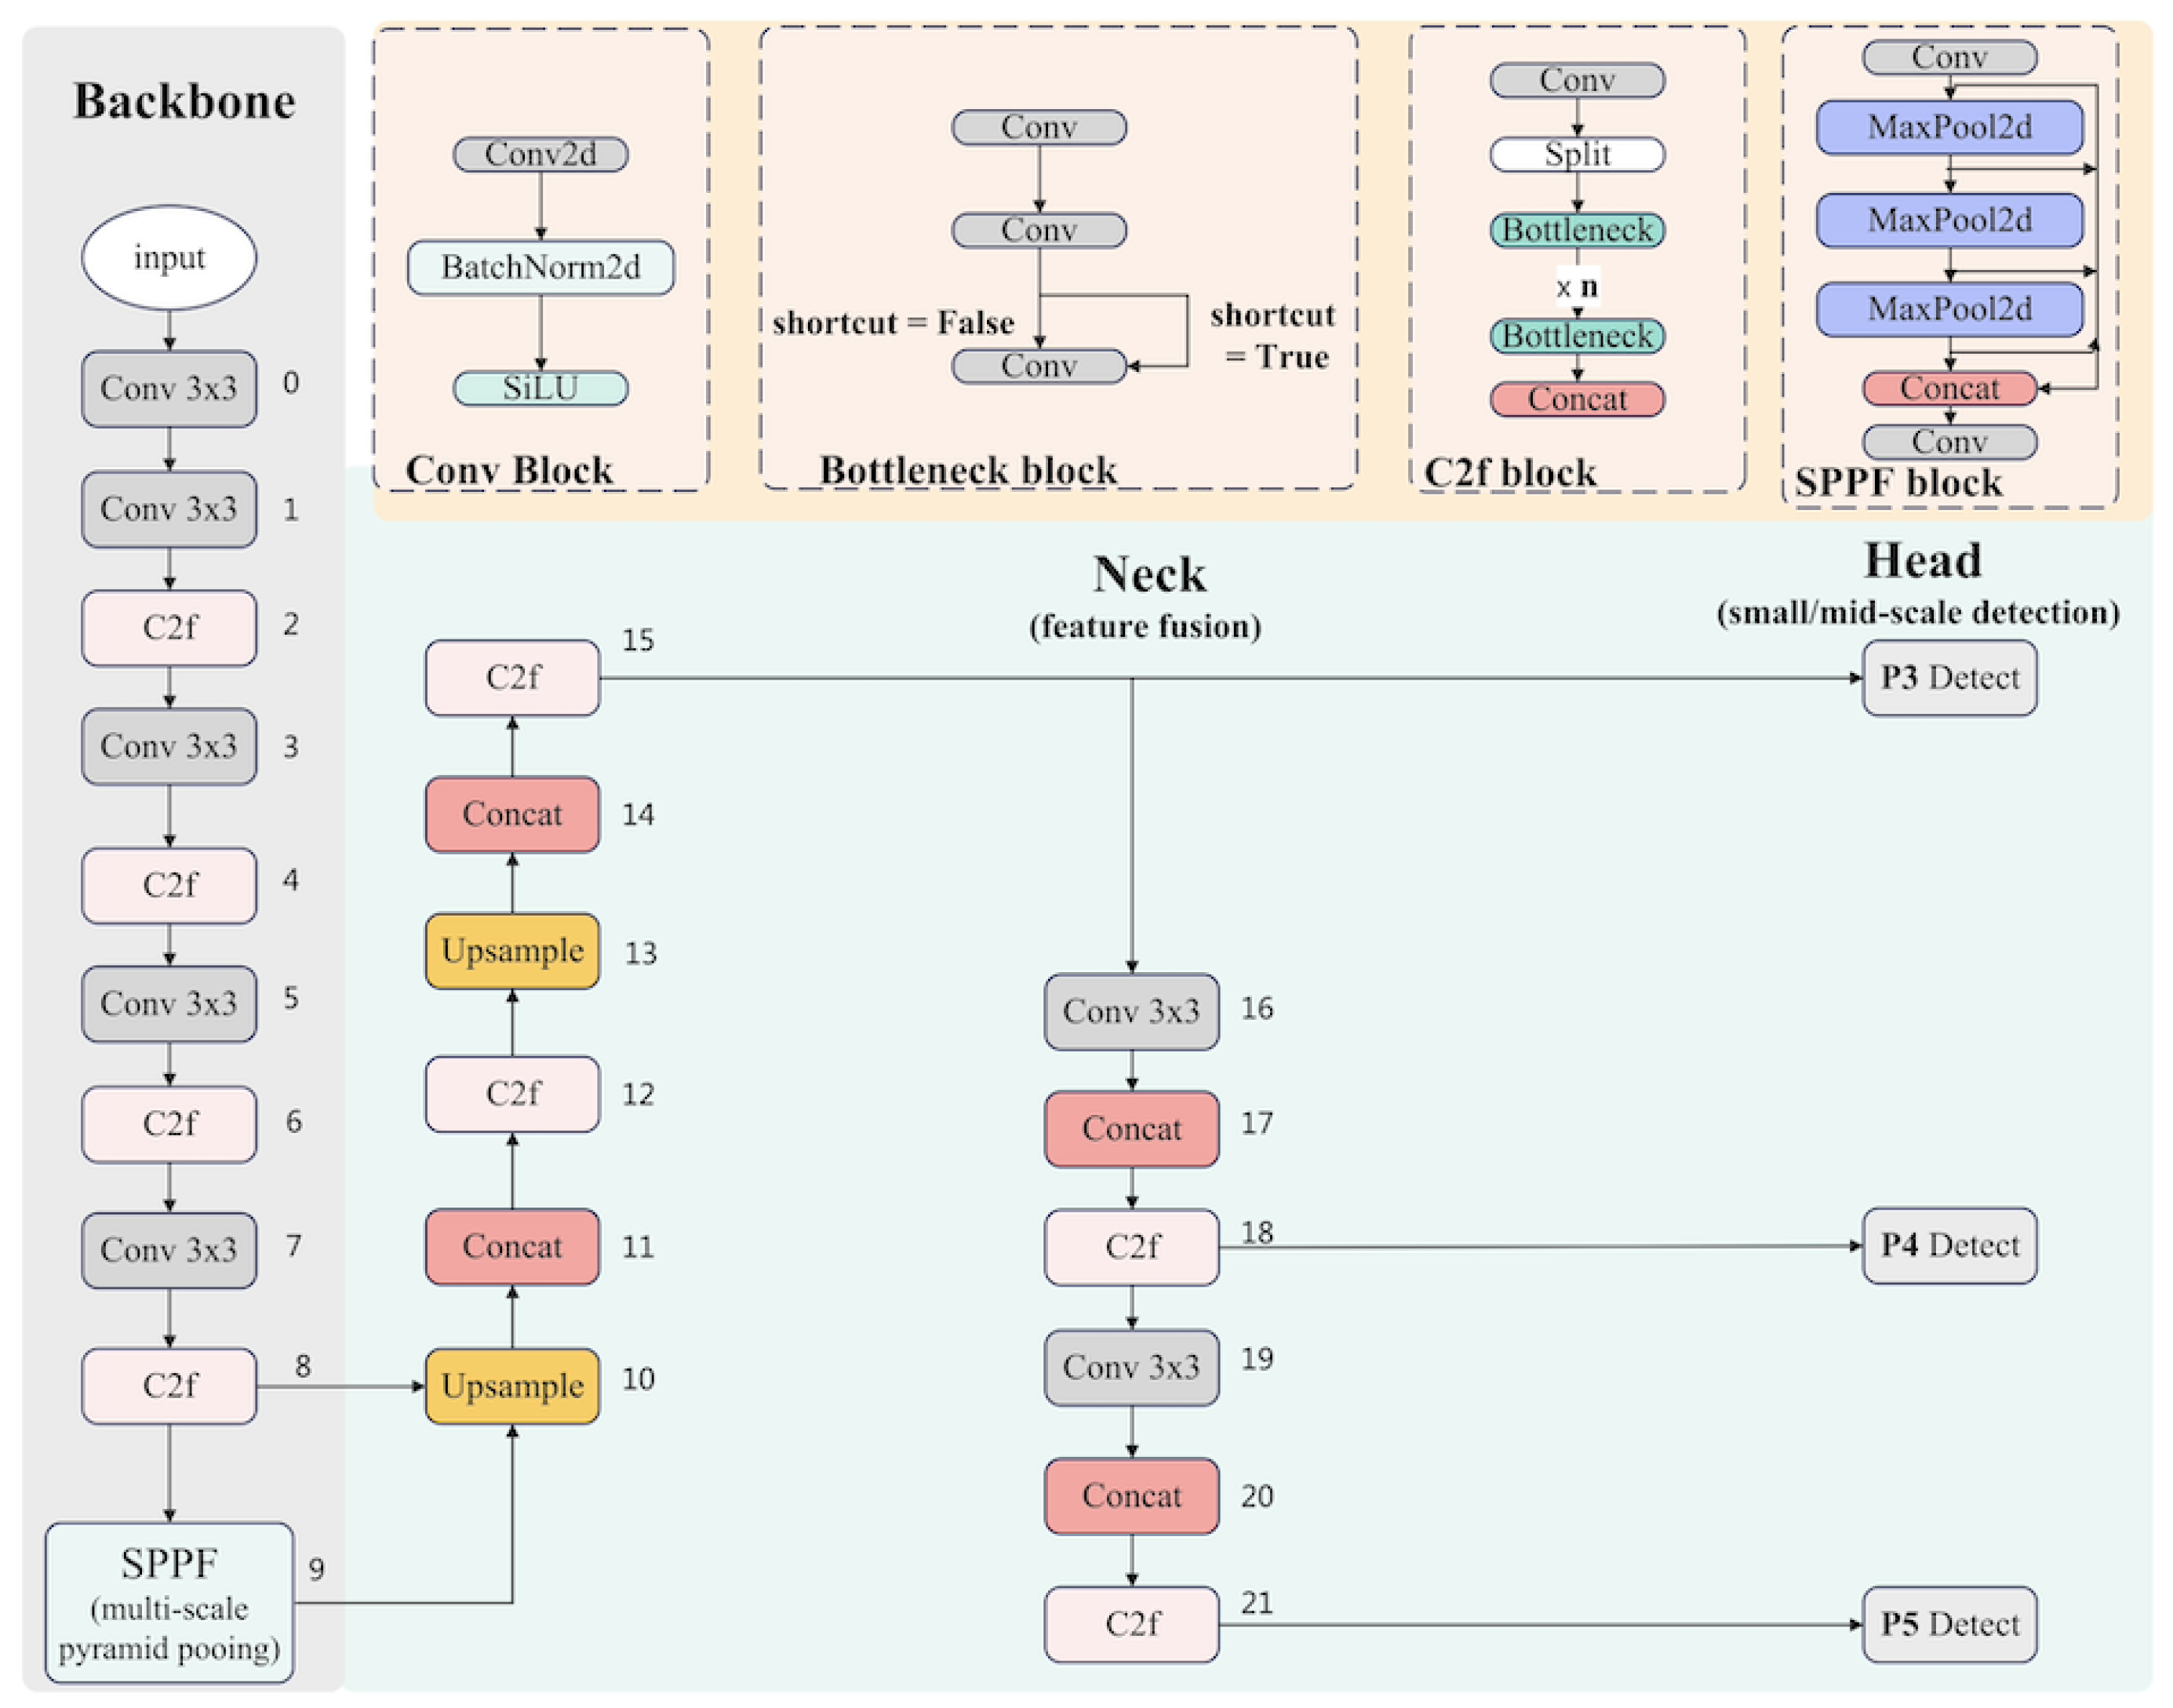
The YOLOv8s network mainly consists of three components: the backbone, neck, and detection head. The overall architecture of YOLOv8s is shown in Figure 3.
  • Backbone: An improved C2f module is adopted, integrating the C3 structure from YOLOv5 [11] and the ELAN design from YOLOv7 [12], which enhances feature representation while reducing computational cost. An additional SPPF module is placed at the end to perform multi-scale pooling, improving the model’s ability to recognize objects of different sizes.
  • Neck: Built on a PAN-FPN path aggregation network, it enables multi-level feature sharing, combining high-level semantic information with low-level localization details for more accurate multi-scale detection.
  • Detection head: An anchor-free design is adopted to directly predict the center coordinates and size of objects, simplifying the network structure. Three detection scales (P3, P4, P5) are used to handle small, medium, and large objects, respectively.
While the existing YOLOv8s architecture is designed to address the challenges of multi-scale object detection, there are potential risks associated with its application to scenarios dominated by small, densely distributed targets, as reflected in Figure 1:
  • Feature Dilution in Backbone: The C2f module improves efficiency, but repeated downsampling in the backbone may progressively lose spatial details of small objects, causing their features to be indistinguishable from background interference [27].
  • Scale Adaptation Issues in Head: While PAN-FPN integrates multi-scale features effectively, its fixed detection scales (P3, P4, P5) struggle to adapt to the small-object-dominated dataset used in this study, limiting performance on such challenging cases.
These architectural limitations introduce potential risks of missed or false detections, especially under challenging conditions such as occlusion and dense arrangements. Errors in insulator detection directly compromise downstream inspection tasks. Specifically, a missed detection in the first stage inevitably leads to undiagnosed defects, potentially resulting in progressive infrastructure failures and serious operational risks like power outages [28,29]. Therefore, the current YOLOv8s architecture requires optimization to mitigate these safety hazards.

2.3. Proposed C5LS Algorithm

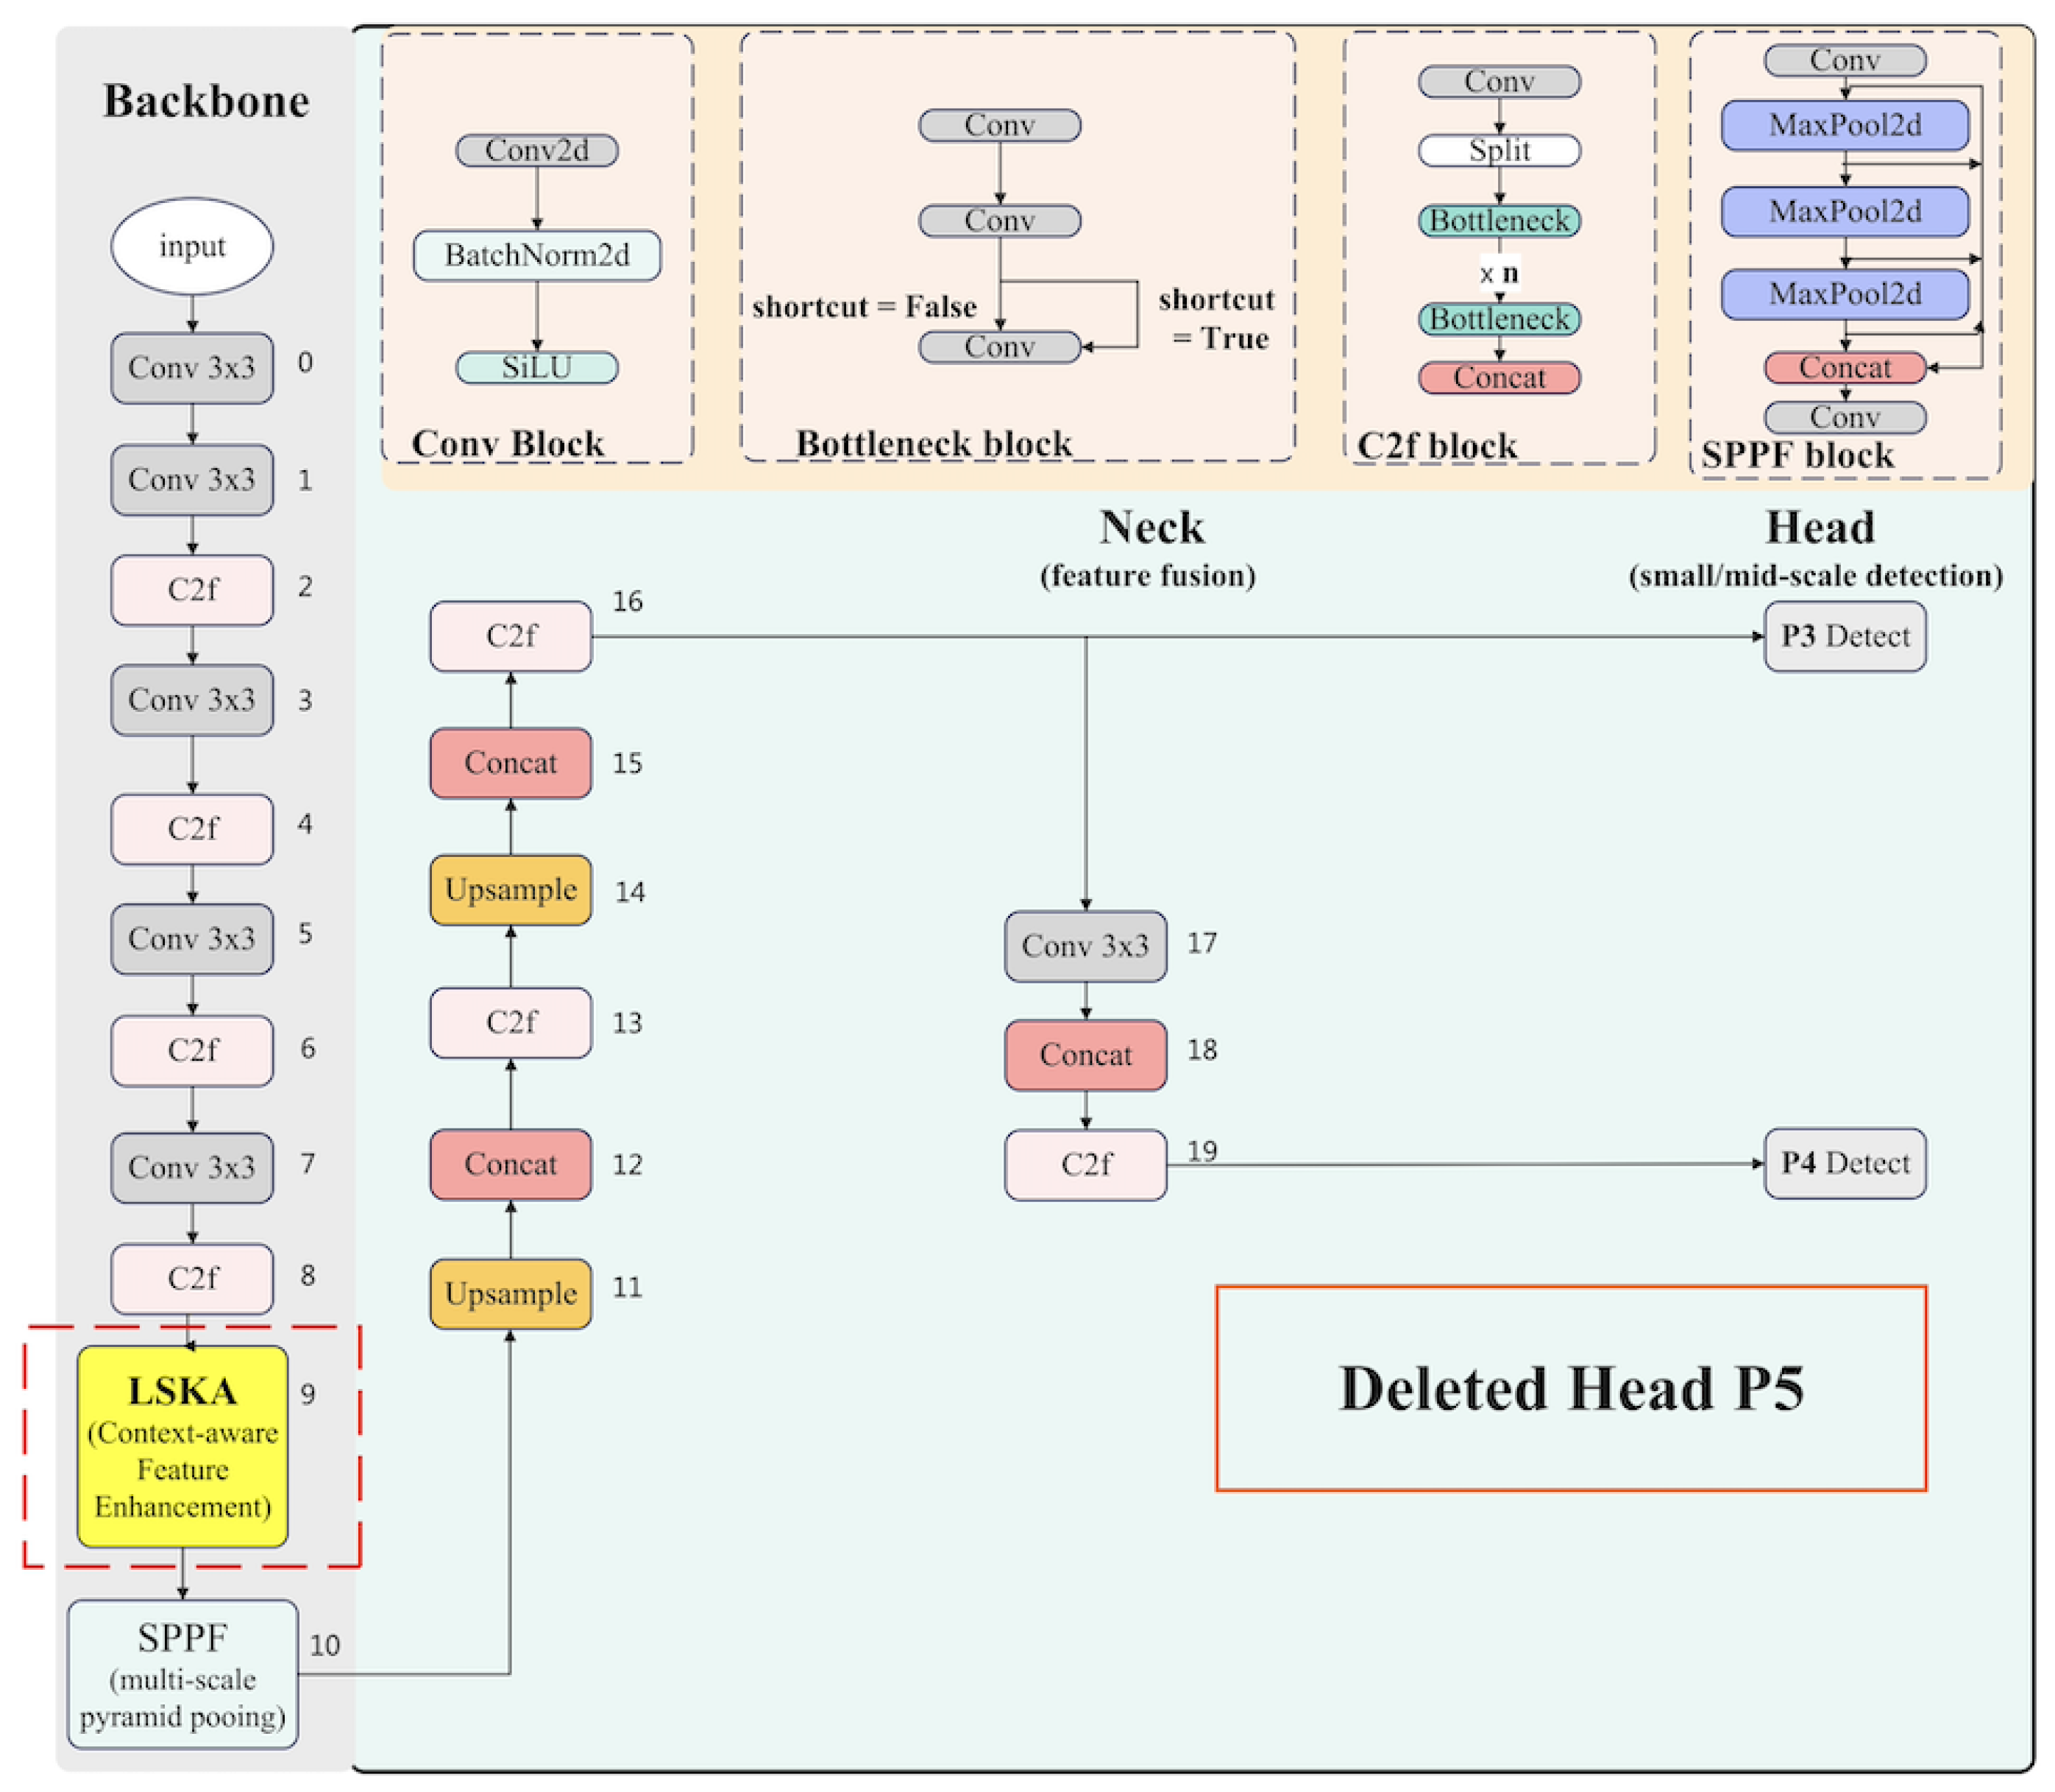
To improve the detection accuracy in UAV aerial insulator images with numerous small objects and complex backgrounds, this study proposes targeted optimizations based on YOLOv8s. Specifically, the P5 large-object detection branch is pruned to reduce redundant computations and enhance small-object detection efficiency; a lightweight LSKA attention module is introduced to improve contextual feature modeling with minimal computational cost, and the SIoU loss function is adopted to achieve refined geometric modeling for better localization accuracy. The improved network is named C5LS, and its overall architecture is shown in Figure 4.

2.3.1. Lightweight Insulator Detection Head

Existing studies show that for small-object detection tasks, appropriately pruning large-scale detection branches can effectively improve model performance. Chen et al. [30] pointed out when adapting YOLOv7 for dense small-object detection tasks, the deep detection head P5 not only becomes redundant but may even cause interference to model training due to the mismatch of feature representation capabilities. By removing the high-level detection head and enhancing the feature extraction pathways for small objects together with other optimizations, their approach significantly reduced model parameters and computational load while achieving higher accuracy in small-object detection.
Therefore, for detection tasks dominated by small- and medium-sized targets, pruning high-level feature maps and detection heads in YOLOv8s can improve training efficiency and detection performance. Inspired by this, the detection head of YOLOv8 is tailored to better adapt to the dominance of small objects in long-range aerial insulator images. As mentioned in the previous section, in the complexRailway dataset, over 75% of objects have a relative area below 0.36%, and all targets fall within the MS-COCO definitions of small and medium objects. The P5 branch in YOLOv8, designed for large-object detection with a 32 × downsampling rate, is almost irrelevant in our task, as targets of the corresponding scale are extremely rare. Therefore, this detection head is not only ineffective, but it also introduces a large amount of redundant computation, resulting in a waste of resources.
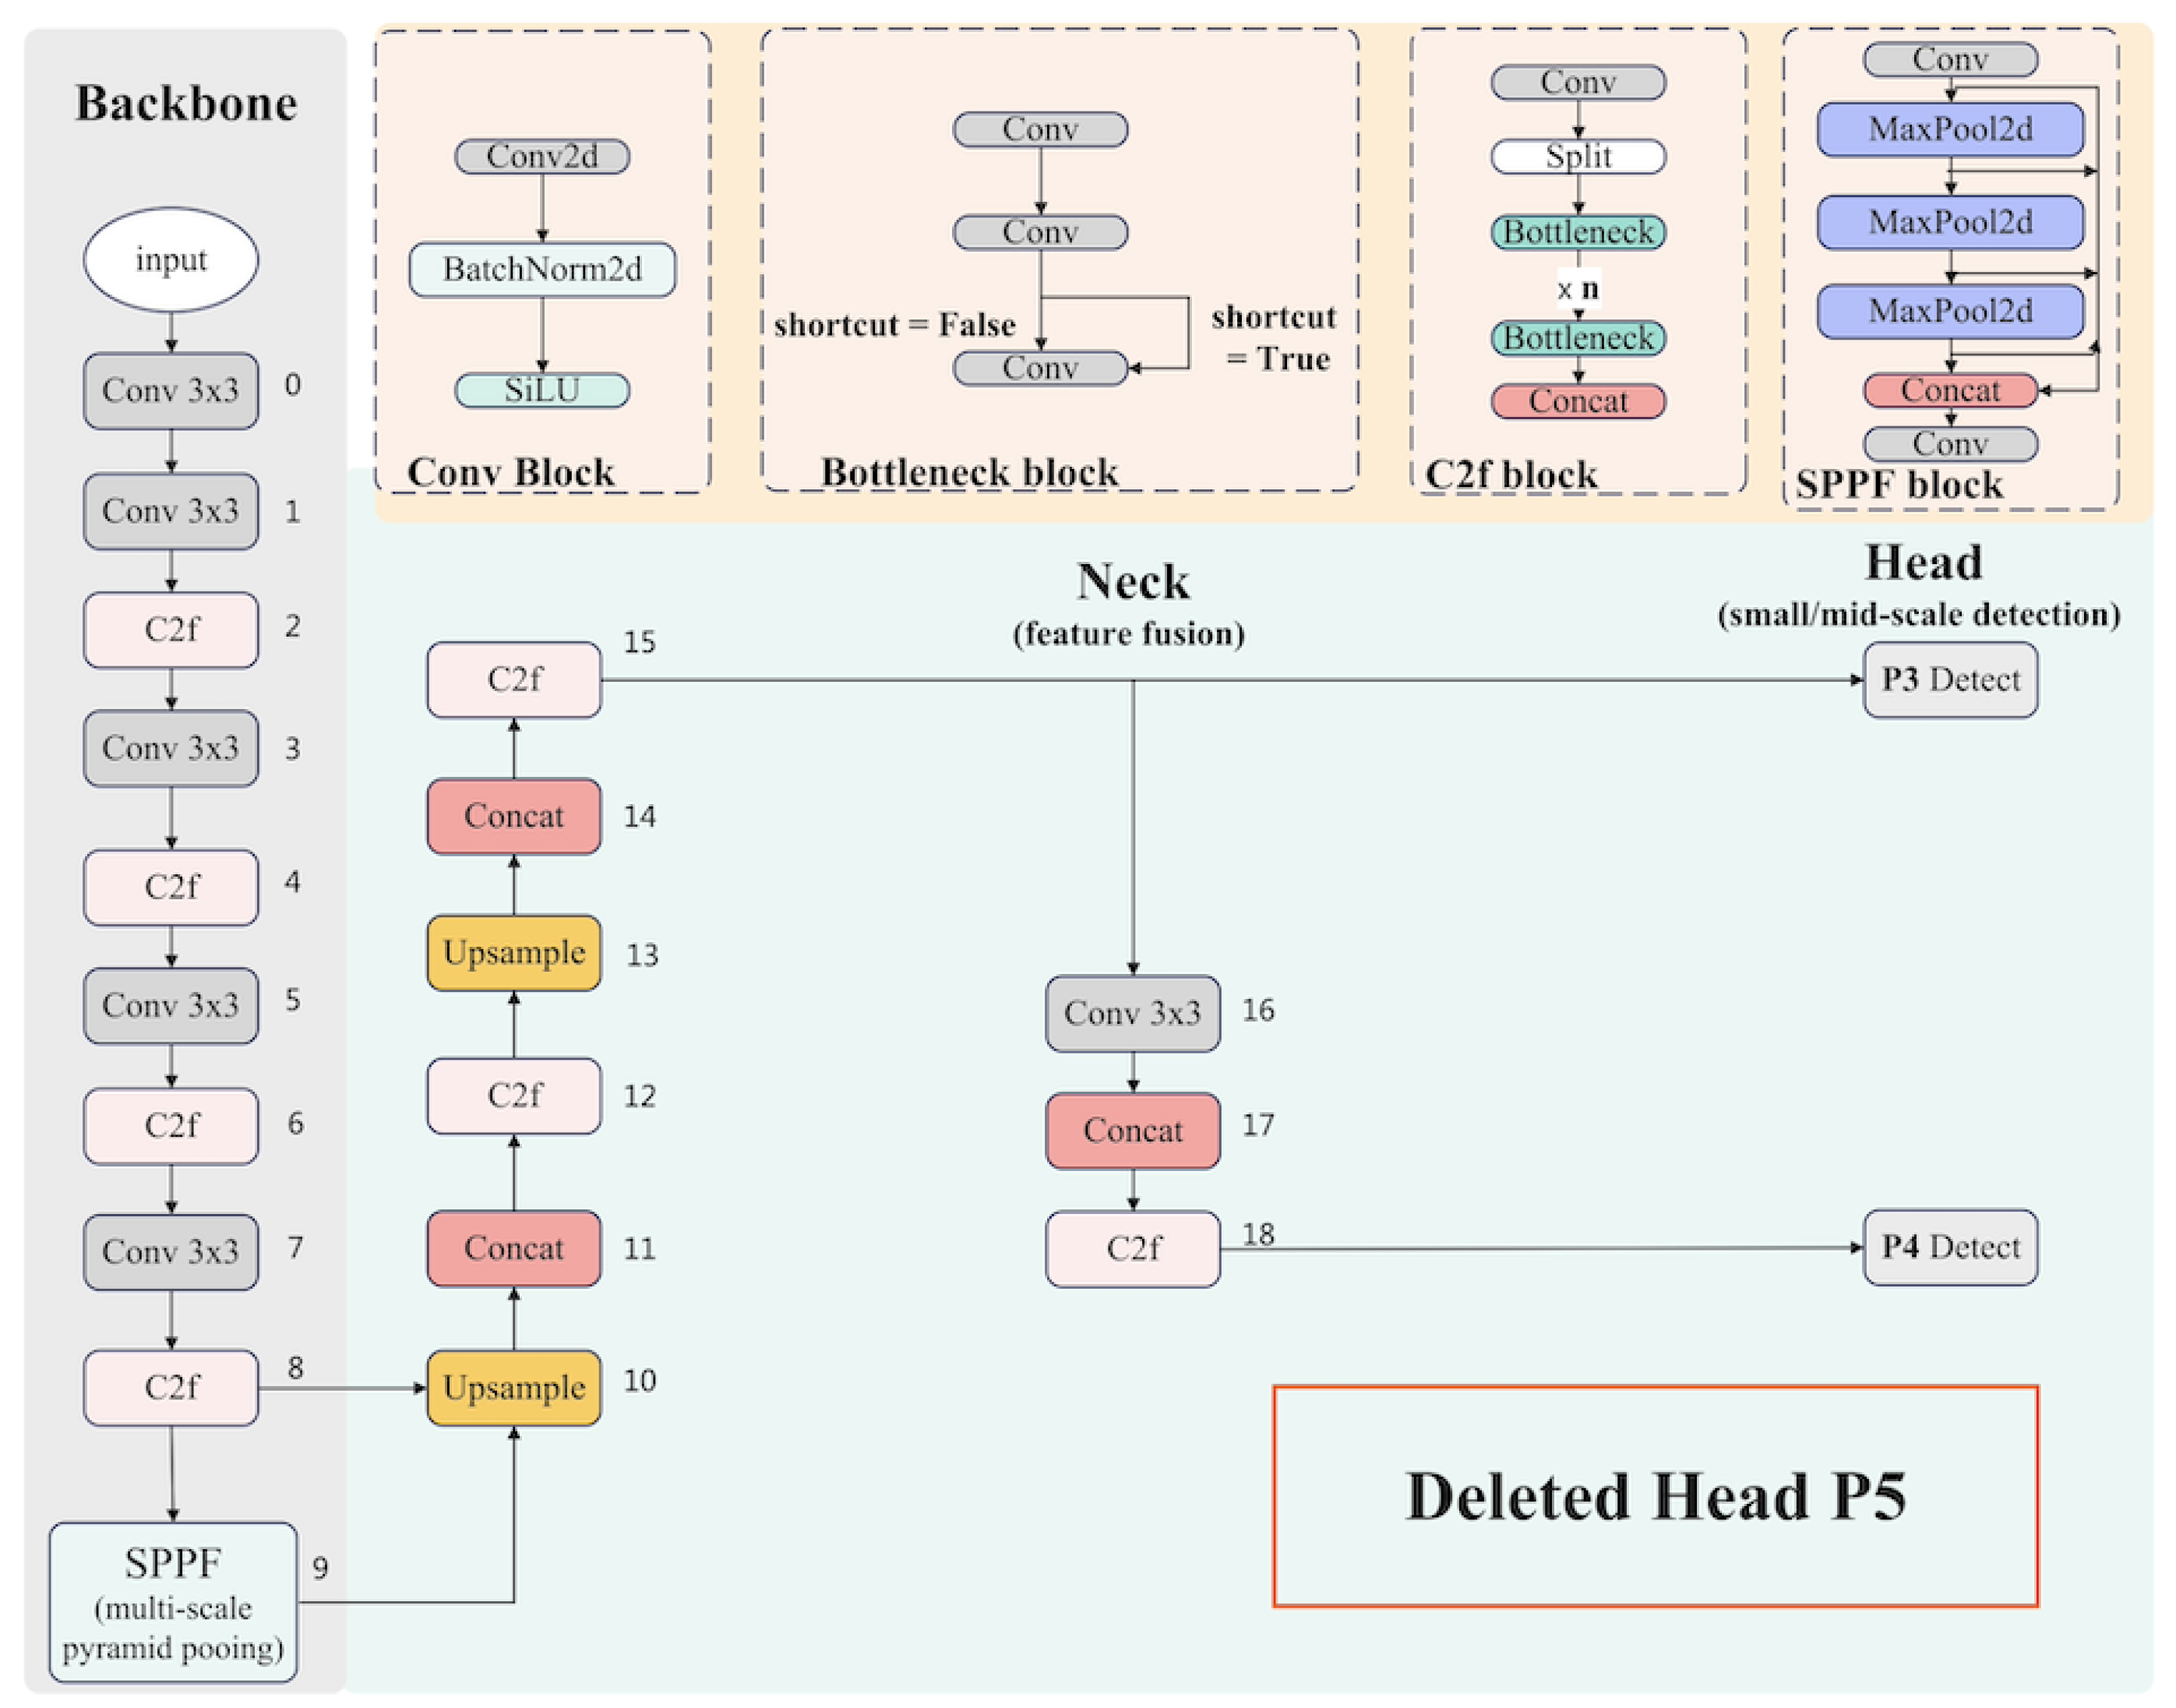
To adapt the model for small- and medium-object-intensive tasks, the structure is tailored following [31]. Specifically, all layers from Block 0 to Block 18 in the original YOLOv8 structure are retained, as shown in Figure 3, to fully leverage the P3 (8 × downsampling) and P4 (16 × downsampling) feature maps. Meanwhile, Blocks 19 to 21 are removed, which are responsible for large-object detection, thereby eliminating the downsampling, fusion, and detection head modules of the P5 branch. This prevents the computational and backpropagation costs associated with the P5 pathway. The pruned model structure is illustrated in Figure 5.
After removing the P5 branch, the feature fusion path is more compact, and reduced feature map dimensions and output channels significantly decrease computational demand during inference. Compared to the original YOLOv8n baseline, the parameter size decreases from 11.1 M to 6.9 M, and the number of layers drops from 129 to 97. More importantly, as our ablation study shows, while maintaining the optimization of computional load, the detection accuracy on this dataset has not decreased. Instead, it has achieved an increase of mAP@0.5 and mAP@0.5–0.95. This is attributed to the stronger perception and positioning capabilities of the P3 and P4 branches for small targets, along with more concentrated use of training resources. By eliminating the P5 branch, feature learning previously dispersed to large-object detection is now focused on more relevant small-object tasks, enabling the model to extract key small-object features more effectively. A detailed comparison is presented in the ablation experiment section.

2.3.2. LSKA-Enhanced Backbone

In the UAV aerial images, the area occupied by insulators is relatively small. The default 3 × 3 convolutional kernels adopted by the YOLOv8 backbone network are limited by the receptive field, making it difficult to capture key contextual information such as the position, arrangement pattern, and orientation of insulators in complex backgrounds, which restricts the model’s perception capability. While large convolutional kernels (such as 11 × 11 or 31 × 31) can expand the receptive field and incorporate richer features, they also introduce substantial computational costs.
To reconcile receptive field expansion with computational efficiency, this paper introduces the lightweight separable kernel attention LSKA [32], an improved version of LKA [33], as shown in Figure 6. Traditional LKA directly uses large 2D deep convolution for feature extraction. Although it can expand the receptive field, the computational complexity increases quadratically (O ( k 2 )) with kernel size. In contrast, LSKA decomposes it into two cascaded one-dimensional separable convolution kernels and incorporates dilated convolution for global contextual modeling. Utilizing 1 × k and k × 1 kernels, LSKA effectively reduces the overall computational complexity from O ( k 2 ) to O (k). In practical deployment, as further elaborated in the ablation experiment section, integrating the LSKA module increases the parameter count from 11.1 M to 18.8 M, with only minor variations across different kernel sizes. This aligns well with the theoretical expectation of linear growth in complexity with respect to kernel size.
In addition, LSKA possesses both spatial modeling capabilities and channel perception capabilities. Specifically, in the spatial dimension, LSKA employs a series of 1 × k and k × 1 separable convolution to extract structural features such as arrangement patterns and edge orientations from both the transverse and longitudinal directions. In the channel dimension, each channel has an independent attention branch, and LSKA generates attention maps through channel-by-channel modeling to emphasize informative features while ignoring redundant background. For the situation where insulators are prone to occlusion or deformation in long-distance aerial imaging, LSKA leverages its contextual and perceptual capabilities to reliably recognize targets using structural and contextual cues.
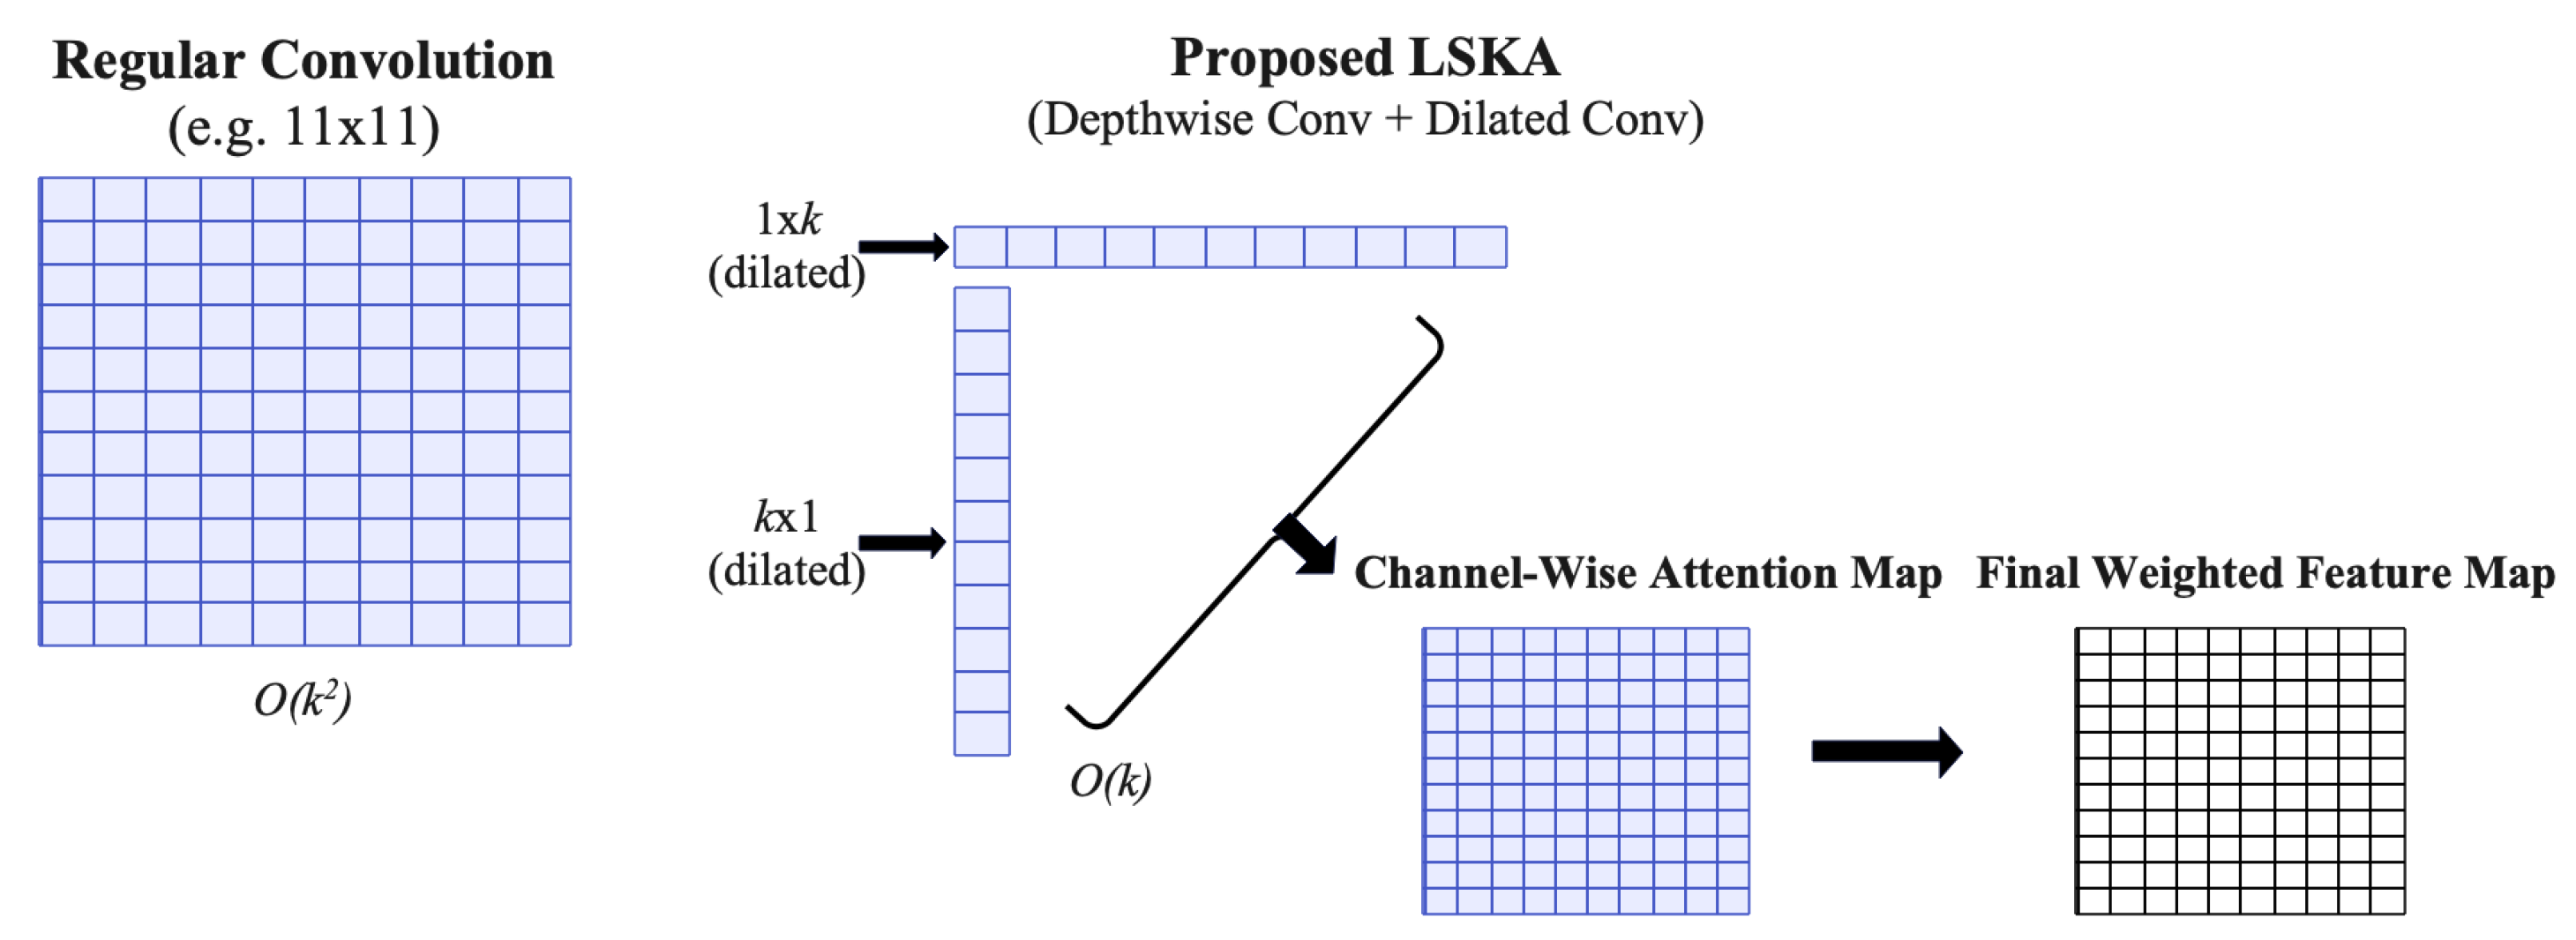
To provide a clearer understanding of the proposed LSKA mechanism, we visualize its computation process in Figure 7, which compares it with the traditional convolution. As shown on the left part of the figure, traditional convolution extracts spatial features directly using a large 2D kernel with a computational complexity of O ( k 2 ). In contrast, the proposed LSKA module, as shown in the right part of the figure, first applies two depthwise dilated convolutions with 1 × k and k × 1 kernels to separately capture horizontal and vertical contextual information with reduced complexity O (k). These features are fused to subsequently form a channel-wise attention map, which is finally used to weight the original features through element-wise computation. This process significantly enhances the model’s ability to model long-range dependencies while remaining computationally efficient.
Mathematically, the final computation is expressed in Equations (1)–(3): let F C denote the input feature map of the C-th channel; W C ( 2 d 1 ) × 1 and W C 1 × ( 2 d 1 ) represent the horizontal and vertical 1D convolution kernels with dilation rate d; d. Z C denotes the intermidiate feature map after one-dimensional convolution, integrating the context information in both horizontal and vertical directions; W 1 × 1 corresponds to the 1 × 1 convolution kernel in channel attention, which is used to generate the channel-wise attention map; A C represents the attention map for the C-th channel; and F ¯ C denotes the final output feature map for the C-th channel, incorporating channel-wise adaptive attention.
Z C = W ( 2 d 1 ) × 1 C W 1 × ( 2 d 1 ) C F C
A C = W 1 × 1 Z C
F ¯ C = A C F C
We integrate the LSKA module immediately before the SPPF block in the backbone. The modified architecture is shown in Figure 4. Layers 8–9 (C2f and SPPF) are critical for feature extraction and fusion. Although the final C2f layer has already captured rich semantic information, its limited receptive field restricts the ability to capture long-distance spatial structure features. Inserting LSKA at this stage can enlarge the receptive field and enhance directional and channel perception modeling, and especially improve the detection accuracy when the target boundary is blurred or obstructed. SPPF serves as a lightweight pyramid pooling structure that integrates multi-scale spatial features. With the input features possessing stronger directional and contextual perception, SPPF performs more efficient multi-scale aggregation.
The relevant experimental results are presented and analyzed in detail in the ablation experiment section, and the performance of the LSKA module under different depth convolution kernel scales is demonstrated.

2.3.3. SIoU-Based Localization Loss

The loss function plays a critical role in determining both the regression accuracy and convergence efficiency, as it directly guides the direction of error propagation during training. YOLOv8’s total loss consists of three components: classification loss, objectness loss, and localization loss. The overall loss is a weighted sum of these three terms. The default localization loss is CIoU, as shown in Equation (4). The first term represents the traditional IoU loss, which measures the overlap error between the predicted and ground truth bounding boxes. The second term calculates the Euclidean distance between the centers of the two boxes, where c represents the diagonal length of their minimum enclosing rectangle, and ρ 2 ( b , b gt ) denotes the Euclidean distance between the centers. The third term is the aspect ratio consistency loss, where α is a hyperparameter, and v penalizes deviations in the width and height ratio.
L CIoU = ( 1 IoU ) + ρ 2 ( b , b gt ) c 2 + α ν
CIoU only considers three aspects, overlap area, center-point distance, and aspect ratio consistency, while ignoring the angular relationship between the predicted and ground truth boxes. In cases where two boxes have close centers and similar proportions but significant directional deviation, CIoU fails to capture such orientation errors. This is particularly critical in our UAV imaging scenarios with extremely small targets, complex background, and tilted arrangements.
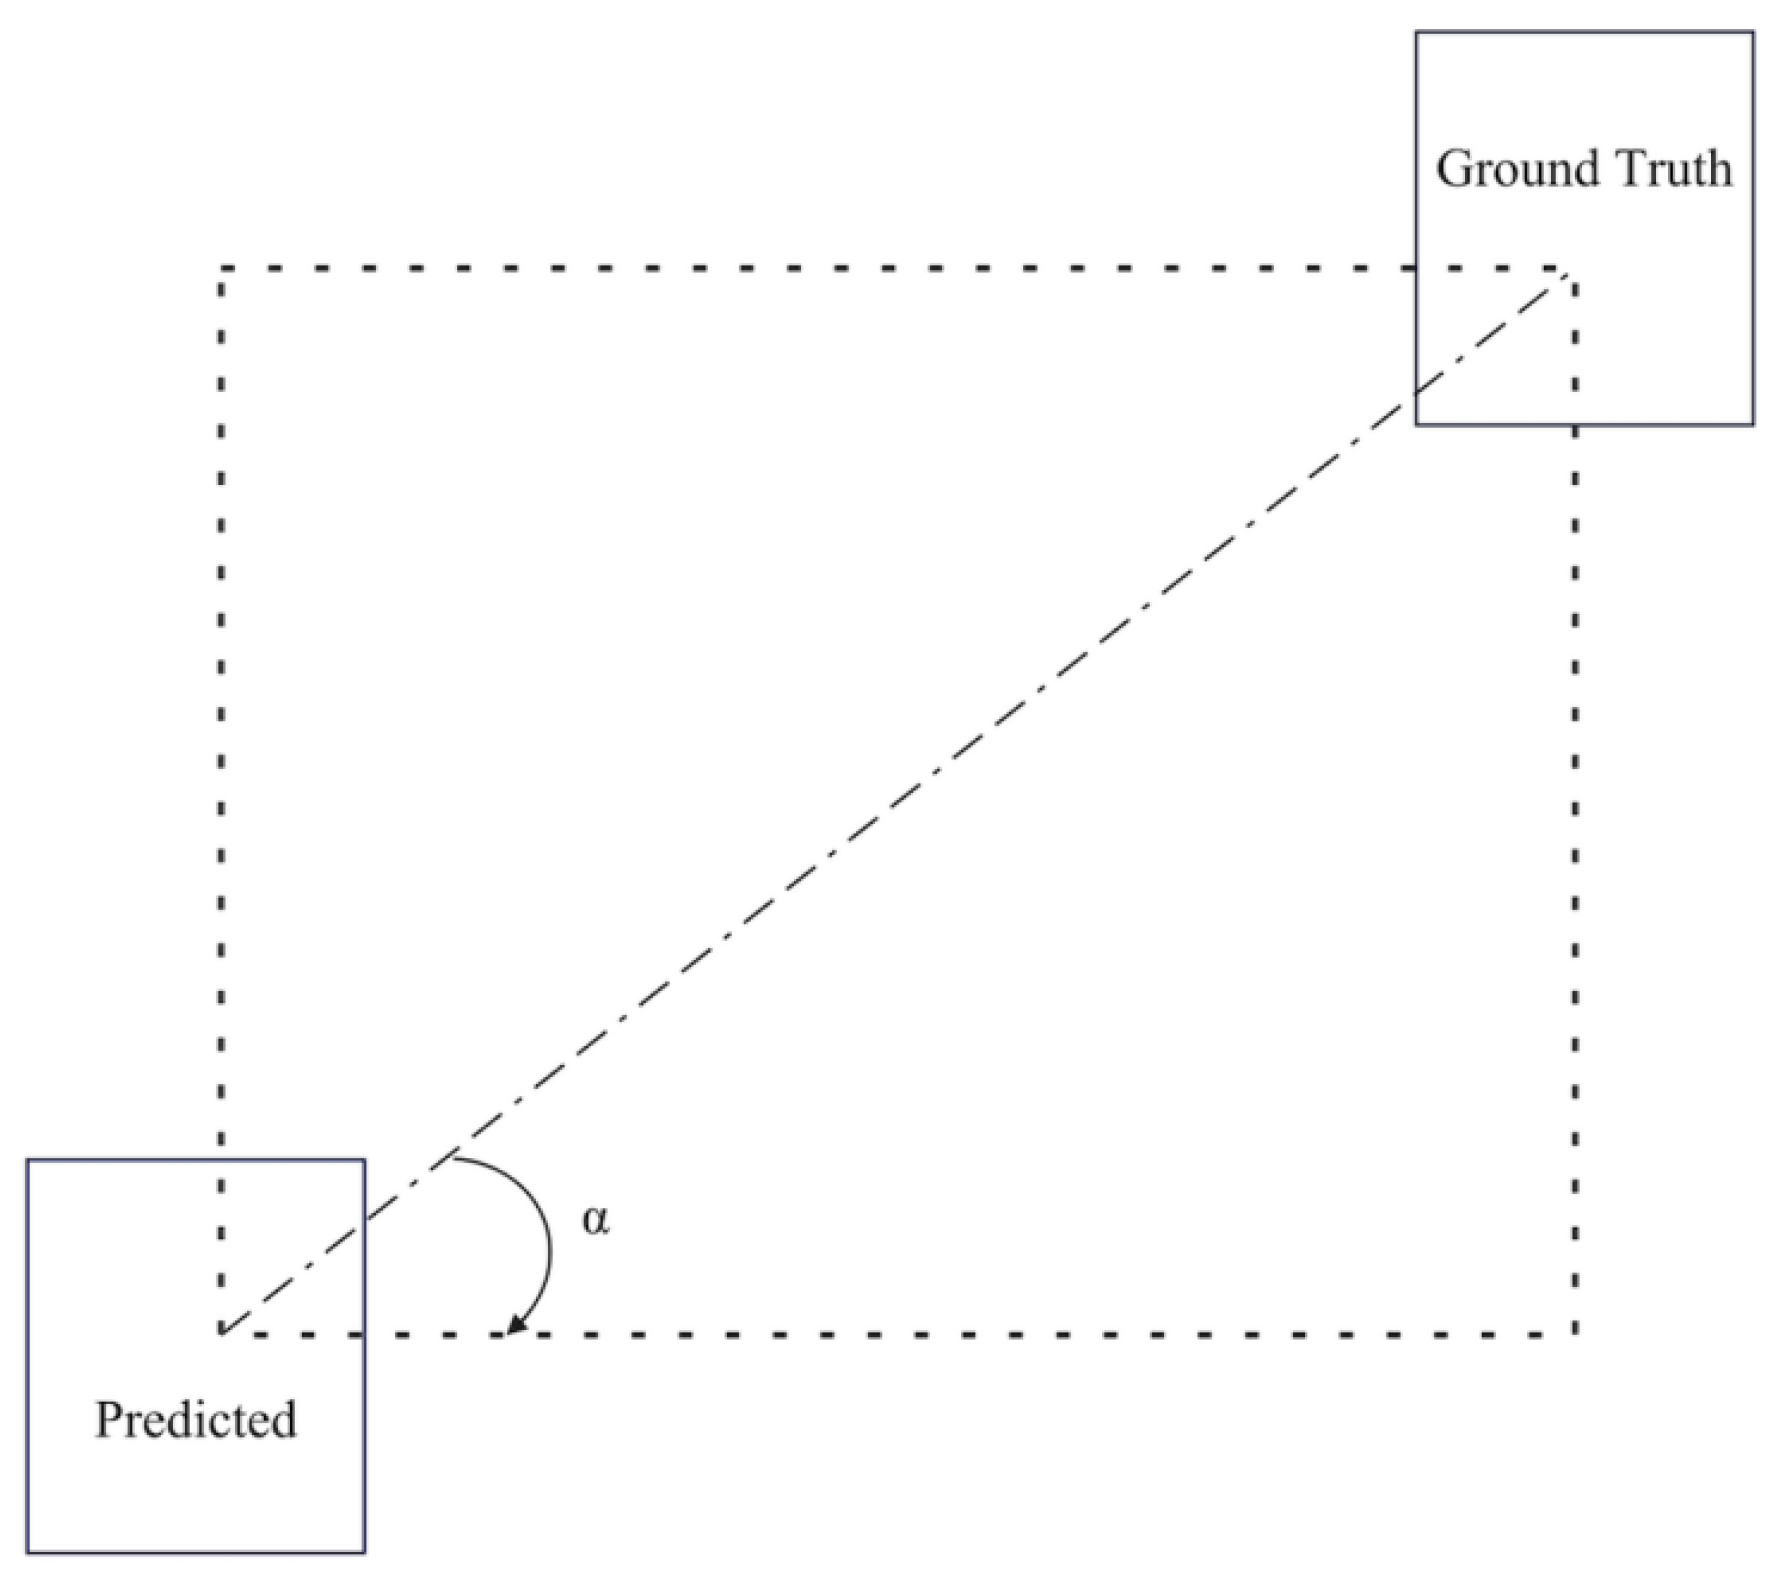
Therefore, this study adopts SIoU [34] as the localization loss function, which further decomposes the localization error into angle cost, distance cost, shape cost, and IoU overlap loss, thereby achieving more refined geometric orientation modeling. As shown in Figure 8, SIoU quantifies angular deviation by measuring the angle α between the connecting line of the predicted and ground truth box centers and the principal axis, intuitively reflecting the skew of the predicted box relative to the target. The angle cost is defined in Equations (5) and (6), where c y 1 and c y 2 denote the vertical coordinates of the predicted and ground truth box centers, and c x 1 and c x 2 represent their horizontal coordinates. π 4 indicates the diagonal direction between the X and Y axes. A smaller value of α π 4 suggests the connecting line is closer to the principal axis. During the training process, the angle cost guides the predicted box to align with the nearest principal axis, while imposing larger penalties for greater deviations from the axes and thereby accelerating convergence.
α = arcsin c y 2 c y 1 c x 2 c x 1 2 + c y 2 c y 1 2 + ϵ
angle _ cost = 1 2 · sin 2 α π 4
The distance cost is defined in Equations (7)–(9), where c w and c h denote the width and height of the two bounding boxes. δ represents the final distance cost, which redefines the error weighting method based on angle optimization: the greater the angle deviation, the higher the proportion of distance cost. This mechanism is particularly effective in early training stages when the predicted and ground truth boxes have little or no overlap.
ρ x = c x 2 c x 1 c w + ϵ 2
ρ y = c y 2 c y 1 c h + ϵ 2
δ = 1 e 2 · angle _ cost · ρ x + 1 e 2 · angle _ cost · ρ y
The shape cost is defined in Equations (10)–(12), which constrains the consistency of width and height between the predicted and ground truth boxes. w 1 , h 1 , w 2 , and h 2 denote the width and height of the predicted and ground truth boxes. The exponent θ is typically set to 4.
w w = | w 1 w 2 | max ( w 1 , w 2 )
w h = | h 1 h 2 | max ( h 1 , h 2 )
shape _ cost = 1 e w w θ + 1 e w h θ
The final SIoU loss is defined in Equation (13). Through refined geometric modeling, it rapidly reduces directional deviation between predicted and ground truth boxes in the early training stage, provides clearer gradient propagation, and thus accelerates convergence. Compared to CIoU, SIoU maintains effective gradients even at low IoU values, enabling meaningful parameter updates when there is little to no overlap and thus mitigating optimization stagnation caused by vanishing gradients, which is a critical advantage under large initial errors. With precise angle and distance modeling, SIoU allows for detecting small, variably oriented targets in complex backgrounds. Since SIoU only modifies the regression loss function and affects the optimization direction during training, it does not introduce any additional parameters to the model. More detailed experimental results will be presented in the ablation study.
SIoU _ Loss = 1 IoU + 0.5 · δ + shape _ cost
Notably, the combination of SIoU and the LSKA module contributes to more efficient training outcomes. LSKA expands the receptive field with low computational cost to enhance contextual modeling, and employs dynamic channel weighting to improve semantic perception, thereby providing more directional context semantic features for subsequent localization regression. On the other hand, SIoU introduces refined geometric orientation modeling during regression, optimizing the position, orientation, and size of prediction boxes through angle, distance, and shape constraints. It offers more guided convergence paths during backpropagation. The combination of the two can further improve the stability and accuracy of small-target detection in complex railway scenarios.

3. Results

3.1. Experimental Environment

To verify the effectiveness of our model, we conducted training and testing under the following experimental environment and hyperparameter settings, as summarized in Table 2. All experiments were conducted on our complexRailway dataset, and each was repeated three times with the average result reported.

3.2. Evaluation Metrics

This study comprehensively assesses the model performance in terms of positioning accuracy, detection efficiency, and deployable friendliness. Accuracy is measured by mAP@0.5 and mAP@0.5–0.95; efficiency by FPS and per-image inference time; and deployment friendliness by parameter count.
Precision describes the proportion of correctly identified insulators among all detection results; recall represents the proportion of successfully detected insulators among all actual insulators. As shown in Equations (14) and (15), TP denotes the number of samples correctly identified as insulators, and FP denotes the number of samples incorrectly identified as insulators.
Precision = TP TP + FP × 100 %
Recall = TP TP + FN × 100 %
As shown in Equation (16), average precision (AP) comprehensively reflects the performance of precision and recall, defined as the area under the precision–recall (P–R) curve. mAP@0.5 represents AP across all classes when the IoU threshold is set to 0.5. In this study, since only insulators are considered, there is only one class. mAP@0.5–0.95 denotes the mean AP under multiple IoU thresholds ranging from 0.5 to 0.95 with a step size of 0.05.
AP = 0 1 P ( r ) d r

3.3. Ablation Experiments

We conducted ablation studies on the three improved modules to independently evaluate their contributions to localization accuracy, convergence speed, and feature representation. Finally, we validated their combined effect on the overall performance improvement.
Notably, all values in this section are reported as the mean ± standard deviation over three independent runs to account for randomness in evaluation. As most results demonstrate relatively low variance, our subsequent analysis is based on the mean values.

3.3.1. Evaluation of Detection Head Pruning

To verify the effectiveness of removing the P5 detection head, we conducted comparative experiments. Results are shown in Table 3: the pruned model outperforms the baseline with improvements in both accuracy and deployability: +0.3% mAP@0.5, +0.3% mAP@0.5–0.95, 24.6% higher FPS, and 37.8% fewer parameters. This indicates that eliminating the redundant large-object branch reduces not only computation but also mismatches in feature representation.
We further compared other pruning strategies, including removing P3, P4, and both P4 and P5. Results demonstrate that removing P3 or P4 leads to reduced accuracy, despite improvements in inference speed and deployment efficiency, making both strategies unsuitable for this accuracy-sensitive task. Removing both P4 and P5 achieved the fastest inference and lowest computational cost, but still with a drop in accuracy, indicating that excessive pruning weakens the model’s ability to capture medium-scale features.
For this small-object-dominated insulator detection task, removing P5 proves to be the optimal pruning strategy, significantly reducing computation load while maintaining or even improving accuracy.

3.3.2. Evaluation of LSKA with Various Kernel Scales

Next, we explored the influence of the LSKA deep convolution kernel scale on the detection performance. k = 7, k = 11, and k = 23 were, respectively, taken, and the results are shown in Table 4. These three kernel sizes were selected to represent typical small, medium, and large scales, corresponding to local features, mid-range context, and global information extraction. As the kernel size increases, the parameter count changes little, which is in line with our expectations. Because LSKA adopts a combination of two one-dimensional separable convolution, the computational complexity only increases with (k).
For accuracy, when k = 7, mAP@0.5 improves from 0.928 to 0.936 and mAP@0.5–0.95 from 0.620 to 0.642 over the baseline. Increasing k to 11 further raises mAP@0.5 to 0.938 and mAP@0.5–0.95 to 0.644, showing that a moderate kernel size expands the receptive field and improves sensitivity to orientation and background variations. However, at k = 23, mAP@0.5 and mAP@0.5–0.95 decline to 0.937 and 0.642, respectively, suggesting that excessively large kernels introduce redundancy and instead weaken feature extraction.
Overall, k = 11 provides the best trade-off between receptive field expansion and redundancy suppression, effectively leveraging long-range dependencies in aerial imagery while avoiding the dilution of small-target features. Thus, we set the convolution kernel size to 11.

3.3.3. Evaluation of Various Loss Functions

We further evaluated different loss functions for small-object localization, including SIoU, CIoU, GIoU, and MDPIoU. As shown in Table 5, replacing CIoU with SIoU improves mAP@0.5 from 0.928 to 0.934 and mAP@0.5–0.95 from 0.620 to 0.628, without affecting model size or speed. Unlike CIoU, which only considers overlap, center distance, and aspect ratio, SIoU incorporates angle modeling, direction-weighted distance cost, and shape consistency penalties, enabling the faster correction of bounding-box orientation and thus improving detection accuracy for small targets.
Other loss functions performed worse than SIoU. MDPIoU [35] raises mAP@0.5 to 0.933 and mAP@0.5–0.9 to 0.622. While adding a corner point Euclidean distance penalty allows faster box adjustment, it emphasizes size alignment and lacks angle modeling, limiting its effectiveness for tilted or densely arranged insulators, especially at high IoU levels. GIoU [36] displays even a reduced accuracy, likely because it only focuses on non-overlapping gradient propagation but neglects angle and shape modeling, resulting in weaker localization in complex backgrounds.

3.3.4. Ablation Experiments Results

After independently evaluating the effectiveness of each improvement module, we conducted comparative experiments to assess the combined effect of the three modules. The results are shown in Table 6.
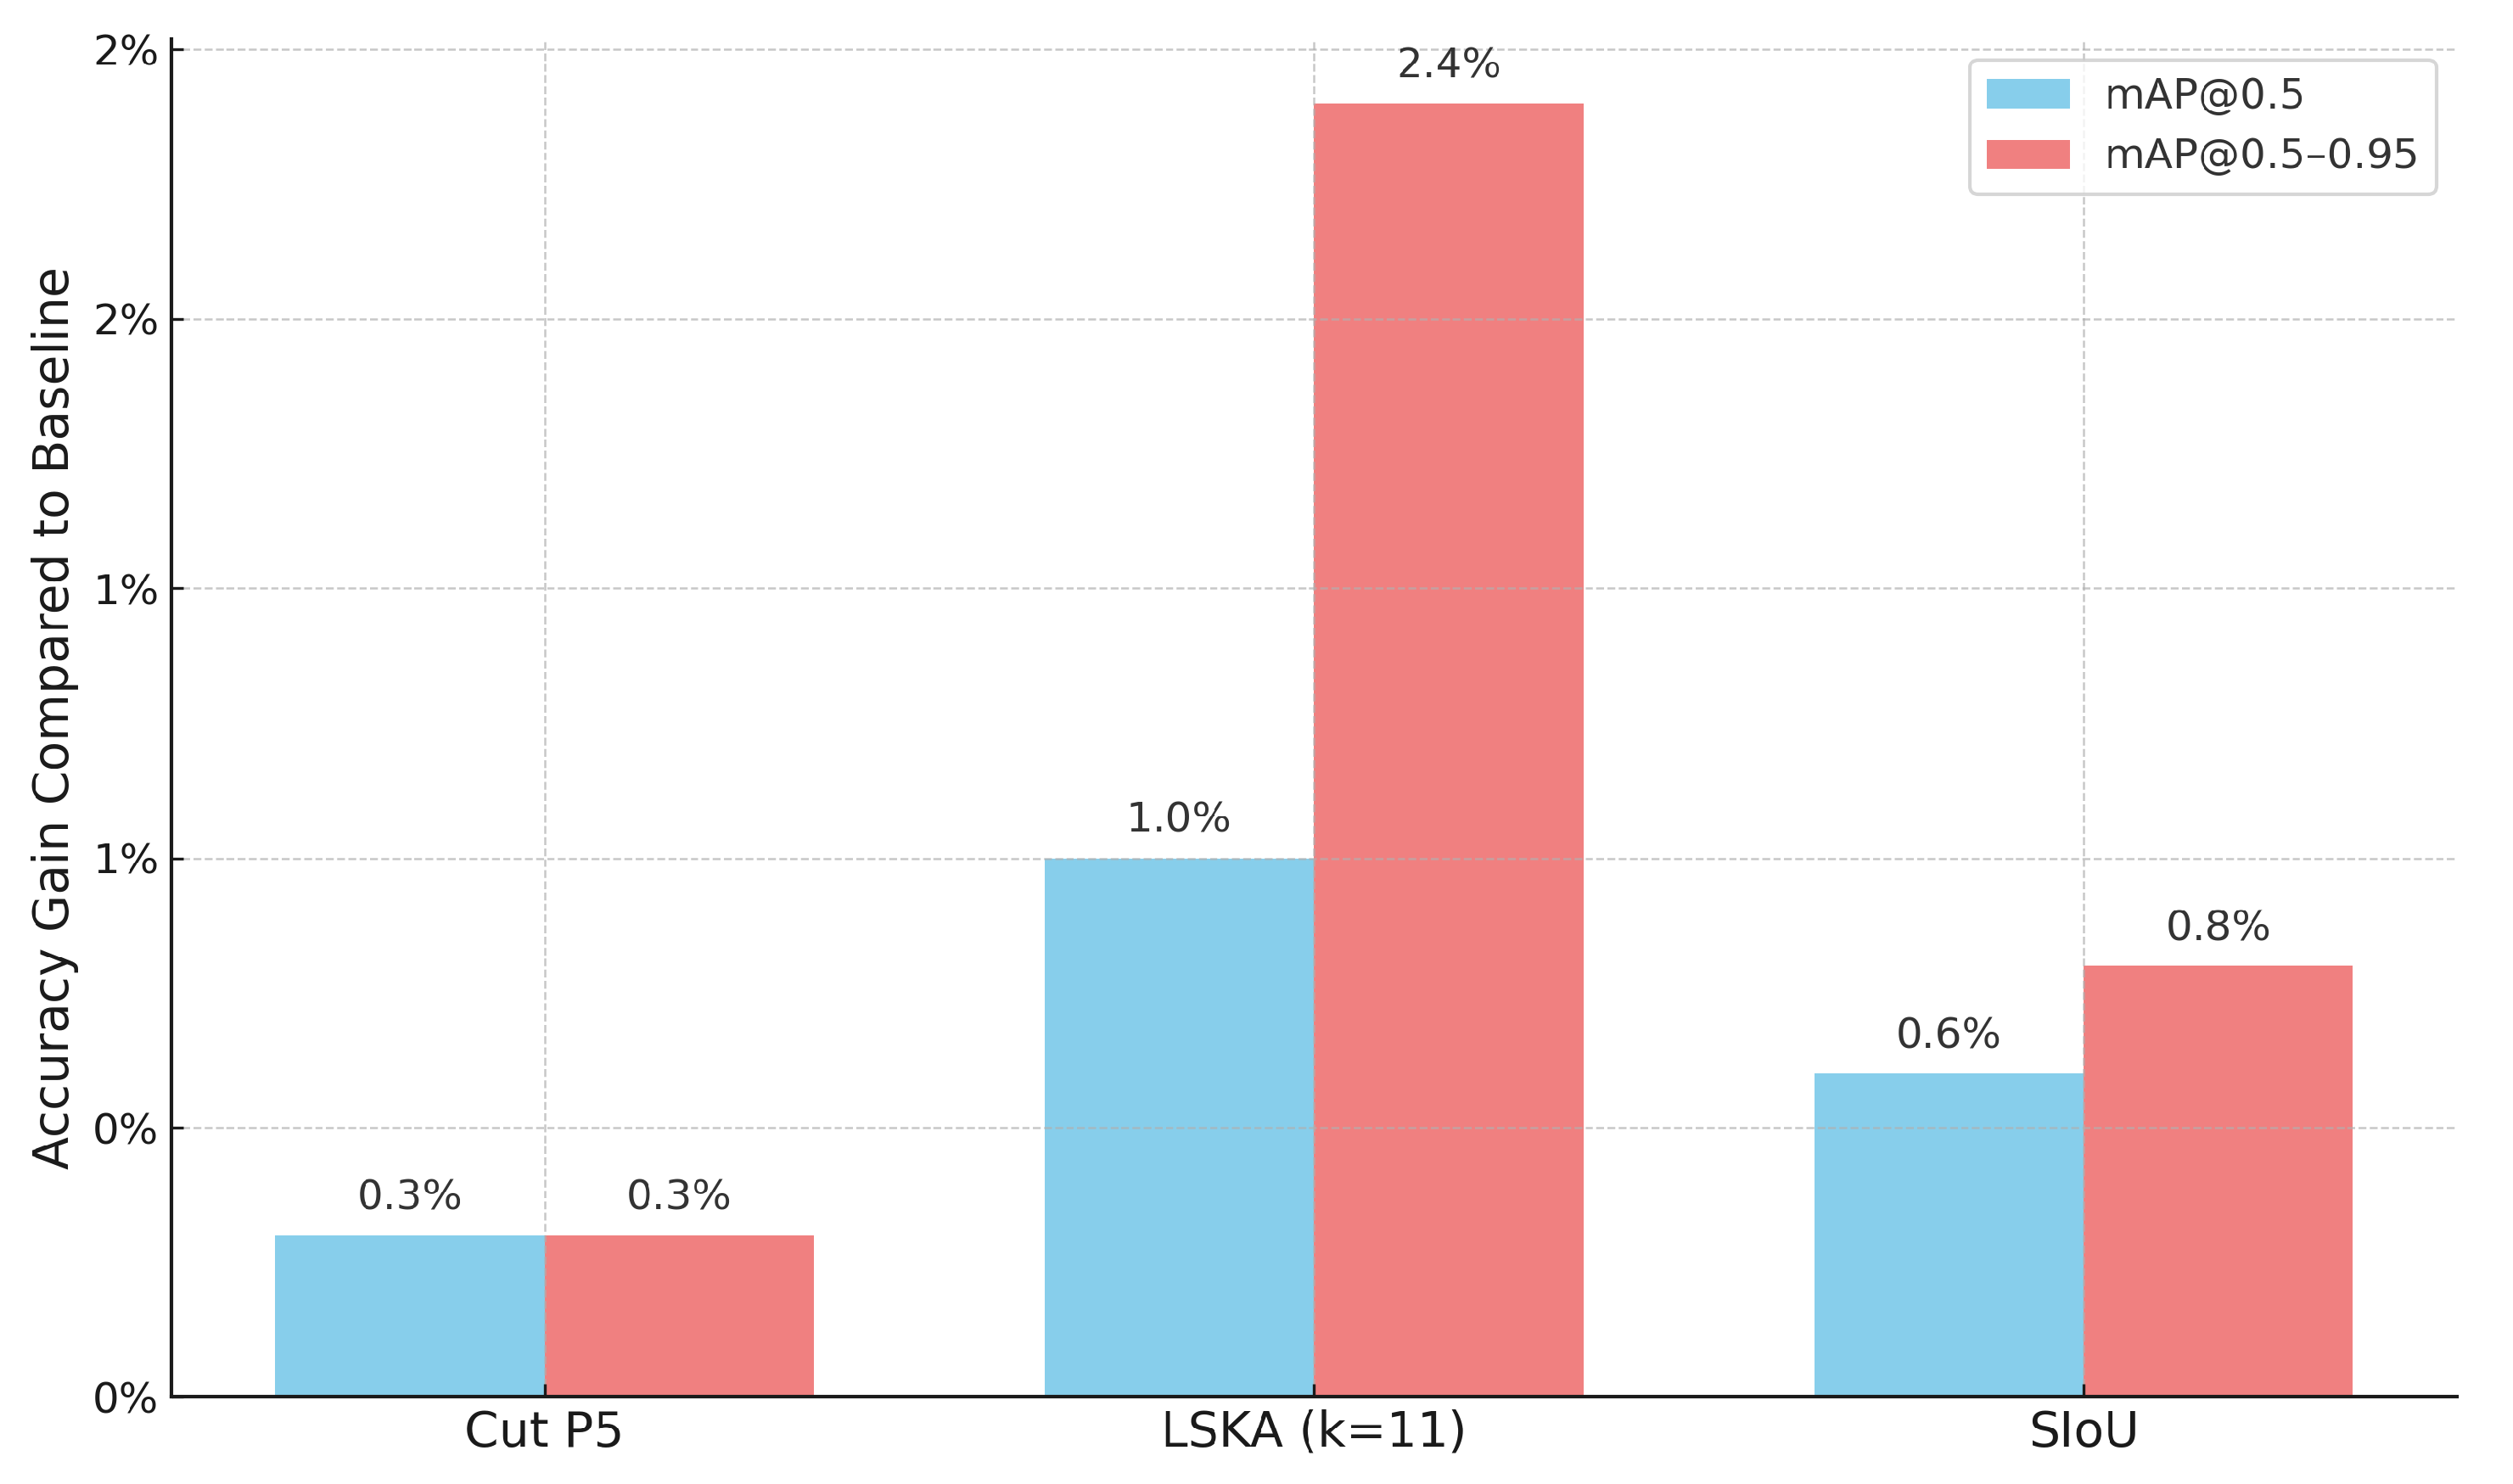
The first row shows the performance of the baseline model YOLOv8s. When the P5 detection head is removed, mAP@0.5 and mAP@0.5–0.95 are increased by 0.3%, and the parameter count is decreased from 11.1 M to 6.9 M, indicating higher lightweightness and deployability. As shown in row 5, when the LSKA with depthwise kernel k = 11 is inserted before the SPPF module, mAP@0.5 is increased by 1% and mAP@0.5–0.95 is increased by 2.4%. Although the parameter count is increased from 11.1 M to 18.8 M, yet it remains deployment-friendly, retaining the lightweight advantage while bringing accuracy improvements. Finally, when the SIoU loss function is incorporated, as shown in row 6, mAP@0.5 is further increased by 0.6% and mAP@0.5–0.95 is increased by 0.8%. Replacing the loss function does not affect the parameter count or inference speed.
The individual accuracy gains of the three proposed enhancements over the baseline model are shown in Figure 9. Notably, among these three proposed modifications, the integration of the LSKA module leads to the most significant accuracy improvement, which is a 1% increase in mAP@0.5 and 2.4% increase in mAP@0.5–0.95. This confirms the importance of contextual and spatial feature enhancement for insulator detection in dense and noisy railway scenarios.
Combining these three improvements, C5LS achieves optimal performance with 94.7% mAP@0.5 and 65.5% mAP@0.5–0.95, demonstrating significant advantages in detection accuracy for small targets and complex backgrounds under railway scenarios.
To evaluate the generalization capability of C5LS, we further conducted identical ablation experiments on public IDID [23], as shown in Table 7. Removing the P5 detection head led to a significant FPS increase from 117.61 to 138.06, along with a slight improvement of 0.2% in mAP@0.5. Integrating the LSKA module resulted in a 0.8% gain in mAP@0.5 and a 0.3% gain in mAP@0.5–0.95. Adding the SIoU loss further improved the accuracy by 0.6% in mAP@0.5 and 0.2% in mAP@0.5–0.95. Although the improvements on mAP@0.5–0.95 on IDID are smaller than those on complexRailway, this is reasonable given that IDID primarily contains medium to large insulators in simple backgrounds, with few long-distance imaging or occluded targets. The fact that our model still achieves steady gains without additional fine-tuning on IDID demonstrates the effectiveness and generalization ability of the proposed enhancements.

3.3.5. Comparison over Mainstream Models

Finally, Table 8 presents the comparison results with mainstream models. It can be observed that our model outperforms YOLOv8s by 1.9% in mAP@0.5 and 3.5% in mAP@0.5–0.95, while also achieving higher accuracy than other mainstream models. Although FPS decreases from 131.6 to 104, the inference time remains within 10 ms. This minor loss in real-time performance is an acceptable trade-off for the accuracy-sensitive application scenarios addressed in this study.

3.3.6. Visual Analysis of C5LS

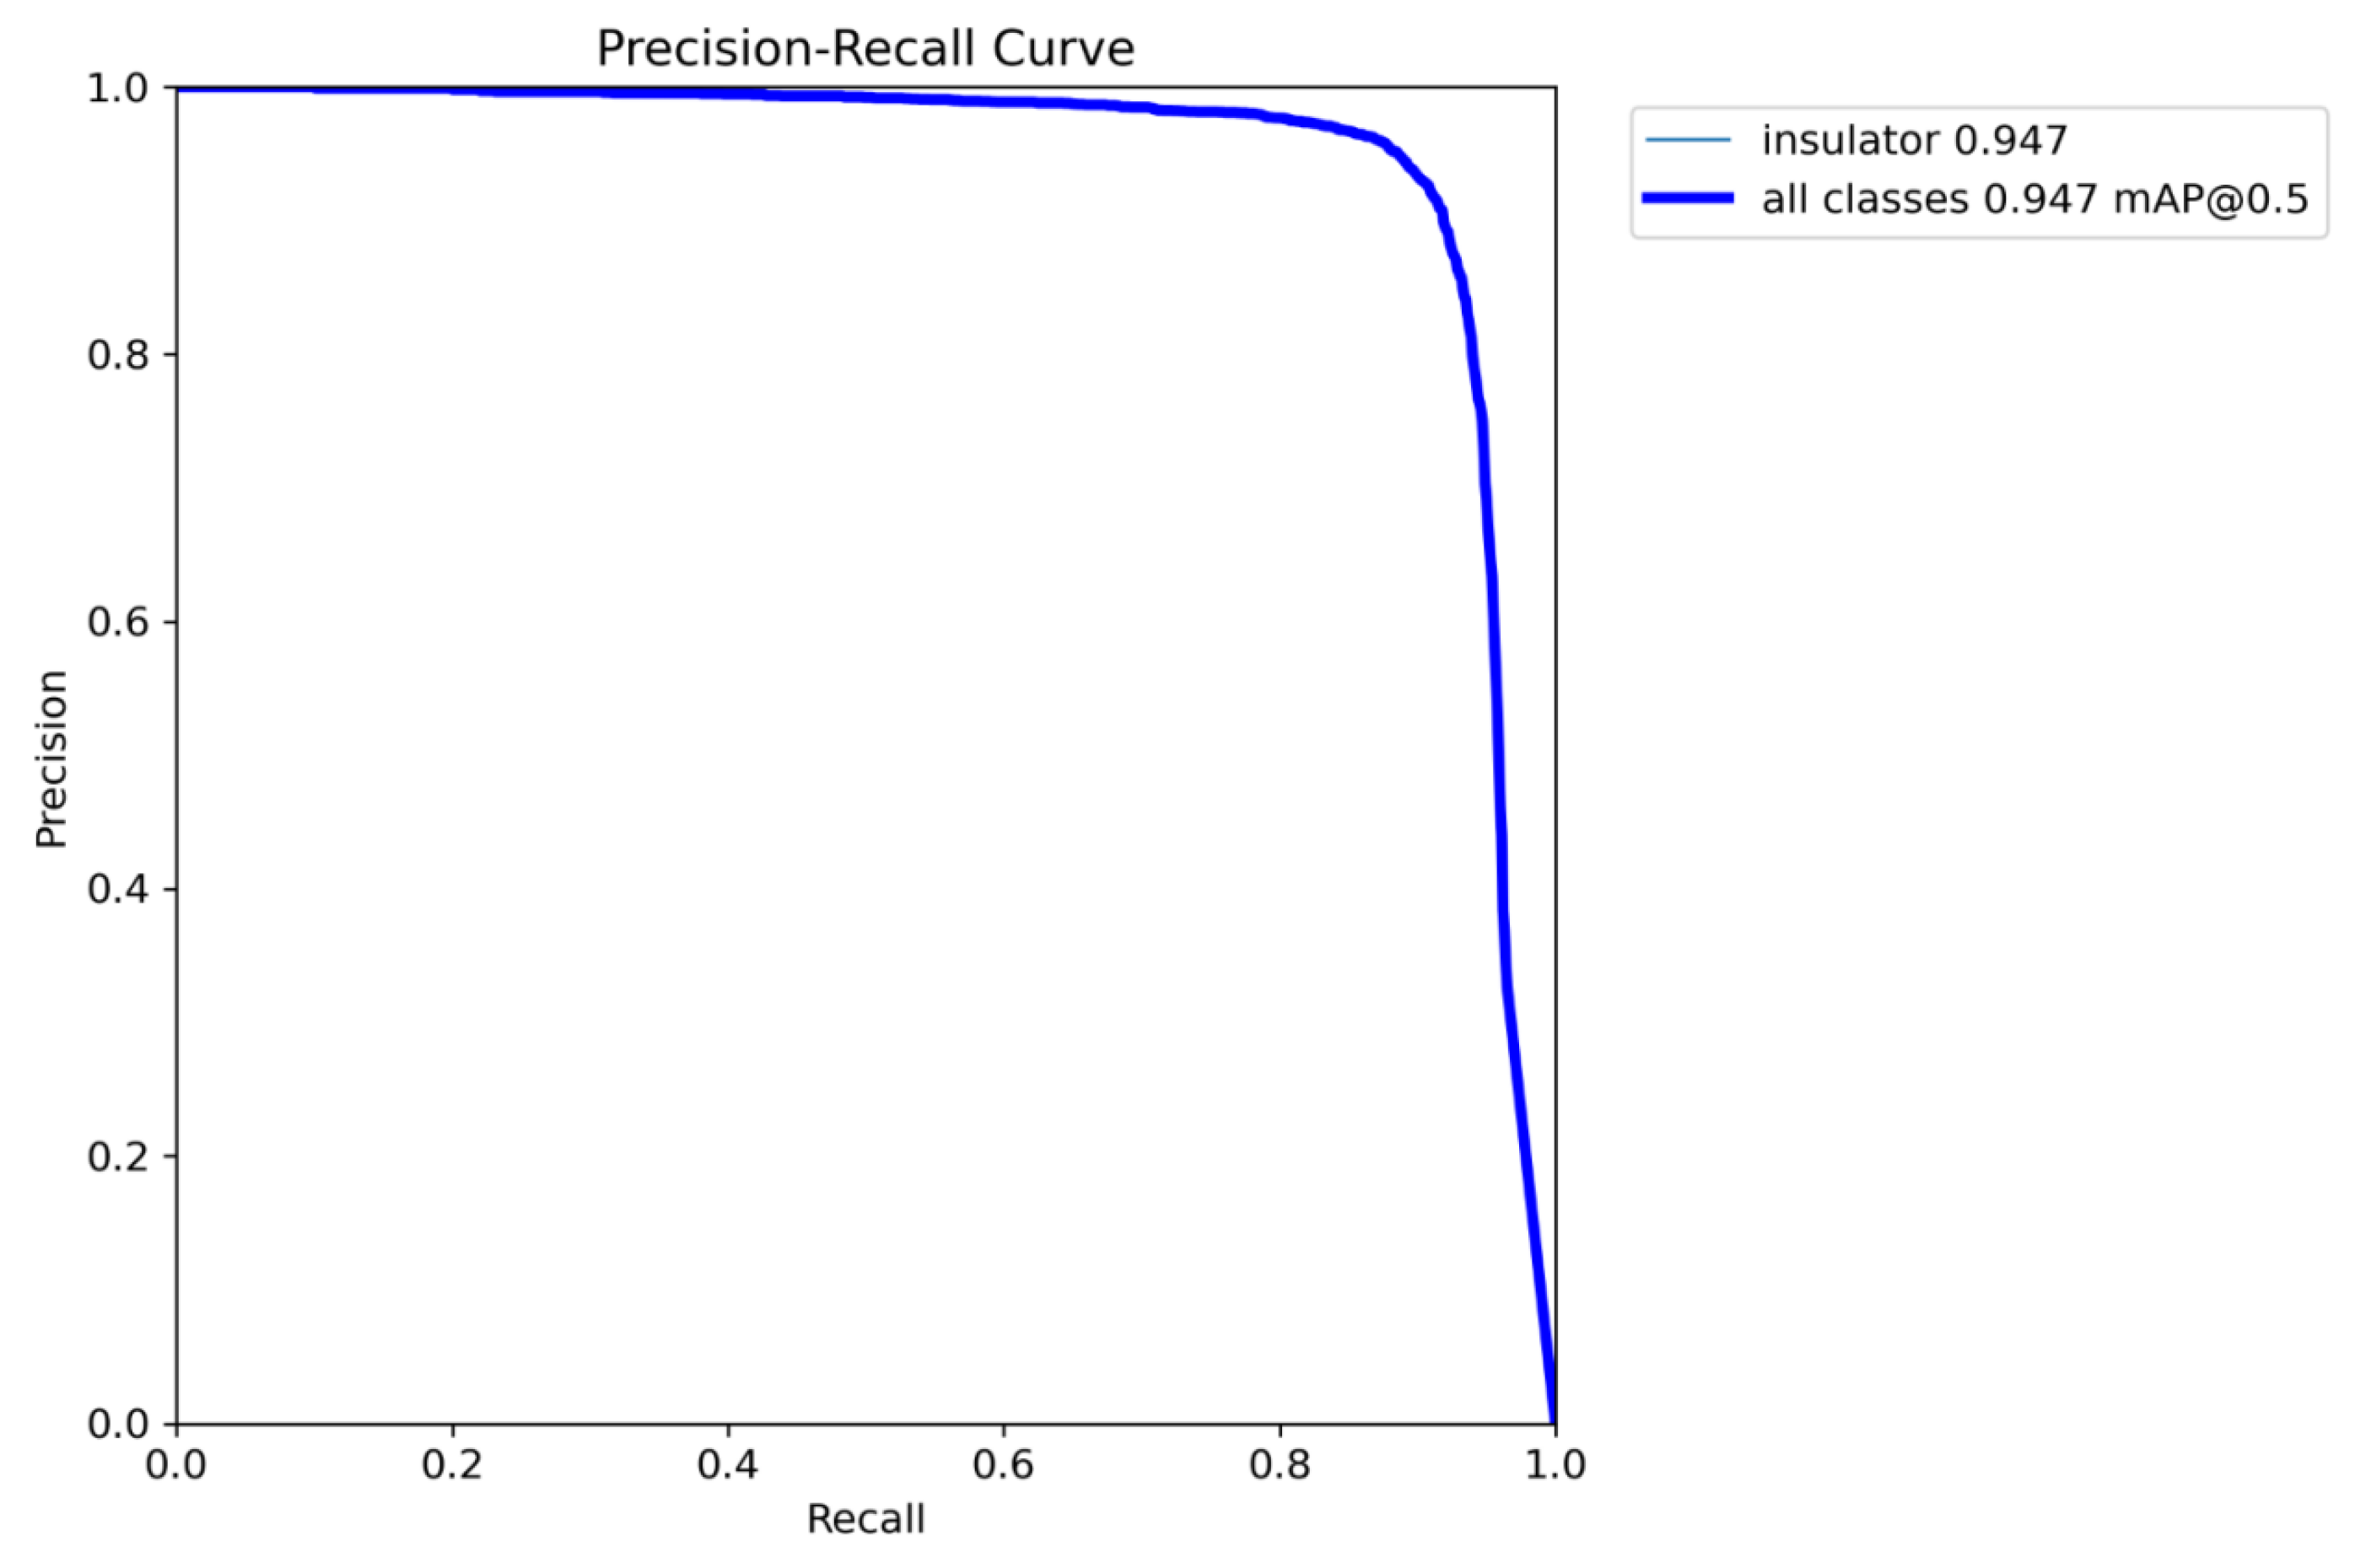
Figure 10 shows the P–R curve of C5LS, where the horizontal axis denotes recall, and the vertical axis denotes precision at IoU = 0.5. The curve is close to the upper-right corner, indicating that the model achieves high recall while maintaining very high precision, demonstrating excellent overall detection performance.
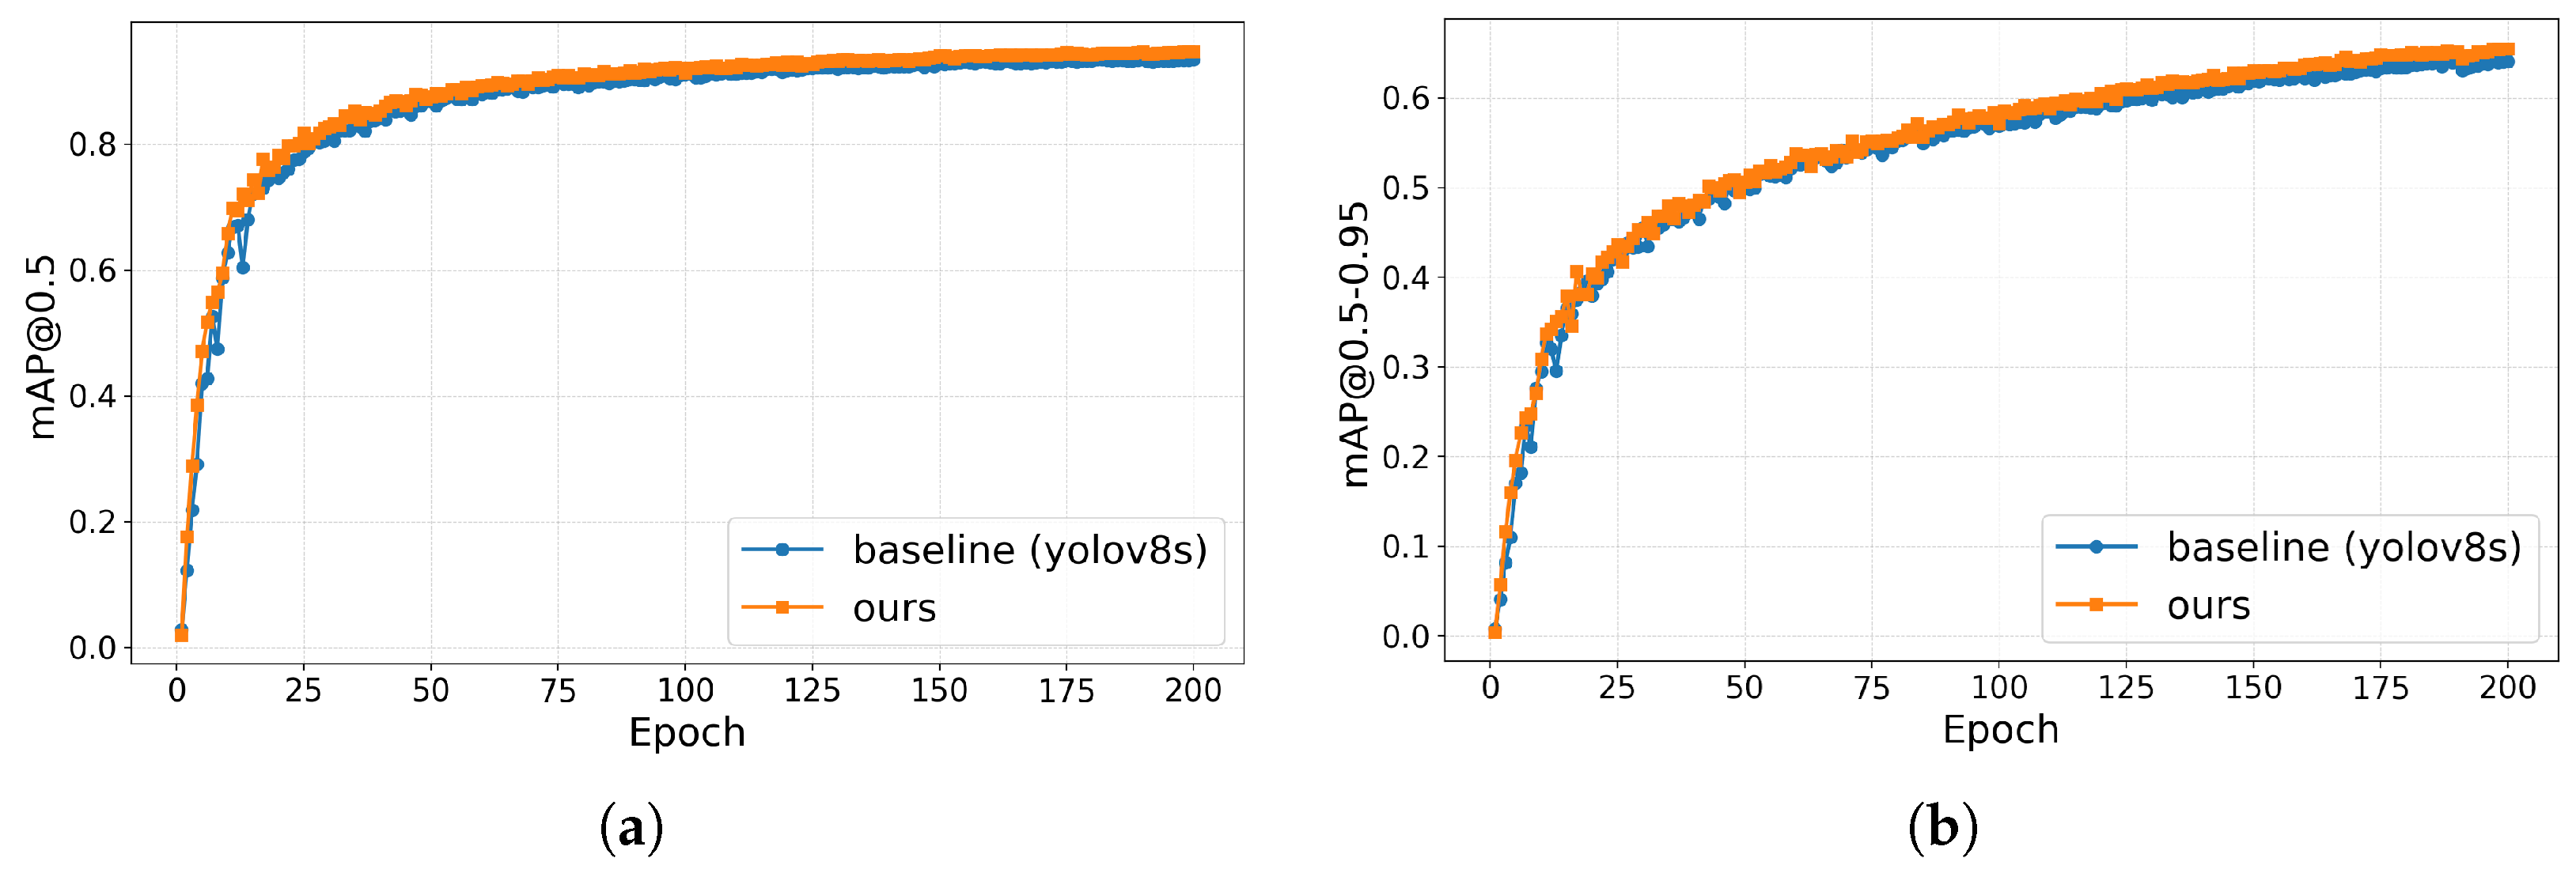
To illustrate the performance gain of C5LS over the baseline, Figure 11 show the trends of mAP@0.5 and mAP@0.5–0.95 over 200 epochs. The improved model converges faster and more smoothly in the early stages, and consistently outperforms the baseline throughout training, highlighting advantages in both convergence stability and detection accuracy.
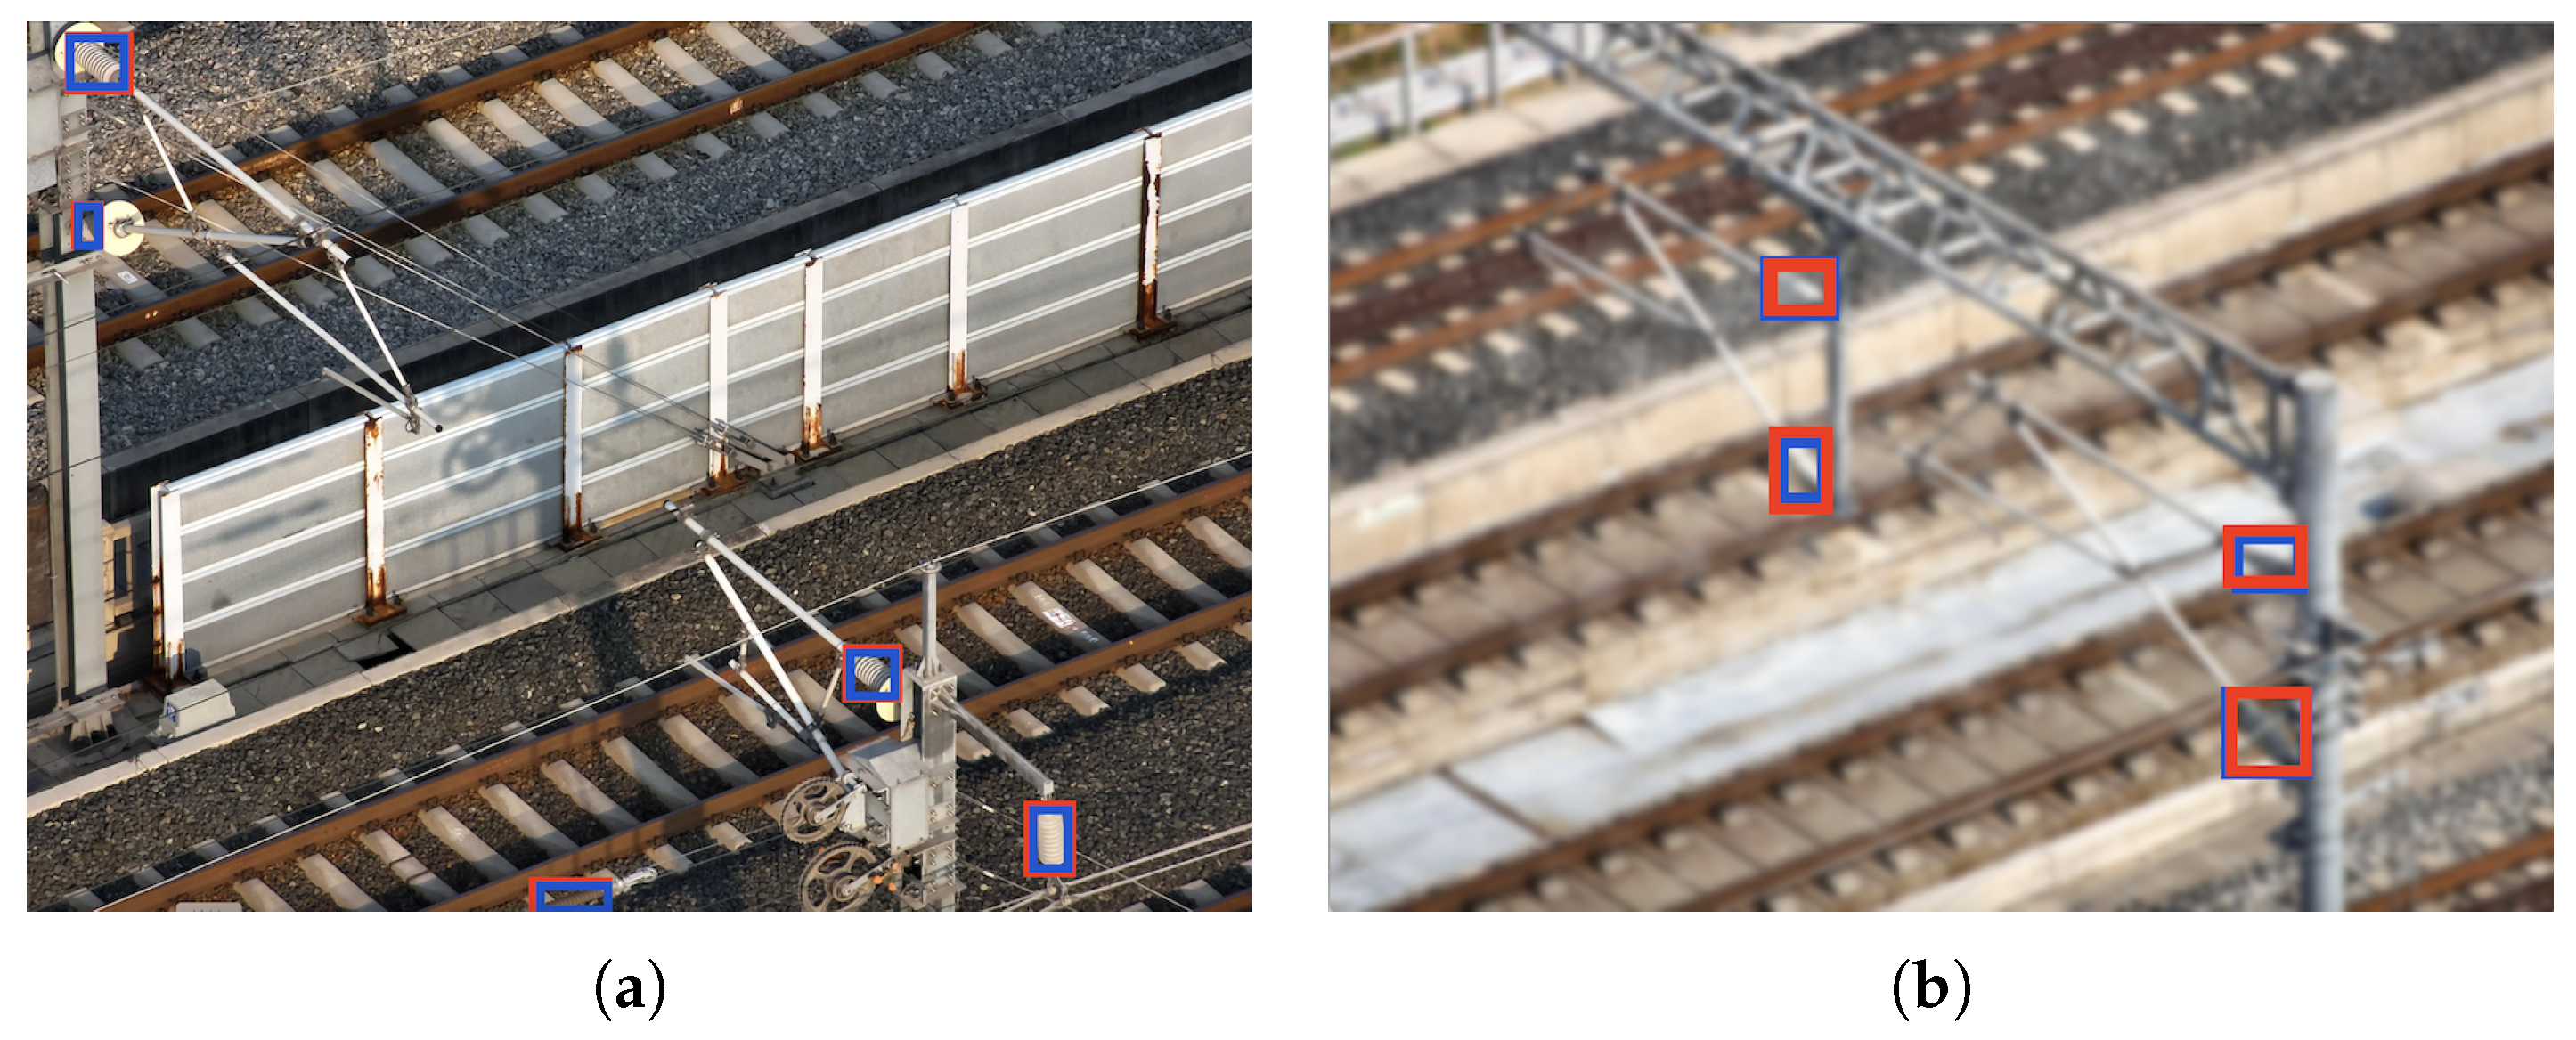
The visualization results of the C5LS model are shown in Figure 12, Figure 13 and Figure 14, demonstrating its robustness in insulator detection across common but challenging railway inspection scenarios. In these figures, red bounding boxes display the predicted results, while blue boxes represent the ground truth annotations.
Firstly, Figure 12 demonstrates the model’s robustness under severe background interference scenarios. In these scenarios, some insulators are partially occluded by power lines and surrounded by interfering textures similar to rails and sleepers. Nevertheless, the improved model can still accurately locate each insulator target without any missed detections or false detections. This capability is mainly attributed to the LSKA module, which strengthens feature extraction by concentrating on critical spatial patterns, thereby effectively addressing challenges such as occlusion and texture confusion.
Secondly, to assess the C5LS’s insulator detection performance under adverse weather, we tested images simulating rain, fog, and their combination, as shown in Figure 13. These conditions blur images and reduce contrast between insulators and background, making detection more difficult. Even so, the improved model accurately localizes insulators, demonstrating strong robustness in complex weather conditions. These results validate that the combined LSKA module and SIoU loss effectively address geometric distortions, thereby ensuring stable detection in low-visibility conditions.
Finally, and most importantly, small targets along railway lines often exhibit varied orientations, small sizes, and dense distributions. By leveraging precise angular modeling in conjunction with enhanced feature extraction to capture these dense distributions, the improved model remains robust in such scenarios. As shown in Figure 14, insulators are densely distributed, with some closely attached and arranged vertically, horizontally, or obliquely. Despite this complexity, the model accurately detects each insulator, confirming its reliability for detecting densely distributed small targets.
Overall, based on the above experiments, it can be known that the combination of the three strategies significantly improves small-target detection accuracy as well as stability and robustness in complex railway conditions involving dense distributions, occlusion, low light, and adverse weather, meeting the core requirements of high-precision insulator identification.

4. Discussion

This study introduces the C5LS model, an enhanced YOLOv8 variant, to address the challenges of insulator detection in railway environments characterized by densely distributed small targets, background interference, and low-quality imaging. Through three targeted optimizations, including removing the P5 detection branch to improve focus on small and medium objects, incorporating a Large Separable Kernel Attention (LSKA) module to enhance feature extraction, and adopting the SIoU loss function to refine localization, the model achieves significant improvement in detection accuracy and robustness. Experimental results show that C5LS outperforms the baseline by 1.9% in mAP@0.5 and 3.5% in mAP@0.5–0.95, while maintaining high inference speed and a lightweight structure, demonstrating strong robustness and deployability in challenging railway environments.
Compared with existing methods, the innovations of C5LS lie in its enhanced adaptability to complex railway scenarios. Its enhanced design enables accurate insulator localization, laying a solid foundation for subsequent defect recognition and spatial referencing for maintenance.
However, although the model is optimized for typical railway scenarios, the complexity of real-world environments still exceeds the dataset’s coverage, leading to limited robustness in certain extreme conditions, such as highly reflective metallic backgrounds. Moreover, synthetic weather augmentation, such as simulated rain and snow, may lack fidelity, reducing the robustness of the model under real-world adverse conditions. Additionally, while the integration of LSKA improves the detection accuracy, the increased number of parameters may pose challenges for deployment on resource-constrained edge devices. Future work will explore photo-realistic augmentation techniques, such as GANs, to enhance dataset diversity and integrate defect classification following [24] and 3D localization. Model lightweightness will also be optimized to further support intelligent and efficient railway maintenance.
Author Contributions

Conceptualization, X.Z.; methodology, X.Z. and M.X.; software, X.Z.; validation, X.Z.; formal analysis, X.Z.; investigation, X.Z. and M.X.; resources, P.P.; data curation, M.X. and P.P.; writing—original draft preparation, X.Z.; writing—review and editing, M.X.; visualization, X.Z.; supervision, P.P.; project administration, P.P.; funding acquisition, P.P. All authors have read and agreed to the published version of the manuscript.

Funding

This research was funded by the National Natural Science Foundation of China under grant number [U2468202].

Institutional Review Board Statement

Not applicable.

Informed Consent Statement

Not applicable.

Data Availability Statement

The data used in this study are available from the corresponding author upon reasonable request. The datasets were obtained from authorized sources and are approved for academic publication.

Acknowledgments

The authors sincerely thank the National Natural Science Foundation of China for funding. Thanks to all the teachers and students who contributed to this work for their valuable efforts and support. We are also grateful to the reviewers and editors for their constructive comments and suggestions. Furthermore, we acknowledge the China Academy of Railway Sciences for providing the dataset and experimental equipment used in this study.

Conflicts of Interest

The authors declare no conflicts of interest.

References

  1. Guo, Y.H. Research on Intelligent Instrument Solutions in the Context of Railway Intelligent Operation and Maintenance. Smart Rail Transit 2023, 60, 45–50. [Google Scholar] [CrossRef]
  2. Yu, G.W.; Zhang, Z.G.; Zhai, Y.T.; Yin, Y.H.; Sun, W.; Li, D.F.; Yang, S.L.; Jiang, S.Y. Research on Intelligent Operation and Maintenance for Shuohuang Railway Traction Power Supply Equipment. Railw. Transp. Econ. 2023, 45, 88–96. [Google Scholar] [CrossRef]
  3. Hao, K.; Chen, G.; Zhao, L.; Li, Z.; Liu, Y.; Wang, C. An Insulator Defect Detection Model in Aerial Images Based on Multiscale Feature Pyramid Network. IEEE Trans. Instrum. Meas. 2022, 71, 3522412. [Google Scholar] [CrossRef]
  4. Quan, L.; Wang, M.; Baihang, L.; Ziwen, Z. Integration of deep learning and railway big data for environmental risk prediction models and analysis of their limitations. Front. Environ. Sci. 2025, 13, 1550745. [Google Scholar] [CrossRef]
  5. Hui, X.; Bian, J.; Yu, Y.; Zhao, X.; Tan, M. A Novel Autonomous Navigation Approach for UAV Power Line Inspection. In Proceedings of the 2017 IEEE International Conference on Robotics and Biomimetics (ROBIO), Macau, China, 5–8 December 2017; IEEE: Piscataway, NJ, USA, 2017; pp. 1–6. [Google Scholar] [CrossRef]
  6. Liu, C.; Wu, Y.; Liu, J.; Sun, Z. Improved YOLOv3 Network for Insulator Detection in Aerial Images with Diverse Background Interference. Electronics 2021, 10, 771. [Google Scholar] [CrossRef]
  7. Girshick, R.; Donahue, J.; Darrell, T.; Malik, J. Rich Feature Hierarchies for Accurate Object Detection and Semantic Segmentation. In Proceedings of the IEEE Computer Society Conference on Computer Vision and Pattern Recognition (CVPR), Columbus, OH, USA, 23–28 June 2014. [Google Scholar] [CrossRef]
  8. Girshick, R. Fast R-CNN. In Proceedings of the IEEE International Conference on Computer Vision, Santiago, Chile, 7–13 December 2015. [Google Scholar]
  9. Ren, S.; He, K.; Girshick, R.; Sun, J. Faster R-CNN: Towards Real-Time Object Detection with Region Proposal Networks. IEEE Trans. Pattern Anal. Mach. Intell. 2017, 39, 1137–1149. [Google Scholar] [CrossRef] [PubMed]
  10. Zhao, L.; Li, S. Object Detection Algorithm Based on Improved YOLOv3. Electronics 2020, 9, 537. [Google Scholar] [CrossRef]
  11. Ultralytics. YOLOv5. Available online: https://github.com/ultralytics/yolov5 (accessed on 22 August 2025).
  12. Wang, C.Y.; Bochkovskiy, A.; Liao, H.Y.M. YOLOv7: Trainable Bag-of-Freebies Sets New State-of-the-Art for Real-Time Object Detectors. In Proceedings of the IEEE Computer Society Conference on Computer Vision and Pattern Recognition, Vancouver, BC, Canada, 18–22 June 2023; Available online: https://github.com/WongKinYiu/yolov7 (accessed on 30 August 2025).
  13. Ultralytics. YOLOv8. Available online: https://github.com/ultralytics/ultralytics (accessed on 22 August 2025).
  14. Wang, A.; Chen, H.; Liu, L.; Chen, K.; Lin, Z.; Han, J.; Ding, J. Yolov10: Real-time end-to-end object detection. Adv. Neural Inf. Process. Syst. 2024, 37, 107984–108011. [Google Scholar]
  15. Liu, W.; Anguelov, D.; Erhan, D.; Szegedy, C.; Reed, S.; Fu, C.Y.; Berg, A.C. SSD: Single Shot Multibox Detector. In European Conference on Computer Vision; Springer: Berlin/Heidelberg, Germany, 2016; pp. 21–37. [Google Scholar]
  16. Lin, T.Y.; Goyal, P.; Girshick, R.; He, K.; Dollar, P. Focal Loss for Dense Object Detection. IEEE Trans. Pattern Anal. Mach. Intell. 2020, 42, 318–327. [Google Scholar] [CrossRef] [PubMed]
  17. Zhang, L.; Li, B.; Cui, Y.; Lai, Y.; Gao, J. Research on Improved YOLOv8 Algorithm for Insulator Defect Detection. J. Real-Time Image Process. 2024, 21, 45–58. [Google Scholar] [CrossRef]
  18. Tao, X.; Zhang, D.; Wang, Z.; Liu, X.; Zhang, H.; Xu, D. Detection of Power Line Insulator Defects Using Aerial Images Analyzed with Convolutional Neural Networks. IEEE Trans. Syst. Man Cybern. Syst. 2018, 50, 1486–1498. Available online: https://github.com/InsulatorData/InsulatorDataSet (accessed on 25 August 2025). [CrossRef]
  19. Liu, Y.; Li, X.; Qiao, R.; Chen, Y.; Han, X.; Agyemang, P.; Wu, Z. Lightweight Insulator and Defect Detection Method Based on Improved YOLOv8. Appl. Sci. 2024, 14, 8691. [Google Scholar] [CrossRef]
  20. Hu, D.; Yu, M.; Wu, X.; Hu, J.; Sheng, Y.; Jiang, Y.; Huang, C.; Zheng, Y. DGW-YOLOv8: A Small Insulator Target Detection Algorithm Based on Deformable Attention Backbone and WIoU Loss Function. IET Image Process. 2024, 18, 1096–1108. [Google Scholar] [CrossRef]
  21. Zhang, Z.D.; Zhang, B.; Lan, Z.C.; Liu, H.C.; Li, D.Y.; Pei, L.; Yu, W.X. FINet: An Insulator Dataset and Detection Benchmark Based on Synthetic Fog and Improved YOLOv5. IEEE Trans. Instrum. Meas. 2022, 71, 6006508. [Google Scholar] [CrossRef]
  22. Xu, Z.Y.; Tang, X. Transmission Line Insulator Defect Detection Algorithm Based on MAP-YOLOv8. Sci. Rep. 2025, 15, 10288. [Google Scholar] [CrossRef]
  23. Lewis, D.; Kulkarni, P. Insulator Defect Detection. Available online: https://ieee-dataport.org/competitions/insulator-defect-detection (accessed on 22 August 2025).
  24. Das, L.; Gjorgiev, B.; Sansavini, G. An Improved Anomaly Detection Model for Automated Inspection of Power Line Insulators. Eng. Appl. Artif. Intell. 2025, 158, 111431. [Google Scholar] [CrossRef]
  25. COCO—Common Objects in Context. Available online: https://cocodataset.org/#detection-eval (accessed on 24 August 2025).
  26. Buslaev, A.; Iglovikov, V.I.; Khvedchenya, E.; Parinov, A.; Druzhinin, M.; Kalinin, A.A. Albumentations: Fast and Flexible Image Augmentations. Information 2020, 11, 125. [Google Scholar] [CrossRef]
  27. Ma, Y.C.; Ma, X.; Hao, T.R.; Cui, L.S.; Jin, S.H.; Lyu, P. Knowledge Distillation for Small Object Detection via Hierarchical Matching. J. Comput. Sci. Technol. 2024, 39, 798–810. [Google Scholar] [CrossRef]
  28. Cao, Y.; Liu, Y.; Sun, Y.; Su, S.; Wang, F. Enhancing Rail Safety through Real-Time Defect Detection: A Novel Lightweight Network Approach. Accid. Anal. Prev. 2024, 203, 107617. [Google Scholar] [CrossRef]
  29. Xu, J.; Zhao, S.; Li, Y.; Song, W.; Zhang, K. MRB-YOLOv8: An Algorithm for Insulator Defect Detection. Electronics 2025, 14, 830. [Google Scholar] [CrossRef]
  30. Chen, X.; Deng, L.; Hu, C.; Xie, T.; Wang, C. Dense Small Object Detection Based on an Improved YOLOv7 Model. Appl. Sci. 2024, 14, 7665. [Google Scholar] [CrossRef]
  31. Rasheed, A.F.; Zarkoosh, M. Optimized YOLOv8 for Multi-Scale Object Detection. J. Real-Time Image Process. 2025, 22, 6. [Google Scholar] [CrossRef]
  32. Lau, K.W.; Po, L.M.; Rehman, Y.A.U. Large Separable Kernel Attention: Rethinking the Large Kernel Attention Design in CNN. Expert Syst. Appl. 2024, 236, 121352. [Google Scholar] [CrossRef]
  33. Guo, M.H.; Lu, C.Z.; Liu, Z.N.; Cheng, M.M.; Hu, S.M. Visual Attention Network. Comput. Vis. Media 2023, 9, 733–752. [Google Scholar] [CrossRef]
  34. Gevorgyan, Z. SIoU Loss: More Powerful Learning for Bounding Box Regression. arXiv 2022, arXiv:2205.12740. [Google Scholar] [CrossRef]
  35. Ma, S.; Xu, Y. MPDIoU: A Loss for Efficient and Accurate Bounding Box Regression. arXiv 2023, arXiv:2307.07662. [Google Scholar] [CrossRef]
  36. Rezatofighi, H.; Tsoi, N.; Gwak, J.; Sadeghian, A.; Reid, I.; Savarese, S. Generalized Intersection over Union: A Metric and a Loss for Bounding Box Regression. In Proceedings of the IEEE/CVF Conference on Computer Vision and Pattern Recognition, Long Beach, CA, USA, 16–17 June 2019; IEEE: Long Beach, CA, USA, 2019; pp. 658–666. [Google Scholar]
Figure 1. Distribution of relative areas of object detection bounding boxes.
Applsci 15 10694 g001
Figure 2. Visualization grid of representative samples in the complexRailway dataset.
Applsci 15 10694 g002
Figure 3. Yolov8s architecture.
Applsci 15 10694 g003
Figure 4. C5LS architecture with a pruned detection head and an LSKA attention module before SPPF.
Applsci 15 10694 g004
Figure 5. YOLOv8s architecture with P5 branch removed.
Applsci 15 10694 g005
Figure 6. LSKA architecture (k: receptive field size; d: dilation rate).
Applsci 15 10694 g006
Figure 7. Illustration of the comparison between traditional convolution and the LSKA module.
Applsci 15 10694 g007
Figure 8. Schematic of SIoU directional modeling.
Applsci 15 10694 g008
Figure 9. Accuracy gains of three individual modules compared to YOLOv8s.
Applsci 15 10694 g009
Figure 10. P-R curve of C5LS.
Applsci 15 10694 g010
Figure 11. Comparison of the improved model and the baseline: (a) mAP@0.5 curves; (b) mAP@0.5–0.95 curves.
Applsci 15 10694 g011
Figure 12. Detection results under background interference. In both (a,b), there are interference from wooden sleepers and rail tracks.
Applsci 15 10694 g012
Figure 13. Detection results under adverse weather conditions: (a) detection under smog; (b) detection under rain; (c) detection under rain; (d) detection under rain and smog.
Applsci 15 10694 g013
Figure 14. Detection results in dense and diverse orientations. In both (a,b), multiple insulators are gathered on the same cable, causing blurry boundaries.
Applsci 15 10694 g014
Table 1. Database scene classification.
Type of Scene ChallengesDescriptionNumber of Images
Long-distance imagingInsulators are often captured as long-range objects, typically constituting less than 0.25% of the total image area.1067
Feature truncationThe side-flight path causes the insulator to be squeezed to the edge of the image; Obstacles along the line such as the vegetation causes partial obstruction.419
Densely distributed targetsMultiple insulators are closely arranged and even appear in clusters.584
Background interference (e.g., dense vegetation, cables)The background contains dense vegetation, cables, and metal reflections.758
Weak light and motion blurInadequate lighting at dusk or near tunnel entrances and UAV vibrations often cause blurred images.609
Table 2. Experimental environment configuration.
ParameterConfiguration
Operating SystemUbuntu 20.04.6
GPUNVIDIA Tesla T4 (15 GB VRAM)
CUDA12.4
Python3.10
PyTorch2.4
Baseline ModelYOLOv8s
OptimizerSGD
Learning Rate0.01
Momentum0.937
Weight Decay0.0005
Batch Size8
Image Size640 × 640
Epochs200
Data AugmentationHorizontal flip ( p = 0.5 ), Mosaic ( p = 1.0 )
Table 3. Comparison results of detection head pruning strategies.
ModelmAP@0.5mAP@0.5–0.95FPSLatency/msParams/M
YOLOv8s (baseline)0.928 ± 0.010.620 ± 0.02131.67.6 ± 0.111.1
Cut P30.837 ± 0.010.510 ± 0.022084.8 ± 0.112.5
Cut P40.925 ± 0.010.617 ± 0.021198.4 ± 0.19.9
Cut P5 (Ours)0.931 ± 0.010.623 ± 0.021646.1 ± 0.16.9
Cut P4 + P50.926 ± 0.010.614 ± 0.022384.2 ± 0.12.29
Table 4. Comparison results of LSKA kernel sizes.
ModelmAP@0.5mAP@0.5–0.95FPSLatency/msParams/M
YOLOv8s (baseline)0.928 ± 0.010.620 ± 0.02131.67.6 ± 0.111.1
LSKA, k = 7 0.936 ± 0.010.642 ± 0.0290.911 ± 0.118.8
LSKA,  k = 11   (Ours)0.938 ± 0.010.644 ± 0.0290.911 ± 0.118.8
LSKA, k = 23 0.937 ± 0.010.642 ± 0.0390.911 ± 0.218.9
Table 5. Comparison results of different loss functions.
ModelmAP@0.5mAP@0.5–0.95FPSLatency/msParams/M
YOLOv8s (baseline)0.928 ± 0.010.620 ± 0.02131.67.6 ± 0.111.1
SIoU (Ours)0.934 ± 0.010.628 ± 0.02131.67.6 ± 0.111.1
MDPIoU0.933 ± 0.020.622 ± 0.04131.67.6 ± 0.111.1
GIoU0.927 ± 0.020.618 ± 0.02131.67.6 ± 0.111.1
Table 6. Performance comparison of different YOLOv8s configurations on complexRailway.
ModelCut P5LSKA (k = 11)SIoUmAP@0.5mAP@0.5–0.95FPSParams/M
YOLOv8s×××0.928 ± 0.010.620 ± 0.02131.611.1
××0.931 ± 0.010.623 ± 0.02164.06.9
××0.938 ± 0.010.644 ± 0.0290.918.8
××0.934 ± 0.010.628 ± 0.02131.611.1
×0.941 ± 0.020.647 ± 0.03104.013.9
0.947 ± 0.020.655 ± 0.03104.013.9
Table 7. Performance comparison of different YOLOv8s configurations on IDID.
ModelCut P5LSKA (k = 11)SIoUmAP@0.5mAP@0.5–0.95FPSParams/M
YOLOv8s×××0.899 ± 0.010.582 ± 0.02117.6111.1
××0.901 ± 0.010.583 ± 0.02138.066.9
××0.906 ± 0.010.585 ± 0.0268.7918.8
××0.904 ± 0.010.584 ± 0.02117.6111.1
×0.909 ± 0.020.585 ± 0.0279.1313.9
0.915 ± 0.020.587 ± 0.0379.1513.9
Table 8. Comparison results of mainstream detection models.
ModelmAP@50mAP@50–95FPSLatency/msParams/M
YOLOv50.915 ± 0.050.615 ± 0.06160.86.2 ± 0.19.1
YOLOv70.919 ± 0.040.618 ± 0.04172.45.8 ± 0.137.2
YOLOv8n0.910 ± 0.020.586 ± 0.04298.03.4 ± 0.13.0
YOLOv8m0.933 ± 0.010.654 ± 0.0168.3514.6 ± 0.0525.9
YOLOv8s (baseline)0.928 ± 0.010.620 ± 0.02131.67.6 ± 0.111.1
Ours0.947 ± 0.020.655 ± 0.03104.09.6 ± 0.113.9
YOLOv90.929 ± 0.020.625 ± 0.03107.759.3 ± 0.27.3
YOLOv100.923 ± 0.030.626 ± 0.05135.27.4 ± 0.158.1
Disclaimer/Publisher’s Note: The statements, opinions and data contained in all publications are solely those of the individual author(s) and contributor(s) and not of MDPI and/or the editor(s). MDPI and/or the editor(s) disclaim responsibility for any injury to people or property resulting from any ideas, methods, instructions or products referred to in the content.