Article

Experimental Evaluation of UAV Energy Management Using Solar Panels and Battery Systems

by
Pedro Fernandes
1,*,†,
Ricardo Santos
2,† and
Francisco Rego
3,4,†
1
Instituto Superior Técnico, Universidade de Lisboa, 1049-001 Lisbon, Portugal
2
Unidade de Investigação em Governança, Competitividade e Políticas Públicas, Universidade de Aveiro, 3810-193 Aveiro, Portugal
3
Escola Superior de Engenharia e Tecnologias, Instituto Politécnico da Lusofonia, 1950-396 Lisbon, Portugal
4
Intelligent Systems Associate Laboratory (LASI), UNINOVA-Instituto de Desenvolvimento de Novas Tecnologias, CTS—Centro de Tecnologia e Sistemas, COPELABS from the Lusófona University, 1749-024 Lisbon, Portugal
*
Author to whom correspondence should be addressed.
These authors contributed equally to this work.
Appl. Sci. 2025, 15(19), 10689; https://doi.org/10.3390/app151910689
Submission received: 7 August 2025 / Revised: 14 September 2025 / Accepted: 25 September 2025 / Published: 3 October 2025
(This article belongs to the Special Issue Advanced Control Systems and Control Engineering)

Abstract

Solar-electric propulsion offers a practical way to lengthen the endurance of small fixed-wing unmanned aerial vehicles while removing the noise, emissions, and upkeep that come with combustion engines. This work describes and tests a lightweight platform that couples a flexible thin-film photovoltaic array, a high-efficiency power-tracking controller, and a lithium–polymer battery to an electric brushless drivetrain. A ground-based flight emulator reproducing steady cruise allows continuous logging of the electrical flows between panel, battery, and motor. The results show that the solar subsystem can sustain most of the cruise demand, so the battery is called on only sparingly and is even able to recharge when sunlight is higher than a specific threshold. This balance translates into a clear endurance gain without upsetting the aircraft’s weight or handling.

1. Introduction

The integration of solar energy into unmanned aerial vehicles (UAVs) has attracted considerable attention as a means to extend flight endurance and reduce their environmental impact. Although internal combustion powered UAVs are still considered the best option for applications with long travel distances and longer duration flights, a hybrid solar-electric system offers a sustainable alternative by harnessing ambient solar energy, thereby increasing the operational time of UAVs without significantly adding weight and despite still having a lower useful energy density propulsion system [1]. This approach is particularly valuable in applications such as environmental monitoring, surveillance, and long-duration reconnaissance missions where flight endurance is critical.
Advanced thin-film photovoltaic (PV) cells, particularly those based on copper indium gallium selenide (CIGS), have emerged as a promising technology for UAVs due to their flexibility, lightweight nature, and competitive efficiency [2,3]. Another option is perovskite-based solar cells, which have demonstrated high laboratory efficiencies. However, challenges related to long-term stability and scalable production currently limit their commercial viability [4,5]. Moreover, the placement and integration of PV panels must be optimized to minimize any adverse aerodynamic effects on the UAV’s performance [6].
Efficient energy management is equally critical for solar-powered UAVs. Maximum Power Point Tracking (MPPT) algorithms, such as Perturb and Observe and Incremental Conductance, are extensively employed to maximize energy extraction from PV cells under variable irradiance conditions. Studies have shown that, when combined with high-energy-density lithium–polymer (LiPo) batteries, these algorithms can achieve efficiency gains exceeding 90% [7,8]. Such improvements are essential to ensure a reliable power supply during low-irradiance periods and peak demand phases.
Aerodynamic design and structural optimization also play a pivotal role in the overall system performance. High-aspect-ratio wings made from lightweight composite materials, such as carbon fiber, provide a large surface area for PV panel integration while maintaining favorable lift-to-drag ratios. Simulation tools such as XFLR5 (X-Foil-based aerodynamic analysis tool) have demonstrated that airfoil optimization can significantly enhance aerodynamic efficiency, which is crucial for maximizing flight endurance [9].
Finally, experimental applications have validated the potential of hybrid solar-electric UAVs. Field trials have reported that lightweight PV modules integrated with LiPo batteries can achieve rapid charging and maintain high efficiency in static tests, with some studies noting flight times exceeding 7 h under optimal sunlight conditions [10,11]. These findings underscore the practical feasibility of extending UAV endurance through solar energy harvesting.
In this study, we present an experimental evaluation of a UAV system equipped with CIGS solar panels and LiPo batteries. Our analysis focuses on quantifying energy contributions of each component during different flight phases, assessing the efficiency of the solar power management system, and identifying limitations under high power demands. The insights from this work aim to inform the design of future solar-powered UAV platforms, thereby contributing to more sustainable and long-endurance flight operations.
In this study, the term "energy management" refers to the closed-loop regulation of cruise power with a maximum power point tracking (MPPT) controller, together with explicit monitoring of battery current direction. Rather than introducing a novel scheduling or optimization algorithm, we deliberately adopt a minimal strategy: the aircraft is commanded to a regulated electrical load (≈31 W), and the MPPT continuously balances solar input against battery discharge. This simple arrangement has two practical advantages. First, it allows us to quantify in real time the split between solar and battery contributions, including when the battery experiences net recharge. Second, it provides a reproducible baseline against which more elaborate algorithms or structural concepts can later be compared. We acknowledge that the hardware configuration and methodology are similar to those reported in the solar UAV literature and that no new optimization or control strategy is proposed here. The contribution of this paper, therefore, lies in its endurance-oriented experimental quantification of solar–battery interactions under regulated cruise power, providing a clear benchmark for future extensions in flight testing and algorithmic management.

Literature Review

The usage of UAVs in companies has grown significantly in recent years. Some applications include logistics (e.g., [12,13]), with some of these companies reaching a good service performance in terms of last-mile efficiency, time deliveries, and the reduction of accidents. Other advantages concerning the UAV usage includes the delivery of medicines in remote locations [14].
Recently, most UAVs are based on batteries, as well as well-known power technologies, which include reciprocating engines, with their low efficiency in small-scale applications, and most of them with CO2 emissions. With regard to UAV CO2 emissions, ref. [15] has made this comparison by using electric UAVs and conventional trucks on its deliveries.
The resulting CO2 savings, presented in this work, highlight the importance of using UAVs as an alternative to conventional vehicles like trucks, for example, or even (in some cases) to complement trucks to improve service quality, minimizing at the same time CO2 emissions [14]. Some of these outcomes can be found in the existing literature (e.g., [16]). On the other hand, works like [17] try to estimate UAV emissions, depending on the payload distance or even on the number of stops related to the vehicle’s route. Other works (e.g., [18]) analyze the impact of the battery capacity on different vehicles’ journeys.
Nevertheless, it is well-known that batteries have limited energy density, which results in substantial weight increases for UAVs, making this issue, therefore, more significant in long flight duration situations. Many technologies have arisen to solve these issues. Fuel cells, for instance, have risen as an alternative power source [19], with PEMFC technology (Proton Exchange Membrane Fuel Cells) presenting a significant advantage when applied to UAV applications. Given their low operational temperature and high specificity, this technology is highly suitable for automotive and aerospace applications (e.g., [20,21,22,23]). Some of these studies have shown the viability of this technology for propelling small aircraft, concurrently allowing a reduction in Greenhouse Gas (GHG) emissions when compared to traditional technologies used in aviation [24].
However, the maturity and accessibility of these technologies on the market, especially for small appliances, present a challenge. Solar PV panels, on the other hand, are a renewable power source, based on sunlight conversion into electric energy, making them a promising technology for UAV propulsion [17,18], given their low cost, energy efficiency, and the availability of sunlight [19]. Solar PV cells are also applied on low-orbit satellites by supplying their systems [25] to perform civilian and military missions (e.g., intelligence, reconnaissance, surveillance, wildfire detection, agriculture, and pollution monitoring), some of which can be unfit for human pilots [24].
On the other hand, hybrid power solutions have also arisen by combining multiple power technologies for UAV propulsion, thus allowing an extended flying range and reduced GHG emissions [20]. However, the integration of some of the systems used (in particular, the dynamic ones) into the UAVs raises multiple challenges concerning their design and implementation, which must be tackled.
Concluding this section, there is a consensus in the literature that there are several key economic areas where the use of UAVs is relevant to promote sustainability. Electric UAVs with batteries and PV panels are a promising technology for promoting sustainability, although the viability of using this technology remains a question to be answered from different points of view. This paper seeks to answer those questions by presenting empirical evidence and practical insights into the performance of battery-plus-PV UAVs.
Recent advances in cooperative UAV systems and solar-powered propulsion further reinforce these perspectives. Works such as [26,27] demonstrate how UAV swarms equipped with advanced planning and resilient distributed learning can accomplish complex tasks such as wildlife tracking, while systematic reviews and design studies on solar-powered UAVs [28,29,30] underline the transformative potential of photovoltaic integration for long-endurance flight. Optimization analyses targeting energy storage [31] and practical demonstrations, like the Qimingxing 50 solar-powered UAV [32], further highlight both the opportunities and challenges of these technologies. However, most of these works remain either conceptual, simulation-based, or focused on large-scale/high-altitude platforms. In contrast, the novelty of this paper lies in providing an experimental evaluation of a lightweight UAV system that integrates thin-film PV panels and batteries, quantifying their joint energy contributions under different irradiance conditions. By presenting empirical evidence through controlled tests, this work bridges the gap between theoretical studies and practical deployment, offering insights into the real-world feasibility of battery-plus-PV UAVs for sustainable operations.

2. Materials and Methods

This section outlines the hardware, theoretical framework, and experimental procedure used to compare a UAV power system running (i) with a solar panel and (ii) without a solar panel. The experiment is performed three times. Once without the solar panel, and twice with the solar panel under different weather conditions. In all cases, the rest of the system remains identical. Data on electrical currents, voltages, and throttle commands are collected using an Arduino for subsequent analysis.

2.1. Theoretical Background

2.1.1. Lift and Drag for Sustained Flight

Consider a UAV of mass m flying at constant altitude. The weight W is calculated as follows:
W = m g .
To remain in level flight, the lift L generated by the wings must match W [33], written as follows:
L = W = 1 2 ρ V 2 S C L ,
where ρ is the air density, V is the airspeed, S is the wing reference area, and C L is the lift coefficient. Solving for V yields the following:
V = 2 W ρ S C L .
The drag force D, approximated by [33], is calculated as follows:
D = 1 2 ρ V 2 S C D ,
where C D is a characteristic drag coefficient, which must be overcome by the propulsive thrust to remain in a steady flight condition. The required propulsive power P f l i g h t is calculated as follows:
P f l i g h t = D × V .

2.1.2. Throttle-to-Power Mapping

In practice, the throttle command τ (ranging from 0% to 100%) is converted by the Electronic Speed Controller (ESC) to the appropriate voltage–current combination on the motor, resulting in an empirical mapping, written as follows:
P m o t o r ( τ ) f ( τ ) ,
where f ( τ ) is found experimentally, e.g., f ( 90 % ) 32.22   W .

2.1.3. Solar Contribution

When the solar panel is present, part of the motor’s power can come directly from the panel. Let P p a n e l be the panel’s instantaneous output:
P p a n e l = I p a n e l × V p a n e l ,
which enables battery recharge if P p a n e l P m o t o r P l o s s e s is verified. In the second experiment (no panel), all propulsion power is drawn from the battery.

2.2. Hypothetical Model Aircraft

In addition to the bench test setup described, we consider a representative fixed-wing UAV sized to accommodate a flexible solar panel of dimensions 1.24 m × 0.35 m (surface area S = 0.5 m2) and a thickness of 2 mm, on its wing’s extrados. This configuration is broadly comparable to platforms such as the Wingtra One and SkyWalker X8. Two mass configurations are defined as follows:
  • No-panel version: total mass m = 4.0 kg. With-panel version: total mass m = 5.5 kg (including a 1.5 kg solar panel assembly).
Assumption 1.
The flexible thin-film panel is bonded flush to the wing skin, and the wing box could be designed to guarantee no wiring protrusions on the wing’s surface. For sizing, we kept the same nominal coefficients in both configurations to isolate the electrical balance; therefore, we assume that its installation does not change the aerodynamic coefficients or flow characteristics of the aircraft. The same lift ( C L ) and drag ( C D ) coefficients are used for both configurations. In practice, surface texture, local camber changes, tape seams, and wiring can increase C D 0 and shift the optimal C L . This likely contributes to the higher observed electrical power in the with-panel case in addition to the mass increase.
Assuming lift coefficient C L = 1.0 , drag coefficient C D = 0.04 , air density ρ = 1.293 kg/m3, and gravitational acceleration g = 9.81 m/s2, the cruise speed for each configuration is calculated from the steady-level flight lift balance, written as follows:
V = 2 m g ρ S C L .
We then substitute the following:
V 4 kg 2 · 4.0 · 9.81 1.293 · 0.5 · 1.0 11.0 m / s ,
V 5.5 kg 2 · 5.5 · 9.81 1.293 · 0.5 · 1.0 12.9 m / s .
The power required to overcome aerodynamic drag in cruise is as follows:
P flight = 1 2 ρ V 3 S C D ,
which numerically gives us
P flight , 4 kg 17.3 W , P flight , 5.5 kg 27.9 W .
Accounting for the propulsion-system efficiency η = 0.9 , the electrical power required in cruise is calculated as follows:
P electrical = P flight η ,
which yields
P electrical 19.2 W ( no - panel ) , 31.0 W ( with - panel ) .
Although our experiments are bench-based, these cruise-power estimates inform the throttle profile selection for the cruise segment and enable a realistic comparison of energy usage and endurance between the panel-assisted and battery-only configurations.
Remark 1.
In the above estimates we adopted several simplifying assumptions. First, a single, lumped propulsive efficiency η was used to represent the combined motor/ESC and propeller chain. Reported values for small UAVs typically lie between 0.75 and 0.88; a short sensitivity shows that taking η = 0.80 would raise the with-panel cruise estimate from ≈31 W to the following:
P electrical ( η = 0.80 ) = P flight , 5.5 kg 0.80 27.9 0.80 34.9 W ,
which remains within the drivetrain envelope and below the sunny-day panel output, leaving the conclusions unaffected. Second, fixed aerodynamic coefficients ( C L = 1.0 , C D = 0.04 ) were used to size the representative cruise point. In practice, C D decomposes as C D = C D 0 + k C L 2 ; if C D 0 increases by 10 % (e.g., due to surface roughness or panel seams), the cruise power rises by only ≈2–3 W, again, not altering the qualitative outcome. Finally, the additional 1.5 kg panel mass was included directly in the weight budget, but secondary penalties due to structural reinforcement or center-of-gravity rebalancing were not modeled. These would increase the real power requirement, but here the aim was to isolate the electrical balance and assess whether solar input can, in principle, offset the direct payload mass under ideal structural assumptions.

2.3. Materials

2.3.1. Solar Panel

A flexible, lightweight panel (SolarFam, Utrecht, The Netherlands) rated at 90 W maximum output under full sunlight. Its open-circuit voltage is approximately 23.7   V , and the operating voltage under load (Vmp) is about 19.8   V . The panel mass is roughly 1.5   k g . When attached, the overall system mass is 5.5   k g . When omitted, the total system mass is 4.0   k g .

2.3.2. MPPT Solar Charge Controller

An off-the-shelf MPPT (Maximum Power Point Tracking) controller (Zilimontt, Wuhan, China) rated for 12–24 V output at up to 40 A is employed in this setup. It supports input voltages up to 100 V and can handle a maximum solar panel power of 520 W under 12 V operation. In the present arrangement, this device serves primarily as a stand-in for a standard solar charge controller, facilitating the optimization of panel voltage and current for load supply and battery charging. Nevertheless, UAV applications often require a lighter solution. More advanced MPPT controller devices allow the adjustment of their working parameters such as the following:
  • Bulk, absorption, and float charger voltages;
  • Re-bulk voltage offset;
  • Duration, time, and tail-current absorption parameters;
  • Equalization of current, interval, stop mode, and duration;
  • Temperature voltage compensation;
  • Low-temperature cut off.
The aforementioned settings of the chosen MPPT controller are not known. Models such as the Genasun GV-5 or Genasun GV-10 weigh approximately 30 g , yet these have high tracking efficiency, making them particularly suitable for small airborne platforms where mass is critical.

2.3.3. Battery

A 3S LiPo pack (Rhino, Dubai, UAE; nominal 11.1   V , 3300 m A h capacity), provides around 36.6   W h of stored energy. This battery was used in both the “panel” and “no panel” configurations.

2.3.4. Brushless Motor and ESC

A Turnigy Aerodrive SK3 motor (Turnigy, Hong Kong, China; 35,361,400 k V ), designed for operation with an open propeller, combined with a 30–40 A ESC (Turnigy, Hong Kong, China) was used. Empirical mapping indicates a power draw between 3.55   W (idle) and 32.22   W (90% throttle).

2.3.5. Arduino Data Logging

An Arduino microcontroller (Arduino, Monza, Italy) reads current and voltage from three channels (panel, battery, and motor). These signals are measured via Hall-effect current sensors and simple voltage dividers, then printed to the serial port every 500 m s . This setup facilitates direct power calculations for each channel in real time, according to the following formula:
P = I × V .

2.4. Experimental Procedure

2.4.1. Setup

All components (motor, ESC, battery, MPPT charge controller, and Arduino) are placed on a bench as shown in Figure 1. For the solar-assisted run, the panel is connected to the MPPT. For the battery-only baseline, it is omitted.
Figure 2 summarizes the power and signal paths used during the bench tests. The MPPT charge controller forms the hub of the system: Its regulated output rail is shared by the Li-Po battery, the ESC, and, when present, the solar panel. Hall-effect current sensors (A) and resistive voltage taps (V) are placed on each of the three branches, panel, battery, and motor, so that the Arduino can sample (I) and (V) for every source independently. Every 500 ms, the microcontroller streams the six raw measurements over its USB-serial port while simultaneously updating the pulse-width-modulated (PWM) throttle command that drives the ESC. A host personal computer (PC) captures the serial feed, renders a live browser dashboard, and logs the data to disk for post-processing. This arrangement enables the identification of the instantaneous power contributions of the panel.

2.4.2. Mission Profile Script

Instead of a predetermined throttle schedule, a closed-loop power controller is implemented using Arduino. Every 50 ms the code reads the panel, battery, and motor currents and voltages; computes the instantaneous motor power (expressed in Watt); and adjusts the ESC throttle via a proportional controller ( K p = 0.5 ) to maintain a power setpoint.

2.4.3. Data Logging

The following steps (panel or no panel) are executed once:
  • The Arduino starts reading I and V on the three channels every 500 ms;
  • The mission script varies the throttle command according to the measured data;
  • The measured values are printed via serial connection;
  • The experiment ends after a predetermined time period.

2.4.4. Post-Processing

From the serial logs, the user calculates the input and output power for each segment as follows:
P m o t o r ( t ) = I m o t o r ( t ) · V m o t o r ( t ) ,
P b a t t e r y ( t ) = I b a t t e r y ( t ) · V b a t t e r y ( t ) ,
P p a n e l ( t ) = I p a n e l ( t ) · V p a n e l ( t ) .
By integrating P ( t ) over time, the total energy consumption is found as follows:
E = 0 T P ( t ) d t ,
allowing direct comparison between the three runs: with the solar panel system in sunny and cloudy conditions, and without it.

2.4.5. Power-Direction Convention and Charging Condition

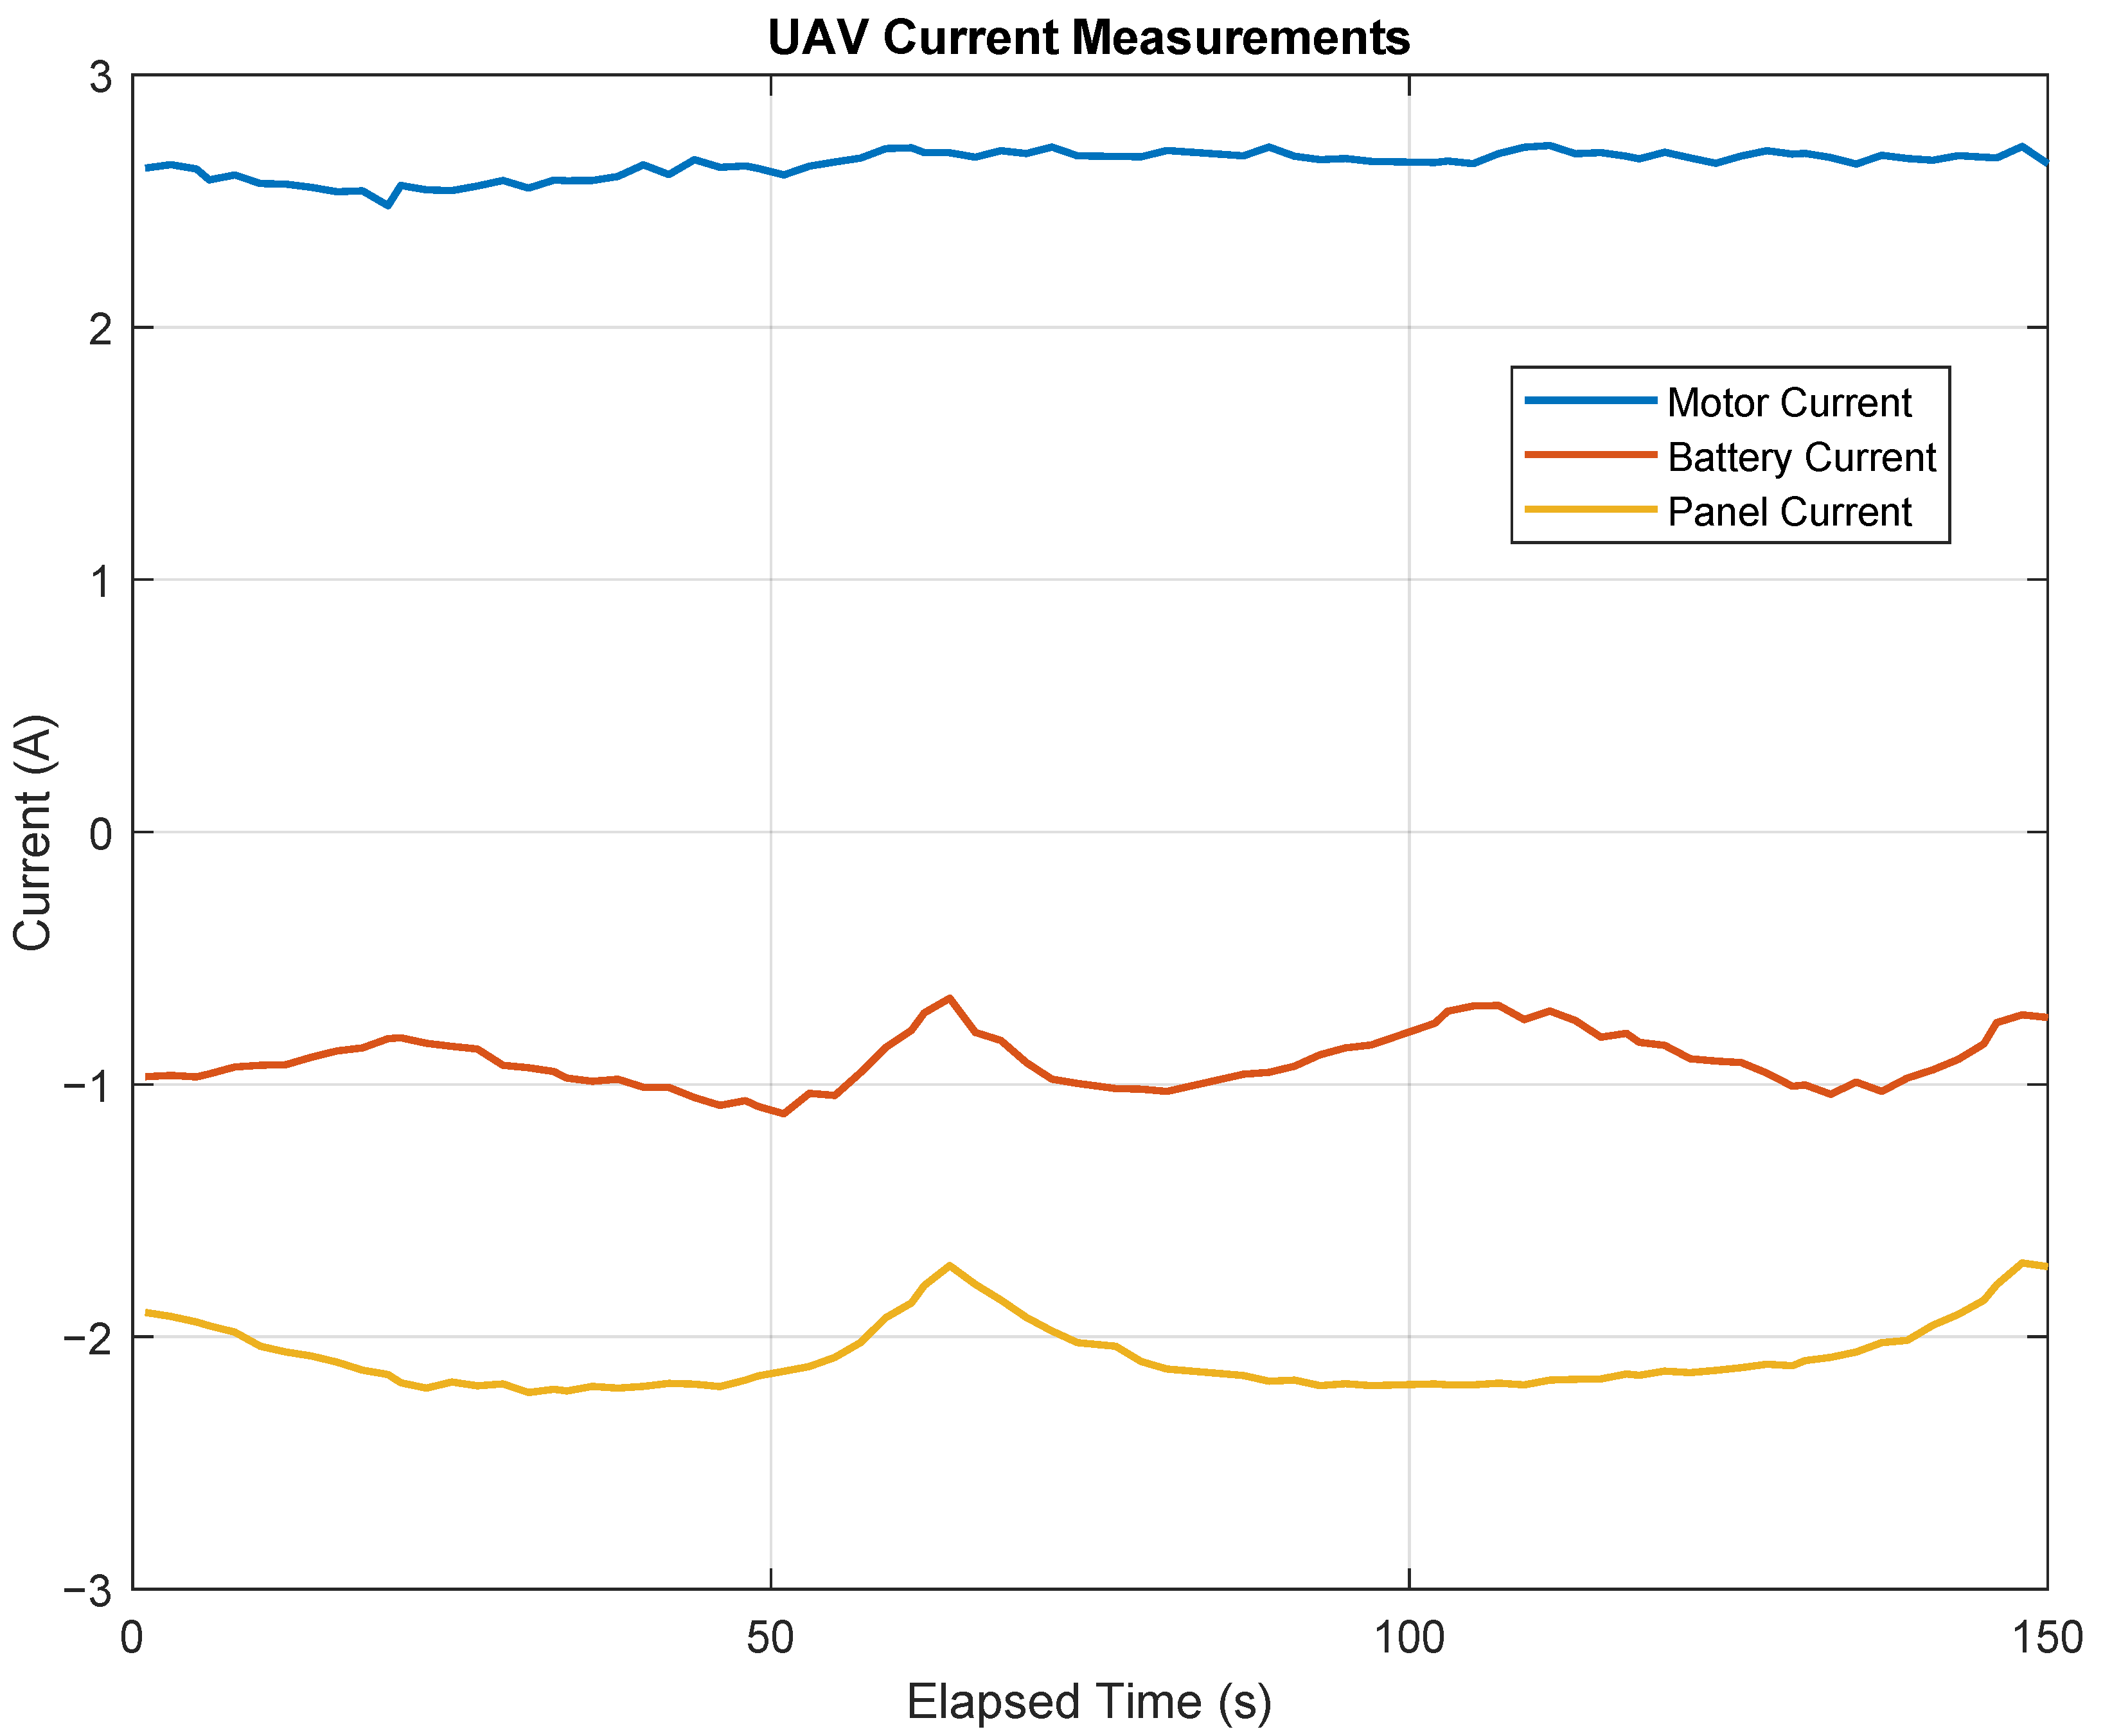
Positive battery current denotes discharge (power from battery to DC bus); negative denotes charge (power from DC bus into the battery). With a shared DC bus, charging occurs when the regulated bus voltage exceeds the instantaneous battery terminal voltage and the controller permits reverse current into the battery. In our sunny-day runs, this condition is met, which is consistent with the observed negative battery current (Figure 3 and Figure 4).

2.4.6. Statistical Analysis and Replication

Five independent solar-assisted cruise runs were recorded, denoted Run 1 through Run 5. For each run, we analyzed a fixed window t [ 100 , 800 ] s and computed 5 s block means to reduce sensor noise and short-term autocorrelation. This yielded N = 562 block means overall, with per-run durations between ≈4.9 and ≈11.7 min and a cumulative steady-cruise observation time of ≈46.8 min (Table 1).
Per run, we report mean, standard deviation and 95% confidence intervals (CI95) for battery power P bat and panel power P panel (from block means). We then fit a robust linear regression of P bat versus the panel power delivered to the DC bus to quantify solar↔battery substitution at cruise. Between-run heterogeneity was assessed with one-way ANOVA and, non-parametrically, with Kruskal–Wallis. Ambient irradiance and temperature data for the test periods were retrieved from the Portuguese Institute for Sea and Atmosphere (IPMA) online database [34].

3. Results and Discussion

Cruise tests were conducted with the solar panel and MPPT under steady-level conditions. All sensors were sampled every 500 ms for a continuous cruise segment, during which throttle was regulated to maintain the 31 W power setpoint.
Remark 2.
The no-panel baseline ( m = 4.0 kg , ≈19.2   W ) and the with-panel case ( m = 5.5 kg , ≈31   W ) are different-weight configurations and therefore are not a like-for-like endurance test. The objective here is a proof-of-concept of solar compensation: under identical commanded cruise-load regulation, we quantify how much of the electrical demand can be covered by the panel and when the battery becomes a net sink or source. A direct endurance comparison would require matched mass or flight-test polars, which we leave for future work.

3.1. Solar Panel Power Measurements

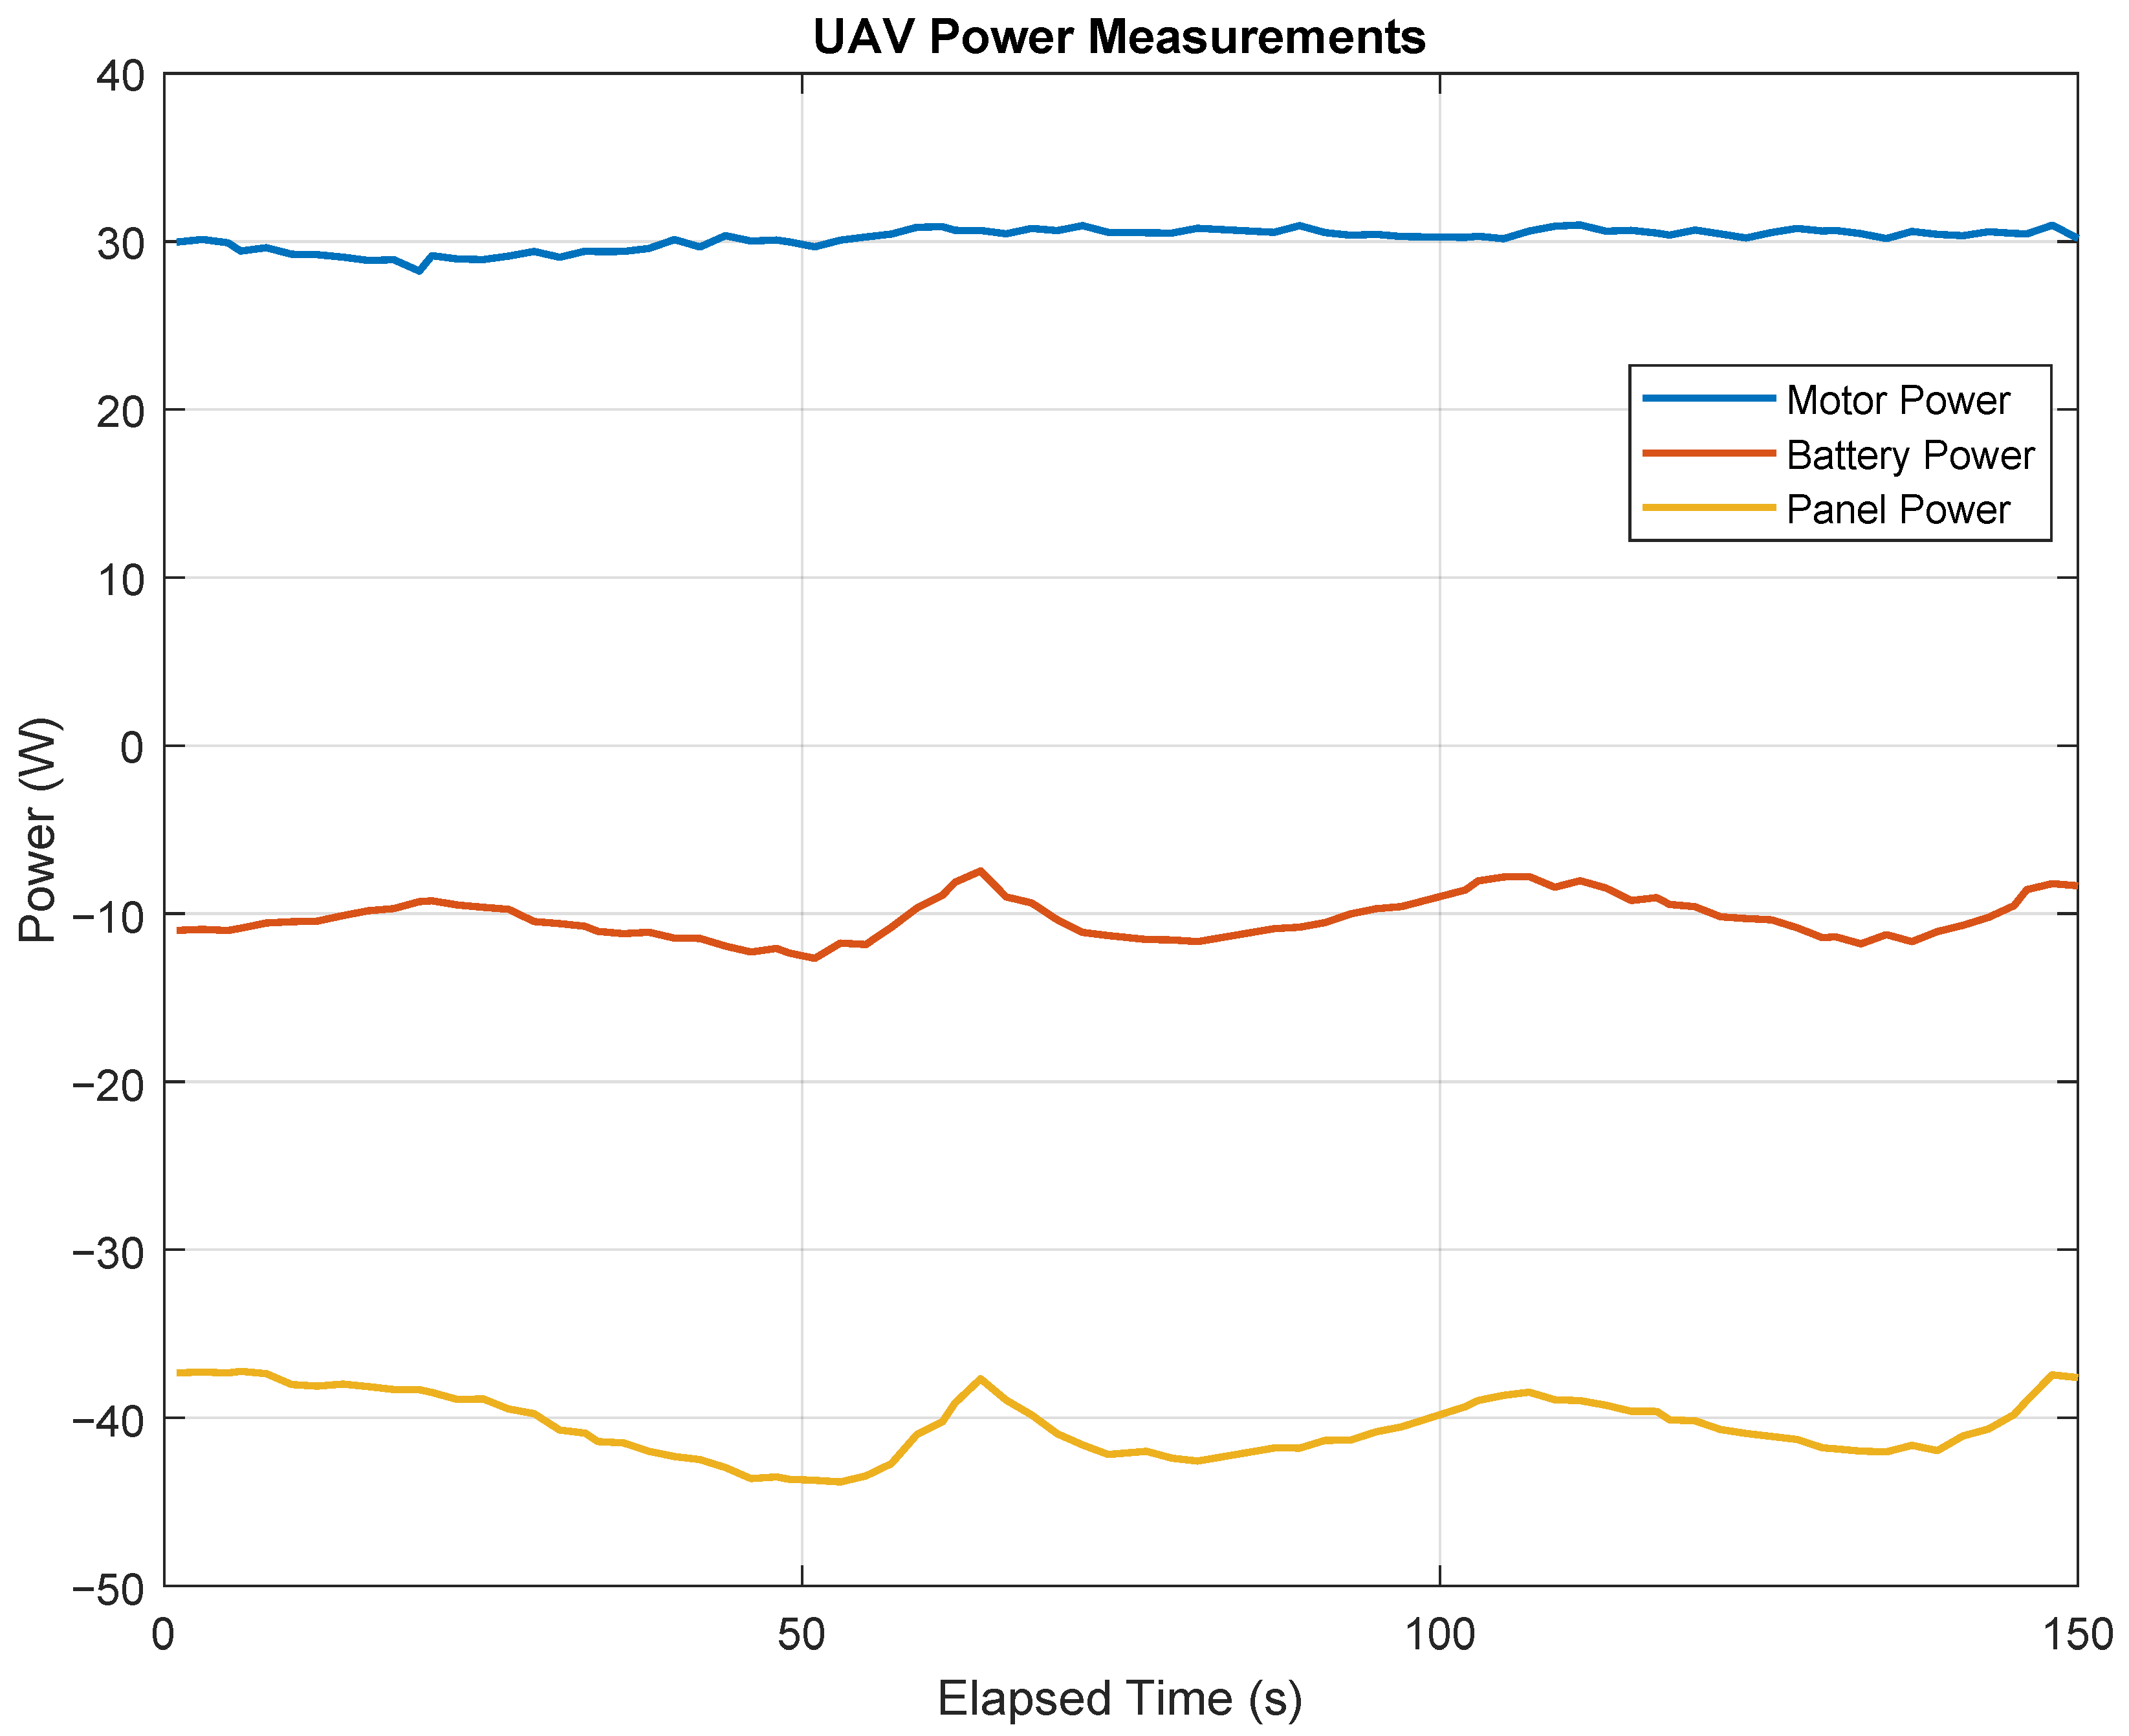
Figure 5 shows the instantaneous solar panel power output throughout the cruise during a sunny day. The panel delivered a near-constant output, averaging 40.4   W , with small variations. The ambient global irradiance during the test was 930 W/m2 and the air temperature was 36.3 °C.
Under G 930 W / m 2 and panel area S p 0.5 m 2 , the incident power is ≈465 W . The measured panel output (mean 40.4 W ) corresponds to an apparent ∼8.7% bus-side efficiency, lower than the ∼18% implied by the 90 Wp STC rating. This gap is expected due to (i) a cell temperature above STC (36 °C; typical CIGS derating ∼0.4– 0.5 % /°C above 25 °C), (ii) a non-normal incidence on the curved wing surface and interconnect shading, and (iii) MPPT/controller plus wiring losses. Accounting for (i)–(iii) narrows the gap and is consistent with the observed bus power.
For comparison, Figure 6 illustrates the power split when the panel was physically removed while the throttle controller attempted to track the 19.2 W setpoint. In this baseline case, the battery alone supplied the propulsion load.
Figure 3 details the simultaneously sampled currents at the motor, battery, and panel terminals. The panel current remained almost constant at about 2.0 A, matching the 40.4 W average power and the 19.8 V maximum-power-point voltage. The motor current tracked the closed-loop throttle demand, fluctuating between 2.4 A and 2.8 A. Crucially, the battery current became negative (charging) since the available solar power exceeded the propulsion demand, confirming that the panel supplied the cruise energy and even charged the battery.
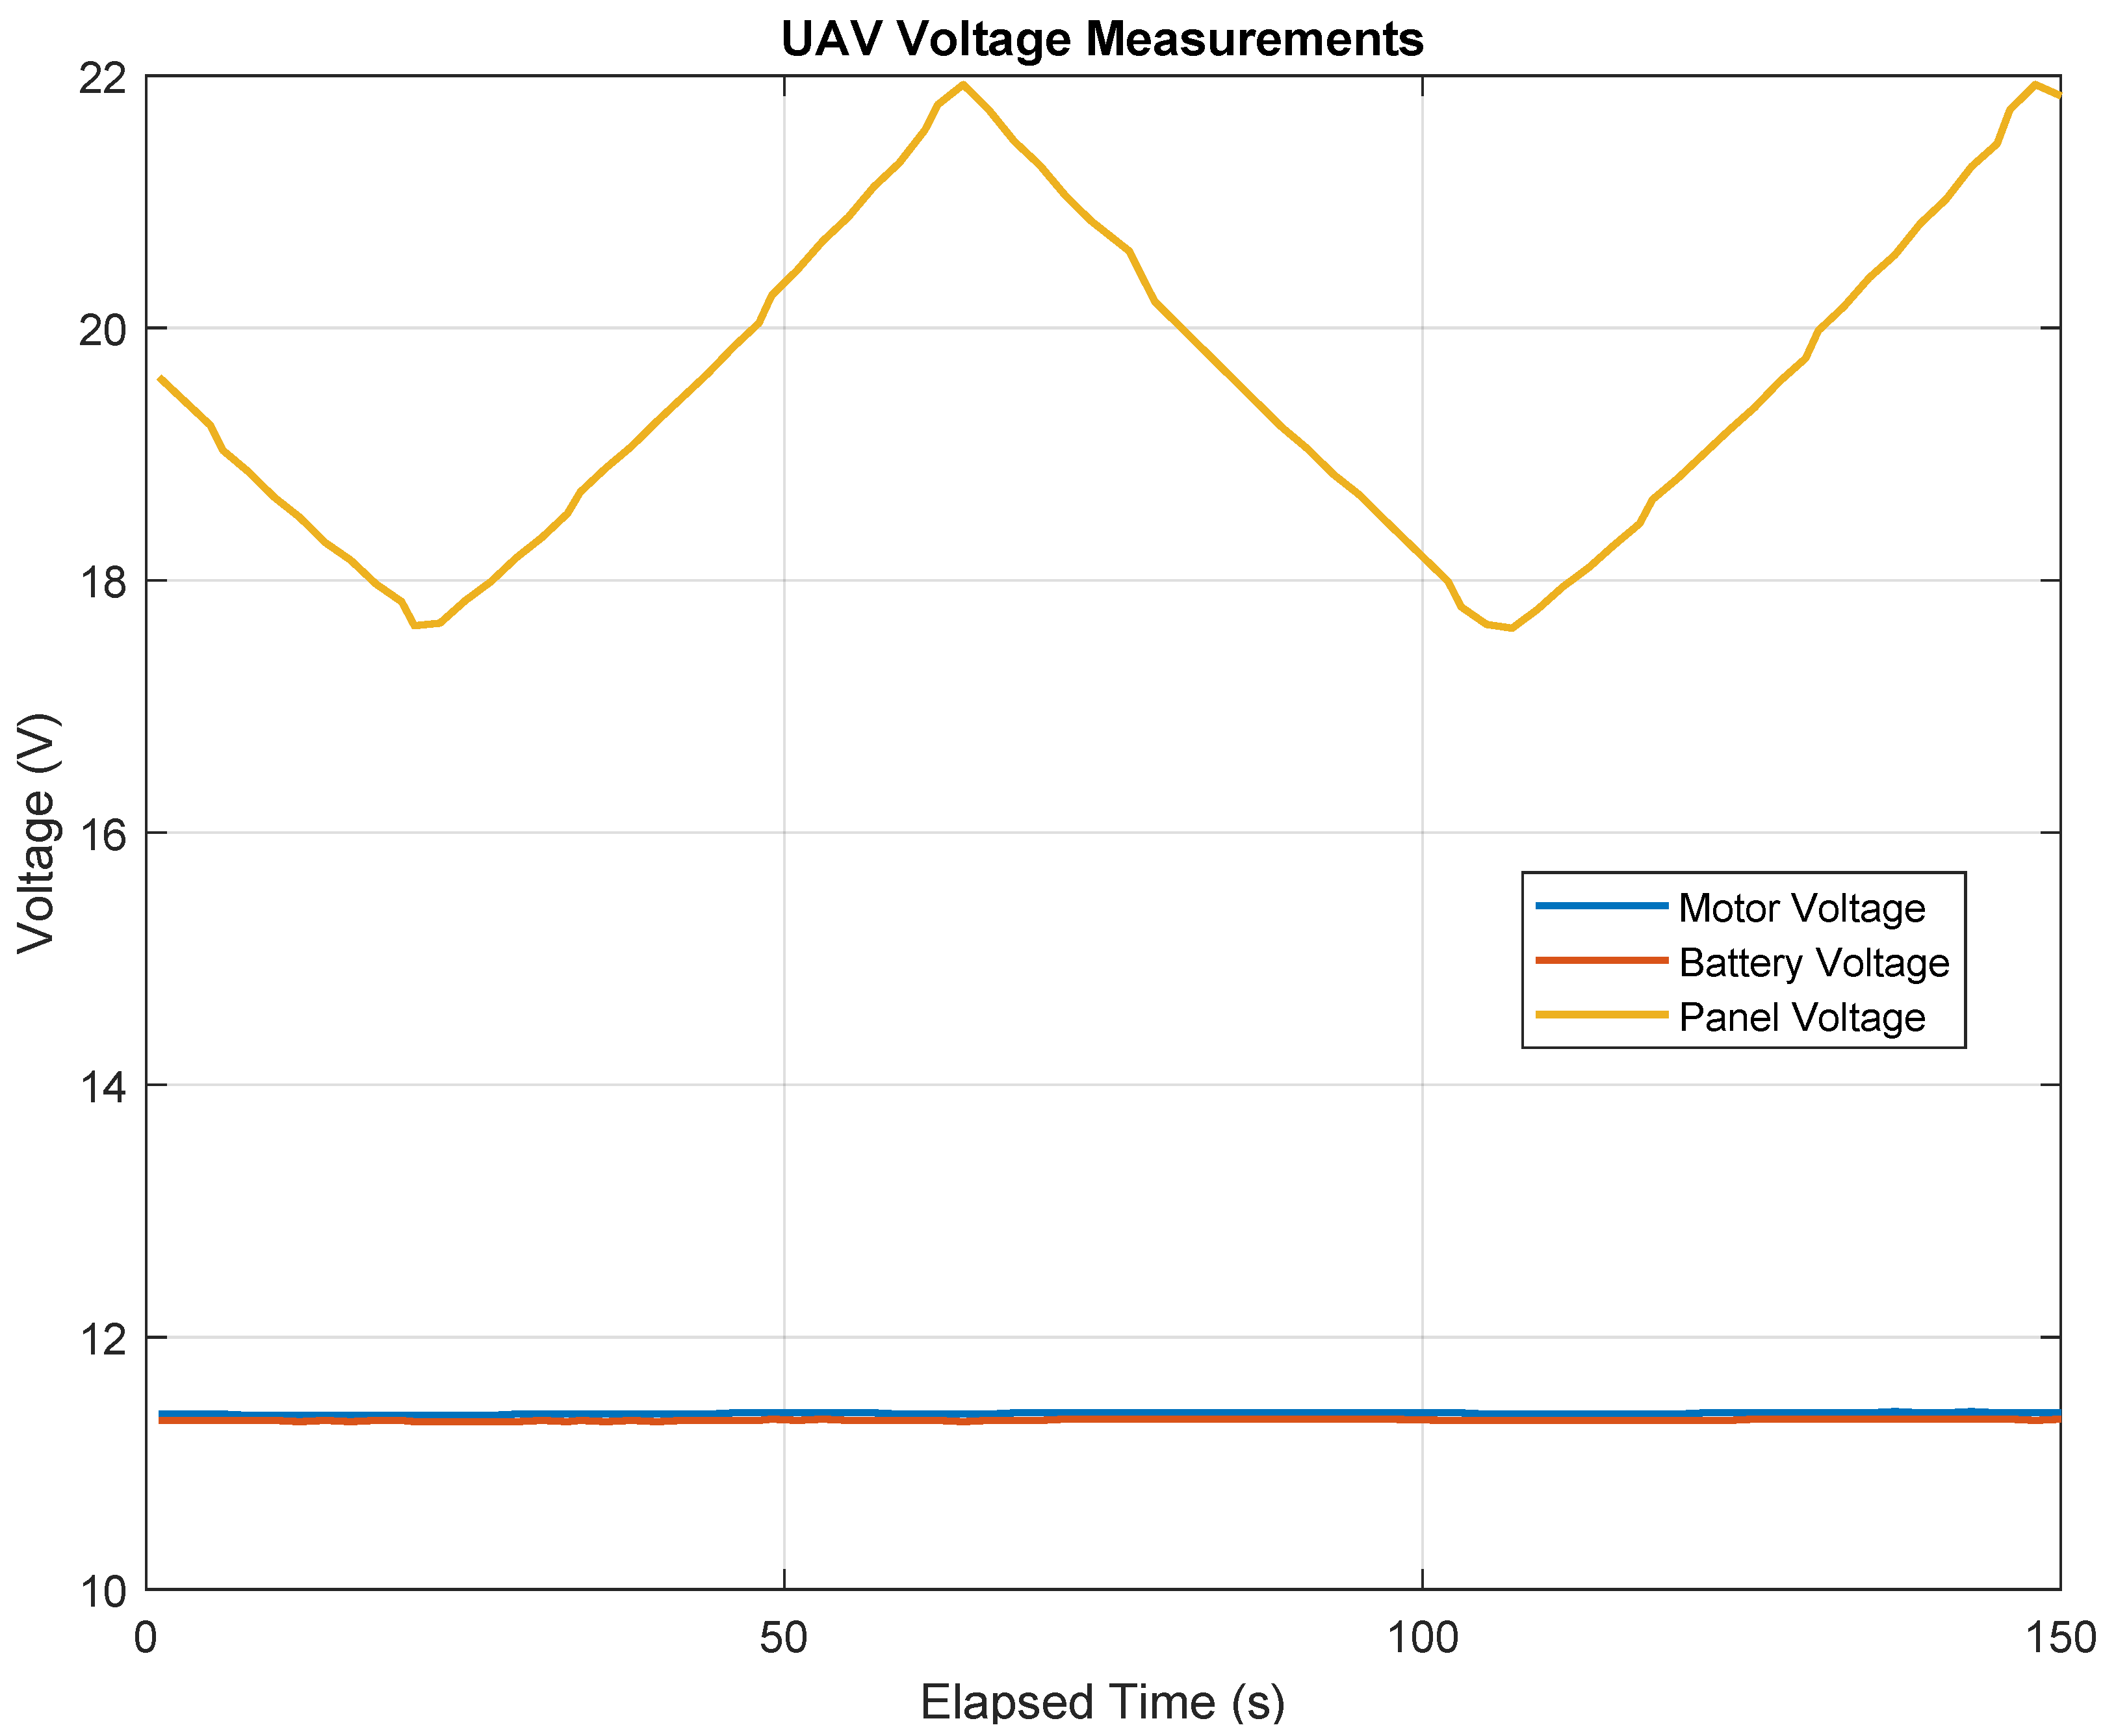
Figure 4 complements the current plot by showing the corresponding terminal voltages. The MPPT maintained the voltage from the panel, close to its maximum point value, oscillating around 19.8 V for the duration of the test, while the battery voltage stayed within 11.3 V. The motor terminals, as seen by the ESC, also remained constant around 11.3 V consistent with the observed 31 W electrical demand and the PWM duty cycle required for steady cruise. The voltage stability across all three nodes underscores both the adequacy of the wiring and the effectiveness of the MPPT controller in rapidly converging to the optimum operating point despite throttle perturbations.
In order to demonstrate the solar panel system performance dependency on weather conditions, namely the solar irradiation, a test with the same equipment but under a cloudy weather. Therefore, Figure 7 illustrates the power split in very cloudy conditions, while the throttle controller attempted to track the same 31 W setpoint.
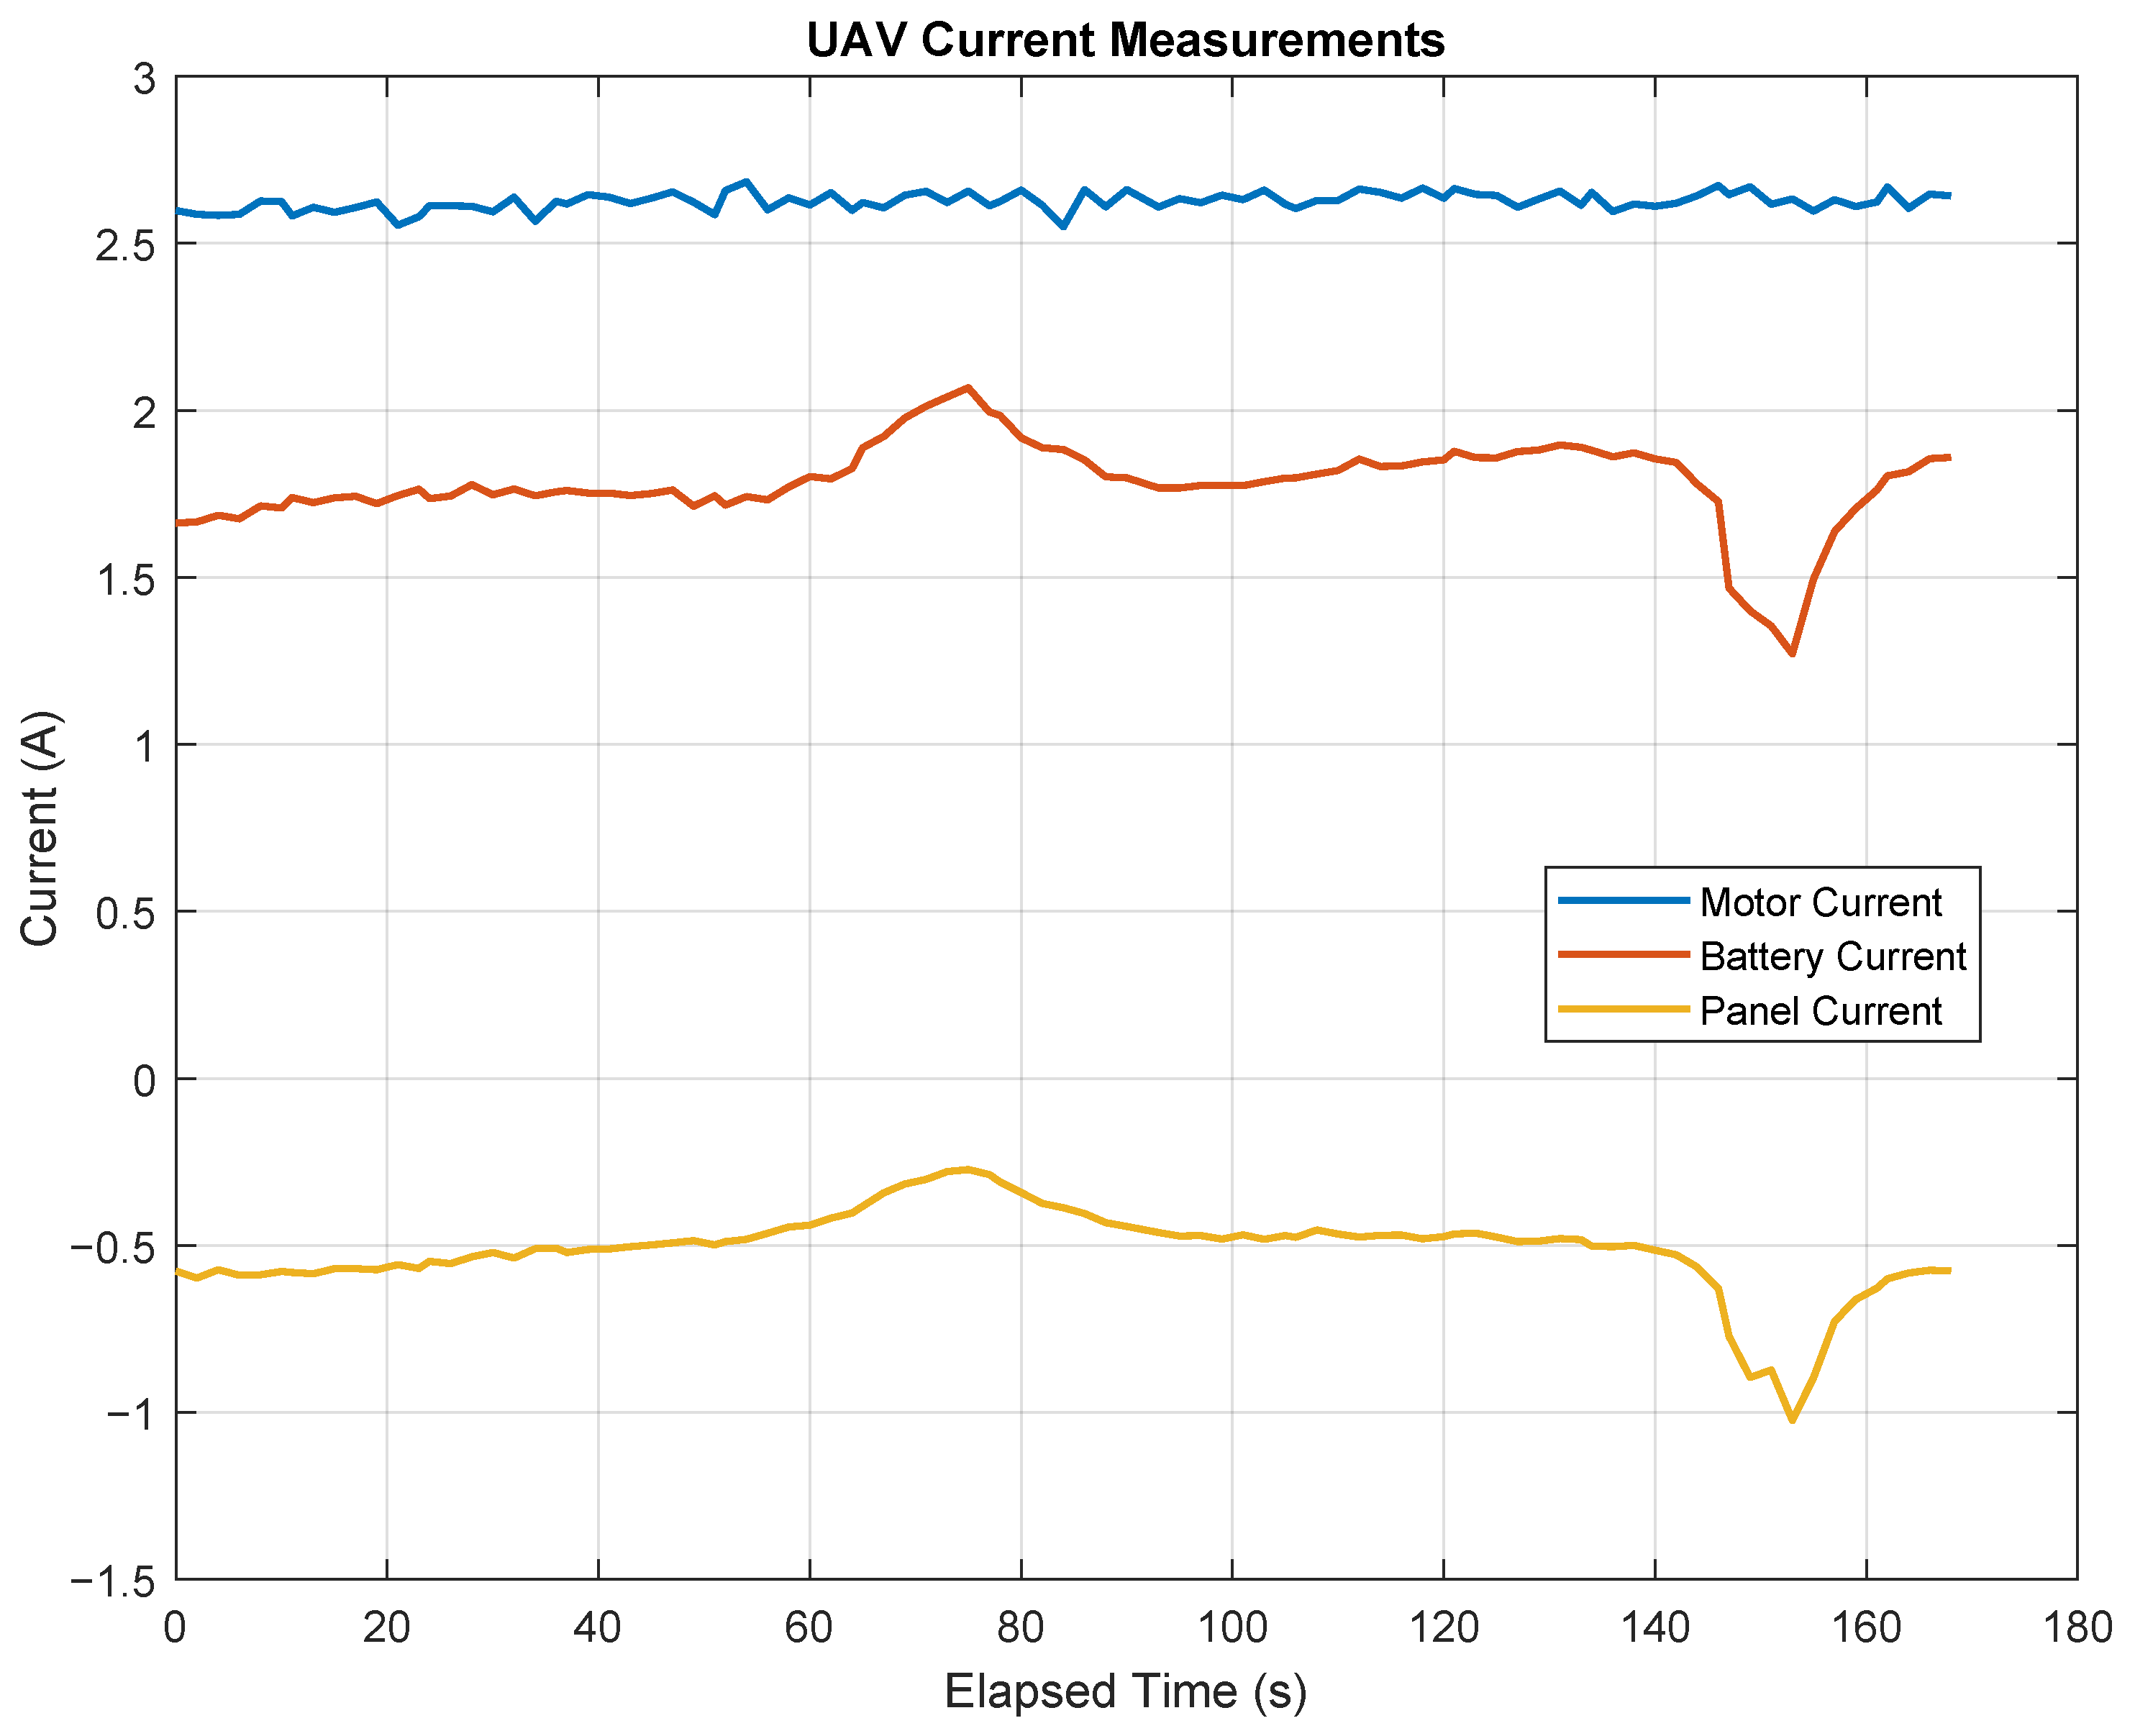
Figure 8 details the simultaneously–sampled currents at the motor, battery and panel terminals. The panel current remained almost constant at about 0.5 A, matching the 9.8 W average power and the 20 V voltage.
Figure 9 complements the current plot by showing the corresponding terminal voltages. The MPPT maintained the panel close to its maximum power point voltage, oscillating between 15 V and 25 V for the duration of the test, while the battery voltage stayed within 11.3 V. The motor terminals, as seen by the ESC, also remained constant around 11.3 V, consistent with the observed 31 W electrical demand and the PWM duty cycle required for steady cruise.

3.2. Cruise Power Summary

Table 2 compares the baseline cruise power demand (no panel) with the measured contributions of the battery and panel during the solar-assisted cruise under sunny and cloudy conditions.

3.3. Replicated Cruise Tests

Five replicated cruise tests were conducted with the solar panel and MPPT under steady conditions. All sensors were sampled every 500 ms, and the throttle was regulated to maintain the ≈31 W cruise setpoint. Using 5 s block means yields N = 562 observations across all runs. Ambient irradiance and air temperature during the test periods, obtained from the Portuguese Institute for Sea and Atmosphere (IPMA) database [34], are summarized in Table 3. Average irradiance ranged from 702 to 791 W/m2 and ambient temperature from 24 to 25 °C, providing context for the variability observed between runs.

3.4. Per-Run Power Traces

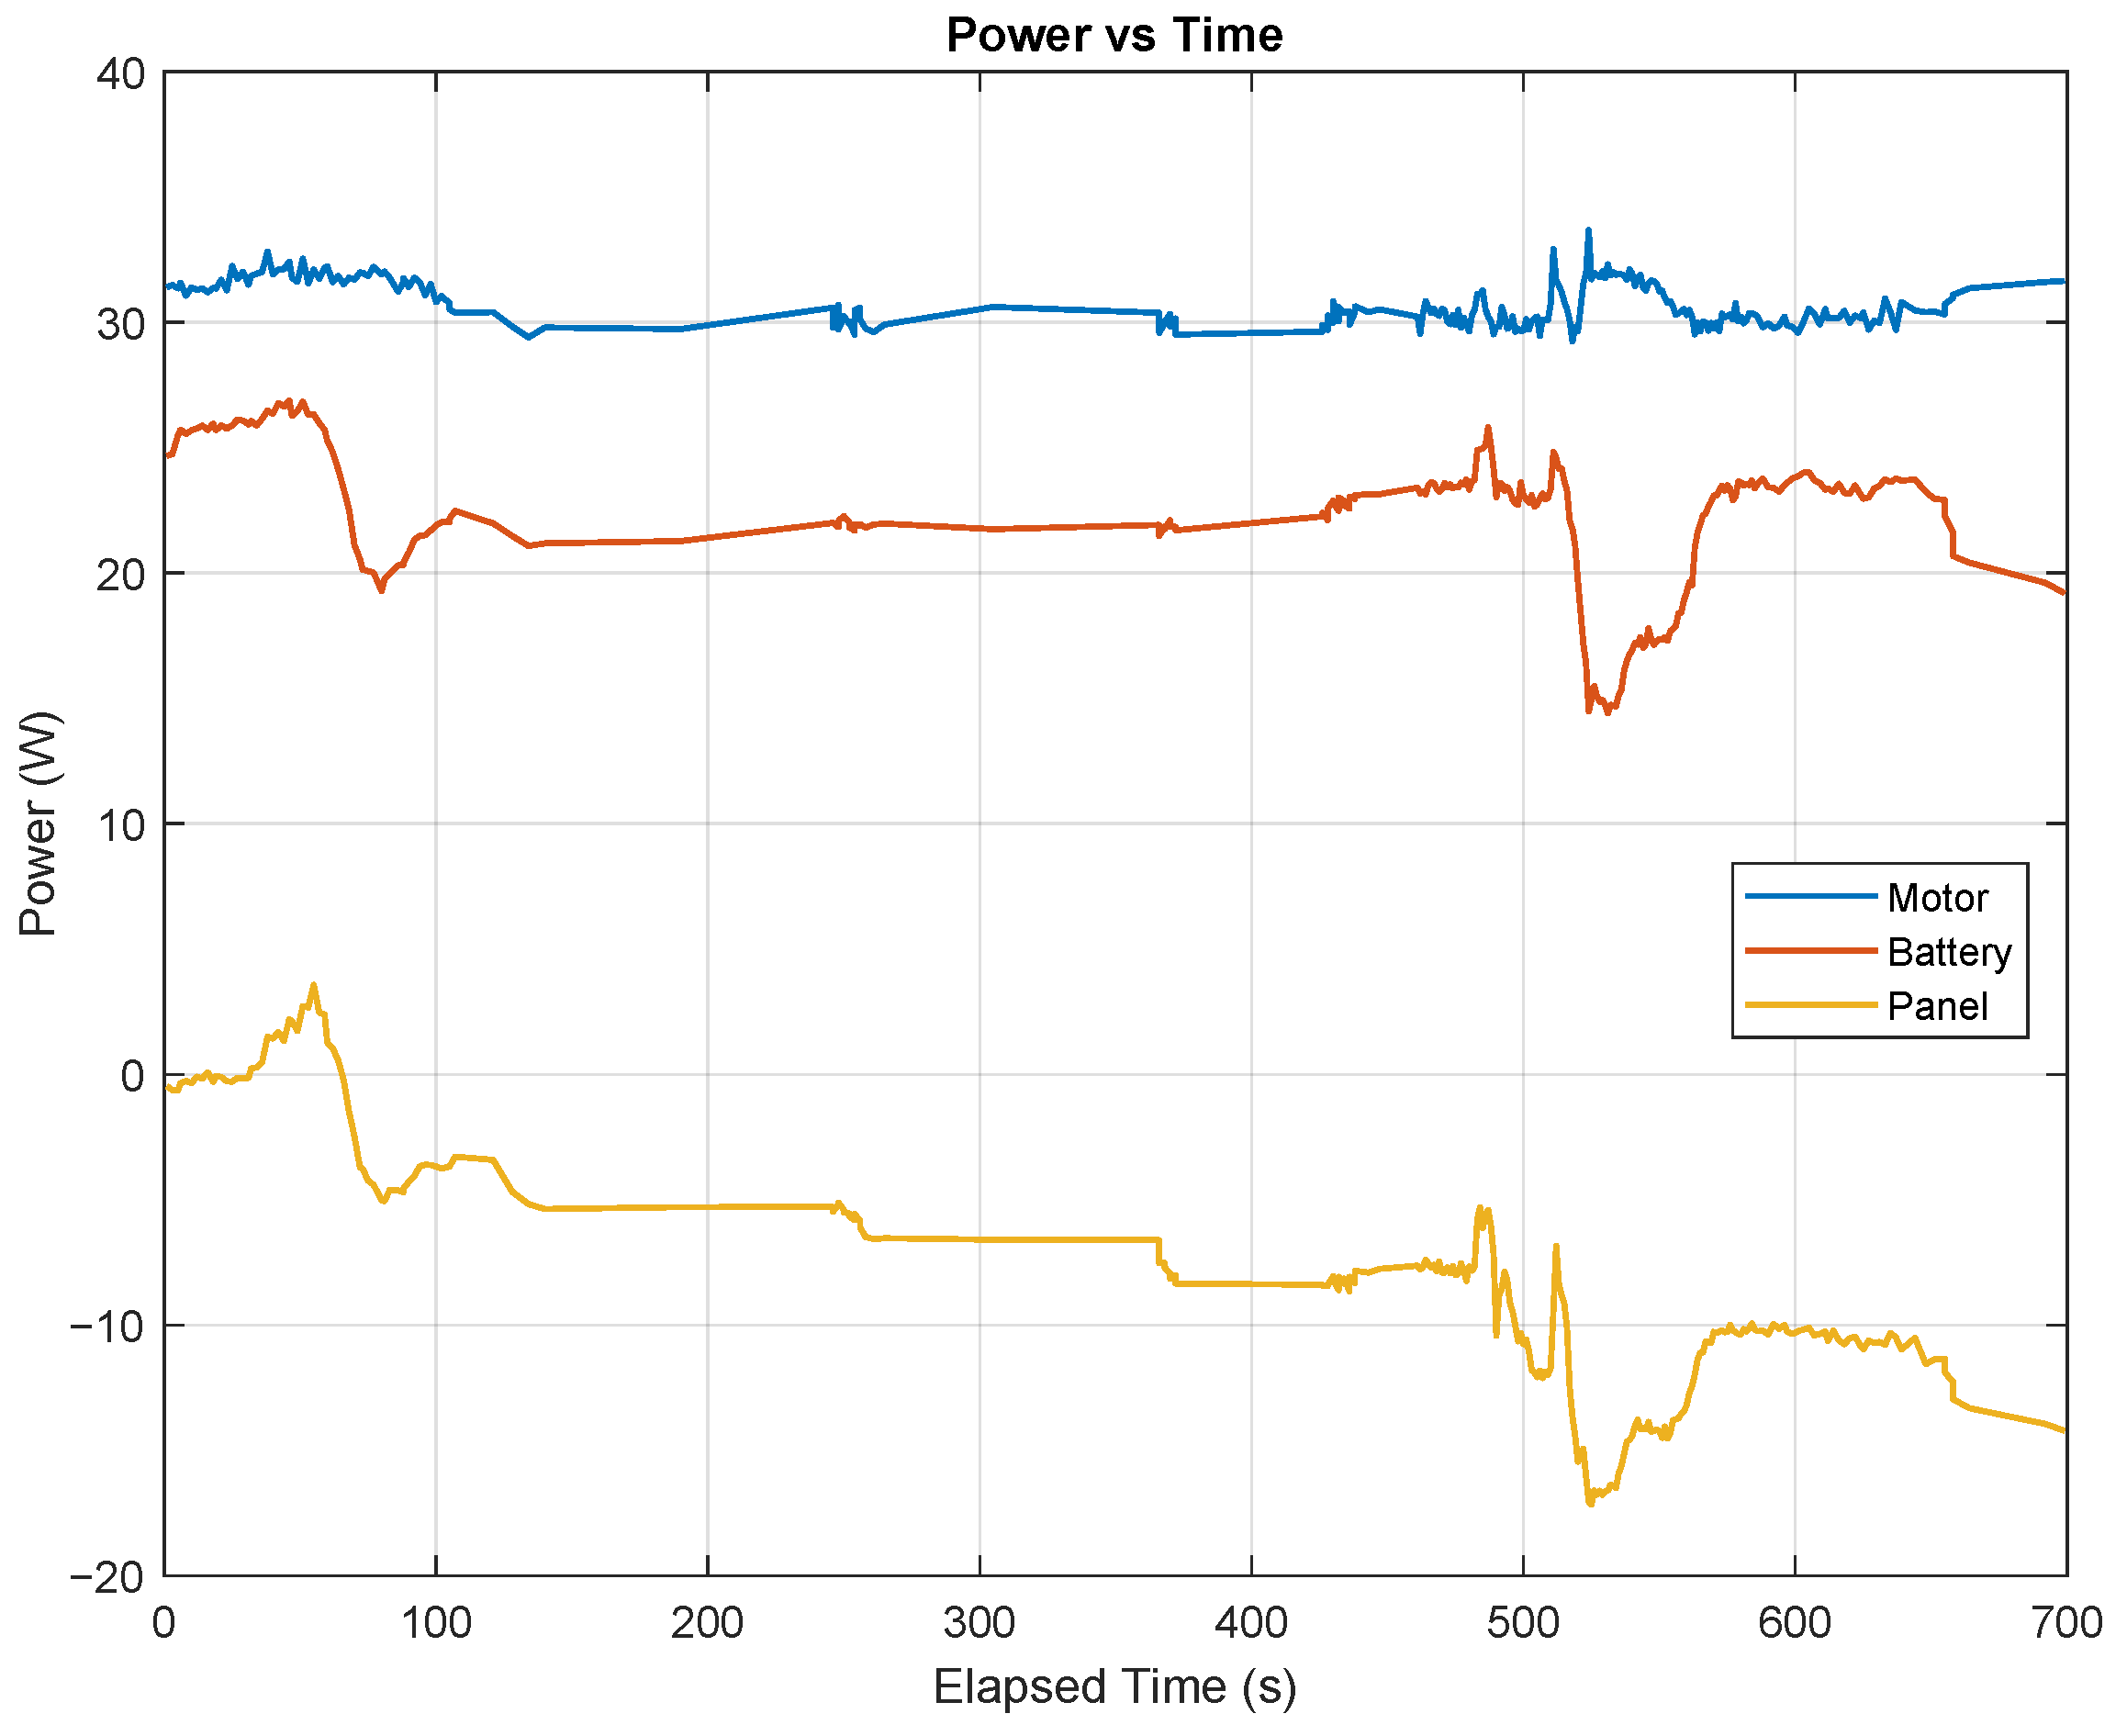
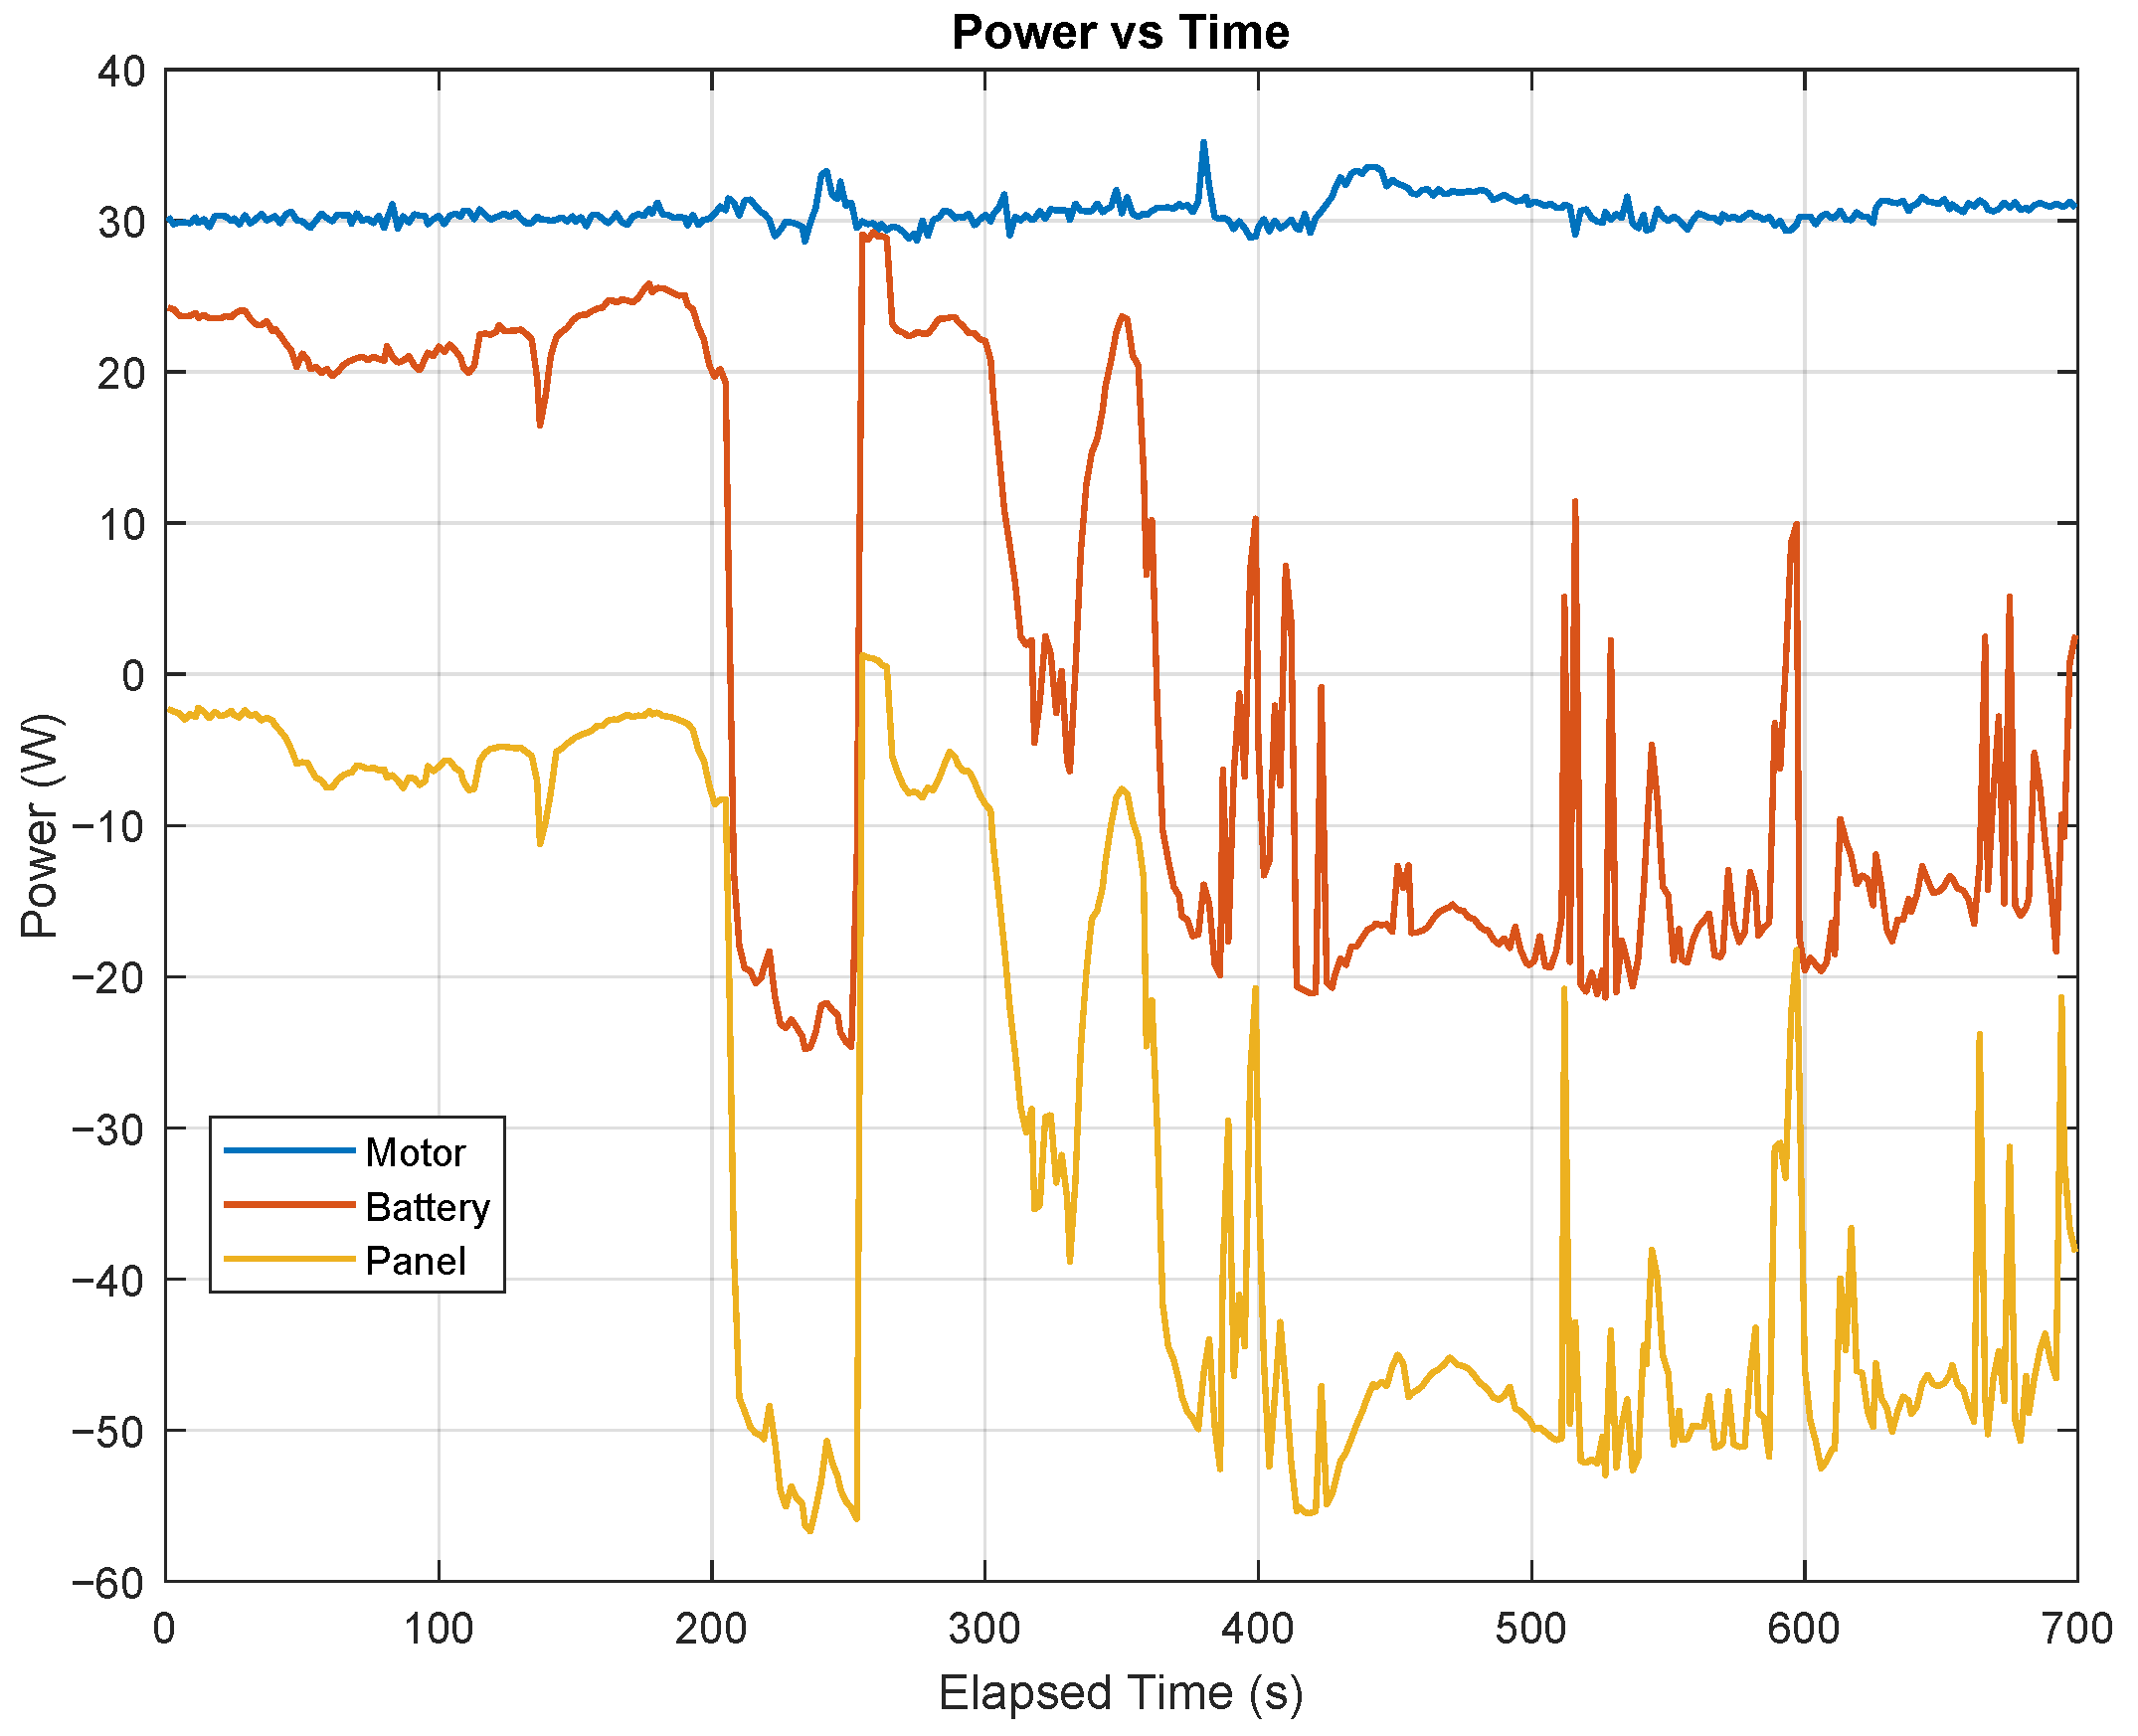
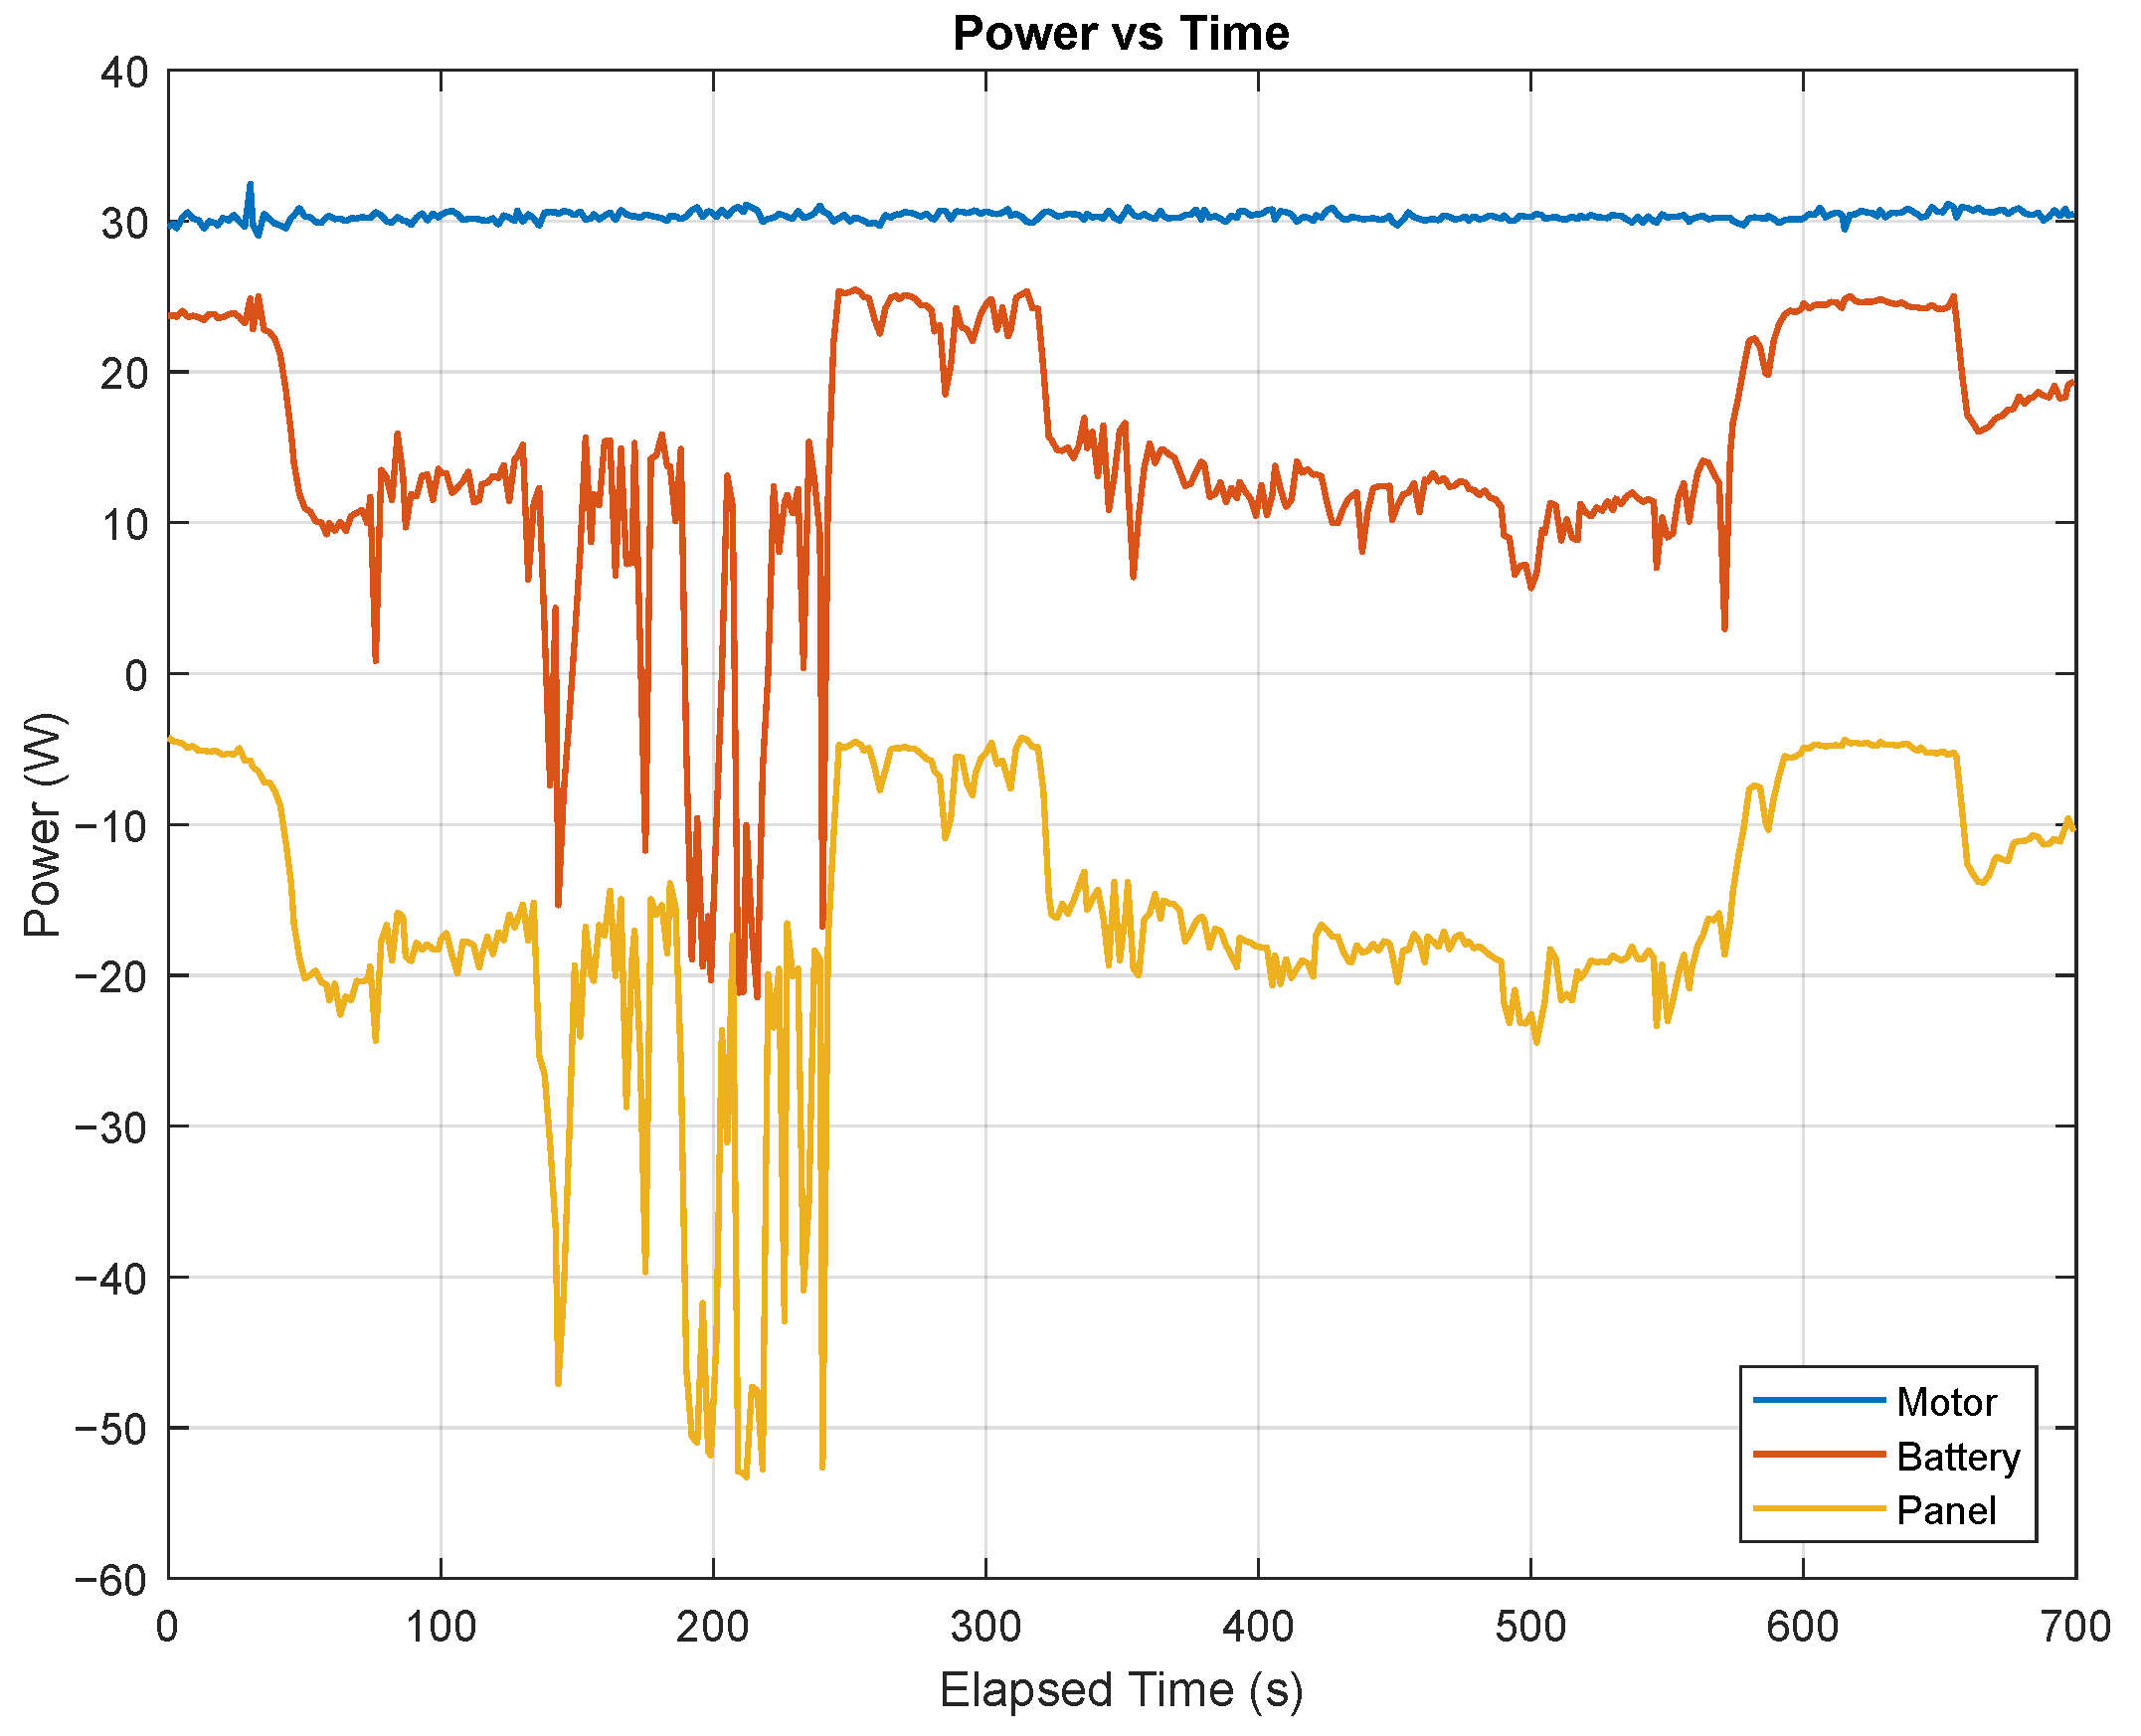
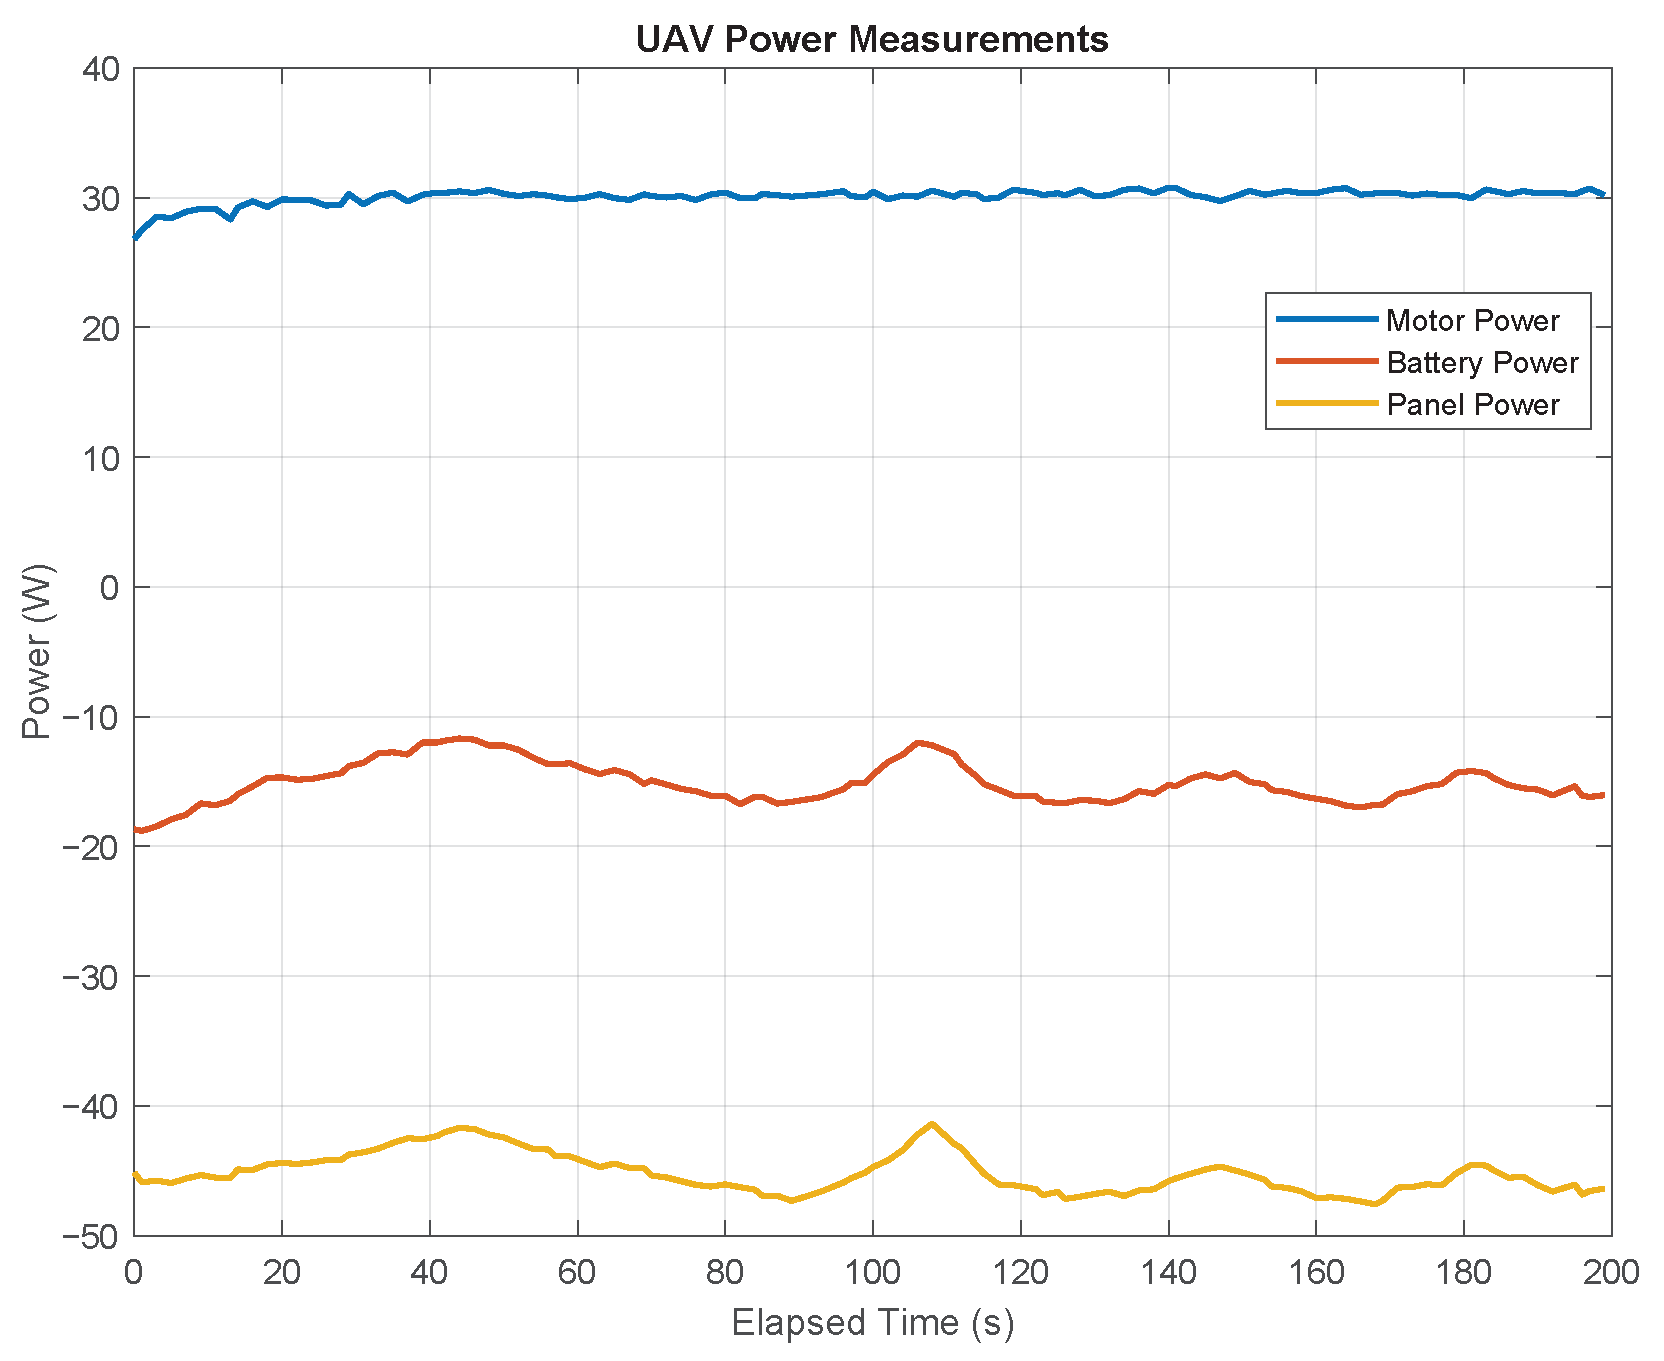
Figure 10, Figure 11, Figure 12, Figure 13 and Figure 14 show the instantaneous power traces (motor, battery, and panel) for the five runs. Despite natural variability in irradiance, the closed-loop controller maintained the commanded motor load, while the partition between panel and battery contributions shifted significantly between runs.

3.5. Aggregate Statistics

Across all five runs, the mean battery power (block means) was P ¯ bat = 10.32 ± 1.16 W (mean ± 95%CI) and the mean bus-side panel contribution (magnitude) was | P ¯ panel | = 20.08 ± 1.20 W, summing to ≈30.4 W, consistent with the imposed cruise load.
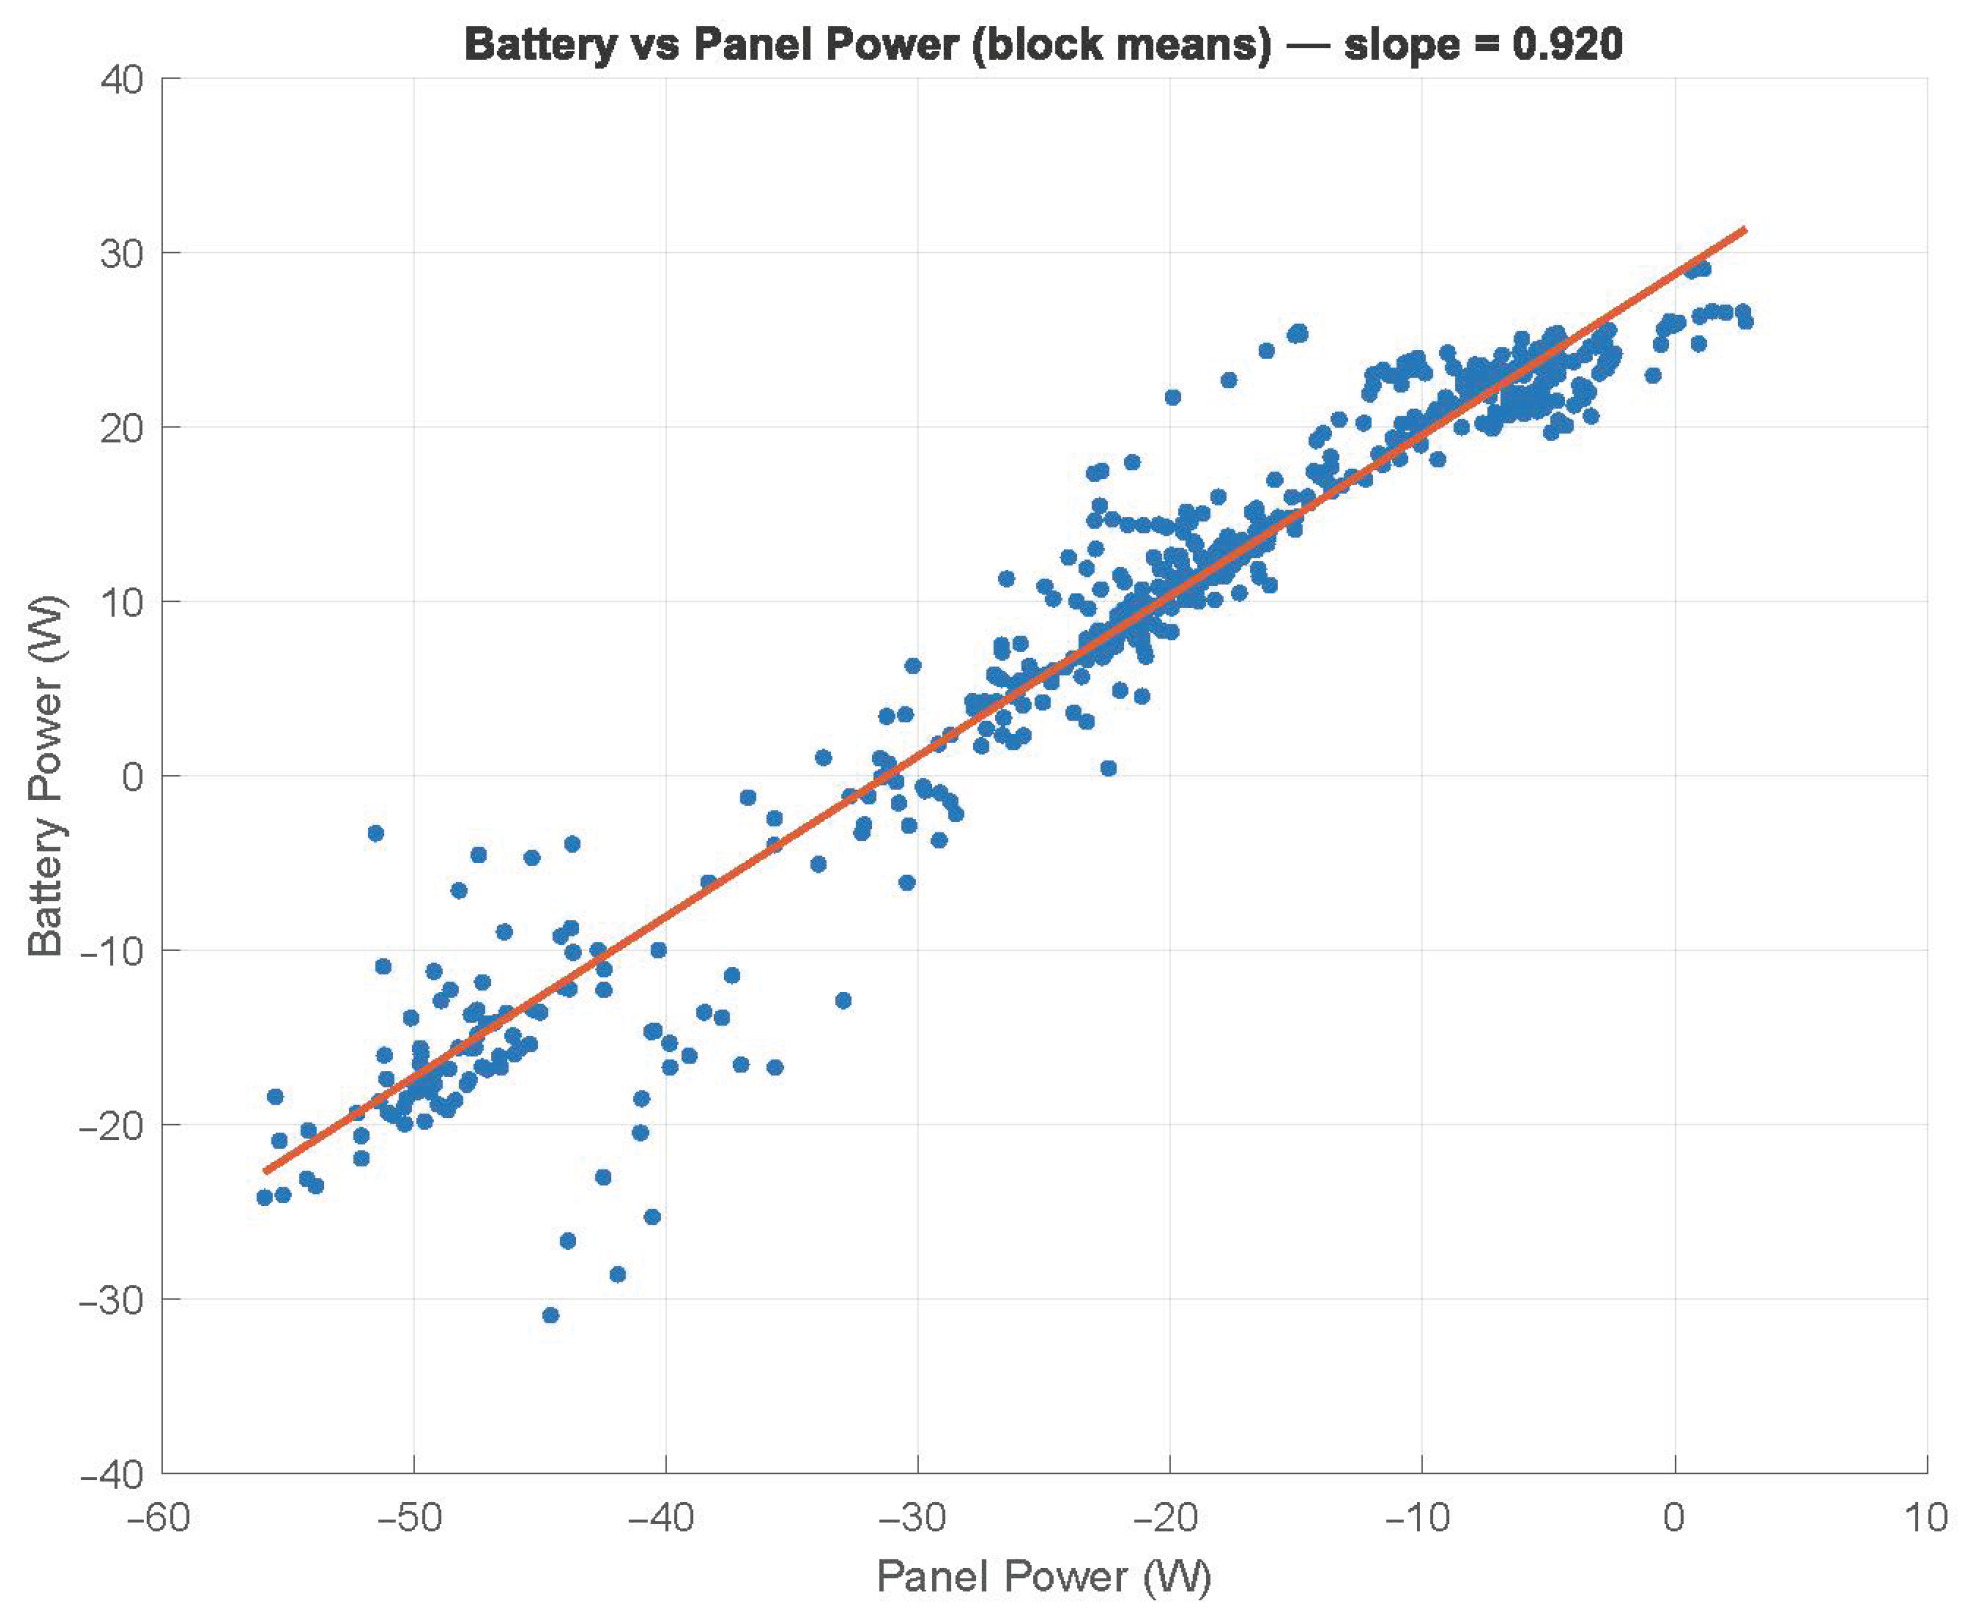
A robust linear regression quantifies the substitution between panel and battery powers at cruise, calculated as follows:
P bat = 29.11 [ 28.63 , 29.60 ] 0.936 [ 0.916 , 0.956 ] P panel , R 2 = 0.94 ,
where brackets indicate 95% confidence intervals. Thus, each additional 1 W of solar bus power reduces battery draw by ≈0.94 W, leaving a small residual consistent with drivetrain and conversion losses. The regression relationship is illustrated in Figure 15.

3.6. Per-Run Summary

Table 4 reports the per-run mean battery and panel powers with 95% confidence intervals. Table 5 presents the endurance proxy assuming a nominal 100 Wh battery capacity.

3.7. Significance of Differences

Between-run differences are statistically significant (ANOVA: F ( 4557 ) = 48.53 , p = 4.97 × 10 35 ; Kruskal–Wallis: H = 127.65 , p = 1.24 × 10 26 ), as expected given natural variability in solar irradiance (702–791 W/m2) and temperature (24–25 °C). Overall, the solar subsystem contributed ≈20 W on average, while the battery supplied ≈10 W, consistent with the 31 W cruise load. These replicated and statistically supported results confirm that solar input can reliably displace battery demand during cruise and even enable net recharging in favorable conditions.

3.8. Discussion of Results

The integration of the solar panel and MPPT significantly reduced net battery consumption, particularly during the cruise phase. Although the additional 1.5   k g of panel’s mass increased the overall power requirement, the in-flight energy harvested from the sunlight more than compensated for this penalty under clear-sky conditions. Consequently, the hybrid configuration is attractive for long-range or repetitive sorties where battery turnaround time is critical.
As the data reveal, in cloudy weather conditions, the power harvested by the solar panel is enough to compensate for the addition of its system mass to the UAV. The values registered during the test performed under these conditions (Figure 9) show some fluctuations corresponding to slight luminosity variations that were apparent while the test was carried out.
Overall, the experimental results indicate that solar power incorporation can substantially improve battery longevity and mission flexibility, provided that sufficient solar irradiance is available to counterbalance the system’s additional mass.

3.9. Sensitivity Analysis and Correction Directions

Although the present results were obtained from controlled bench tests, simple sensitivity analyses can be used to approximate the baseline data towards realistic flight scenarios. Three representative factors were considered: structural reinforcement penalties, pitch/roll attitude variations, and drag increments due to gusts or climb or descent phases. These analyses provide a tolerance envelope for the endurance benefit of the solar subsystem.
First, while the direct payload mass of the PV module is 1.5 kg , its installation in a real UAV may require structural reinforcement of the wing box or fuselage attachment points, thereby increasing the effective payload penalty. The magnitude of this additional mass depends strongly on the choice of materials and structural design: lightweight composites may limit the penalty, whereas conventional metallic reinforcements may significantly increase it. To quantify this effect, we considered a conservative scenario in which reinforcement adds + 0.5 kg , raising the total system mass from 5.5 kg to 6.0 kg . The electrical cruise power was obtained from the steady-level flight model. For a UAV of mass m, lift balance yields the trimmed velocity, calculated as follows:
V ( m ) = 2 m g ρ S C L ,
which, substituted into the drag power expression, gives
P electrical ( m ) = 1 η C D C L 3 / 2 ( m g ) 3 / 2 ρ S .
Since P m 3 / 2 for fixed coefficients, a mass increase from 5.5 kg (baseline 31 W ) to 6.0 kg leads to the following:
P electrical ( 6.0 kg ) 31 W × 6.0 5.5 3 / 2 35 W .
Depending on the assumed propulsive efficiency ( η = 0.90 –0.95) or small variations in C D , this estimate ranges from 33 to 35 W , consistent with the value reported in the sensitivity analysis. Under sunny conditions, the panel delivered ≈40 W bus-side output, which still covers the increased cruise demand with margin, maintaining the possibility of battery recharge. Under cloudy conditions (≈10 W panel output), the increased requirement implies that the battery must now supply ≈23 W instead of ≈20 W . Extrapolating linearly, additional reinforcement above + 1.5 kg (total mass ≈7.0 kg ) would raise the cruise requirement beyond the observed ≈40 W solar capability under clear skies, making battery-neutral operation unachievable. This sensitivity analysis shows that moderate structural penalties do not invalidate the endurance benefit, but excessive reinforcement would limit the solar advantage.
Second, attitude excursions reduce the effective projected area of the panel. Geometrically, the captured irradiance scales as cos ( θ ) with incidence angle θ . For θ = ± 10 ° , the reduction is only 1.5 % , while at ± 20 ° it is 6 % . With a nominal 40 W output this corresponds to ≈37.6 W , which still exceeds the 31 W cruise requirement.
Empirical results confirm this trend: Under irradiance 802 W / m 2 and ambient temperature 29   ° C , the panel delivered ≈45.2 W at 0 ° incidence (motor demand 30.1 W and net battery charging 15.1 W ; see Figure 16) and ≈39.5 W at 35 ° incidence (motor demand 31.9 W and net charging 7.7 W ; Figure 17). These measurements demonstrate that moderate attitude deviations do not eliminate the endurance benefit.
Finally, to assess whether the additional mass due to the PV integration materially penalises the mission, we compute the incremental energy required during takeoff and initial climb. The kinetic energy gained during the takeoff run, from rest ( V = 0 m / s ) to V to , is calculated as follows:
E KE ( m ) = 1 2 m V to 2 , V to 1.2 V stall = 1.2 2 m g ρ S C L , max .
Thus, for fixed ( ρ , S , C L , max ) , E KE m 2 because V to m . The incremental kinetic energy from the no-panel configuration ( m 0 = 4.0 kg ) to the panel configuration ( m 1 = 5.5 kg ) is calculated as follows:
Δ E KE = 1 2 m 1 V to ( m 1 ) 2 1 2 m 0 V to ( m 0 ) 2 .
Using the same atmospheric and geometric parameters adopted in this work ( ρ = 1.293 kg / m 3 , S = 0.5 m 2 ) and a representative C L , max = 1.4 for small fixed-wing UAVs, we obtain the following:
Δ E KE 222 J .
The incremental potential energy to climb a clearance height of h is purely linear in the added mass Δ m :
Δ E PE = Δ m g h , Δ m = 1.5 kg .
For a clearance height of h = 50 m , one obtains Δ E PE 736 J . Hence, a realistic aggregate takeoff overhead lies in the following calculation:
Δ E TO Δ E KE + Δ E PE 958 J = 0.27 Wh .
Relative to the cruise power budget of ≈31 W established in Section 2, this overhead is equivalent to only the following value:
t eq = Δ E TO P cruise 31 s
of steady cruise. For a 10 min (600 s) cruise segment, the extra takeoff energy represents merely 5.1 % of the segment energy ( 31 W × 600 s = 18.6 kJ ), and for 30 min it drops to 1.7 % .

3.10. Practical Considerations

The implementation of this solar-powered system could be advantageous in multiple UAV operation scenarios. Navy patrol or search missions, terrain reconnaissance, and wildfire monitoring, among others, would benefit from the increase in flight endurance that such a system enables. The increase in UAV mass should be considered not only during electric motor and propeller selection but also when designing the wing structure and root area, as well as in the tuning of flight dynamics control due to the consequent shift in the center of gravity. These structural project changes must be adapted to operational requirements, for example, whether a short runway is available for takeoff and landing procedures or whether the UAV is to be launched by catapult and recovered with a net. Such detailed structural and operational design analysis is outside the scope of this document.
The present results are restricted to ground-based bench tests under a regulated cruise load. While this apparatus isolates the electrical power split between solar input and the battery, it cannot replicate vibration, attitude variation, or dynamic inflow conditions of real flight. Likewise, dynamic phases such as takeoff, climb, gust response, and secondary penalties from structural reinforcement were not captured. These factors influence both aerodynamic efficiency and the MPPT’s voltage–current behavior. The findings should therefore be interpreted as a controlled proof of concept: solar input can offset the additional payload mass under steady cruise regulation. Future work will include repeated runs for statistical robustness and flight campaigns to validate the system in realistic aerodynamic and environmental conditions.

4. Conclusions

The present study compared a UAV propulsion system with and without a solar panel and MPPT using identical mission profiles. Despite the increased throttle requirements due to the added panel mass, the solar-assisted configuration markedly reduced net battery discharge during cruise. In some flight segments, solar generation even exceeded the motor’s instantaneous load, yielding in-flight battery recharging. By contrast, the panel-less setup was entirely dependent on battery energy, resulting in faster battery capacity depletion. These findings underscore that, while a solar-assisted system has higher initial demands, the potential for in-flight recharging can extend overall flight endurance, provided that sufficient irradiance is verified.

Author Contributions

Conceptualization, P.F. and F.R.; methodology, P.F., R.S. and F.R.; software, P.F.; investigation, R.S.; resources, R.S.; writing—original draft preparation, P.F.; writing—review and editing, R.S. and F.R.; supervision, F.R. All authors have read and agreed to the published version of the manuscript.

Funding

This work was supported by Fundação para a Ciência e a Tecnologia (FCT), Portugal, under the project CTS/00066.

Institutional Review Board Statement

Not applicable.

Informed Consent Statement

Not applicable.

Data Availability Statement

The data presented in this study are openly available in the GitHub repository ffcrego87/data_solar at https://github.com/ffcrego87/data_solar.git (version v1.0.0, commit c27640b, accessed on 20 September 2025).

Conflicts of Interest

The authors declare no conflicts of interest.

Abbreviations

The following abbreviations are used in this manuscript:
UAVUnmanned Aerial Vehicle
PVPhotovoltaic
CIGSCopper Indium Gallium Selenide
MPPTMaximum Power Point Tracking
LiPoLithium–Polymer (battery)
ESCElectronic Speed Controller
PWMPulse Width Modulation
PCPersonal Computer
DCDirect Current
XFLR5Open-Source X-Foil-Based Aerodynamic Analysis Tool
VmpVoltage at Maximum Power

References

  1. Diogo, C.M.A.; Fernandes, E.C. A Mass, Fuel, and Energy Perspective on Fixed-Wing Unmanned Aerial Vehicle Scaling. Drones 2024, 8, 396. [Google Scholar] [CrossRef]
  2. Mitzi, D.B.; Yuan, M.; Liu, W.; Kellock, A.J.; Chey, S.J.; Gignac, L.; Schrott, A.G. Hydrazine-based deposition route for device-quality CIGS films. Thin Solid Film. 2009, 517, 2158–2162. [Google Scholar] [CrossRef]
  3. Chawla, R.; Singhal, P.; Garg, A.K. Photovoltaic review of all generations: Environmental impact and its market potential. Trans. Electr. Electron. Mater. 2020, 21, 456–476. [Google Scholar] [CrossRef]
  4. Yang, D.; Yang, R.; Priya, S.; Liu, S. Recent advances in flexible perovskite solar cells: Fabrication and applications. Angew. Chem. Int. Ed. 2019, 58, 4466–4483. [Google Scholar] [CrossRef] [PubMed]
  5. Dallaev, R.; Pisarenko, T.; Papež, N.; Holcman, V. Overview of the Current State of Flexible Solar Panels and Photovoltaic Materials. Materials 2023, 16, 5839. [Google Scholar] [CrossRef] [PubMed]
  6. Dui, H.; Zhang, C.; Bai, G.; Chen, L. Mission reliability modeling of UAV swarm and its structure optimization based on importance measure. Reliab. Eng. Syst. Saf. 2021, 215, 107879. [Google Scholar] [CrossRef]
  7. Shiau, J.K.; Ma, D.M.; Yang, P.Y.; Wang, G.F.; Gong, J.H. Design of a solar power management system for an experimental UAV. IEEE Trans. Aerosp. Electron. Syst. 2009, 45, 1350–1358. [Google Scholar] [CrossRef]
  8. Hohm, D.; Ropp, M.E. Comparative study of maximum power point tracking algorithms. Prog. Photovoltaics Res. Appl. 2003, 11, 47–62. [Google Scholar] [CrossRef]
  9. de Carvalho Bertoli, G.; Pacheco, G.M.; Adabo, G.J. Extending flight endurance of electric unmanned aerial vehicles through photovoltaic system integration. In Proceedings of the 2015 International Conference on Renewable Energy Research and Applications (ICRERA), Palermo, Italy, 22–25 November 2015; pp. 143–147. [Google Scholar] [CrossRef]
  10. Boucher, R.J. History of solar flight. In Proceedings of the AIAA/SAE/ASEE Joint Propulsion Conference, Cincinnati, OH, USA, 11–13 June 1984; pp. 1429–1438. [Google Scholar] [CrossRef]
  11. Thirugnanasambandam, M.; Iniyan, S.; Goic, R. A review of solar thermal technologies. Renew. Sustain. Energy Rev. 2010, 14, 312–322. [Google Scholar] [CrossRef]
  12. Heutger, M.; Kückelhaus, M. Unmanned Aerial Vehicles in Logistics: A DHL Perspective on Implications and Use for the Logistics Industry, 2014. Available online: https://www.dhl.com/discover/content/dam/dhl/downloads/interim/full/dhl-trend-report-uav.pdf (accessed on 20 September 2025).
  13. Anderson, M. Amazon Seeks FAA Approval to Test Delivery Drones Outdoors. The Seattle Times, 2014 July 11. [Google Scholar]
  14. Thiels, C.A.; Aho, J.M.; Zietlow, S.P.; Jenkins, D.H. Use of unmanned aerial vehicles for medical product transport. Air Med. J. 2015, 34, 104–108. [Google Scholar]
  15. Goodchild, A.; Toy, J. Delivery by drone: An evaluation of unmanned aerial vehicle technology in reducing CO2 emissions in the delivery service industry. Transp. Res. Part D Transp. Environ. 2018, 61, 58–67. [Google Scholar] [CrossRef]
  16. Wang, X.; Poikonen, S.; Golden, B. The vehicle routing problem with drones: Several worst-case results. Optim. Lett. 2017, 11, 679–697. [Google Scholar] [CrossRef]
  17. Lei, Z. Development of a Solar-Powered unmanned aerial vehicle. In Proceedings of the 52nd Aerospace Sciences Meeting, National Harbor, ML, USA, 13–17 January 2014; p. 0539. [Google Scholar]
  18. Choi, Y.; Schonfeld, P.M. Optimization of multi-package drone deliveries considering battery capacity. In Proceedings of the 96th Annual Meeting of the Transportation Research Board, Washington, DC, USA, 8–12 January 2017; pp. 8–12. [Google Scholar]
  19. Baroutaji, A.; Wilberforce, T.; Ramadan, M.; Olabi, A.G. Comprehensive investigation on hydrogen and fuel cell technology in the aviation and aerospace sectors. Renew. Sustain. Energy Rev. 2019, 106, 31–40. [Google Scholar] [CrossRef]
  20. Romeo, G.; Frulla, G.; Cestino, E. Design of a high-altitude long-endurance solar-powered unmanned air vehicle for multi-payload and operations. Proc. Inst. Mech. Eng. Part G J. Aerosp. Eng. 2007, 221, 199–216. [Google Scholar] [CrossRef]
  21. Baharozu, E.; Soykan, G.; Ozerdem, M.B. Future aircraft concept in terms of energy efficiency and environmental factors. Energy 2017, 140, 1368–1377. [Google Scholar] [CrossRef]
  22. Escarti, F. Boeing fuel cell plane in manned aviation first. Fuel Cells Bull. 2008, 4, 70146–70149. [Google Scholar]
  23. Barrett, S. First flight of DLR’s HY4 fuel cell light aircraft. Fuel Cells Bull. 2016, 2016, 1. [Google Scholar] [CrossRef]
  24. Meyer, J.; Du Plessis, J.; Ellis, P.; Clark, W. Design considerations for a low altitude long endurance solar powered unmanned aerial vehicle. In Proceedings of the AFRICON 2007, Windhoek, South Africa, 26–28 September 2007; pp. 1–7. [Google Scholar]
  25. Montgomery, S.; Mourtos, N. Design of a 5 kilogram solar-powered unmanned airplane for perpetual solar endurance flight. In Proceedings of the 49th AIAA/ASME/SAE/ASEE, San Jose, CA, USA, 15–17 July 2013; p. 3875. [Google Scholar]
  26. Cui, Y.; Chen, J.; Lin, H.; Shu, Z.; Huang, T. Cooperative Multi-AAV Path Planning for Discovering and Tracking Multiple Radio-Tagged Targets. IEEE Trans. Syst. Man Cybern. Syst. 2025, 55, 2463–2475. [Google Scholar] [CrossRef]
  27. Cui, Y.; Cheng, L.; Basin, M.; Wu, Z. Distributed Byzantine-resilient learning of multi-UAV systems via filter-based centerpoint aggregation rules. IEEE/CAA J. Autom. Sin. 2025, 12, 1056–1058. [Google Scholar] [CrossRef]
  28. Al Dhafari, L.S.; Afzal, A.; Al Abri, O.K.; Khan, A. Solar-powered UAVs: A systematic literature review. In Proceedings of the 2024 2nd International Conference on Unmanned Vehicle Systems-Oman (UVS), Muscat, Oman, 12–14 March 2024; pp. 1–8. [Google Scholar]
  29. Hariharan, R.; Saxena, A.; Dhote, V.; Srisathirapathy, S.; Almusawi, M.; Kumar, J.R.R. Advancements in solar-powered UAV design leveraging machine learning: A comprehensive review. In Proceedings of the E3S Web of Conferences, EDP Sciences, Dushanbe, Tajikistan, 22–24 April 2024; Volume 540, p. 02024. [Google Scholar]
  30. İlhan, C.; Çalık, Z. Solar-powered UAV: A novel approach to conceptual design. Konya J. Eng. Sci. 2024, 12, 396–409. [Google Scholar] [CrossRef]
  31. Salazar, F.; Martinez-Garcia, M.S.; de Castro, A.; Logroño, N.; Cazorla-Logroño, M.F.; Guamán-Molina, J.; Gómez, C. Optimization of the solar energy storage capacity for a monitoring UAV. Sustain. Futur. 2024, 7, 100146. [Google Scholar] [CrossRef]
  32. Zhao, L. Solar-Powered High-Altitude Drone Makes Maiden Flight. China Daily (Global Edition), 5 September 2022. Available online: https://global.chinadaily.com.cn/a/202209/05/WS63154be7a310fd2b29e75e19.html (accessed on 20 September 2025).
  33. de Brederode, V. Fundamentos de Aerodinâmica Incompressível; IST Press: Lisbon, Portugal, 1997. [Google Scholar]
  34. Instituto Português do Mar e da Atmosfera. IPMA Climate and Meteorological Data Portal, 2025. Available online: https://www.ipma.pt/ (accessed on 1 September 2025).
Figure 1. Bench test apparatus: solar panel, brushless motor, ESC, MPPT charge controller, battery pack, Arduino data logger, and laptop.
Applsci 15 10689 g001
Figure 2. Block diagram of the bench-test power train and instrumentation. Voltage dividers (V) and Hall-effect current sensors (A) on the panel, battery, and motor branches feed the Arduino logger; the MPPT controller ties all branches to a common direct-current (DC) bus while the Arduino issues the ESC throttle command.
Applsci 15 10689 g002
Figure 3. Instantaneous currents measured at the motor, battery, and panel during the solar-assisted cruise. For the battery, a positive value measured indicates discharging, a negative value indicates charging.
Applsci 15 10689 g003
Figure 4. Measured voltages at the motor, battery, and panel terminals during the solar-assisted cruise.
Applsci 15 10689 g004
Figure 5. Instantaneous solar panel power during the cruise test.
Applsci 15 10689 g005
Figure 6. Instantaneous power during the cruise test without solar panel.
Applsci 15 10689 g006
Figure 7. Instantaneous solar-panel power during the cruise test in cloudy conditions.
Applsci 15 10689 g007
Figure 8. Instantaneous currents measured at the motor, battery and panel during the solar-assisted cruise in cloudy conditions. For the battery, a positive value measured indicate discharging, a negative value indicate charging.
Applsci 15 10689 g008
Figure 9. Measured voltages at the motor, battery and panel terminals during the solar-assisted cruise under cloudy conditions.
Applsci 15 10689 g009
Figure 10. Run 1 power traces: motor, battery, and panel (5 s block means).
Applsci 15 10689 g010
Figure 11. Run 2 power traces: motor, battery, and panel (5 s block means).
Applsci 15 10689 g011
Figure 12. Run 3 power traces: motor, battery, and panel (5 s block means).
Applsci 15 10689 g012
Figure 13. Run 4 power traces: motor, battery, and panel (5 s block means).
Applsci 15 10689 g013
Figure 14. Run 5 power traces: motor, battery, and panel (5 s block means).
Applsci 15 10689 g014
Figure 15. Battery vs. panel power at cruise (5 s block means). Robust fit: P bat = 29.11 0.936 P panel , R 2 = 0.94 .
Applsci 15 10689 g015
Figure 16. Instantaneous solar-panel power during the cruise test at 0 ° incidence.
Applsci 15 10689 g016
Figure 17. Instantaneous solar-panel power during the cruise test at 35 ° incidence.
Applsci 15 10689 g017
Table 1. Replication and duration (5 s blocks).
RunNumber of BlocksApprox. Duration (min)
Run 1836.92
Run 2594.92
Run 314011.67
Run 414011.67
Run 514011.67
Total56246.85
Table 2. Cruise power summary: no-panel baseline vs. solar-assisted contributions.
ConfigurationBattery Power (W)Panel Power (W)Total Power (W)Irradiance (W/m2)Temperature (°C)
No panel (baseline)19.20.019.2--
With panel, sunny−10.240.430.293036
With panel, cloudy20.59.830.336021
Table 3. Irradiance and temperature per run (IPMA data).
RunIrradiance (W/m2)Temp (°C)
Run 1, Run 270225
Run 3, Run 475124
Run 579124
Table 4. Per-run statistics (5 s block means). Panel values shown as magnitudes (bus-side).
Run P ¯ bat (W) ± CI95 | P ¯ panel | (W) ± CI95
Run 122.41 ± 0.567.51 ± 1.07
Run 24.10 ± 4.1726.80 ± 2.25
Run 31.11 ± 3.0629.48 ± 3.42
Run 414.28 ± 1.3816.05 ± 1.54
Run 511.01 ± 1.4419.33 ± 1.52
Table 5. Battery-only endurance proxy normalized to E bat = 100 Wh ( E = 100 / P ¯ bat ).
RunEndurance (h)
Run 14.46
Run 224.36
Run 390.42
Run 47.00
Run 59.08
Disclaimer/Publisher’s Note: The statements, opinions and data contained in all publications are solely those of the individual author(s) and contributor(s) and not of MDPI and/or the editor(s). MDPI and/or the editor(s) disclaim responsibility for any injury to people or property resulting from any ideas, methods, instructions or products referred to in the content.