Article

Numerical Simulation and Empirical Validation of Casing Stability in Coalbed Methane Wells Under Mining-Induced Stress: A Case Study of Xiaobaodang Coal Mine in Yulin-Shenmu Mining Area

School of Resources and Geosciences, China University of Mining and Technology, Xuzhou 221116, China
*
Authors to whom correspondence should be addressed.
Appl. Sci. 2025, 15(19), 10674; https://doi.org/10.3390/app151910674
Submission received: 28 August 2025 / Revised: 28 September 2025 / Accepted: 29 September 2025 / Published: 2 October 2025

Abstract

This study addresses the issue of coordinated development of coal, oil, and gas resources in the Yulin-Shenmu Coalfield. Taking the 132,201 working face of the Xiaobaodang No. 1 Coal Mine as a case study, the study combines FLAC3D numerical simulation with on-site monitoring to analyze the impact of mining activities on the stability of gas well casings. Simulation results indicate that mining activities cause stress redistribution in the surrounding rock, with a maximum shear stress of 5.8 MPa, which is far below the shear strength of the casing. The maximum horizontal displacement of the wellbore is only 23 mm, with uniform overall deformation and no shear failure. On-site monitoring showed that the airtightness was intact, and the wellbore diameter test did not detect any destructive damage such as deformation or cracks. Concurrently, fiber optic strain monitoring of the inner and outer casings aligns with simulation results, confirming no significant instability caused by mining activities. The conclusion is that mining activities have a negligible impact on the stability of the gas well casing-concrete composite structure. The dual casing-cement ring structure effectively coordinates deformation to ensure safety. This finding provides a reliable technical basis for the coordinated exploitation of coal, oil and gas resources at the Xiaobaodang No. 1 Coal Mine and similar mines.

1. Introduction

With the rapid growth of China’s economy, energy demand has also increased steadily, enabling the extraction of two or more resource types within the same mining area at the same time. As China’s largest coalfield and integrated gas field, the Yulin Coalfield has coal, oil, and gas resources heavily overlapped vertically, leading to significant development conflicts [1,2,3]. Although coal pillar protection offers some level of safeguard, high-intensity mining can easily cause large-scale severe deformation of the term overburden rock, damaging the integrity of oil and gas wells. This results in a large amount of coal resources becoming buried and poses serious threats to safety [4,5]. Therefore, Huang et al. introduced the concept of associated mining grade and examined the key technical challenges of co-mining coal and related resources in the coal series [6]. Yuan et al. proposed the concept of precisely coordinated coal, co-associated resource mining, and the technical means of reserving corridor mining [7]. In-depth research into the stability mechanisms of oil and gas wells affected by mining and prevention and control technologies is crucial for overcoming the challenges in the safe and efficient coordinated development of overlapping resource areas.
Regarding deformation and failure of casing in oil and gas wells, during oilfield production, when loads imposed on the casing by factors such as engineering, geological conditions, and dynamic production changes exceed the casing’s load-bearing capacity, the casing may experience deformation, cracking, or fracture, resulting in casing damage [8,9,10]. Lian et al. [11,12] developed a spatial finite element mechanical model and a mathematical model of casing deformation. This model can simulate and analyze casing spatial problems under combined loads such as bending, torsion, and internal and external pressure. The issue of casing damage in oilfields is highly complex, involving many influencing factors and causing significant losses to oilfield production. Akbarpour M. and Abdideh M. [13] employed numerical methods and Phase 2 v10.0 software to investigate rock mechanics parameters and demonstrate their variation patterns, thereby enabling induced stress analysis around the borehole. Following finite element solution, a comprehensive analysis of the software-generated stress and displacement results around the borehole was conducted to simulate borehole stability. In response, Hua and Yao [14] suggested that increasing the toughness of cement rings can prevent casing damage caused by formation pressure and corrosion from formation fluids. Yang et al. [15,16] maintained that casing made of high-steel grades with low diameter-to-thickness ratios helps improve the ultimate bearing capacity of the casing. At the same time, the design of composite pipe strings can effectively lower the cost of casing usage. The review [17] further explores the implementation of Well Integrity Management Systems (WIMS) and the integration of advanced monitoring technologies such as fiber optics, logging tools, and real-time pressure sensors. Jiang et al. [18] conducted shear tests and numerical simulations on single-layer casings, flexible double-layer casings, and double-layer casings. They proposed a method that uses stress transfer coefficients to characterize the degree of stress reduction during the process of stress transfer from the outside to the inside. Liang et al. [19,20,21,22] studied the stability of natural gas wells in the Longbi mining area in southwestern Pennsylvania, USA, under the influence of mining activities. They analyzed the axial distribution characteristics of wellbore shear, torsion, and tensile deformation. They concluded that shear failure is likely to occur at the interface between soft and hard rock layers overlying the wellbore. They also predicted the timing and spatial location of gas well instability. W.H. Su [23] deployed experimental monitoring wells within the coal pillar of a longwall mining section to collect horizontal displacement data of gas well casings under mining impact from surrounding working faces. Surface subsidence and coal pillar pressure measurements were also conducted. Combined with ABAOUS finite element simulation, the study assessed the effect of rock mass displacement and deformation caused by longwall mining on the mechanical integrity of natural gas wells penetrating the coal pillar section. Abdollahipour A. et al. [24] employed maximum borehole wall displacement as a stability factor for investigating wellbore stability, utilizing a three-dimensional finite difference method based on the Mohr model for numerical simulation. The numerical model was validated using analytical solutions, and a dimensionless sensitivity factor was proposed. Schatzel S. et al. [25] studied the dynamic effects between coal seam conditions in mining areas, overburden conditions such as surface subsidence deformation, and gas wells. Domestic and international research on casing damage in oil and gas wells mainly focuses on casing damage caused by loads exceeding the casing’s load-bearing capacity during oil and gas well production due to geological and extraction factors. However, there has been relatively little research on casing damage caused by mining other minerals at different levels within the same coalfield.
This paper describes the engineering background of the coal-natural gas cross-mining project at the Xiaobaodang No. 1 Coal Mine in Shaanxi Province. Using the FLAC3D6.0 numerical simulation software, it performs solid modeling of the wellbore structure within the model to simulate and study the stress and displacement distribution characteristics along the wellbore axis under mining-induced effects. At the same time, field monitoring techniques are employed to analyze the tightness of the gas well, casing deformation, and other damage conditions. The discussion of the numerical simulation results aims to further clarify the dynamic evolution patterns and stability assessment of the stress-deformation behavior of the gas well casing-concrete composite structure during coal seam mining. Simultaneously, the results of this study offer valuable guidance and reference for optimizing the coordinated use of coal, oil, and gas resources at the Xiaobaodang No. 1 Coal Mine and similar operations, as well as for maintaining the stability of gas wells under mining conditions.

2. Background and Problem Statement

Xiaobaodang No. 1 Coal Mine is located in the Yulin Yusheng Mining Area of Shaanxi Province. Most of the coal mine area is covered by Quaternary wind-deposited sand, with a landscape dominated by wind-eroded and wind-deposited desert hills. The strata generally trend northeast-southwest and dip northwest-southeast, with an overall dip angle of less than 3°, forming a monoclinal structure. The terrain generally rises in the southwest and falls in the east. The main study area of this paper, as shown in Figure 1, is the 132,201 working face in the 13-panel area of the mine. The 132,201 working face has a strike length of 5531 m and a dip length of 300 m. The oil and gas well site Double 3–24 is situated within the 132,202 working face, 127 m from the 132,201 conveyor tunnel, 3168 m from the cut-off, and 2633 m from the retreat channel. The width of the coal pillar reserved for protecting the oil and gas well is 200 m. The central coal seam within the working face is the 2–2 coal seam, which is located at the top of the fourth section of the Yan’an Formation. The coal seam is buried at a depth of 272 to 340 m, with an average thickness of 5.08 m. A natural gas transmission pipeline extending from the Double 3–24 gas well site to the 132,202 cut-off area is also laid on the ground. The area surrounding the Double 3–24 gas well site is relatively flat underground.
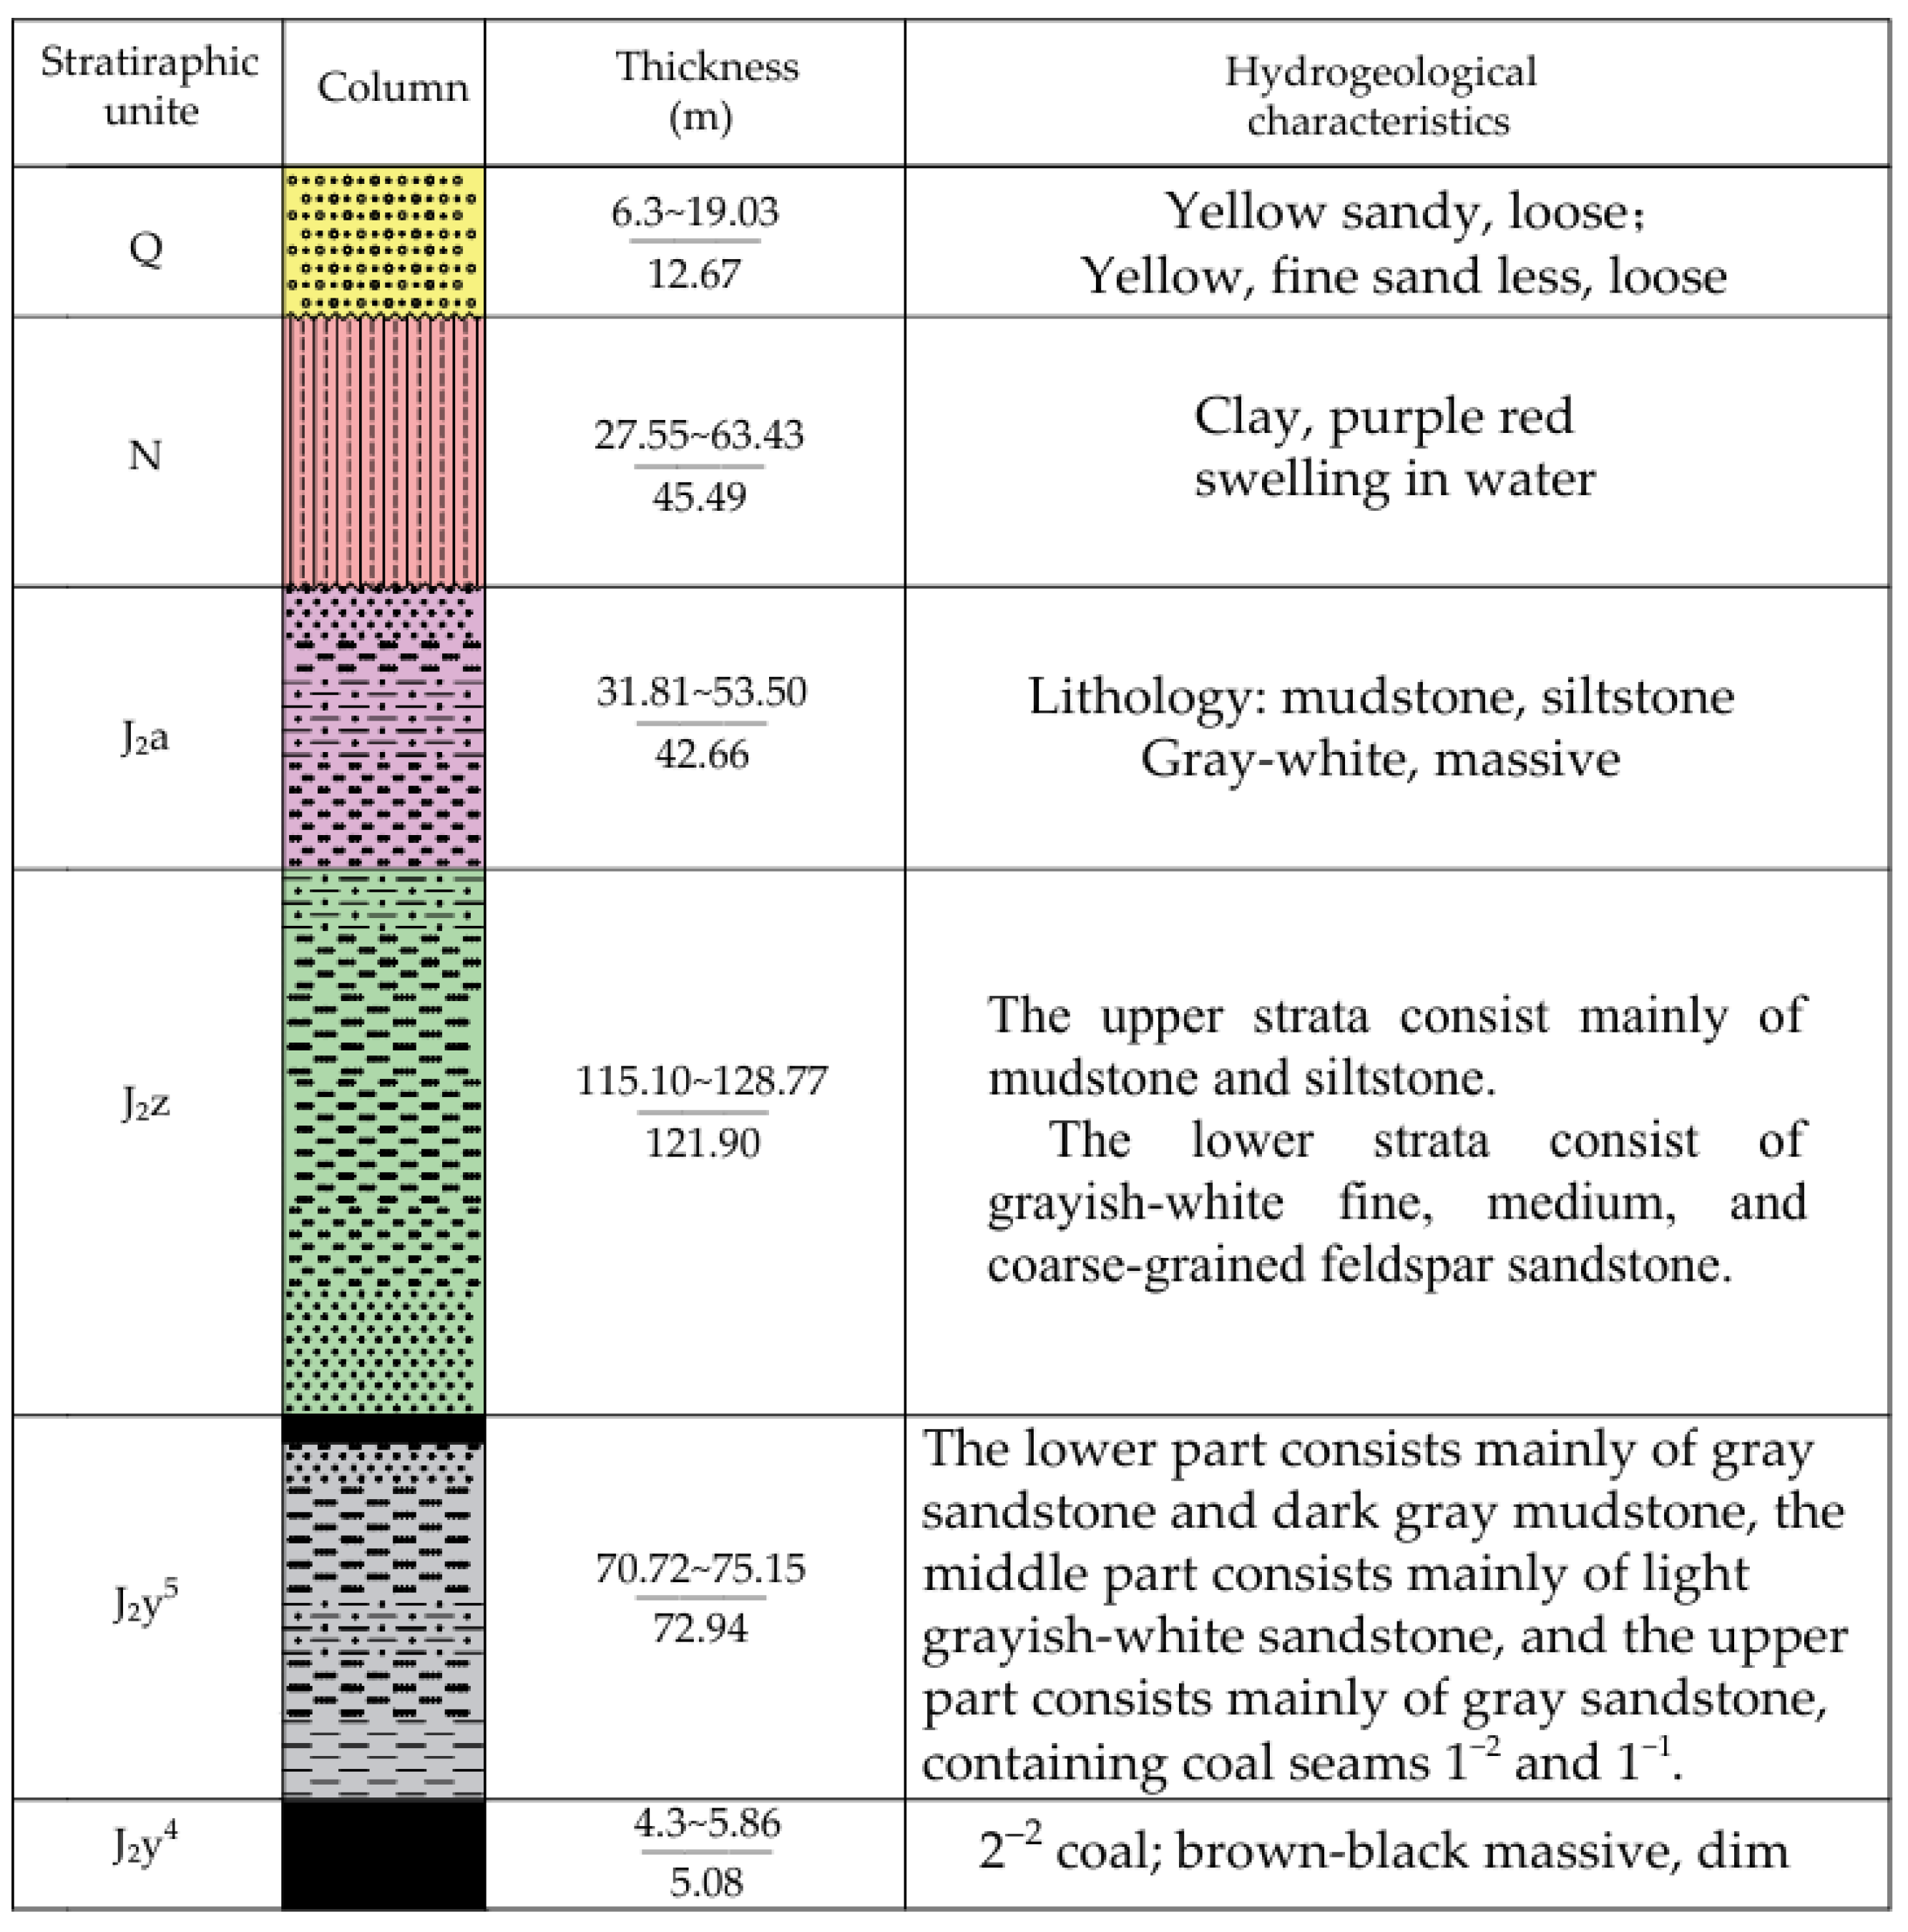
The mining of the 132,201 working face inevitably impacts the protective coal pillar of the double 3–24 gas well field. Based on the actual drilling data shown in Figure 2, the strata above the 2-coal seam in the working face include the Fifth Member of the Yan’an Formation, Middle Jurassic Series (J2y5), Zhiluo Formation (J2z), and Anding Formation (J2a); the Baode Formation, Neogene System, Cenozoic Era (N2b); and the Holocene aeolian sands (Q4eol).

3. Materials and Methods

To mine coal safely and efficiently while ensuring the stability of natural gas well casings within the same coalfield, it is essential to understand the stress deformation of the overlying rock, coal pillars, and well casings under mining conditions. Numerical simulation, due to its low cost, high efficiency, strong repeatability, and flexibility, has become a preferred analytical and evaluation method over field or laboratory tests. The main numerical simulation software used in geotechnical and mining engineering issues includes FLAC, UDEC 7.0, RFPAv2.0, etc. [26]. The numerical simulations in this study were conducted using the finite difference code FLAC3D. This software was selected for its proven capability in handling large-strain geomechanical problems. Furthermore, its integrated structural and interface elements offer significant advantages in explicitly simulating the mechanical response of gas well casings and their interaction with surrounding rock—a core focus of this research [27]. This paper primarily uses FLAC3D, an explicit finite difference program software widely used in the field of geotechnical engineering, to establish a large-scale three-dimensional geological model for the study of oil and gas well deformation and failure under the influence of the 132,201 working face mining. The basic principles of FLAC3D are similar to those of the discrete element method. Still, it can be applied to multiple material modes and solve continuous problems with irregular boundary conditions. The program employs the dynamic relaxation method of discrete elements during the solution process. It does not require solving large systems of simultaneous equations, which makes it easy to implement on a computer. A finite difference scheme is used to solve the control differential equations of the field, and a mixed element discrete model is applied to accurately simulate material yield, plastic flow, softening, and large deformation, especially in the areas of material elastic-plastic analysis, extensive deformation analysis, and construction process simulation. By using corresponding constitutive equations tailored to different material properties, the dynamic behavior of real materials can be more accurately represented [28].

3.1. FLAC3D Model Construction

The composition of the rock strata at the 132,201 working face in the 13th mining area of Xiaobaodang No. 1 Coal Mine forms the basis for the calculation model. Considering the requirements for computational capacity and unit division, the model size should be appropriately divided into multiple units. The basic parameters of the model are as follows:

3.1.1. Model Size

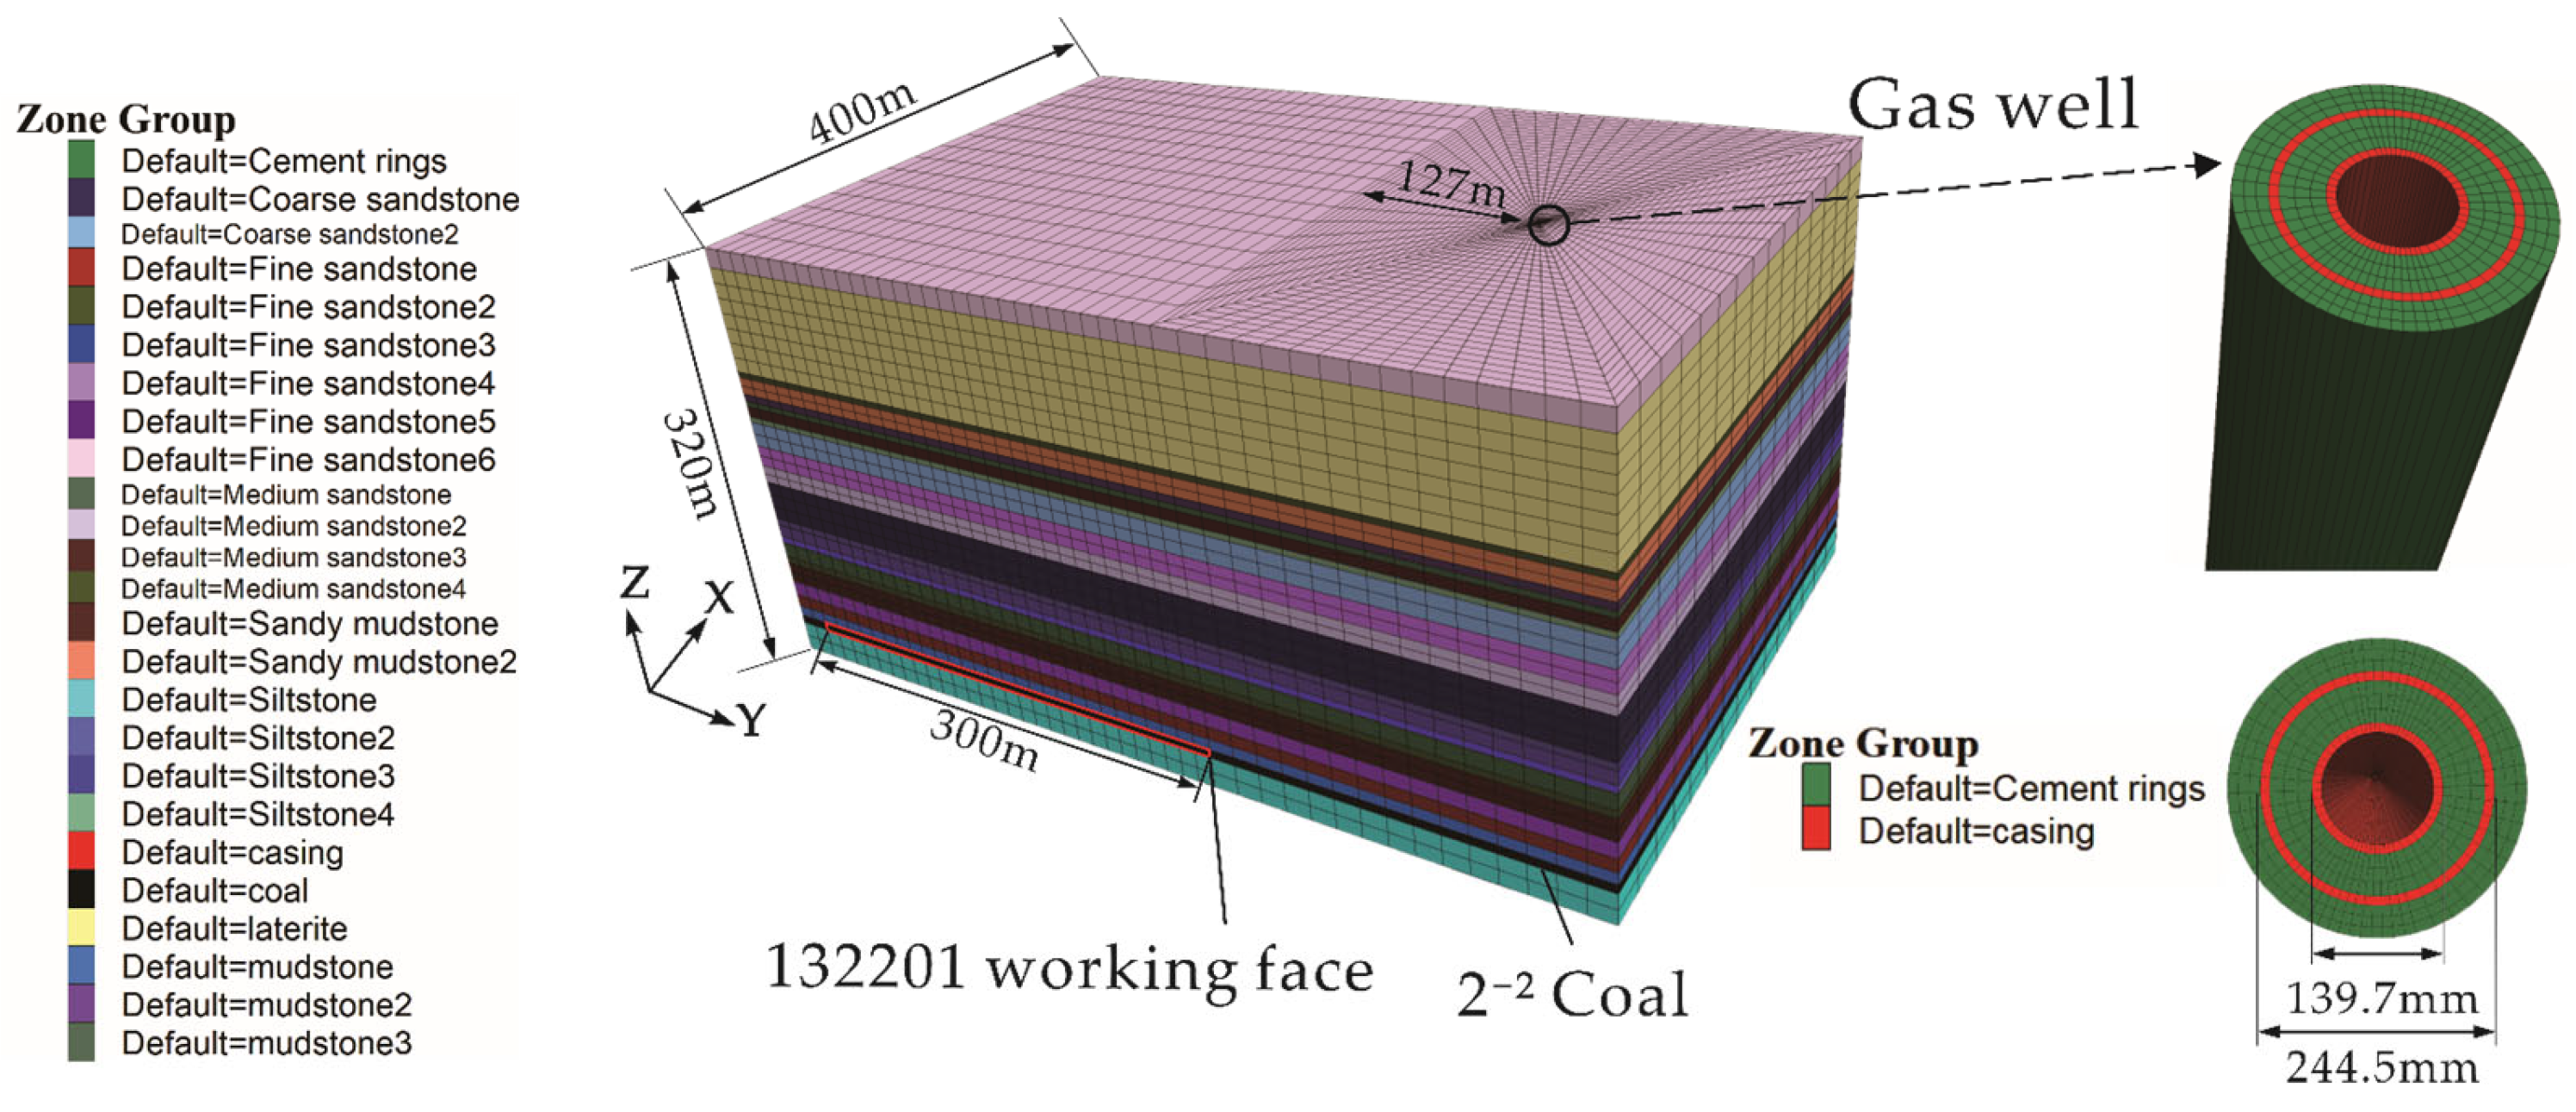
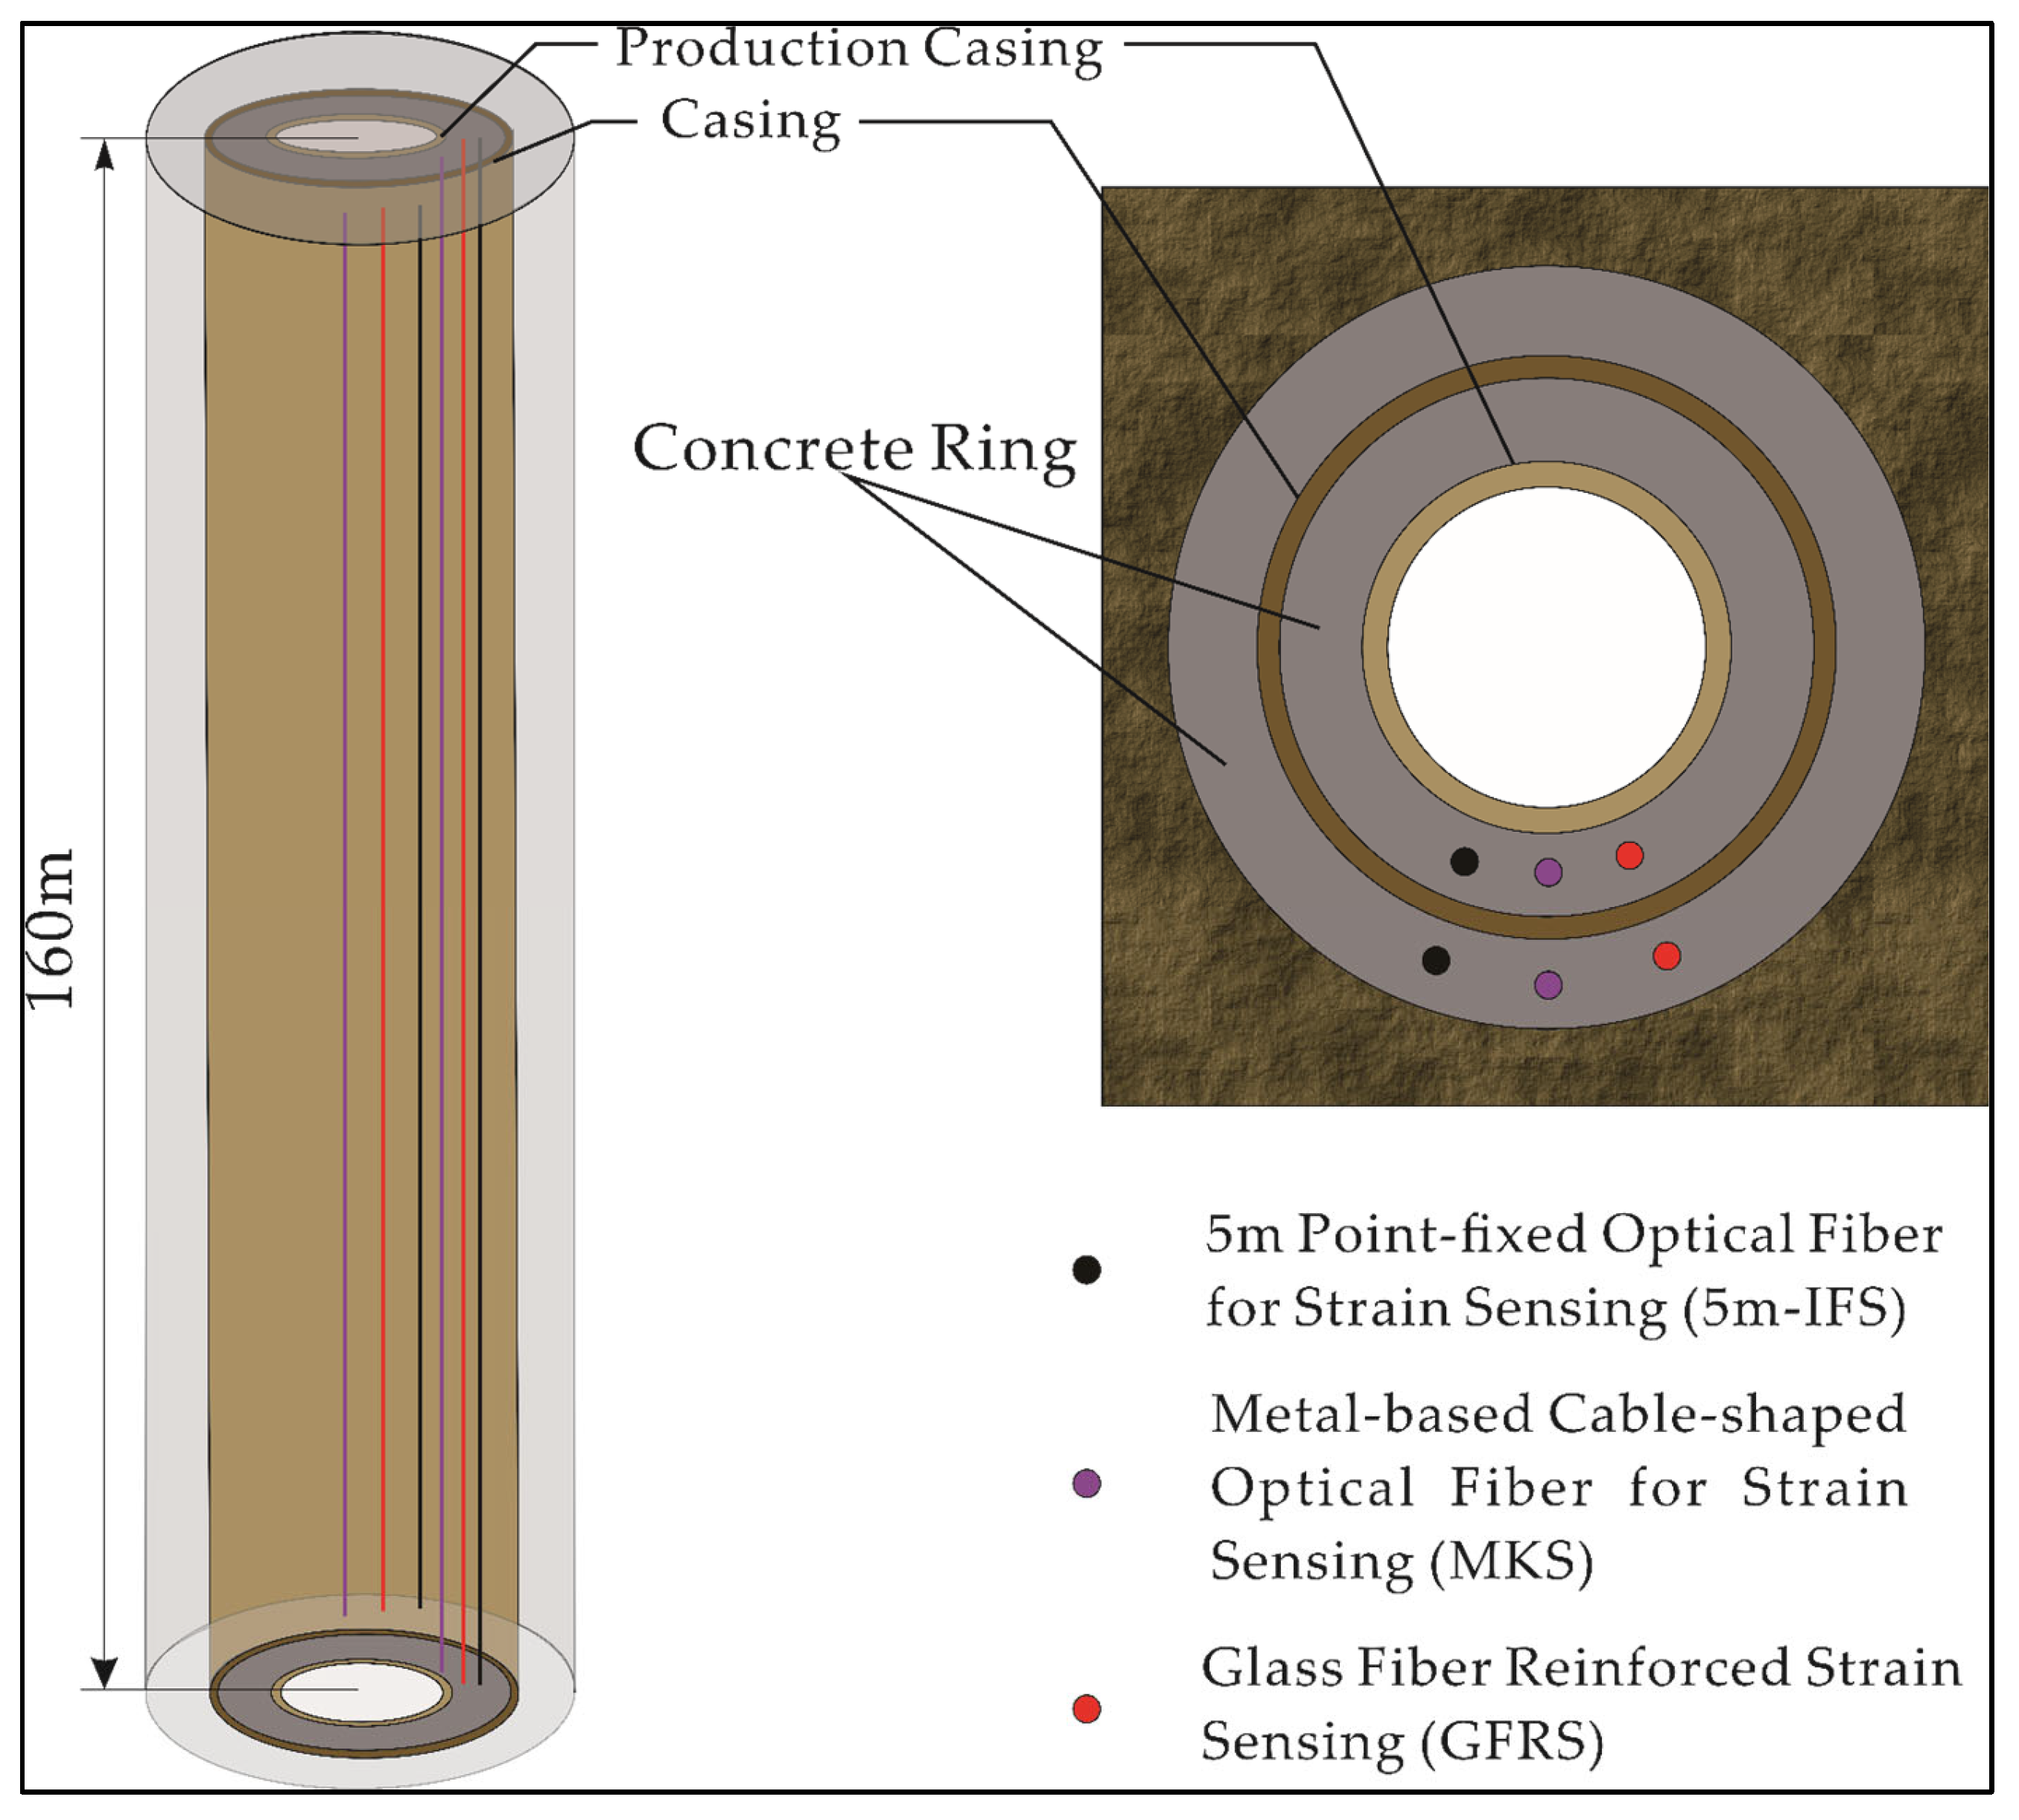
To ensure the model size adequately covers the primary impact zone and to enhance efficiency, the strike length of the mining area model was selected as 400 m, a dip length of 300 m, and simulates the range of geological strata vertically, with a maximum height of 320 m. The casings directly affected by mining operations are the outer protective casing and the inner production casing of the Double 3–24 gas well. The Double 3–24 gas well is located at the center of the coal pillar in the working face, 127 m away from the return airway of the working face. The gas wells consist of a double-layer cement ring-casing structure. Therefore, only these two types of casings are included in the model. Their dimensions are as follows: the outer protective casing of the Double 3–24 gas well has an inner diameter of 226.62 mm, an outer diameter of 244.5 mm, and a length of 320 m. The inner diameter of the production casing of the Double 3–24 gas well is 121.36 mm, the outer diameter is 139.7 mm, and the casing length is 160 m, as shown in Figure 3.

3.1.2. Grid Division

Based on the content to be studied, the model is divided into non-uniform grids and calculated according to the principle of gradually decreasing density. The grids of the natural gas well casing, along with the surrounding rock and coal seam that need to be studied, are densified. Meanwhile, the unit sizes of the remaining parts are appropriately increased based on their distance from the key research object. The further an area is from the key research object, the larger its unit size. The ANSYS APDL 15.0 solver was used for modeling and meshing. A radial mesh was applied around the oil and gas wells, while a hexahedral mesh was used for the coal seam mining area. To balance computational accuracy and efficiency, a non-uniform mesh was adopted—featuring a finely refined mesh close to the oil and gas wellbore and a larger mesh for the surrounding rock and mining area farther from the wellbore. The computational model range with FLAC3D software includes a grid of 103,740 cells and 109,980 nodes.

3.1.3. Constitutive Relation

In order to accurately reflect the deformation and failure patterns of the casing in the Double 3–24 gas well caused by mining at the 132,201 working face, as well as the relationship between the deformation and failure of the overlying rock layers and the casing’s deformation, it is essential to select appropriate models for the rock layers and natural gas wells for calculations. The overlying rock layers above the coal pillar primarily experience shear failure and rock strength failure. Therefore, this model uses the Mohr-Coulomb model as the constitutive model for the overlying rock. Since natural gas well casings are made of steel, which is an artificial material with a strength limit, they are considered uniform, isotropic, continuous bodies with linear stress–strain behavior. Consequently, the Elastic model was employed in this calculation to describe the strength characteristics of natural gas well casings. The calculation utilized the Mohr-Coulomb and empty cell models (for tunnel excavation and working face mining). The Mohr-Coulomb yield criterion is:
f s = σ 1 σ 3 1 + sin φ κ 1 cos φ κ 2 cos φ κ 1 sin φ κ c κ
In the equation, σ1 and σ3 are the maximum principal stress and minimum principal stress, respectively; while c, φ and κ represent cohesion, the friction angle, and the internal variable, respectively. When fs > 0, the material will experience shear failure. Under normal stress conditions, the tensile strength of rock masses is very low; therefore, the tensile failure criterion can be used to determine whether tensile failure occurs in the rock mass.

3.2. Setting Model Parameters

The rock mechanics parameters required for numerical simulation were obtained, as shown in Table 1, based on the results of indoor rock mechanics tests and the field geological survey report.
According to the field investigation report, the physical and mechanical parameters of the double 3–24 gas well casing required for numerical simulation were obtained, as shown in Table 2.
The physical and mechanical parameters between the cement ring and the rock layer interface are shown in Table 3.

3.3. Numerical Boundary Conditions and Excavation Design

Based on field measurements of in situ stress, the maximum principal stress in the bedrock stress field is horizontal stress (σH > σV > σh). The measured vertical stress is essentially consistent with the vertical stress calculated from overburden thickness and unit weight. The maximum horizontal principal stress is 1.33 to 1.59 times the vertical stress. The measured maximum horizontal principal stress is 1.19 to 1.89 times the minimum horizontal principal stress. To accurately replicate the in situ stress boundary conditions, the following settings were applied to the numerical model: the gravitational acceleration (g) was applied along the z-axis to generate the vertical stress; the maximum horizontal principal stress (x-direction) was set to 1.46 times the vertical stress; and the minimum horizontal principal stress (y-direction) was set to 0.65 times the maximum horizontal principal stress. The model boundaries were constrained:
  • Constraints are applied along the X-axis at both ends of the model’s X-axis, meaning that the displacement in the X-direction at the boundary is 0;
  • Constraints are applied along the Y-axis at both ends of the model’s Y-axis boundary, meaning that the displacement in the Y-direction at the boundary is 0;
  • The bottom boundary of the model is fixed, i.e., the displacement of the bottom boundary in the X, Y, and Z directions is 0;
  • The top of the model is a free boundary.
Initial stress equilibrium is established for the model. The three-dimensional numerical model is shown in Figure 4. The working face is simulated to advance along the width of the model. A 20 m protective coal pillar is left on both sides of the working face. The gas well in the model is located at Y = 200 m along the direction of working face advancement in the mining area. The working face advances 360 m, with a mining step size of 10 m. After each mining step is completed and the model calculations stabilize, the following mining step is carried out.

4. Results

4.1. Stress Distribution Characteristics of Overlying Rock (Soil) Layers Affected by Mining Activity Around Gas Wells

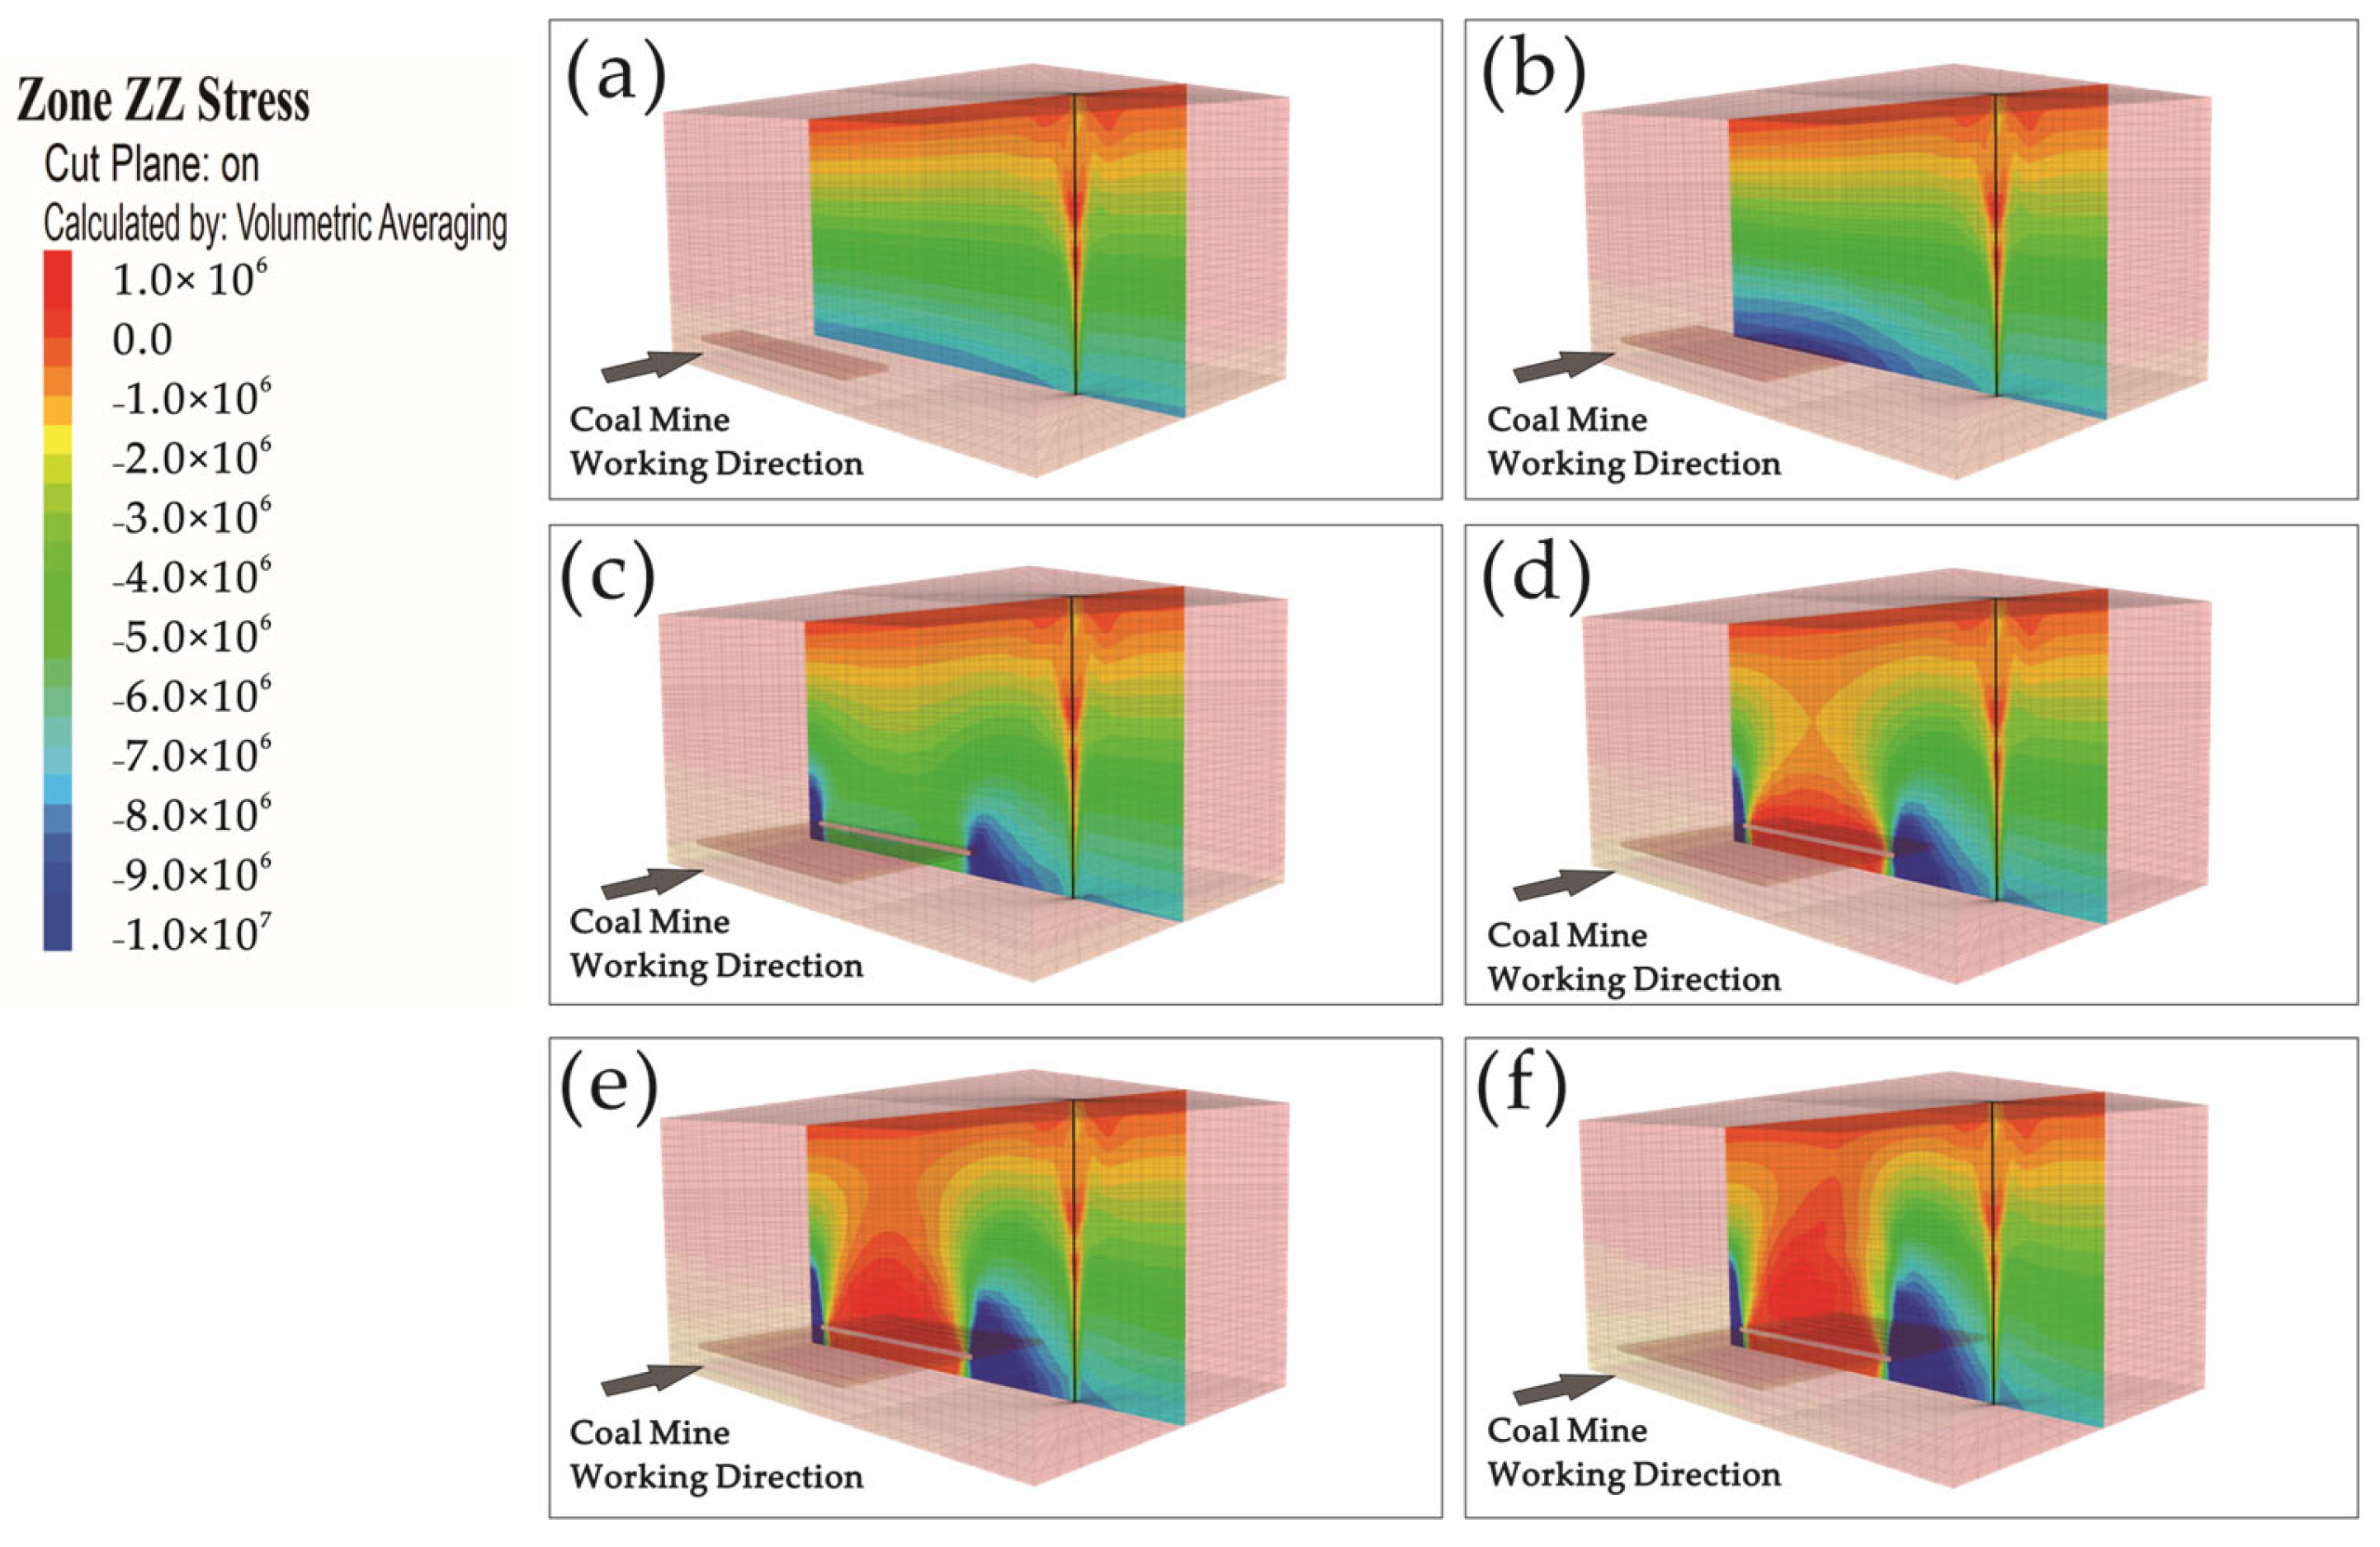
Simulation of vertical stress changes in the surrounding rock near the gas well casing caused by mining operations along the working face shows the vertical stress distribution along the working face from the first excavation step to the completion of the final excavation step, as shown in Figure 5.
According to the analysis of the figure above, coal seam mining causes redistribution of the original rock stress. Besides the uniform internal pressure from oil and gas, the casing also experiences external pressure and axial force due to the redistribution of the original rock stress, leading to stress concentration around the casing of natural gas wells. Because of the different rock types of each rock layer, the vertical stress distribution of the surrounding rock of natural gas wells has the characteristics of continuity and interlayer sudden change. As the working face continues to advance, the stress concentration in the surrounding rock of the natural gas well increases. By the end of excavation, the maximum vertical stress had increased, but the stress concentration area had decreased, primarily around the natural gas well near the goaf side. This is mainly because the rock layers at the coal face shift toward the goaf under mining stress. This movement causes the gas well casing to bend and sink toward the goaf, resulting in increased stress concentration on the side of the gas well casing adjacent to the goaf. The maximum vertical stress distribution in the surrounding rock of a natural gas well shows intense compressive stress on one side of the gas well. Conversely, the stress value on the opposite side of the gas well is relatively small. At this point, the casing of the natural gas well is subjected to asymmetric vertical stress, but overall, the stress peak remains relatively small and has little impact on the gas’s stability well.

4.2. Shear Stress Distribution Characteristics of Casing in Gas Wells Affected by Production Activities

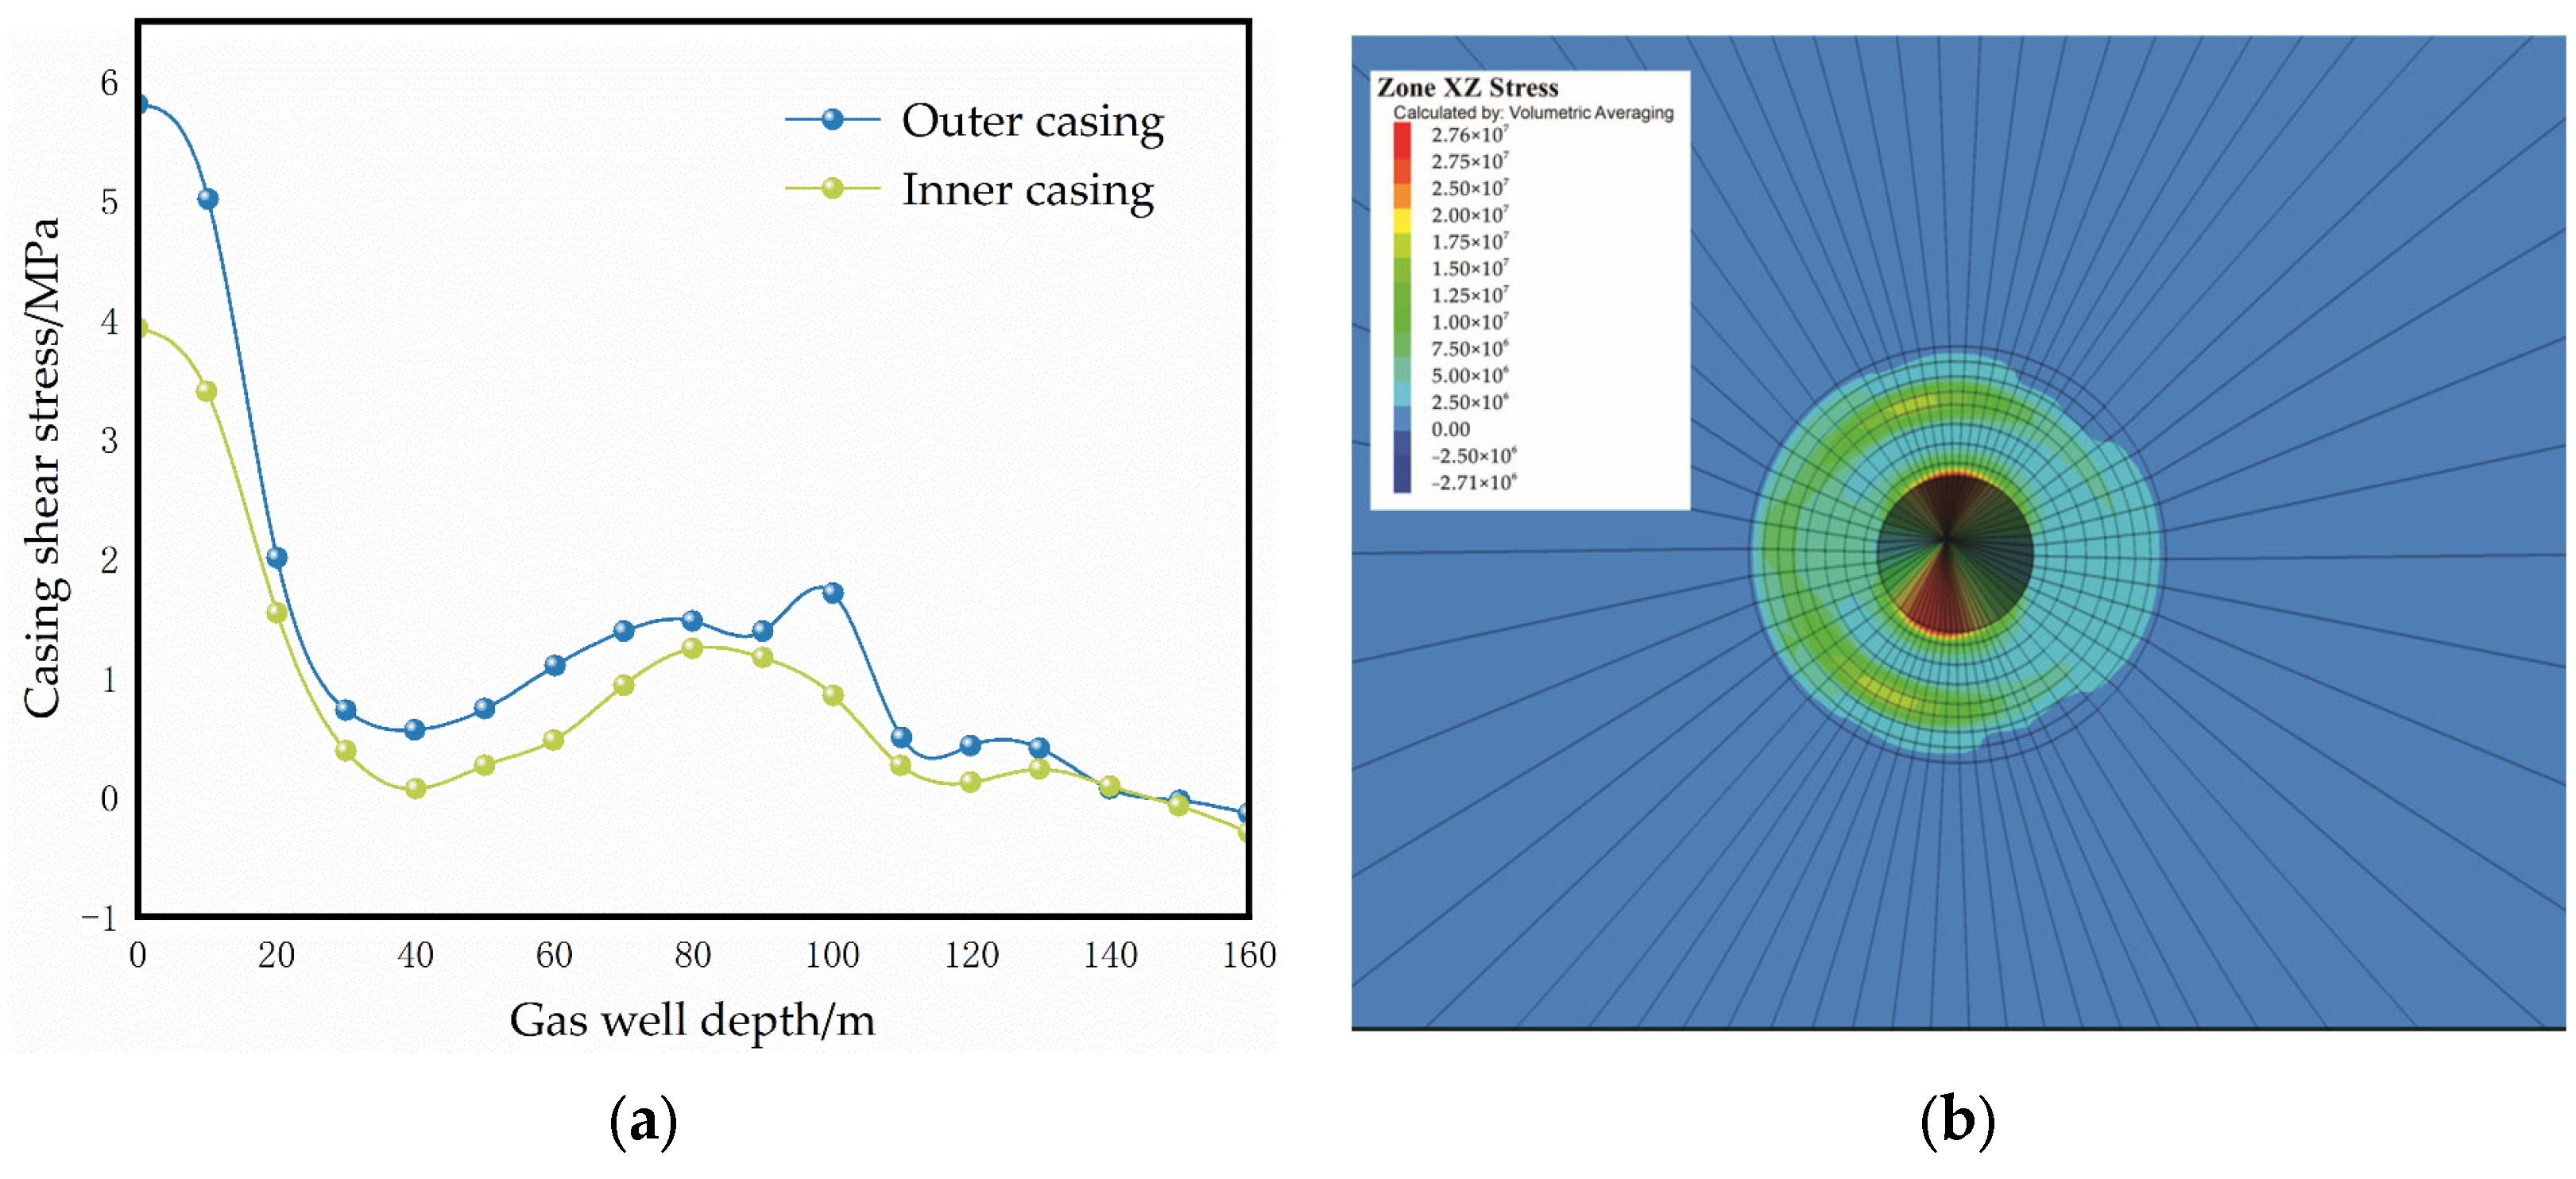
During the simulation calculation process, the shear stress distribution characteristics of the gas well and its surrounding rock from the first excavation to the completion of the last excavation were analyzed, as shown in Figure 6.
As shown in the figure above, the casing of the gas well experiences varying degrees of shear stress from the wellhead surface down to a burial depth of 160 m, with a maximum of 5.8 MPa near the wellhead surface, which is well below the casing’s yield strength. The shear stress on the gas well casing from the wellhead to a depth of 20 m is relatively high and displays characteristics of sudden changes alongside continuity. This is mainly because the overlying rock layers consist of rock bodies with different properties. Since normal stress, cohesion, and internal friction angle vary among different rock layers, their shear strength also varies, leading to various locations of maximum shear stress. Therefore, the shear stress in the gas well formation shows abrupt changes, primarily at the interfaces between rock layers. However, within individual rock layers, continuity is observed because the normal stress, cohesion, and internal friction angle are consistent, and so is the shear strength, leading to continuous changes in shear stress. In the 20–80 m burial depth range, the shear stress on gas wells’ inner and outer casings gradually increases but stays below 2 MPa overall. In the 80–160 m burial depth range, the shear stress values on the casings decrease to a stable level, indicating that the casings in this section are less affected by mining activities.

4.3. Characteristics of the Impact of Mining Activity on Gas Well Displacement Distribution

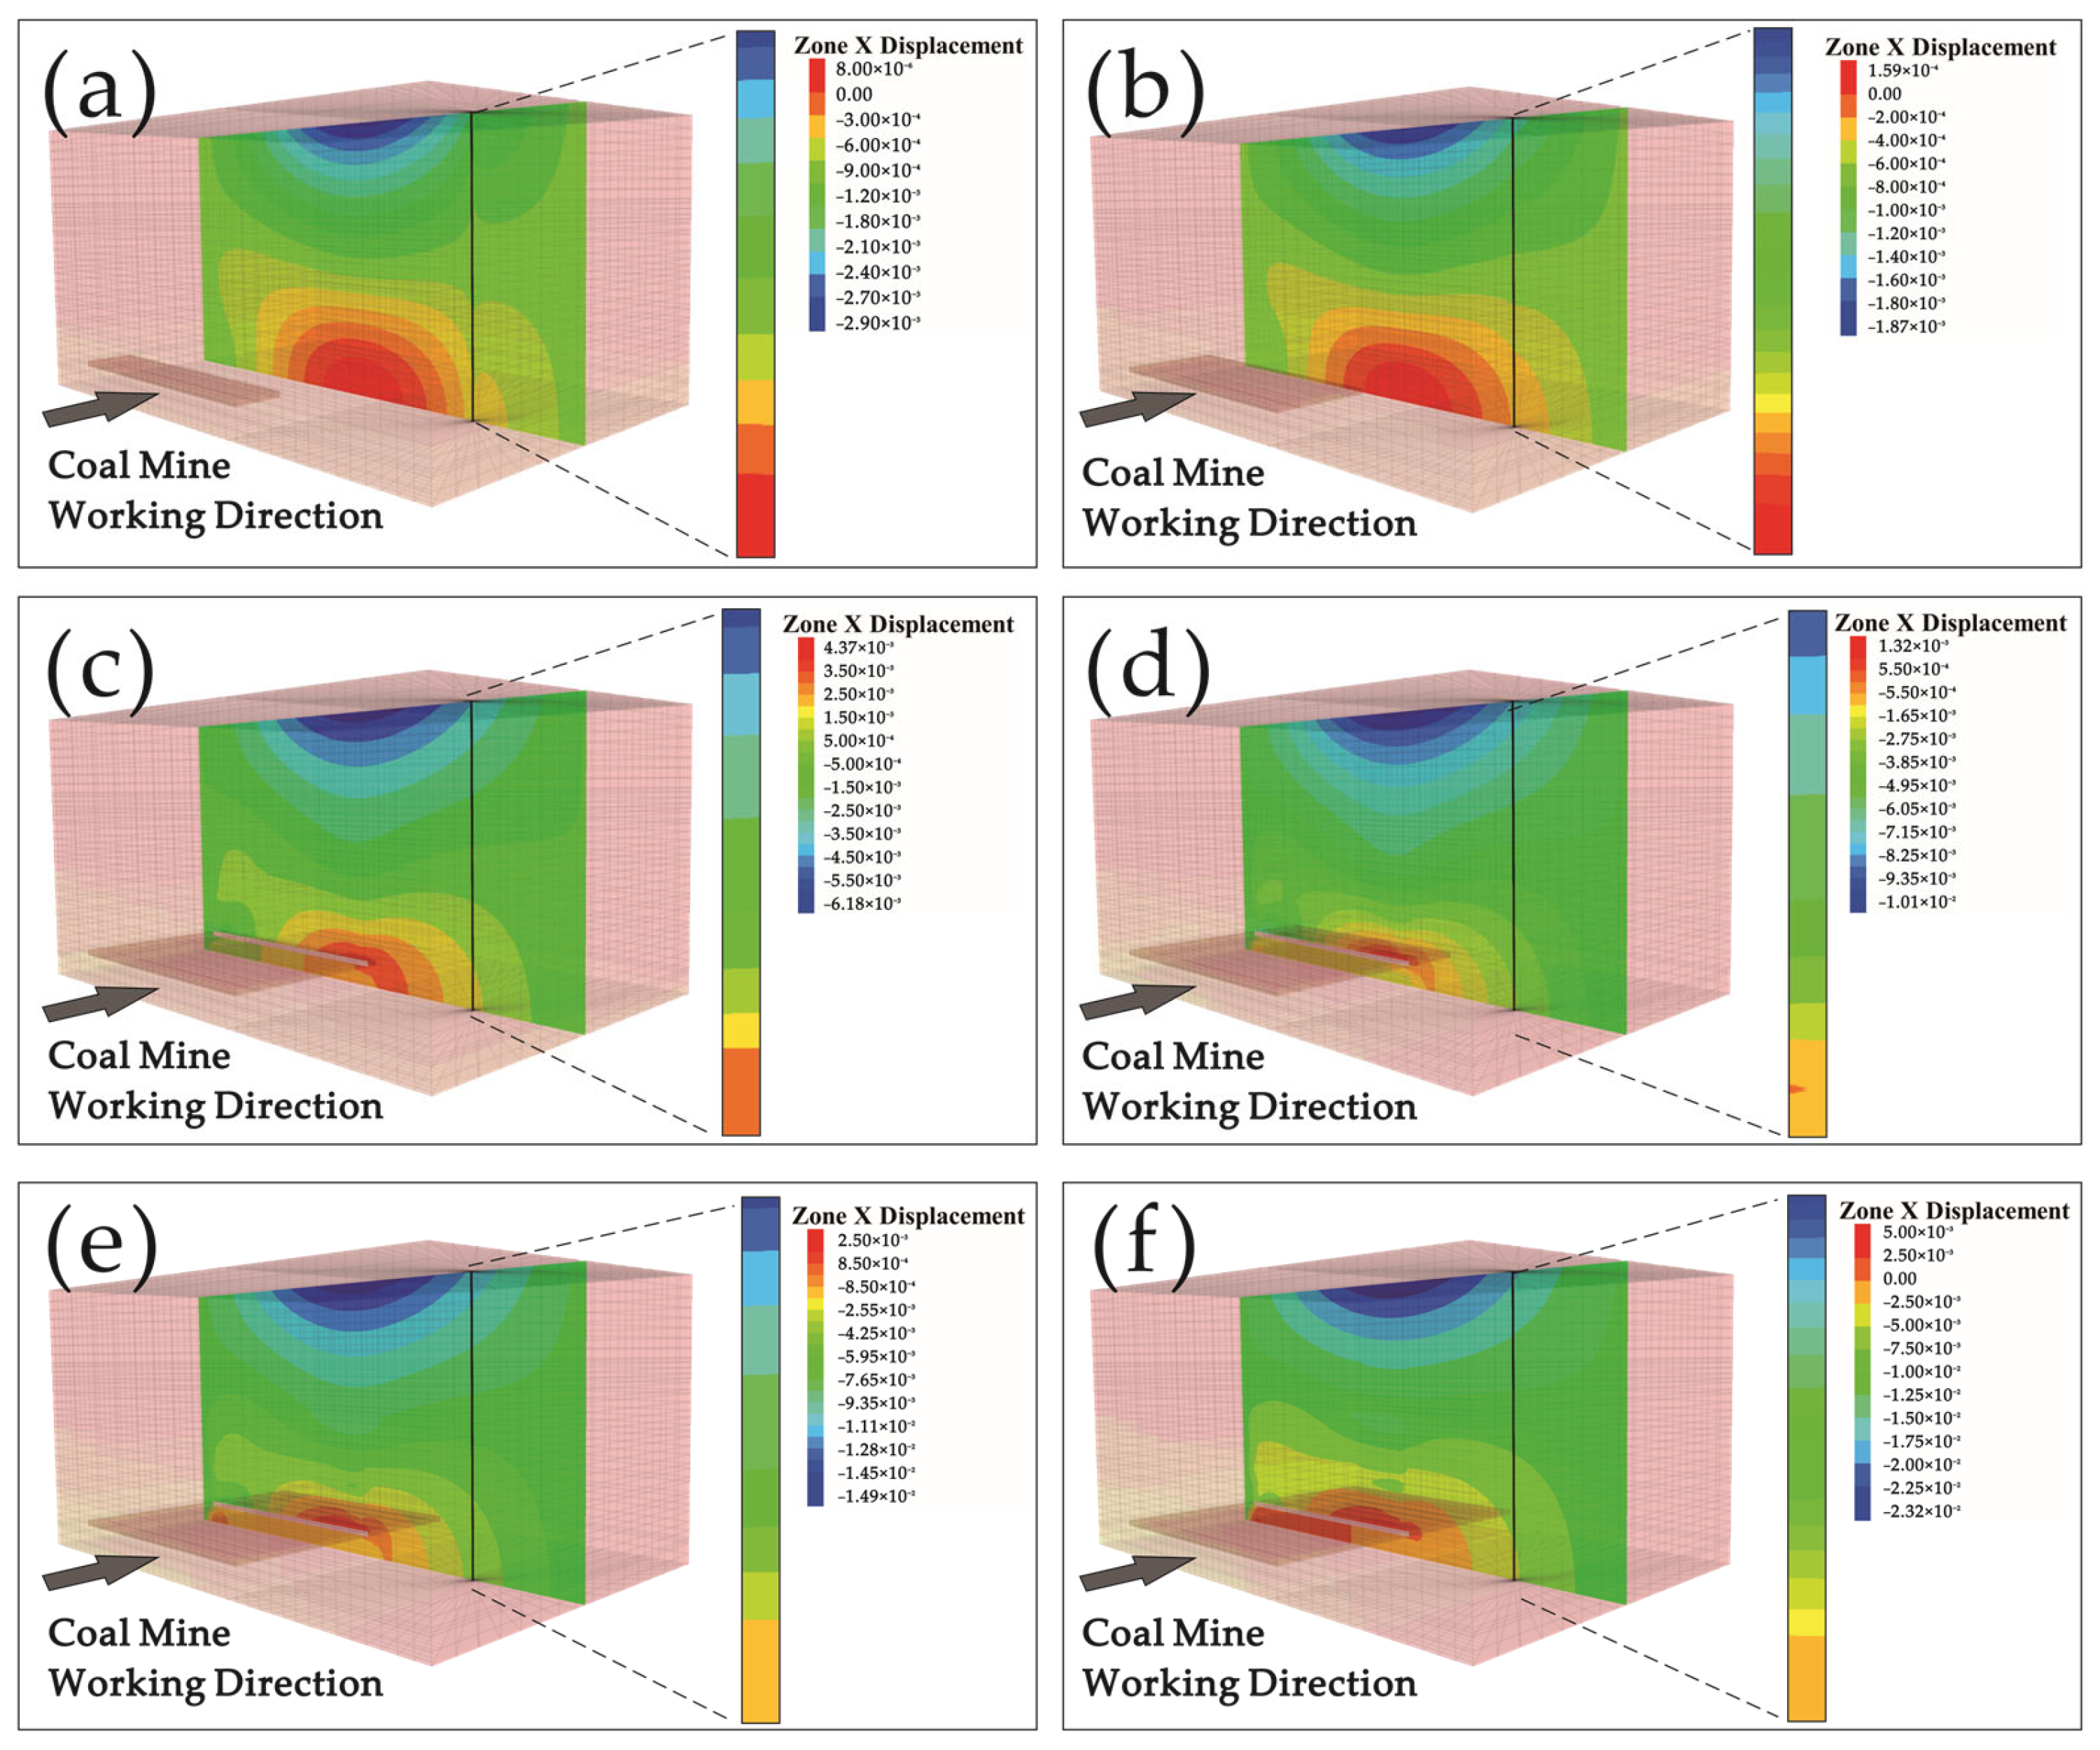
During the mining of the 132,201 working face, the casing-concrete composite structure of the simulated gas well experienced displacement deformation as the face was gradually excavated. The displacement cloud map of the simulated gas well affected by mining activity is shown in Figure 7. Analyzing the displacement distribution of the gas well’s casing during the mining process, as shown in Figure 8, reveals how the deformation of the casing-concrete composite structure occurs during the mining of the working face assessed.
During the mining process, the displacement of the gas wellbore shows regular patterns. When the working face is 120 m away from the shaft (Figure 7a), the maximum positive displacement at the bottom of the shaft starts to shift toward the coal seam roof. From the surface down to a depth of 160 m, horizontal displacement first decreases and then increases: the maximum surface displacement was −0.289 mm (negative values indicate displacement toward the goaf), with a depth of 140 m approaching 0 m and reaching a minimum at 150 m (−0.008 mm). At this stage, the wellbore functions like a lever, with the upper part tilting toward the goaf due to mining activity, causing significant negative displacement at the surface, while the lower part experiences positive displacement because of the wellbore’s rigidity and the prying action of the upper part.
When the working face advanced to a distance of 60 m from the well (Figure 7b) and the well crossing position (Figure 7c), the maximum positive displacement of the lower part of the wellbore continued to migrate toward the roof, and the displacement zero point moved toward the shallow part. The maximum negative displacement at the surface increased to −1.8 mm and −6 mm, respectively. In comparison, the maximum positive displacement at a depth of 160 m increased to +0.15 mm and +0.6 mm (displacement ratio of approximately 10:1). The double casing structure allows the main shear stress to be borne by the casing, causing the wellbore to tilt rigidly and the water-conducting fracture zone to develop upward, exacerbating the tilt.
During the process of advancing the working face through the shaft by 60 m (Figure 7d), 120 m (Figure 7e), and 180 m (end of mining, Figure 7f), the trend of displacement change continued: surface negative displacement kept accumulating, reaching −10 mm, −14 mm, and −23 mm, respectively; positive displacement at a depth of 160 m increased to +1 mm, +2 mm, and +5 mm; the displacement zero point continued to migrate toward the surface; and the displacement ratio gradually decreased to 4:1. Although the inclination trend intensified, the cement ring and casing continued to deform in unison, with no significant shear displacement, ensuring the overall stability of the wellbore.
In summary, at the end of mining, the maximum displacement of the wellbore was −23 mm at the surface and +5 mm at 160 m, with the displacement decreasing with depth initially and then increasing. Although the wellbore shows a tendency to tilt toward the abandoned area, thanks to the double casing-cement ring structure and synergistic deformation, the overall displacement remains small and evenly distributed, with no obvious shear deformation, indicating that the working face mining has no impact on the safe and stable production of the gas well.

5. Discussion

While direct comparisons are constrained by the scarcity of studies on multi-level mining of different minerals within the same coalfield, our findings can be contextualized with broader research on casing damage in subsurface extraction. For instance, the gypsum salt layer [29] contains abundant oil and gas resources, but its creep characteristics readily cause shear failure in casing—a mechanism validated by our model. Moreover, studies [30] have revealed that excessive and uneven stresses around the wellbore, coupled with reduced pore pressure, collectively lead to rock strength loss and failure. This shear failure triggers solid phase production, forming cavities, and causes casing deformation due to excessive buckling forces. However, unlike these cases involving mining within a single rock formation, this study uniquely reveals the interaction between the overlying hard sandstone layer and the underlying weak mudstone layer. This interaction amplifies asymmetric settlement, thereby intensifying the bending stress acting on the casing. This comparison underscores that while the fundamental mechanics of casing damage (e.g., shear, compression) may be universal across mining types, the specific geological context and mining layout—such as the interlayered strata in a coalfield—are paramount in determining the ultimate failure mode and risk level.

5.1. Gas Well Production Casing Pressure Monitoring

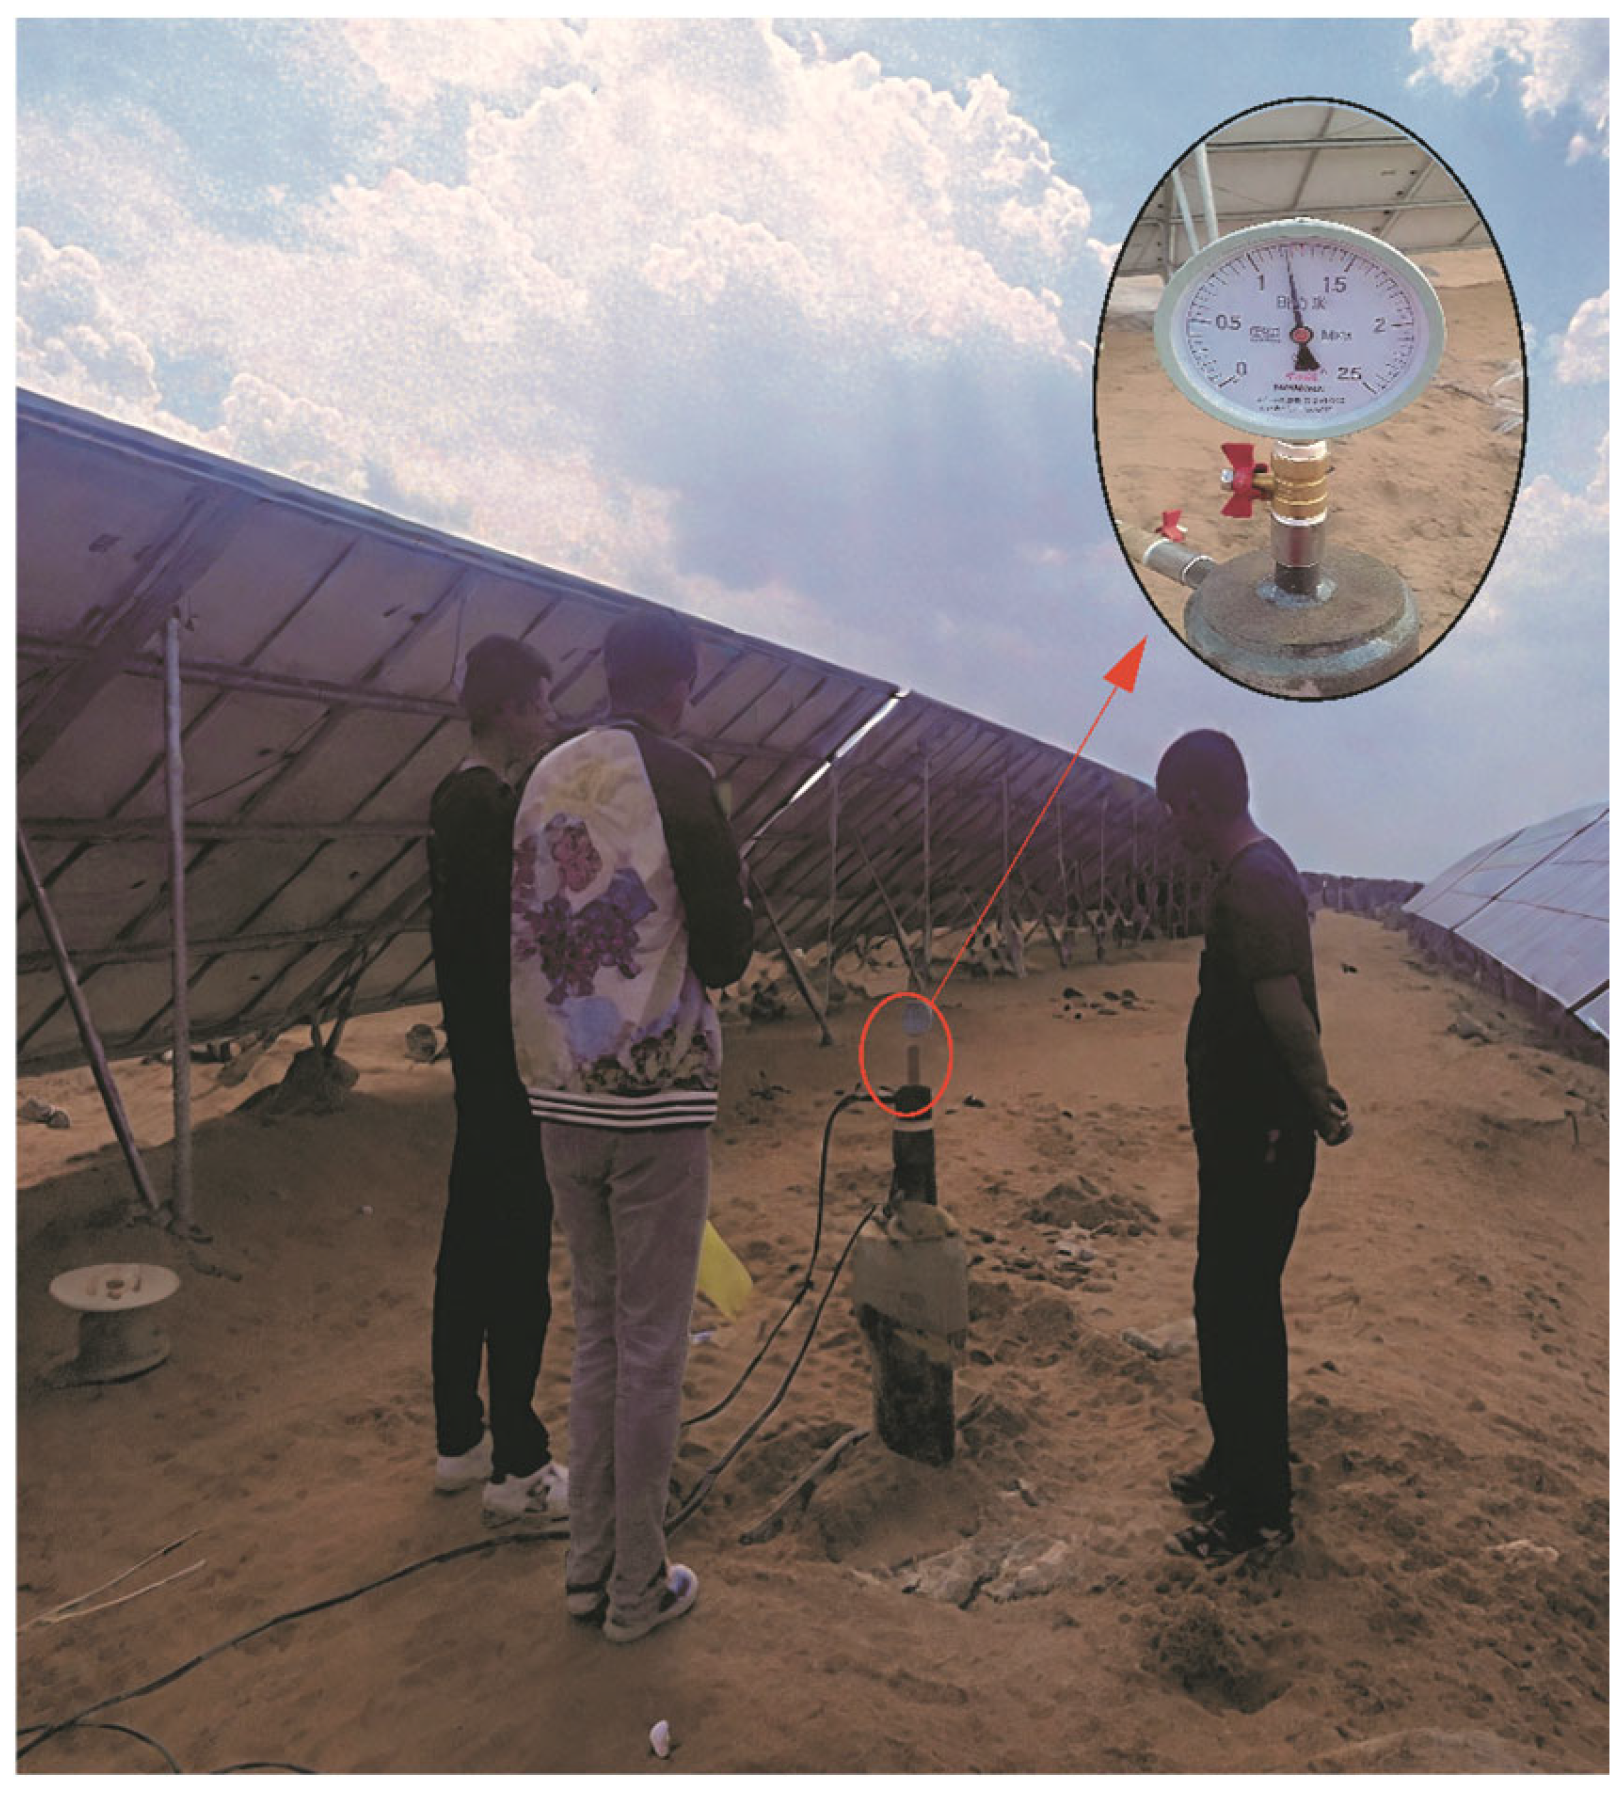
To monitor changes in borehole pressure and airtightness caused by mining activities during the mining impact period at the 132,201 working face, a borehole mouth device and pressure gauge were installed at the gas well’s borehole opening, with the pressure gauge having an accuracy of ±0.005 MPa, as shown in Figure 9. This setup simulates the oil pressure inside the gas well borehole. By continuously tracking changes in internal pressure during the active ground subsidence period at the 132,201 working face, data are provided to assess the stability of the gas well under mining conditions.
According to the data collected from the natural gas wells at the Shuang 3–24 well site, the oil pressure of the gas wells is 1.02 to 1.53 MPa. During the initial pressurization process, the pressure could not be increased beyond 1.32 MPa. This occurred because the water level within the borehole was relatively high, with a water depth of 0.5 m. When the applied pressure reached equilibrium with the hydrostatic pressure of the water column, this phenomenon ensued. The pressure monitoring of the production casing in this gas well was conducted continuously at initial pressures of 1.32 MPa, 1.55 MPa, 1.25 MPa, and 1.42 MPa, respectively. The monitoring frequency was once a day, with 60 pressure monitoring sessions conducted. Before monitoring, the water level in the borehole was 0.5 m below ground level. After monitoring, the water level in the borehole was 14.99 m below ground level.
Before the first pressure monitoring, repeatedly test the airtightness of the pressure device installed at the hole opening, treat each pressure relief leak point, and ensure as much as possible that there are no air leaks or pressure relief points at the hole opening device. The initial pressure test was conducted due to the high water level inside the borehole, with a water level burial depth of 0.5 m. The pressure was increased to 1.32 MPa, but could not be improved further. The gas valve was closed, and pressure monitoring began. The pressure monitoring data is shown in Figure 10.
As shown in Figure 10a, the pressure readings from the pressure gauge decreased from 1.32 MPa in the first test to 1.18 MPa, from 1.55 MPa in the second test to 1.39 MPa, from 1.25 MPa in the third test to 1.14 MPa, and from 1.42 MPa in the fourth test to 1.25 MPa. Furthermore, after averaging the test data and calculating the difference, Figure 10b shows the trend of relative pressure change. It can be observed that the average change amplitude is approximately 0.01 MPa/d, and the pressure changes tend to stabilize. However, this value is within the margin of measurement error (±0.005 MPa) for our apparatus, indicating no statistically significant decline in pressure. During the active mining period, when the mining progress at the working face was between 702.5 m and 1699.9 m from the cut-off point, monitoring was carried out using water to observe the welded seams, joints, and valves of the hole-mouth pressure device for any potential pressure leaks. No obvious pressure leaks were detected, indicating that the production casing and hole mouth device are airtight. However, four separate pressure readings showed that the air pressure inside the borehole gradually decreased. Analyzing the cause revealed that the water level inside the borehole had dropped from 0.5 m to 14.99 m, and the pressure decline was due to the slow seepage of water through the casing at the bottom of the borehole caused by the high internal pressure. Leakage occurs through natural pores or microfractures in the bedrock beneath the casing. This pathway formed because the applied internal pressure (1.32 MPa) exceeded the rock’s natural sealing capacity. The absence of a sharp pressure drop provides key evidence that the production casing itself did not sustain significant mining-induced damage (such as shear tearing or large fractures). If mining activities had severely compromised the casing’s mechanical integrity, a more pronounced pressure decline would have been expected. The deformation and movement of the overlying strata resulting from coal seam mining in the 132,201 fully mechanized mining face have minimal impact on the gas pressure and air tightness of the production casing in gas wells.

5.2. Multi-Arm Wellbore Diameter Testing of Gas Well Production Casing

To further analyze the impact of overburden movement and deformation caused by mining the 132,201 working face on the gas well casing and tubing, determine the type of damage to the casing and tubing, evaluate the extent of that damage, and design a multi-arm borehole diameter test for the gas well production tubing. The wellbore diameter series logging instruments are contact-type measuring devices that detect changes in the inner wall of the casing by having the measuring arm of the wellbore diameter instrument contact the inner surface of the casing. These changes are translated into the radial displacement of the wellbore diameter measuring arm. Through the mechanical transmission system inside the wellbore diameter instrument, the radial displacement of the probe arm is transformed into the vertical displacement of the push rod. The displacement sensor then converts these vertical displacement changes into electrical signals for reception. Arm well diameter gauges come in various types, including 8-arm, 10-arm, 16-arm, 30-arm, 36-arm, and 40-arm models.
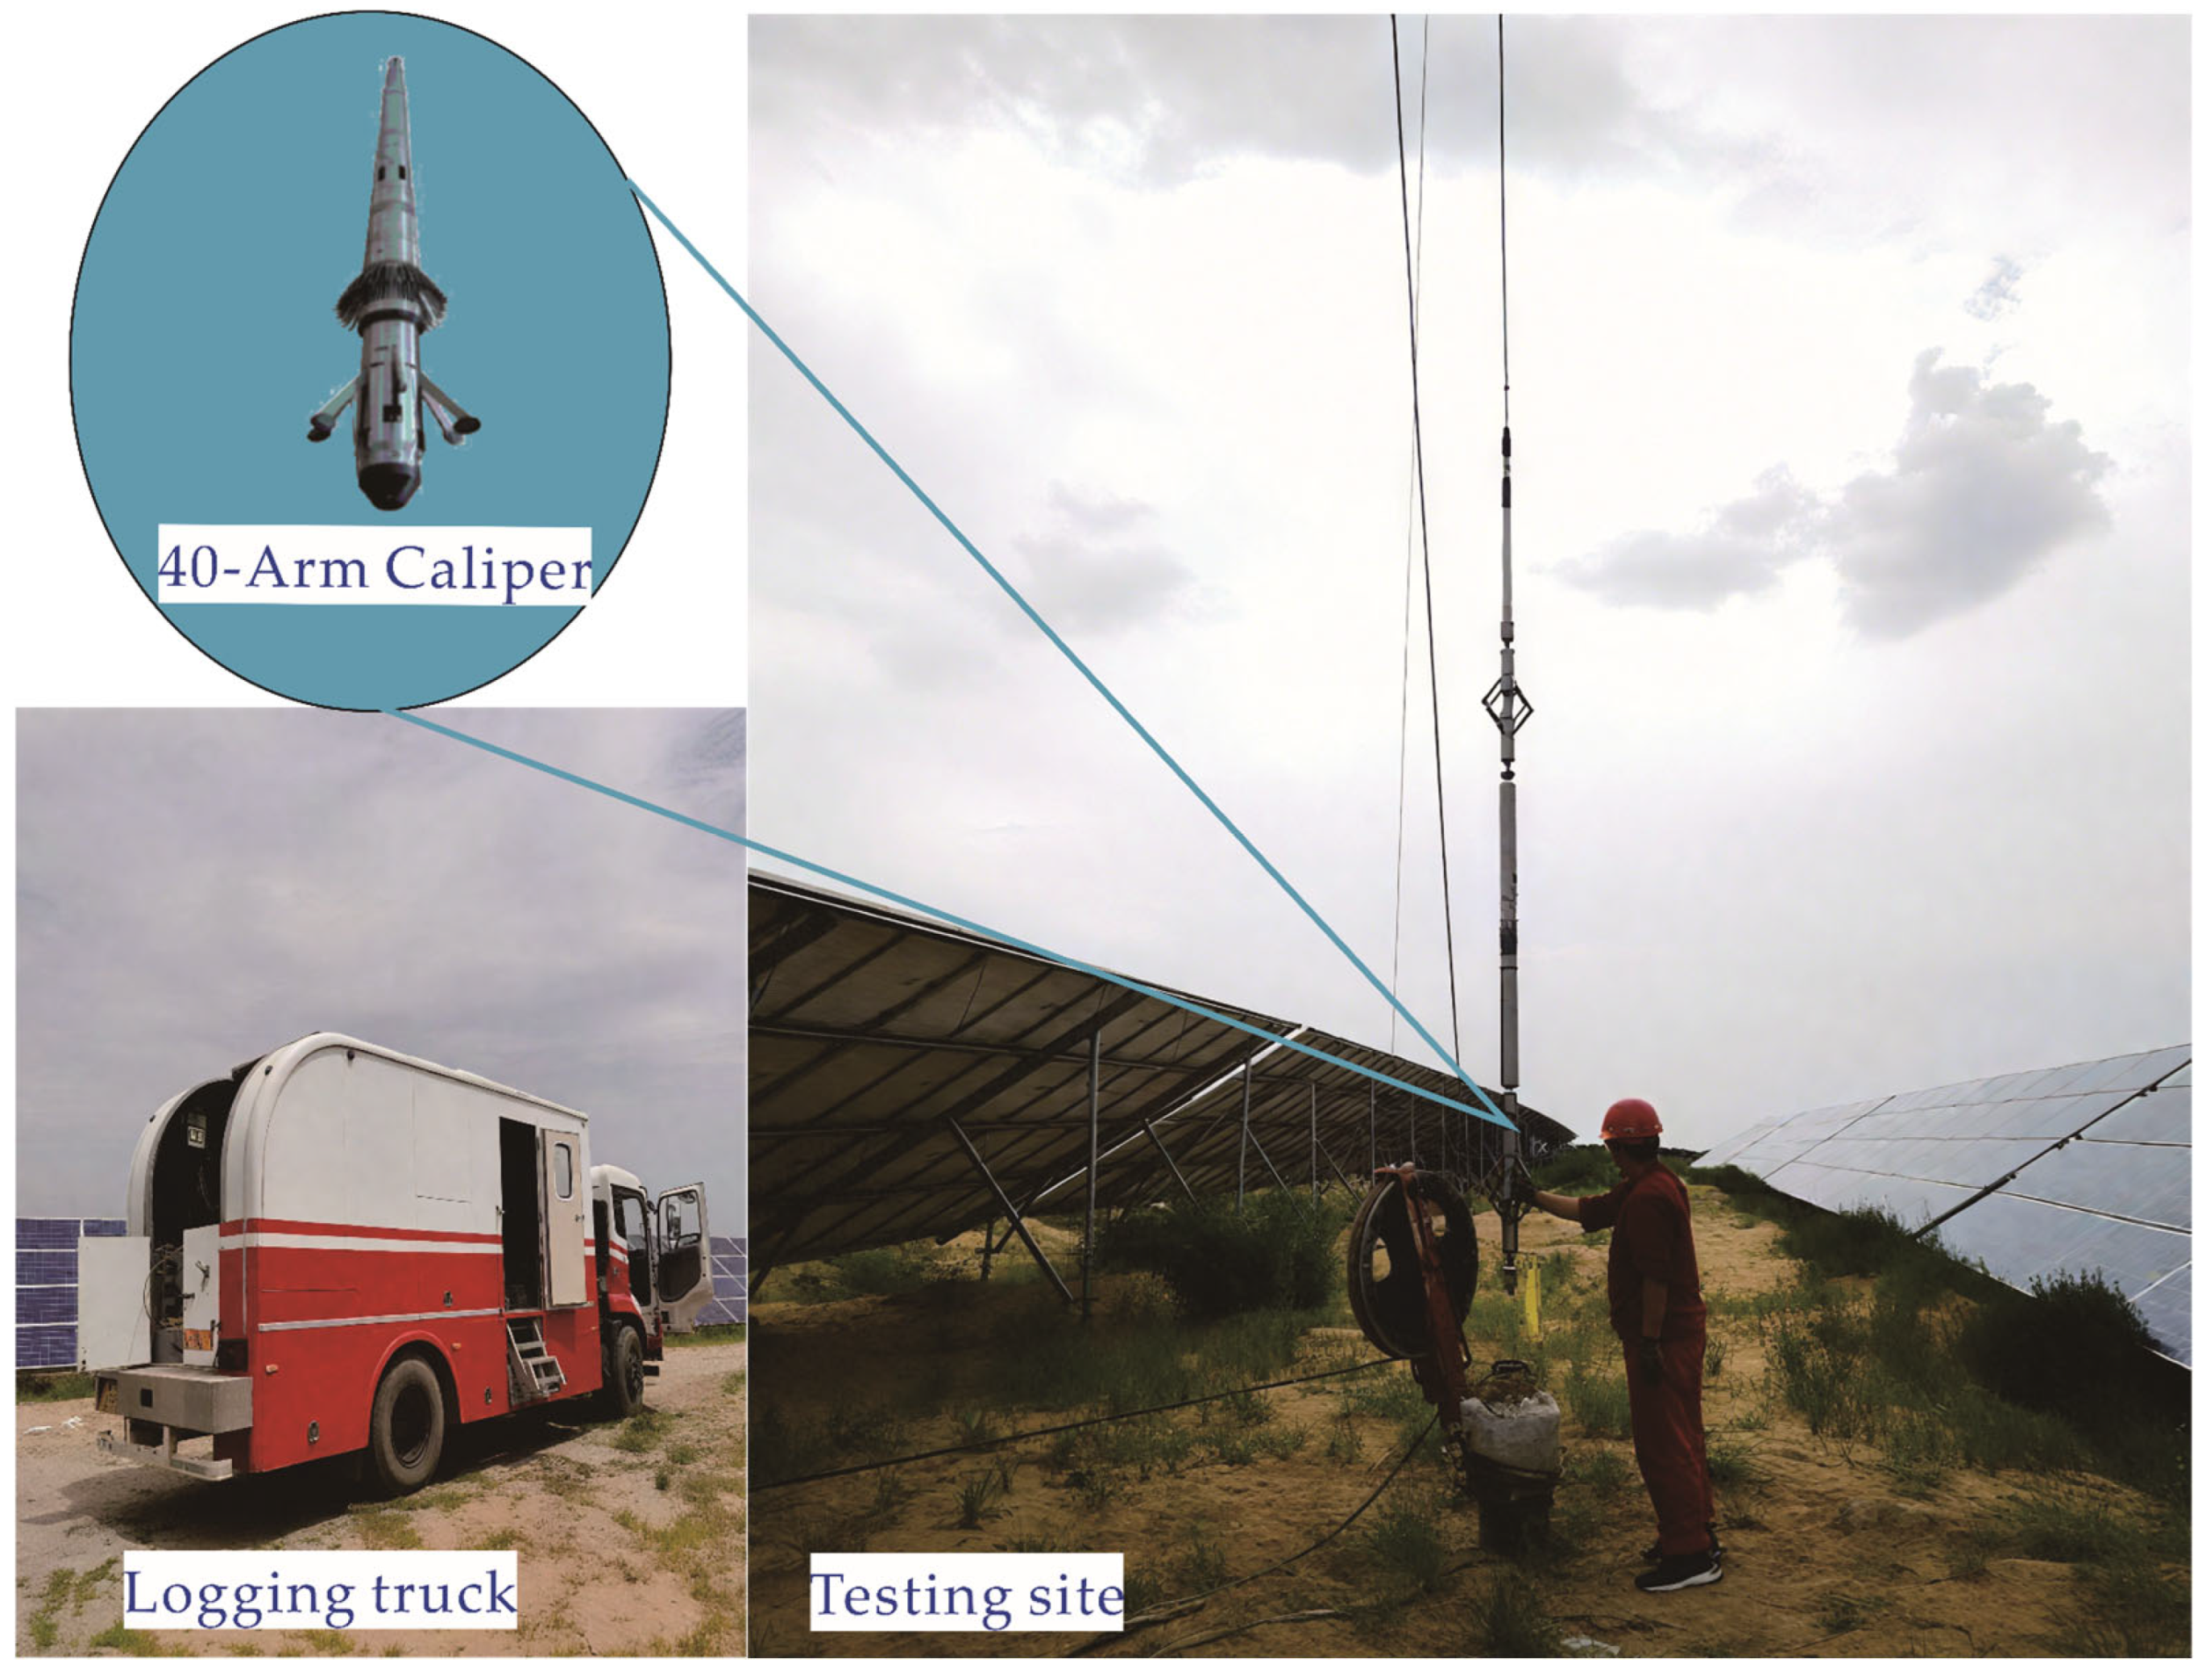
The 40-arm wellbore diameter gauge is mainly used to assess the quality of metal casings, detect casing deformation, breaks, bends, holes, cracks, corrosion, and contamination, and evaluate the condition of the casing. The 40-sensor, 40-arm wellbore diameter gauge is a mechanical instrument designed for measuring wellbore diameter. Its advantages include high measurement accuracy and a detailed wellbore curve that shows casing deformation. The sensor employs a non-contact displacement sensor, which is characterized by high accuracy and sensitivity. At the same time, the sensor does not wear out during instrument use, reducing the need for sensor maintenance and thereby extending the instrument’s service life. Its technical features include the ability to measure 40 single-arm wellbore diameter curves simultaneously. The direct measurement values for each arm of the instrument are the casing radius values, which can be used to identify casing deformation, fractures, bending, and internal wall corrosion. The instrument has an outer diameter of 70 mm and employs single-core logging cables. Communication between downhole tools and the surface computerized logging system uses Manchester encoding. The measuring arms and centralizers of the 40-sensor/40-arm caliper tool are controlled by surface voltage.
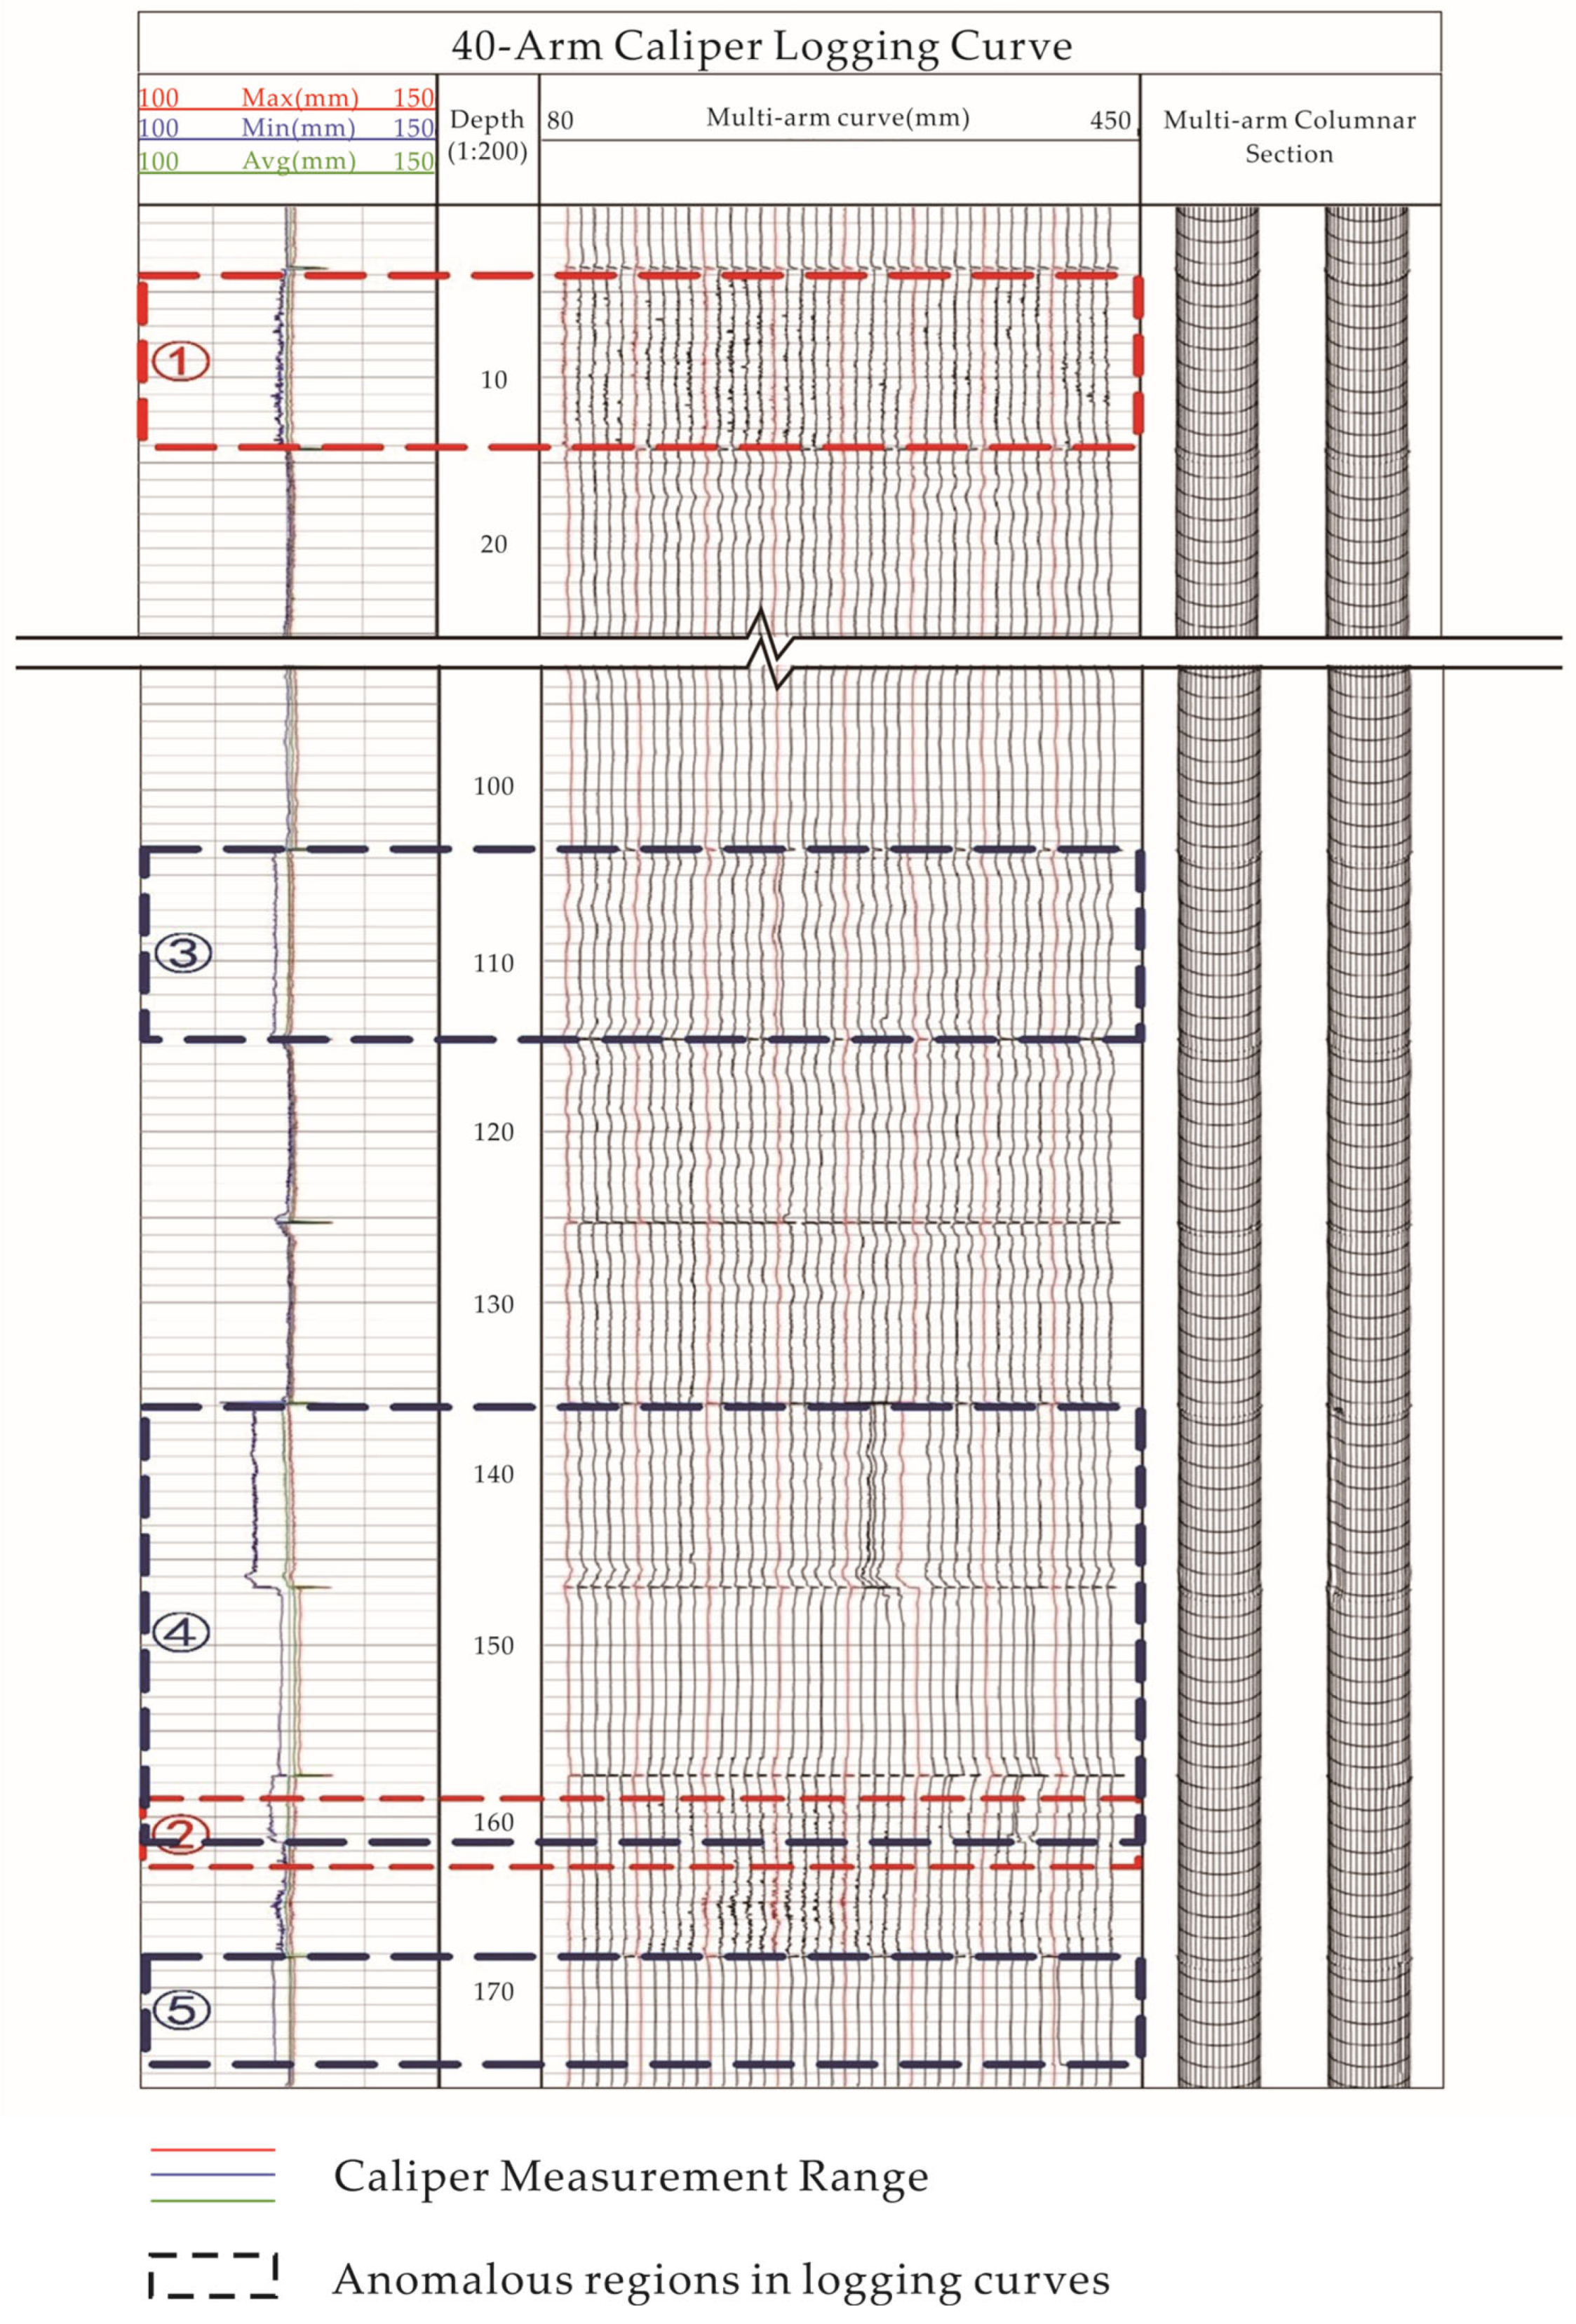
In order to improve testing accuracy and more accurately monitor casing deformation and other damage conditions, a 40-arm wellbore diameter meter was used for logging, with a logging engineering volume of 176 m. The wellbore diameter testing site is shown in Figure 11. The curve diagram of the 40-arm test results is shown in Figure 12.
It can be seen that the gas well production casing has slight corrosion at ① 4.3 m to 14.0 m and ② 159.0 m to 163.0 m, causing a slight expansion of the well diameter. At locations ③ 103.5–114.5 m, ④ 135.9–161.5 m, and ⑤ 168.1–174.5 m, there are isolated cases where the wellbore diameter measurements are smaller than expected. The cause of this discrepancy may be that during the installation of the production casing, drilling mud adhered to the inner wall of the casing, and the mud residue caused the wellbore diameter measurement to be smaller than expected. The 40-arm caliper tool testing detected no casing deformation or fracture damage in the production casing of the gas well caused by mining at the 132,201 working face. Results indicate that overlying strata movement and deformation caused by mining exerted no destructive impact on the casing structure integrity.

5.3. Distributed Fiber Optic In Situ Dynamic Monitoring

Monitoring of rock mass deformation and failure presents challenges such as large deformations, high concealment, poor continuity, extended duration, and harsh environmental conditions. Consequently, sensing optical fibers must meet the following requirements: moderate fiber length, excellent tensile strength, high resistance to bending, effective protection against external impacts, corrosion resistance, good integrity, and superior strain transmission capability. Considering three factors—optical performance, mechanical strength, and strain transmission capability—three types of fibers were selected: metal-core stranded distributed strain sensing fiber (MKS), 5 m-fixed point distributed strain sensing fiber (5 m-IFS), and fiber-reinforced distributed strain sensing fiber (GFRS). MKS fiber offers superior strength, 5 m-IFS fiber provides enhanced resistance to deformation, and GFRS fiber delivers high precision. These three fiber types complement each other.
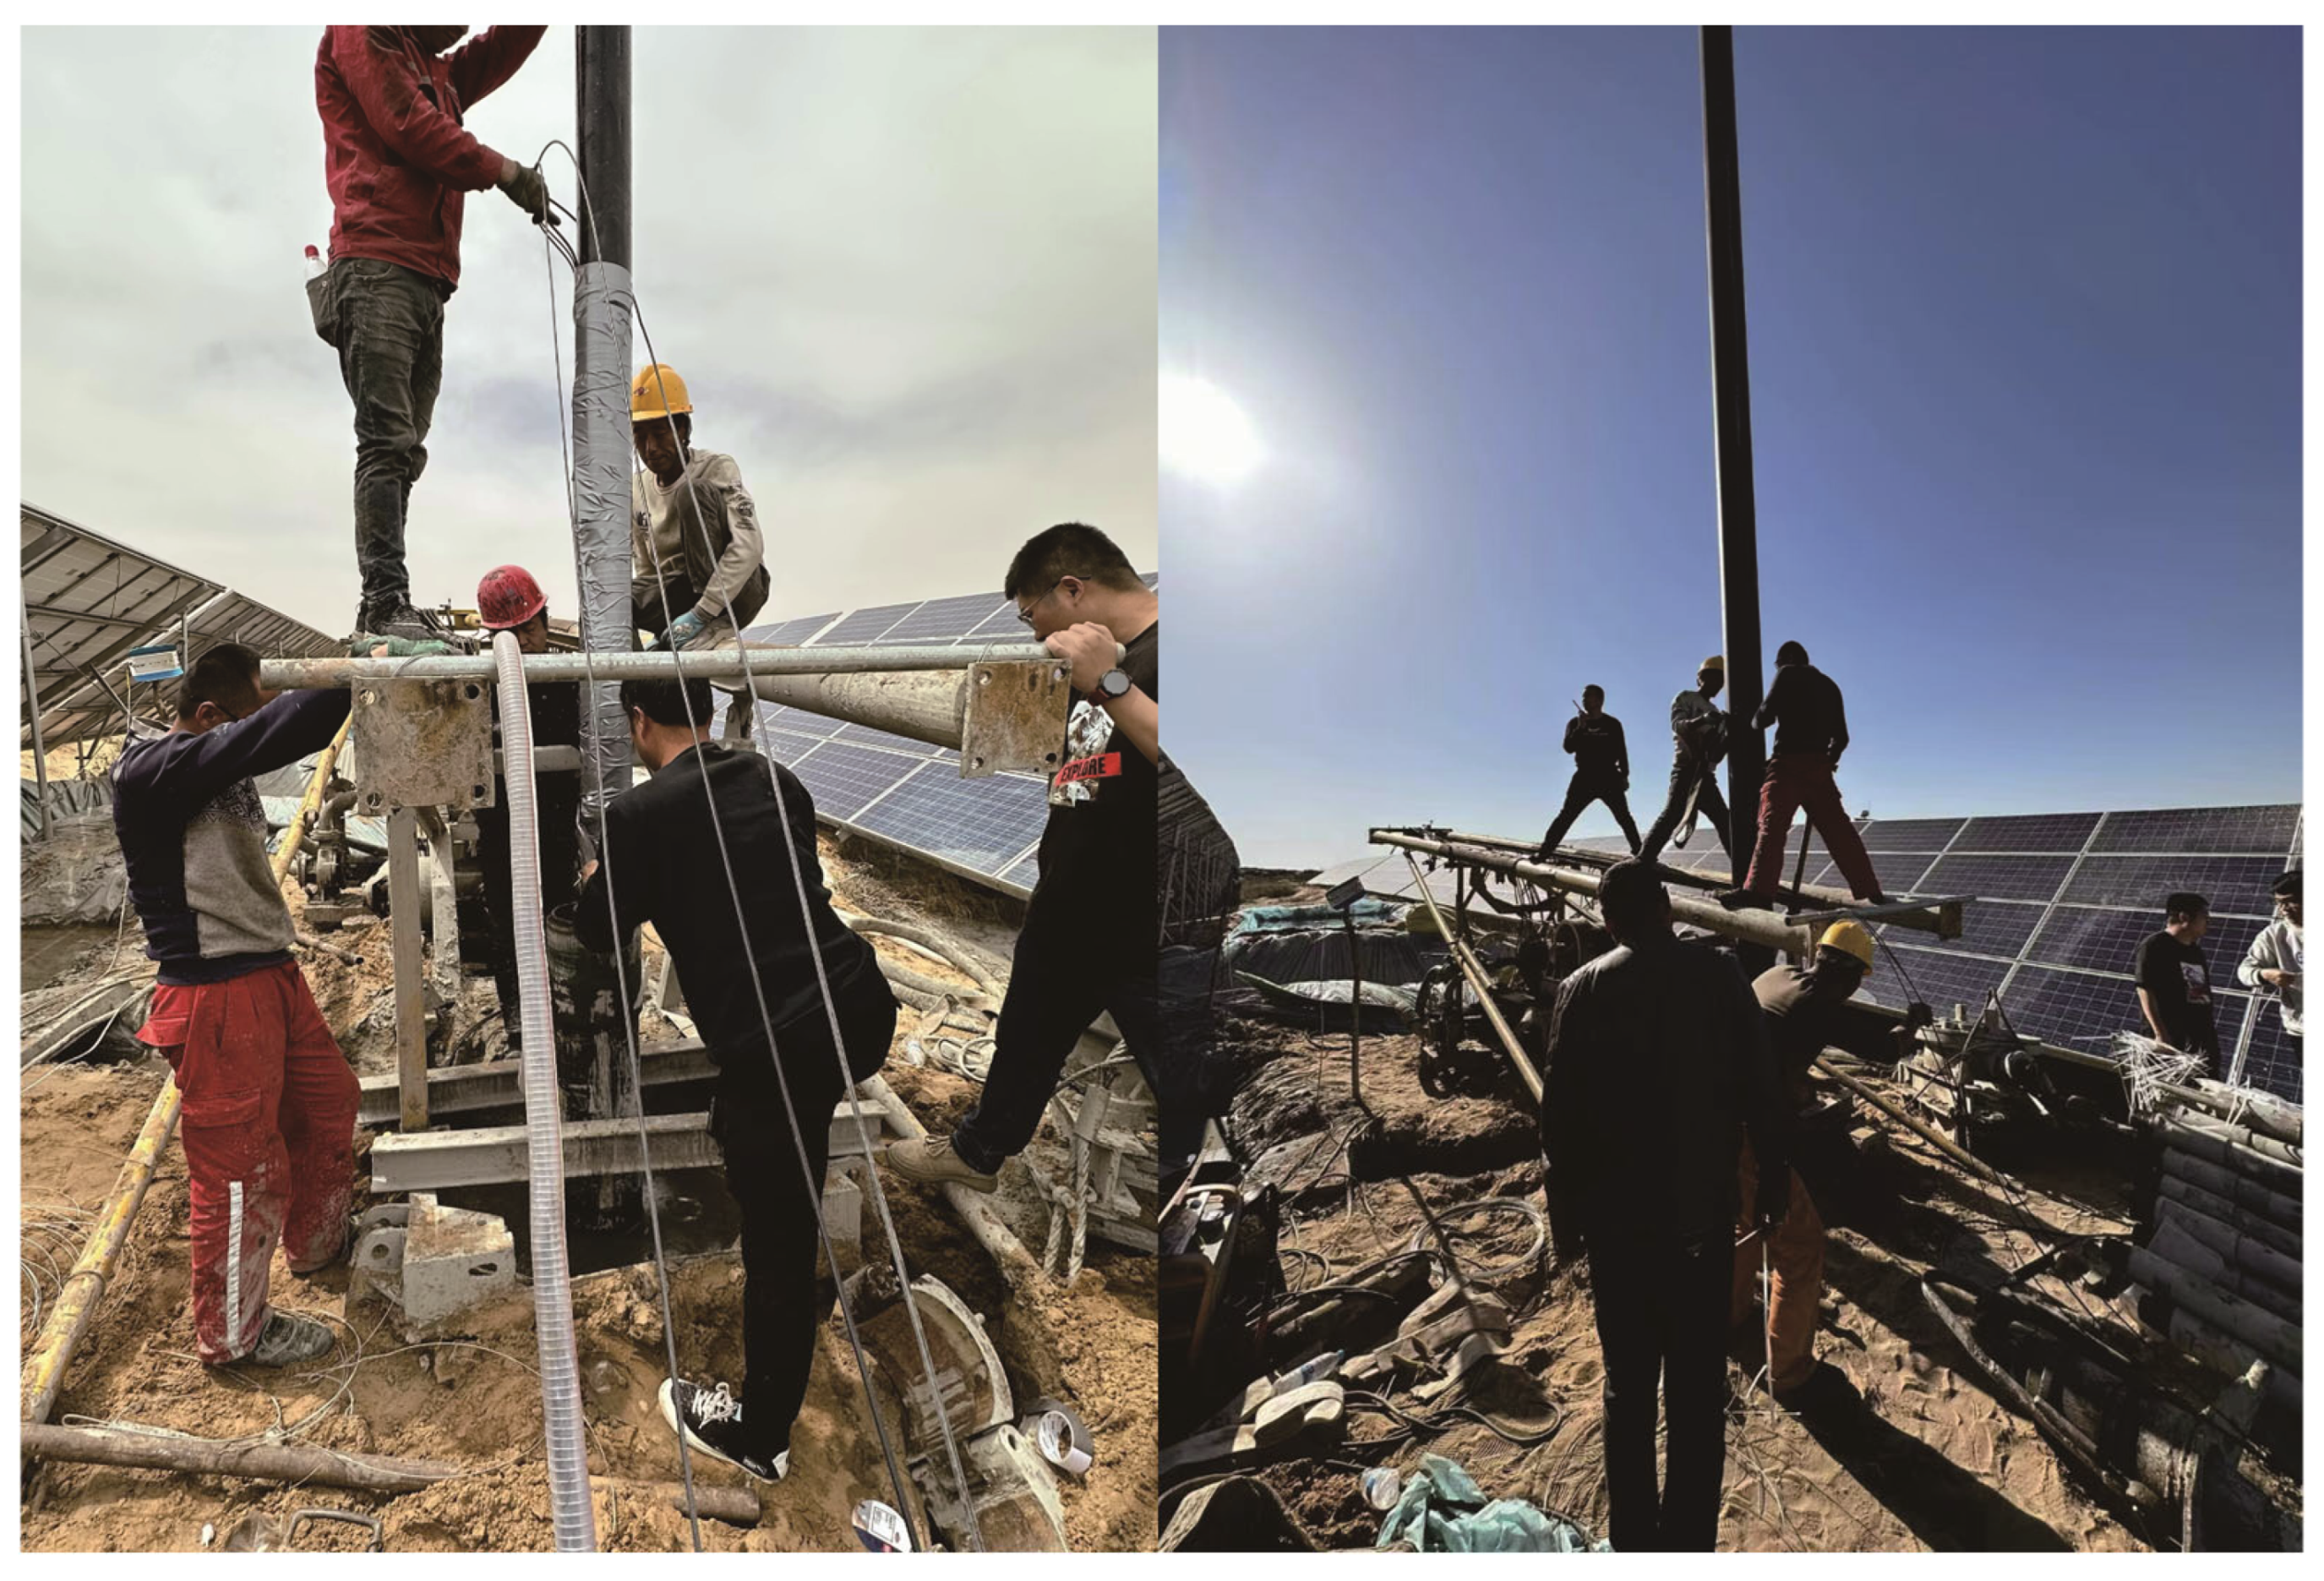
The gas well casing composite structure consists of a protective casing, production casing, and specialized cement for oil and gas wells. After drilling and installing the simulated gas well casing structure, fiber optic sensors must be installed between the protective casing and the borehole wall. These sensors are then cemented in place using cement slurry. The on-site construction process is shown in Figure 13, while the specific fiber optic sensor layout is illustrated in Figure 14. Simultaneously, specialized instruments are used to inspect the fiber optic cables before and after installation to ensure installation quality.
Monitoring employs periodic manual inspections. Based on the mining progress of the 132,201 working face, tests are conducted once or twice daily, with results averaged to ensure timely and effective monitoring data. Under mining influence, a single-ended distributed optical fiber strain demodulator based on BOTDR technology is utilized to process and interpret field-collected fiber monitoring data. This enables analysis of strain variation characteristics in the inner and outer casings of gas wells, thereby evaluating whether coal mining activities cause deformation or damage to the gas wells.
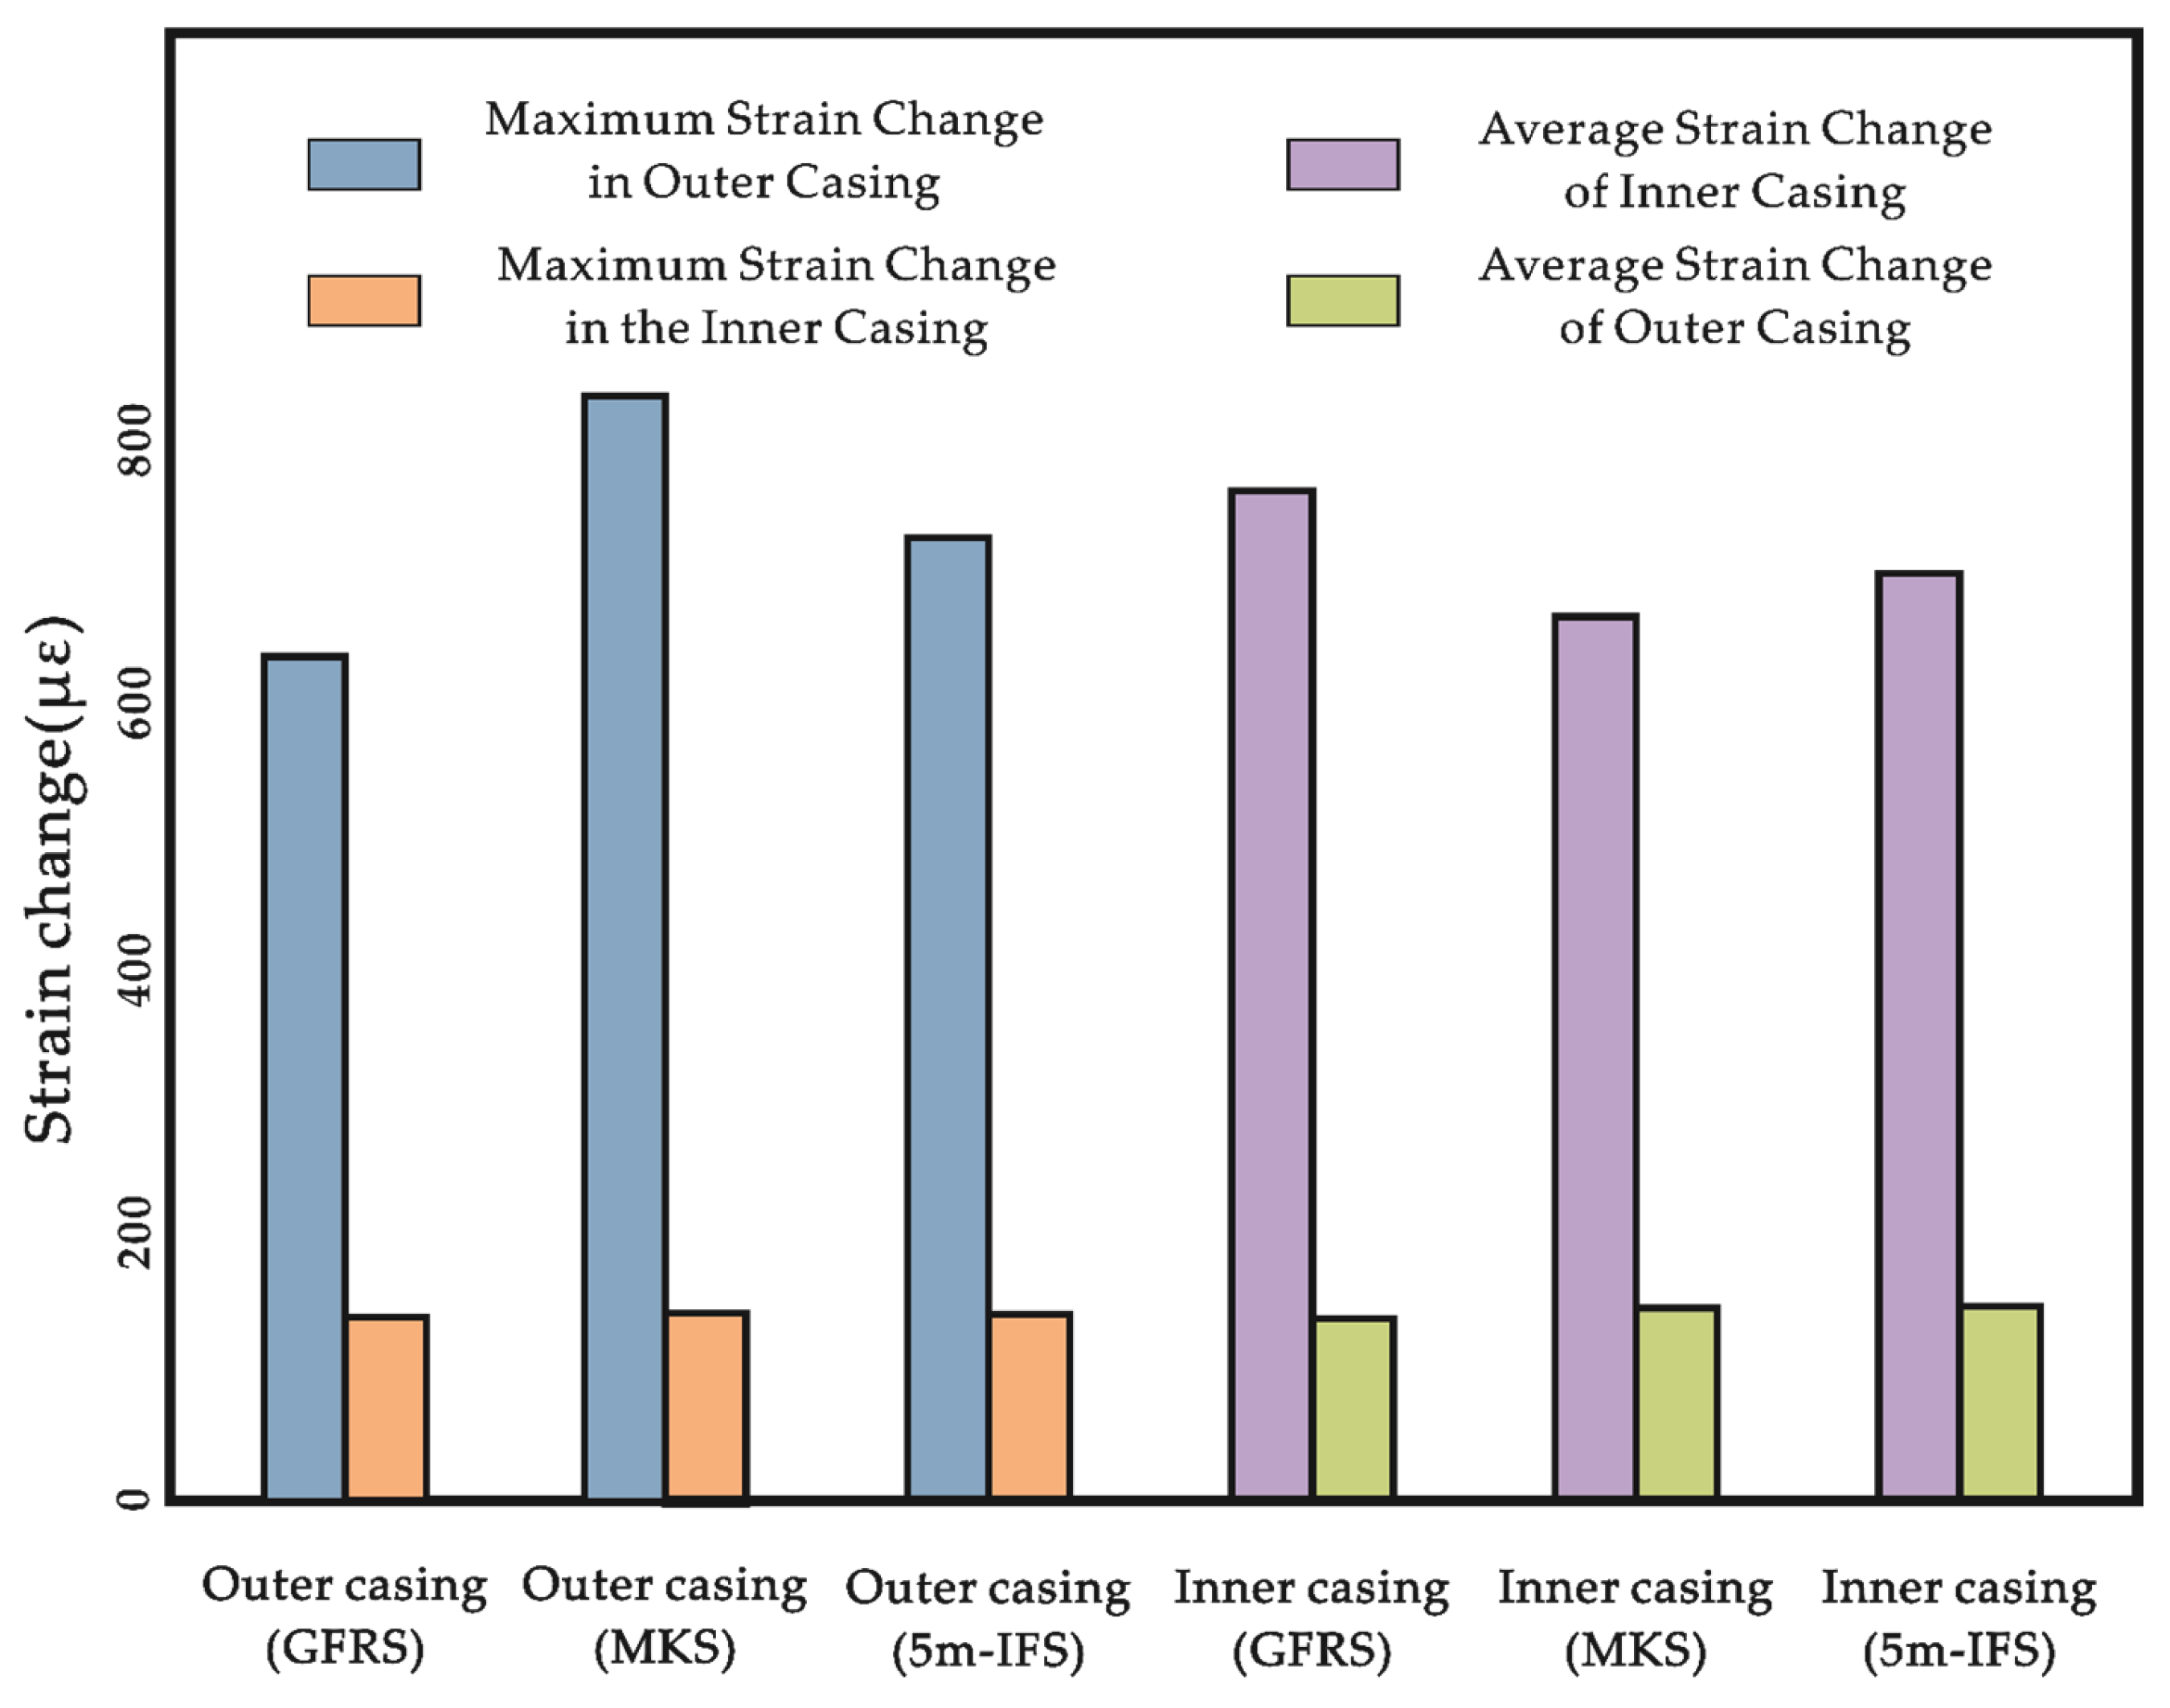
The strain distribution characteristics of the overlying strata affected by mining activities, as monitored by three different types of sensing optical cables, exhibit certain differences. Compared to Glass Fiber Reinforced Strain Sensing (GFRS) and Metal-based Cable-shaped Optical Fiber for Strain Sensing (MKS), the strain data monitored by the 5 m Point-fixed Optical Fiber for Strain Sensing (5 m-IFS) exhibits more pronounced strain peaks and clearer fluctuation patterns. This is primarily due to the inherent properties of the 5 m Point-fixed Optical Fiber for Strain Sensing (5 m-IFS) itself. Specifically, this optical fiber converts large local deformations within the formation into small deformations between two fixed points, thereby enabling continuous monitoring of large-scale formation deformations. In summary, all three types of optical fibers can accurately and effectively reflect the deformation and failure characteristics of rock strata at different levels, thereby enabling the detection and analysis of stress–strain changes caused by deformation and displacement of the overlying strata during mining operations. The strain trends experienced by the outer protective casing and inner production casing are essentially identical. Due to the geological forces induced by mining operations, the overall tensile strain state gradually decreases as the 132,201 working face advances, leading to a stabilization of stress conditions and a progressive reduction in tensile strain. The strain variations in the gas well casing assembly structure caused by mining activity were relatively minor overall, as shown in Figure 15. The maximum strain change for the outer protective casing was 836 με, with an average strain change of 141 με. For the inner production casing, the maximum strain change was 766 με, with an average strain change of 143 με. The maximum strain variation in the inner and outer casing layers is significantly less than the yield strain of the casing itself. Therefore, the inherent strength of the inner and outer casing layers is sufficient to resist stress–strain changes induced by mining activities, ensuring that the gas well casing assembly structure will not experience significant instability due to mining operations.

6. Conclusions

Through FLAC3D numerical simulation analysis, the study examined how coal seam mining affects the vertical and shear stresses on the gas well casing and surrounding rock. The results show that the shear stress on the inner and outer casings initially decreases and then fluctuates as burial depth increases. Overall, within the 0–80 m depth range, the casing experiences relatively high shear stress (maximum of 5.8 MPa), indicating a strong influence from mining activities. However, these values are still well below the casing’s shear strength limit material.
For the analysis of gas well displacement caused by mining, the maximum horizontal displacement of shallow gas wells is 2.3 cm. At a burial depth of 160 m, the horizontal displacement increases to 5 mm. Overall, the gas wells tend to tilt toward the working face. Vertically, the displacement of the wellbore first decreases and then increases, mainly due to the development of water-conducting fracture zones and mining-induced tilting. However, the synergistic deformation of the double casing structure and cement ring effectively suppressed shear displacement, and the FLAC3D model showed no significant shear slip at the cement ring-rock interface. The small and evenly distributed displacement confirms that the sound structure remains stable under mining conditions and meets safety standards requirements.
Field monitoring results support the findings from numerical simulations: Pressure monitoring indicates that the gas well pressure is steadily decreasing at an average rate of 0.01 MPa/d, with no leakage points. The primary cause of the pressure decline is water seepage into the borehole, confirming that overburden deformation has not compromised the casing’s integrity and tightness. Multi-arm caliper logging (40-arm tool at 176 m depth) detected only localized minor corrosion and slight diameter reduction caused by mud deposition, with no evidence of mining-induced deformation, fractures, or shear dislocation damage. Through on-site fiber optic monitoring of the gas well casing assembly structure, the maximum strain change in the outer casing liner was 836 με, while the maximum strain change in the inner production casing was 766 με. Both values are significantly lower than the yield strain of the casing itself. Therefore, neither the inner nor outer casing nor the surrounding rock of the gas well will undergo deformation or failure due to mining activities. These findings match exactly with numerical simulations predicting minimal displacement, ultimately confirming that longwall mining at the 132,201 working face has not compromised the structural integrity or mechanical performance of the casing.
Due to time constraints, this study, based on the specific geological context of the Ordos Basin characterized by shallowly buried, gently dipping coal seams and interbedded sandstone-shale formations, reveals the vertical superposition relationship between coal-tight sandstone gas reservoirs and the applicability of synergistic mining techniques. When extending these conclusions to significantly different geological conditions such as deep high-stress zones or structurally complex areas, their universality must be validated in conjunction with specific geological circumstances. Future research can be expanded to examine the interaction mechanisms between mining activities and oil and gas wells under different geological conditions; Simultaneously, advanced technologies such as microseismic monitoring can be combined to develop a dynamic monitoring system for the entire life cycle of gas well casings. This system can quantify fatigue damage patterns in casing materials caused by long-term repeated mining operations and assess how cement ring degradation impacts wellbore integrity. Future research will focus on making further improvements to broaden its application scope, offering more relevant theoretical support and technical solutions for the efficient development of superimposed resources under different conditions.

Author Contributions

Methodology, W.L.; Software, Z.G.; Formal analysis, D.L.; Writing—original draft, Z.G.; Writing—review and editing, Y.Y.; project administration, Y.L. All authors have read and agreed to the published version of the manuscript.

Funding

This research was funded by the National Natural Science Foundation of China (Grant No. 42372316). All of the funders are Wenping Li.

Data Availability Statement

The original contributions presented in this study are included in the article. Further inquiries can be directed to the corresponding authors.

Acknowledgments

The authors express their gratitude to everyone who provided assistance in conducting the present study.

Conflicts of Interest

The authors declare no conflicts of interest.

References

  1. Hao, D.; Zhang, T.; Yang, Y.; Ren, J. Study on the Disturbance Characteristics and Control Strategies of Coordinated Exploitation of Superimposed Resources of Coal and Oil-Type Gas in Ordos Basin. Energy Sci. Eng 2023, 11, 3964–3978. [Google Scholar] [CrossRef]
  2. Yuan, L. Scientific problem and countermeasure for precision mining of coal and associated resources. China Coal Soc. 2019, 44, 1–9. [Google Scholar] [CrossRef]
  3. Qin, B.; Shi, Z.; Hao, J.; Ye, D.; Liang, B.; Sun, W. Analysis of the Space–Time Synergy of Coal and Gas Co-Mining. ACS Omega 2022, 7, 13737–13749. [Google Scholar] [CrossRef]
  4. Liu, J.; Yang, T.; Wang, L.; Chen, X. Research Progress in Coal and Gas Co-mining Modes in China. Energy Sci. Eng. 2020, 8, 3365–3376. [Google Scholar] [CrossRef]
  5. Dong, M.; Wang, W. Research on coordinated exploitation for resources overlap area of oil-gas and coal in Ordos Basin. Chin. Energy Environ. Prot. 2017, 101–104. [Google Scholar] [CrossRef]
  6. Huang, B.; Zhao, X.; Zhang, Q. Framework of the theory and technology for simultaneous mining of coal and its associated resources. J. China Univ. Min. Technol. 2016, 45, 653–662. [Google Scholar] [CrossRef]
  7. Yuan, L.; Zhang, T.; Zhao, Y.; Ren, B.; Hao, X.; Xu, C. Precise coordinated mining of coal and associated resources: A case of environmental coordinated mining of coal and associated rare metal in Ordos basin. China Univ. Min. Technol. 2017, 46, 449–459. [Google Scholar] [CrossRef]
  8. Zhou, F.; Wang, T.; Ma, C.; Lei, P.; Zhang, X.; Ding, Q. Review on the Evaluation of Casing Damage Level in Oil and Gas Field. MATEC Web Conf. 2019, 256, 02008. [Google Scholar] [CrossRef]
  9. Zhang, Z.; Li, A. Research Overview of Casing Damage in China’s Oil Fields. In Proceedings of the International Conference on Architectural Engineering and New Materials, Guangzhou, China, 7 October 2015; pp. 409–415. [Google Scholar]
  10. Yu, X.; Cen, X.; Kan, C.; Hu, Y.; Yang, Y.; Tao, S.; Chen, X.; Chen, X.; Hu, Z. Numerical Simulation Analysis of Wellbore Integrity and Casing Damage in High-Temperature Injection and Production of Shale Oil. Processes 2023, 11, 3053. [Google Scholar] [CrossRef]
  11. Zhang, J.; Lian, Z.; Zhou, Z.; Song, Z.; Liu, M.; Yang, K.; Liu, Z. Safety and Reliability Assessment of External Corrosion Defects Assessment of Buried Pipelines—Soil Interface: A Mechanisms and FE Study. J. Loss Prevent. Proc. 2023, 82, 105006. [Google Scholar] [CrossRef]
  12. Lian, Z.; Yu, H.; Lin, T.; Guo, J. A Study on Casing Deformation Failure during Multi-Stage Hydraulic Fracturing for the Stimulated Reservoir Volume of Horizontal Shale Wells. Gas Sci. Eng. 2015, 23, 538–546. [Google Scholar] [CrossRef]
  13. Akbarpour, M.; Abdideh, M. Wellbore Stability Analysis Based on Geomechanical Modeling Using Finite Element Method. Model. Earth Syst. Environ. 2020, 6, 617–626. [Google Scholar] [CrossRef]
  14. Hua, S.; Yao, X. Analysis of the Mechanism by Which High-Toughness Cement Rings Reduce Casing Loss in Oil and Gas Wells. Oil-Gasf. Surf. Eng. 2009, 28, 34–35. [Google Scholar]
  15. Yang, S.; Han, L.; Feng, C.; Wang, H.; Feng, Y.; Wu, X. Mechanical Performance of Casing in In-Situ Combustion Thermal Recovery. J. Petrol. Sci. Eng. 2018, 168, 32–38. [Google Scholar] [CrossRef]
  16. Huang, Y.; Li, X.; Dai, K.; Zhang, Z.; Zhang, C.; Lv, C.; Zhang, X. Damage Causes and Solutions for Shale Gas Production Casing. Pet. Tubul. Goods Instrum. 2020, 6, 82–85. [Google Scholar] [CrossRef]
  17. Alsubaih, A.A.S.; Sepehrnoori, K.; Delshad, M.; Alsaedi, A. A Comprehensive Review of Well Integrity Challenges and Digital Twin Applications Across Conventional, Unconventional, and Storage Wells. Energies 2025, 18, 4757. [Google Scholar] [CrossRef]
  18. Jiang, M.; Zhou, F.; Liu, Y.; Ye, G.; Wang, F.; Kang, J. Shear Mechanical Behavior and Stress Transfer Characteristics of the Bilayer Casing of Gob Gas Ventholes. Geoenergy Sci. Eng. 2023, 226, 211656. [Google Scholar] [CrossRef]
  19. Liang, S.; Elsworth, D.; Li, X.; Fu, X.; Sun, B.; Yao, Q. Key Strata Characteristics Controlling the Integrity of Deep Wells in Longwall Mining Areas. Int. J. Coal Geol. 2017, 172, 31–42. [Google Scholar] [CrossRef]
  20. Liang, S.; Elsworth, D.; Li, X.; Yang, D. Topographic Influence on Stability for Gas Wells Penetrating Longwall Mining Areas. Int. J. Coal Geol. 2014, 132, 23–36. [Google Scholar] [CrossRef]
  21. Zhang, P.; Dougherty, H.; Su, D.; Trackemas, J.; Tulu, B. Influence of Longwall Mining on the Stability of Gas Wells in Chain Pillars. Int. J. Min. Sci. Technol. 2020, 30, 3–9. [Google Scholar] [CrossRef]
  22. Ma, Y.; Mu, J.; Xu, P.; Liang, S.; Xu, Y.; Wang, X. Overburden deformation characteristics and gas wellstability under influence of multiple mining. Shaanxi Coal 2025, 44, 15–23+85. [Google Scholar] [CrossRef]
  23. Su, D.W.H. Effects of Longwall-Induced Stress and Deformation on the Stability and Mechanical Integrity of Shale Gas Wells Drilled through a Longwall Abutment Pillar. Int. J. Min. Sci. Technol. 2017, 27, 115–120. [Google Scholar] [CrossRef]
  24. Abdollahipour, A.; Soltanian, H.; Pourmazaheri, Y.; Kazemzadeh, E.; Fatehi-Marji, M. Sensitivity Analysis of Geomechanical Parameters Affecting a Wellbore Stability. J. Cent. South Univ. 2019, 26, 768–778. [Google Scholar] [CrossRef]
  25. Schatzel, S.J.; Karacan, C.Ö.; Dougherty, H.; Goodman, G.V.R. An Analysis of Reservoir Conditions and Responses in Longwall Panel Overburden during Mining and Its Effect on Gob Gas Well Performance. Eng. Geol. 2012, 127, 65–74. [Google Scholar] [CrossRef]
  26. Xiao, J.; Zhang, B.; Wang, Y.; Wang, T.; Liu, Y.; Wang, Y. Anchoring Effect of Abandoned Oil Wells in Coal, Oil, and Gas Co-Production Areas and Its Influence on Overburden Stability. Appl. Sci. 2025, 15, 4223. [Google Scholar] [CrossRef]
  27. Peng, W. FLAC3D Practical Tutorial; Machinery Industry Press: Beijing, China, 2007. [Google Scholar]
  28. Xie, H.; Zhou, H.; Wang, J. Application of FLAC to Predict Ground Surface Displacements Due to Coal Extraction and Its Comparative Analysis. Chin. J. Rock Mech. Eng. 1999, 5, 29–33. [Google Scholar]
  29. Wang, Y.; Xiang, Y.; Zhang, X.; Liu, S.; Jing, J.; Chen, Y. Study on the Mechanical Behavior and Collapse Resistance of Double-Casing under Gypsum-Salt Layer. J. Phys. Conf. Ser. 2025, 2964, 012006. [Google Scholar] [CrossRef]
  30. Gholami, R.; Rasouli, V.; Aadnoy, B.; Mohammadnejad, M. Geomechanical and Numerical Studies of Casing Damages in a Reservoir with Solid Production. Rock Mech. Rock Eng. 2016, 49, 1441–1460. [Google Scholar] [CrossRef]
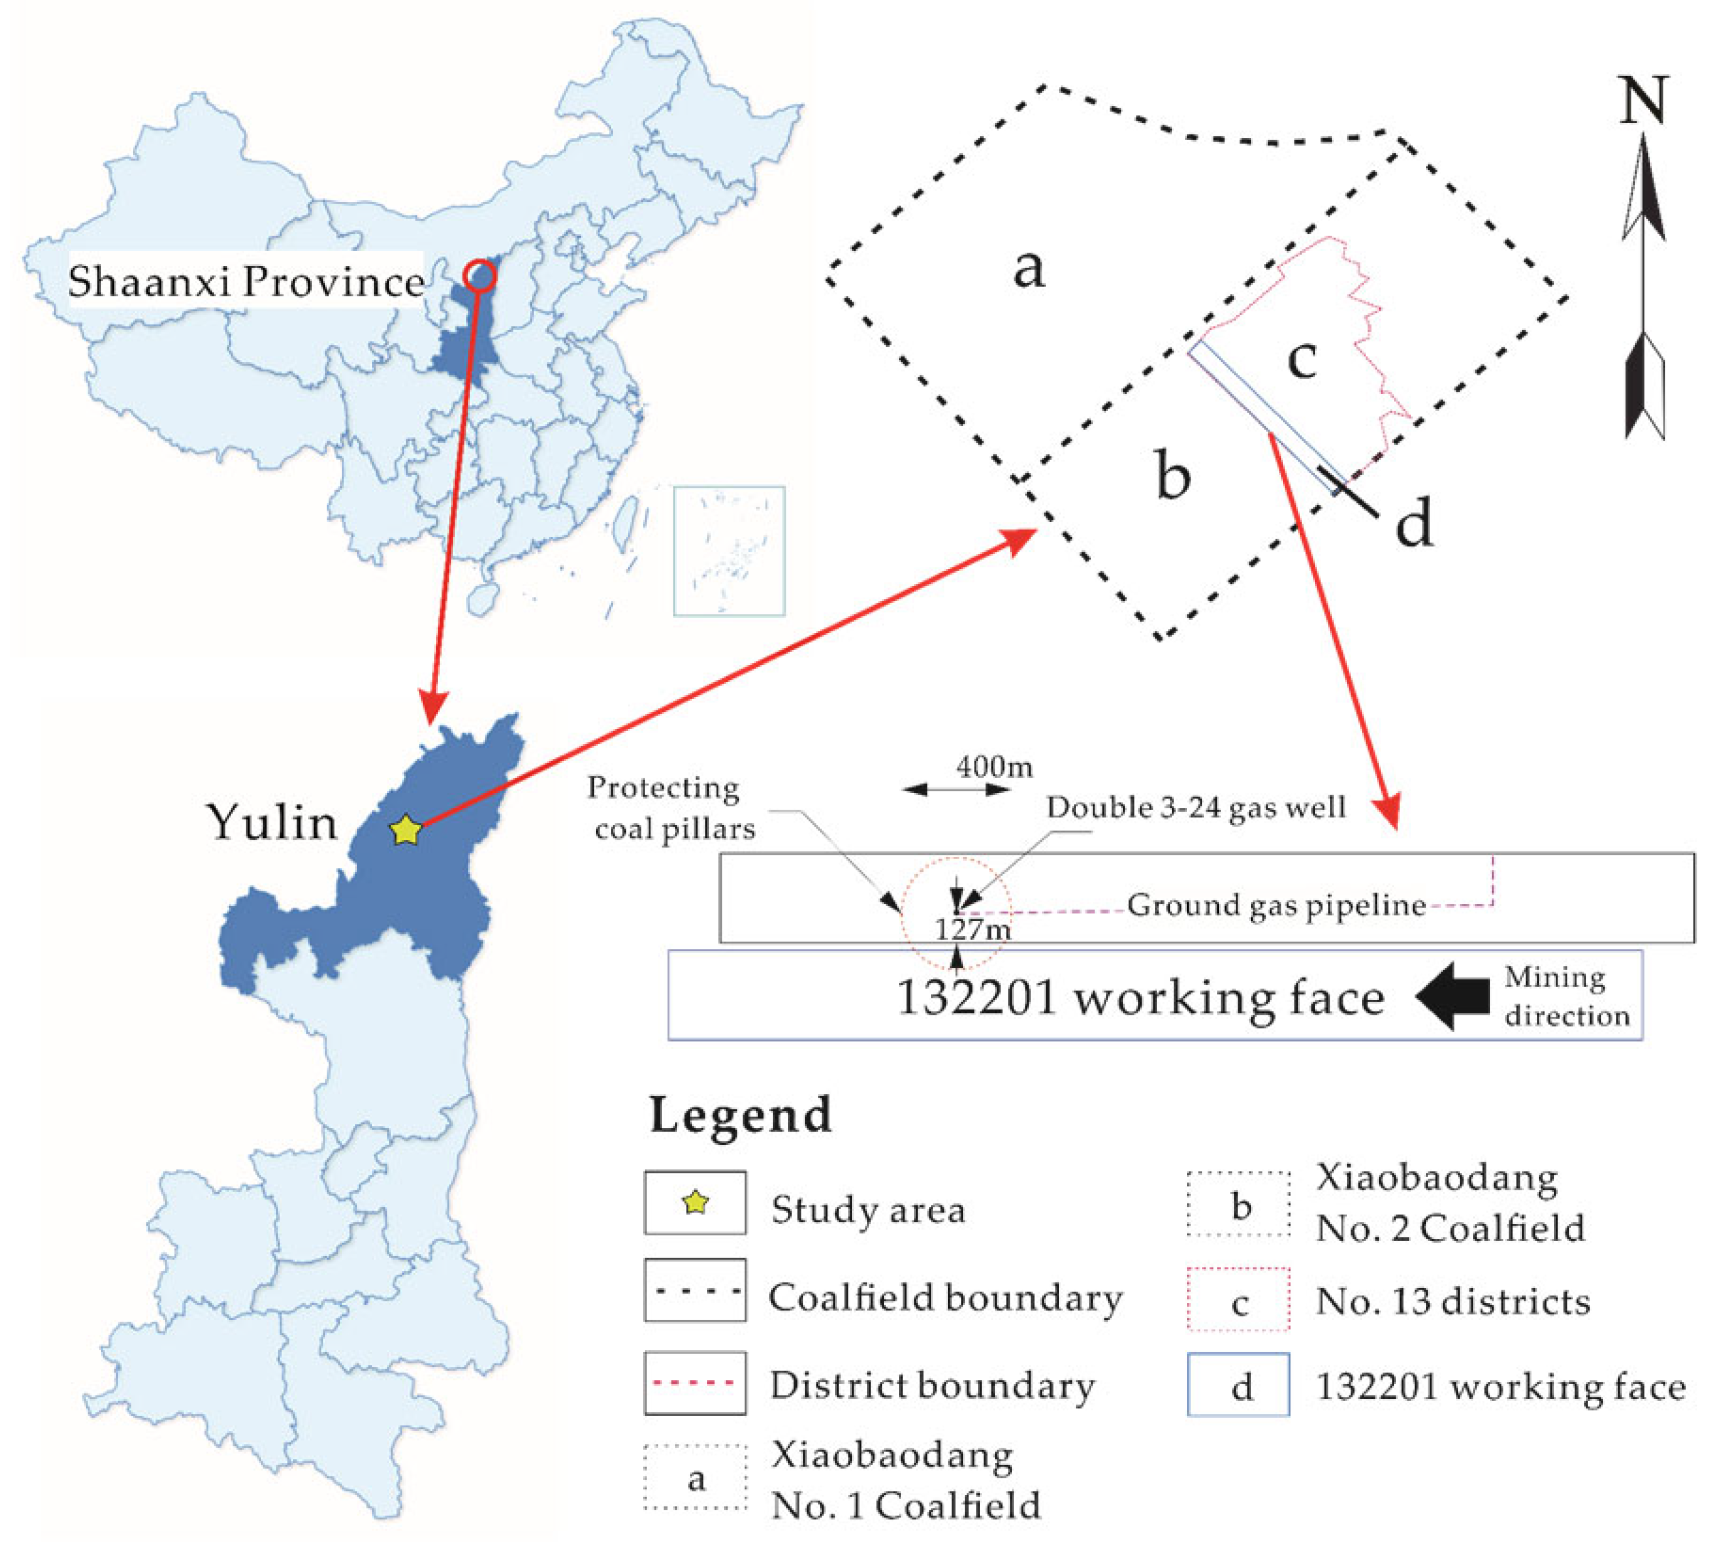
Figure 1. Overview of the study area.
Applsci 15 10674 g001
Figure 2. The overburden strata histogram of the 2−2# coal seam.
Applsci 15 10674 g002
Figure 3. Dimensions of the 132,201 working face and gas well model.
Applsci 15 10674 g003
Figure 4. Three-dimensional numerical model.
Applsci 15 10674 g004
Figure 5. Vertical stress distribution (inclination) during the stepwise excavation of the coal seam roof’s overburden (soil) layer in the 132,201 working face. (a) Distance from gas well: 120 m; (b) Distance from gas well: 60 m; (c) gas well location; (d) Passing through the gas well 60 m; (e) Passing through the gas well 120 m; (f) Passing through the gas well 180 m.
Applsci 15 10674 g005
Figure 6. Stress distribution characteristics of casing shears. (a) Shear Stress Distribution in the Inner and Outer Casing of a Gas Well; (b) Shear Stress Distribution in Gas Well Borehole Casing and Surrounding Rock.
Applsci 15 10674 g006
Figure 7. Simulation of gas well displacement cloud map affected by mining activity. (a) Distance from gas well: 120 m; (b) Distance from gas well: 60 m; (c) gas well location; (d) Passing through the gas well 60 m; (e) Passing through the gas well 120 m; (f) Passing through the gas well 180 m.
Applsci 15 10674 g007
Figure 8. Simulation of gas well displacement distribution affected by mining activity.
Applsci 15 10674 g008
Figure 9. Pressure test site.
Applsci 15 10674 g009
Figure 10. Pressure monitoring data (a) Pressure monitoring change curve; (b) Relative pressure change trend chart.
Applsci 15 10674 g010
Figure 11. Field testing of 40-arm caliper tool.
Applsci 15 10674 g011
Figure 12. Test results.
Applsci 15 10674 g012
Figure 13. Deploy and secure the fiber optic cable.
Applsci 15 10674 g013
Figure 14. Fiber optic cable layout diagram.
Applsci 15 10674 g014
Figure 15. Maximum and average strain variation in inner and outer casing.
Applsci 15 10674 g015
Table 1. * Physical and mechanical properties of model rock layers.
Rock TypeDensity (kg/m3)Tensile Strength (MPa)Young’s Modulus (GPa)Poisson RatioCohesive Strength (MPa)Internal Friction Angle (°)
sand layer1600 (1500–1700)0.002 (0.001–0.004)0.008 (0.005–0.012)0.35 (0.3–0.4)0.14 (0.1–0.18)15 (12–18)
red soil1860 (1750–1950)0.03 (0.02–0.05)0.3 (0.2–0.5)0.36 (0.32–0.4)0.36 (0.28–0.45)23 (20–26)
medium-grained sandstone2260 (2140–2380)5.62 (4.5–6.7)9.78 (7.8–11.7)0.25 (0.22–0.28)4.8 (4.0–5.6)41 (38–44)
siltstone2350 (2250–2450)9.26 (7.4–11.1)13.97 (11.2–16.7)0.24 (0.20–0.28)5.15 (4.1–6.2)40 (37–43)
coarse-grained sandstone2160 (2050–2270)1.08 (0.8–1.3)2.1 (1.7–2.5)0.22 (0.18–0.26)4.78 (3.8–5.7)51 (48–54)
sandy mudstone2360 (2260–2460)5.47 (4.4–6.6)6.08 (4.9–7.3)0.2 (0.17–0.23)3.9 (3.1–4.7)42 (39–45)
medium-grained sandstone2260 (2140–2380)5.62 (4.5–6.7)9.78 (7.8–11.7)0.25 (0.22–0.28)4.8 (4.0–5.6)41 (38–44)
siltstone2350 (2250–2450)9.26 (7.4–11.1)13.97 (11.2–16.7)0.24 (0.20–0.28)5.15 (4.1–6.2)40 (37–43)
sandy mudstone2360 (2260–2460)5.47 (4.4–6.6)6.08 (4.9–7.3)0.2 (0.17–0.23)3.9 (3.1–4.7)42 (39–45)
medium-grained sandstone2260 (2140–2380)5.62 (4.5–6.7)9.78 (7.8–11.7)0.25 (0.22–0.28)4.8 (3.9–5.9)41 (38–44)
siltstone2350 (2250–2450)9.26 (7.4–11.1)13.97 (11.2–16.7)0.24 (0.20–0.28)5.15 (4.1–6.2)40 (37–43)
medium-grained sandstone2260 (2140–2380)5.62 (4.5–6.7)9.78 (7.8–11.7)0.25 (0.22–0.28)4.8 (4.0–5.6)41 (38–44)
fine-grained sandstone2290 (2180–2400)6.01 (4.8–7.2)15.59 (12.5–18.7)0.33 (0.29–0.37)4.88 (3.9–5.9)42 (39–45)
siltstone2350 (2250–2450)9.26 (7.4–11.1)13.97 (11.2–16.7)0.24 (0.20–0.28)5.15 (4.1–6.2)40 (37–43)
fine-grained sandstone2290 (2180–2400)6.01 (4.8–7.2)15.59 (12.5–18.7)0.33 (0.29–0.37)4.88 (3.9–5.9)42 (39–45)
siltstone2350 (2250–2450)9.26 (7.4–11.1)13.97 (11.2–16.7)0.24 (0.20–0.28)5.15 (4.1–6.2)40 (37–43)
fine-grained sandstone2290 (2180–2400)6.01 (4.8–7.2)15.59 (12.5–18.7)0.33 (0.29–0.37)4.88 (3.9–5.9)42 (39–45)
medium-grained sandstone2260 (2140–2380)5.62 (4.5–6.7)9.78 (7.8–11.7)0.25 (0.22–0.28)4.8 (4.0–5.6)41 (38–44)
siltstone2350 (2250–2450)9.26 (7.4–11.1)13.97 (11.2–16.7)0.24 (0.20–0.28)5.15 (4.1–6.2)40 (37–43)
2−2 coal seam1450 (1350–1550)1.04 (0.8–1.3)7.36 (5.9–8.8)0.26 (0.22–0.30)2.37 (1.9–2.8)33 (30–36)
siltstone2350 (2250–2450)9.26 (7.4–11.1)13.97 (11.2–16.7)0.24 (0.20–0.28)5.15 (4.1–6.2)40 (37–43)
* The parameters in the table are formatted as “Average Value (Minimum Value–Maximum Value)”. Their variation ranges are comprehensively determined based on regional geological characteristics, statistical results from laboratory tests, and engineering experience, reflecting the heterogeneity of the rock strata.
Table 2. * Physical and mechanical parameters of double 3–24 gas well casing.
Type of CasingElastic Modulus (E/GPa)Poisson RatioTensile Strength (MPa)Density (kg/m3)Outer Diameter of Casing (mm)Wall Thickness (mm)
J55 steel grade2100.35177850244.58.94
N80 steel grade2100.36897850139.79.17
* The casing parameters represent standard material values and typically exhibit no significant variation range.
Table 3. * Physical and mechanical parameters of joints.
JointNormal Stiffness (Kn/MP)Tangential Stiffness (Ks/MP)Friction Angle (°)Cohesive Strength (MPa)Tensile Strength (MPa)
Interface between the cement ring and the rock layer250 (200–300)70 (50–90)30 (28–32)00
* The range of joint surface parameters is determined based on inversion analysis and engineering analogy experience. Cohesion and tensile strength are set to zero, consistent with the general assumption of contact surface mechanical behavior.
Disclaimer/Publisher’s Note: The statements, opinions and data contained in all publications are solely those of the individual author(s) and contributor(s) and not of MDPI and/or the editor(s). MDPI and/or the editor(s) disclaim responsibility for any injury to people or property resulting from any ideas, methods, instructions or products referred to in the content.