1. Introduction
The operational integrity of power transmission networks is fundamental to national energy infrastructure. To maintain this integrity, intelligent inspection methods, particularly those utilizing unmanned aerial vehicles (UAVs), have become a key technology for proactive maintenance [
1]. These inspections often target the condition of critical line hardware. Among these components, split pins are prevalent fasteners used to prevent the loosening of structural connections. However, defects in these pins—such as corrosion, displacement, or absence—can compromise structural security, potentially leading to conductor detachment or catastrophic line failure. Such events pose significant safety risks and can result in substantial economic losses [
2]. Therefore, developing an efficient and accurate method for the automated detection of split pin defects is of paramount importance for ensuring grid reliability.
Despite the advantages of UAV-based inspections, the automated detection of split pins from aerial imagery presents several technical challenges. Due to long inspection distances, split pins appear minute in high-resolution images and constitute a very low pixel-to-image ratio [
3]. This issue is exacerbated by cluttered and dynamic backgrounds, where environmental factors such as glare and partial occlusion can obscure the target and diminish target-to-background contrast. Consequently, traditional computer vision methods typically lack the required robustness and adaptability. While deep learning-based detectors like the YOLO series [
4,
5,
6,
7,
8] have achieved success in general object detection, they are not inherently optimized for such small-scale targets. Their direct application often results in unsatisfactory performance, characterized by high rates of both missed detections and false positives [
9]. Moreover, processing numerous high-resolution images with large, computationally intensive models is impractical, as the associated latency would fail to meet the real-time demands of power grid maintenance.
To address these challenges, prior research has largely converged on two main technical strategies. The first is a multi-stage, ‘coarse-to-fine’ detection paradigm based on task decomposition. This method first employs a model to perform a preliminary localization of potential target regions within the high-resolution image [
10]. These candidate regions are then cropped and processed by a subsequent detection model. By isolating the region of interest, the small object detection problem is effectively transformed into a standard detection task where the target appears significantly larger and more prominent. This foundational strategy has facilitated the development of general-purpose frameworks for small object detection, most notably the Slicing Aided Hyper Inference (SAHI) framework [
11]. Distinct from the prevalent ‘coarse-to-fine’ paradigm, other collaborative detection frameworks have been explored for industrial inspection tasks. One common strategy is ‘Detect-then-Classify’, where an initial model localizes a general object category (e.g., insulators), and a subsequent model classifies its specific state (e.g., breakage or contamination) [
12]. Another approach, ‘Anomaly-Detection-then-Diagnosis’, first trains a model on defect-free samples to establish a baseline of normal appearance and then flags anomalous regions for subsequent diagnosis, a strategy effective for rare defects like cracks [
13]. A third category involves multi-modal fusion, which integrates data from heterogeneous sources, such as visible (RGB) and infrared (IR) sensors, to detect faults like equipment overheating [
14]. Although these methods also employ task decomposition, their underlying principle differs fundamentally from our approach, as they typically alter the task’s objective or rely on multiple data modalities. In contrast, the contribution of our work is the simplification of the detection task within a single modality through the intelligent localization of parent components, thereby optimizing the balance between detection accuracy and efficiency.
The second primary approach involves enhancing the architecture of backbone networks to more efficiently model contextual information. This represents a paradigm shift from traditional Convolutional Neural Networks (CNNs) [
15], which are inherently limited by their local receptive fields, to Vision Transformers (ViTs) [
16,
17,
18]. While ViTs excel at capturing long-range dependencies, they introduce significant computational overhead. Recently, State Space Model (SSM), exemplified by Mamba [
19], have emerged as a breakthrough. These models theoretically match the global context modeling capabilities of Transformers while maintaining linear computational complexity [
20], offering a more balanced solution for object detection. Complementing these advancements, techniques have also been developed to address the loss of fine-grained information during downsampling. Among these, lossless downsampling methods such as SPD-Conv [
21,
22] have proven effective at preserving feature detail.
While “coarse-to-fine” strategies and advanced network architectures have developed independently, research that integrates the advantages of both approaches remains limited. Consequently, this paper proposes a novel framework for split pin defect detection by combining component cropping with an enhanced Mamba-based Yolo11 model. The primary contributions of this research are as follows:
An efficient two-stage collaborative detection framework is proposed and validated. A pre-trained Yolo11x model is utilized for the rapid localization and cropping of mechanical components that contain split pins. This procedure transforms the challenging task of small object detection into a more straightforward detection problem within a simplified background.
We present the design and development of Mamba-YOLO-SPDC, a high-performance detection network. By integrating Vision State Space (VSS) blocks from the Mamba model [
23] into the YOLO backbone, the network effectively captures global contextual information. Furthermore, the inclusion of an SPD-Conv lossless downsampling module ensures the preservation of fine-grained feature information. Experimental results demonstrate that this model significantly outperforms the baseline in terms of both accuracy and inference speed.
2. Detection Framework and Model Design
This section presents the proposed two-stage collaborative detection framework, elaborating on its design rationale and operational workflow. Subsequently, the core of this framework—the Mamba-YOLO-SPDC detection model—is introduced, providing a detailed overview of its network architecture, key innovative modules, and theoretical foundations.
2.1. Two-Stage Collaborative Detection Framework
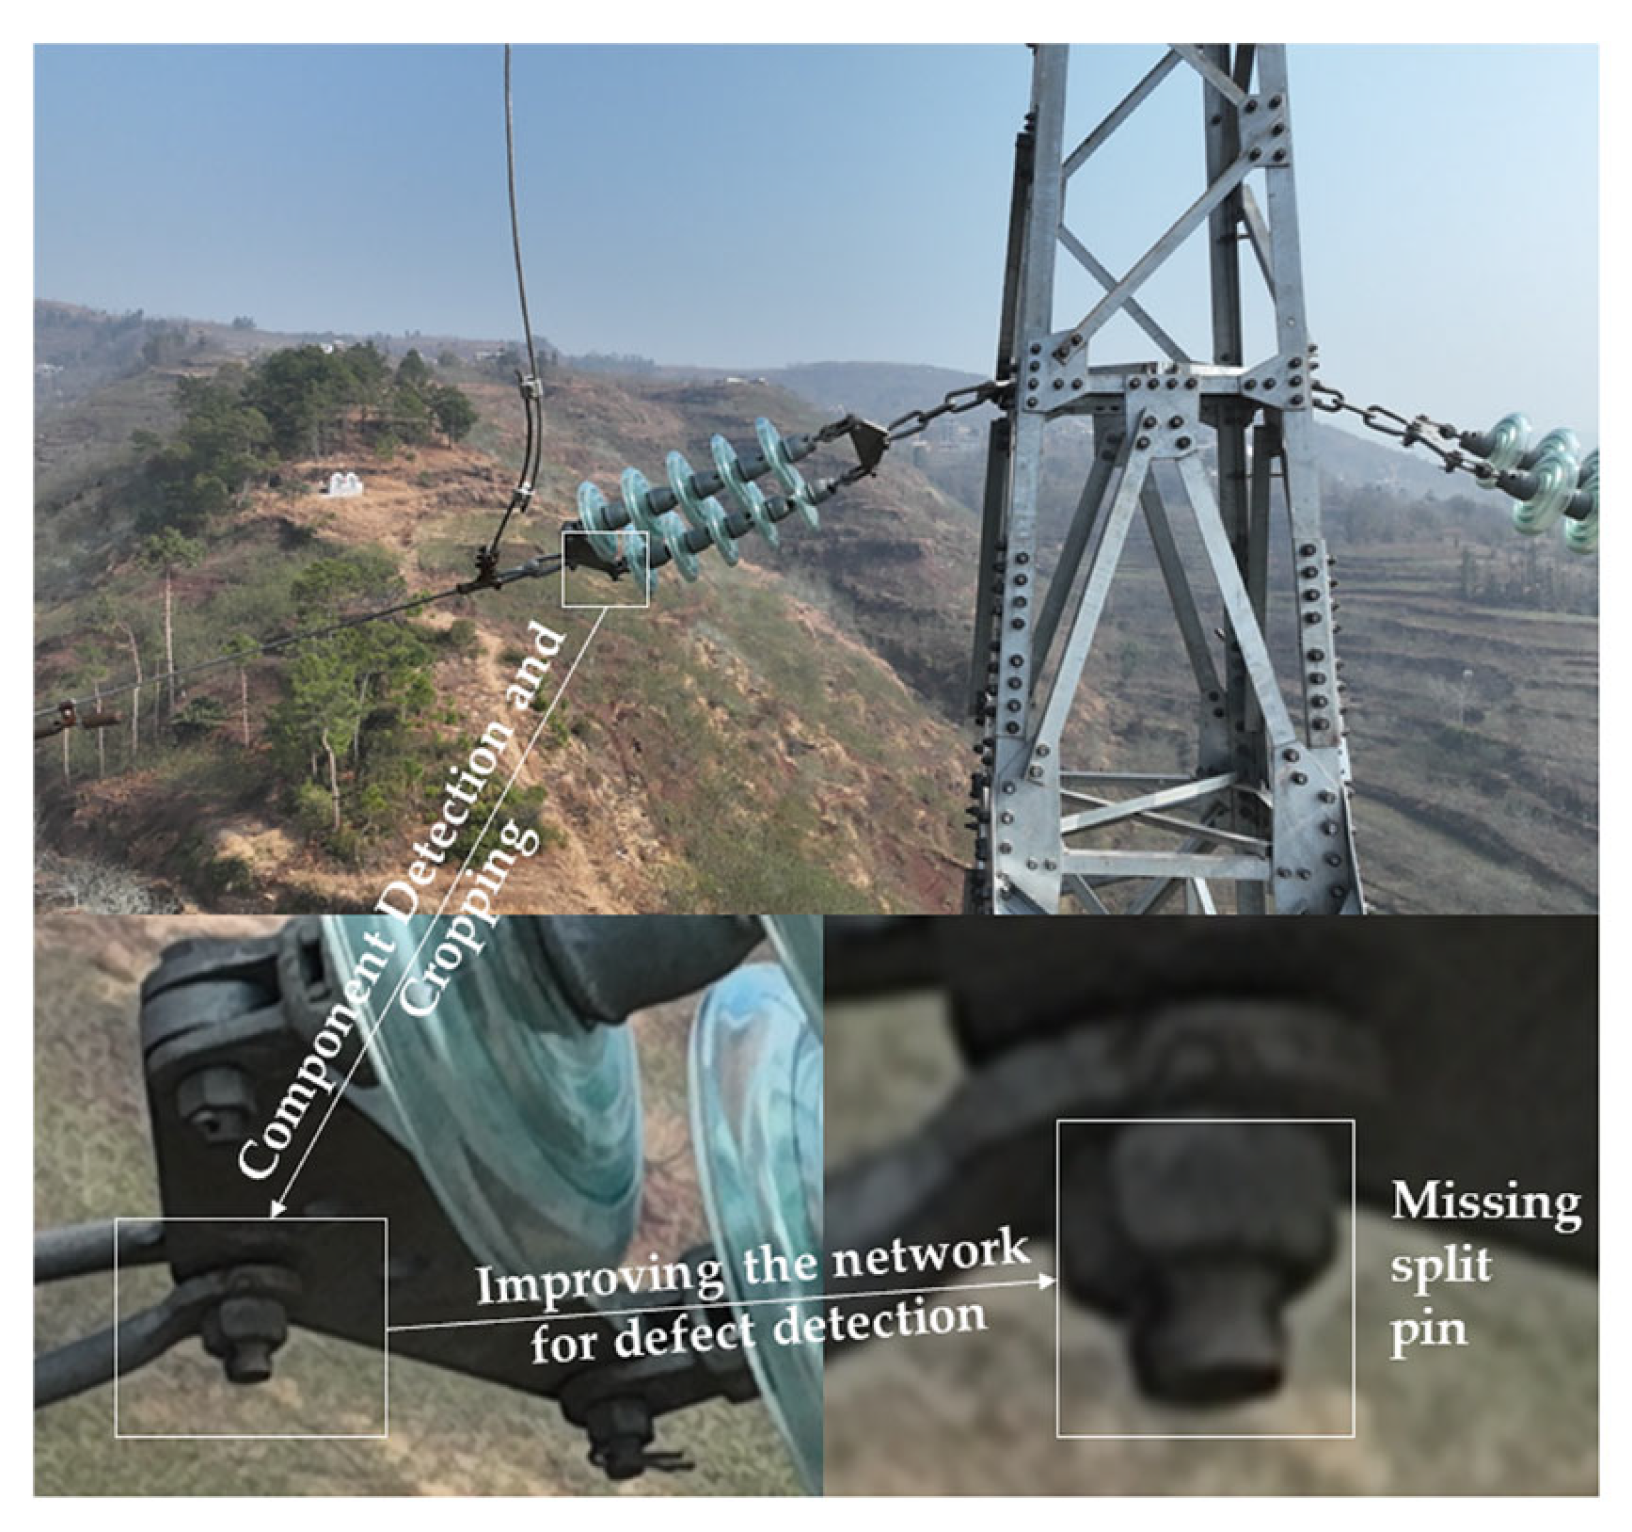
Conventional end-to-end detection methodologies are often computationally intensive and exhibit low accuracy, particularly when identifying small targets that occupy only a few hundred pixels within a multi-megapixel image. The proposed collaborative detection framework is composed of two sequential stages: target localization and segmentation, followed by fine-grained defect detection. This framework decomposes a complex detection task, which is subject to significant interference, into two simpler and more manageable sub-tasks. The overall architecture of the proposed framework is illustrated in
Figure 1.
In the initial stage, termed ‘target area localization and cropping,’ a pre-trained Yolo11x model is employed to efficiently identify and crop mechanical components containing split pins. This process eliminates approximately 90% of the irrelevant background, thereby enhancing the signal-to-noise ratio and substantially increasing the target’s relative size within the image. As a result, the visual features of the target become significantly more prominent. The output of this stage is an image focused on the key components against a simplified, low-interference background. This provides a robust foundation for the subsequent defect detection stage.
In the subsequent stage, designated ‘fine-grained defect detection,’ the Mamba-YOLO-SPDC network is employed to detect defects within the cropped images produced by the initial stage. The architecture and components of this network are discussed in detail in the following section.
2.2. Mamba-YOLO-SPDC Model Research
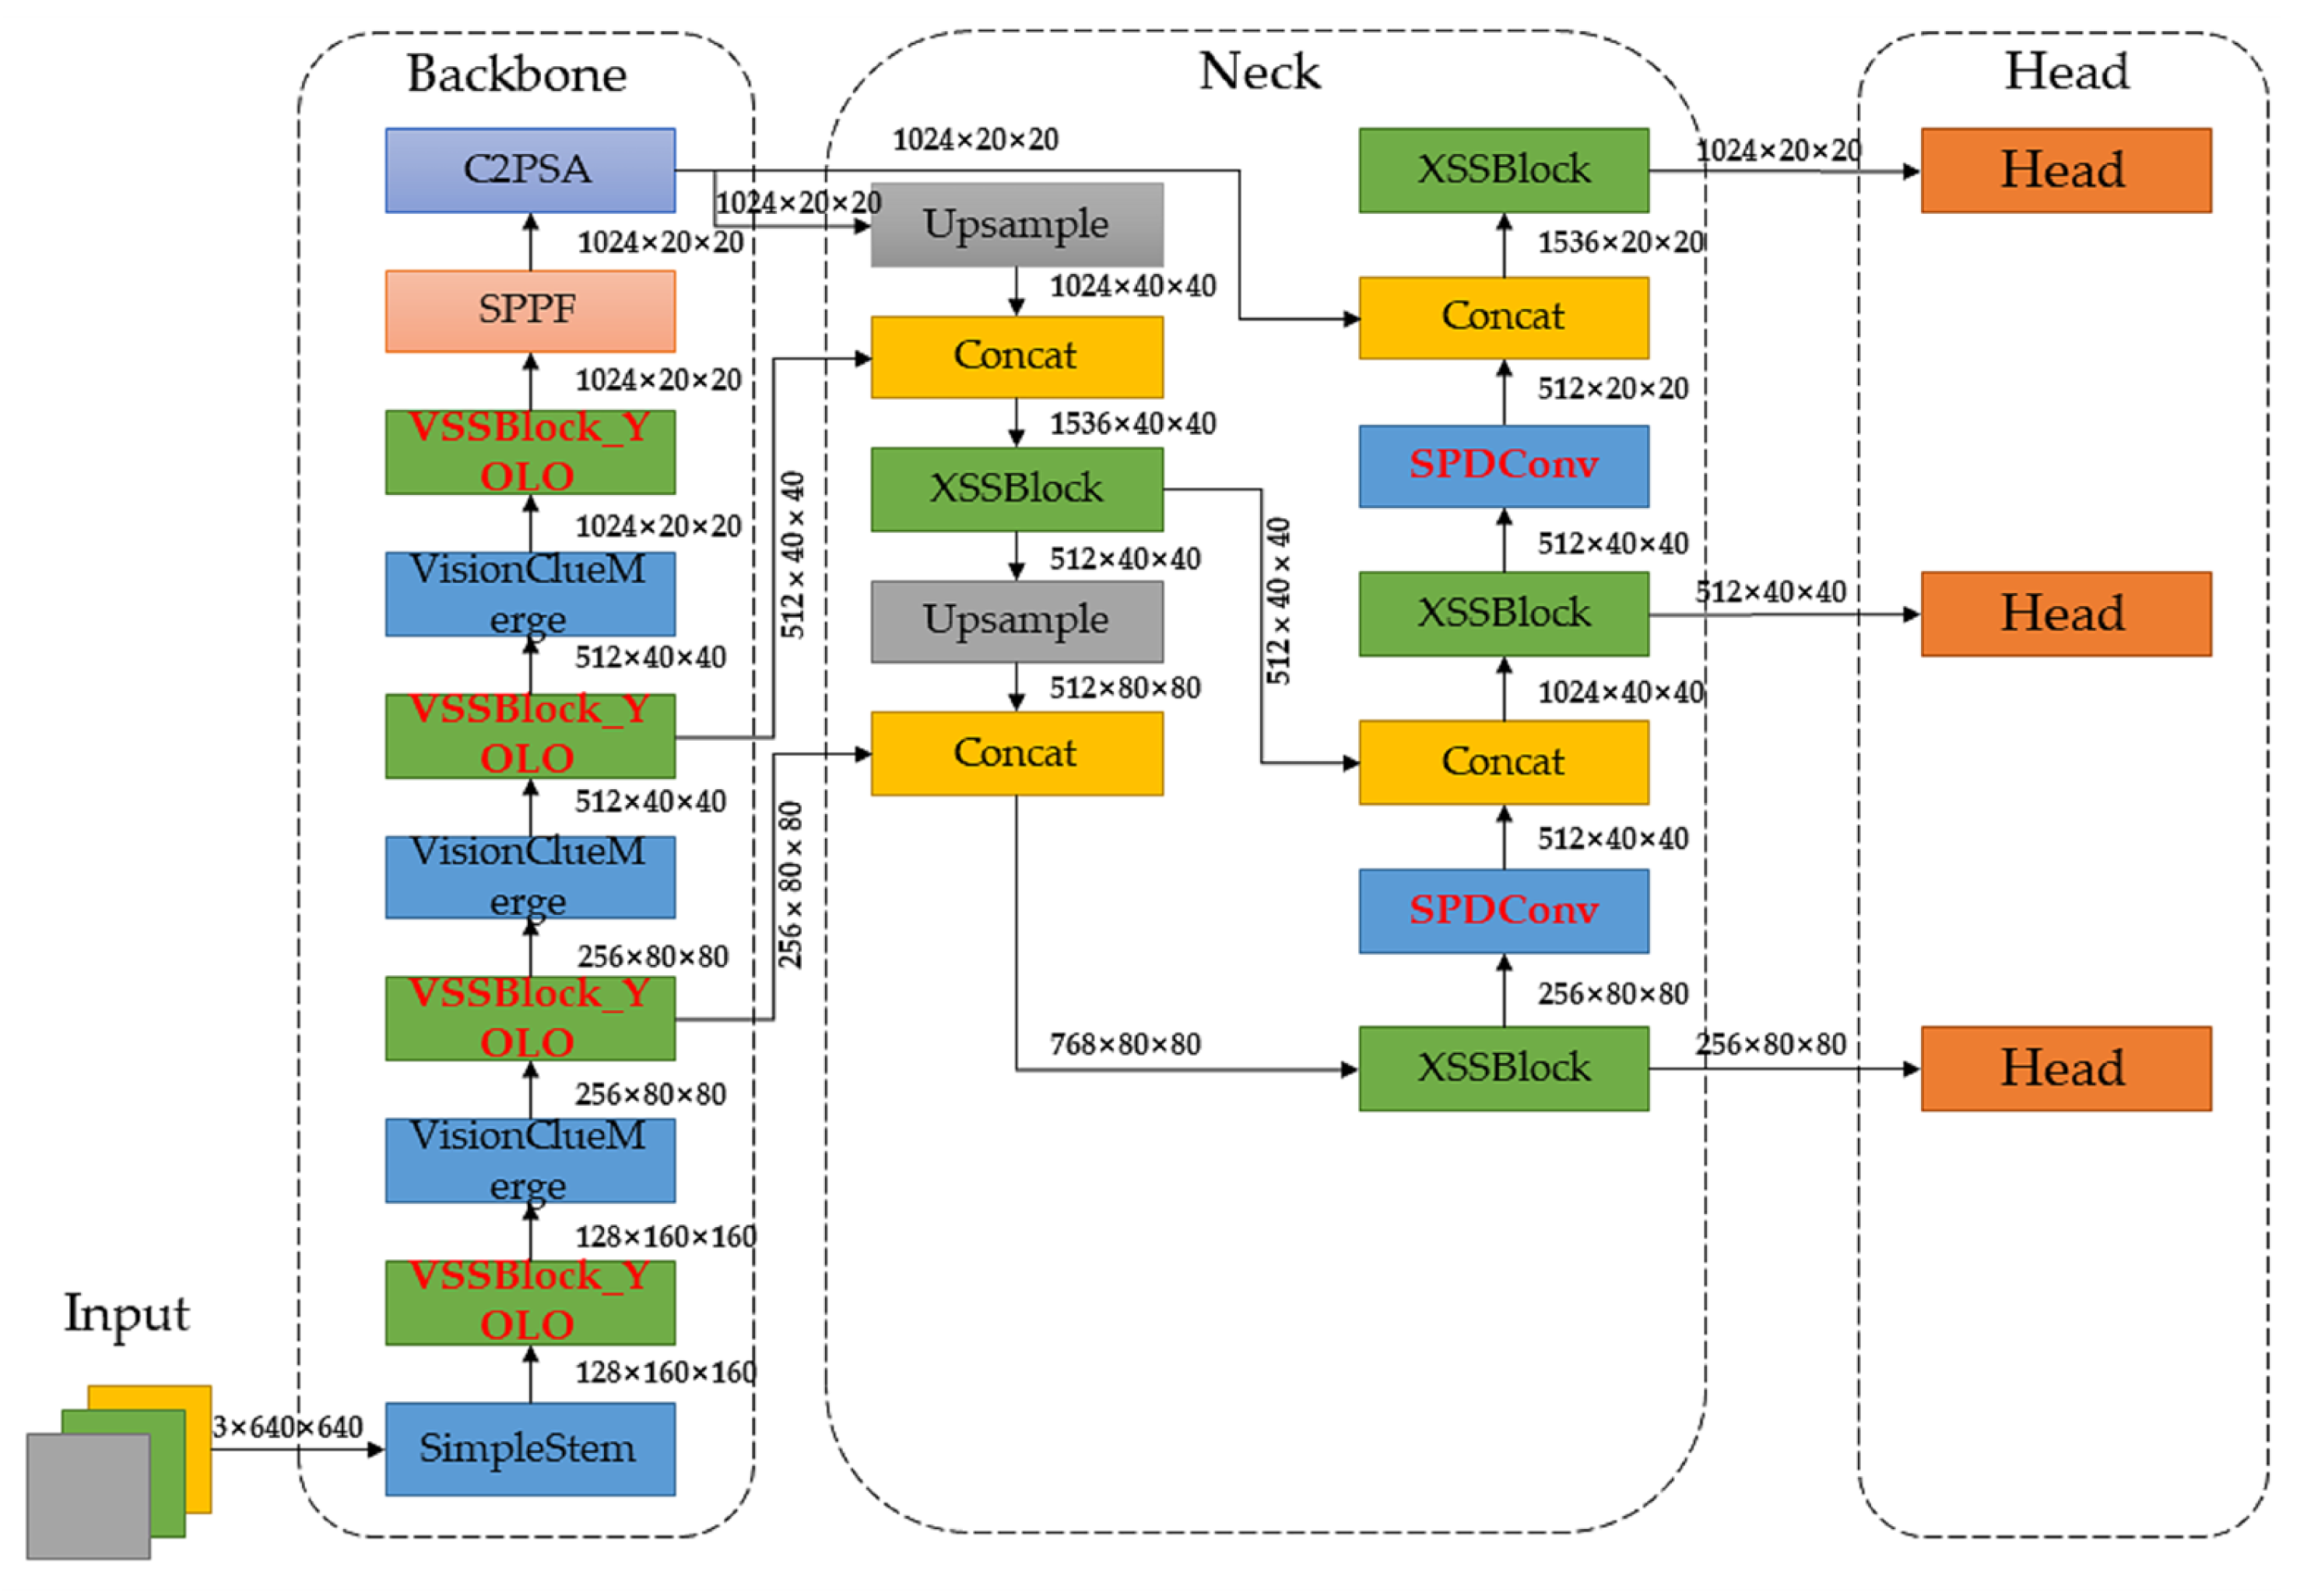
To achieve high detection performance on the cropped images, this paper introduces the Mamba-YOLO-SPDC model, which incorporates two primary innovations into the lightweight Yolo11n/s architecture. This model integrates the state-of-the-art State Space Model (SSM), Mamba, with a lossless downsampling module, SPD-Conv, to achieve an optimal trade-off between detection accuracy and inference speed. The overall architecture of the model is illustrated in
Figure 2. The two primary enhancements consist of integrating Vision State Space (VSS) blocks into the backbone and incorporating an SPD-Conv module into the neck of the network.
2.2.1. Visual State Space (VSS) Block: Efficient Global Context Modeling for Small Target Discrimination
Detecting small targets, such as split pins, within complex environments like power transmission lines poses a critical challenge: a model must possess both fine-grained local feature perception for target identification and a robust understanding of global context for effective background suppression. Conventional Convolutional Neural Networks (CNNs), constrained by their inherently local receptive fields, are inefficient at establishing long-range dependencies and thus often fail to accurately distinguish the target from similarly textured metallic backgrounds. Although Vision Transformers (ViTs) offer superior global context modeling through self-attention mechanisms, their quadratic computational complexity (O(N2)) renders them prohibitive for processing the high-resolution imagery typically acquired during UAV inspections.
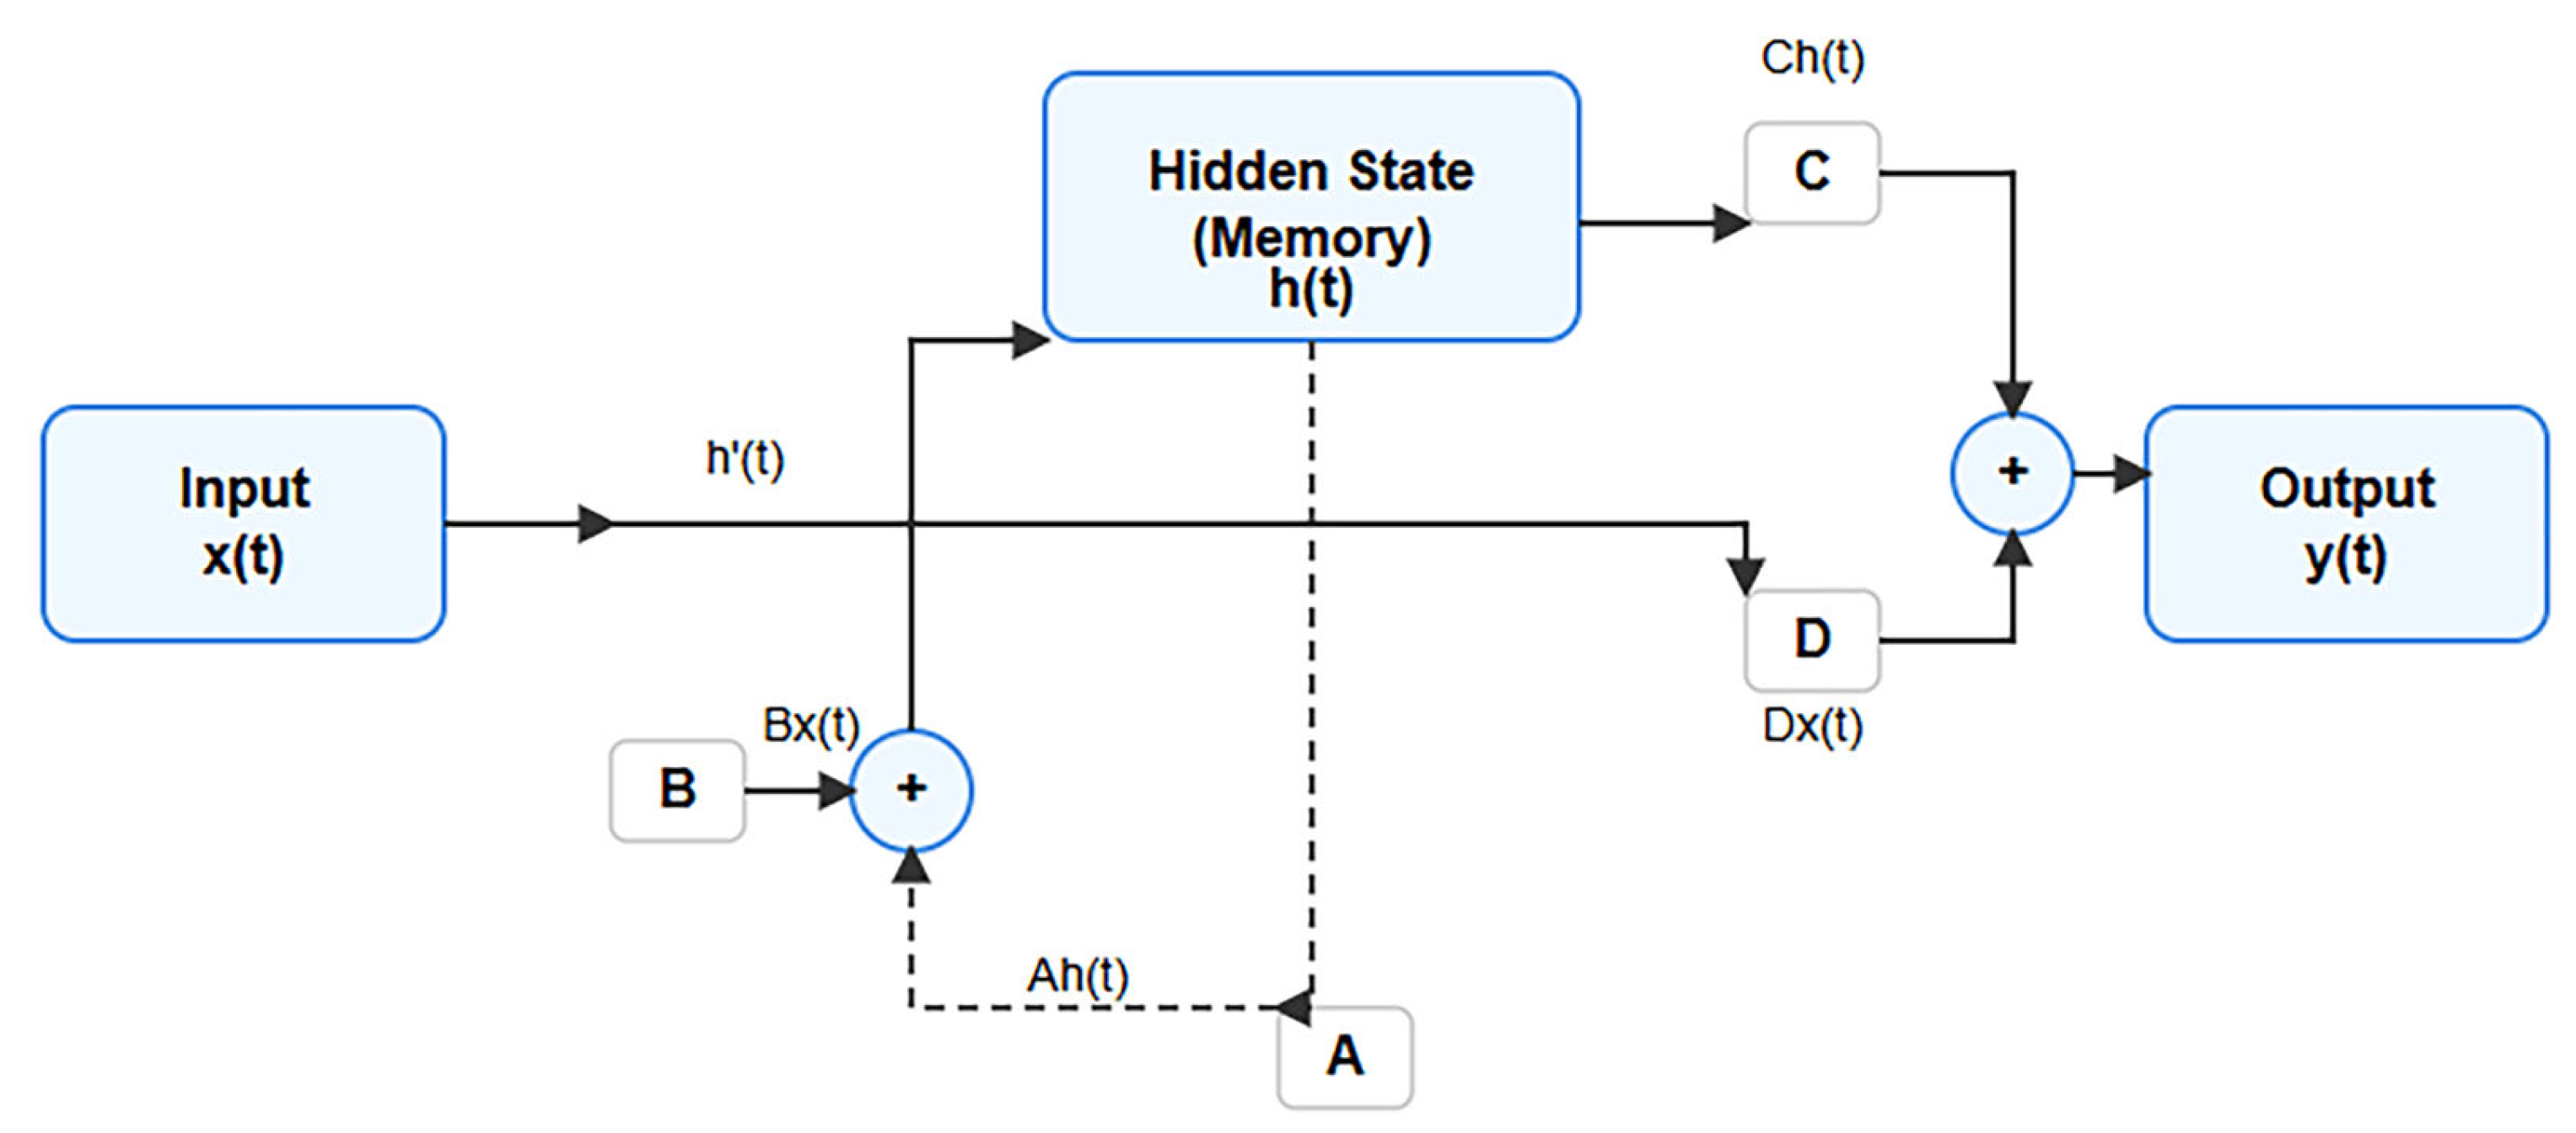
To address the trade-off between performance and efficiency, this study adopts a methodology based on the Mamba architecture, an emergent State Space Model (SSM) that matches the global context modeling capabilities of Transformers while maintaining linear computational complexity (O(N)). A continuous SSM maps an input function
to an output function
via a latent state vector
, a process governed by a set of linear Ordinary Differential Equations (ODEs):
Figure 3 provides a detailed schematic of this core mechanism at a single timestep. Here, the latent state
acts as a compressed representation of the input sequence’s history up to time t. For practical implementation in digital systems, these continuous-time dynamics are discretized into a discrete-time formulation, a process commonly achieved using methods such as the zero-order hold (ZOH). This discretization process transforms the original ODEs into a set of recurrence relations suitable for sequential computation:
The core innovation of the Mamba architecture is its selection mechanism (S6), which makes the discretized state matrices (, , ) input-dependent. Instead of using fixed matrices, S6 computes them dynamically from the input sequence . This allows the model to selectively propagate or forget information based on the current input’s content, enabling it to filter irrelevant background interference and focus on features with high discriminative power for split pin identification.
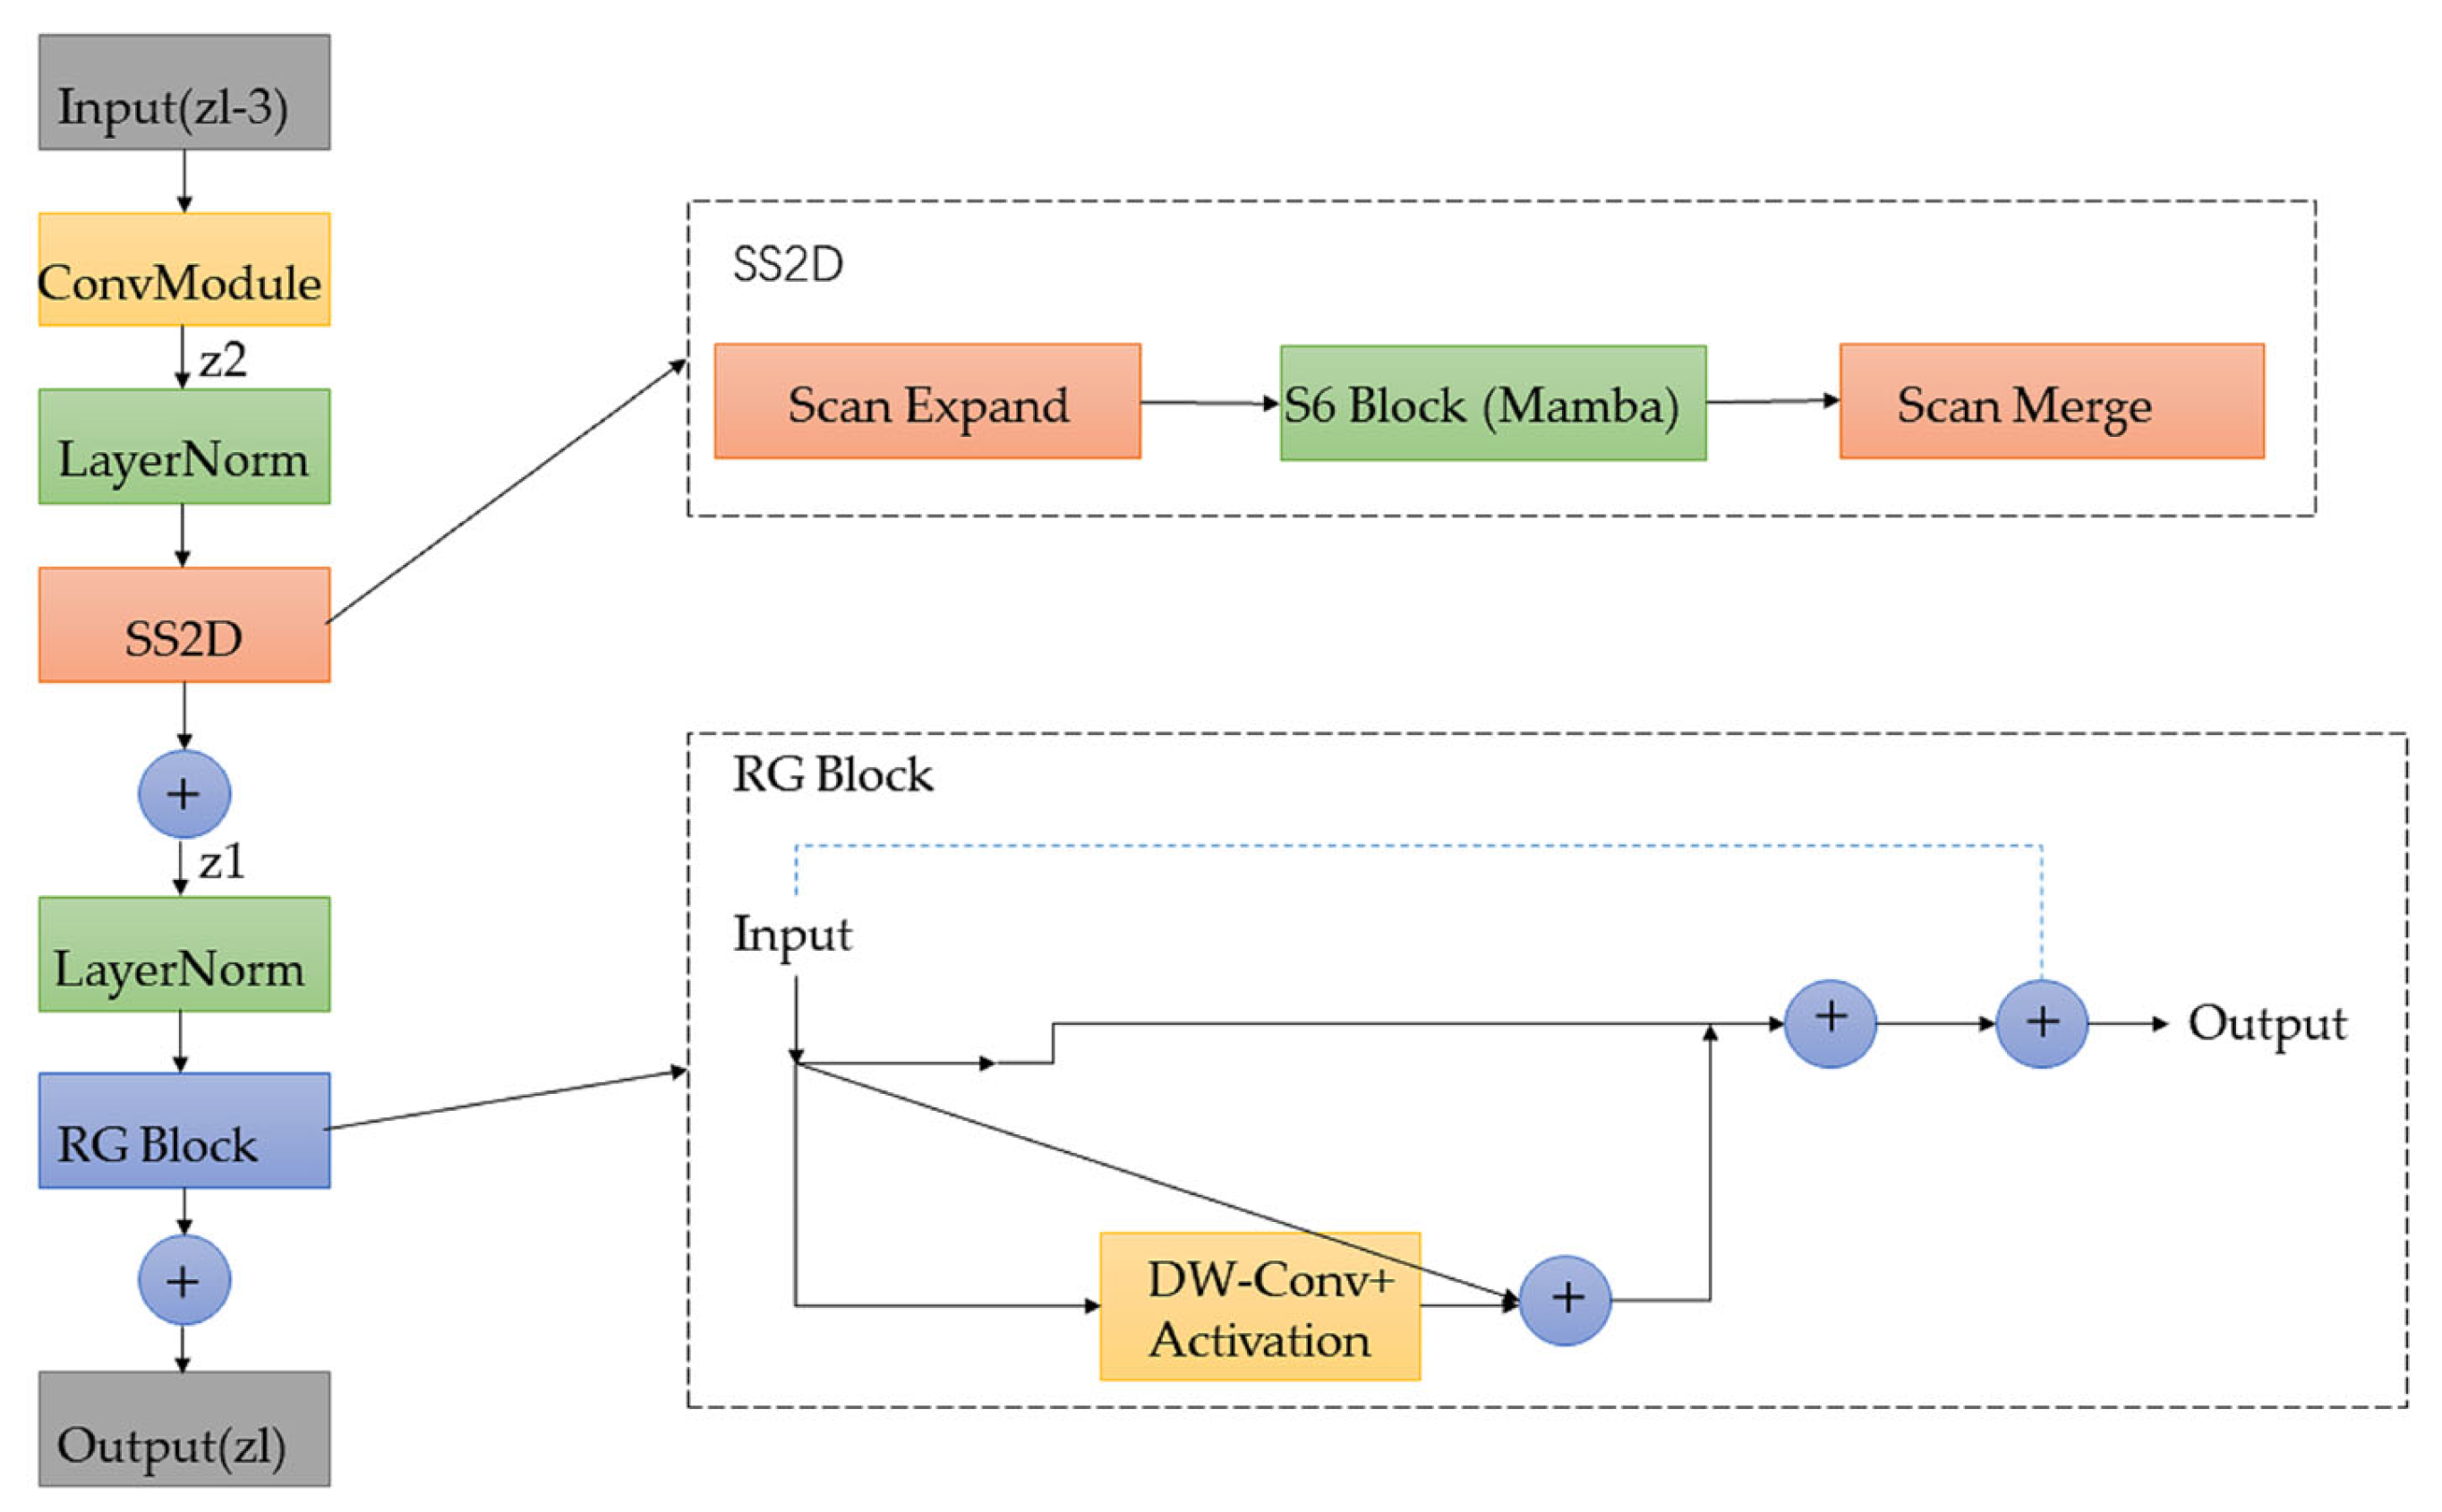
To adapt this sequential model for two-dimensional (2D) image processing, the C2f blocks in the YOLO backbone are replaced with a more powerful Visual State Space (VSS) block, the architecture of which is detailed in
Figure 4. The core component of the VSS block is the SS2D module. This module flattens the 2D image feature map into a sequence and processes it via bidirectional scanning along the spatial axes. The outputs from these multi-directional scans are then aggregated by summation to effectively merge contextual information from all directions. This comprehensive scanning mechanism enables the robust modeling of spatial dependencies, efficiently capturing the global context required to disambiguate the target. Furthermore, the output of the SS2D module is refined by a Residual Gating (RG) block, which utilizes depth-wise convolutions to enhance local details and compensate for any potential dilution of fine-grained features during the global information aggregation stage.
Through this integrated design, the VSS block synergistically combines the global context modeling strengths of the Mamba architecture with the fine-grained local feature extraction capabilities of convolutions. This dual-capability architecture is superior to the original C2f module, providing a richer and more discriminative feature representation that is essential for the robust detection of minuscule split pins against complex and variable backgrounds.
2.2.2. SPD-Conv: Lossless Downsampling for Critical Fine-Grained Feature Preservation
In object detection, the construction of feature pyramids employs successive downsampling operations to generate multi-scale feature representations. However, standard downsampling methods, such as strided convolutions or max-pooling, are inherently lossy. A convolution with a stride of two, for instance, can discard up to 75% of the spatial information within a feature map. For diminutive targets like split pins, whose defining characteristics (e.g., contours, corrosion patterns) often span only a minimal pixel area, this information loss is particularly detrimental. Consequently, critical features can be entirely lost in the deeper layers of the network, leading to missed detections or complete detection failure.
To resolve this critical issue, this work replaces the standard downsampling layers within the network’s neck with the SPD-Conv module, a lossless downsampling strategy. The core principle of SPD-Conv is not to discard information but to reorganize it. As illustrated in
Figure 5, it employs a Space-to-Depth (S2D) transformation. Given an input feature map
with dimensions (C,H,W), the S2D operation slices it into four sub-maps,
. The construction of each sub-feature map
is outlined as follows:
These sub-maps are subsequently concatenated along the channel dimension to form a new feature map
, which now has dimensions (4C,H/2,W/2):
This process effectively trades spatial resolution for an increase in channel depth, thereby preserving the entirety of the feature information throughout the downsampling operation. Subsequently, a non-strided 1 × 1 convolution is applied to this reorganized feature map. This final step is crucial not only for reducing the channel dimensionality but also for enabling the network to learn complex relationships from the spatial features that have been encoded into the channel dimension.
The strategic integration of SPD-Conv into the feature fusion neck ensures that high-frequency details, which are essential for identifying split pins, are effectively preserved throughout the network’s hierarchy. This approach provides the detection heads with high-fidelity feature maps, thereby significantly enhancing the model’s capability to accurately locate and classify small-scale defects that would otherwise be lost during conventional downsampling.
2.2.3. Neck and Head Detection
The integration of the VSS block and SPD-Conv—the two core innovations of this work—into a unified architecture allows the Mamba-YOLO-SPDC model to build upon the mature design principles of the YOLO series, particularly its feature fusion neck and prediction head architecture. This synergistic integration results in a framework that achieves both stable and highly efficient detection performance.
For its feature fusion neck, the model adopts the bidirectional pathways of PANet [
24], where “top-down” high-semantic features and “bottom-up” fine-grained spatial features are fused, enabling comprehensive interaction between different network layers. This bidirectional fusion is a critical factor in enhancing multi-scale object detection. As illustrated in
Figure 2, a simplified SSM block (designated XSSBlock) and the SPD-Conv downsampling module are integrated into the neck network to further enhance inter-scale feature interaction during the fusion process.
In the head prediction stage, the most recent decoupled head is utilized to address the discrepancy between the classification and regression tasks, thereby markedly enhancing convergence speed and accuracy. Finally, predictions are made on the multi-scale feature maps of the neck regions P3, P4, and P5 to ensure the identification of defects of all sizes.
3. Experimental Results and Analysis
This section provides a comprehensive experimental validation of the proposed two-stage * collaborative framework and the Mamba-YOLO-SPDC model. First, the dataset is introduced, along with the software, hardware, and training configurations used for the experiments. Subsequently, the evaluation metrics for assessing model performance are defined. A series of rigorous ablation studies is then conducted to analyze the contribution of each innovative module. The performance of the proposed model is then compared against that of the mainstream small object detection framework, SAHI. Finally, qualitative visualizations are presented to demonstrate the superiority of the proposed method over the baseline model.
3.1. Dataset and Experimental Setup
Original Dataset: The dataset utilized in this study was constructed from 5155 high-resolution images captured during UAV-based inspections of in-service power lines, provided by the Yunnan Power Grid Corporation. This collection encompasses a wide range of variations in lighting, camera angles, and background complexity, making it highly representative of real-world operational conditions.
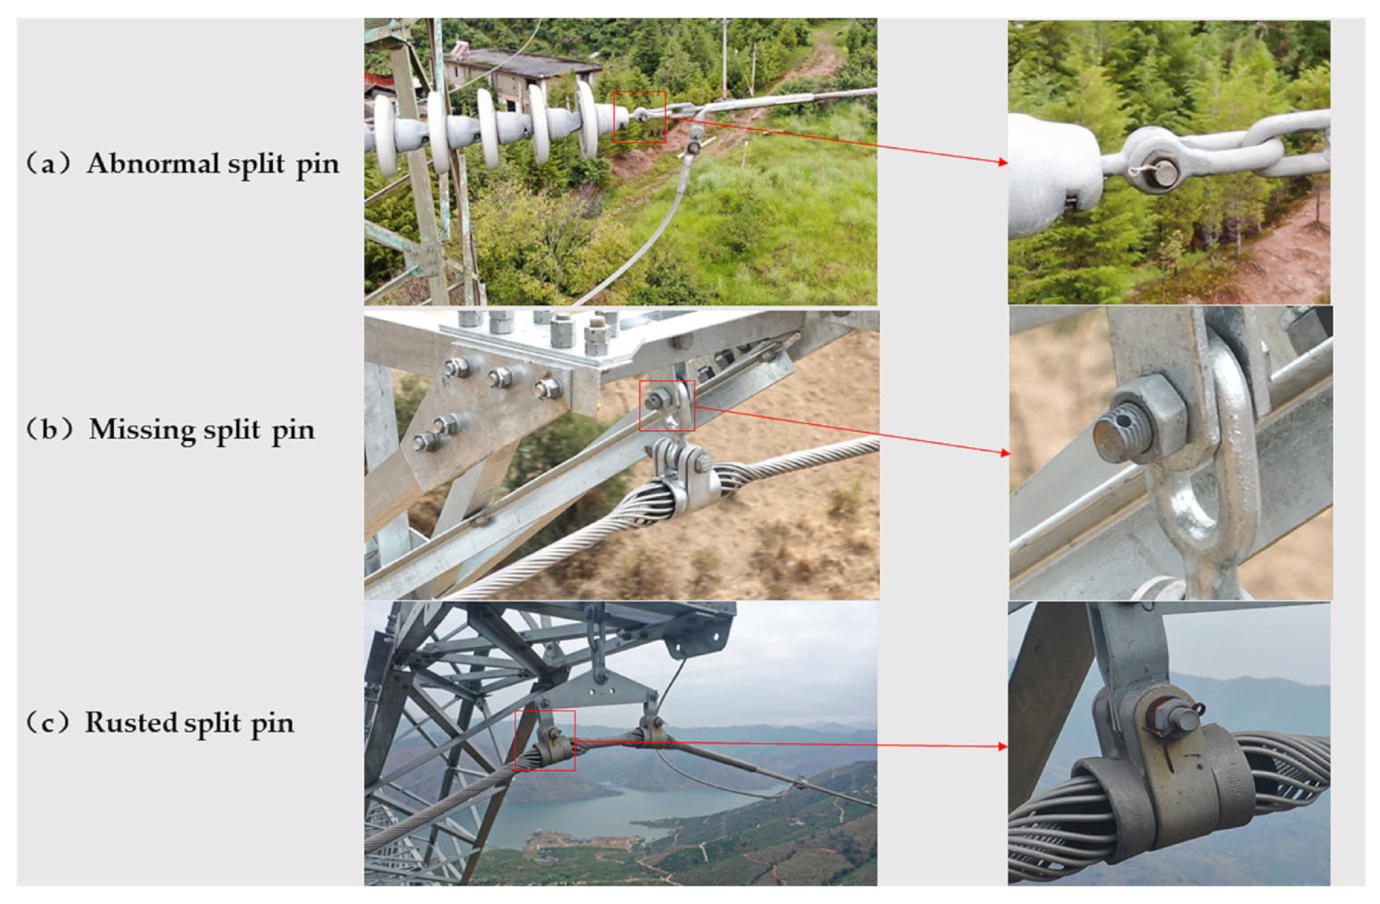
The process for defect annotation and classification is detailed as follows. Three primary types of split pin defects were annotated in the dataset: abnormalities (
Figure 6a), missing components (
Figure 6b), and corrosion/rust (
Figure 6c). The distribution of the annotated defects exhibits a mild class imbalance, which is inherent to real-world data, with an approximate instance ratio of 4:3:3 for abnormal, missing, and rusted pins, respectively. To ensure the quality and precision of the annotations, all labels underwent a rigorous review and verification process conducted by domain experts from the China Southern Power Grid. The dataset was meticulously partitioned into a training set (3609 images), a validation set (1031 images), and a test set (515 images), closely adhering to a 7:2:1 ratio.
Component Cropping Dataset: For this study, ten types of components that typically contain split pins (e.g., insulators, hooks, and brackets) were annotated within the original high-resolution dataset. A Yolo11x component localization model was subsequently trained on this custom-annotated set of transmission line images. To train and evaluate the first-stage component localizer, the original dataset of 5155 images was annotated with ten distinct types of component labels. This newly annotated dataset was then partitioned into a training set (3609 images), a validation set (1031 images), and a test set (515 images), adhering to a 7:2:1 ratio. This rigorous partitioning formed the basis for training the Yolo11x model and for the subsequent evaluation of its detection performance. The trained localization model identifies the bounding boxes of all target components within the source images. By expanding these predicted bounding boxes by a 10% margin, the corresponding component regions were then cropped from the original high-resolution images. This cropping procedure generated a new dataset for fine-grained defect detection. This dataset comprises 8890 images in total, as multiple components can be extracted from a single source image. The images in this new dataset were annotated for three types of defects: split pin abnormalities, missing components, and corrosion. Subsequently, this dataset of 8890 images was partitioned for training, validation, and testing, adhering to a 7:2:1 ratio. This division resulted in a training set comprising 6223 images, a validation set with 1778 images, and a test set containing 889 images, ensuring a standard and robust split for model training and evaluation.
Experimental Environment: To ensure the reproducibility and fairness of the results, all experiments were conducted under identical hardware and software conditions. The hardware platform consisted of an NVIDIA GeForce RTX 4090 GPU (24 GB VRAM), 16 vCPUs from an Intel® Xeon® Platinum 8474C processor, and 80 GB of system memory.
The software environment was configured on an Ubuntu 20.04 LTS operating system. The deep learning implementation utilized PyTorch 2.0.0, CUDA 11.8, and Python 3.9. For the evaluation of inference speed, measured in Frames Per Second (FPS), all models were deployed on a Jetson Orin NX (16 GB) edge computing platform.
Training Parameter Settings: To ensure a fair comparison, all models were trained using the same core hyperparameter settings, utilizing the Stochastic Gradient Descent (SGD) optimizer. The learning rate was governed by a cosine annealing schedule with an initial value of 0.01; the optimizer was configured with a momentum of 0.937 and a weight decay of 0.0005. All models were trained for 600 epochs, with the batch size adjusted according to the model’s scale and GPU memory constraints. For example, the batch size was set to 128 for Yolo11n and 32 for Yolo11s. Standard data augmentation techniques, including Mosaic and Mixup, were employed during training to improve model generalization. To ensure the reliability and statistical significance of the results, all pivotal experiments were independently conducted three times, and the final metrics are reported as the mean ± standard deviation.
3.2. Evaluation Metrics
To comprehensively evaluate the performance of the various models, this study adopts standard metrics widely used in the field of object detection. The primary metric for assessing overall detection accuracy is the mean Average Precision (mAP), calculated at an Intersection over Union (IoU) threshold of 0.5 (denoted as mAP@0.5). Additionally, Precision (
) and Recall (
) are reported to provide a more detailed analysis of model performance.
The calculation of Precision () and Recall () is based on three key statistical measures derived from the model’s detection results. The first measure is True Positives (TP), representing the number of defects correctly identified by the model. The second is False Positives (FP), which is the number of non-defect instances incorrectly identified as defects. The third is False Negatives (FN), defined as the number of actual defects that the model failed to detect.
By varying the model’s confidence threshold, a series of corresponding Precision (
) and Recall (
) values are generated, which can then be plotted to form a P-R curve. For a specific object class, the Average Precision (
) is defined as the area under this P-R curve and is calculated using the following formula:
Finally,
mAP is the arithmetic mean of the
AP values for
C categories, serving as a key metric for evaluating the model’s overall performance.
In mAP@0.5, the ‘@0.5’ refers to the IoU threshold being set to 0.5 when calculating the average precision (AP) to determine whether a detection bounding box is a positive sample.
Model complexity is evaluated using two primary metrics: the number of parameters (Parameters, measured in millions) and computational load (GFLOPs). The number of parameters determines the static size of the model (i.e., the storage footprint of the model weights). In contrast, GFLOPs (Giga Floating-point Operations) quantify the theoretical computational demand for a single forward pass and are directly correlated with the model’s inference speed.
3.3. Ablation Experiments and Analysis
To validate the efficacy of the proposed framework and to ascertain the contribution of each individual module, a series of detailed ablation studies was conducted. The analysis begins by verifying the performance of the first-stage component localization model, which provides the foundation for the entire two-stage framework. Next, comparative experiments are presented to demonstrate the significant advantages of the component cropping strategy. Following this, the respective contributions of the integrated Mamba (VSS) and SPD-Conv modules are analyzed individually. Finally, the overall performance of the proposed framework is benchmarked against the mainstream small object detection framework, SAHI.
3.3.1. Component Recognition Model
The first stage of the proposed framework is dedicated to the precise localization and cropping of mechanical components that contain split pins. The Yolo11x model, one of the larger-scale variants in the Yolo11 series, was selected for this component localization task. This model variant features a deeper network and wider feature channels, yielding robust feature representation capabilities and ensuring high performance across a wide range of target scales. This selection was made to ensure the high localization accuracy required for this foundational stage of the framework.
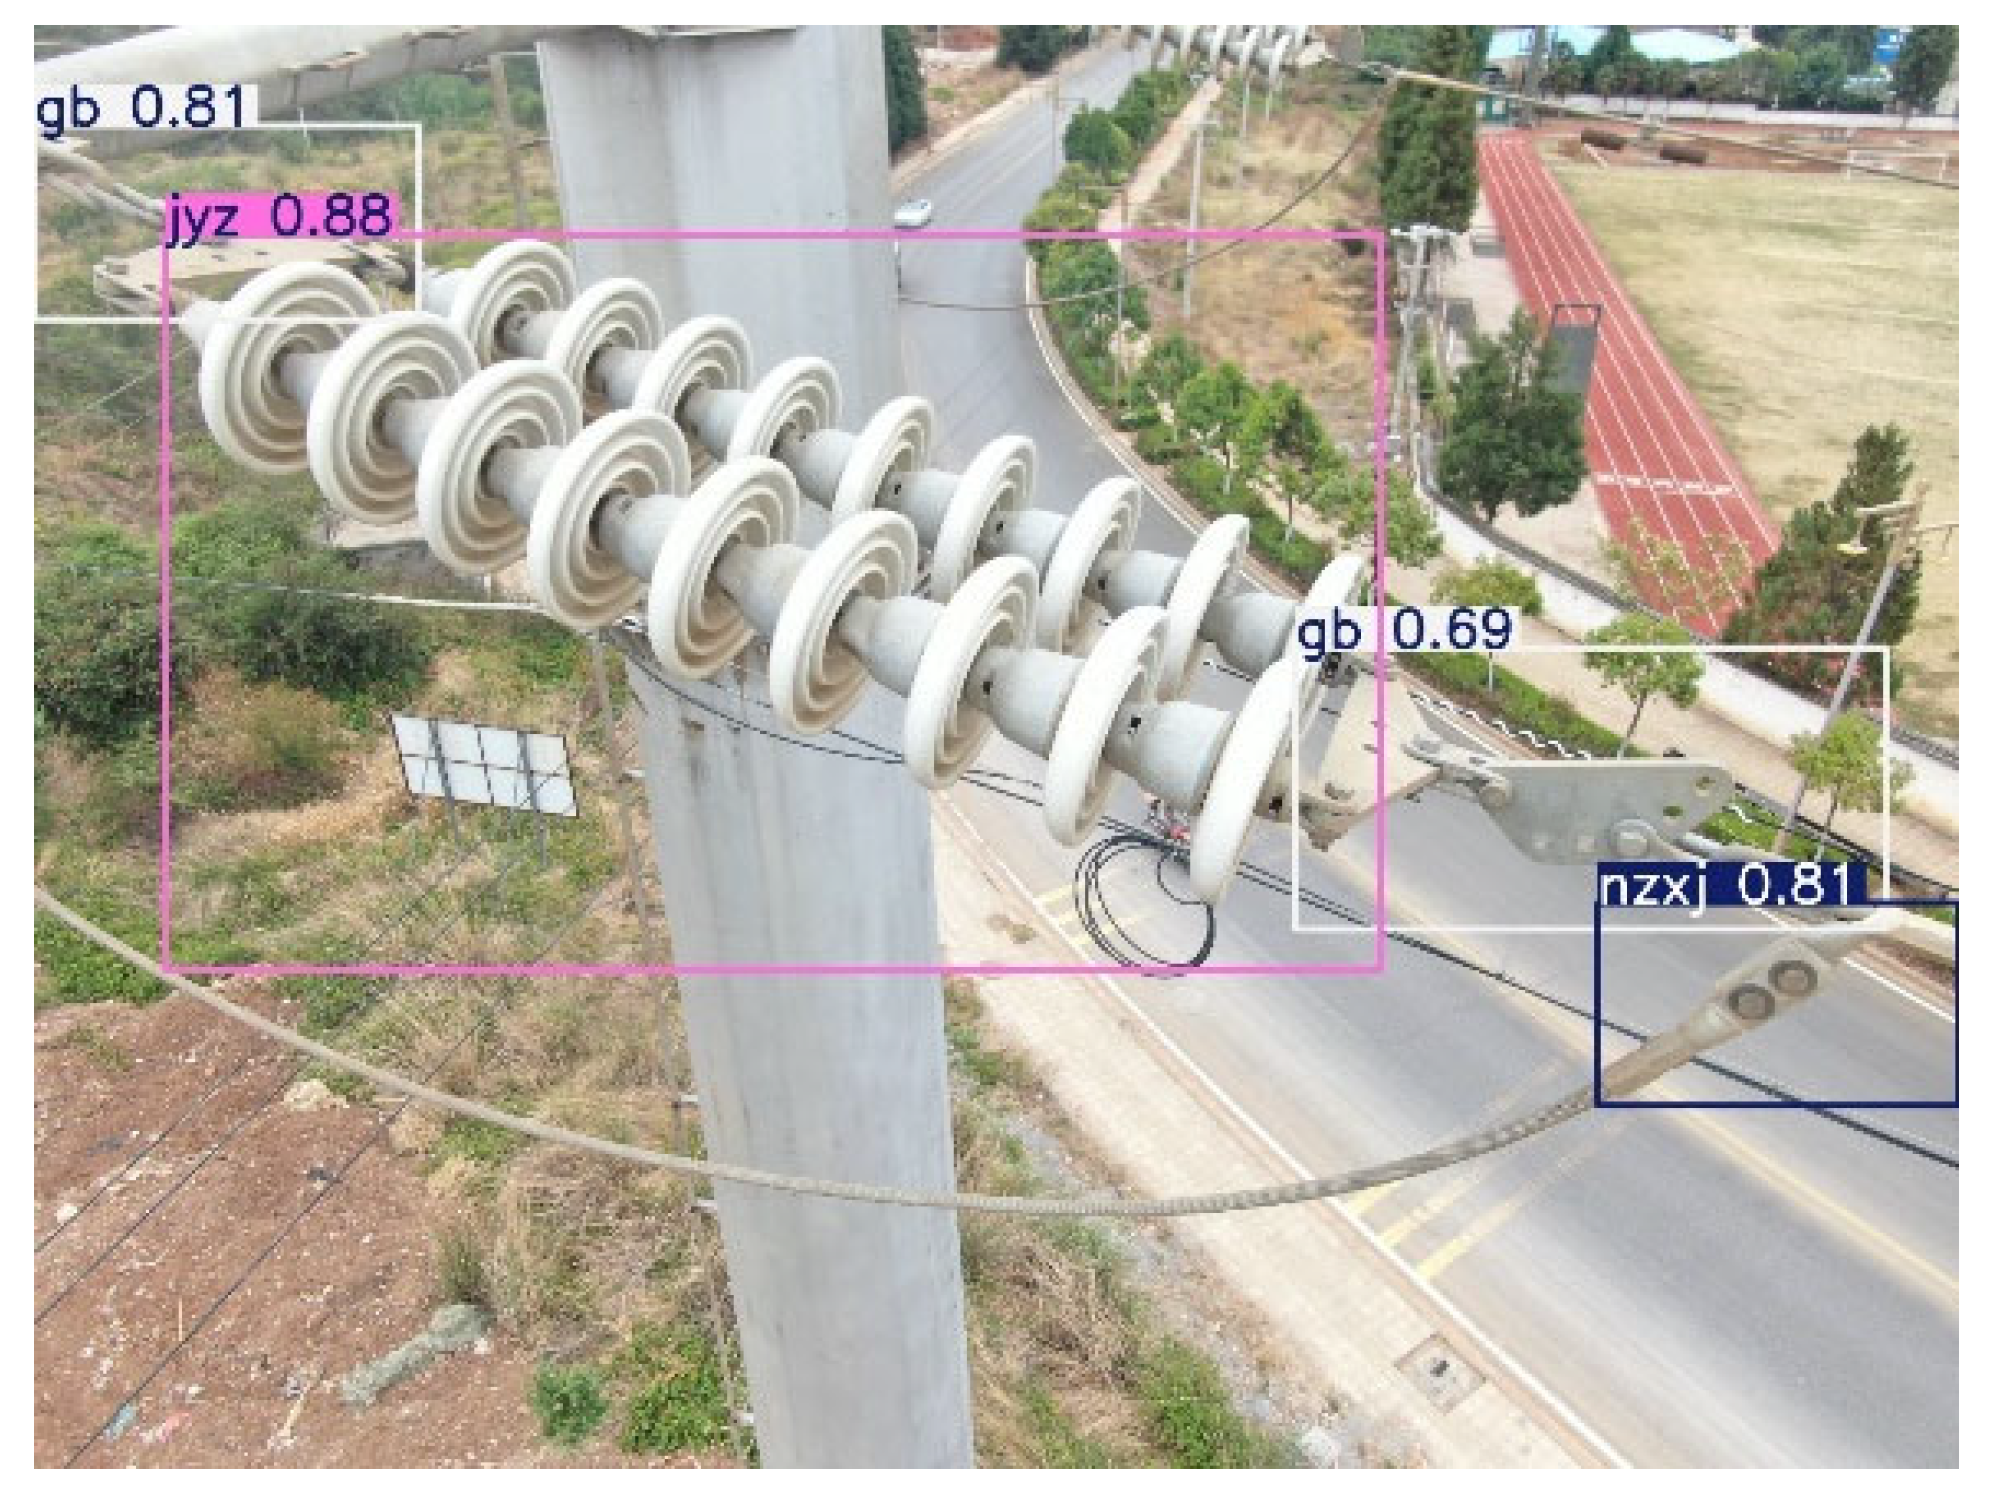
The experiment was conducted on the original dataset, which was annotated with labels for ten types of mechanical components known to contain split pins. The Yolo11x model was trained on this dataset for the task of accurately localizing these components. The model achieved a mean Average Precision (mAP@0.5) of 74.5%*, effectively distinguishing the target components from the complex power line background. Qualitative examples of the detection results are illustrated in
Figure 7. This finding confirms that the initial localization model possesses sufficient accuracy to provide high-quality, reliably cropped images as input for the subsequent defect detection model.
3.3.2. Advantages of the Component Cropping Strategy
The core strategy of this paper is to convert the small-target detection problem into a standard-target detection task, thereby substantially enhancing performance. To validate this approach, the following experiment was conducted using five representative model configurations. These models were trained on two distinct datasets: the ‘original dataset’ containing high-resolution images, and the ‘component cropping dataset’ produced by our first stage. The detection performance of each model was subsequently evaluated on its respective dedicated test set. The five models included for comparison are: two baseline models (Yolo11n and Yolo11s), an ablation model with only SPD-Conv added (Yolo11n-SPDC), a second ablation model with only Mamba blocks added (Mamba-YOLO-t), and the final proposed model (Mamba-YOLO-SPDC). A comprehensive summary of the experimental results is presented in
Table 1.
The results presented in
Table 1 lead to a clear and significant conclusion. A substantial improvement in mAP@0.5 is observed for all tested models when they are trained on the cropped dataset as opposed to the original high-resolution images. For instance, the mAP@0.5 of the Yolo11n model surged from 12.4% on the original images to 49.2% on the cropped dataset, representing a relative performance gain of approximately 297%. Similarly, the proposed Mamba-YOLO-SPDC model’s mAP improved from 18.0% to 61.9% when applying the same cropping strategy. This universal performance uplift indicates that the enhancement is primarily attributable to the “localize first, then detect” strategy itself, rather than any specific detector, which demonstrates the excellent generalizability of the proposed framework.
3.3.3. Advantages of the Mamba and SPD-Conv Modules
Having established the general effectiveness of the component cropping strategy, the analysis now proceeds to a detailed evaluation of the complete Mamba-YOLO-SPDC network. This is achieved by comparing its performance against a baseline YOLO model, with both models being trained on the same ‘component cropping dataset’. This comparative analysis also serves to validate the individual contributions of the integrated Mamba (VSS) and SPD-Conv modules. Accordingly, a series of ablation studies was conducted using Yolo11n and Yolo11s as baselines, with the comprehensive results presented in
Table 2.
A detailed analysis of the data presented in
Table 2 yields the following key observations:
The Yolo11n-SPDC model modifies the Yolo11n baseline by replacing the standard downsampling layers in the neck region with the SPD-Conv module. This single modification leads to a 2.2 percentage point improvement in mAP@0.5, achieving a score of 51.4%. Notably, this accuracy gain is accomplished with a concurrent reduction in both the number of parameters and the computational load (GFLOPs). Furthermore, the inference speed marginally increases to 38.9 FPS, clearly demonstrating the distinct advantage of SPD-Conv in preserving fine-grained information while simultaneously enhancing model efficiency.
The integration of the Mamba module (in the Mamba-YOLO-t model) yields a substantial performance advancement, achieving an mAP@0.5 of 61.1%. This represents an improvement of 11.9 and 9.7 percentage points over the Yolo11n and Yolo11n-SPDC models, respectively. Although this configuration increases model complexity relative to Yolo11n, it maintains a real-time inference speed of 28.1 FPS, which is notably faster than the larger Yolo11s baseline. This outcome demonstrates the Mamba architecture’s powerful capability to enhance detection accuracy while maintaining efficient inference speeds.
The final Mamba-YOLO-SPDC model, which integrates both Mamba (VSS) blocks and the SPD-Conv module, demonstrates the best overall performance, achieving the highest mAP@0.5 score among all models tested. Furthermore, its parameter count and computational complexity are marginally reduced compared to the Mamba-YOLO-t model, which incorporates only the Mamba blocks. Crucially, this synergy also boosts the inference speed to 29.5 FPS, representing an optimal balance between accuracy and real-time performance. This finding underscores the critical role of SPD-Conv in preserving local, fine-grained features, a capability that is powerfully complemented by Mamba’s robust global context modeling. This synergistic processing of both global and local information is the key to achieving the observed breakthrough in detection performance.
3.3.4. Comparison and Analysis with SAHI
To further validate the superiority of the proposed two-stage collaborative detection framework, this section presents a comparative analysis against Slicing Aided Hyper Inference (SAHI), a prevalent framework for small object detection. The SAHI framework employs a ‘slicing-aided inference’ technique, which partitions a high-resolution image into numerous overlapping patches that are processed individually during inference. This slicing method is a widely adopted and practical strategy for detecting small objects in large-scale imagery. To ensure a fair and direct comparison, the Mamba-YOLO-SPDC model developed in this study was utilized as the base detector within the SAHI framework for this experiment.
Proposed Framework: The proposed methodology consists of two sequential steps: first, intelligent localization and cropping of the component region, followed by fine-grained defect detection using the Mamba-YOLO-SPDC model.
SAHI Framework: In contrast, the SAHI framework employs a ‘mechanical slicing’ strategy to partition the image, after which the same Mamba-YOLO-SPDC model is utilized for detection on each resulting slice.
The experiment was conducted on the identical test set for both frameworks. For the SAHI method, the slice size was configured to 640×640 pixels with an overlap ratio of 0.2. Inference was performed across the entire test set for each framework to generate a complete set of prediction results, which were then compared against the ground-truth labels. The performance of each framework was quantified using the mAP@0.5 metric. The final comparative results are presented in
Table 3.
The proposed framework and the SAHI framework were compared against a direct detection baseline, using mAP@0.5 as the primary evaluation metric. The results indicate that both frameworks achieve significant performance enhancements over the direct detection baseline. This finding validates the distinct advantages of a ‘localize-first, then-detect’ paradigm compared to end-to-end detection.
The primary advantage of the proposed framework over SAHI is its significantly lower computational complexity. While the proposed framework achieves a marginally higher mAP@0.5 score, its associated inference cost is substantially lower. This discrepancy can be attributed to the ‘mechanical slicing’ approach of SAHI, which results in redundant inference operations being performed on numerous overlapping image patches. To illustrate, processing a 3840 × 2160 image with 640 × 640 slices and a 0.2 overlap ratio requires 32 separate inference operations, leading to significant computational overhead.
In contrast, the proposed framework avoids such redundant computations through its ‘intelligent localization’ strategy. In this process, the Yolo11x model first performs a single global inference pass on the original image to identify component areas containing the target. Subsequently, the Mamba-YOLO-SPDC model is only required to perform inference on these 2–3 cropped regions in the second stage, resulting in a total of just 3–4 inferences per source image.
The proposed two-stage collaborative framework achieves higher detection accuracy than the SAHI framework but with a significantly lower computational cost, which underscores its overall superiority. This approach effectively circumvents the computational redundancy inherent in SAHI’s ‘mechanical slicing’ through ‘intelligent localization’, thereby achieving a superior trade-off between accuracy and efficiency. This performance advantage is attributed to the framework’s ability to provide the final detection model with richer contextual information from the initial localization stage, leading to more precise and effective defect detection.
3.3.5. Comparative Analysis with Other Advanced Models
To further validate the performance of the proposed model, this section presents a comparative analysis of the Mamba-YOLO-SPDC detector against other state-of-the-art lightweight and high-performance models. These include classic efficient architectures such as MobileNet and ShuffleNet, as well as the contemporary Transformer-based model, RT-DETR. To ensure a fair and direct comparison, all models were trained and evaluated on the identical ‘component cropping dataset’. A comprehensive comparison of each model’s performance across key metrics, including inference speed on the Jetson Orin NX (16 GB) platform, is summarized in
Table 4.
The primary objective of the second stage is to perform efficient and precise defect detection on the cropped images, necessitating an optimal balance between accuracy, model size, and inference speed. The data presented in
Table 4 provides a clear rationale for the selection of Mamba-YOLO-SPDC for this task.
The Mamba-YOLO-SPDC model demonstrates a comprehensive and leading advantage over the other architectures. Primarily, regarding the most critical metric of detection accuracy, it achieves an mAP@0.5 of 61.9%, significantly outperforming all other compared models. This high level of precision is paramount for defect detection, a task where accuracy is the foremost requirement. Remarkably, this top-tier accuracy is achieved in conjunction with exceptional efficiency and speed. The model features the lowest parameter count (5.42 M) and computational load (11.8 GFLOPs) among all tested models, which directly translates into the fastest inference speed of 29.5 FPS on the Jetson Orin NX edge device. This unique synergy of state-of-the-art accuracy, minimal resource consumption, and maximum processing speed establishes its comprehensive superiority over alternatives such as MobileNet, ShuffleNet, and RT-DETR, confirming it as the optimal choice for the second-stage detection task in this study.
3.4. Result Visualization
To illustrate the merits of the proposed method, a visualization of the detection results is presented in this section.
Figure 8 illustrates a scene image with a missing split pin defect.
As illustrated in the left panel of
Figure 8, the proposed Mamba-YOLO-SPDC model successfully detects a missing split pin defect. In contrast, the right panel shows the failure of the baseline Yolo11s model, which is unable to identify the target due to its diminutive scale and the substantial background interference from similarly textured metallic components. This direct visual comparison underscores the superior robustness and accuracy of the proposed Mamba-YOLO-SPDC model for detecting small targets amidst complex and cluttered backgrounds.
4. Conclusions
4.1. Summary of the Work
This study addresses the challenges of low accuracy, significant background interference, and poor computational efficiency inherent to the detection of split pins on power transmission lines. To overcome these limitations, a novel and efficient two-stage collaborative detection framework was proposed and validated.
The foundational principle of this framework is task decomposition and optimization. In the initial stage, a component localization model based on Yolo11x is employed to implement a ‘coarse-to-fine’ strategy, thereby converting the challenging task of detecting small targets into a conventional detection problem within a simplified background. This fundamental simplification of the task significantly reduces its overall complexity. For the second stage, this study proposes a novel high-performance detection network, Mamba-YOLO-SPDC, tailored explicitly for this transformed task. This network innovatively combines the powerful global context modeling capabilities of the State Space Model, Mamba, with the lossless downsampling of SPD-Conv, seamlessly integrating these advantages into the mature Yolo11 framework.
4.2. Limitations and Future Directions
While the proposed two-stage framework demonstrates significant efficacy for detecting split pin defects, it is important to acknowledge its inherent limitations, which in turn suggest promising directions for future research. These limitations primarily fall into three categories: the cascaded nature of the framework’s architecture, the generalization capability of the model, and its robustness in specific failure scenarios.
First, a primary limitation stems from the serial, cascaded nature of the two-stage architecture. The framework’s overall performance is critically dependent on the success of the initial component localization stage. Any failure in this first stage—whether in detecting a component or providing an accurate bounding box due to factors like severe occlusion, challenging viewing angles, or novel hardware variants—inevitably propagates, leading to a complete failure in the subsequent defect detection stage, as the second model is never triggered. This error propagation characteristic imposes a theoretical ceiling on the system’s maximum achievable recall rate. Furthermore, the management and execution of two separate models introduce additional deployment complexity compared to a unified, end-to-end solution, which can pose engineering challenges, particularly in resource-constrained edge computing environments.
Second, the model’s robustness and generalization capabilities are inherently limited by the diversity of its training data. Although the dataset is extensive, it was captured exclusively within a specific geographic region (Yunnan Province). Consequently, the model’s performance could potentially degrade when deployed in environments with substantially different geographical features, weather conditions (e.g., snow, heavy fog), or lighting phenomena (e.g., intense specular reflections or deep shadows) that were underrepresented in the training set. This limitation highlights a potential gap between the model’s performance in controlled tests and its operational reliability in the field. Furthermore, the model’s generalization is confined to the ten predefined component types it was trained to localize; it cannot analyze hardware configurations outside of these learned categories.
Third, the system exhibits certain limitations when handling specific and ambiguous detection scenarios. The model may struggle to identify incipient or subtle defects, such as very early-stage corrosion that is visually similar to stains or minor surface discolorations. Similarly, split pins that are loose but not significantly deformed may not be reliably detected. Conversely, the system is susceptible to false positives when encountering features that mimic defects; for instance, shadows, water droplets, or adjacent bolt holes within complex metallic assemblies could be misinterpreted as a missing split pin.
To address these limitations, several avenues for future research are proposed. A critical direction is the development of a unified, end-to-end network that integrates component localization and defect detection, potentially through a shared backbone and multi-task learning heads. Such an architecture would mitigate error propagation and reduce deployment complexity. To enhance model generalization, future work will focus on curating a more diverse training dataset encompassing a wider range of geographical locations, weather conditions, and component types, supplemented by advanced data augmentation and domain adaptation techniques. Finally, improving the model’s discriminative power for ambiguous cases will involve exploring more advanced feature extraction modules and potentially incorporating a dedicated anomaly detection branch to reduce false positives.
