Article

Experimental Study and Engineering Application of Concrete-Encased Reinforcement for Mine Pillars

1
School of Resource & Environment and Safety Engineering, Hunan University of Science and Technology, Xiangtan 411100, China
2
State Key Laboratory of Metal Mine Safety Technology, Changsha 410012, China
*
Author to whom correspondence should be addressed.
Appl. Sci. 2025, 15(19), 10615; https://doi.org/10.3390/app151910615
Submission received: 8 September 2025 / Revised: 29 September 2025 / Accepted: 29 September 2025 / Published: 30 September 2025

Abstract

The stability of the mine pillar is a key issue related to the safe mining underground. Reinforcing the mine pillar is an important method to improve its stability. To reveal the reinforcement effect and mechanism of concrete-encased mine pillars, laboratory tests and field engineering application studies were conducted. Four groups of tests were carried out considering different sample sizes, rock strengths, encasing material strengths, and encasing layer thicknesses. The results demonstrated that mortar-encased rock specimens exhibited significant improvements in peak stress and axial peak strain. The reinforcement effectiveness was inversely proportional to the specimen’s height-to-diameter ratio and rock strength, while directly proportional to the wrapping material strength and layer thickness. Orthogonal range analysis revealed the sensitivity ranking of influencing factors as follows: encasing thickness > specimen height-to-diameter ratio > encasing material strength > rock strength. After encasing, the failure mode transitioned from integral failure to fragmented failure, with encased specimens demonstrating enhanced energy absorption capacity and bearing capacity. Increasing encasing strength and thickness induced a tendency towards plastic deformation failure. The encased rock-specimen system can be regarded as a parallel composite structure of rock and mortar layer. This configuration not only increases the bearing capacity of the mortar layer but also significantly enhances the rock’s intrinsic bearing capacity through confining pressure provided by the encasing material, which grows substantially with improvements in encasing material strength and thickness. Field applications in mines demonstrated that concrete-encased reinforcement of key area pillars can effectively control overall ground pressure in mining operations. The research results of this paper indicated that the reinforcement of mine pillars by concrete wrapping can enhance the stability of mine pillars and provide a new idea for improving the safety of mines.

1. Introduction

The comprehensive mining method with retaining ore pillars is the most commonly used approach for gently inclined ore bodies [1,2,3]. Owing to historical mining activities, many untreated contiguous mined-out areas have formed in such mines, with ore pillar groups used to support the stability of these areas [4,5]. Under the influence of long-term mining disturbances, natural weathering, and other factors, instabilities in ore pillar groups have led to frequent occurrences of large-scale collapses in mined-out areas [6]. Examples include the major collapse in the mined-out area of the Gaofeng Metal Mine in Dachang, Guangxi Province, on 19 March 1993, which was followed by more than ten subsequent mine tremors caused by additional collapses in other mined-out areas [7]; the large-scale collapse of the mined-out area in the Qingshan Pyrite Mine in Lianyuan city, Hunan Province, on 1 July 1996, which induced a 2.6-magnitude mine tremor [8]; the large-scale roof collapse in the Yicheng Gypsum Mine in Zaozhuang city, Shandong Province, on 20 May 2002, which resulted in a 3.6-magnitude mine tremor that affected four surrounding mines and formed a 144,700 km2 collapse area on the surface [9]; the large-scale collapse in the mined-out area of the Shangwangzhuang Gypsum Mine in Xingtai, Hebei Province, on 6 November 2005, which created a collapse area approximately 300 m long, 210 m wide (short axis), and 53,000 km2, and caused 37 fatalities [10]; the large-scale collapse in the mined-out area of the Wanzhuang Mining Area in Linyi city, Shandong Province, on 25 December 2015 which induced nine mine tremors with magnitudes ranging from 0.9 to 3.5 and resulted in the formation of a ground collapse area approximately 1220 m long (east–west) and 660 m wide (north–south), affecting the Wanzhuang, Yurong, and Baotai gypsum mines, with an area of approximately 0.61 km2 [11]; and the large-scale collapse in the mined-out area of the Xiang’an Tungsten Mine in Anhua County, Yiyang City, Hunan Province, on 17 September 2022, which induced a 3.0-magnitude mine tremor [12]. These accidents were all caused by instabilities in the ore pillars, leading to large-scale collapses in the mined-out areas, which often resulted in significant casualties and economic losses. Therefore, the stability of ore pillars is a key concern in the safety management of such mines.
Scholars have conducted extensive research on the stability of ore pillars. For example, the peak strength of chromite pillars in South African platinum mines has re-examined by comparing laboratory test results to calculation results obtained via the Upper Group 2 (UG2) PlatMine pillar strength formula and to underground measurements [13]. Weizhang Liang et al. used the GBDT, XGBoost, and LightGBM algorithms to predict hard rock pillar stability [14]. To calculate pillar strength, many empirical methods, such as the linear shape effect, power shape effect, size effect, and Hoek–Brown formulas [15], has been proposed. Mortazavi et al. used the fast Lagrangian analysis of continua (FLAC) approach to study the failure process and nonlinear behavior of rock pillars [16]. Using numerical simulation techniques, the complex failure behaviors of pillars can be modeled, and the failure process and range can be obtained. However, because of the complicated nonlinear characteristics and anisotropic nature of rock masses, model inputs and constitutive equations are not easy to accurately determine [17]. Tawadrous and Katsaban used artificial neural networks (ANNs) to analyze the stability of surface crown pillars [18]. Wattimena introduced multinomial logistic regression (MLR) for pillar stability prediction [19]. Ding et al. adopted a stochastic gradient boosting (SGB) model to predict pillar stability [20]. Grgic D. and Homand F. used the FLAC2D numerical calculation method to analyze the rheological properties of the ore pillar group in the Lorraine room-and-pillar mining system in France [21]. AI Heib et al. evaluated the load distribution of the ore pillar group in the French Senonian gypsum mine and used the FLAC3D numerical simulation method to analyze the influence of water level, rock layer integrity, and lithology on the distribution of plastic zones in the ore pillar group [22]. Salmi et al. considered the effect of degradation on the load and strength of ore pillars, optimized the calculation formula for ore pillar strength, and analyzed the impact of degradation on the long-term stability of ore pillar groups [23]. Zhou Zilong et al. conducted experimental research on the deformation, failure, and bearing characteristics of a double-pillar system, using the particle flow discrete element PFC2D to study the dynamic process of chain instability in the ore pillar group, as well as the influence of different ore pillar safety factors, different triggering locations, and different roof stiffness on the chain instability of the ore pillar group, and evaluated the stability of the ore pillar group system under different safety factor standards based on the Monte-Carlo simulation method [24]. Guan Yongwei et al. used the finite element numerical simulation method to study the influence of key layer thickness on the stress field of the key layer-rock pillar system and found that stress redistribution occurred in the key layer-rock pillar system, with stress concentration mainly located at the corners of the rock pillars, the mid-span surface of the key layer, and the upper surface of the key layer directly above the rock pillars [25]. Liu Jianxin et al. conducted theoretical and numerical experimental research on the deformation and fracture process of a coal-rock combined model using the two-body interaction theory and RFPA [26]. Zhu Defu et al. employed renormalization theory to analyze the instability probability of mine ore pillar groups and evaluated methods for assessing the stability of these groups [27]. Feng Guorui et al. proposed the weakest instability disaster mode for left-behind coal pillar groups, analyzed the disaster-inducing mechanism of local instability in key pillars, and introduced key pillar theory for chain instability in left-behind coal pillar groups [28]. Tesarik et al. and Tan et al. developed a physical monorail compression experimental model and analyzed the supporting effect of the backfill on the surrounding rock, finding that the backfill improves long-term underground safety by supporting the mine’s roof and maintaining the strength of the support pillars [29,30].
Regarding the issue of pillar stability, scholars both domestically and internationally have primarily conducted research using theoretical analysis, numerical calculations, and field monitoring methods, focusing mainly on aspects such as pillar strength, load-bearing capacity, and instability mechanisms. Currently, there is small amount of research on the engineering reinforcement of pillars, particularly on the reinforcement of concrete-encased pillars. Zhang C. et al. explored the coupling bearing behavior and interfacial force transfer characteristics of concrete-wrapped coal pillars through laboratory uniaxial compression experiments [31]. Li Jian et al. introduced a new technique to strengthen square cement mortar columns via fiber-reinforced polymer (FRP) strips to verify the strengthening effect of FRP on pillars [32]. Zhao et al. and Ren et al. studied the axial compression characteristics of coal gangue concrete columns constrained by FRP [33,34]. The author’s team has carried out laboratory tests and engineering application studies to reveal the reinforcement mechanisms of concrete-encased pillars and their effectiveness in ground pressure control engineering, thereby providing a new approach for the engineering reinforcement of pillars.

2. Experimental Plan

2.1. Preparation of the Test Samples

To investigate the reinforcement effect and mechanism of ore pillars encased by concrete, our team conducted four sets of reinforcement experiments on test samples. The first set involved encasing and reinforcement tests on rock samples of different sizes (with diameters and heights of 50 mm × 50 mm, 50 mm × 100 mm, 50 mm × 150 mm, and 50 mm × 200 mm). The second set involved encasing and reinforcement tests on three types of rock samples with different strengths (red sandstone, blue sandstone, and white sandstone) for encasing and reinforcing tests. The third involved encasing and reinforcement tests on three different encasing materials (M5, M10, and M10 reinforced mortar). The fourth set involved encasing and reinforcement tests with different encasing thicknesses (using rock samples with a diameter of 50 mm and encasing them to diameters of 70 mm, 100 mm, and 150 mm).
Using 42.5 Ordinary Portland Cement and fine sand, mortars were prepared with the following mass ratios: a cement–sand–water ratio of 1:4.5:1.1 for M10 strength grade, and a ratio of 1:6.0:1.2 for M5 strength grade. PVC pipes with internal diameters of 70 mm, 100 mm, and 150 mm were used as molds. The rock specimens were placed centrally within these molds, the inner walls of which were coated with engine oil as a release agent. The cement mortar was then poured into the molds. Demolding was performed after 24 h. Following demolding, the specimens were placed in a curing chamber maintained at 20 °C and 90% relative humidity for 28 days. Finally, both ends of the specimens were ground, achieving a post-grinding length tolerance of less than 1 mm. See Table 1.

2.2. Testing Method for the Test Samples

The force on the mine pillar comes from the top and bottom plates of the goaf. The periphery of the mine pillar is open. To simulate the force-induced failure process of ore pillars, uniaxial compression failure tests were conducted on the test samples. The loading system utilized a hydraulic universal material testing machine (model: YNS-Y600, produced by Changchun Machinery Science Research Institute Co., Ltd., Changchun, China). To simulate the increasing stress conditions experienced by ore pillars during mining activities, the tests were conducted via a velocity-controlled loading method with a loading rate of 2 mm/min. The monitoring system included a stress-displacement monitoring system for the loading system, a strain monitoring system, and an acoustic emission monitoring system. An ST-3C dynamic and static strain meter (model: ST-3C, manufacturer: Beijing Boren Jizhi Technology Co., Ltd., Beijing, China) was used to monitor the strain of the test samples. A PAC acoustic emission system (model: Micro-Ⅱ, manufacturer: Physical Acoustics Corporation, West Windsor Township, NJ, USA) was used to monitor the acoustic emissions of the test samples during the loading process. Figure 1 shows a schematic diagram of the test system structure, and Figure 2 shows a photograph of the test system onsite.

3. Results of the Uniaxial Compression Tests on the Test Samples

3.1. Uniaxial Compression Tests on Test Samples of Different Sizes

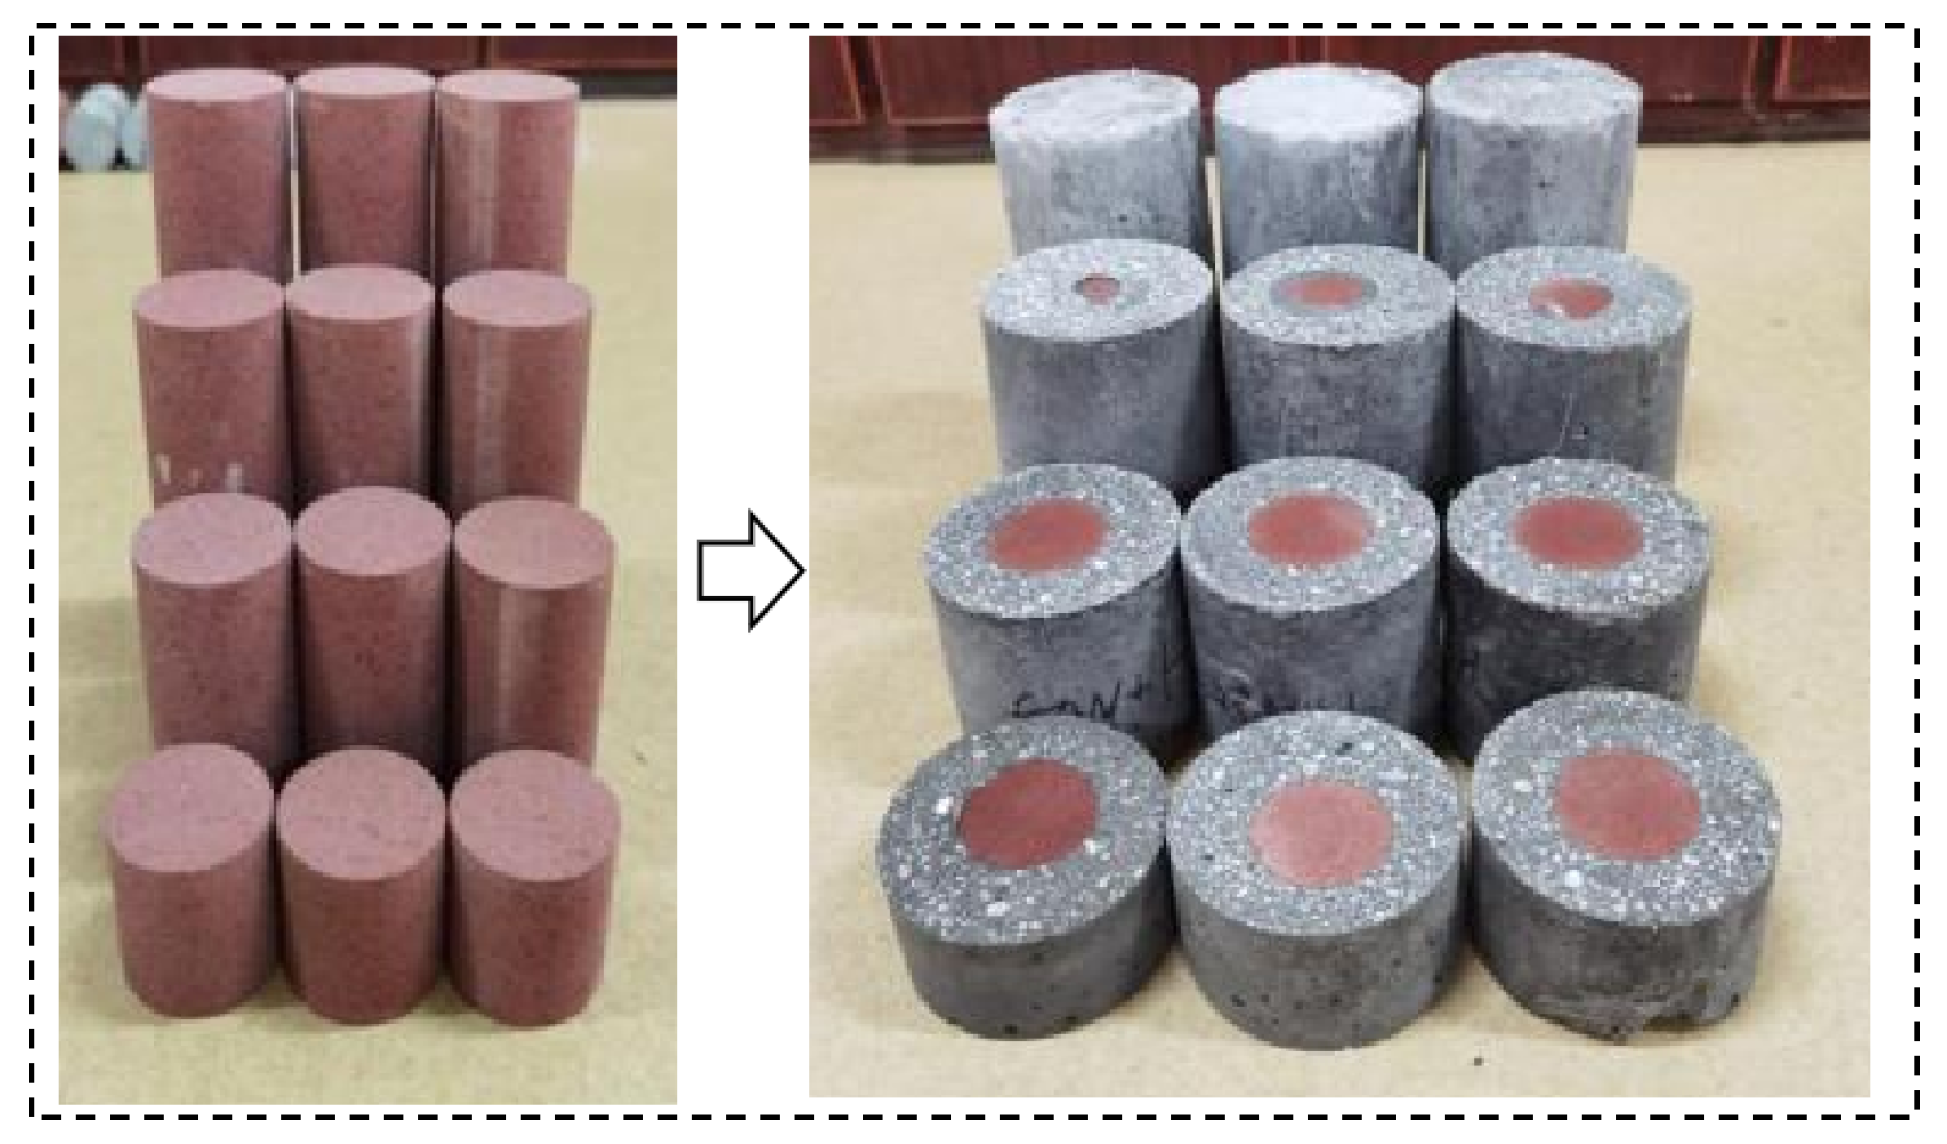
Four different sizes of red sandstone test samples, with diameters and heights of 50 mm × 50 mm, 50 mm × 100 mm, 50 mm × 150 mm, and 50 mm × 200 mm, were used for encasing and reinforcement tests. The encasing material was M10 mortar, with an encasing thickness of 25 mm, resulting in an encased sample diameter of 100 mm. Specimens 4-1, 4-2, and 4-3 are the 50 mm × 50 mm rock samples before encapsulation, while specimens H-17, H-18, and H-19 are the counterparts after encapsulation, with a final diameter of 100 mm and a height of 50 mm. Specimens 1-1, 1-2, and 1-3 are the 50 mm × 100 mm rock samples before encapsulation, while specimens H-1, H-2, and H-3 are the counterparts after encapsulation, with a final diameter of 100 mm and a height of 100 mm. Specimens 5-1, 5-2, and 5-3 are the 50 mm × 150 mm rock samples before encapsulation, while specimens H-13, H-14, and H-15 are the counterparts after encapsulation, with a final diameter of 100 mm and a height of 150 mm. Specimens 6-1, 6-2, and 6-3 are the 50 mm × 200 mm rock samples before encapsulation, while specimens H-22, H-23, and H-24 are the counterparts after encapsulation, with a final diameter of 100 mm and a height of 200 mm. Photographs of the test samples before and after encasing are shown in Figure 3.
In Table 2, f 0 represents the peak bearing capacity of the rock sample before wrapping, ε 0 represents the peak strain of the rock sample before wrapping, f b represents the peak bearing capacity of the rock sample after wrapping, ε b represents the peak strain of the rock sample after wrapping, f b / f 0 represents the multiple by which the peak bearing capacity of the rock sample increases after wrapping, ε b / ε 0 represents the multiple by which the peak strain of the rock sample increases after wrapping. Table 2, Table 3 and Table 4 are the same.
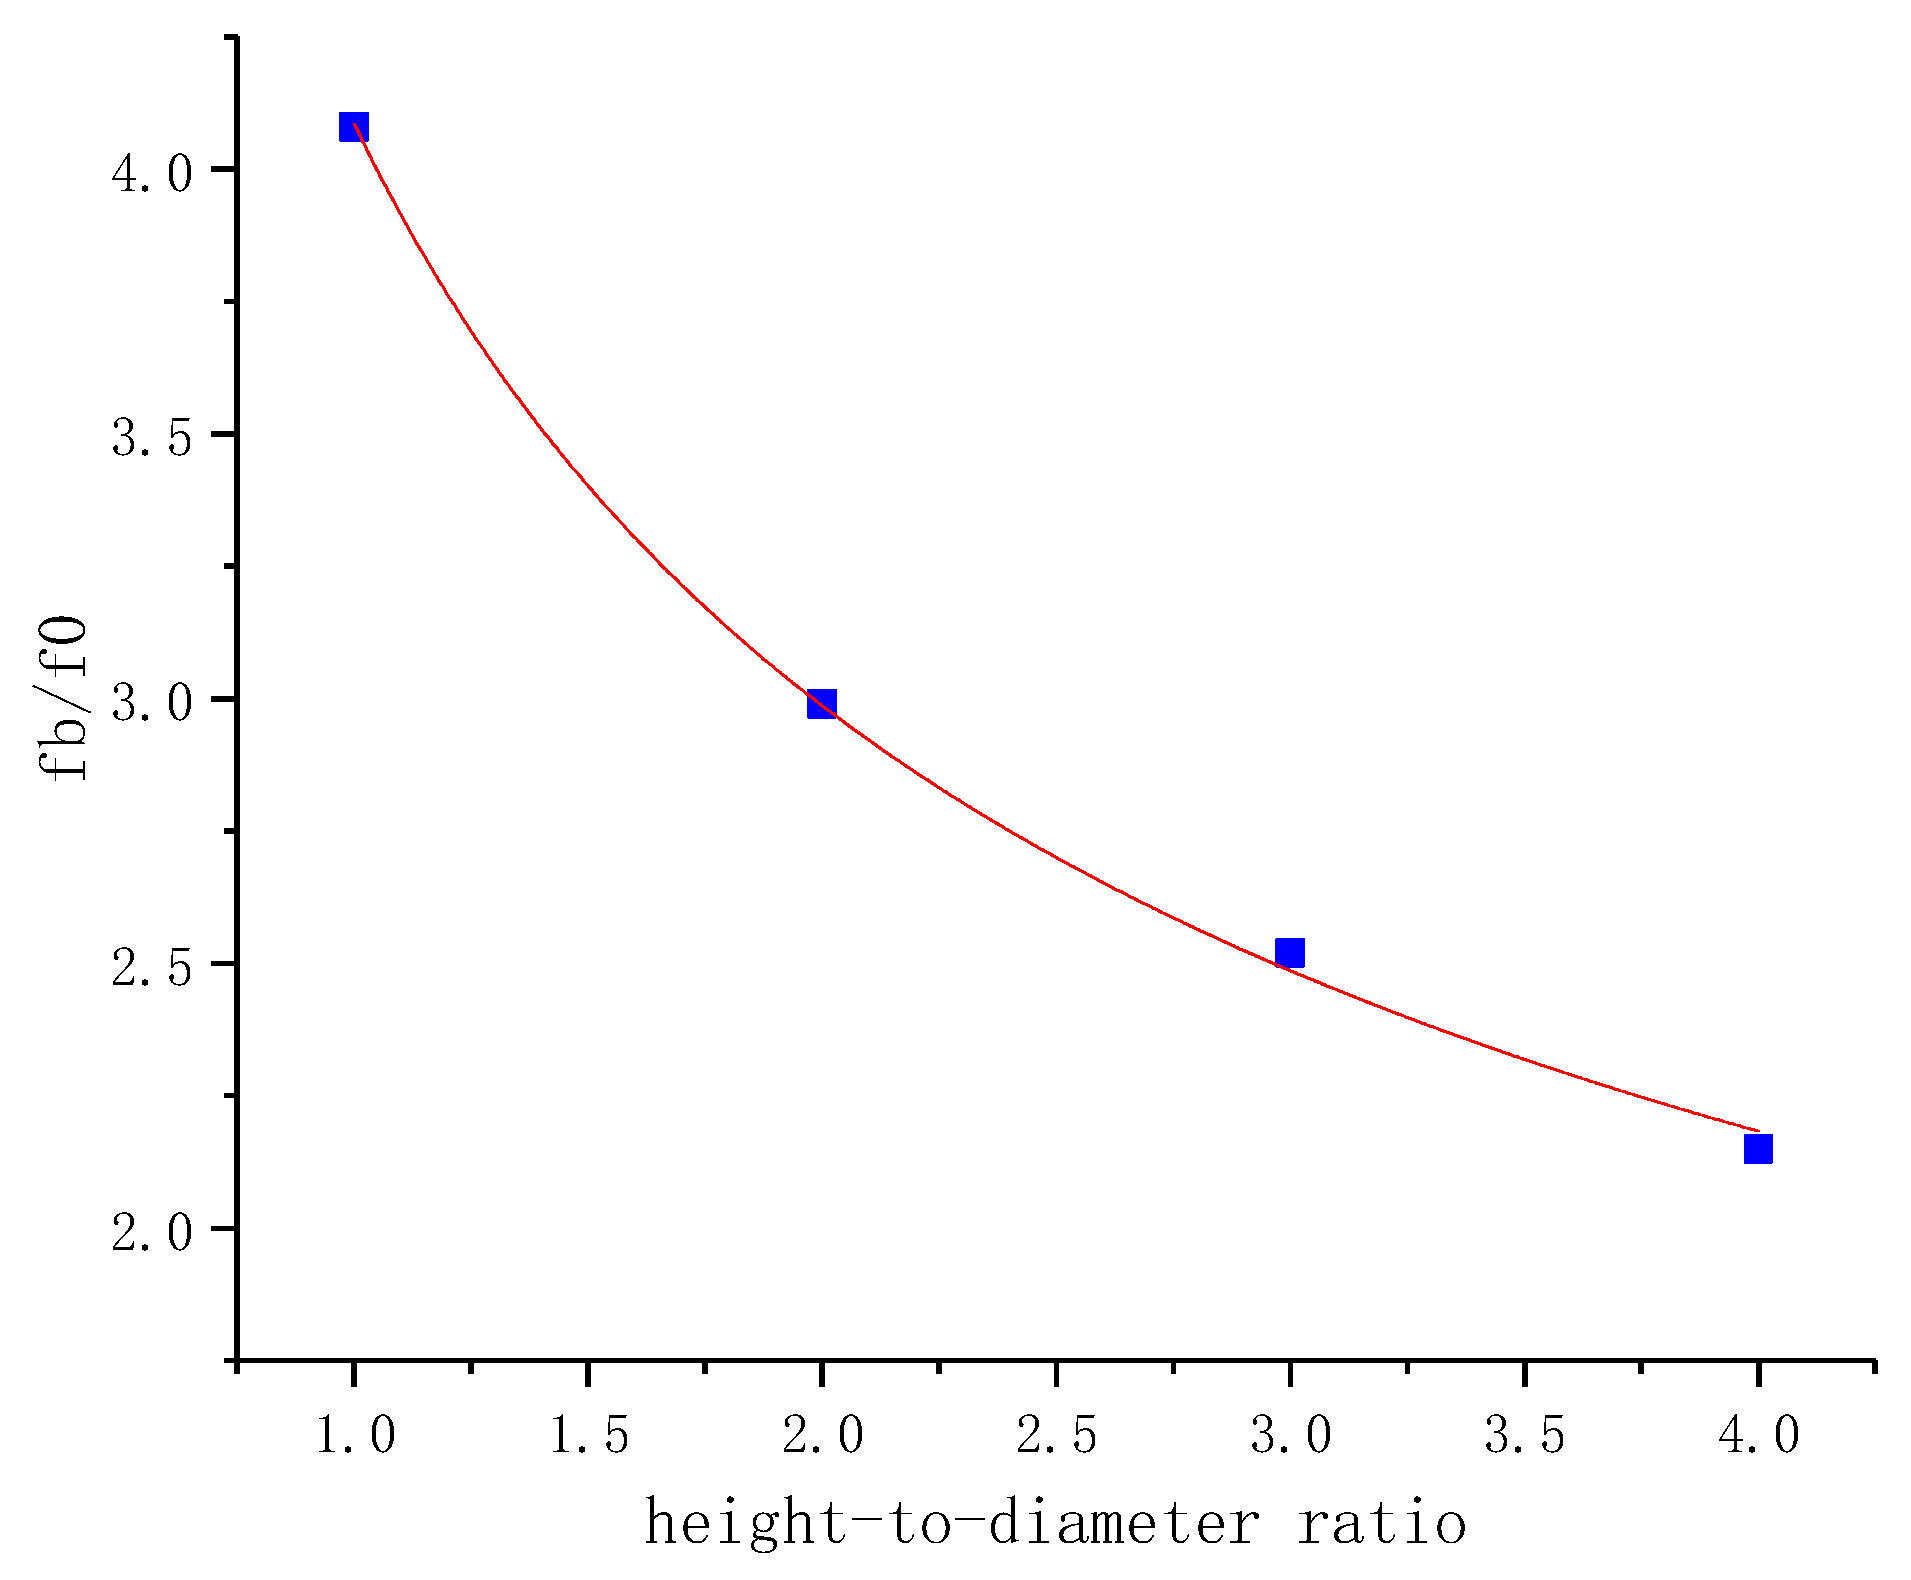
The test results before and after encasing for the samples of different sizes are shown in Table 1 and Figure 4. The peak bearing capacity of the samples of various sizes significantly increased after encasing. For red sandstone samples with a diameter and height of 50 mm × 50 mm, the peak bearing capacity before encasing was 31.61 kN, whereas after encasing, it ranged from 123.95~136.11 kN, with an average increase of 4.08 times. For the samples with dimensions of 50 mm × 100 mm, the peak bearing capacity before encasing was 44.49 kN, and after encasing, it was between 130.74~136.31 kN, indicating an average increase of 2.99 times. For those with dimensions of 50 mm × 150 mm, the peak bearing capacity before encasing was 43.35 kN, and after encasing, it was between 103.75~118.87 kN, indicating an average increase of 2.52 times. Finally, for the samples with dimensions of 50 mm × 200 mm, the peak bearing capacity before encasing was 36.52 kN, and after encasing, it ranged from 78.07~79.56 kN, with an average increase of 2.16 times.
Figure 4 presents the fitting curve of the relationship between the reinforcement effect of encasing and the aspect ratio (height-to-diameter ratio) of the samples. As the aspect ratio of the samples decreased, the improvement in peak strength become more pronounced, indicating a better reinforcement effect from encasing. The increase in peak bearing capacity was exponentially related to the aspect ratio of the samples, following a power function.
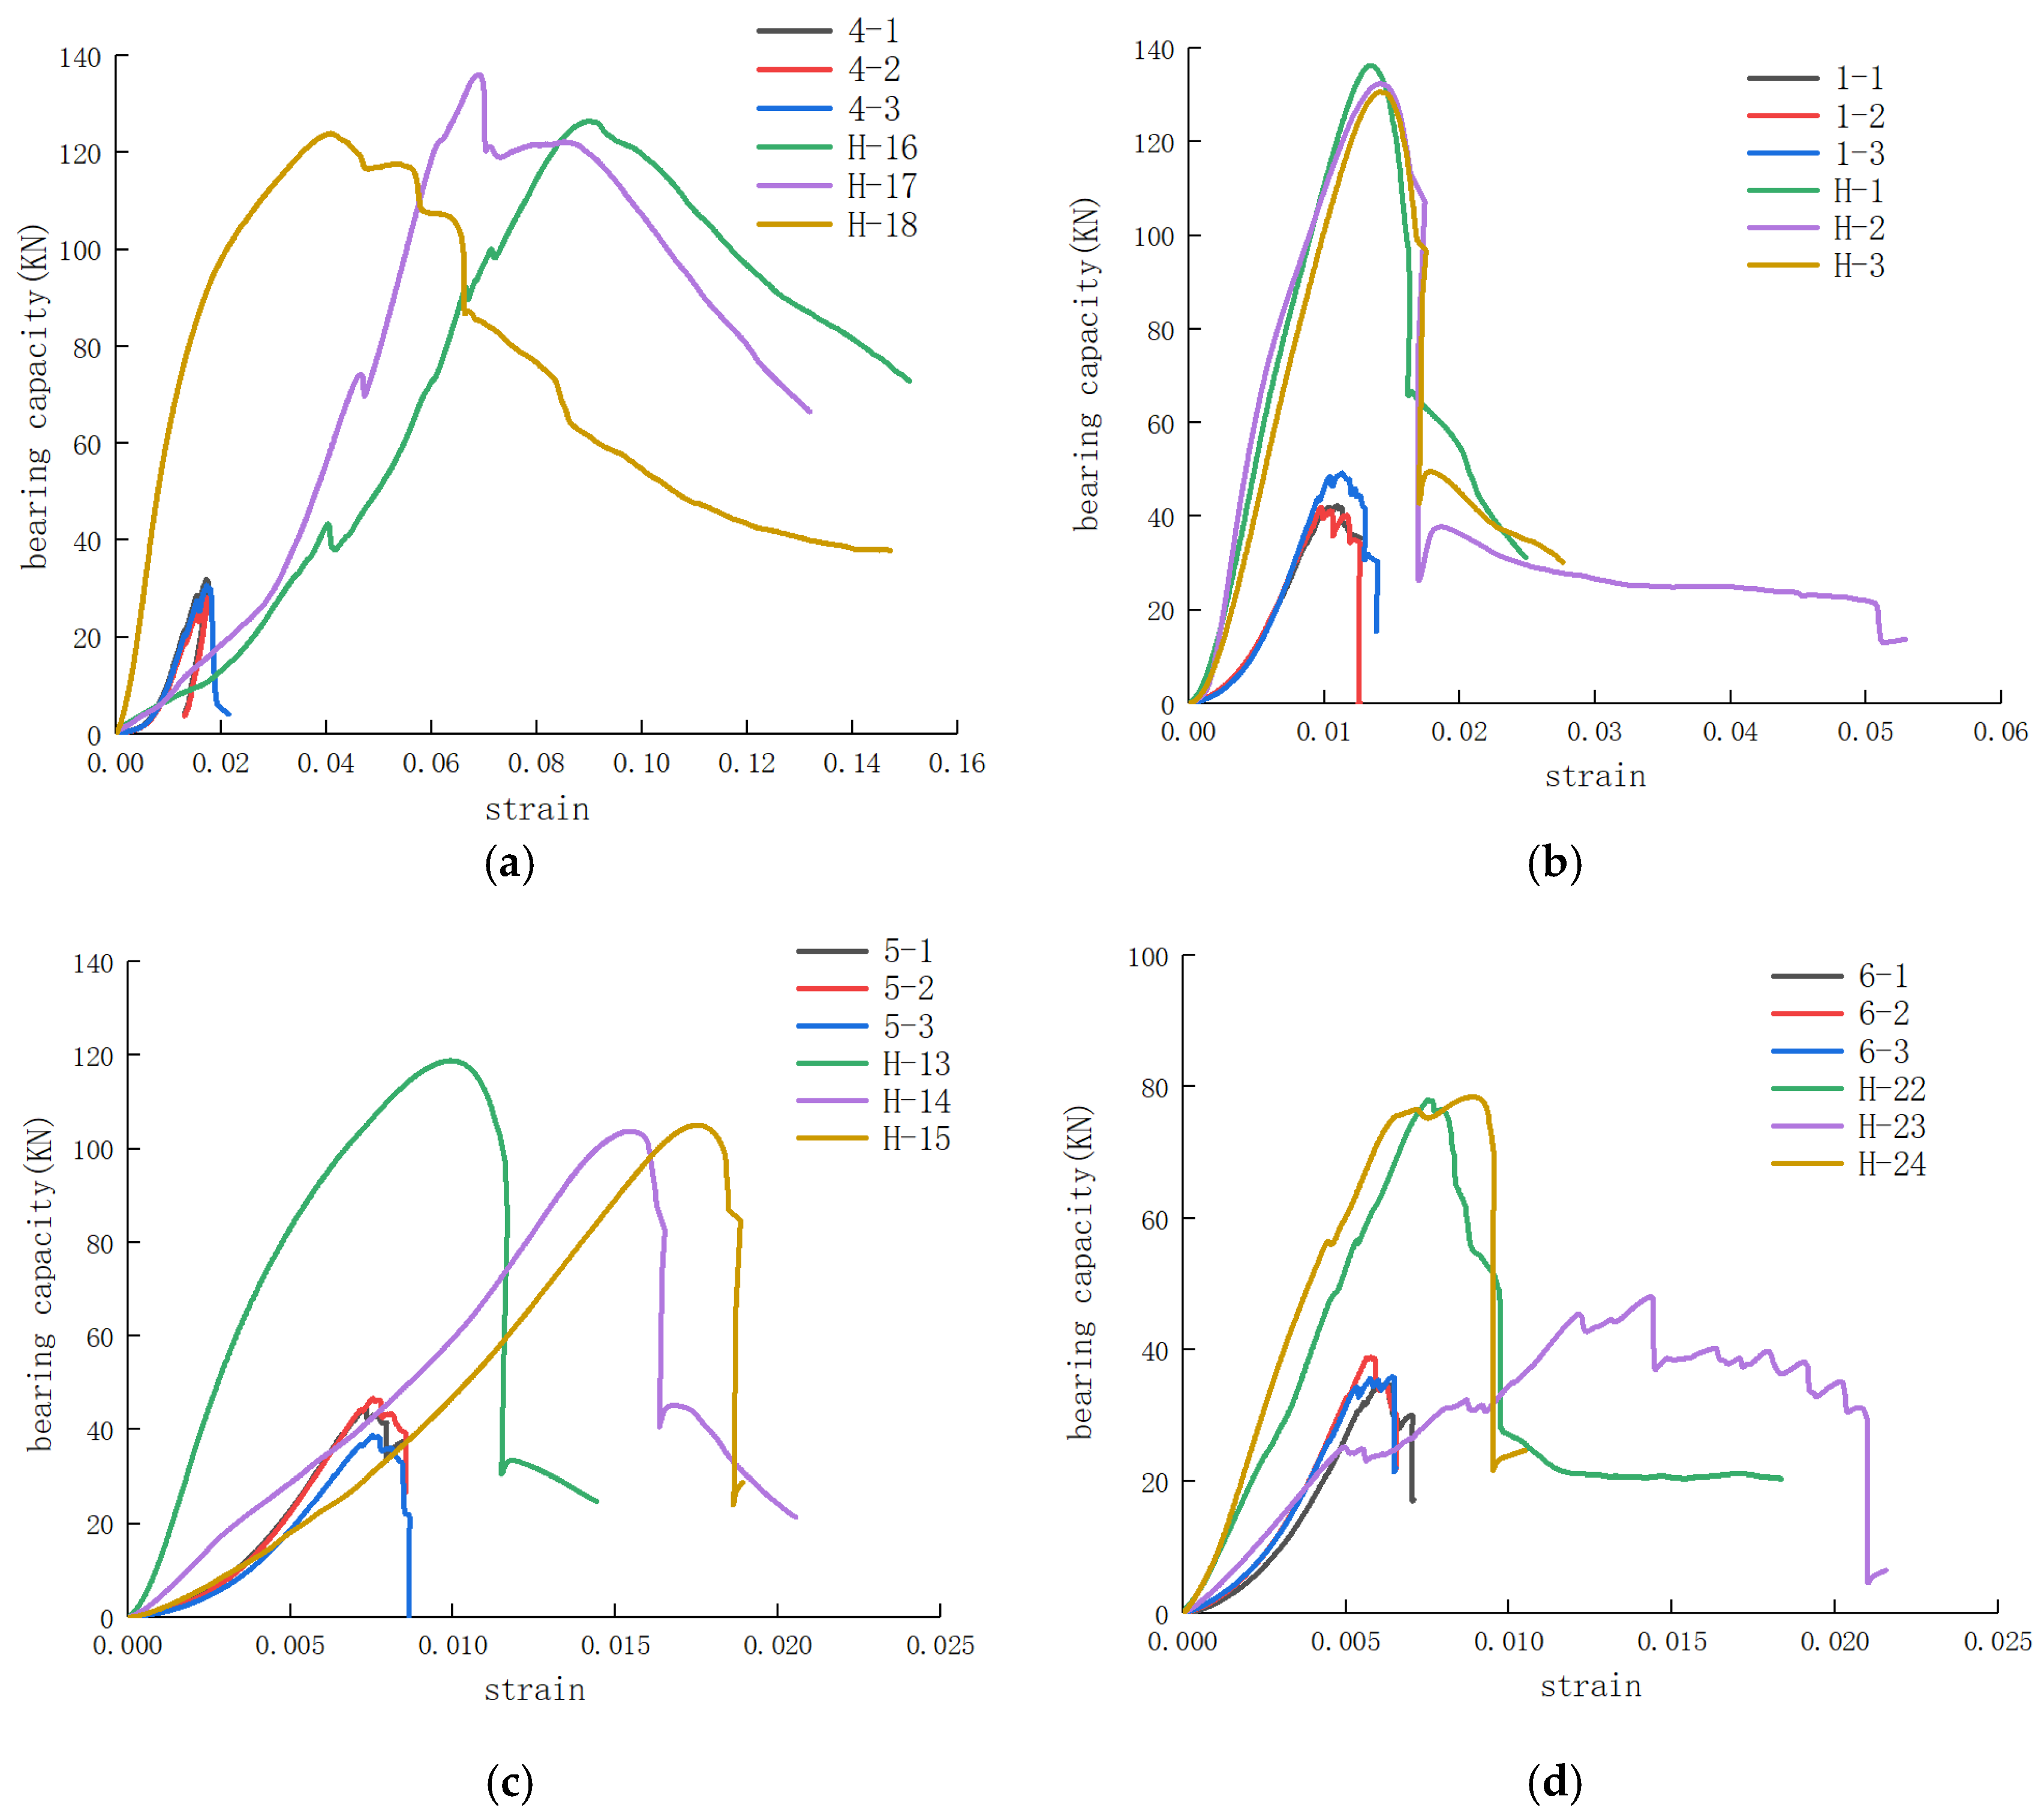
Figure 5 displays the bearing capacity-strain curves of red sandstone samples of different sizes before and after encasing. It is evident that after encasing, the peak bearing capacity of the samples was significantly enhanced, along with a notable increase in the axial peak strain. Specifically, for samples with a diameter and height of 50 mm × 50 mm, the average axial peak strain increased by 3.87 times after encasing. For those with dimensions of 50 mm × 100 mm, it increased by 1.32 times. For samples with dimensions of 50 mm × 150 mm, the increase was 1.93 times, and for those with dimensions of 50 mm × 200 mm, the average axial peak strain increased by 1.77 times. Prior to encasing, the samples exhibited brittle failure, with a rapid decrease in bearing capacity after reaching the peak. However, after encasing, the samples retained a certain residual strength beyond the peak strength. Furthermore, samples with a smaller aspect ratio exhibited greater residual strength after reaching the peak.

3.2. Uniaxial Compression Tests on Rock Specimens with Different Strengths

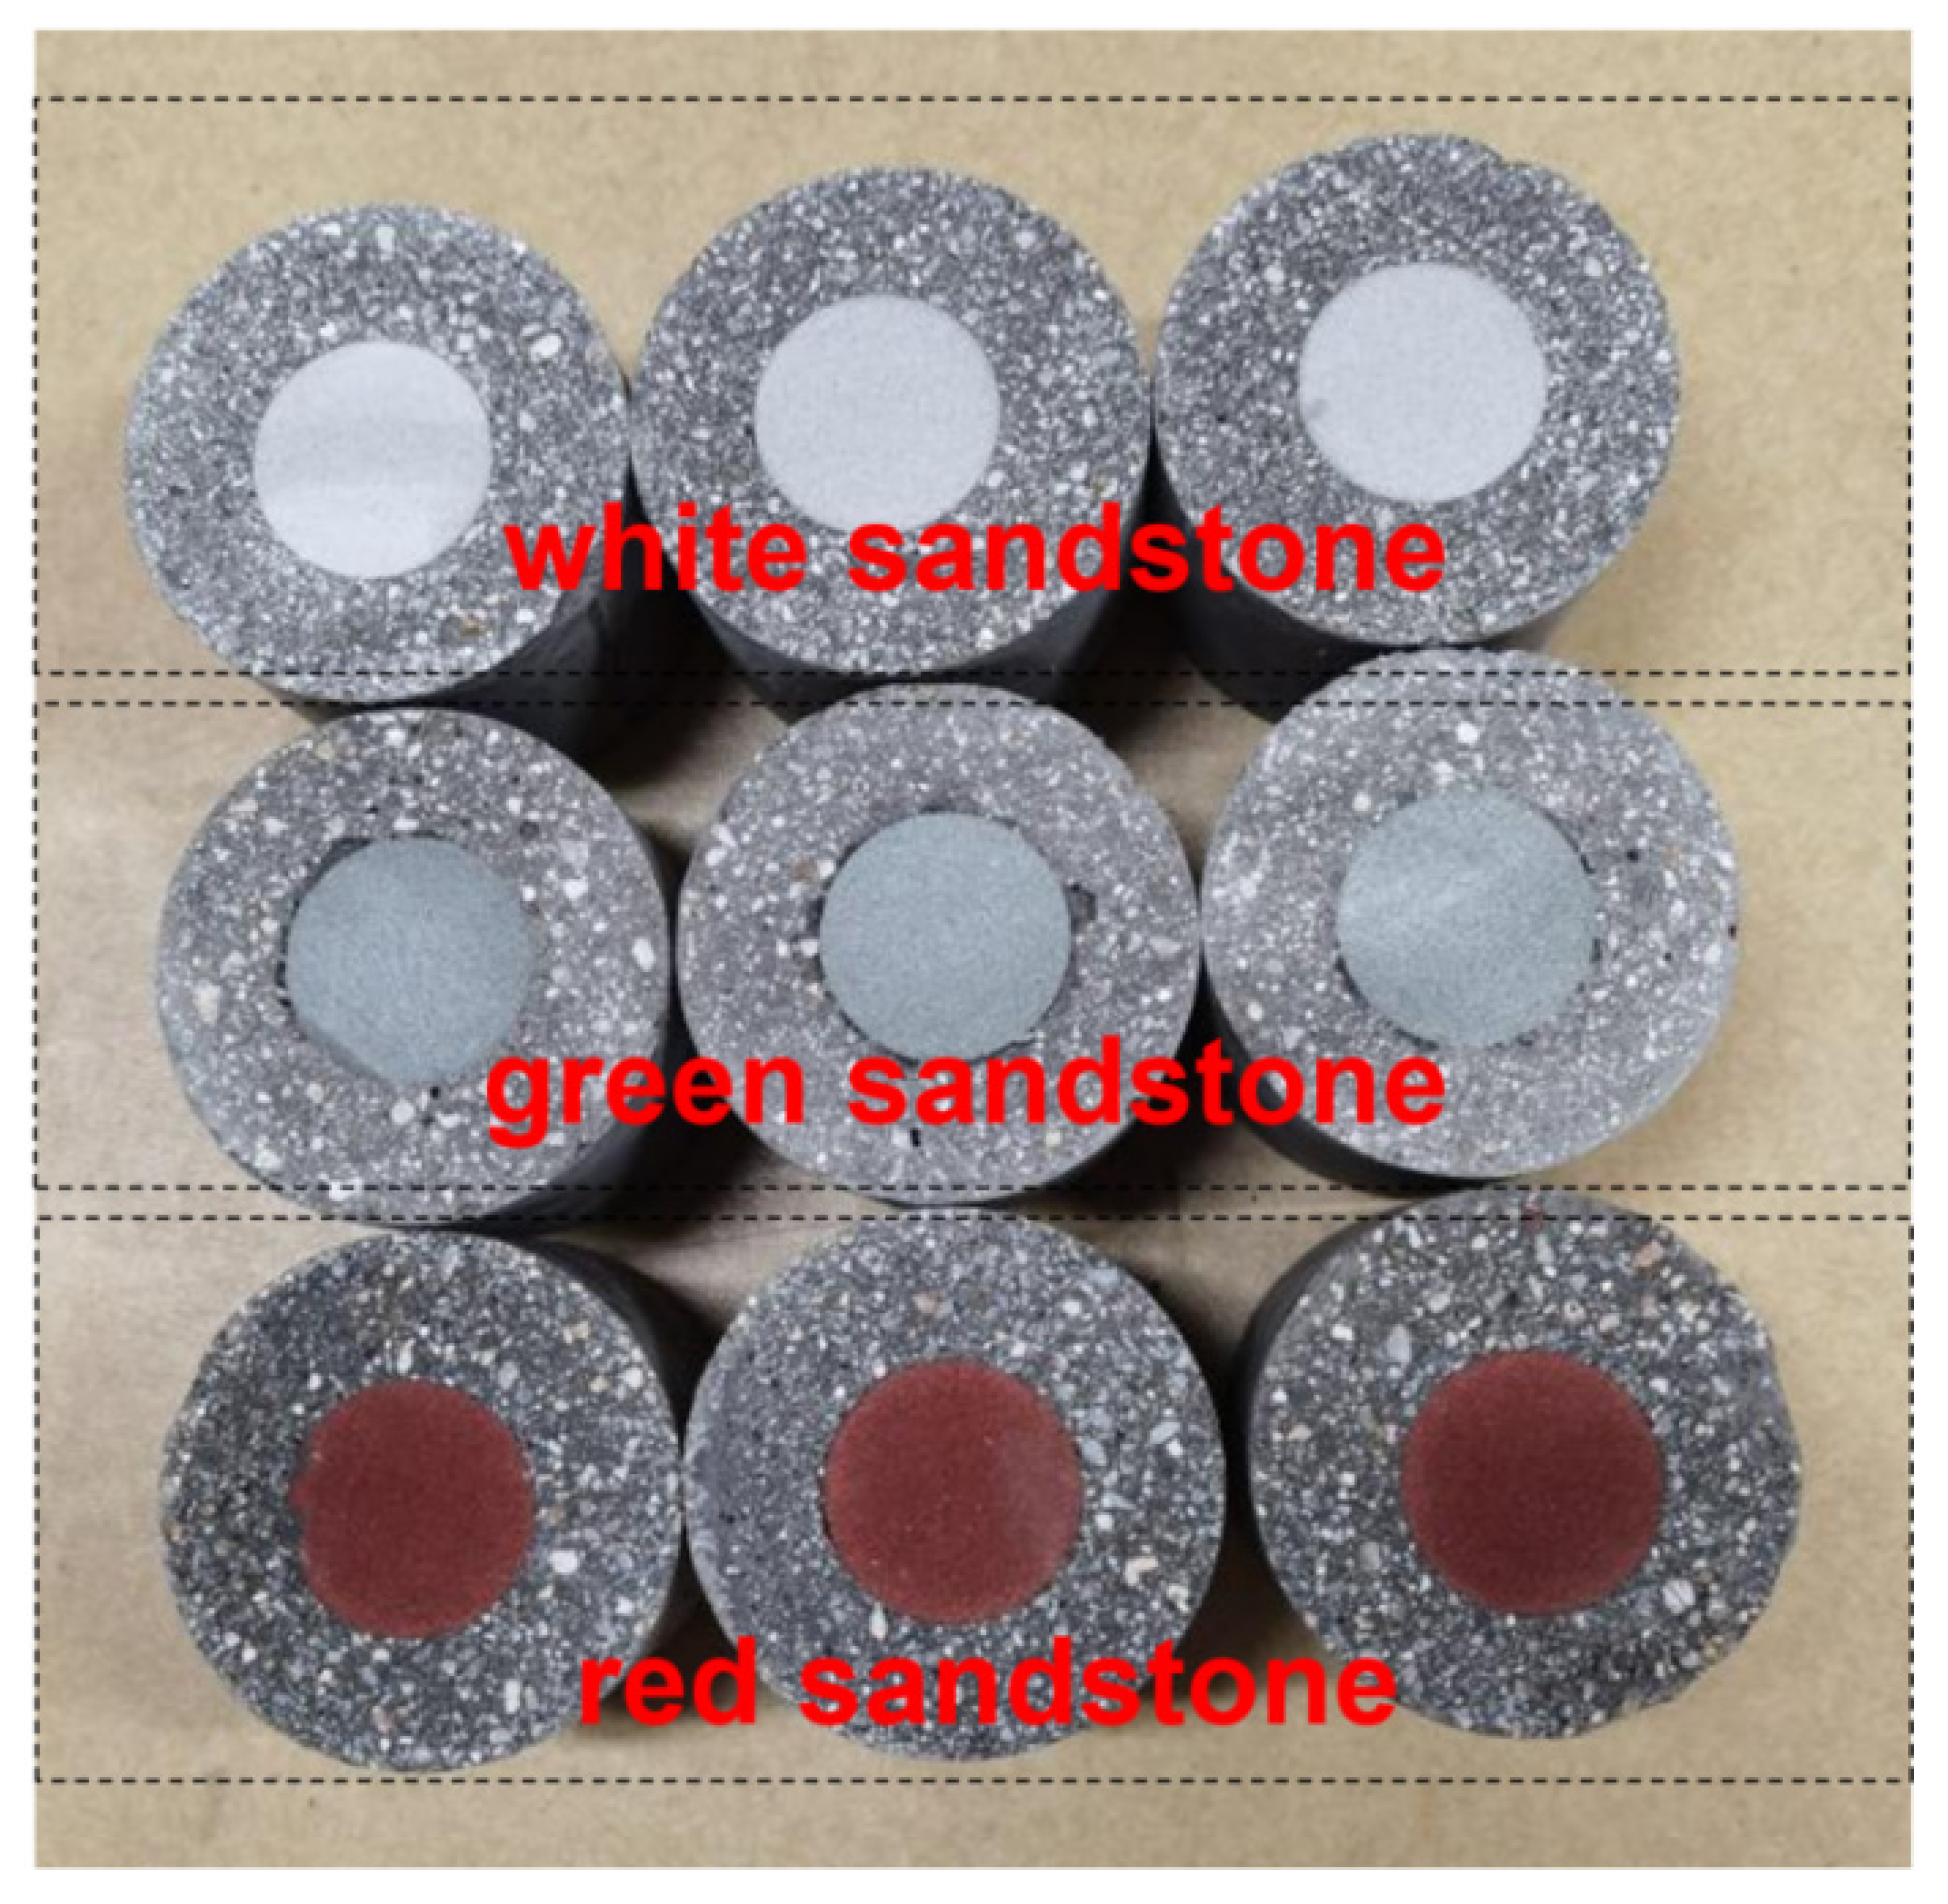
To investigate the influence of rock sample strength on the reinforcement effect, encasing and reinforcement tests were conducted separately on three different types of rock samples: red sandstone, green sandstone, and white sandstone. The rock samples were 100 mm in height and 50 mm in diameter. The encasing material used was M10 mortar with a thickness of 25 mm, resulting in a sample diameter of 100 mm after encasing. Specimens 1-1, 1-2, and 1-3 are the red sandstone rock samples before encapsulation, while specimens H-1, H-2, and H-3 are the counterparts after encapsulation. Specimens 2-1, 2-2, and 2-3 are the green sandstone rock samples before encapsulation, while specimens Q-1, Q-2, and Q-3 are the counterparts after encapsulation. Specimens 3-1, 3-2, and 3-3 are the while sandstone rock samples before encapsulation, while specimens B-1, B-2, and B-3 are the counterparts after encapsulation. A photograph of the encased samples was shown in Figure 6.
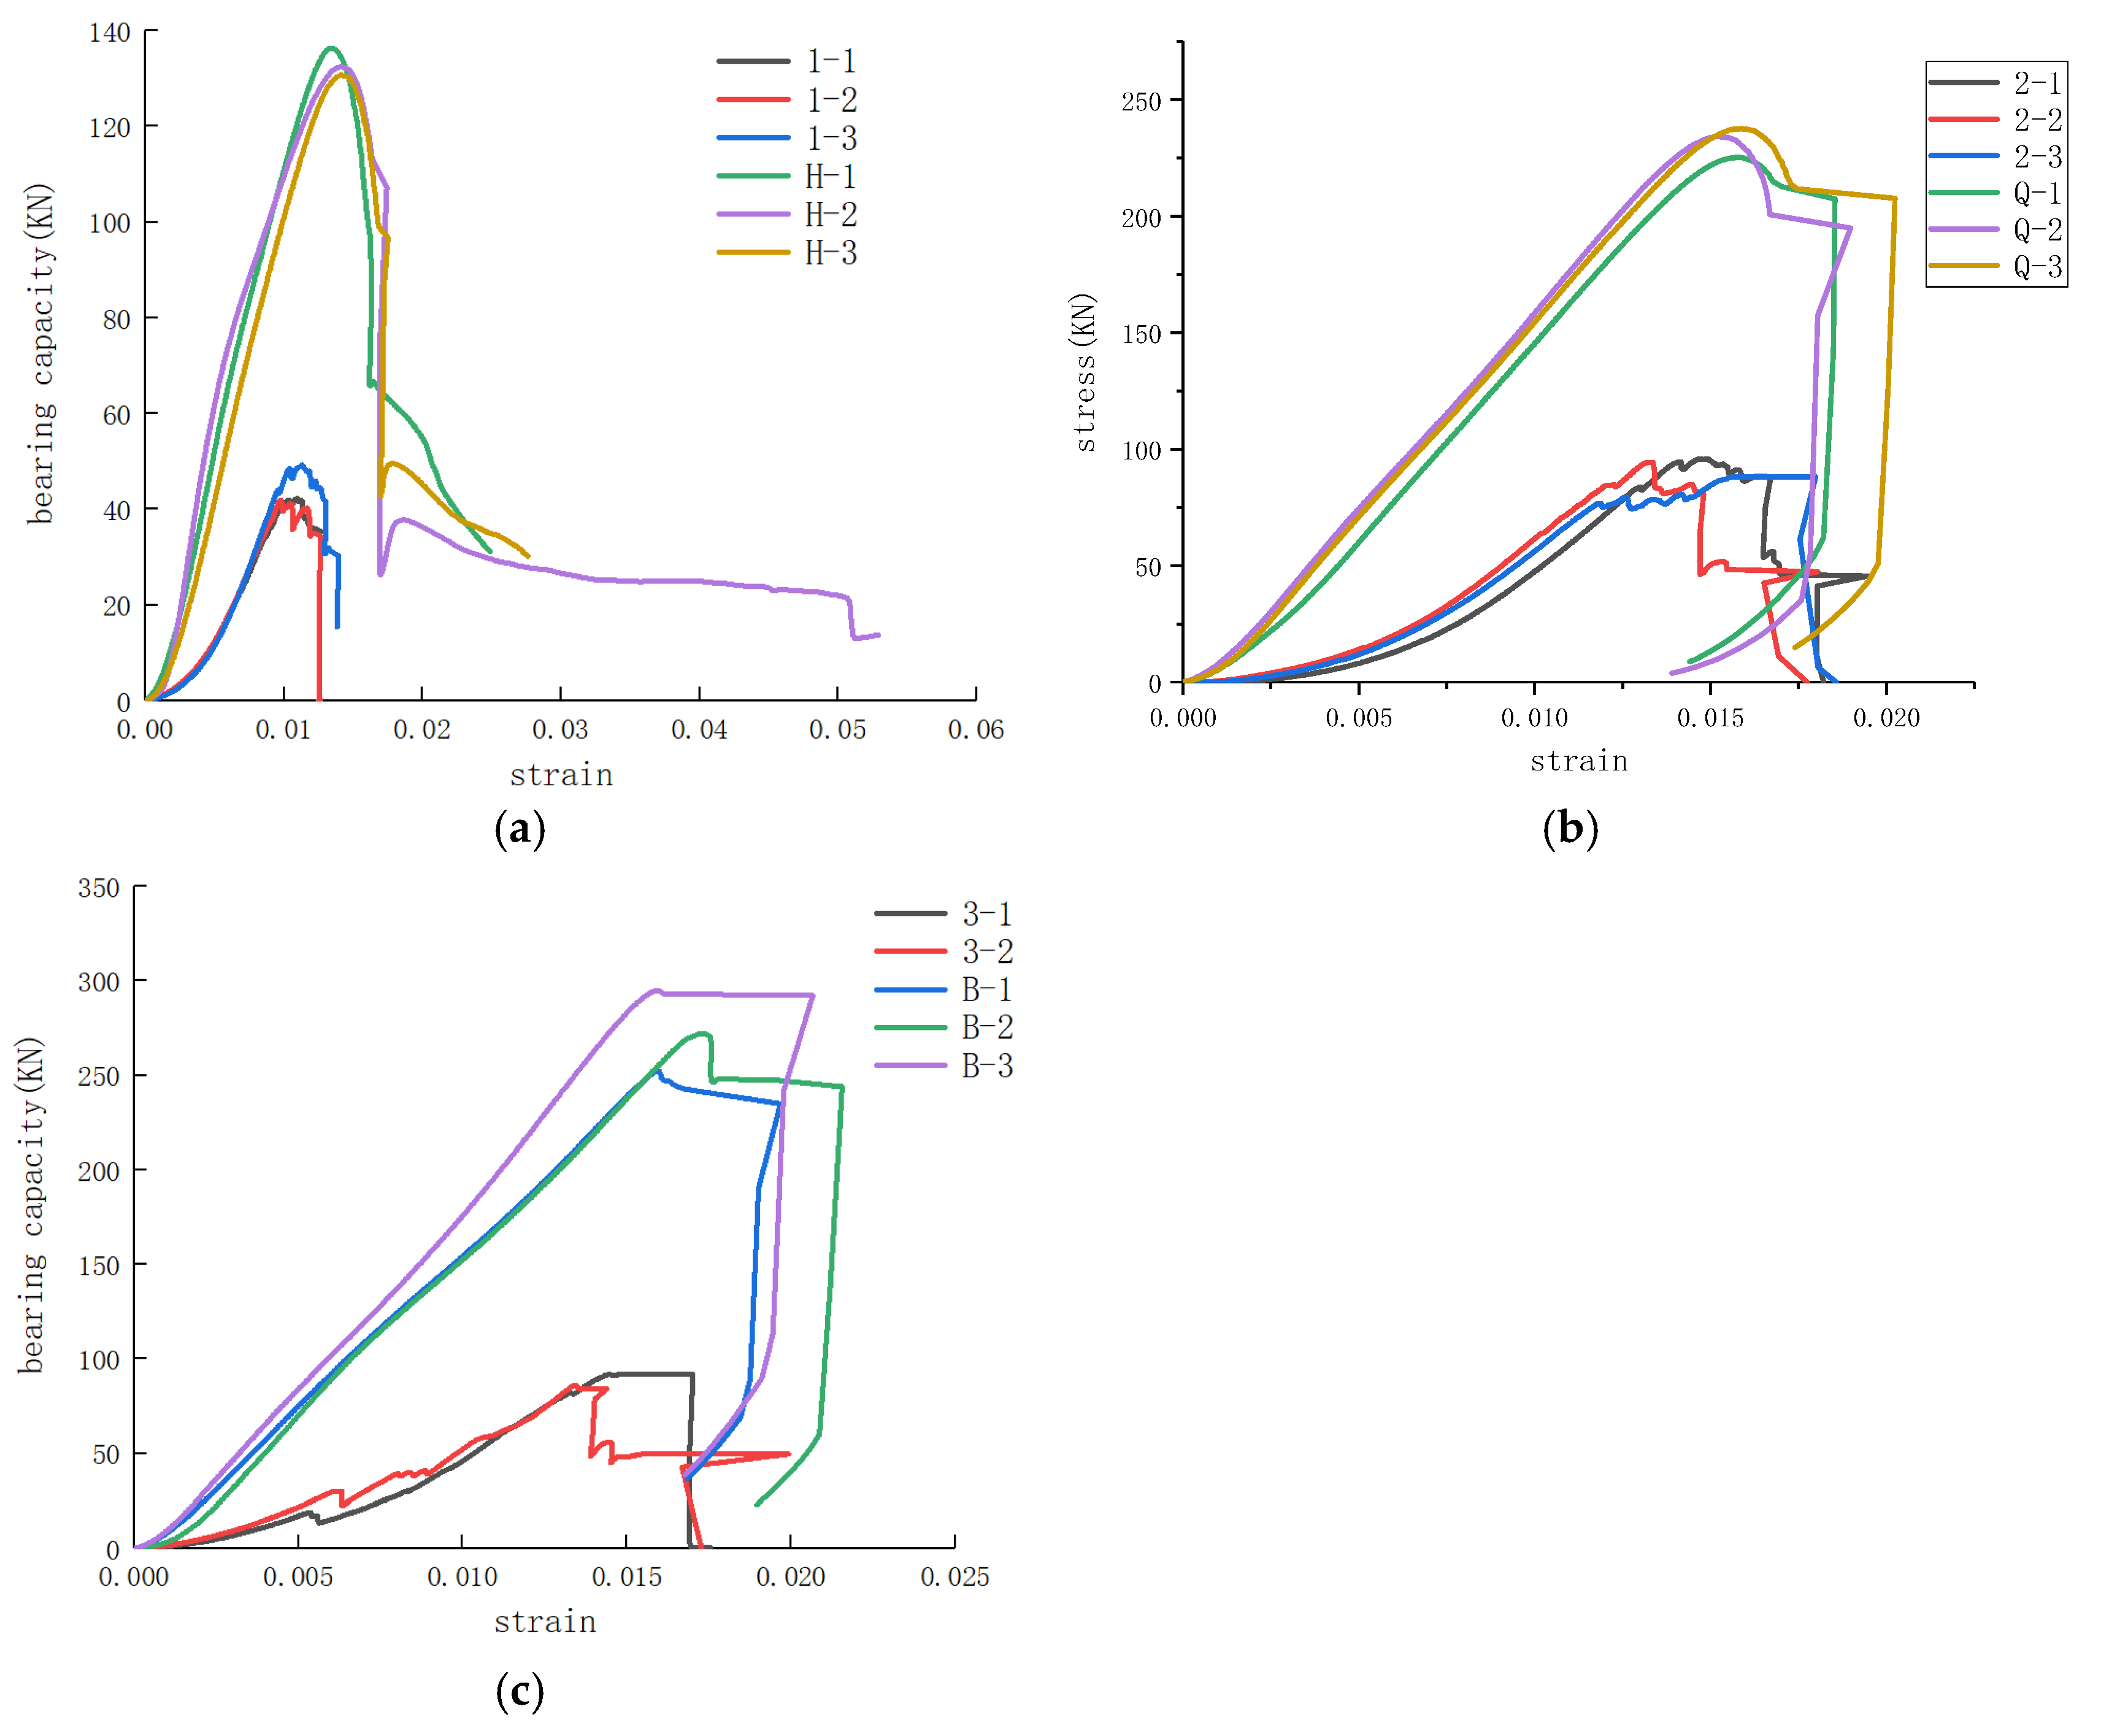
The test results before and after encasing for rock samples of different strengths are presented in Table 3 and Figure 7. The peak bearing capacity of the rock samples significantly increased after encasing. Specifically, for the red sandstone samples, the average peak bearing capacity before encasing was 44.49 kN, whereas after encasing, the peak bearing capacity ranged from 130.74 to 136.31 kN, with an average increase of 2.99 times. For the green sandstone samples, the average peak bearing capacity before encasing was 92.79 kN, and after encasing, it ranged from 225.28 to 237.54 kN, with an average increase of 2.50 times. Finally, for the white sandstone samples, the average peak bearing capacity before encasing was 118.03 kN, and after encasing, it ranged from 252.30 to 294.59 kN, with an average increase of 2.32 times. The lower the initial strength of a rock sample was, the greater the increase in peak bearing capacity after encasing, indicating a better reinforcement effect.
Table 3. Test results for rock samples with different strengths.
Rock SampleRock Type f 0 (kN) ε 0 f b (kN) ε b f b / f 0 ε b / ε 0
H-1red sandstone44.490.0107136.310.01353.062.991.261.32
H-2red sandstone44.490.0107132.410.01472.981.37
H-3red sandstone44.490.0107130.740.01412.941.32
Q-1green sandstone92.790.0145225.280.02002.432.501.381.18
Q-2green sandstone92.790.0145234.180.01552.521.07
Q-3green sandstone92.790.0145237.540.01592.561.10
B-1white sandstone118.030.0151252.300.01602.142.321.061.18
B-2white sandstone118.030.0151272.120.02142.311.42
B-3white sandstone118.030.0151294.590.01592.501.05

3.3. Uniaxial Compression Tests on Samples with Different Encasing Materials

To investigate the influence of encasing materials on the reinforcement effect, encasing and reinforcement tests were conducted using three different encasing materials: M5 mortar, M10 mortar, and M10 steel wire-reinforced mortar. The rock samples used were red sandstone with dimensions of 100 mm in height and 50 mm in diameter. The encasing thickness was 25 mm, resulting in a specimen diameter of 100 mm after encasing. Specimens 1-1, 1-2, and 1-3 are the red sandstone rock samples before encapsulation, while specimens H-4, H-5, and H-6 are the counterparts after encased by M5 mortar, specimens H-1, H-2, and H-3 are the counterparts after encased by M10 mortar, specimens H-7, H-8, and H-9 are the counterparts after encased by M10 steel wire-reinforced mortar. A photograph of the encased samples is shown in Figure 8.
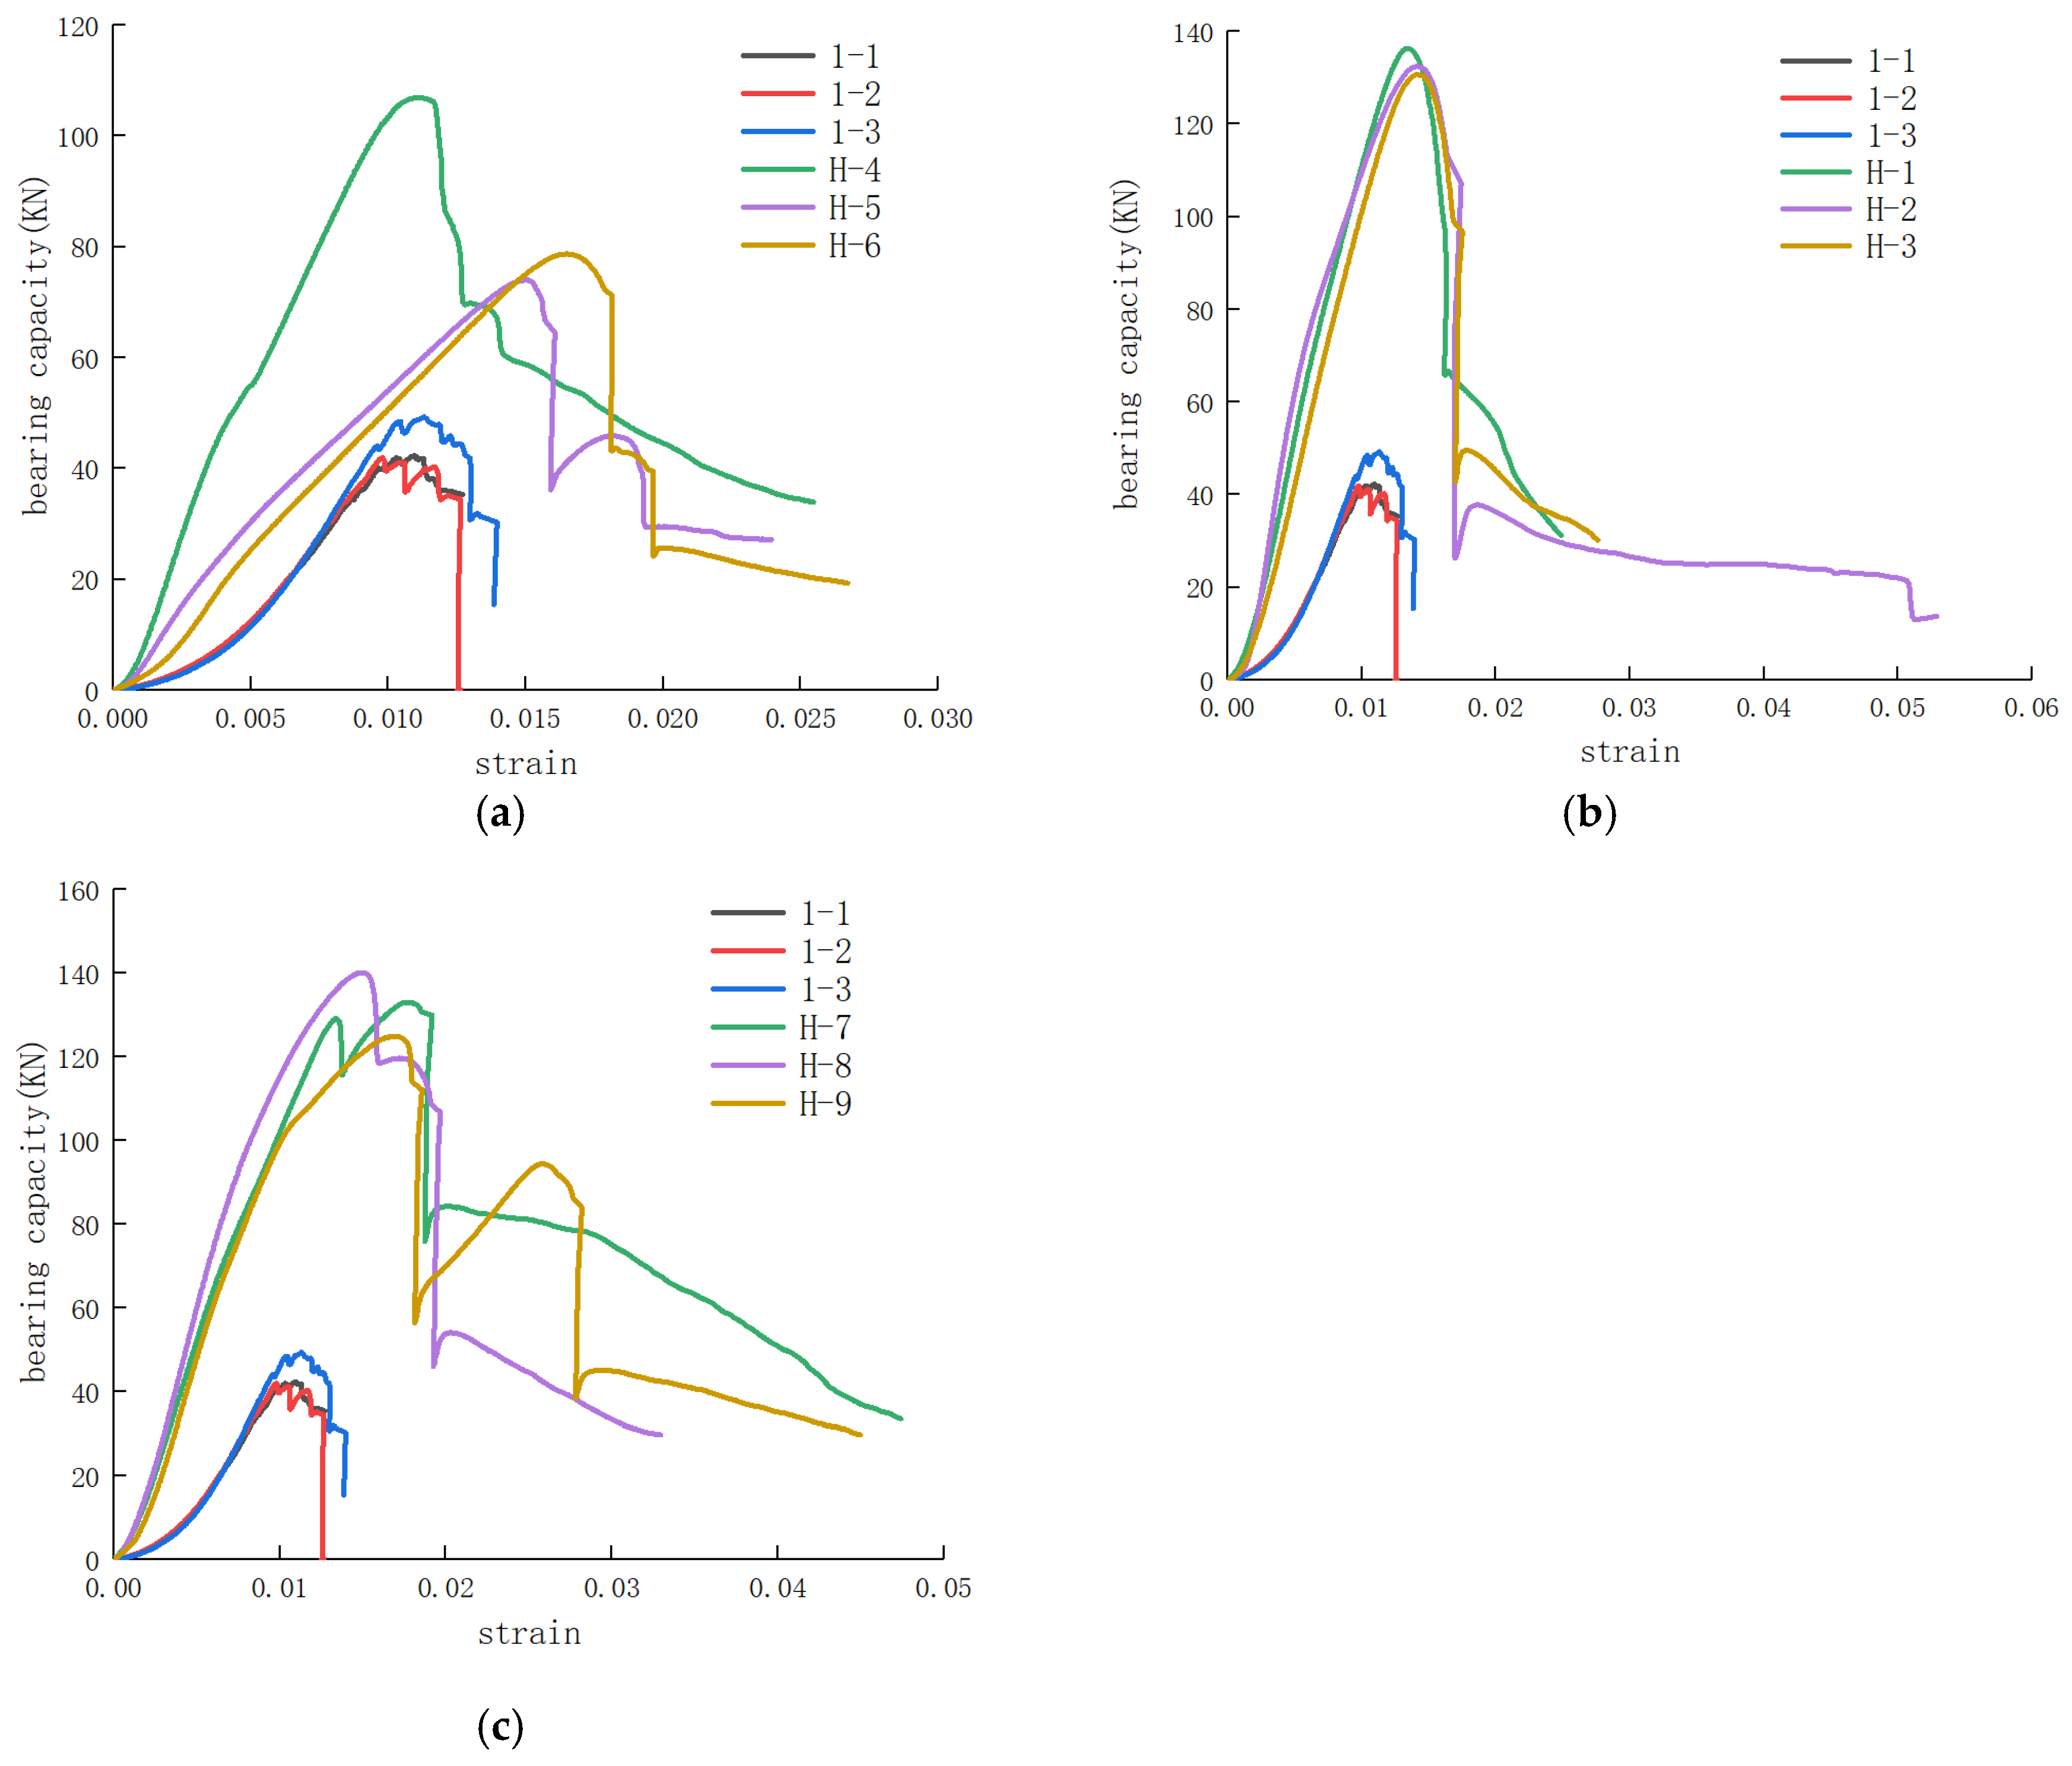
The test results before and after encasing the samples with different encasing materials are presented in Table 4 and Figure 9. The average peak bearing capacity increased by 1.94 times after encasing with M5 mortar, by 2.99 times after encasing with M10 mortar, and by 2.98 times after encasing with M10 steel wire-reinforced mortar. Comparing M10 mortar with M5 mortar, as the strength of the encasing material increased, the multiplication factor of the sample peak bearing capacity increased from 1.94 to 2.98, indicating a significant improvement in peak bearing capacity. Comparing M10 steel wire-reinforced mortar with M10 mortar, the multiplication factor of the sample peak bearing capacity was almost the same. However, the strain of the samples encased with steel wire-reinforced mortar was significantly greater than that of the samples encased with nonreinforced mortar, suggesting that reinforcement enables the samples to withstand greater deformation. Additionally, the samples encased with M10 steel wire-reinforced mortar exhibited significant residual strength after reaching their peak bearing capacity.
Table 4. Test results for rock samples with different encasing materials.
Rock SampleEncasing Material f 0 (KN) ε 0 f b (KN) ε b f b / f 0 ε b / ε 0
H-4M5 mortar44.490.0107106.870.01112.401.941.041.33
H-5M5 mortar44.490.010774.000.01491.661.39
H-6M5 mortar44.490.010778.710.01661.771.55
H-1M10 mortar44.490.0107136.310.01353.062.991.261.32
H-2M10 mortar44.490.0107132.410.01472.981.37
H-3M10 mortar44.490.0107130.740.01412.941.32
H-7M10 reinforced mortar44.490.0107133.020.01772.992.981.651.54
H-8M10 reinforced mortar44.490.0107140.070.01503.151.40
H-9M10 reinforced mortar44.490.0107124.890.01682.811.57

3.4. Uniaxial Compression Tests on Samples with Different Encasing Thicknesses

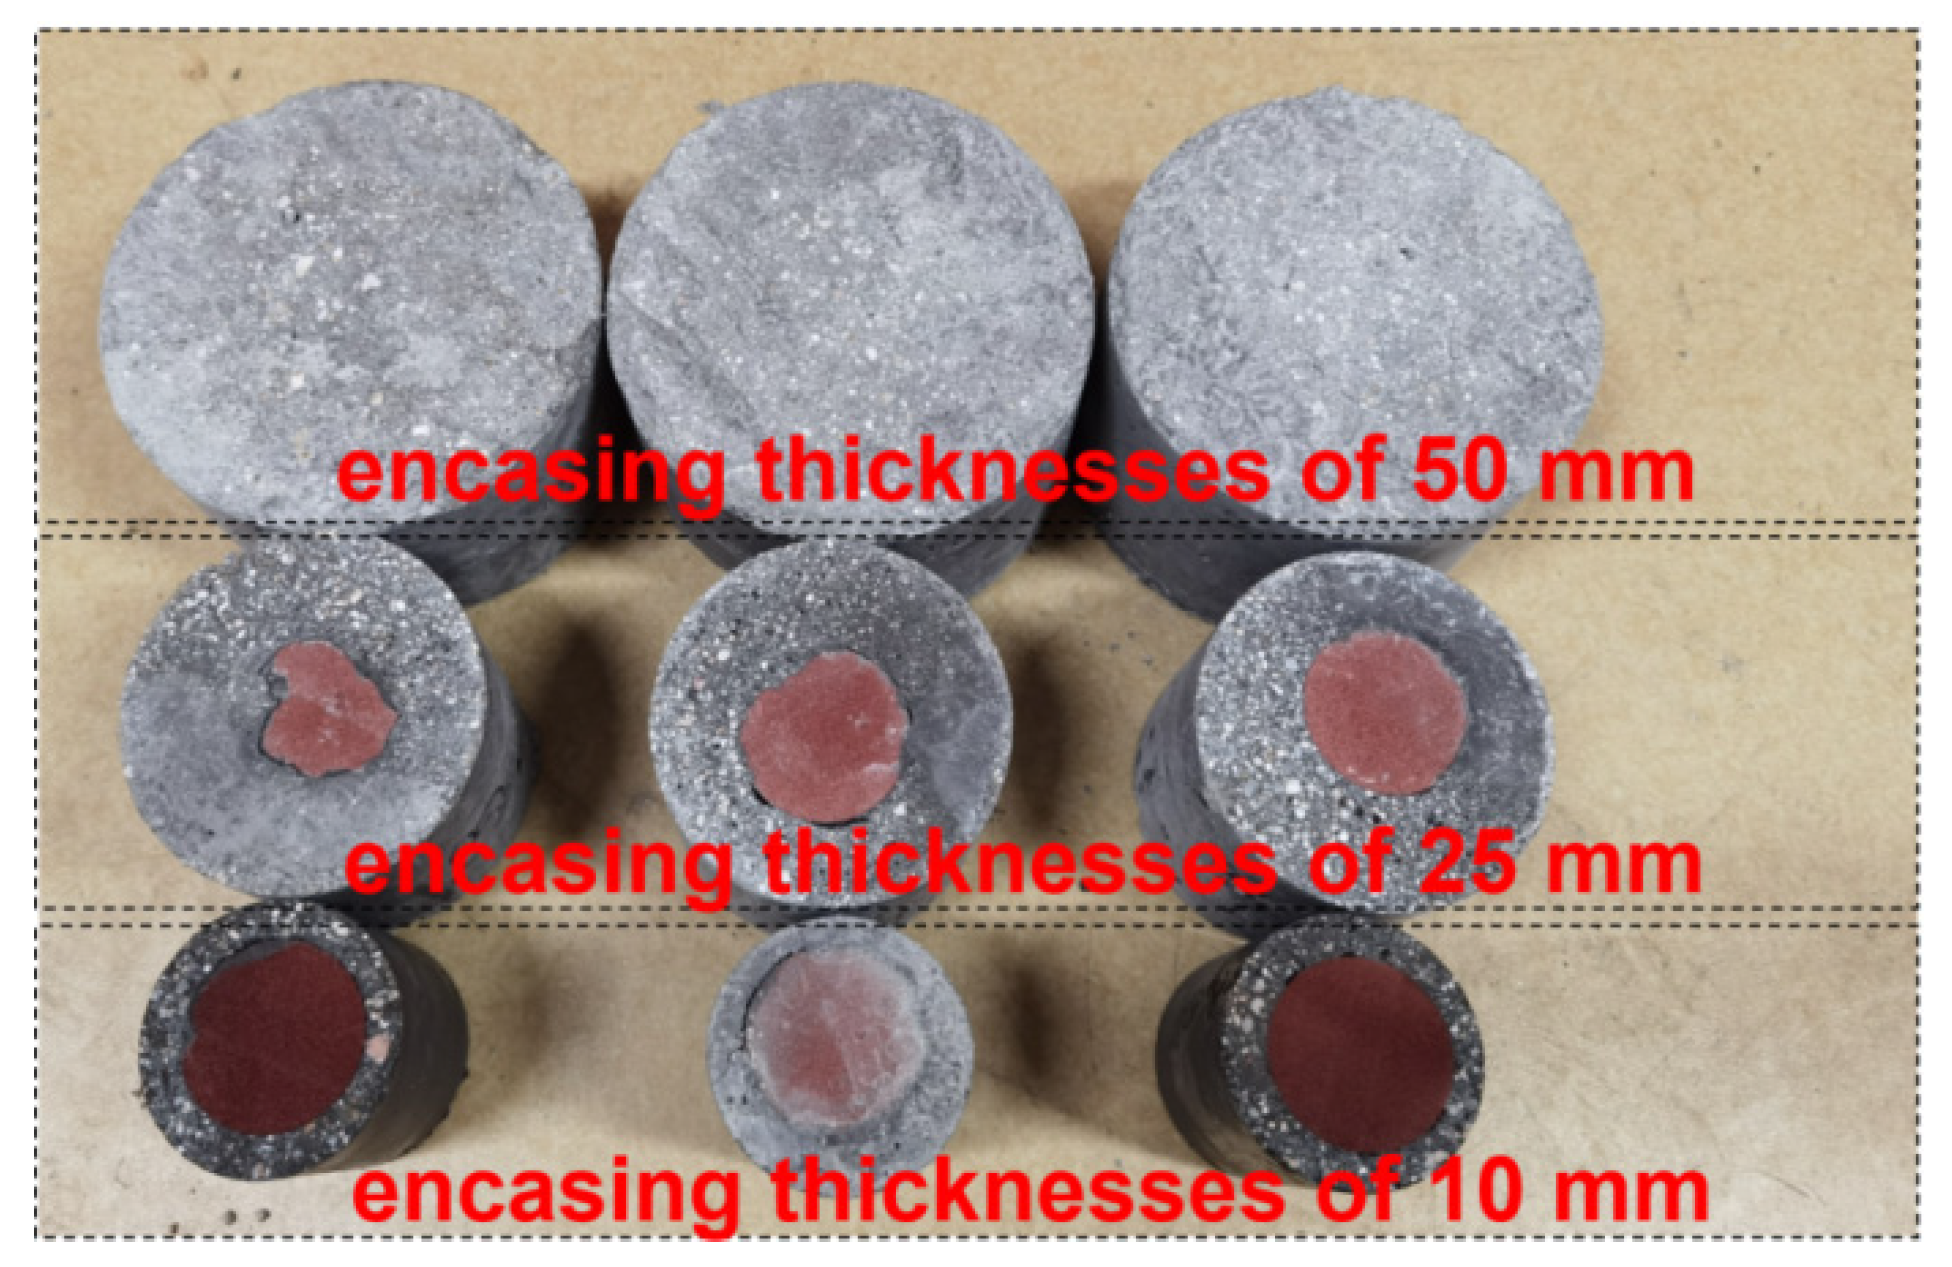
To investigate the influence of the encasing layer thickness on the reinforcement effect, encasing and reinforcement tests were conducted using M10 mortar with encasing thicknesses of 10 mm, 25 mm, and 50 mm. The rock samples used were red sandstone with dimensions of 100 mm in height and 50 mm in diameter. After encasing, the diameters of the samples were 70 mm, 100 mm, and 150 mm. Specimens 1-1, 1-2, and 1-3 are the red sandstone rock samples before encapsulation, while specimens H-10, H-11, and H-12 are the counterparts after encased by M10 mortar with encasing thicknesses of 10 mm, specimens H-1, H-2, and H-3 are the counterparts after encased by M10 mortar with encasing thicknesses of 25 mm, specimens H-19, H-20, and H-21 are the counterparts after encased by M10 mortar with encasing thicknesses of 50 mm. A photograph of the encased samples is shown in Figure 10.
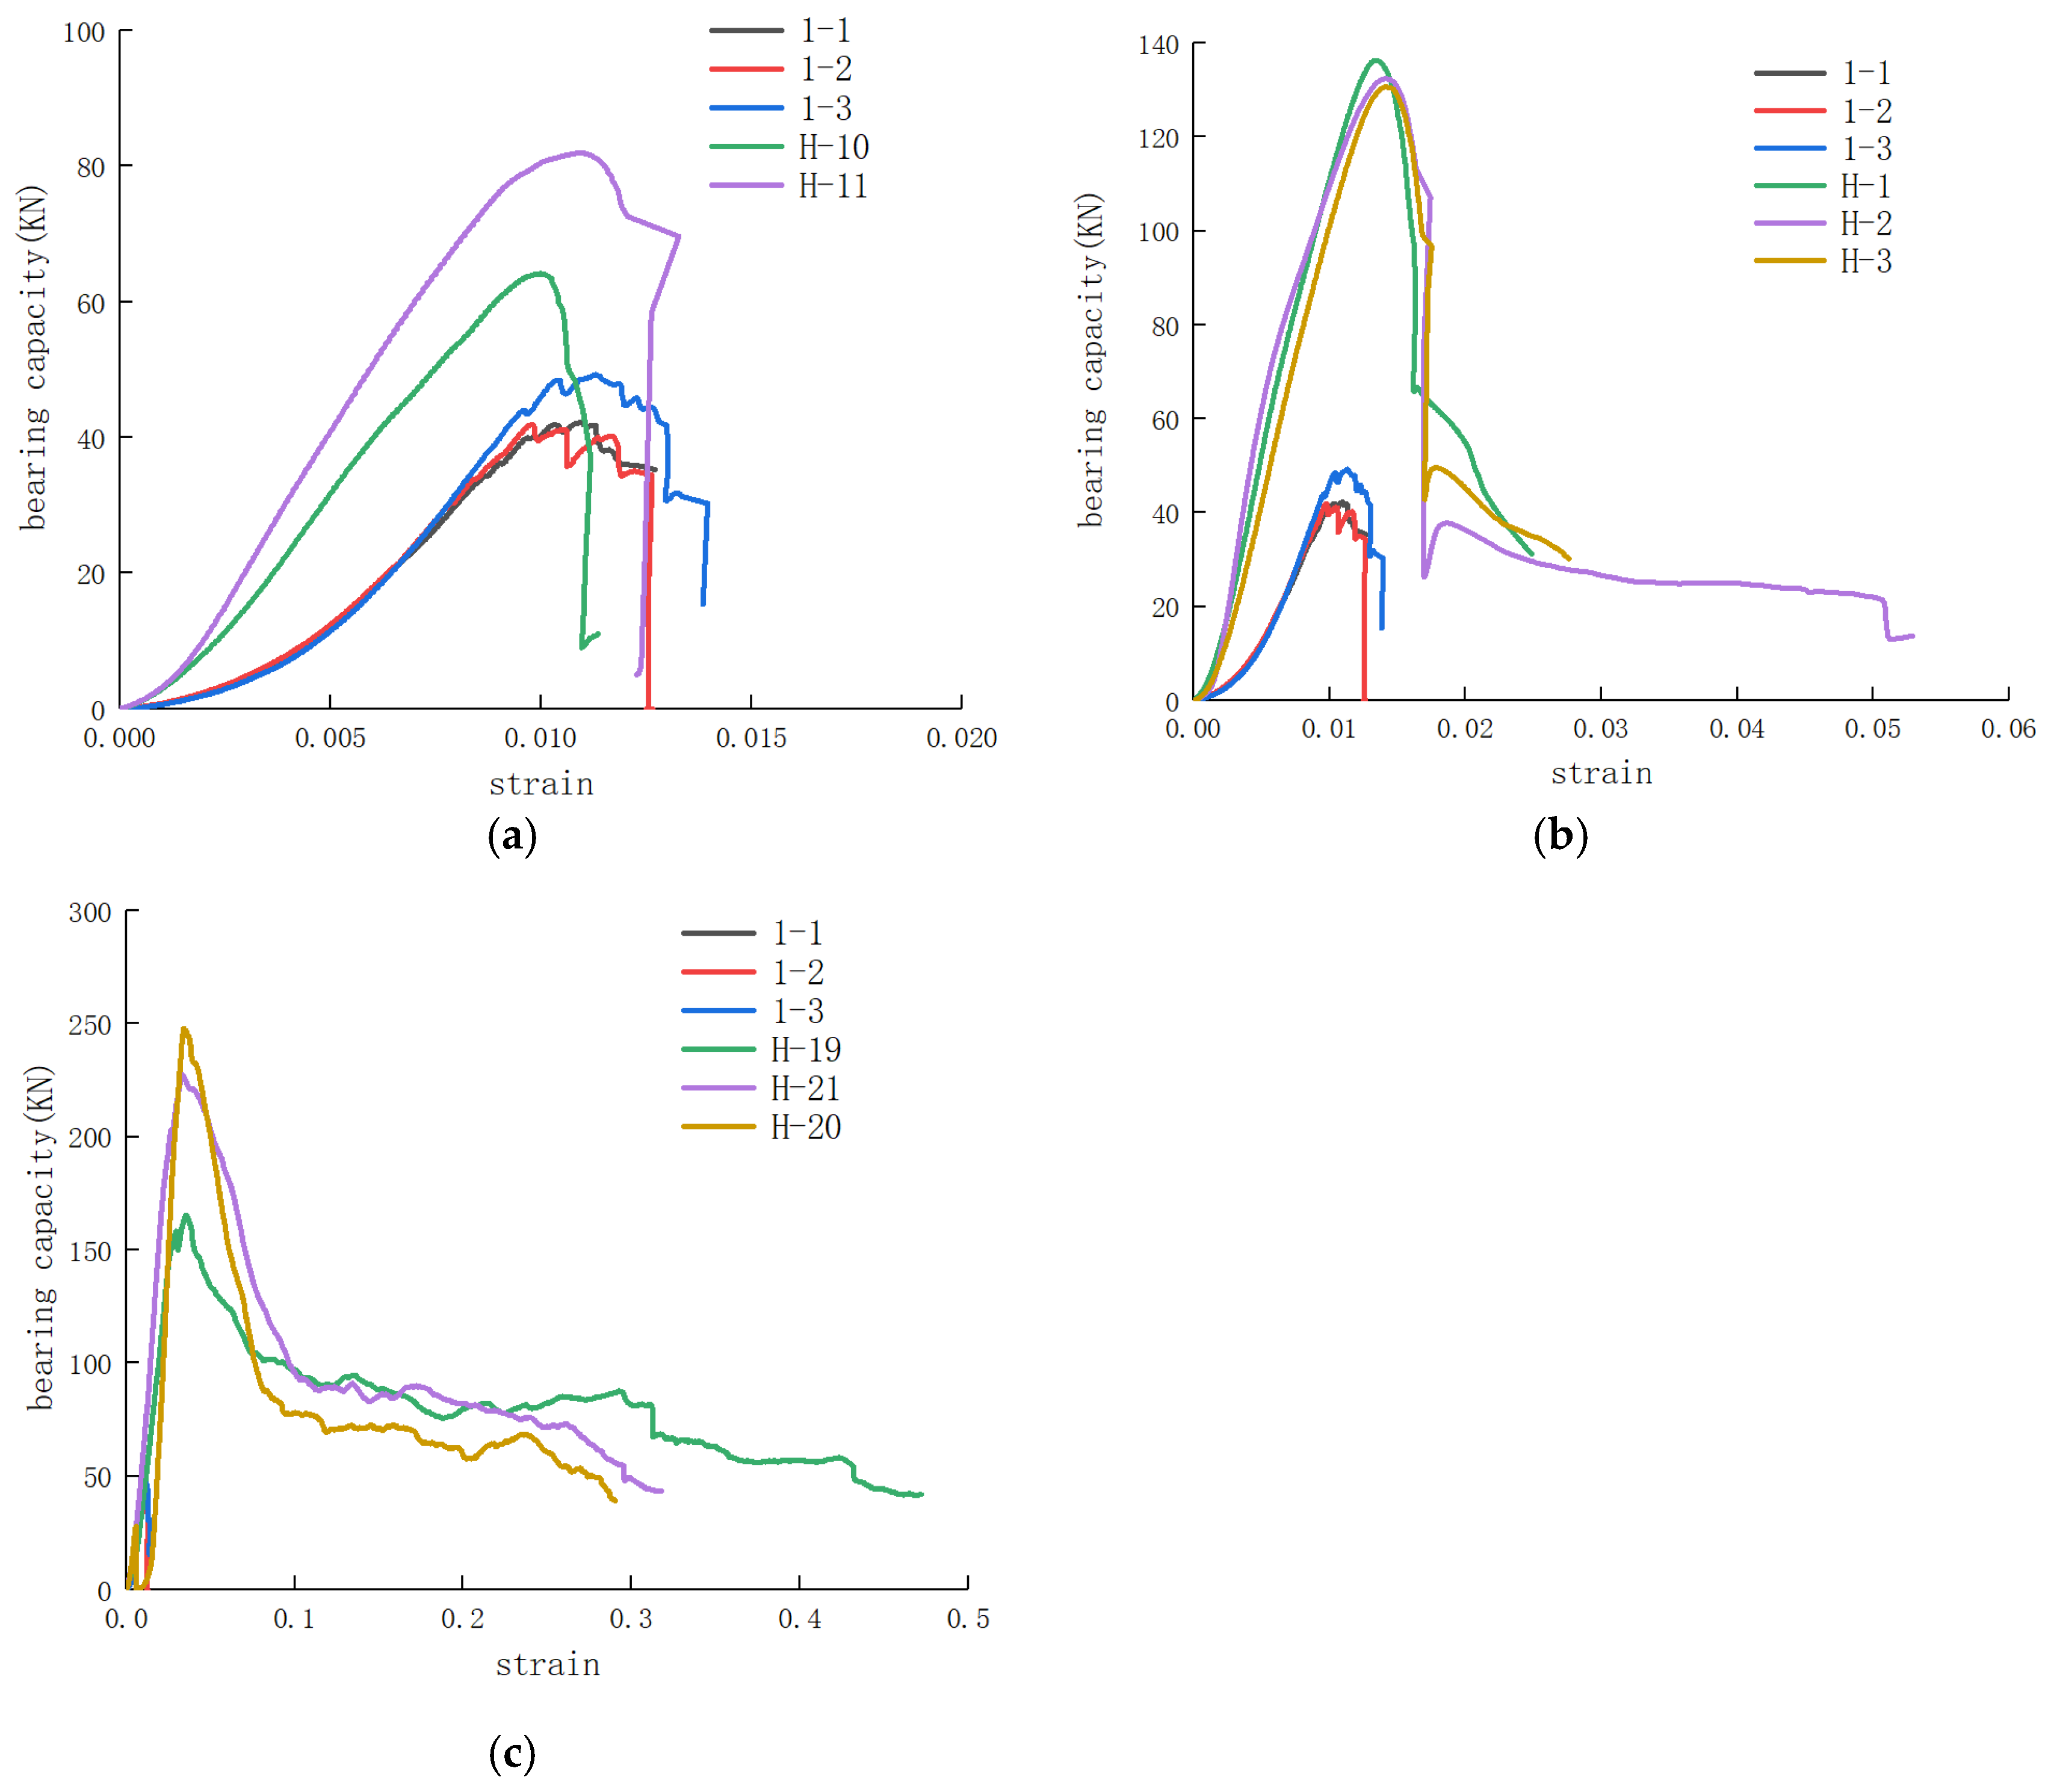
The test results before and after encasing for the samples with different encasing thicknesses were presented in Table 5 and Figure 11. For the samples with an encasing thickness of 10 mm, the average peak bearing capacity increased by 1.67 times, and the axial peak strain increased by 1.02 times after encasing. For the samples with an encasing thickness of 25 mm, the average peak bearing capacity increased by 2.99 times, and the axial peak strain increased by 1.32 times after encasing. For the samples with an encasing thickness of 50 mm, the average peak bearing capacity increased by 5.31 times, and the axial peak strain increased by 3.27 times after encasing.

4. Analysis of the Deformation and Failure Characteristics of the Samples and the Reinforcement Mechanism

4.1. Analysis of the Sample Deformation and Failure Characteristics

4.1.1. Failure Modes of Rock Specimens of Different Sizes

Figure 12 show photographs of unencased and encased red sandstone samples of different sizes under uniaxial compression failure. For samples with diameters and heights of 50 mm × 50 mm and 50 mm × 100 mm, before encasing, the cracks under uniaxial compression were basically shear planes that ran through the samples, resulting in the formation of two large blocks after failure. After being encased with a 25 mm thick M10 mortar, the samples with diameters and heights of 50 mm × 50 mm and 50 mm × 100 mm broke into large blocks, resulting in the formation of large rock blocks and a significant amount of debris after failure. For the samples with diameters and heights of 50 mm × 150 mm and 50 mm × 200 mm, the failure locations were mainly at the ends of the samples, with local longitudinal cracks appearing at the ends, indicating a failure mode of local splitting at the ends. After encasing, the failure of the 50 mm × 150 mm samples basically involved a shear plane running through the samples, resulting in the formation of two rock blocks after failure. The failure mode of the 50 mm × 200 mm samples after encasing was end failure, resulting in the formation of several large blocks, as shown in Table 5.
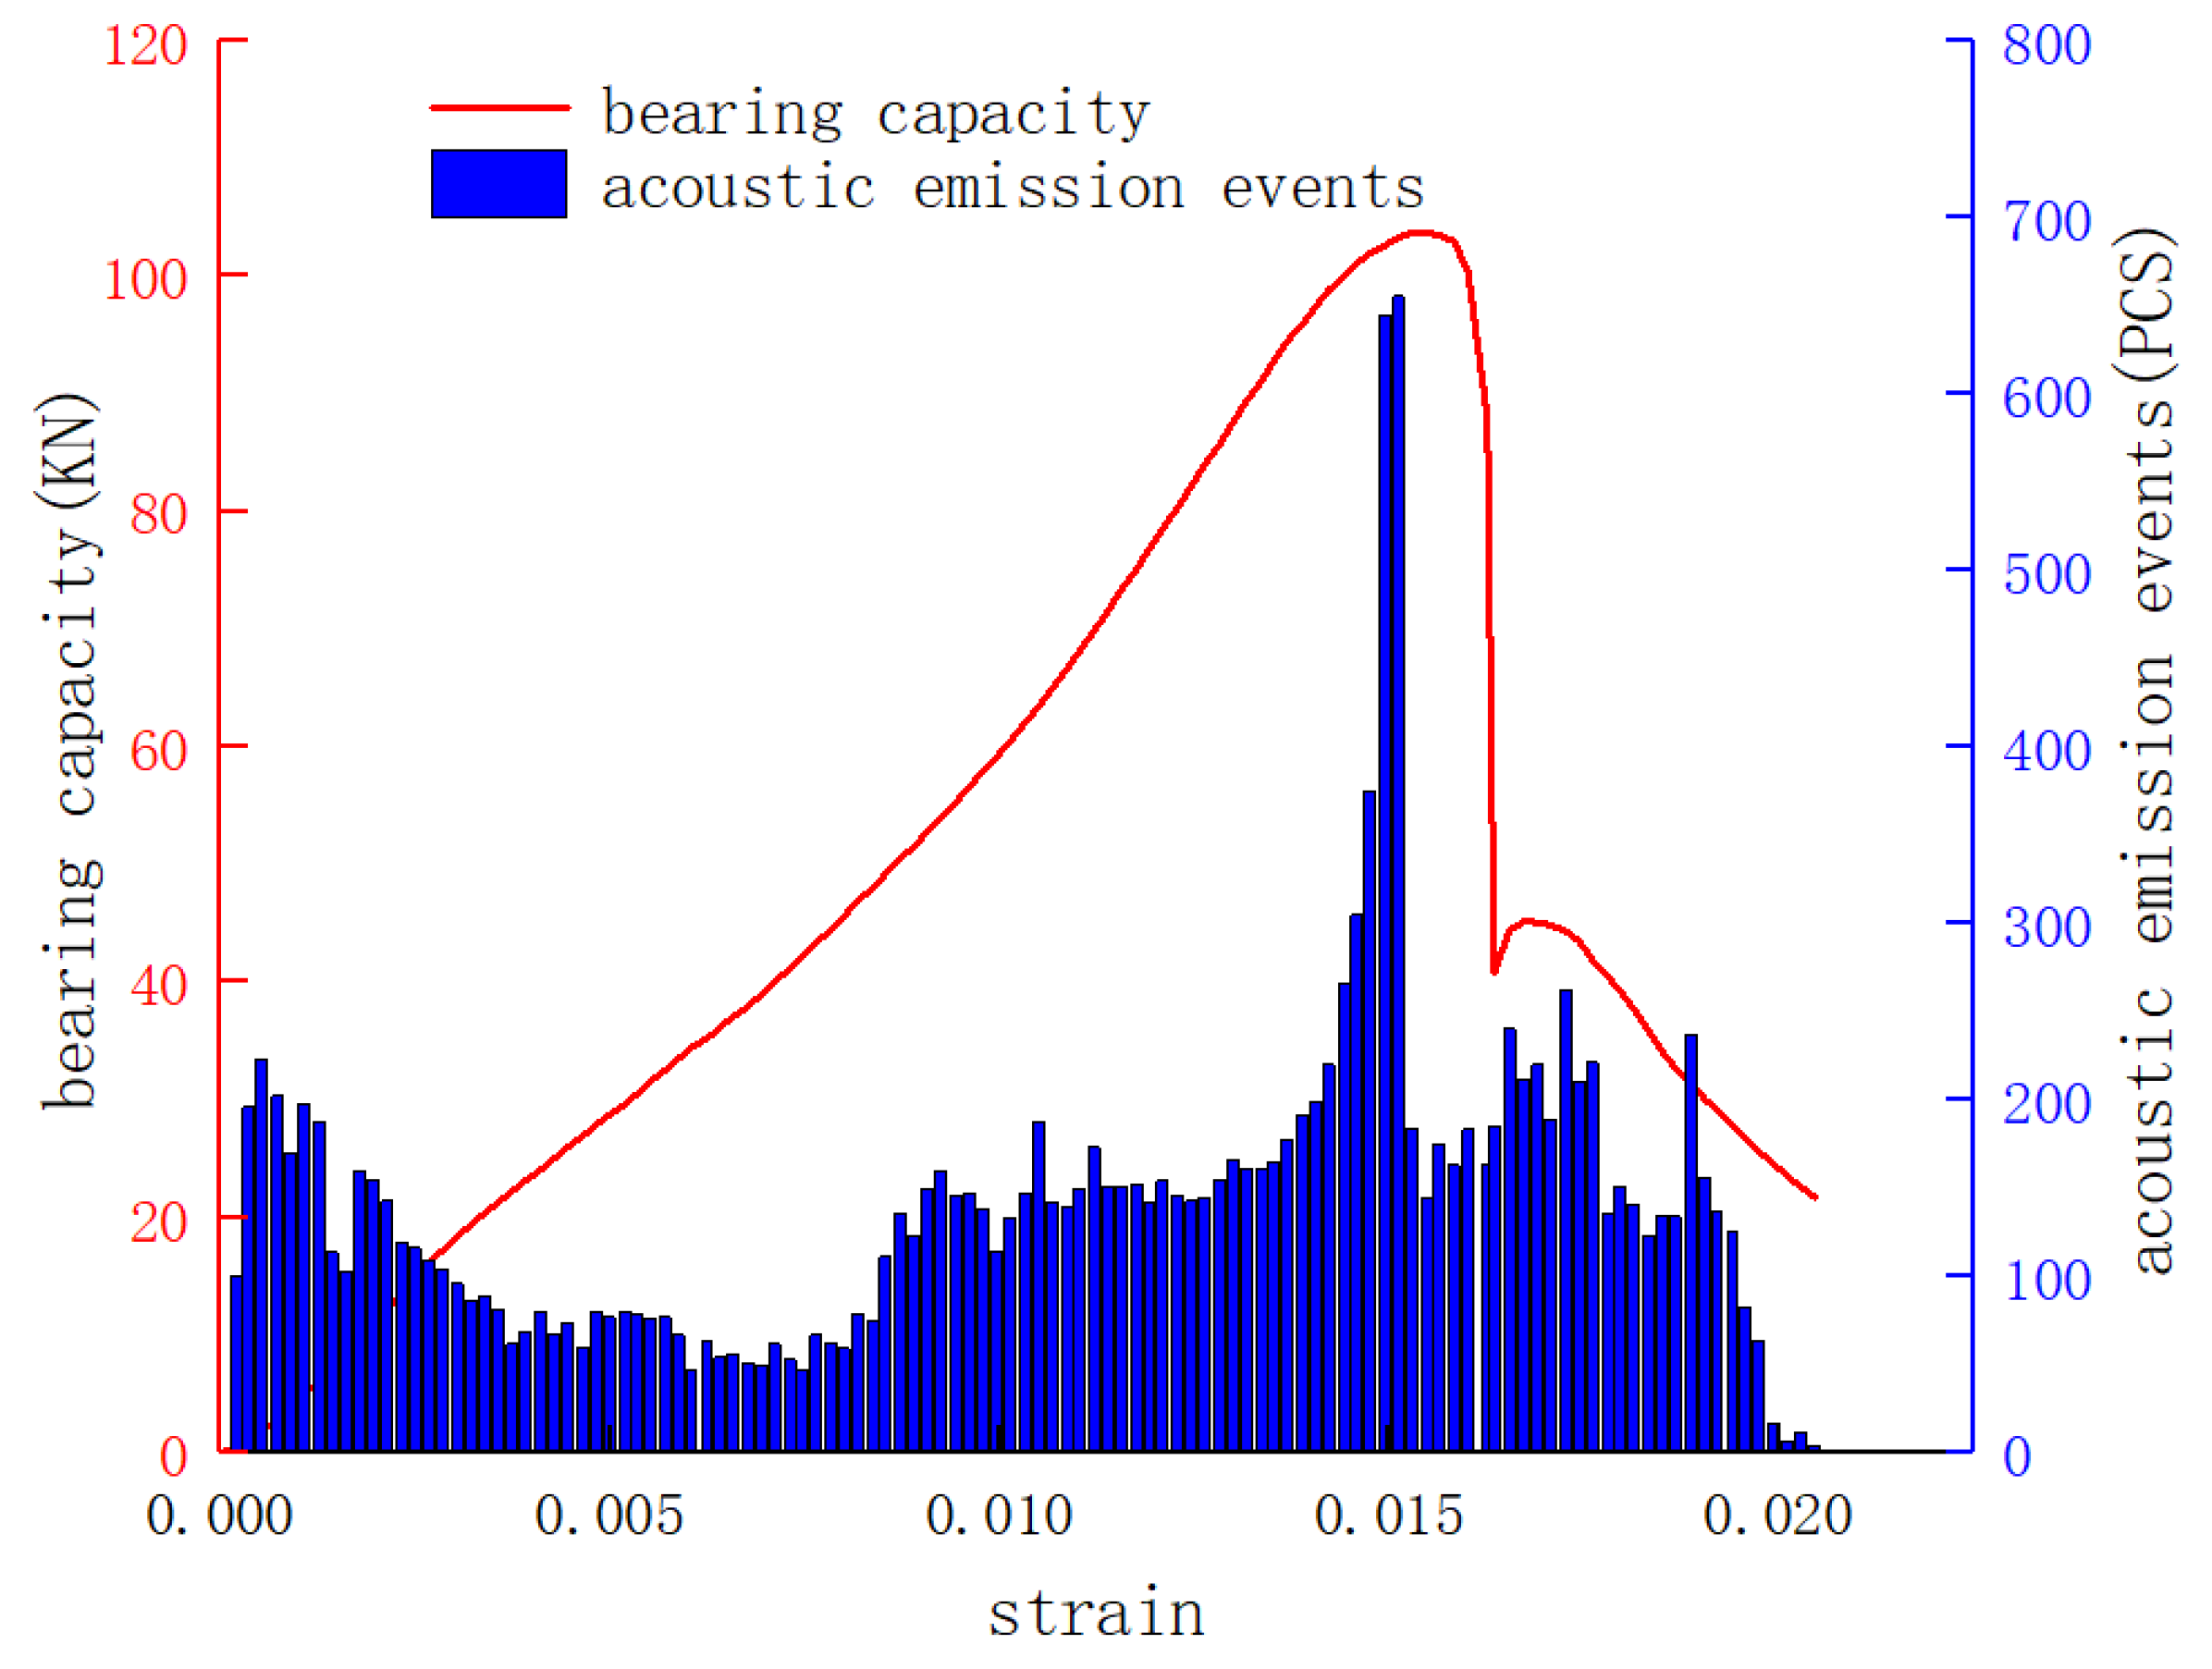
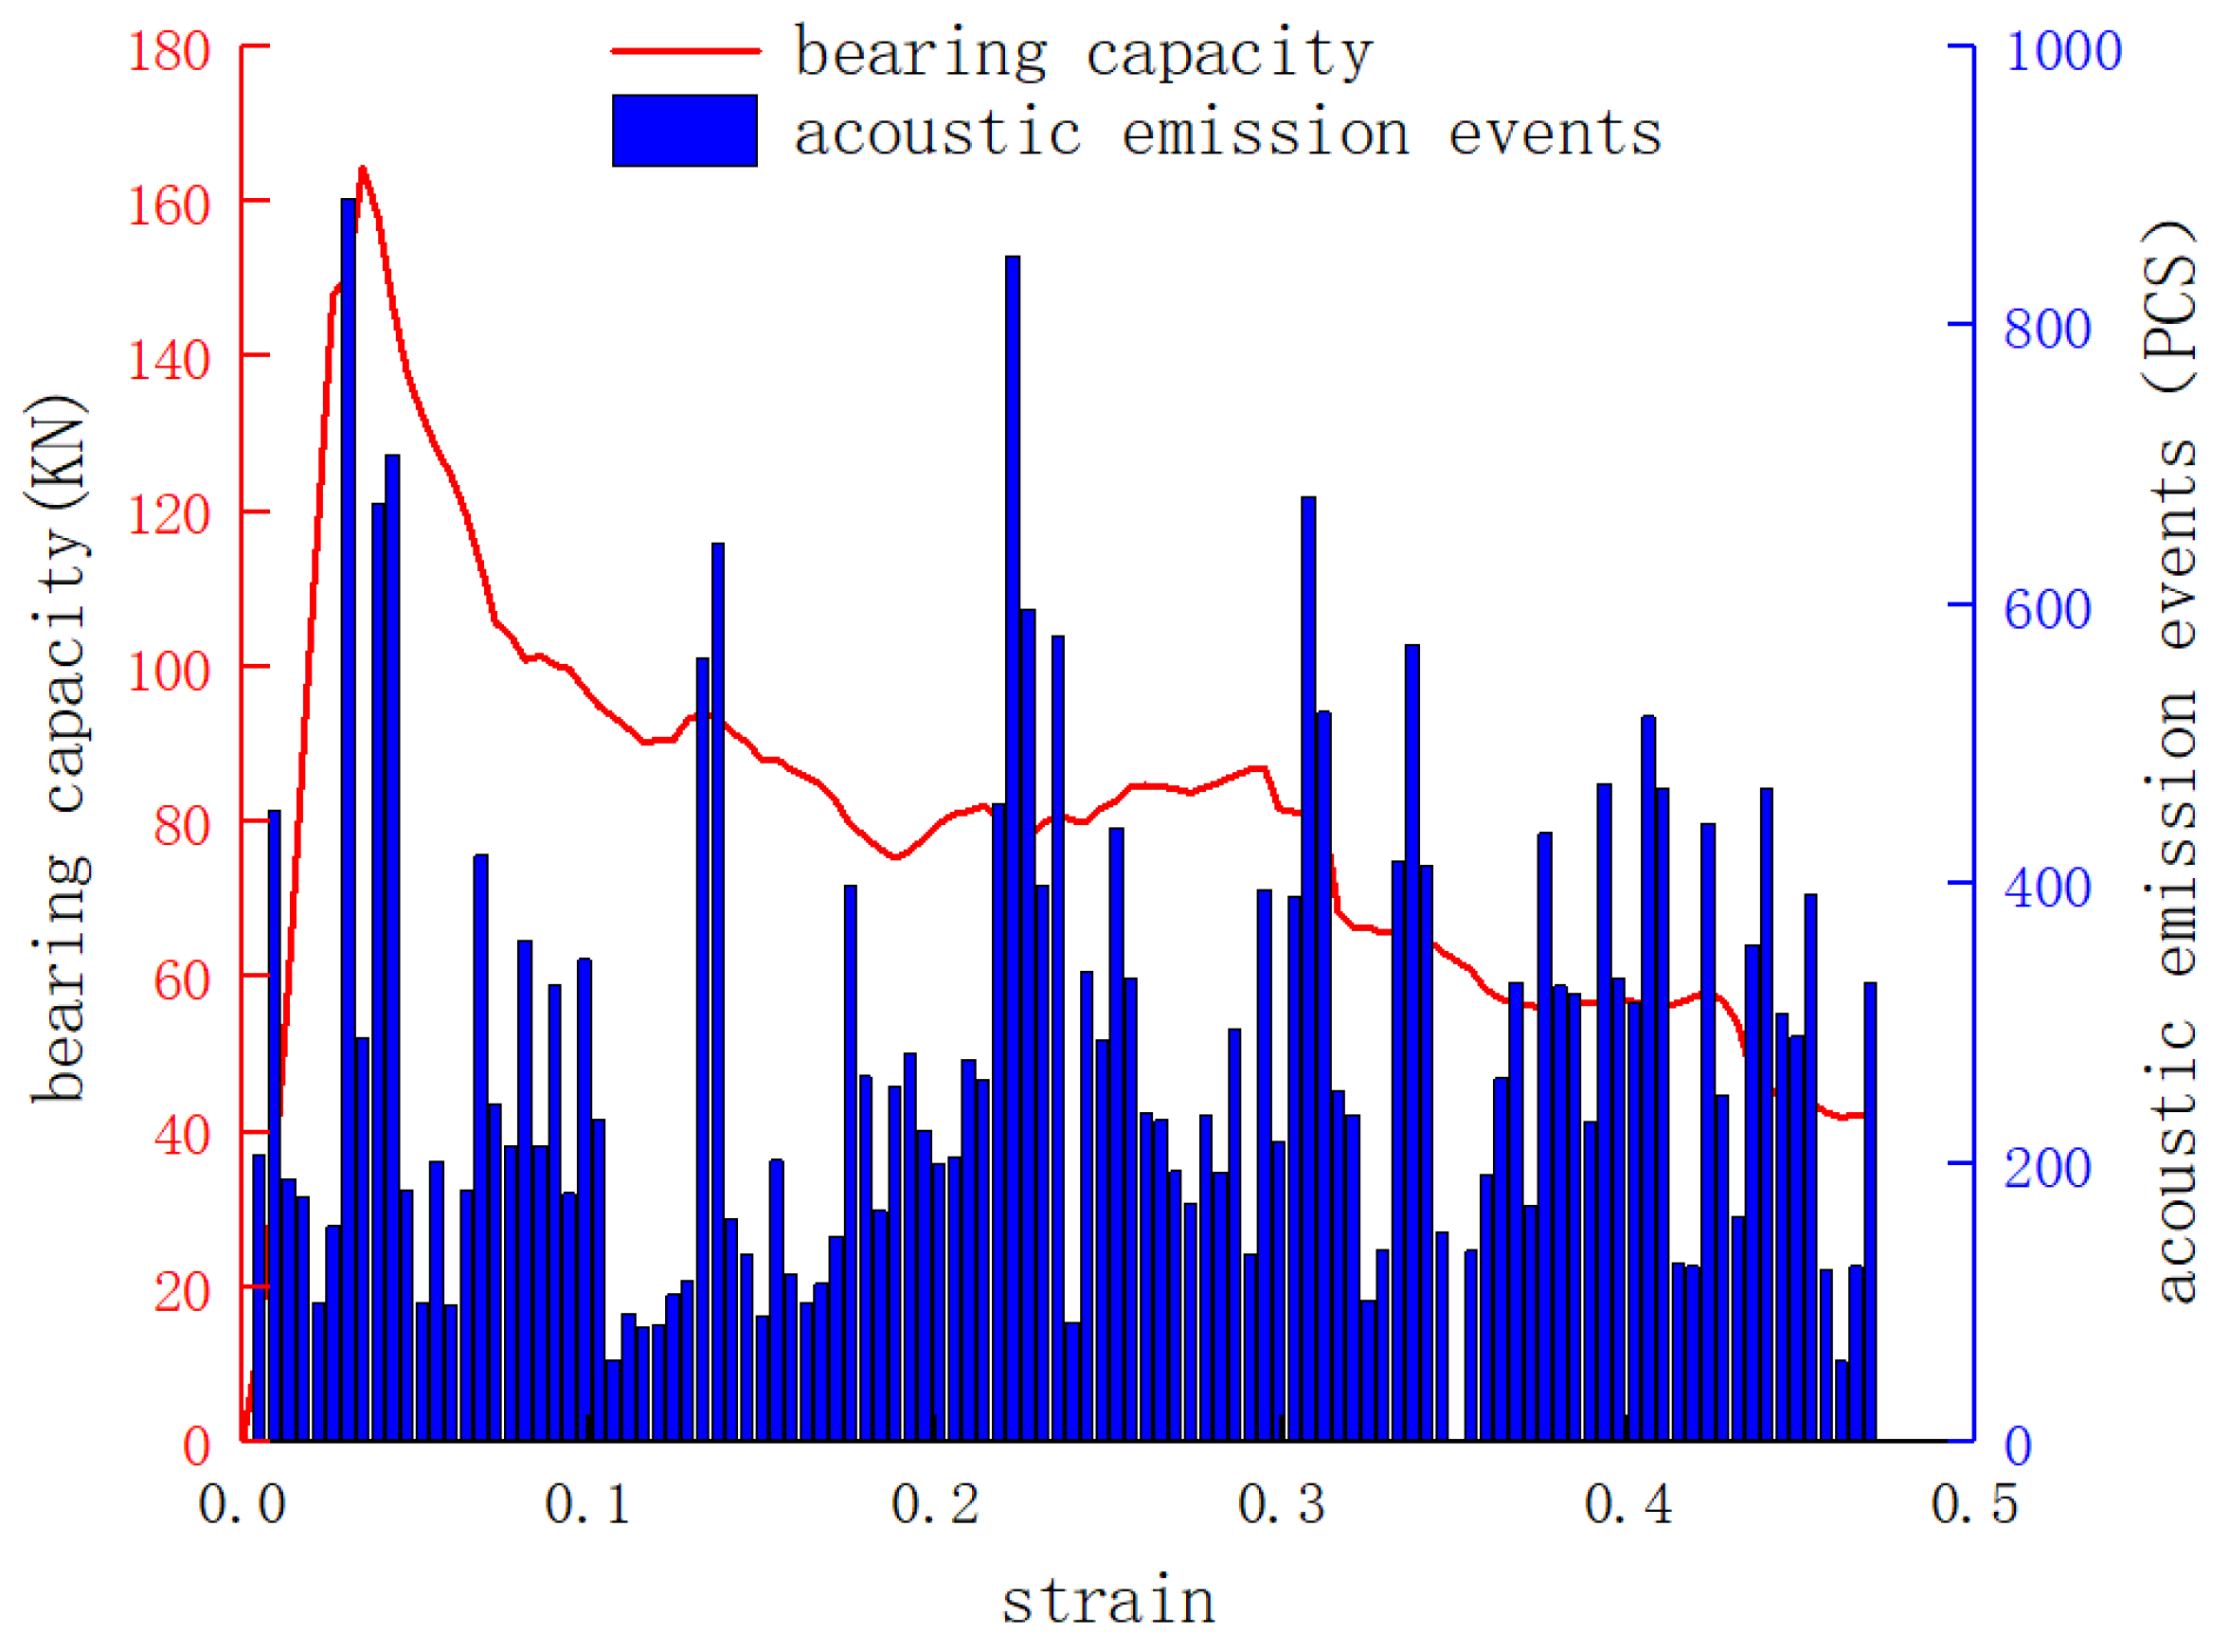
Compared with those before encasing, the failure types of the four types of rock samples of different sizes shifted from overall failure to fragmented failure after encasing. Figure 13 shows the acoustic emission monitoring results for a typical encased sample during failure. There were numerous acoustic emission events throughout the entire failure process, indicating that the encased samples absorbed more external energy and that bearing capacity was significantly improved.

4.1.2. Failure Modes of Rock Specimens with Different Strengths

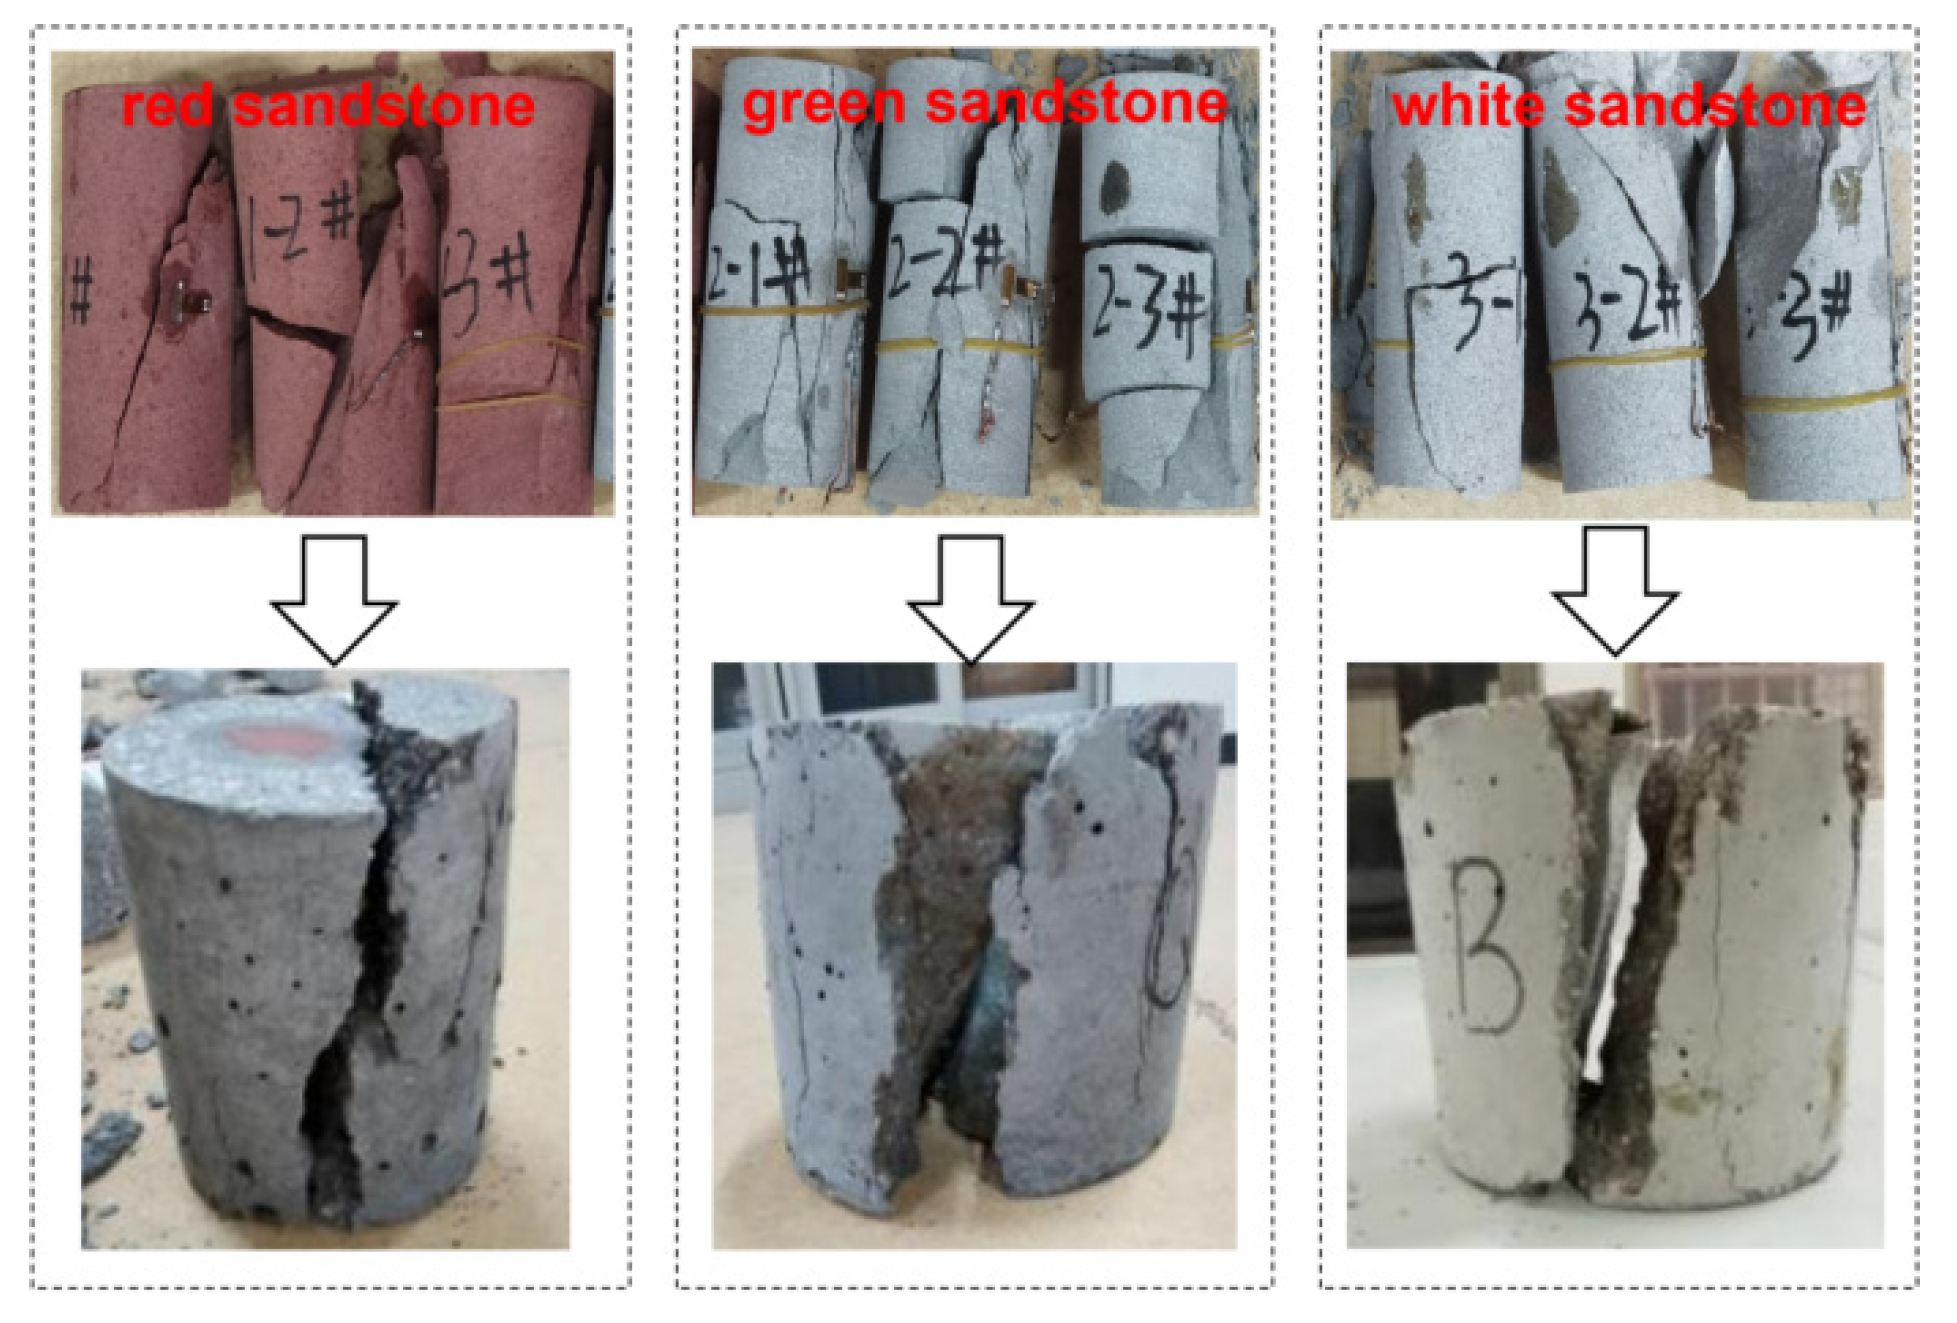
Figure 14 shows a photograph of the uniaxial compression failure of samples of red sandstone, green sandstone, and white sandstone. Before encasing, the failure of the samples was typically due to compression-shear forces, resulting in a single main fracture plane and splitting each sample into two large blocks. After encased with 25 mm thick M10 mortar, the failure was also typically due to compression-shear forces, with no significant change in the failure mode before and after encasing, as shown in Table 5.

4.1.3. Failure Modes of Specimens with Different Encasing Materials

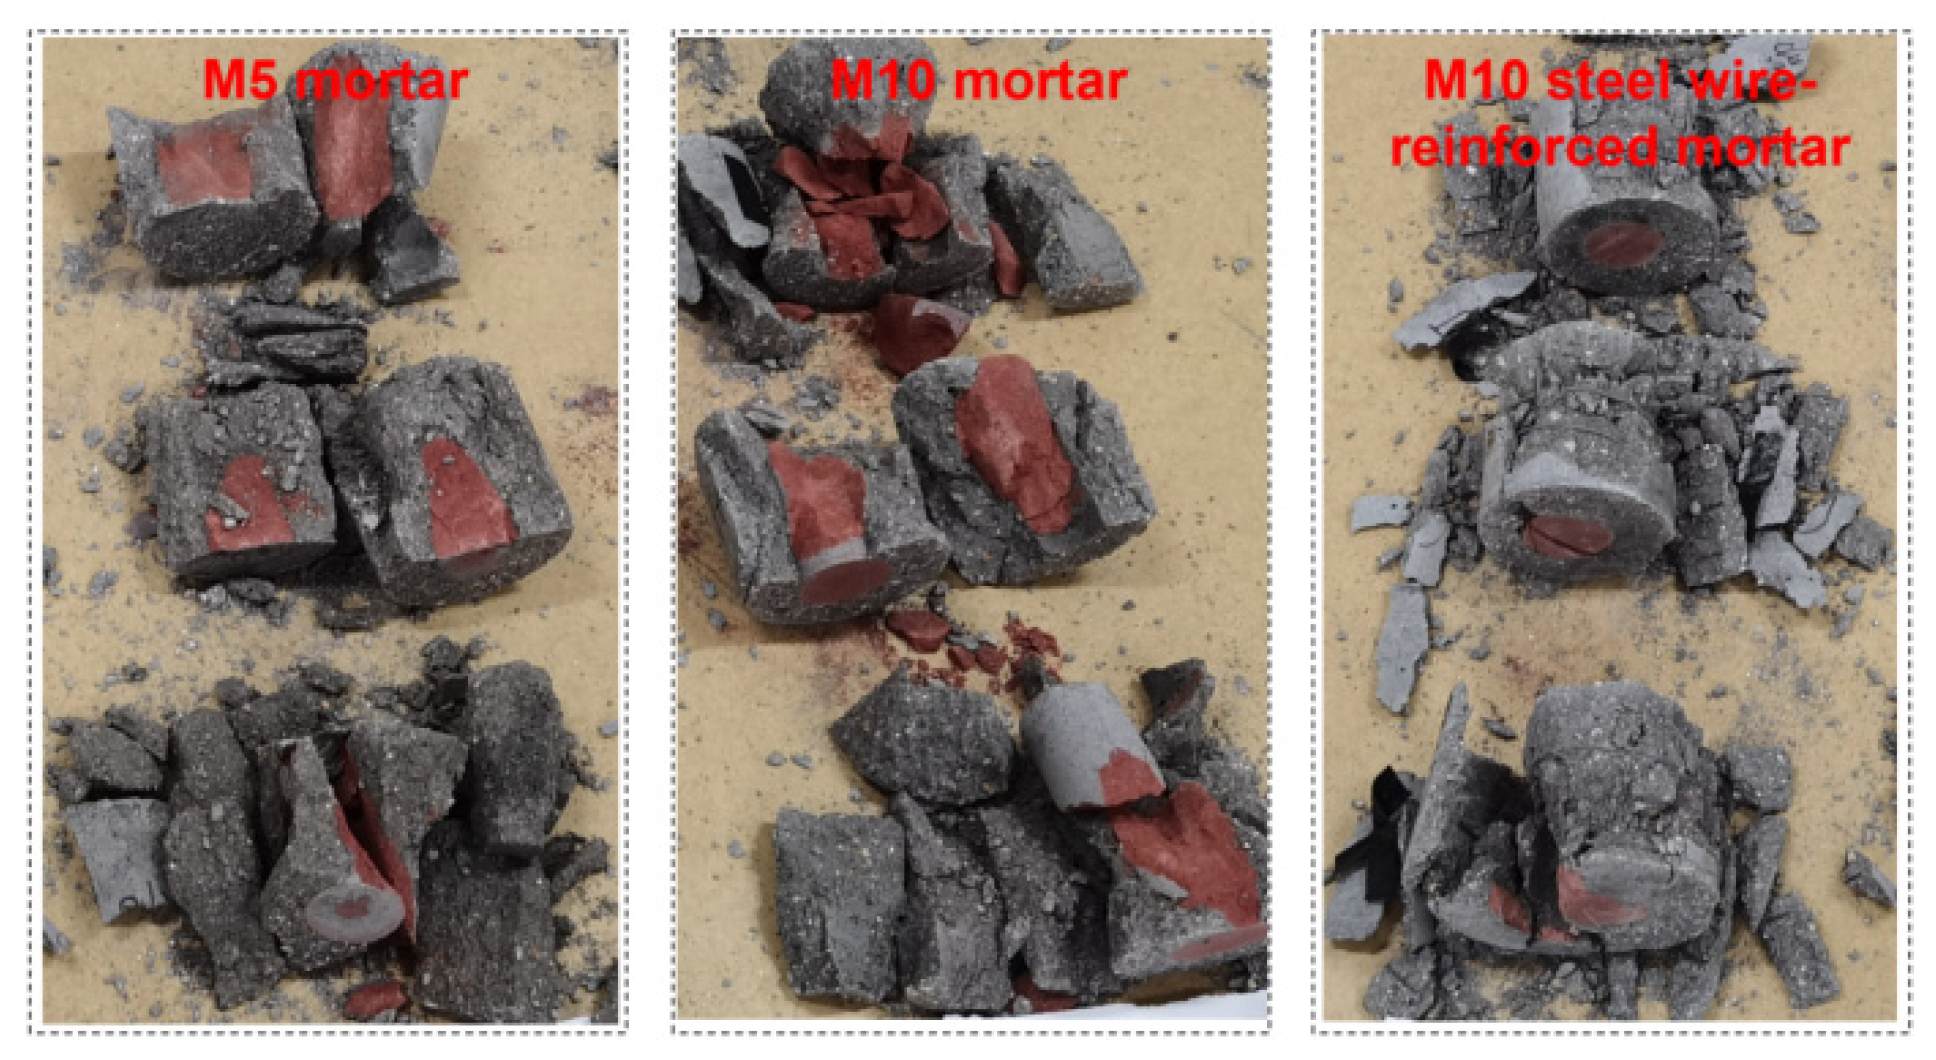
Figure 15 presents photographs of the uniaxial compression failure of standard-sized red sandstone samples encased with 25 mm thick M5 mortar, M10 mortar, and M10 mortar steel wire-reinforced with additional materials. The red sandstone samples encased with M5 mortar and M10 mortar broke into several large rock blocks after failure, with the encased samples being more fragmented after failure. For the samples encased with M10 mortar reinforced with additional materials, the outer layer of the reinforced mortar failed first, whereas the red sandstone remained relatively intact overall after failure, as shown in Table 5.

4.1.4. Failure Modes of Specimens with Different Encasing Thicknesses

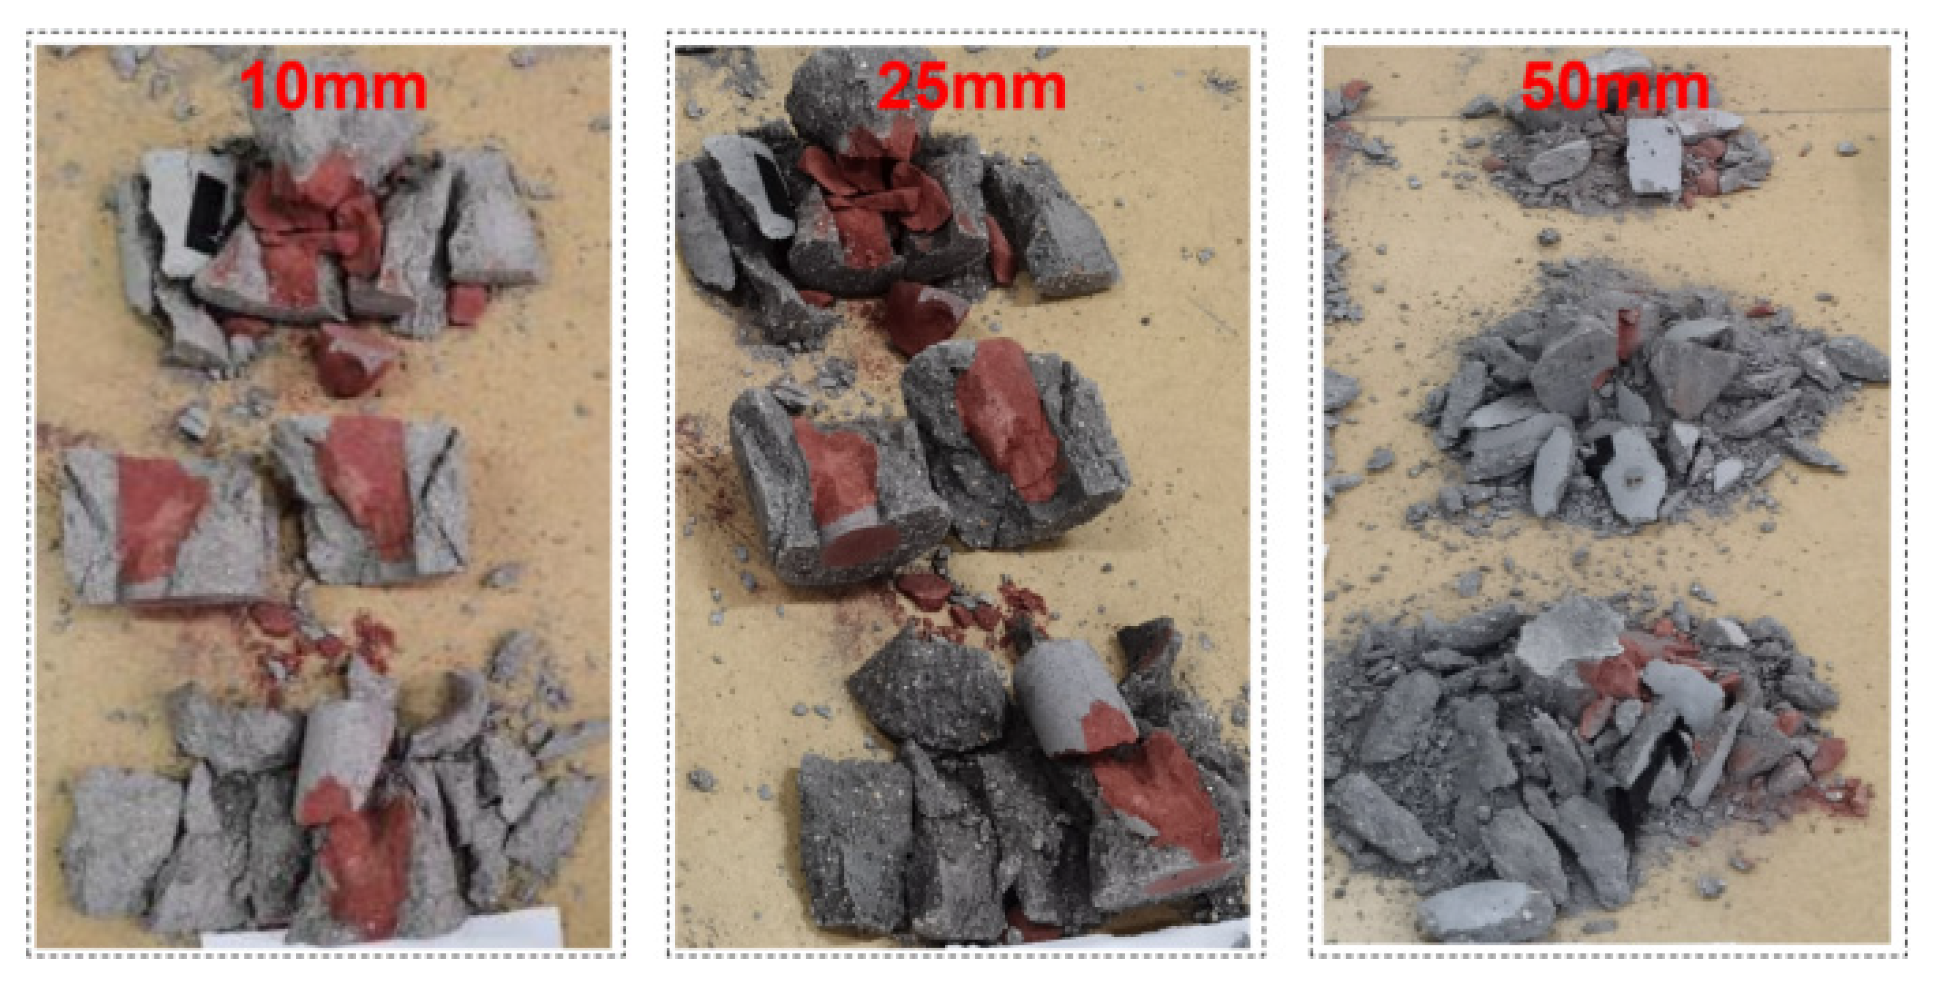
Figure 16 displays photographs of the uniaxial compression failure of standard-sized red sandstone samples encased with 10 mm, 25 mm, and 50 mm thick M10 mortar materials. The red sandstone samples encased with 10 mm and 25 mm thick mortar broke into several large rock blocks after failure. The samples encased with 50 mm thick mortar exhibited plastic failure, resulting in small blocks and a large amount of debris after failure. Figure 17 presents the acoustic emission monitoring results for mortar-encased sample H19, which has the typical encasing thickness of 50 mm, during its failure process. After the sample reached its peak strength, many acoustic emission events still occurred, indicating that the sample experienced plastic deformation and failure after reaching its peak strength. During this process, the sample continued to absorb external energy, resulting in many internal fractures, as shown in Table 6.

4.2. Sensitivity Analysis of Influencing Factors of Reinforcement Effect

From the above experiments, it can be seen that the four factors of sample size, rock strength, wrapping material and wrapping thickness have different degrees of influence on the wrapping reinforcement effect of specimens. The orthogonal range analysis method is used to conduct sensitivity analysis on these four influencing factors, see Table 7. Orthogonal Range analysis is a statistical method based on orthogonal experimental design. It calculates the sensitivity of each factor to the output result through range to quickly identify key influencing factors. The core idea is to quantify the contribution of changes in different factor levels to the results through a small number of experiments with balanced distribution [35,36,37].
The range refers to the maximum difference among the test results of different levels for each factor. Let the number of factors be N, with the index i (i = 1, 2, …, N). Each factor has M levels, with the level index r (r = 1, 2, …, M). For each factor, the same level can only be tested M times. The corresponding value for each factor at its respective level is the peak stress enhancement ratio obtained from the tests. Kr represents the average of the test results for factor i at the same level r, which reflects the effect size of that level of the factor. By comparing the effects of different levels for the same factor, the best and worst levels can be identified, thereby determining the range:
R i = m a x K r m i n K r                       ( i = 1,2 , , N )
Table 8 presents the analysis of the test sensitivity results. As can be seen, the range for the height-to-diameter ratio factor of the rock specimen is 1.92, the range for the rock strength factor is 0.64, the range for the encasing material factor is 1.04, and the range for the encasing thickness factor is 3.64. Thus, the primary and secondary order of factors influencing the encapsulation reinforcement effect of the specimen is as follows: encasing thickness > rock height-to-diameter ratio > encasing material > rock strength.

4.3. Analysis of the Reinforcement Mechanism for the Encased Test Specimens

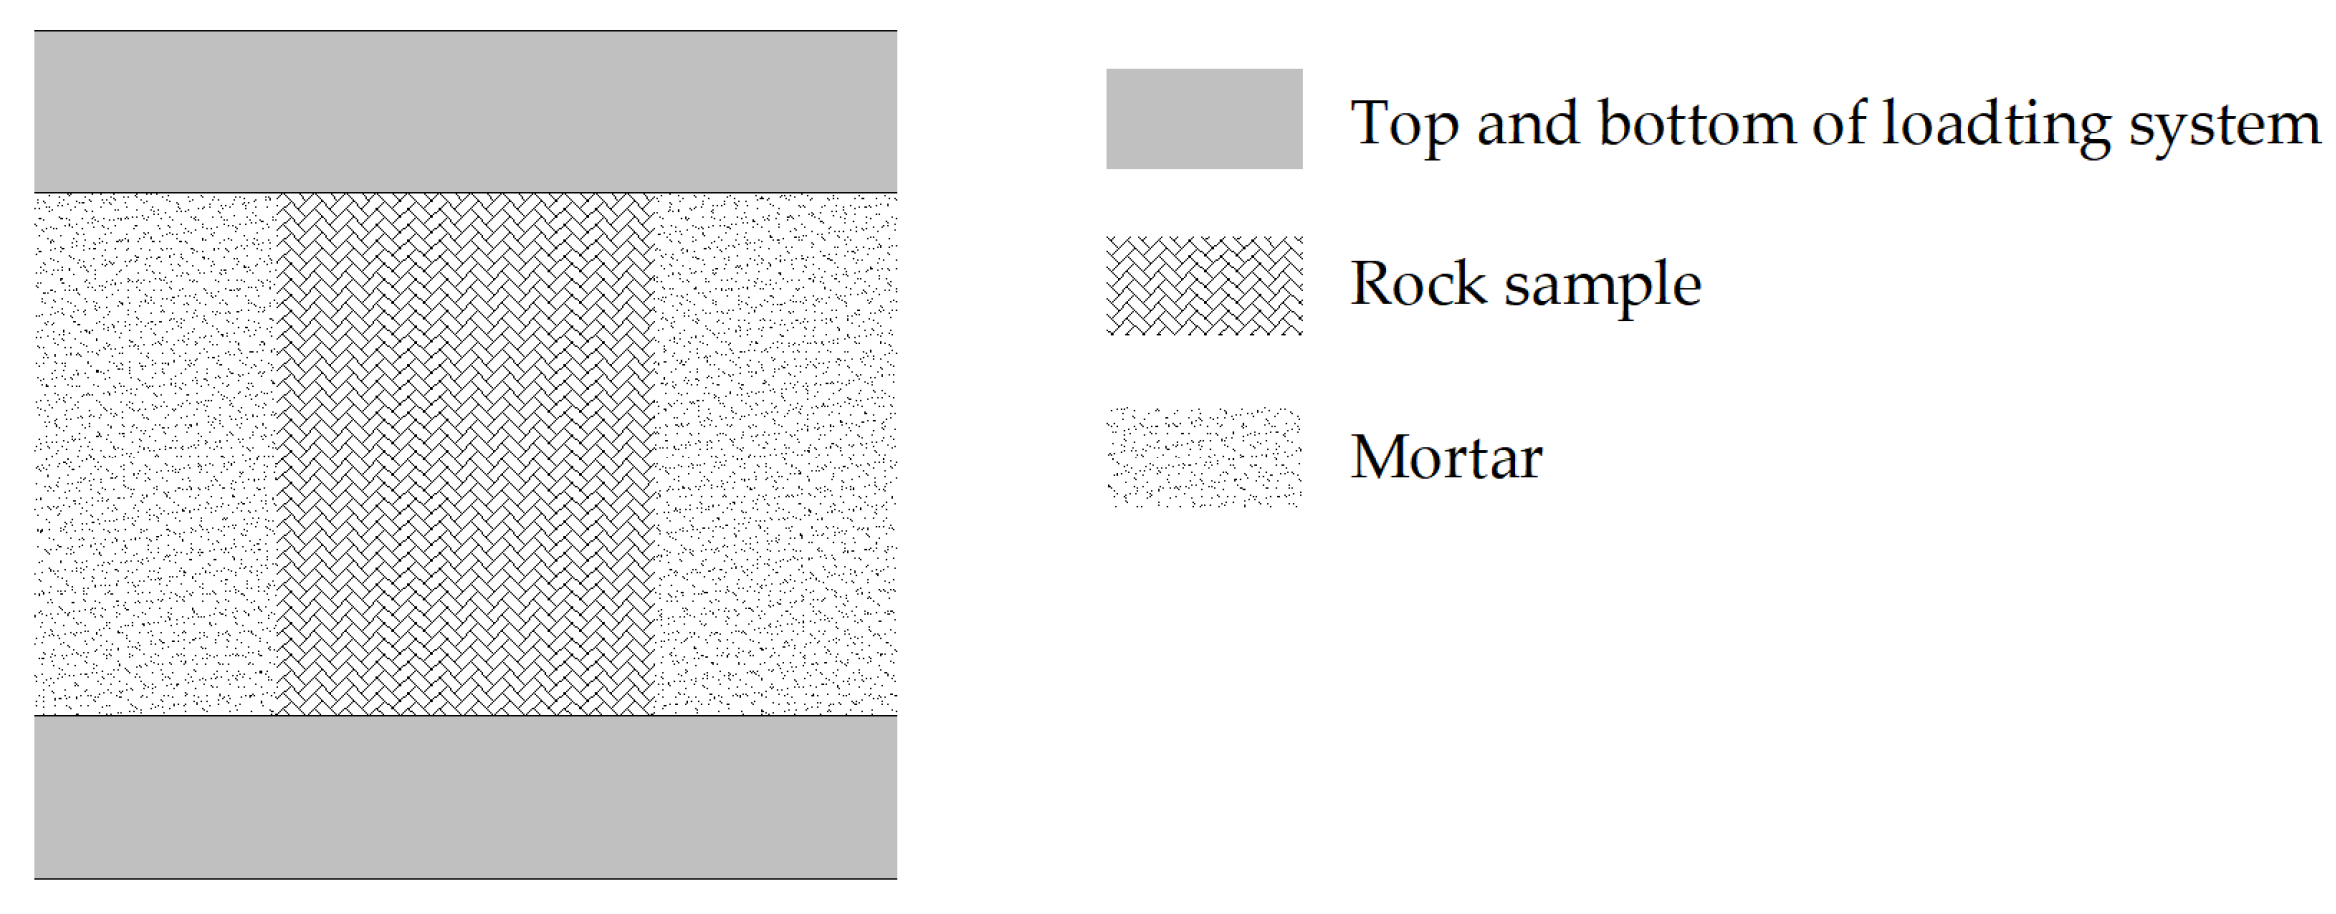
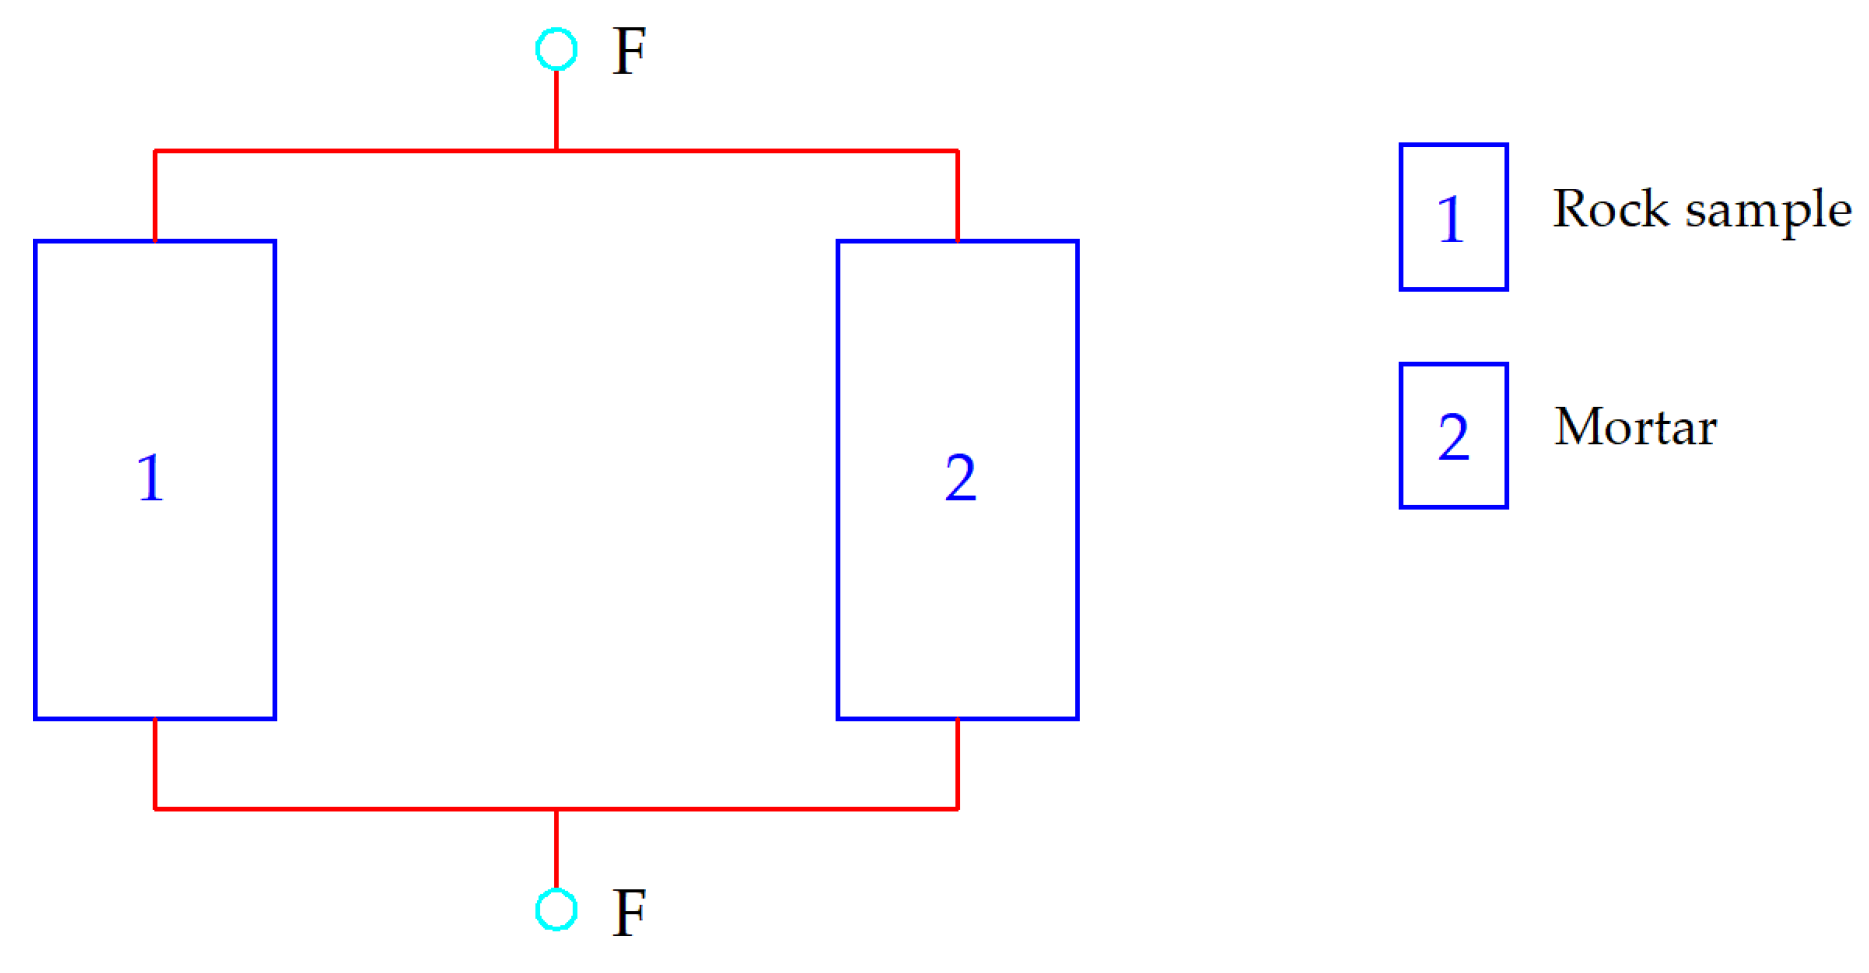
During the pressurization process, stress concentration may occur at the contact surface between the mortar and the rock, leading to failure at the contact surface first and thereby reducing the overall load-bearing capacity of the specimen. In this experiment, the factors considered to affect the bearing capacity of the specimens are different rock sample sizes, rock sample strengths, encasing material strengths, and encasing layer thicknesses. In all four groups of tests, there is a possibility of contact surface influence. Here we have made a hypothesis and simplified treatment, considering that the contact between the mortar and the rock is complete, and the influence of the contact surface properties on the overall bearing capacity of the rock sample is not taken into account. Therefore, whether during the indoor sample testing process or when reinforcing the mine pillar with concrete at the mine site, it is necessary to consider reducing the impact brought by the contact surface. After the rock specimens were encased with mortar, a new composite structure was formed. Based on the mechanical characteristics of the encased structure, this composite system can be regarded as a parallel combination of the rock and the mortar layer, as shown in Figure 18 and Figure 19.
Therefore, the bearing capacity F of the composite structure satisfies the following relationship:
F = F 1 + F 2
where F 1 and F 2 represent the bearing capacity of the rock sample and mortar, respectively.
The bearing capacity of the unencased rock specimen is denoted as F 1 , and the change in the bearing capacity of the rock specimen itself after encapsulation is expressed as:
F 1 / F 1 = ( F F 2 ) / F 1
Taking the test results of Group 4 as an example to analyze the change in the bearing capacity of the rock specimen itself before and after encased, Table 9 shows the test results of specimens with different encased thicknesses. It can be observed that after encased with a 10 mm mortar layer, the peak bearing capacity increased by the mortar layer is 18.84 KN. The bearing capacity of the rock sample itself after encased increased to 45.33–63.08 KN, with an average improvement of 1.24 times. After encased with a 25 mm mortar layer, the peak bearing capacity increased by the mortar layer is 58.88 KN, and the bearing capacity of the rock sample itself after encased increased to 71.87–77.44 KN, with an average improvement of 1.67 times. After encased with a 50 mm mortar layer, the peak bearing capacity increased by the mortar layer is 157 KN, and the bearing capacity of the rock sample itself after encased increased to 70.35–90.94 KN, with an average improvement of 1.78 times. It can be concluded that as the thickness of the encased layer increases, the improvement in the bearing capacity of the rock sample itself significantly increases.
The encased mortar layer provides a confining pressure to the rock specimen, transforming its force state from uniaxial compression to triaxial compression under confinement. Based on extensive experimental results from domestic and international scholars, it has been demonstrated that under triaxial compression, the peak axial stress increases with higher confining pressure [38,39,40]. Consequently, as the thickness of the encased layer increases, the confining pressure provided by the layer also increases, thereby enhancing the bearing capacity of the rock specimen.
In summary, after the rock specimen is encased with mortar, the composite structure not only gains additional load-bearing capacity from the mortar layer itself but also exhibits significantly improved inherent load-bearing capacity of the rock due to the confining pressure provided by the encasing. The extent of this improvement in the rock’s inherent load-bearing capacity is positively correlated with the thickness of the encased layer.

5. Engineering Application

Xianglushan tungsten mine is a large-scale, high-quality scheelite deposit in China. It is characterized by vast reserves, high ore grade, thick ore bodies, gentle dip angles, stable surrounding rock in both the roof and floor, as well as simple engineering geological and hydrogeological conditions. The ore bodies occur at the contact zone between late Yanshanian fine-grained biotite granite and the carbonaceous siliceous argillaceous limestone of the Yangliugang Formation, presenting as stratiform-like deposits. The burial depth of the ore bodies ranges from 40 to 230 m, with thicknesses varying between 5.98 m and 45.59 m, averaging 12.35 m. The ore bodies exhibit gentle slopes along both the strike and dip directions, belonging to locally expanded stratiform-like deposits. The mining operation employs adit development and the room-and-pillar method [41]. Since its commissioning in the 1990s, approximately 3.5 million cubic meters of untreated irregular goaf have formed underground, with a mined-out area reaching 250,000 square meters. The goaf group was formed after open-stope mining, with interconnected cavities and irregular point pillars left in place, as shown in Figure 20. The height of the goaf ranges from 5 to 25 m, with spans between 10 and 35 m. Figure 21 shows the statistical results of pillar distribution. According to the statistics, there are 409 pillars in total. Among them, 67 pillars (16% of the total) have a height of less than 5 m; 207 pillars (51%) range between 5 and 10 m; 102 pillars (25%) range between 10 and 15 m; 25 pillars (6%) range between 15 and 20 m; and 8 pillars (2%) exceed 20 m.
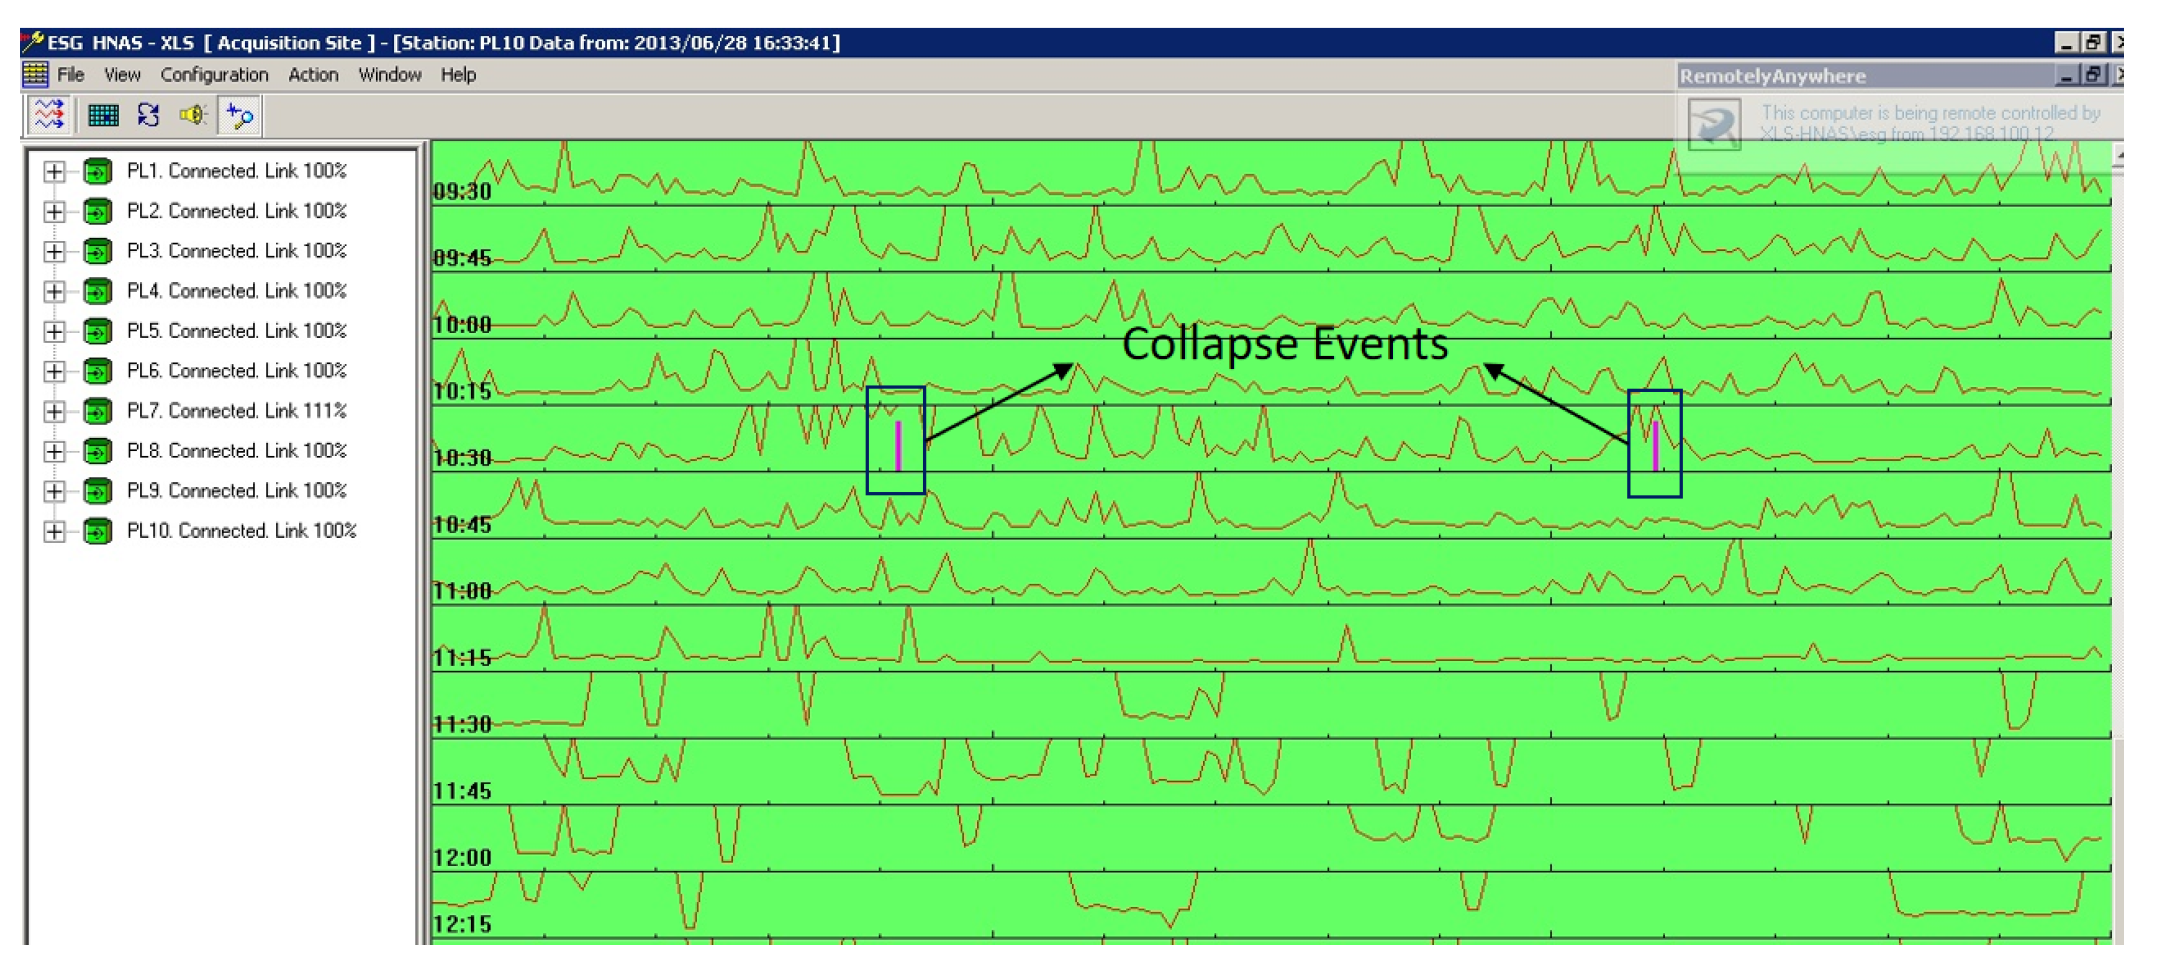
Due to historical mining activities, the mine has formed large-scale interconnected goaf-pillar systems. Given the enormous scope of the goaf, it was impossible for the mine to undertake backfilling treatment within a short period. To ensure underground production safety, a 60-channel microseismic monitoring system was installed in 2010, which was later expanded to 84 channels in 2013, making it the largest microseismic monitoring system in the Asia-Pacific region [42]. As mining operations continued and the volume of the goaf increased, significant ground pressure manifestations began to occur underground. For instance, on 28 June 2013, a large-scale stope collapse took place in the No. 4 adit, triggering extensive ground pressure activity. Figure 22 and Figure 23 show the microseismic monitoring results of the stope collapse on 28 June 2013.
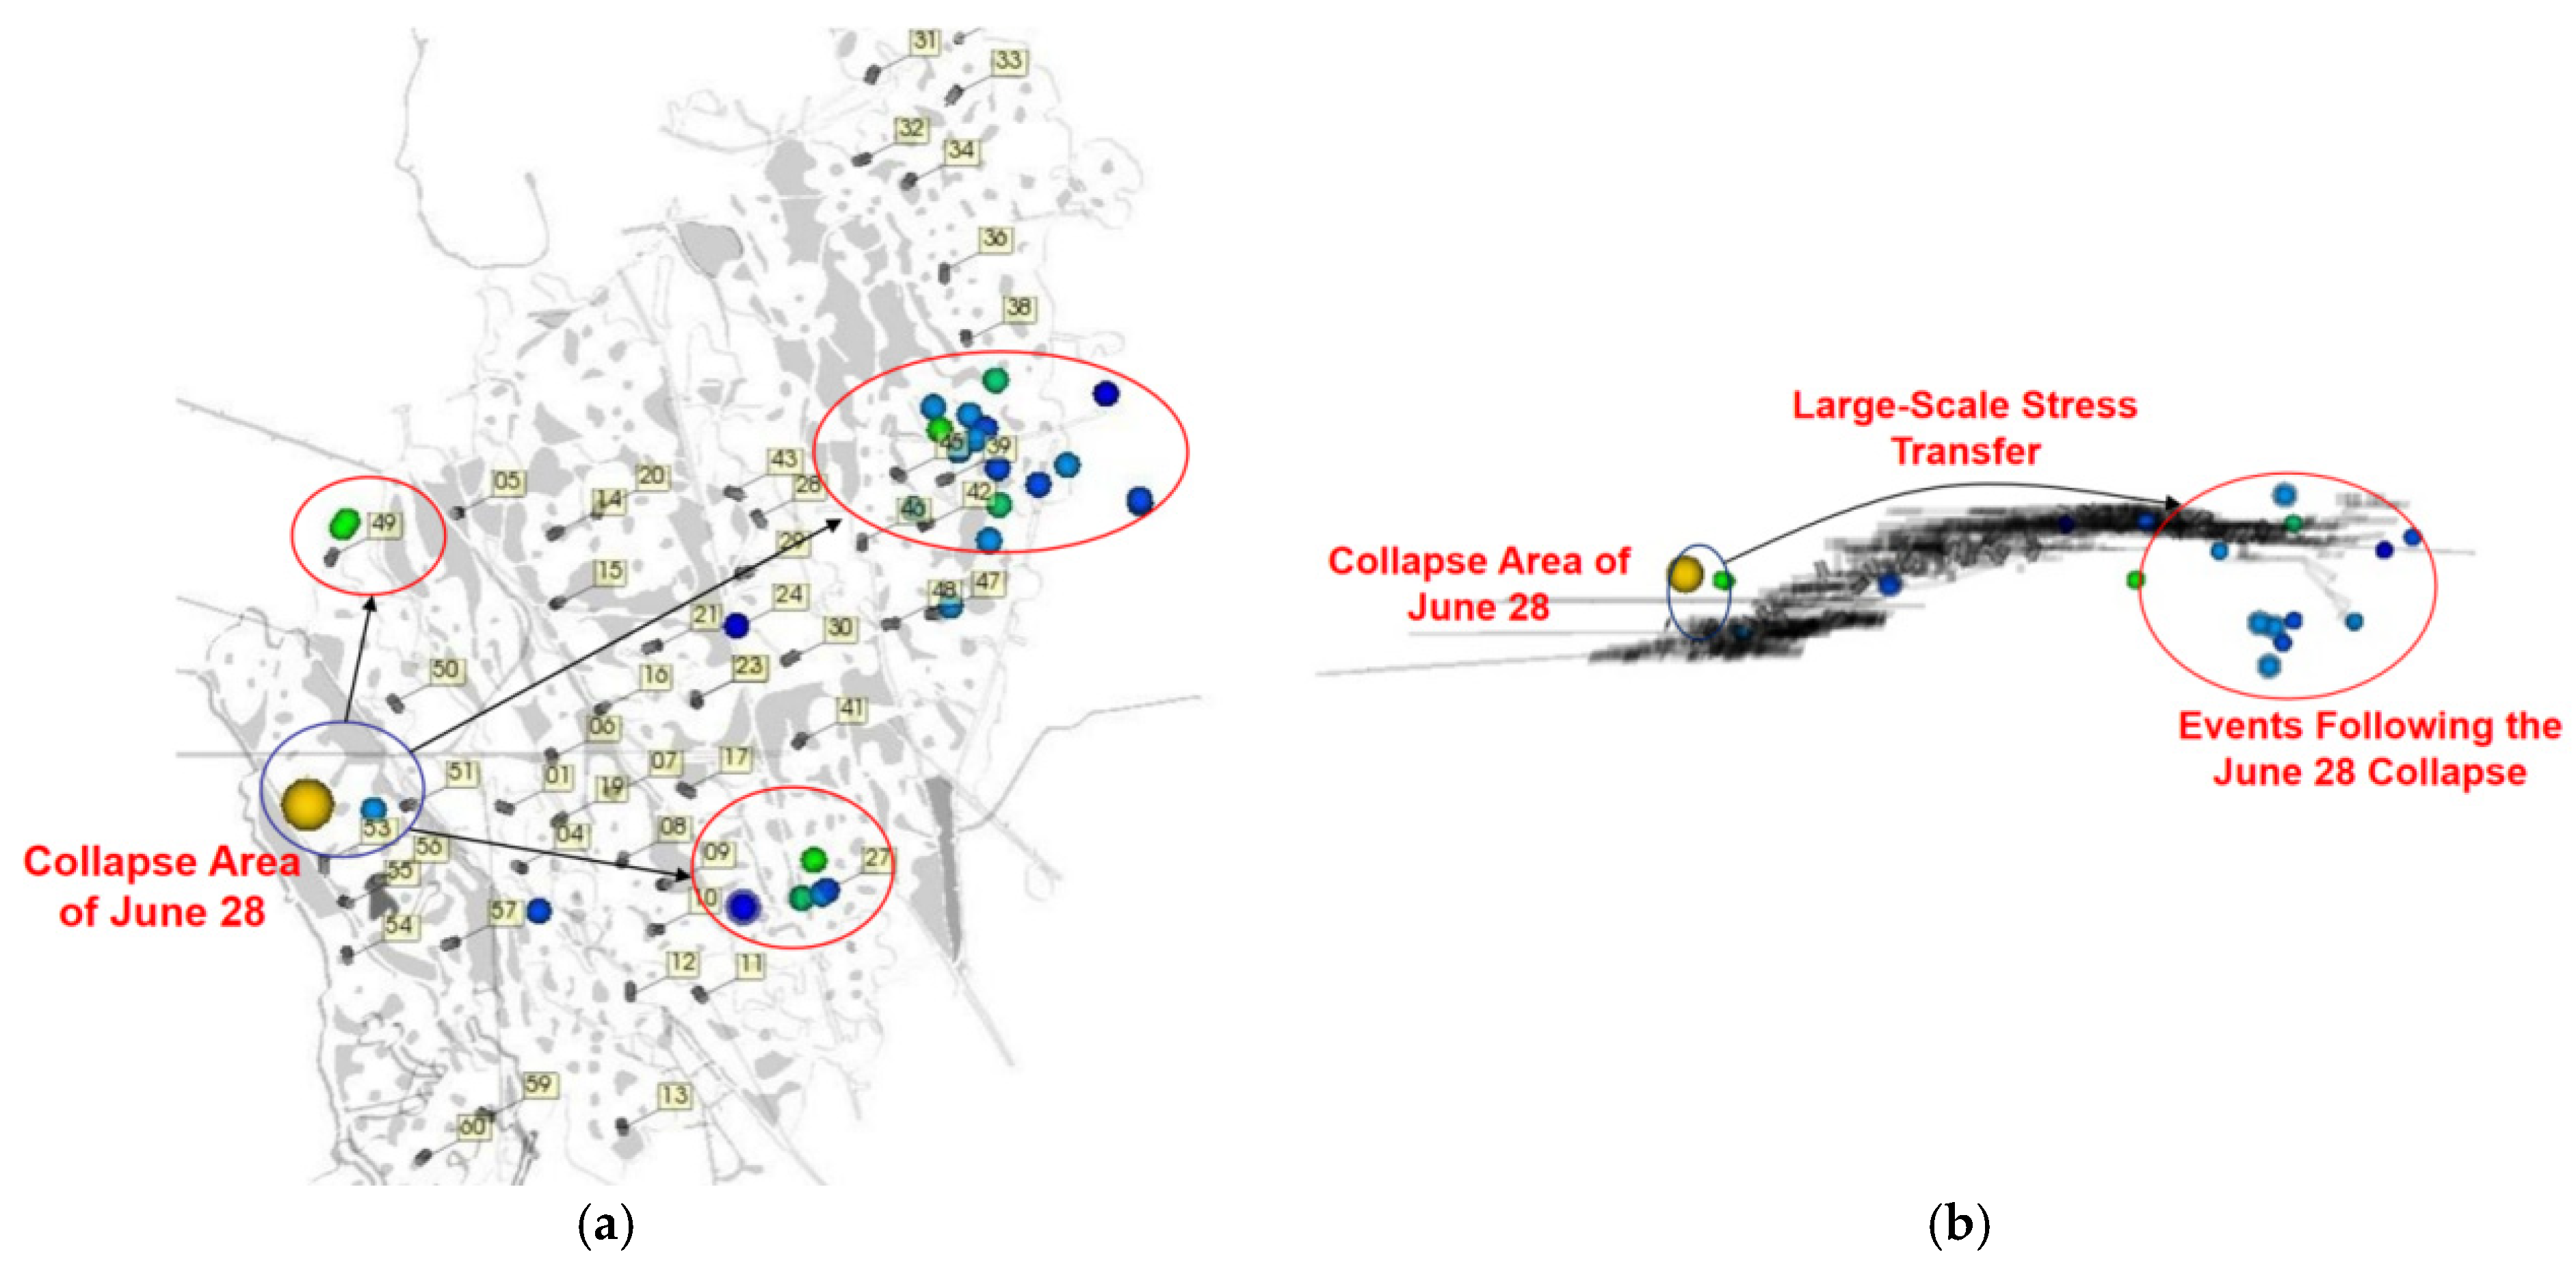
Following the large-scale collapse on 28 June, the mine experienced rapid and extensive stress transfer and redistribution across the entire operation. During this stress redistribution process, localized rock mass failures with relatively high energy releases occurred. Figure 24 shows the localization results of microseismic events induced after the stope collapse. The color of the balls represent the magnitude of the microseismic events; the darker the color, the greater the magnitude. The widespread stress transfer after the collapse primarily shifted to the periphery of the “overall arch-shaped structure” of the ore body, particularly in its eastern section.
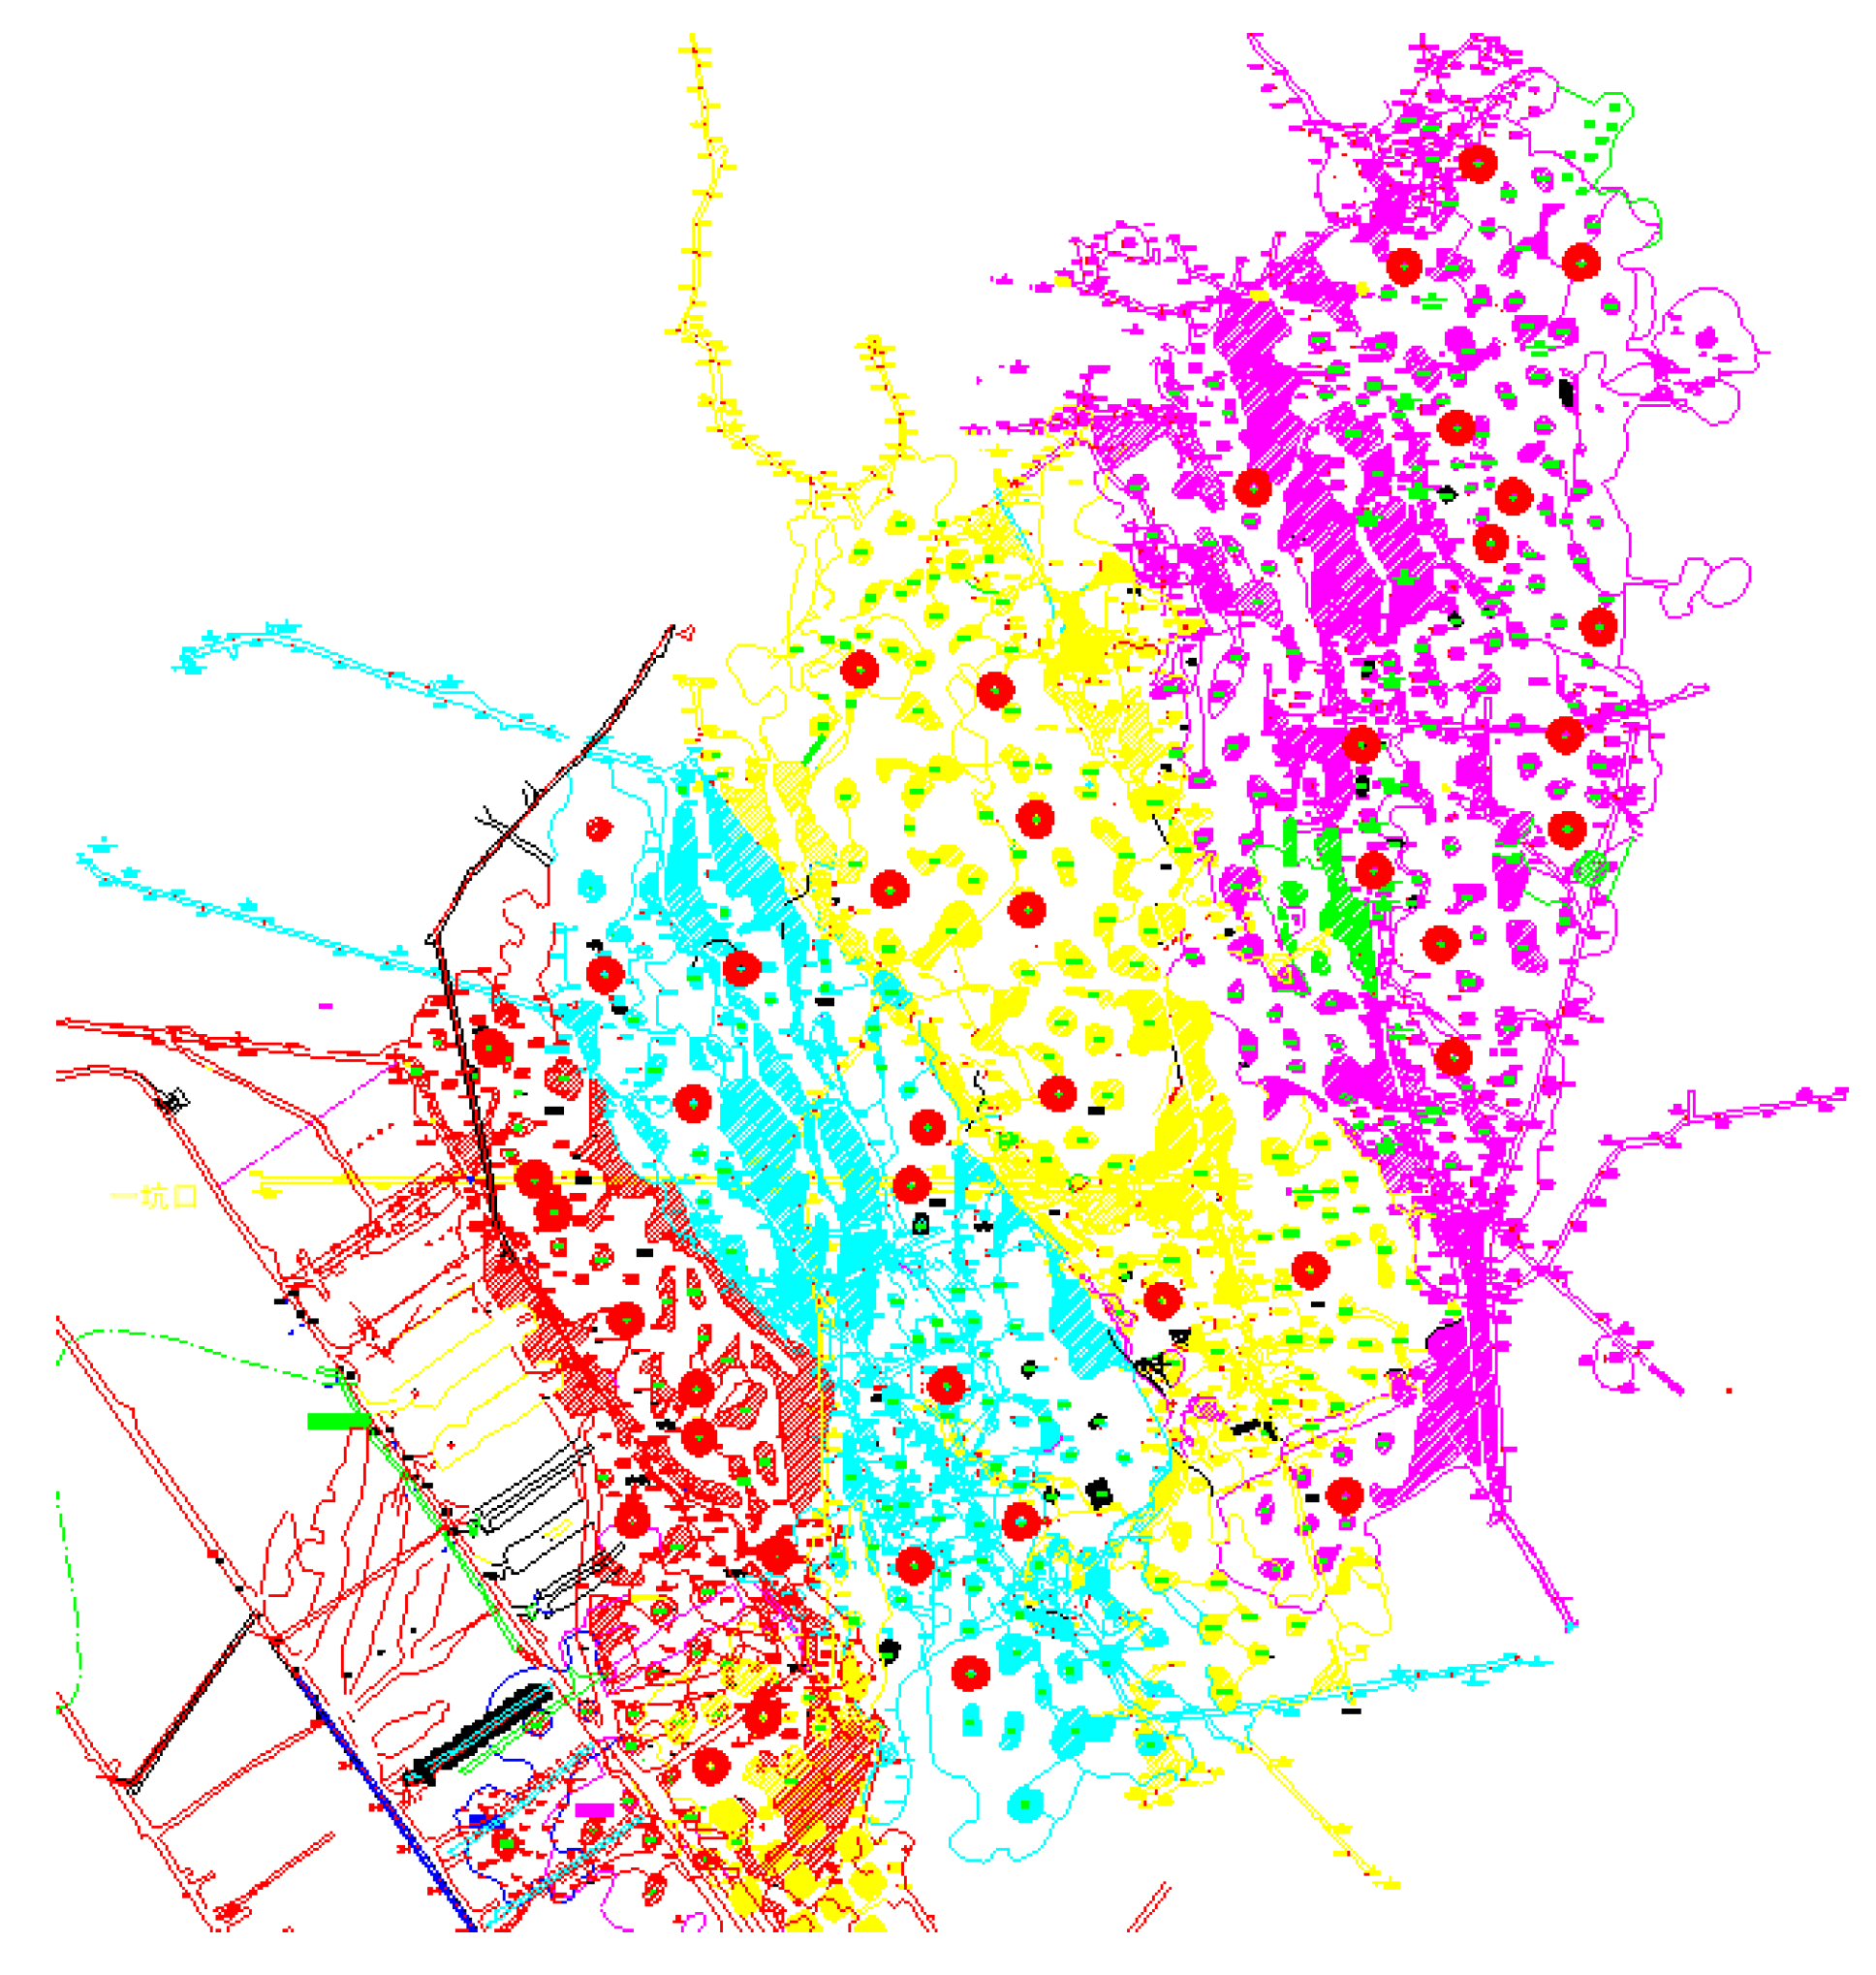
Consequently, the mine management decided to implement a complete temporary suspension of underground operations after the collapse. Simultaneously, concrete encapsulation reinforcement was carried out on critical pillars in areas with relatively low safety factors and where ground pressure manifestations had already appeared. The reinforcement utilized C25 reinforced concrete with an encapsulation thickness of not less than 3 m. Vertical reinforcement employed Φ16 rebar at 300 mm spacing, with stirrups using Φ20 rebar at 500 mm spacing. Throughout 2013, a total of 42 underground pillars underwent concrete encapsulation reinforcement treatment, as shown in the red dot in Figure 25 (different color areas represent different panel sections: the red area indicates Panel 1, the light blue area indicates Panel 2, the yellow area indicates Panel 3, and the magenta area indicates Panel 4), and typical photo of a mine pillar encased by concrete see in Figure 26.
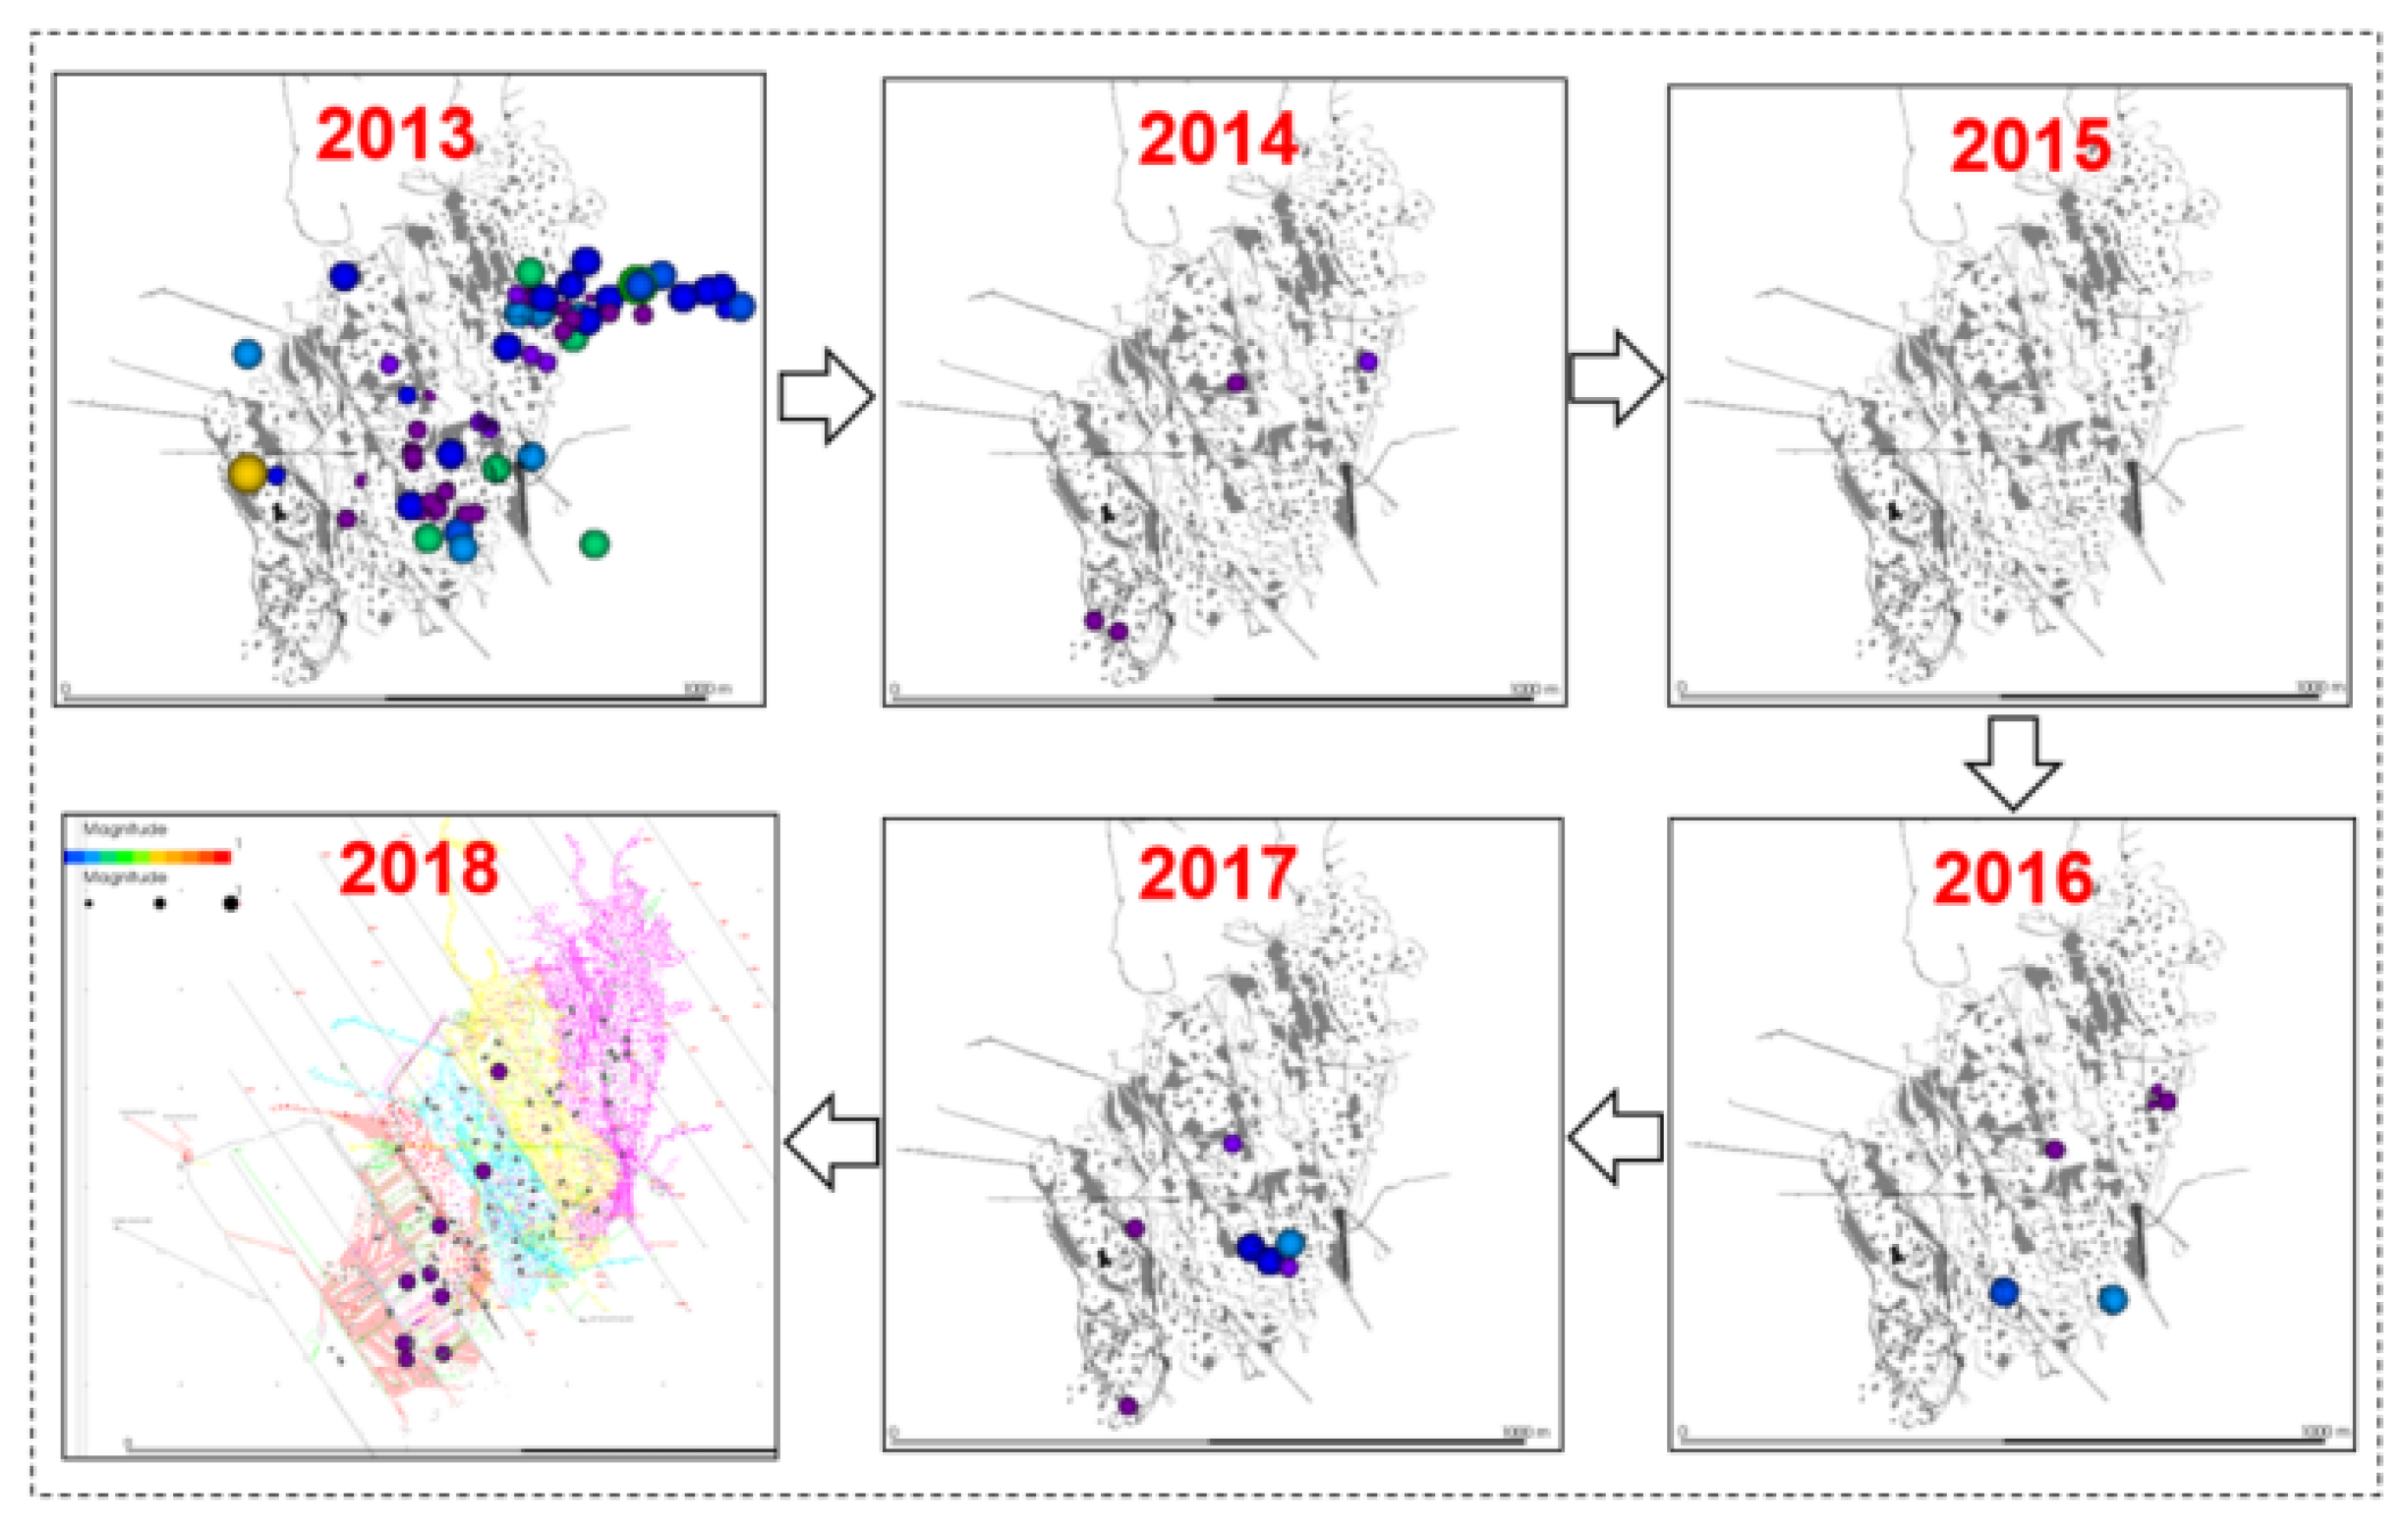
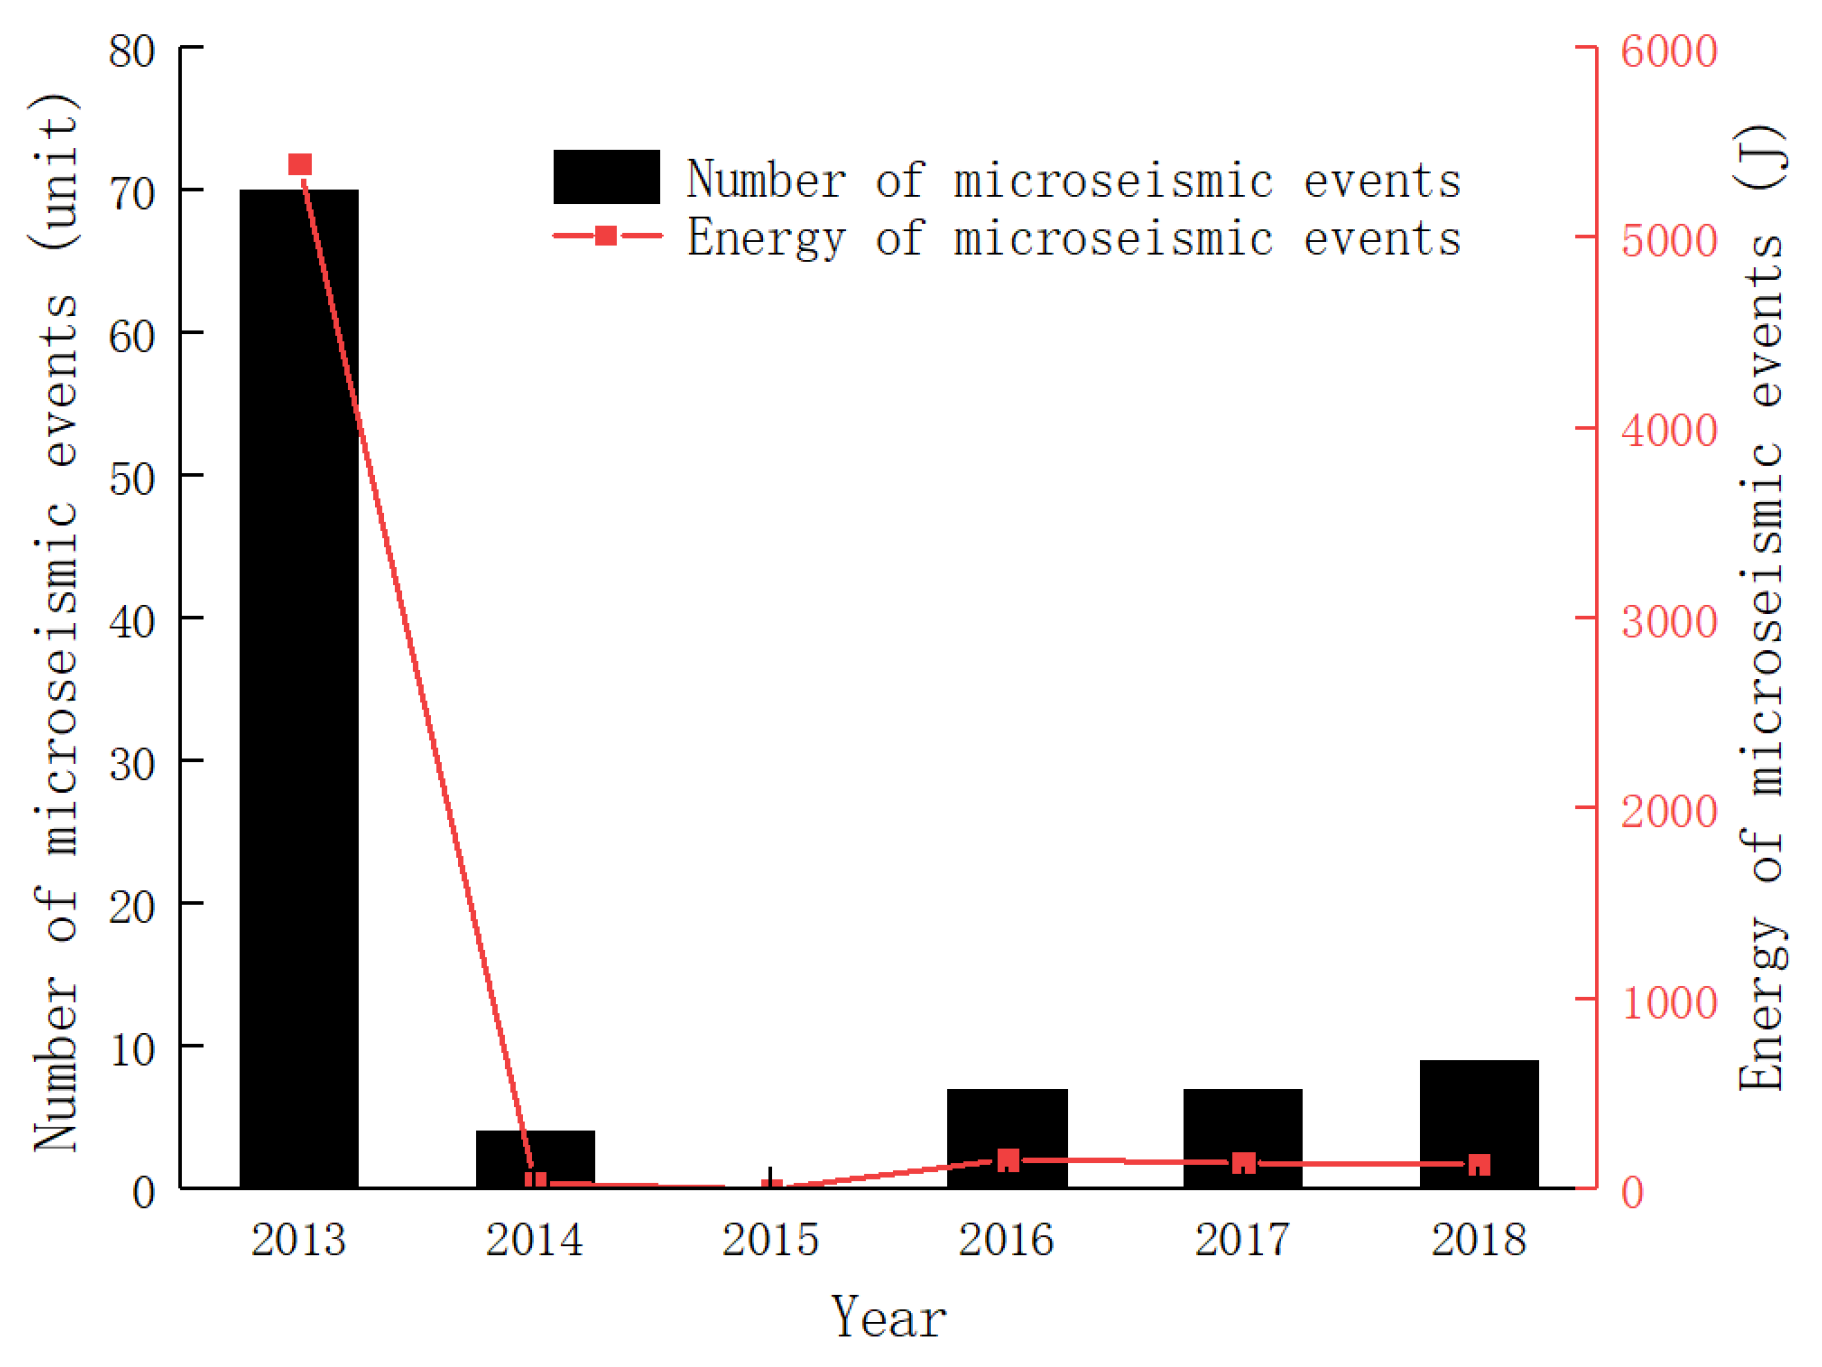
According to the underground microseismic monitoring results presented in Figure 27 and Figure 28, 2013 represented a period of active ground pressure, with 70 high-energy microseismic events located predominantly in the eastern and western sections of the mining area. After 2014, the annual number of located microseismic events never exceeded 10, and their distribution became significantly more scattered. This demonstrates that following the completion of concrete encapsulation reinforcement of critical pillars, the frequency of underground microseismic events decreased substantially without further large-scale ground pressure manifestations. The overall underground ground pressure has been effectively controlled.

6. Conclusions

(1)
Mortar encapsulation significantly enhances the bearing capacity and axial peak strain of rock specimens. Specimens with smaller height-to-diameter ratios demonstrate more substantial bearing capacity improvement, indicating better reinforcement effectiveness. The bearing capacity enhancement ratio follows a power function relationship with the height-to-diameter ratio. Rocks with lower strength exhibit greater bearing capacity improvement after encapsulation, resulting in superior reinforcement effect. Both increased encapsulation material strength and greater encapsulation thickness lead to notable improvement in bearing capacity and enhanced reinforcement effectiveness.
(2)
Orthogonal range analysis was employed to evaluate the sensitivity of four influencing factors: rock size, rock strength, encapsulation material, and encapsulation thickness. The results indicate that the primary-to-secondary order of factors affecting the reinforcement effectiveness is encapsulation thickness > rock height-to-diameter ratio > encapsulation material > rock strength.
(3)
Compared to unwrapped specimens, encapsulated rock specimens transition from overall failure to fragmentation failure modes. The encapsulated specimens absorb more external energy and demonstrate significantly improved load-bearing capacity. With increasing encapsulation strength and thickness, the specimens exhibit tendencies toward plastic deformation failure. The mortar-encapsulated rock specimen can be considered as a parallel composite structure of rock and mortar layers. This composite system not only gains additional load-bearing capacity from the mortar layer but also shows substantially enhanced inherent load-bearing capacity of the rock itself due to the confining pressure provided by the encapsulation. The inherent load-bearing capacity of the rock specimen increases significantly with both the strength and thickness of the encapsulation material.
(4)
Field application involved reinforcing 42 critical pillars in a tungsten mine using C25 reinforced concrete encapsulation with a minimum thickness of 3 m. Following the completion of pillar reinforcement in key areas, the underground microseismic activity decreased markedly without further large-scale ground pressure manifestations. The overall underground ground pressure has been effectively controlled. The field demonstration confirms that concrete-encapsulated pillar reinforcement effectively manages mine-wide ground pressure.

Author Contributions

F.P.: Funding acquisition, investigation, data curation, writing—original draft. W.W.: Project administration, conceptualization, methodology. All authors have read and agreed to the published version of the manuscript.

Funding

This Project was supported by the National Natural Science Foundation of China (No. 52374088), the National Key Research and Development Program Project of China (2022YFC2904002), and the State Key Laboratory Special Programs of China Minmetals Corporation (2024GZKJ03).

Data Availability Statement

All the data, models, and codes generated or used during the study appear in the submitted article.

Conflicts of Interest

The authors declare that they have no conflicts of interest.

References

  1. Guo, Q.; Yu, H.; Dan, Z.; Li, S. Mining Method Optimization of Gently Inclined and Soft Broken Complex Ore Body Based on AHP and TOPSIS: Taking Miao-Ling Gold Mine of China as an Example. Sustainability 2021, 13, 12503. [Google Scholar] [CrossRef]
  2. Lin, Y. Research on Mining Technology of Steeply Inclined Thin Ore Body in High-grade Content Mine. IOP Conf. Ser. Earth Environ. Sci. 2021, 632, 022038. [Google Scholar] [CrossRef]
  3. Javanshirgiv, M.; Safari, M. The selection of an underground mining method using the fuzzy topsis method: A case study in the kamar mahdi ii fluorine mine. Min. Sci. 2017, 24, 161. [Google Scholar]
  4. Liang, W.Z.; Dai, B.; Zhao, G.Y.; Wu, H. Assessing the Performance of Green Mines via a Hesitant Fuzzy ORESTE–QUALIFLEX Method. Mathematics 2019, 7, 788. [Google Scholar] [CrossRef]
  5. Ghasemi, E.; Ataei, M.; Shahriar, K. Prediction of global stability in room and pillar coal mines. Nat. Hazards 2014, 72, 405–422. [Google Scholar] [CrossRef]
  6. Zhou, Y.J.; Li, M.; Xu, X.D.; Li, X.T.; Ma, Y.D.; Ma, Z. Research on catastrophic pillar instability in room and pillar gypsum mining. Sustainability 2018, 10, 3773. [Google Scholar] [CrossRef]
  7. Li, T.; Cai, M.F.; Zhang, S.Q. Mining-induced seismicity in China. Seismol. Res. North. Chin. 2005, 21, 1–26. [Google Scholar]
  8. Tong, Q.; Tong, Y.S.; Kang, C.X. Feature categorization of mining induced tremor in Hunan Province. Seismol. Geomagn. Obs. Res. 2023, 44, 41–47. [Google Scholar]
  9. Wang, G.B. Study on Rock Burst Induced by Roof Falling and Its Control Methods in Gypsum Mine. Master’s Thesis, Wuhan University of Technology, Wuhan, China, 2006. [Google Scholar]
  10. Wen, J.; Gou, X.B.; Zhao, J.Y. The gestation process and the caution of the Xingtai gypsum mine subsidence. Seismol. Geom. Obs. Res. 2007, 28, 36–40. [Google Scholar]
  11. Yao, Q. Research on the Treatment Methods of Goaf Areas in Xingtai Gypsum Mining Area. Min. Technol. 2012, 3, 59–61. [Google Scholar]
  12. Hunan Earthquake Administration. Analysis Report on the Xiang’an Tungsten Industry Mine Earthquake; Hunan Earthquake Administration: Changsha, China, 2022.
  13. Watson, B.; Maphosa, T.; Theron, W.; Fernandes, N.; Stacey, T.; Morgan, A.; Carpede, A.; Betz, G. Establishing a UG2 pillar strength formula in south african platinum mines. Minerals 2024, 14, 1161. [Google Scholar] [CrossRef]
  14. Liang, W.Z.; Luo, S.Z.; Zhao, G.Y.; Wu, H. Predicting Hard Rock Pillar Stability Using GBDT, XGBoost, and LightGBM Algorithms. Mathematics 2020, 8, 765. [Google Scholar] [CrossRef]
  15. Zhou, J.; Li, X.; Mitri, H.S. Comparative performance of six supervised learning methods for the development of models of hard rock pillar stability prediction. Nat. Hazards 2015, 79, 291–316. [Google Scholar] [CrossRef]
  16. Mortazavi, A.; Hassani, F.P.; Shabani, M. A numerical investigation of rock pillar failure mechanism in underground openings. Comput. Geotech. 2009, 36, 691–697. [Google Scholar] [CrossRef]
  17. Griffiths, D.V.; Fenton, G.A.; Lemons, C.B. Probabilistic analysis of underground pillar stability. Int. J. Numer. Anal. Met. 2002, 26, 775–791. [Google Scholar] [CrossRef]
  18. Tawadrous, A.S.; Katsabanis, P.D. Prediction of surface crown pillar stability using artificial neural networks. Int. J. Numer. Anal. Met. 2007, 31, 917–931. [Google Scholar] [CrossRef]
  19. Wattimena, R.K. Predicting the stability of hard rock pillars using multinomial logistic regression. Int. J. Rock Mech. Min. 2014, 71, 33–40. [Google Scholar] [CrossRef]
  20. Ding, H.X.; Li, G.H.; Dong, X.; Lin, Y. Prediction of pillar stability for underground mines using the stochastic gradient boosting technique. IEEE Access 2018, 6, 69253–69264. [Google Scholar] [CrossRef]
  21. Grgic, D.; Homand, F.; Hoxha, D. A short-and long-term rheological model to understand the collapses of iron mines in Lorraine France. Comput. Geotech. 2003, 30, 557–570. [Google Scholar] [CrossRef]
  22. AI Heib, M.; Duval, C.; Theoleyre, F. Analysis of the historical collapse of an abandoned underground chalk mine in 1961 in Clamart (Paris France). Bull. Eng. Geol. Environ. 2015, 74, 1001–1018. [Google Scholar] [CrossRef]
  23. Salmi, E.F.; Nazem, M.; Karakus, M. The effect of rock mass gradual deterioration on the mechanism of post-mining subsidence over shallow abandoned coal mine. Int. J. Rock Mech. Min. 2017, 91, 59–71. [Google Scholar] [CrossRef]
  24. Zhou, Z.L.; Chen, L.; Zhao, Y. Experimental study on failure mechanism and bearing characteristic of double-pillar system. Chin. J. Rock Mech. Eng. 2017, 36, 420–428. [Google Scholar]
  25. Guan, Y.W.; Wei, Y.Q.; Yang, Z.J. Failure mechanism of the key strata-pillar system in room and pillar goaf based ona numerieal simulation. Chin. J. Geol. Hazard Control 2017, 28, 59–63. [Google Scholar]
  26. Liu, J.X.; Tang, C.A.; Zhu, W.C. Rock-coal model for studying the rockburst. Chin. J. Geotech. Eng. 2004, 26, 276–280. [Google Scholar]
  27. Zhu, D.F.; Tu, S.H.; Wang, F.T. Stability evaluation on pillar system of room and pillar mining in goaf at shallow depth seam. J. Chin. Coal Soc. 2018, 43, 390–397. [Google Scholar]
  28. Feng, G.R.; Bai, J.W.; Shi, X.D. Key pillar theory in the chain failure of residual coal pillars and its application prospect. J. Chin. Coal Soc. 2021, 46, 164–179. [Google Scholar]
  29. Tesarik, D.R.; Seymour, J.B.; Yanske, T.R. Longterm stability of a backfilled room-and-pillar test section at the buick mine missouri. Int. J. Rock Mech. Min. Sci. 2009, 46, 1182–1196. [Google Scholar] [CrossRef]
  30. Tan, Y.Y.; Zhang, K.; Yu, X.; Song, W.D.; Wang, J.; Hai, C.L. The mechanical and microstructural properties of composite structures made of a cement-tailing backfill and rock core. Minerals 2020, 10, 159. [Google Scholar] [CrossRef]
  31. Zhang, C.; Jin, Z.; Feng, G.; Tai, Y.; Gao, R.; Li, C. Joint load-bearing behaviors and interface failure mechanism of encased coal samples under uniaxial compression. Compos. Struct. 2024, 10, 118480. [Google Scholar] [CrossRef]
  32. Li, J.; Bai, J.W.; Feng, G.R.; Wang, S.Y. Compressive performance of innovative reinforced pillars in closed/abandoned mines. J. Cent. South Univ. 2024, 31, 2780–2793. [Google Scholar] [CrossRef]
  33. Zhao, H.C.; Ren, T.; Remennikov, A. Behaviour of FRP-confined coal reject concrete columns under axial compression. Compos. Struct. 2021, 262, 113621. [Google Scholar] [CrossRef]
  34. Ren, T.; Zhao, H.C.; Remennikov, A. Fibre-reinforced polymer confined-coal rejects concrete: Compressive behaviour. Compos. Struct. 2022, 299, 116063. [Google Scholar] [CrossRef]
  35. Song, W.D.; Cao, S.; Fu, J.X. Sensitivity analysis of impact factors of pillar stability and its application. Rock Soil Mech. 2014, 35, 271–277. [Google Scholar]
  36. Yin, S.H.; Wu, A.X.; Li, X.W. Orthogonal polar difference analysis for sensitivity of the factors influencing the ore pillar stability. J. Chin. Coal Soc. 2012, 37, 48–52. [Google Scholar]
  37. Dong, J.Y.; Yang, J.H.; Yang, G.X. Research on similar material proportioning test of model test based on orthogonal design. J. Chin. Coal Soc. 2012, 37, 44–49. [Google Scholar]
  38. Lu, Y.D.; Ge, X.R.; Jiang, Y. Study on conventional triaxial compression test of complete process for marble and its constitutive equation. Chin. J. Rock Mech. Eng. 2004, 23, 2489–2493. [Google Scholar]
  39. He, M.C.; Xie, H.P.; Peng, S.P.; Jiang, Y.D. Study on rock mechanics in deep mining engineering. Chin. J. Rock Mech. Eng. 2005, 16, 2803–2813. [Google Scholar]
  40. Zhang, L.; Wang, B.X.; Yang, T. Research of rock triaxial compression test with multilevel confining pressure. Site Investig. Sci. Technol. 2007, 3, 6–8. [Google Scholar]
  41. Hu, J.Y.; Lin, F.; Peng, F.H. Research on application of microseismic monitoring technology on ground pressure hazard of residual are in Xianglushan tungsten mine. Chin. J. Geol. Hazard Control 2010, 21, 109–115. [Google Scholar]
  42. Peng, F.H.; Li, S.L.; Leng, X.N. Study of influence of rainfall permeation on shallow stope stability by microseismic Monitoring. Chin. J. Rock Mech. Eng. 2016, 35, 4154–4163. [Google Scholar]
Figure 1. Schematic diagram of the test system structure.
Applsci 15 10615 g001
Figure 2. Photograph of the test system.
Applsci 15 10615 g002
Figure 3. The photo of rock samples of different sizes before and after being encased.
Applsci 15 10615 g003
Figure 4. Fitting curve of the relationship between the increase in peak bearing capacity and the ratio of height-to-diameter ratio: the blue squares represent the coordinate points of the height-to-diameter ratio and the ratio of the bearing capacity after wrapping to that before wrapping, the red line is the fitting curve.
Applsci 15 10615 g004
Figure 5. Bearing capacity–strain curves of rock samples of different sizes before and after encasing: (a) 50 mm × 50 mm, (b) 50 mm × 100 mm, (c) 50 mm × 150 mm, (d) 50 mm × 200 mm.
Applsci 15 10615 g005
Figure 6. Photograph of rock samples with different strengths encased by mortar.
Applsci 15 10615 g006
Figure 7. Bearing capacity–strain curves of rock samples of different strengths before and after encasing: (a) red sandstone, (b) green sandstone, and (c) white sandstone.
Applsci 15 10615 g007
Figure 8. Photograph of rock samples encased by different materials.
Applsci 15 10615 g008
Figure 9. Bearing capacity–strain curves of rock samples of different materials before and after encasing: (a) M5 mortar, (b) M10 mortar, and (c) M10 steel wire-reinforced mortar.
Applsci 15 10615 g009
Figure 10. Photograph of rock samples encased with different thicknesses.
Applsci 15 10615 g010
Figure 11. Bearing capacity-strain curves of rock samples of different thicknesses before and after encasing: (a) Encasing thickness of 10 mm, (b) encasing thickness of 25 mm, and (c) encasing thickness of 50 mm.
Applsci 15 10615 g011
Figure 12. Damage photos of rock samples with different sizes before and after encased.
Applsci 15 10615 g012
Figure 13. AE results for rock sample H14 after encasing.
Applsci 15 10615 g013
Figure 14. Photos of damaged rock samples made with different strengths before and after being encased.
Applsci 15 10615 g014
Figure 15. Photos of damaged rock samples made with different materials after being encased.
Applsci 15 10615 g015
Figure 16. Photographs of damaged rock samples made with different thicknesses after encasing.
Applsci 15 10615 g016
Figure 17. AE results for rock sample H19 after encasing.
Applsci 15 10615 g017
Figure 18. Structure of a rock sample encased by mortar.
Applsci 15 10615 g018
Figure 19. Mechanical model of rock sample encased by mortar.
Applsci 15 10615 g019
Figure 20. Typical photograph of mined out area.
Applsci 15 10615 g020
Figure 21. Statistics of pillar height distribution.
Applsci 15 10615 g021
Figure 22. Real-time monitoring chart for stope collapse events.
Applsci 15 10615 g022
Figure 23. Waveform Diagram of Stope Collapse Events.
Applsci 15 10615 g023
Figure 24. Localization map of induced microseismic events following stope collapse: (a) top view; (b) side view.
Applsci 15 10615 g024
Figure 25. Layout diagram of concrete-encased reinforced mine pillars.
Applsci 15 10615 g025
Figure 26. Typical photo of a mine pillar encased by concrete.
Applsci 15 10615 g026
Figure 27. Monitoring results of microseismic events over the years.
Applsci 15 10615 g027
Figure 28. Trend chart of microseismic events.
Applsci 15 10615 g028
Table 1. Mortar preparation scheme.
MaterialQuality Mix RatioMoldCuringGrinding
ordinary Portland cement 42.5, dry fine sand (0.25 mm–0.35 mm), watercement–sand–water ratio = 1:4.5:1.1 (M10)
cement–sand–water ratio = 1:6.0:1.2 (M5)
PVC pipes with internal diameters of 70 mm, 100 mm, and 150 mmafter being demolded at 24 h, the specimens are cured in a chamber at 20 °C and 90% relative humidity for 28 daysthe specimen shall be ground at both ends to achieve a height tolerance of ±0.5 mm
Table 2. Test results for rock samples of different sizes.
Rock SampleH (mm)d (mm) f 0 (KN) ε 0 f b (KN) ε b f b / f 0 ε b / ε 0
H-16505031.610.0172126.470.08964.004.085.213.87
H-17505031.610.0172136.110.06924.314.02
H-18505031.610.0172123.950.04093.922.38
H-11005044.490.0107136.310.01353.062.991.261.32
H-21005044.490.0107132.410.01472.981.37
H-31005044.490.0107130.740.01412.941.32
H-131505043.350.0074118.870.01002.742.521.351.93
H-141505043.350.0074103.750.01552.392.09
H-151505043.350.0074105.080.01752.422.36
H-222005036.520.005878.070.00762.142.161.311.77
H-232005036.520.005879.560.01442.182.48
H-242005036.520.005878.470.00892.151.53
Table 5. Test results for rock samples with different thicknesses.
Rock SampleEncasing Thicknesses (mm) f 0 (KN) ε 0 f b (KN) ε b f b / f 0 ε b / ε 0
H-101044.490.010764.170.01111.441.671.041.02
H-111044.490.010781.920.01061.840.99
H-121044.490.010776.360.01091.721.02
H-12544.490.0107136.310.01353.062.991.261.32
H-22544.490.0107132.410.01472.981.37
H-32544.490.0107130.740.01412.941.32
H-195044.490.0107233.730.03465.255.313.233.27
H-205044.490.0107247.940.03635.573.39
H-215044.490.0107227.350.03415.113.19
Table 6. Deformation and failure characteristics of the rock samples.
Rock SamplePeak Bearing CapacityPeak StrainFailure Mode
CategoryCharacteristic Description
H-16126.470.0896Large fragmented blocksForming large rock blocks and a large amount of debris after failure
H-17136.110.0692
H-18123.950.0409
H-1136.310.0135Large blocksForming several large rock blocks after failure
H-2132.410.0147
H-3130.740.0141
H-13118.870.0100Splitting patternProducing a single main fracture surface and splitting into two large blocks
H-14103.750.0155
H-15105.080.0175
H-2278.070.0076Large blocksForming several large rock blocks after end failure
H-2379.560.0144
H-2478.470.0089
Q-1225.280.0200Splitting patternProducing a single main fracture surface and splitting into two large blocks
Q-2234.180.0155
Q-3237.540.0159
B-1252.300.0160Splitting patternProducing a single main fracture surface and splitting into two large blocks
B-2272.120.0214
B-3294.590.0159
H-4106.870.0111Large blocksForming several large rock blocks after failure
H-574.000.0149
H-678.710.0166
H-7133.020.0177Large blocksForming large rock blocks and a large amount of debris after the outer layer of mortar fails, with the rock remaining relatively intact
H-8140.070.0150
H-9124.890.0168
H-1064.170.0111Large blocksForming several large rock blocks after failure
H-1181.920.0106
H-1276.360.0109
H-19233.730.0346Small fragmented blocksForming small blocks and a large amount of debris after failure
H-20247.940.0363
H-21227.350.0341
Table 7. Influencing factors and levels in sensitivity analysis.
Influencing FactorsLevel 1Level 2Level 3Level 4
height-to-diameter ratio1234
rock strength (KN)4592.79118.03/
encasing materialM5M10M10 mortar with steel wire/
encasing thickness (mm)102550/
Table 8. Sensitivity analysis results.
Test NumberHeight-to-Diameter RatioRock Strength (KN)Encasing MaterialEncasing Thickness (mm)Peak Stress Enhancement Ratio
1145M10254.08
2245M10252.99
3345M10252.52
4445M10252.16
5245M10252.99
6292.79M10252.50
72118.03M10252.32
8245M5251.94
9245M10252.99
10245M10 with steel wire252.98
11245M10101.67
12245M10252.99
13245M10505.31
K14.082.992.522.16
K22.992.502.32
K31.942.992.98
K41.672.995.31
the rangeR1 = 1.92R2 = 0.67R3 = 1.05R4 = 3.64
Order of Factor Significanceencasing thickness > height-to-diameter ratio > encasing material > rock strength
Table 9. Test results of rock samples with different thickness.
Rock SampleEncasing Thickness (mm) F 2 (KN)F (KN) F 1 ( K N ) F 1 ( K N ) F 1 / F 1
H-101018.8464.1745.3344.491.021.24
H-111018.8481.9263.0844.491.42
H-121018.8476.3657.5244.491.29
H-12558.88136.3177.4444.491.741.67
H-22558.88132.4173.5444.491.65
H-32558.88130.7471.8744.491.62
H-1950157.00233.7376.7344.491.721.78
H-2050157.00247.9490.9444.492.04
H-2150157.00227.3570.3544.491.58
Disclaimer/Publisher’s Note: The statements, opinions and data contained in all publications are solely those of the individual author(s) and contributor(s) and not of MDPI and/or the editor(s). MDPI and/or the editor(s) disclaim responsibility for any injury to people or property resulting from any ideas, methods, instructions or products referred to in the content.