Abstract
In recent years, controlling the integrity of shallow-buried natural gas pipelines within surface subsidence zones caused by high-intensity underground longwall mining in the Daniudi Gas Field of China’s Ordos Basin has emerged as a critical challenge impacting both mine planning and the safe, efficient co-exploitation of coal and deep natural gas resources. This study included field measurements and an analysis of surface subsidence data from high-intensity longwall mining operations at the Xiaobaodang No. 2 Coal Mine, revealing characteristic ground movement patterns under intensive extraction conditions. The subsidence basin was systematically divided into pipeline hazard zones using three key deformation indicators: horizontal strain, tilt, and curvature. Through ABAQUS-based 3D numerical modeling of coupled pipeline–coal seam mining systems, this research elucidated the spatiotemporal evolution of pipeline Von Mises stress under varying mining parameters, including working face advance rates, mining thicknesses, and pipeline orientation angles relative to the advance direction. The simulations further uncovered non-synchronous deformation behavior between the pipeline and its surrounding sand and soil, identifying two distinct evolutionary phases and three characteristic response patterns. Based on these findings, targeted pipeline integrity preservation measures were developed, with numerical validation demonstrating that maintaining advance rates below 10 m/d, restricting mining heights to under 2.5 m within the 260 m pre-mining influence zone, and where geotechnically feasible, the maximum stress of the pipeline laid perpendicular to the propulsion direction (90°) can be controlled below 480 MPa, and the separation amount between the pipe and the sand and soil can be controlled below 8.69 mm, which can effectively reduce the interference caused by mining. These results provide significant engineering guidance for optimizing longwall mining parameters while ensuring the structural integrity of shallow-buried pipelines in high-intensity extraction environments.
1. Introduction
Over the past decade, as China’s coal resource development has gradually shifted westward, the extent of coal–oil/gas co-mining areas has steadily expanded. Representative of such overlapping resource zones, the Daniudi Gas Field in the Ordos Basin is currently facing numerous challenges and complex issues [1,2]. In particular, the coal seams in this mining area exhibit generally favorable geological conditions, including uniform thicknesses ranging from 2 to 10 m, nearly horizontal deposition, low gas content, and simple structural settings. Consequently, longwall panels in overlapping coal–gas zones typically feature large dimensions, with most mines designed for panel widths exceeding 300 m and face lengths surpassing 4,000 m, achieving average advance rates of 10–20 m/day. Compared with conventional operations advancing at rates below 10 m per day, such high-intensity mining induces significantly more severe overburden movement and surface subsidence. This has led to frequent occurrences of stress concentration, deformation, and even structural failure in oil/gas wells and shallow-buried pipelines located within the mining influence zone [3]. The loss of integrity in oil/gas wells and pipelines may trigger leakage-induced hazards, including underground/surface fires, explosions, and contamination of shallow soils and groundwater [4,5,6,7,8].
The load–deformation characteristics of shallow-buried pipelines in high-intensity longwall mining subsidence areas are closely related to pipe–sand interactions. When the surrounding sand soil deforms, the pipeline cross-section is subjected to normal pressure, tangential forces, and axial friction during discontinuous surface deformation, forming a complex nonlinear contact problem. With the development of computer simulation technology and contact theory, theoretical analysis and numerical simulation have become common methods for studying nonlinear pipe–soil interaction models. Researchers worldwide have proposed the elastic foundation beam model in semi-elastic space and cylindrical shell theory to describe and simulate pipe–soil interactions, which helps to understand and analyze pipeline instability and rupture mechanisms [9,10]. For pipe–sand interactions in both unfrozen and frozen sand layers, stress calculation models for buried pipelines were established and validated against experimental data. Laboratory freezing experiments were conducted to study pipe–soil interactions under different cooling modes (constant cooling, linear cooling, and stepwise cooling), obtaining pipeline strain data under various cooling conditions, which provides references for the design of buried natural gas pipelines in cold regions [11,12,13]. Ding et al. [14] developed a laboratory test system for pipe–soil interaction, studying the deformation mechanisms and the distribution of surrounding pressure and additional axial stress along pipelines. They analyzed the effects of burial depth, soil cohesion, and internal friction angle on pipeline stress, providing references for integrity control of shallow-buried pipelines during settlement. Costa et al. [15] systematically analyzed the coupling behavior of soil arching effect and pipeline deformation under local settlement through physical models, providing key insights for the design of flexible pipelines. During pipeline failure processes caused by surface subsidence, conducting comprehensive field monitoring of stress and deformation along the entire pipeline section proves extremely challenging and cost-prohibitive. With continuous advancements in pipeline mechanical models, theoretical frameworks, and numerical simulation software, some researchers have employed finite element methods to investigate the nonlinear mechanical responses of buried pipelines to localized soil subsidence, focusing particularly on the influence of pipeline and soil parameters [16,17,18,19,20,21]. Extensive research has also been conducted on the responses of buried pipelines under different load conditions, covering not only seismic loads but also traffic movement loads, thereby providing a more comprehensive framework for pipeline stability assessment. Fadaee et al. [22] employed a three-dimensional finite element model to investigate the influence of reverse fault action on buried steel pipelines, revealing the significant impact of parameters such as sediment thickness, pipeline burial depth, and wall thickness on the pipeline failure mode, thus filling the gap in pipeline design in fault areas. Saboya Jr et al. [23] combined centrifuge tests and numerical simulations to investigate the mechanical behavior of buried pipelines in non-cohesive soil under mobile traffic loads, verified the conservation of the modified Spangler–Iowa formula, and provided experimental data support for the design optimization of shallow-buried pipelines. Alzabeebee et al. [24] adopted a fine three-dimensional finite element model verified by multiple sets of high-quality field data to systematically analyze the influence of key parameters such as truck speed and pipe stiffness on the maximum displacement of the pipe body, and clearly concluded the following: under static loads, the displacement of the pipeline is always greater than that under moving loads, and the ratio of static to dynamic displacement decreases with the increase in pipeline stiffness and slightly increases with the increase in truck speed. This research provides a solid theoretical basis for subsequent related analysis and design. It is recommended to adopt static load as the most unfavorable working condition, which not only ensures the safety margin but also has significant engineering application value due to its simpler analysis process and lower demand for computing resources. The above-mentioned research not only demonstrates the progress of international cooperation in the field of pipeline engineering, but also promotes the development of the stability assessment of buried pipelines from empirical to theoretical and refined. To effectively evaluate pipeline integrity in subsidence areas and ensure safe operation, Sarvanis et al. [25,26,27] investigated parameter variation patterns, including pipeline-limiting spans in subsidence zones, and established failure evaluation criteria, providing important technical references for pipeline maintenance. Bazaluk et al. [28] integrated surface deformation parameters and pipeline responses and proposed a pipeline safety assessment framework, while Peng and Luo et al. [29,30] emphasized the effectiveness of protective measures to reduce horizontal strain and vertical curvature of pipelines through case studies. The experimental strain analysis by Polak et al. [31] further quantified the performance of polyethylene pipes in horizontal directional drilling installations, revealing the significant influence of installation parameters (such as drilling fluid properties) on pipe behavior.
Previous studies have extensively investigated pipe–soil interactions and the mechanical responses and deformation patterns of gas pipelines under coordinated and uncoordinated deformations in subsidence areas. However, considering the impact of high-intensity coal seam mining on the integrity of surface shallow-buried pipelines in coal, oil, and gas superimposed basins, such problems exist in countries like China and the United States. Detailed research remains scarce regarding the loading and deformation characteristics of shallow-buried gas pipelines during high-intensity coal seam extraction in the Yushen mining area of Northwest China (where the surface consists of the Mu Us Desert and which vertically overlaps with the Daniudi Gas Field), particularly under varying angles between the pipeline orientation and the longwall face advance direction. In this context, this study focuses on the Xiaobaodang No. 2 Coal Mine within the Daniudi Gas Field of China’s Ordos Basin, where simultaneous coal and deep natural gas extraction occurs. Using ABAQUS nonlinear finite element analysis software (version 2021), we examined the deformation characteristics of both surface ground and gas pipelines under different mining parameters (including the advance rate, extraction height, and the angle between the pipeline and face advance direction). This study elucidates the spatiotemporal evolution patterns of mechanical loading and deformation in shallow-buried pipelines during high-intensity mining operations (considering both advance rate and extraction height) at various intersection angles with the advance direction and identifies critical hazard zones for pipeline integrity within surface subsidence basins resulting from high-intensity mining. This research contributes significantly to the accurate prediction of primary failure locations and timing for shallow-buried pipelines under high-intensity coal mining impacts, improved efficiency of pipeline integrity assessment in coal–gas co-mining areas, and optimization of working face advance rates and coal seam extraction heights. These advancements are crucial for ensuring safe, efficient, and coordinated simultaneous extraction of coal and gas resources.
2. Engineering Background
The Daniudi Gas Field (with depths > 2000 m) shows significant vertical overlap with the Jurassic coal seams (<800 m depth) in the upper mining area of the Xiaobaodang No. 2 Coal Mine (Figure 1). The oil/gas wells and pipelines distributed across the mining area feature a wide distribution, long service life, and substantial coal resources sterilized underneath, severely restricting panel succession and safe, efficient mine production. The initial mining Panel 13 is approaching completion, while the subsequent Panel 14 contains 27 shallow-buried gas pipelines totaling 30.11 km in length in its corresponding surface area. The ground surface is covered by approximately 18 m thick aeolian sand deposits [3]. In the current initial mining panels, the extracted longwall faces in the No. 2-2 coal seam average 2.5 m in thickness, with mining depths of 259.05–387.44 m, a 2° dip angle, and advance lengths > 4000 m. The working face utilizes the strike-oriented longwall fully mechanized mining method with complete roof caving, achieving advance rates of 10–20 m/d (average ~17 m/d), representing high-intensity mining operations in ultra-long faces of medium-depth coal seams (Table 1) [32,33].
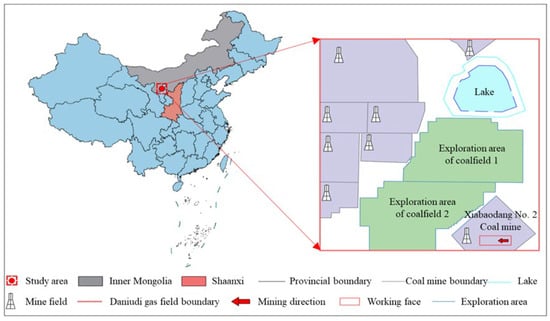
Figure 1.
Schematic diagram of the coal–gas co-mining area of the Daniudi gas field in the Ordos Basin [3].

Table 1.
Main reference indexes and factor characteristics of high-intensity longwall mining.
The 132201 working face in Panel 13 has a natural gas pipeline on the surface that intersects at 82° with the open-off cut and 8° with the gate road. The pipeline consists of 245N seamless steel pipe with 159 mm outer diameter, 5 mm wall thickness, and 1.8 m burial depth. As Panel 13’s first working face, it measures 300 m in width (subsequent faces were widened to 450 m) with an approximate 4000 m advance length. To properly evaluate high-intensity mining’s effects on surface and shallow-buried pipeline deformation at the 132201 face, two subsidence monitoring lines were installed along strike and dip directions above the working face for field measurement and an analysis of surface movement patterns caused by coal seam mining. Figure 2 illustrates the positional relationship between the 132201 working face and surface pipeline, along with the surface subsidence monitoring point arrangement. The dip monitoring line is located 500 m ahead of the face’s open-off cut, while the strike monitoring line follows the face’s centerline, with 20 m spacing between adjacent monitoring points. The working face has simple geological conditions. Using actual borehole data obtained near the surface pipeline, thinner rock layers were combined to produce the coal seam and rock stratum column diagram for the extraction area (Figure 3).
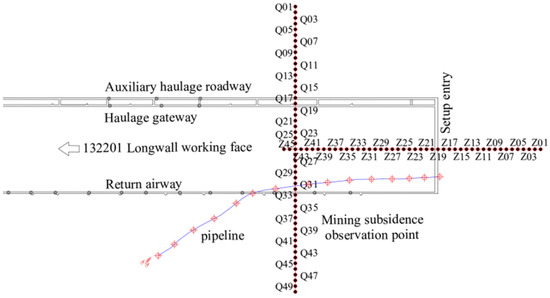
Figure 2.
Relationship between the coal LWWF, pipeline location, and layout of surface subsidence monitoring points [3].
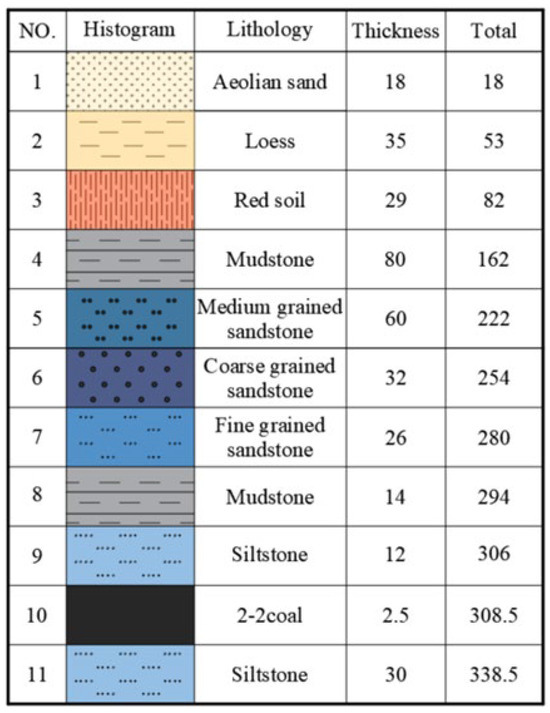
Figure 3.
Histogram of coal and rock strata [3].
3. Hazard Zoning of Gas Pipelines in Subsidence Areas
Based on field-collected surface subsidence data, the horizontal deformation, tilt, and curvature values of the ground surface caused by high-intensity mining at the 132201 longwall working face (LWWF) were calculated, with their corresponding curves shown in Figure 4. Following the industry standard Q/SY 05487-2017 “Technical Specifications for Safety Design and Protection of Oil and Gas Pipelines in Goaf Areas” issued by China National Petroleum Corporation (CNPC) [34], pipeline hazard zoning was performed according to the dynamic evolution of surface deformation indicators at different mining advance distances (Table 2). The hazard level of pipelines is determined when any one of the three surface deformation indicators (horizontal deformation, tilt, or curvature) reaches or exceeds the specified limit values.
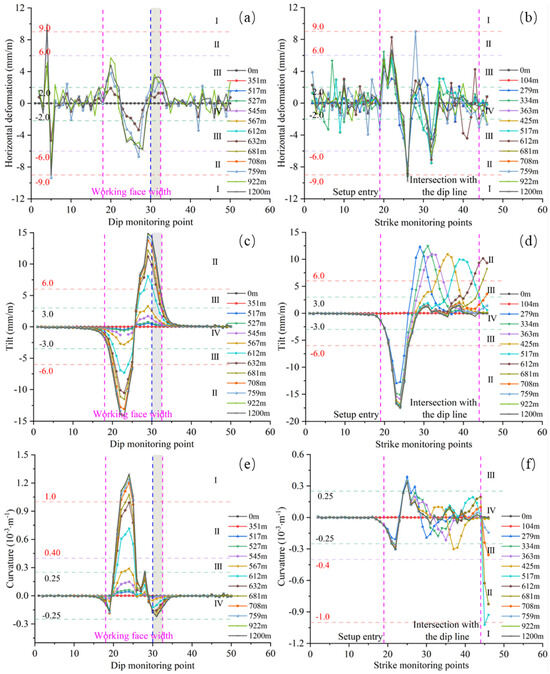
Figure 4.
The 132201 working face high-intensity mining surface inclination and trend: (a,b) horizontal deformation curve; (c,d) tilt curves; (e,f) curvature curves.
Table 2.
Classification of pipeline stability and danger degree in mining subsidence areas.
According to the pipeline hazard classification criteria in mining subsidence areas (Table 2), hazard zoning was conducted along the dip-direction monitoring line. The results demonstrate that surface curvature deformation had the greatest impact on pipelines within monitoring points Q21–Q25. During the face advance from 567 m to 1200 m, the pipeline hazard level in this section reached Grade II, escalating to Grade I when the advance distance exceeded 632 m, representing medium-to-high risk zones unsuitable for pipeline installation. Comparatively, in the Q20–Q32 monitoring range above the goaf area during mining advance beyond 612 m, surface tilt deformation exhibited a moderate influence on pipeline stability, reaching the Grade II hazard level (advance distance ≥ 612 m), while surface horizontal deformation showed a minimal impact, remaining predominantly Grade III (low hazard) except for localized Grade II zones near monitoring point Q27 at an approximately 759 m advance distance.
For the pipeline situated within the dip-oriented sector (Figure 2, monitoring points Q30–Q32), hazard evaluation was performed. This specific zone exhibited progressive intensification of both horizontal and curvature deformations with advancing excavation (as shown in the gray zones of Figure 4a,e), though their collective influence on pipeline stability proved comparatively minor. The horizontal deformation maintained a consistent Grade IV hazard classification until the working face reached the 632 m advancement mark. Subsequent progression to 1200 m elevated the horizontal deformation hazard to Grade III (designated as low risk). Contrastingly, tilt deformation demonstrated more substantial effects on pipeline integrity (Figure 4c). The tilt-related hazard persisted at Grade IV until 567 m of face advance, then systematically intensified to Grade II (moderate–high risk) during continued excavation to 1200 m. Surface curvature deformation manifested the least hazardous influence (Figure 4e), persistently remaining within Grade IV parameters throughout the complete excavation process. In summary, for the pipeline located in the dip-direction area (Figure 2, monitoring points Q30–Q32), the sensitivity of deformation impacts on pipeline integrity followed this order: tilt deformation > horizontal deformation > curvature deformation. Comprehensive hazard assessment confirmed that relative safety was exclusively maintained prior to the 567 m advancement threshold.
Regarding the three deformation indicators (tilt, horizontal, and curvature), the analysis reveals that only before the working face advance reaches 567 m (having passed 67 m beyond the pipeline location), an approximately 40 m wide surface zone along the goaf edge (corresponding to monitoring points Q18–Q20 and Q30–Q32) maintains relative safety for pipeline operation. Conversely, the central inclined section of the working face (monitoring points Q20–Q30) constitutes a hazardous deformation zone, with risk levels escalating from Class III (low risk) to Class II (moderate risk) or even Class I (high risk). Consequently, if it is necessary to lay shallow-buried pipelines within the goaf area on site, it is recommended to arrange the pipelines within 40 m from the haulage gateway and return airway to the inner side of the working face, which can significantly reduce the impact of mining on the stability of the pipelines.
The hazard zoning analysis conducted along the strike-direction monitoring line of the working face, based on surface horizontal deformation, tilt, and curvature measurements, demonstrated that pipeline impact became significantly more pronounced in the Z19–Z46 section after the working face advanced beyond 279 m. Within this zone, horizontal and tilt deformations exhibited a greater influence on pipeline integrity compared to curvature effects. The Z17–Z19 area at the subsidence basin boundary maintained a Grade IV hazard classification during working face extraction, constituting a relatively safe zone for pipeline operation. In contrast, the region outside the goaf area (Z1–Z19) showed that surface horizontal deformation exerted more substantial effects on pipeline integrity than either tilt or curvature deformations.
4. Numerical Simulation of Pipeline Loading and Deformation Characteristics Under Different Mining Parameters
4.1. Numerical Model Development
4.1.1. Model Construction and Fundamental Assumptions
Natural gas pipelines, as thin-shell structures, are susceptible to compressive, tensile, and bending deformations—potentially leading to structural failure—when subjected to non-uniform subsidence of overlying sandy soils in goaf areas. The development of residual stresses in pipe walls following deformation makes the application of superposition principles theoretically inappropriate for analyzing cumulative deformations when significant cross-sectional distortions occur [35,36]. This study employs ABAQUS finite element software to develop an integrated 3D continuum model that simultaneously accounts for surface pipeline networks and underground mining geometries. The model specifically investigates the nonlinear mechanical behavior of pipelines and their spatiotemporal deformation evolution patterns during high-intensity coal extraction operations. Based on the advancing speed of the working face in the 2-2 coal seam of Xiaobaodang No. 2 Coal Mine, the minable coal seam thickness, and the spatial relative position between surface pipelines and the coal mining face, three-dimensional mining models were established for different advancing speeds (10 m/d, 15 m/d, and 20 m/d), different mining thicknesses (2.5 m, 3.5 m, 5.5 m, and 7.5 m), and surface gas pipelines intersecting with the working face advancing direction at different angles (0°, 30°, 45°, 60°, and 90°). A total of three groups with 10 schemes were designed (Table 3). Among them, Scheme I-3 serves as the common case, participating in the comparison across all three groups of schemes.
Table 3.
Design of simulation scheme of pipeline stability influence study.
(1) Schemes I and II: Modeling the Effects of Advancing Speed and Mining Thickness on Pipeline Stability
Since the pipelines in both Scheme Group I and Scheme Group II were perpendicular to the working face advancing direction, with identical mesh division around the pipelines and consistent model dimensions—differing only in advancing length and mining thickness—the pipeline and coal seam mining 3D model from Scheme Group I is presented here as an example (Figure 5). The model measured 1400 m (L) × 850 m (W) × 338.5 m (H). The pipeline had an outer diameter of 159 mm, a wall thickness of 5 mm, a length of 850 m, and a burial depth of 1.8 m. To ensure the gas pipeline was located within the surface’s fully mined area, field subsidence monitoring data from Panel 132201 showed that the strike observation line should be positioned 500 m ahead of the setup entry (Figure 2). When the 300 m wide working face advanced to 700 m, the surface along the strike observation line reached full subsidence [3]. The adjacent Panel 14 in the field was expanded to 450 m in width, which also achieved full subsidence. To make the research results more applicable and valuable for reference to subsequent 450 m wide working faces, the model adopted a working face width of 450 m. In the model, the pipeline was placed 500 m from the setup entry and perpendicular (90°) to the direction of the working face advancement. The model simulated an advancement distance of 1000 m along the strike (length direction), exceeding the 700 m required for full subsidence development.
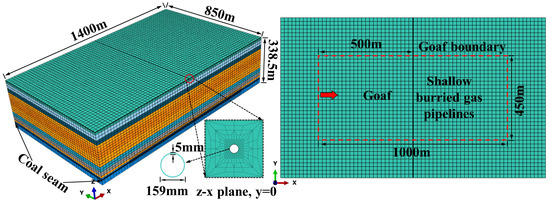
Figure 5.
Model construction of simulation schemes with different advancing speeds and mining thicknesses.
Given the large model dimensions and computational considerations, extensive numerical testing led to the adoption of a transition mesh scheme, with particular refinement applied to the coal seam excavation zone and critical study areas, including the pipeline and surrounding soil matrix. The rock strata and coal seams adopt eight-node linear subtractive integral solid elements (C3D8R), with the grid refined to 5 m to accurately capture the stress distribution of the rock strata. The pipelines adopt four-node subtractive integral shell elements (S4R), dividing 32 grid elements along the pipe circumference and refining the grid along the pipeline axis to approximately 10 m to precisely analyze the nonlinear deformation of the pipelines and sand under settlement. The soil grid within a range of three times the diameter around the pipeline is densified, with a size of approximately 20 mm. The pipe–soil interaction was simulated using a master–slave contact algorithm, where the pipeline elements were deliberately sized larger than the surrounding soil elements to ensure proper numerical contact [37]. Boundary conditions were implemented as follows: horizontal displacement constraints were applied to the lateral boundaries, full horizontal and vertical displacement constraints were specified at the base, and the top surface was left unconstrained as a free boundary. To mitigate boundary effects, protective coal pillars measuring 200 m in width were strategically placed in three locations: behind the active working face, ahead of the stopping line, and along both sides of the longwall panel.
(2) Scheme Group III: Modeling the Influence of Pipeline Orientation Angles Relative to the Advancing Direction on Pipeline Stability
The model dimensions, soil parameters, boundary conditions, and element types were maintained identical to those described previously. Three-dimensional models were constructed with pipeline orientations of 0°, 30°, 45°, 60°, and 90° relative to the working face advance direction, where the 90° orientation model represents Scheme I-3. For the remaining schemes featuring non-perpendicular pipeline orientations, random mesh generation was implemented with localized mesh refinement around the pipeline periphery (Figure 6).
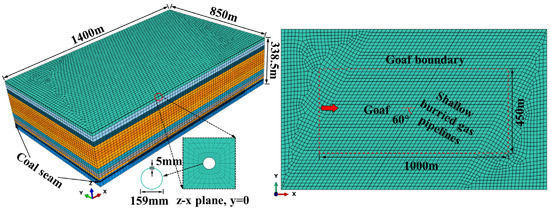
Figure 6.
Model construction of simulation schemes with different angles from the advancing direction of the working face (taking simulation scheme III-4 with a 60° angle to the working face advance direction as an example).
To investigate the loading and deformation characteristics of pipelines interacting with sandy soil in mining subsidence areas, the following fundamental assumptions were adopted for the established numerical model [16]:
(1) The mechanical properties of the pipeline remain unaffected by temperature and time, excluding considerations of creep and relaxation;
(2) Pipeline joints and wall corrosion are not incorporated in the finite element model;
(3) All rock strata in the model are treated as homogeneous formations;
(4) The pipe–soil interaction is defined as finite sliding contact.
4.1.2. Model Validation and Parameter Determination
Based on the measured surface subsidence data from high-intensity mining in Panel 132201, Figure 7 presents a comparison between field-measured and numerically simulated subsidence profiles along the strike direction. The measured strike subsidence profile showed a maximum subsidence value of 1.613 m. Using the same surface monitoring point arrangement as the subsidence observation lines in Panel 132201, the numerical simulation yielded a maximum strike subsidence of 1.54 m. The simulated subsidence curve exhibited good agreement with field measurements in overall trend, with the maximum subsidence value differing by only 4.53% from the measured result. These findings confirm the reliability of the established finite element model in accurately representing surface movement and deformation caused by high-intensity mining. Through this model validation process, the physical and mechanical parameters of various rock strata and the pipeline were determined (Table 4) and subsequently applied to the 450 m wide panel mining model in this study.
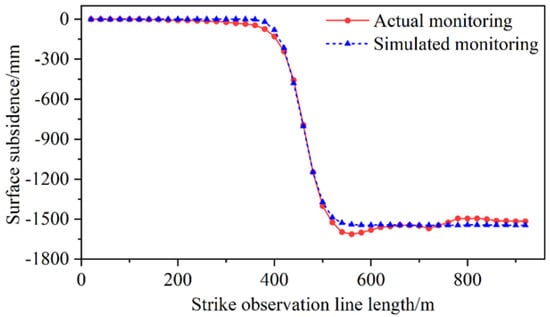
Figure 7.
Comparison and verification of strike settlement curve between full mining.
Table 4.
Physical and mechanical parameters of strata and pipeline.
4.2. The Influence of Working Face Advance Rate on Pipeline Loading and Deformation
4.2.1. Loading Characteristics of Shallowly Buried Pipelines
In mining subsidence areas, the deformation and failure of steel pipelines predominantly occur as post-yielding failures. According to the fourth strength theory (Von Mises yield criterion), the Von Mises stress (hereinafter referred to as Mises stress) is commonly adopted as the failure criterion [38,39]. The Mises stress is calculated based on the three principal stress components:
where σ is the Von Mises stress; σ1, σ2, and σ3 denote the first, second, and third principal stresses, respectively.
The shallow-buried gas pipeline utilizes seamless steel pipes of Grade 245N, a standard material specification for oil and gas transmission. As stipulated by GB/T 9711-2023 “Petroleum and natural gas industries—Steel pipes for pipeline transportation systems” (Chinese National Standard) [40], Grade 245N steel has a specified maximum yield strength of 450 MPa and a maximum tensile strength of 655 MPa. In structural applications of steel materials, the Von Mises stress must not be used for the yield strength threshold. Considering the fundamental modeling simplifications previously assumed for both the geological strata and pipeline in the numerical simulation, which may introduce discrepancies from actual physical responses, a safety reduction factor is incorporated into the Von Mises stress evaluation: 70% of the maximum yield strength of the pipe (315 MPa). Therefore, the allowable stress threshold for pipeline integrity control is set at 315 MPa. When the detected stress exceeds this threshold, it is determined that the pipeline has entered a yield failure state.
Figure 8, Figure 9 and Figure 10 present distinct spatiotemporal variations in Von Mises stress evolution of shallow-buried pipelines under different advance rates (10/15/20 m/d). The bending strain of the pipeline in a surface subsidence basin is indirectly reflected through its axial stress distribution. As shown in Figure 8, Figure 9 and Figure 10, the high-stress area corresponds to the location with a larger bending curvature, and its spatial distribution shows a characteristic “W shape”, reflecting the degree of pipeline bending deformation induced by uneven surface settlement. Stress concentrations primarily occur in central zones (peak 488.6 MPa at 15 m/d) and goaf boundaries (peak 88.3 MPa), with central stresses at 15 m/d exceeding those at 10 m/d and 20 m/d by 32.7% and 35.8% respectively. The evolutionary process demonstrates initial disturbance of 85.3 MPa during the pre-mining influence zone (240 m); stress increase to 88.3 MPa during face–pipeline alignment (500–520 m); peak stress of 488.6 MPa, triggering yielding during active subsidence (720 m); and 22.4% stress reduction post-full subsidence (800 m), indicating notable stress recovery.
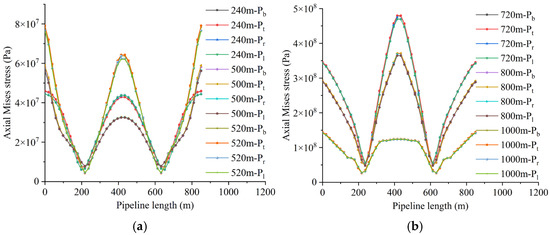
Figure 8.
Mises stress evolution along the pipeline axis at different advancing distances of the working face at 10 m/d. (a) Advance to 240 m, 500 m, and 520 m. (b) Advance to 720 m, 800 m, and 1000 m.
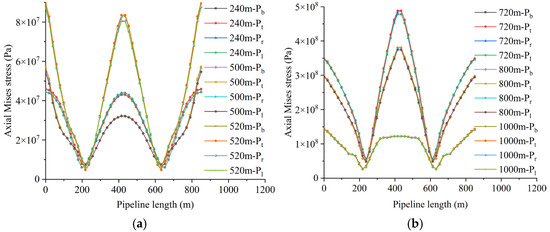
Figure 9.
Mises stress evolution along the pipeline with different advancing distances at the working face at a speed of 15 m/d. (a) Advance to 240 m, 500 m, and 520 m. (b) Advance to 720 m, 800 m, and 1000 m.
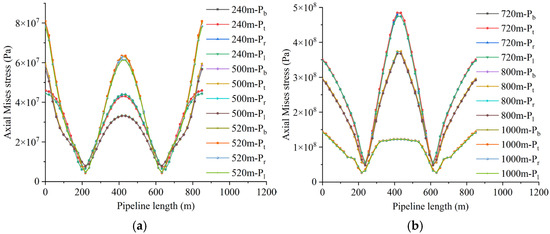
Figure 10.
Mises stress evolution along the pipeline with different advancing distances at the working face at a speed of 20 m/d. (a) Advance to 240 m, 500 m, and 520 m. (b) Advance to 720 m, 800 m, and 1000 m.
Analysis of the Von Mises stress evolution along the pipeline axis at various advancement distances (Figure 10) revealed a distinctive “W”-shaped distribution pattern, leading to the establishment of five monitoring cross-sections (Figure 11) comprising a central section at the subsidence zone core and symmetrically arranged sections in both the compressive inner margin and tensile outer margin of the displacement basin. Continuous monitoring of field variables at solid element centroids throughout the extraction cycle was conducted, with the pipeline’s orthogonal 90° orientation to the advancement direction creating axisymmetric stress distribution that produced identical evolution curves for corresponding inner and outer edge sections on both pipeline sides, all maintaining stresses below the 315 MPa safety threshold (70% of yield strength) during the entire mining cycle. In the central section, stress analysis showed that at a 10 m/d advancement rate, the 450 MPa critical zone spanned 710–768 m (between red lines in Figure 11), while the 315 MPa warning zone extended from 640 to 840 m (between blue lines); at 15 m/d, these zones ranged 708–775 m and 640–848 m, respectively; and at 20 m/d, they covered 718–780 m and 645–850 m, demonstrating consistent stress concentration patterns that varied systematically with advancement speed while maintaining similar spatial distributions relative to the reference markers in Figure 11.
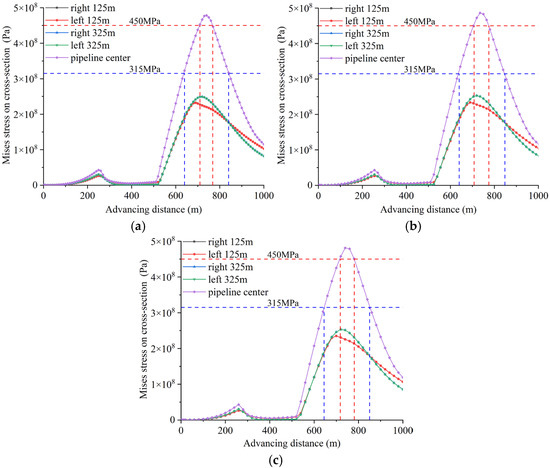
Figure 11.
Mises stress evolution at the inner edge, outer edge, and central section of the basin at different advancing speeds. (a) The advancement speed is 10 m/d. (b) The advancement speed is 15 m/d. (c) The advancement speed is 20 m/d.
To identify yield-prone orientations along the pipeline circumference, Von Mises stress evolution data were extracted clockwise at eight azimuthal positions (0°, 45°, 90°, 135°, 180°, 225°, 270°, and 315°) on the central cross-section relative to the working face advancement direction under different advancement rates (Figure 12). The analysis revealed a consistent yielding sequence across all advancement speeds, with the highest susceptibility occurring at 45° and 135° orientations, followed by 225°, 180°, 315°, and 270°, while 0° and 90° positions exhibited the greatest yield resistance.
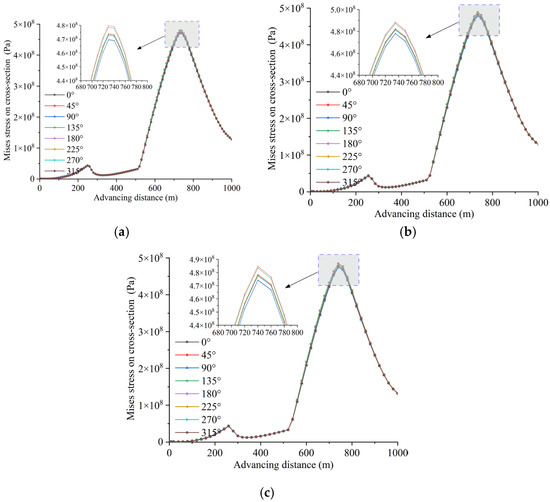
Figure 12.
Mises stress evolution at various azimuths of the central section of the basin at different advancing speeds. (a) The advancement speed is 10 m/d. (b) The advancement speed is 15 m/d. (c) The advancement speed is 20 m/d.
4.2.2. Settlement Deformation Characteristics of Pipeline and Surface Sandy Soil
To systematically investigate the influence of different advancement rates (10 m/d, 15 m/d, and 20 m/d) on surface and pipeline settlement deformation, spatiotemporal evolution cloud diagrams were generated to visualize the relationship between surface subsidence and pipeline position at various working face advancement distances (Figure 13). The analysis revealed consistent settlement patterns between the 15 m/d and 20 m/d cases, prompting a detailed examination of the representative 10 m/d scenario. Initial surface settlement became evident at 100 m of advancement, though the pipeline remained unaffected at this stage. Building upon the pipeline loading characteristics established in Section 4.2.1, the progressive impact of mining advancement was observed through several critical stages: the initial pipeline influence commenced at 240 m advancement, followed by the working face reaching directly beneath the pipeline at 500 m. Full mining subsidence conditions were achieved at the pipeline location by 800 m advancement, with subsequent progression to 1000 m resulting in super-full mining conditions developing in the central pipeline region.
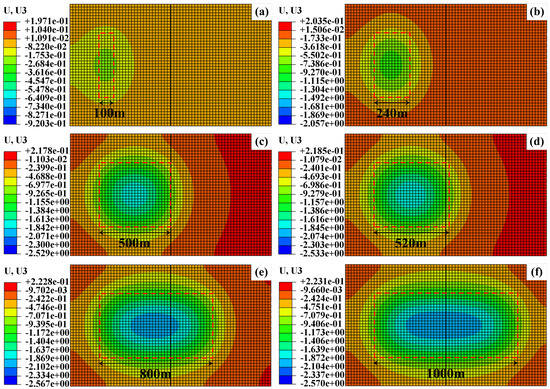
Figure 13.
Advancement speed of 10 m/d—cloud picture of the relationship between ground settlement and pipeline spatial position with advancing working face. (a) Advance distance: 100 m. (b) Advance distance: 240 m. (c) Advance distance: 500 m. (d) Advance distance: 520 m. (e) Advance distance: 800 m. (f) Advance distance: 1000 m.
According to the analysis in Section 4.2.1, the maximum Mises stress occurs in the central region of the pipeline. To investigate the deformation characteristics of the pipeline’s central zone and the surrounding sandy soil throughout the mining cycle, the COPEN function in ABAQUS was used to extract the separation displacement between the pipeline and the sandy soil. The evolution of deformation between the pipeline and the sandy soil under different advancement rates is illustrated in Figure 14. Each subfigure in the diagram (from left to right) shows the legend of pipeline–soil separation at different mining distances, a cross-section of the maximum separation zone, and a magnified view of the maximum separation zone (with a deformation scaling factor of 10). The deformation patterns for daily advancement rates of 15 m/day and 20 m/day are consistent with those at 10 m/day, so the analysis focuses on the case of 10 m/day.
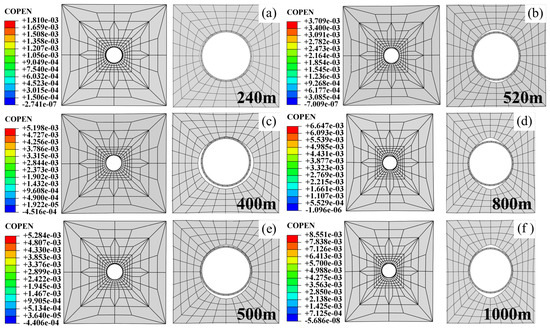
Figure 14.
Advancement speed of 10 m/d—the pipe is separated from the sand body around the pipe with the advancing face. (a) Advance distance: 240 m. (b) Advance distance: 520 m. (c) Advance distance: 400 m. (d) Advance distance: 800 m. (e) Advance distance: 500 m. (f) Advance distance: 1000 m.
When the working face advances to 240 m, the forward influence zone reaches the pipeline. Due to surface subsidence, a separation displacement of 1.8 mm occurs on both sides of the pipeline under compressive stress. As the working face advances to 400 m, with a normal distance of 100 m from the pipeline, the separation between the pipeline and the sandy soil increases to 5.2 mm. Owing to the differences in mechanical properties between the pipeline and the sandy soil, the subsidence of the soil beneath the pipeline becomes significantly greater than that of the pipeline itself. When the working face reaches 500 m, directly beneath the pipeline, the sandy soil at the pipeline location shifts noticeably toward the goaf (mined-out area), and the separation on both sides of the pipeline is compacted. At this stage, the maximum separation displacement (5.28 mm) occurs beneath the pipeline. When the working face advanced to 520 m (20 m past the pipeline), significant surface subsidence occurred at the pipeline location, reducing the pipe–soil separation to 3.71 mm while creating pronounced detachment at the pipeline crown. The surrounding soil’s substantial movement toward the goaf formed a distinctive “soil arch” structure above the pipeline due to lateral compression forces. By 800 m of advancement, maximum separation reached 6.64 mm, with evident soil deformation around the pipe induced by ground movement. At 1000 m of advancement, peak separation of 8.55 mm developed beneath the pipeline, while 15 m/d and 20 m/d advancement rates produced marginally greater maximum separations of 8.67 mm and 8.69 mm, respectively.
In summary, the non-synergistic deformation between the pipeline and surrounding soil during working face advancement exhibits a characteristic “two-phase, three-pattern” behavior: the initial phase occurs before the working face passes the pipeline location, while the subsequent phase develops after the face surpasses this position, manifesting three distinct deformation modes—initial separation occurring exclusively along both pipeline flanks, followed by compaction of these lateral separations coupled with emerging detachment beneath the pipeline, and ultimately, the compaction of lateral separations accompanied by simultaneous detachment at both the crown and base of the pipeline.
4.3. Effect of Mining Height on Pipeline Loading and Deformation
4.3.1. Load-Bearing Characteristics of Shallow-Buried Pipelines
Figure 15, Figure 16 and Figure 17, respectively, illustrate the evolution of Mises stress at the pipeline’s bottom (Pb), top (Pt), left side (Pr), and right side (Pl) along the axial direction under different advancement distances when the mining thickness is 3.5 m, 5.5 m, and 7.5 m. The results reveal only minor variations across these four measurement positions, with differences primarily concentrated in the pipeline’s central region and the outer boundary of the goaf.
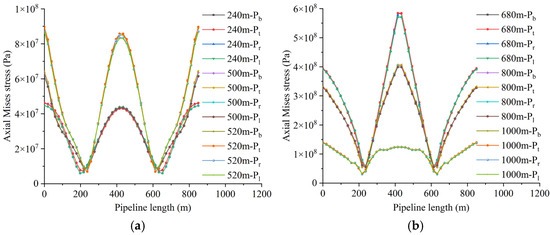
Figure 15.
Mises stress evolution along the pipeline at different advancement distances from the face with a mining thickness of 3.5 m. (a) Advance to 240 m, 500 m, and 520 m. (b) Advancement to 680 m, 800 m, and 1000 m.
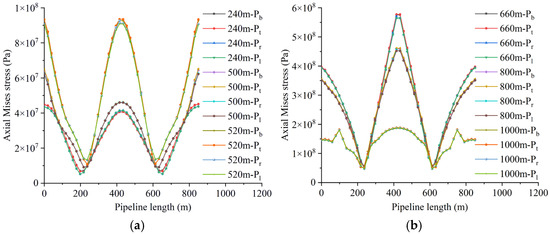
Figure 16.
Mises stress evolution along the pipeline at different advancement distances from the face with a mining thickness of 5.5 m. (a) Advancement to 240 m, 500 m, and 520 m. (b) Advancement to 660 m, 800 m, and 1000 m.
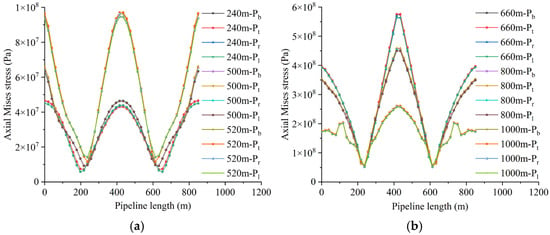
Figure 17.
Evolution of Mises stress along the pipeline axis at different advancement distances from the working face with a mining thickness of 7.5 m. (a) Advancement to 240 m, 500 m, and 520 m. (b) Advancement to 660 m, 800 m, and 1000 m.
The evolution patterns of pipeline Mises stress remain fundamentally consistent across different mining thicknesses and advancement rates. When the mining thickness reaches 3.5 m, 5.5 m, and 7.5 m, respectively, the maximum Mises stress values during the entire extraction cycle occur in the pipeline’s central region at working face advancement distances of 680 m, 660 m, and 660 m, measuring 577 MPa, 578.6 MPa, and 585.6 MPa, correspondingly (Figure 15, Figure 16 and Figure 17).
The analysis confirms the persistence of the characteristic “W”-shaped Von Mises stress distribution. Given the pipeline’s orthogonal 90° orientation to the advancement direction, which generates symmetrical stress patterns around the pipeline centerline, our investigation focused on three critical cross-sections, as established in Section 4.2.1: the central pipeline section and the inner/outer margin sections from one side. Figure 18 illustrates the stress evolution in these zones (inner margin, outer margin, and central region) under mining thicknesses of 3.5 m, 5.5 m, and 7.5 m. Throughout the extraction cycle, Von Mises stresses in both inner and outer margin sections remained below the 315 MPa threshold, while Table 5 documents the initiation/termination distances of both 315 MPa and 450 MPa critical zones for the central pipeline section across the studied mining thicknesses.
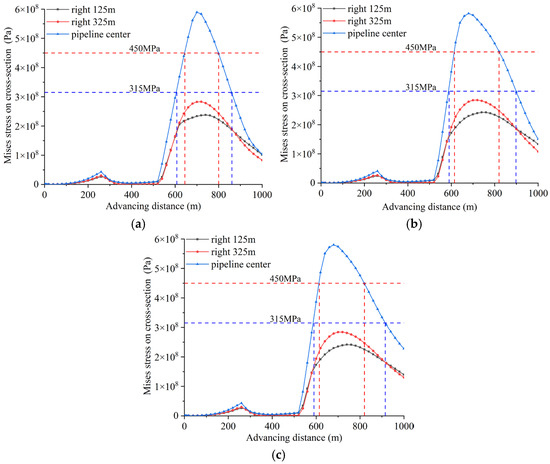
Figure 18.
Mises stress evolution at the inner edge, outer edge, and central section of the basin with different mining thicknesses. (a) The mining thickness is 3.5 m. (b) The mining thickness is 5.5 m. (c) The mining thickness is 7.5 m.
Table 5.
Danger zones at central pipeline section for different mining thicknesses.
The analysis focused on the pipeline’s central section, where Von Mises stresses peak, to identify circumferential yield-prone orientations. Stress evolution data were extracted clockwise along eight azimuths (0°, 45°, 90°, 135°, 180°, 225°, 270°, and 315°) relative to the working face advancement direction for different mining thicknesses (Figure 19). Results demonstrate consistent yield initiation sequences across all mining thicknesses and advancement rates: the most vulnerable orientations were 45° and 135°, followed by 225°, 180°, 315°, and 270°, with 0° and 90° exhibiting the highest yield resistance.
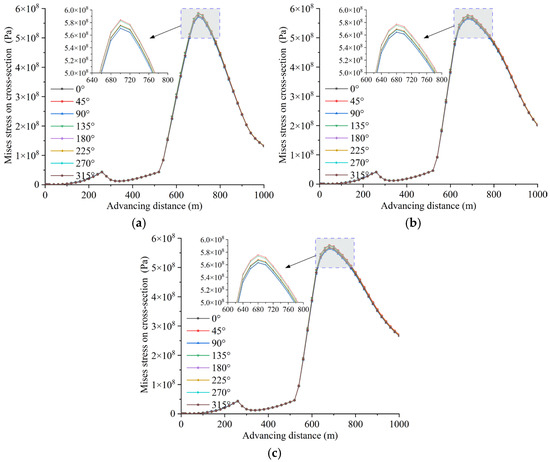
Figure 19.
Mises stress evolution at various azimuth angles of the central section of the basin with different mining thicknesses. (a) The mining thickness is 3.5 m. (b) The mining thickness is 5.5 m. (c) The mining thickness is 7.5 m.
4.3.2. Subsidence Deformation Characteristics of Pipeline–Soil Systems
The pipeline–sandy soil separation patterns under different mining thicknesses (3.5 m, 5.5 m, and 7.5 m) are, respectively, illustrated in Figure 20, Figure 21 and Figure 22, all demonstrating conformity with the previously established “two-stage, three-pattern” characteristic of non-coordinated deformation. During the first stage, when the working face approaches but has not yet passed the pipeline location, initial separation emerges along both sides of the pipeline upon reaching 240 m of advancement, with the separation magnitude showing a slight but consistent increase corresponding to greater mining thicknesses. As advancement progresses to 500 m, the combined effects of soil movement and compressive deformation cause gradual closure of the side separations while simultaneously inducing maximum separation development beneath the pipeline bottom. Quantitative analysis reveals that this bottom separation displays distinct mining thickness dependency, measuring 5.23 mm for 2.5 m (Case I-3), 6.35 mm for 3.5 m, 6.95 mm for 5.5 m, and 7.05 mm for 7.5 m mining thicknesses, respectively, demonstrating a clear positive correlation between the separation magnitude and extraction height.
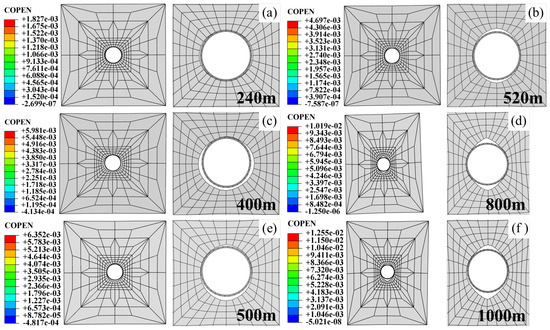
Figure 20.
Mining thickness of 3.5 m—the pipe is separated from the sand body around the pipe with the advancement of the working face. (a) Advance distance: 240 m. (b) Advance distance: 520 m. (c) Advance distance: 400 m. (d) Advance distance: 800 m. (e) Advance distance: 500 m. (f) Advance distance: 1000 m.
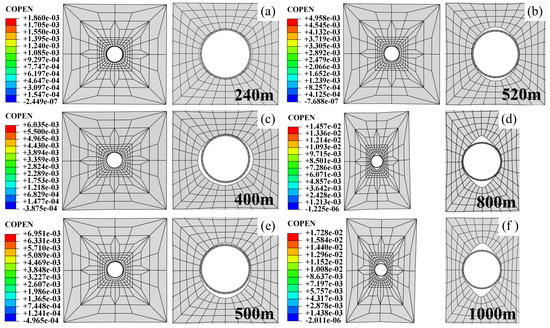
Figure 21.
Mining thickness of 5.5 m—the pipe is separated from the sand body around the pipe with the advancement of the working face. (a) Advance distance: 240 m. (b) Advance distance: 520 m. (c) Advance distance: 400 m. (d) Advance distance: 800 m. (e) Advance distance: 500 m. (f) Advance distance: 1000 m.
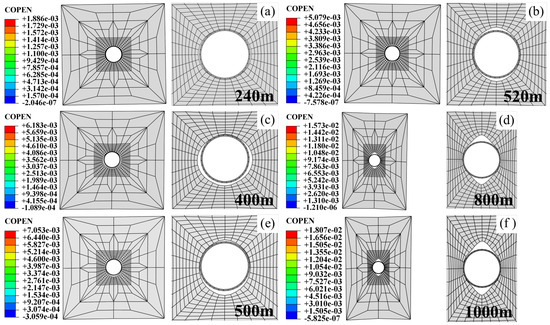
Figure 22.
Mining thickness of 7.5 m—the pipe is separated from the sand body around the pipe with the advancement of the working face. (a) Advance distance: 240 m. (b) Advance distance: 520 m. (c) Advance distance: 400 m. (d) Advance distance: 800 m. (e) Advance distance: 500 m. (f) Advance distance: 1000 m.
During the second phase, when the working face advanced past the pipeline location (520 m), the formation of a goaf directly beneath the pipeline caused surrounding soil to deform toward the excavated area, accelerating pipeline deformation rates under combined soil pressure and gravitational loading. This resulted in complete compaction of lateral separations while initiating new detachments at both the pipeline crown and base, though with limited magnitudes of 3.76 mm, 4.69 mm, 4.96 mm, and 5.08 mm for mining thicknesses of 2.5 m, 3.5 m, 5.5 m, and 7.5 m, respectively, at the pipeline base. When the working face advanced to 800 m and 1000 m, the pipeline location reached full mining-induced subsidence conditions, with its central zone positioned directly above the goaf center. During surface subsidence, the sandy soil mass converged toward the goaf center, inducing severe deformation of the surrounding soil that progressively intensified with greater mining thickness. Ultimately, this process generated simultaneous separation at both the pipeline crown and base, accompanied by the development of distinct soil arching phenomena. Final maximum separation values at 1000 m advancement reached 8.69 mm, 12.55 mm, 17.28 mm, and 18.07 mm for the respective 2.5 m, 3.5 m, 5.5 m, and 7.5 m mining thicknesses, demonstrating clear thickness-dependent deformation scaling.
4.4. Influence of Varied Angles Between Advancement Direction and Pipeline Axis on Pipeline Loading and Deformation Behavior
4.4.1. Mechanical Response Characteristics of Shallow-Buried Pipelines
When the advancement direction of the working face forms different angles with the axial direction of the pipeline, the layout position and length of the pipeline in the surface subsidence basin are different, resulting in different loading characteristics of the pipeline during the surface subsidence process. To clarify the force evolution law of the pipeline at different angles as the working face advances, relevant numerical simulation studies have been carried out. Due to space limitations, this section exclusively analyzes the evolution characteristics of Mises stress as the pipeline failure criterion. Figure 23 demonstrates the distribution and evolution of axial Mises stress when the pipeline is oriented at 0°, 30°, 45°, 60°, and 90° relative to the working face advancement direction. ABAQUS post-processing analysis of Mises stresses at four measurement positions (bottom, top, right, and left) under different angular conditions revealed negligible variations; thus, this study focuses specifically on the top surface Mises stress. Stress data were extracted at key advancement milestones (200 m, 400 m, 600 m, 800 m, and 1000 m) along the pipeline axis, including the peak Mises stress observed during the complete extraction cycle. Due to varying intersection angles with the working face advance direction, pipelines of different total lengths experience extended mining influence periods. Consequently, the axial Von Mises stresses along the pipeline are significantly greater than those observed under different advance rates or mining thickness conditions. Particularly when the pipeline is aligned parallel to the advance direction (0° intersection angle), the maximum Von Mises stresses at various advance distances approach or exceed the pipe’s yield strength of 450 MPa.
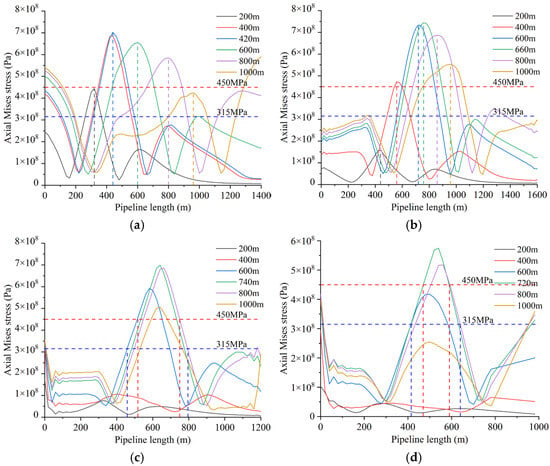
Figure 23.
Mises stress evolution along the pipeline axis at different angles from the mining direction of the working face. (a) Angle = 0°. (b) Angle = 30°. (c) Angle = 45°. (d) Angle = 60°.
When the pipeline is aligned parallel to the working face advancement direction (0° intersection angle), the maximum Mises stress of 703 MPa during the entire extraction cycle occurs at the 440 m axial position when the face advances to 420 m. At a 30° intersection angle, this peak stress increases to 744.3 MPa, occurring at the 758 m axial position when the face reaches 660 m of advancement. For the 45° configuration, the maximum cyclic Mises stress of 690.9 MPa emerges at the 641 m axial position upon 740 m of face advancement, demonstrating the progressive concentration of peak stresses toward the pipeline’s central region as the intersection angle increases. The stress analysis reveals distinct danger zones during specific advancement intervals: for the 450 MPa critical zone (demarcated by red lines in Figure 23c), the hazardous range spans from 517 m to 750 m of face advancement, while the 315 MPa warning zone (between blue lines in Figure 23c) extends from 458 m to 795 m. At a 60° intersection angle configuration, the peak Mises stress of 574.4 MPa during the complete extraction cycle occurs at the pipeline’s 540 m axial position when the face advances to 720 m, with corresponding danger zones narrowing to 470–590 m (450 MPa threshold) and 415–640 m (315 MPa threshold). The 90° orientation exhibits optimal stress distribution, generating a maximum cyclic stress of 486 MPa at the 415 m axial position upon 720 m advancement, where both danger zones reach their minimum extents—a mere 62 m span (718–780 m) for the 450 MPa zone and 205 m range (645–850 m) for the 315 MPa zone.
The comprehensive analysis demonstrates that as the intersection angle between the pipeline and working face advancement direction increases, the required advancement distance to generate the maximum Mises stress during the entire extraction cycle becomes progressively longer, eventually stabilizing at 60° and 90° orientations. The axial location of peak Mises stress along the pipeline gradually shifts toward the central region with increasing intersection angles. For angles ≥45°, both the initiation and termination distances of the 315 MPa danger zone and 450 MPa danger zone exhibit progressive reduction as the angle enlarges. The most favorable condition occurs at 90° orientation, where the danger zones reach their minimum extents of 205 m (315 MPa zone) and 62 m (450 MPa zone), respectively.
As the intersection angle increases, the axial location of maximum Von Mises stress progressively shifts toward the central pipeline region. Based on the characteristic stress distribution patterns along the pipeline axis at different angles, five monitoring sections were selected for 0° and 30° configurations (the central section plus symmetrically distributed sections at ±100 m and ±200 m intervals), while three sections were chosen for 45° and 60° cases (central section with ±100 m intervals), where negative sections denote positions toward the initially mined goaf side and positive sections toward the subsequently mined direction. Figure 24 illustrates the evolution of Von Mises stress at these sections versus working face advancement distance. For the parallel alignment (0° angle), the peak stresses at all sections gradually decreased during face advancement, consistent with the axial stress distribution pattern shown in Figure 23a. This attenuation occurs because post-full subsidence conditions generate more gradual surface settlement rates and deformation magnitudes compared to the initial active subsidence phase, with the absolute maximum stress of 684.2 MPa occurring at the −200 m section when the face advanced to 520 m. As the intersection angle approaches 90°, the maximum Mises stress progressively shifts toward the pipeline’s central region (0 m cross-section). Across all angular configurations, nearly every pipeline cross-section exceeds 315 MPa Mises stress during the extraction cycle, with the sole exception being the −100 m axial cross-section at a 60° orientation, which shows a peak value of 263.7 MPa. This stress distribution pattern reveals distinct danger zones: for 0° and 30° orientations, a 200 m bilateral expansion from the pipeline center remains critical; at 45°, this hazardous range reduces to 100 m bilateral expansion; while at 60°, potential risk concentrates near the central region around the −100 m cross-section. These findings demonstrate an inverse relationship between intersection angle and danger zone magnitude—smaller angles correspond to larger areas of mining-induced failure risk. Furthermore, when angles exceed 45°, negative cross-sections (upstream positions) develop lower stress peaks than positive sections (downstream positions). The 90° configuration exhibits perfect stress symmetry, with identical peak stresses occurring at mirrored ±100 m cross-sections.
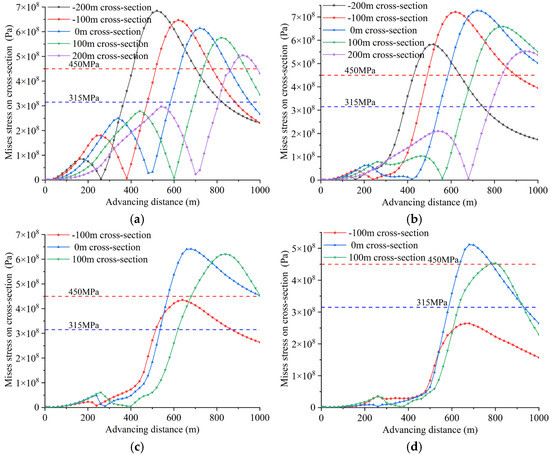
Figure 24.
Mises stress evolution of pipeline section with different angles from the working face. (a) Angle = 0°. (b) Angle = 30°. (c) Angle = 45°. (d) Angle = 60°.
Von Mises stresses were extracted clockwise at eight azimuthal positions (0°, 45°, 90°, 135°, 180°, 225°, 270°, and 315°) of the pipeline’s central cross-section relative to the working face advancement direction, as illustrated in Figure 25. Given the elliptical subsidence profile characteristic of longwall mining, the temporal sequence of yielding initiation varied significantly across different pipeline–face intersection angles. The 0° and 90° configurations exhibited identical yield-prone orientations at 45° and 135°. The 30° and 60° angled pipelines, being symmetrically arranged about the 45° axis, shared primary yielding orientations at 45° and 315°. The 45° intersection represented a special case where, upon reaching approximately 500 m of face advancement, the 180°, 270°, and 315° orientations demonstrated accelerated stress escalation and consequently yielded sequentially due to enhanced mining-induced effects, followed by the 45°, 0°, and 90° positions, and finally 135° and 225°.
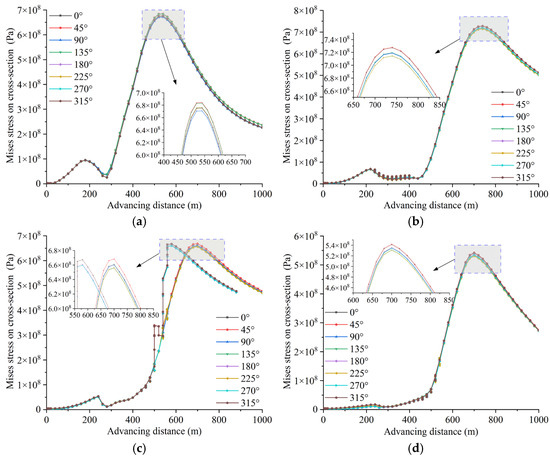
Figure 25.
Mises stress evolution at various azimuth angles in the central section of pipeline with different angles from the working face. (a) Angle = 0°. (b) Angle = 30°. (c) Angle = 45°. (d) Angle = 60°.
4.4.2. Settlement Deformation Characteristics of Pipeline-Soil System
The study extracted cloud diagrams (Figure 26, Figure 27, Figure 28, Figure 29 and Figure 30) showing surface subsidence and pipeline positions at key advancement distances (200 m, 400 m, 600 m, 800 m, and 1000 m), along with maximum Mises stress distributions under various intersection angles. At a 0° alignment, the pipeline remains entirely within the subsidence basin throughout, exhibiting severe stress concentration and reaching peak stress at the shortest advancement distance (420 m) among all angular configurations. The 30° orientation shows near-maximum surface subsidence by 600 m advancement, with pipeline loading reaching 733.7 MPa, ultimately peaking at 660 m. Similarly, for 45°, the surrounding soil achieves near-complete settlement by 600 m, while maximum stress (690.9 MPa) occurs at 740 m. Comparative analysis of 60° versus 45° configurations through subsidence cloud patterns reveals reduced pipeline impact at 600 m advancement for the steeper angle, with stress peaking at 720 m. Both 60° and 90° orientations reach maximum loading at 720 m (574.4 MPa and 484.8 MPa, respectively), but the 60° pipeline traverses a longer length of the subsidence zone, resulting in a greater length affected by mining, with a significantly larger difference in the peak loading values.
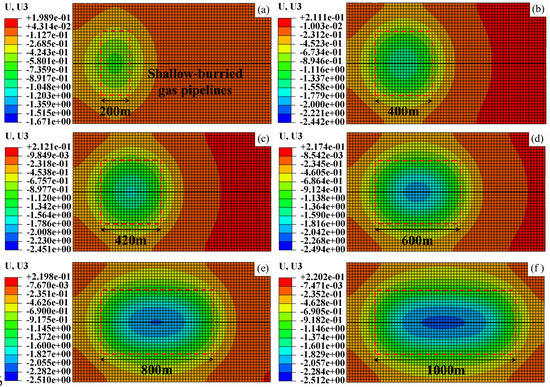
Figure 26.
Relation between the ground settlement and the relative position of the pipeline with an angle of 0° from the propulsion direction. (a) Advance distance: 200 m. (b) Advance distance: 400 m. (c) Advance distance: 420 m. (d) Advance distance: 600 m. (e) Advance distance: 800 m. (f) Advance distance: 1000 m.
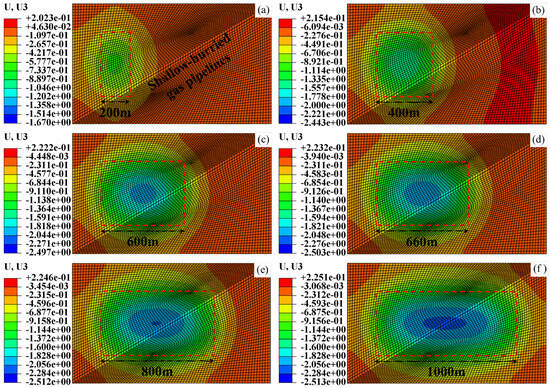
Figure 27.
Relation between the ground settlement and the relative position of the pipeline with an angle of 30° from the propulsion direction. (a) Advance distance: 200 m. (b) Advance distance: 400 m. (c) Advance distance: 600 m. (d) Advance distance: 660 m. (e) Advance distance: 800 m. (f) Advance distance: 1000 m.
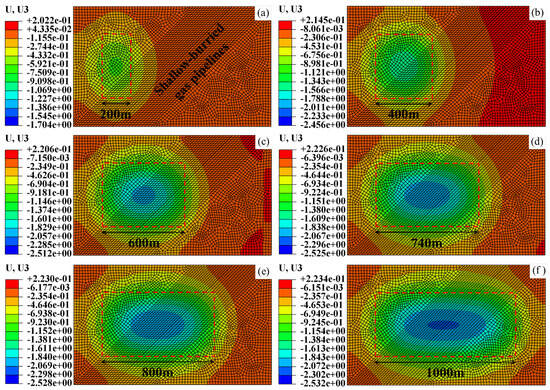
Figure 28.
Relation between the ground settlement and the relative position of the pipeline with an angle of 45° from the propulsion direction. (a) Advance distance: 200 m. (b) Advance distance: 400 m. (c) Advance distance: 600 m. (d) Advance distance: 740 m. (e) Advance distance: 800 m. (f) Advance distance: 1000 m.
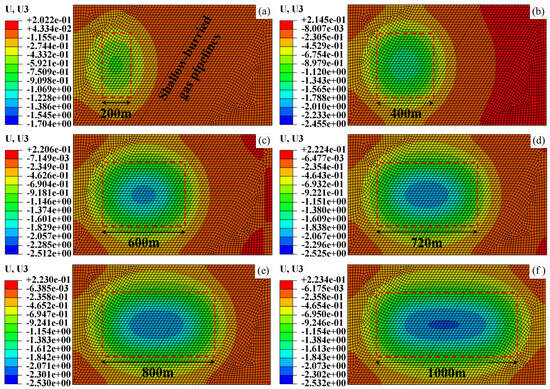
Figure 29.
Relation between the ground settlement and the relative position of the pipeline with an angle of 60° from the propulsion direction. (a) Advance distance: 200 m. (b) Advance distance: 400 m. (c) Advance distance: 600 m. (d) Advance distance: 720 m. (e) Advance distance: 800 m. (f) Advance distance: 1000 m.
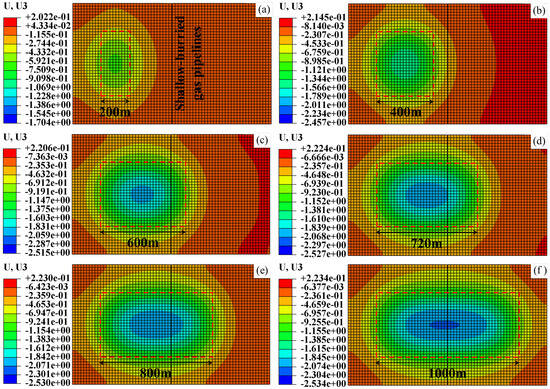
Figure 30.
Relation between the ground settlement and the relative position of the pipeline with an angle of 90° from the propulsion direction. (a) Advance distance: 200 m. (b) Advance distance: 400 m. (c) Advance distance: 600 m. (d) Advance distance: 720 m. (e) Advance distance: 800 m. (f) Advance distance: 1000 m.
Analysis of the non-coordinated deformation behavior between the pipeline and surrounding soil revealed distinct separation patterns at different advancement distances in the central pipeline region (Figure 31). During the entire extraction cycle, the separation between the pipeline and the sand body at a 45° angle was significantly greater than at other angles. When the working face advanced to 400 m, the maximum separation reached 16.21 mm. As the extraction continued, the separation began to decrease. Throughout the extraction cycle, the separation between the pipeline and the sand body first increased and then decreased. Intermediate separation magnitudes were observed for 30° and 60° angles, while 90° and 0° configurations showed minimal displacement. The 0° and 30° cases exhibited continuous separation growth, reaching maximum values of 6.25 mm and 12.2 mm, respectively, with the parallel alignment (0°) showing the least separation overall. More complex triphasic separation patterns (growth–reduction–regrowth) emerged for 60° and 90° angles, attaining peak separations of 11.82 mm and 8.69 mm, respectively.
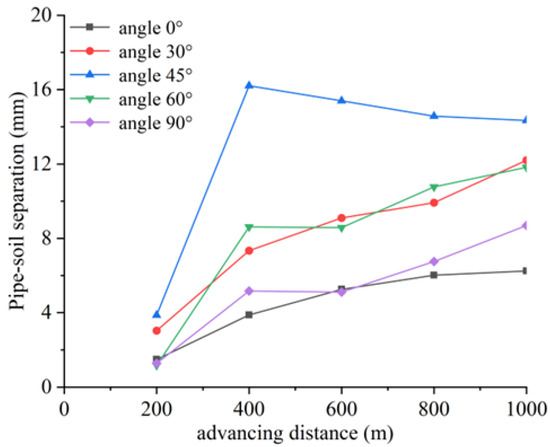
Figure 31.
The maximum amount of separation between the pipe and the sand body around the pipe at different angles from the working face.
5. Protective Measures for Shallow-Buried Pipelines: Discussions and Limitations
The numerical model in this study was established based on field stratigraphic data, with mechanical parameters of coal and rock and pipelines assigned according to material properties. The model’s accuracy was validated using post-mining surface subsidence data, ensuring the reliability of subsequent research findings regarding the spatiotemporal evolution of surface settlement and pipeline loading/deformation under high-intensity mining conditions. Building upon the simulation results obtained in Section 4, the following protective measures and recommendations are proposed:
(1) The forward influence distance of the working face on the pipeline is 260 m. Mitigation measures should be implemented before reaching this critical distance, including reducing the advancement rate and mining height to minimize surface movement-induced impacts on pipeline stability.
(2) For subsequent mining operations near shallow-buried pipelines, the advancement speed should be controlled below 10 m/d. When approaching the pipeline, the mining thickness must be limited to under 2.5 m. If pipeline installation in the goaf is necessary, a 90° orientation relative to the advancement direction is recommended.
(3) Although shallow-buried pipelines with a 90° intersection angle to the working face advancement direction experience shorter mining influence distances compared to other angular configurations, they remain susceptible to damage within the goaf area, particularly in the central zone. Therefore, pre-emptive measures should include implementing limited-thickness mining based on predicted influence distances to reduce overburden failure scope and intensity by decreasing extraction height or conducting targeted grouting in bed separation zones within the overlying strata of the mining area to provide structural support, thereby significantly mitigating surface subsidence in coal–oil/gas overlapping resource zones and ensuring pipeline integrity.
(4) This study presents a mechanical model focused on the acute loading and deformation of pipelines subjected to intensive short-term mining subsidence. However, certain limitations should be acknowledged. The model primarily treats stress exceeding the yield strength as a threshold for integrity loss, without delving into the intricacies of long-term mechanical behaviors such as low-cycle fatigue, fracture mechanics, and the progressive accumulation of plastic strain. In the context of high-intensity mining, the primary threat to pipeline integrity is the severe stress concentration and large deformations induced by the rapid and large-scale ground movement. While these acute factors are the dominant failure modes in our study scenario, the omission of time-dependent degradation processes is a recognized limitation. This simplification means the model does not capture potential failure mechanisms that could manifest over the pipeline’s full lifecycle under repeated or sustained loading. Therefore, future research will aim to develop a more sophisticated framework that incorporates cyclic plasticity models, fatigue life analysis, and fracture mechanics criteria. This will allow for a comprehensive assessment of pipeline integrity under the combined effects of both acute mining-induced subsidence and long-term operational loads, providing a more holistic understanding of failure risks over time.
6. Conclusions
(1) This study reveals distinct risk distribution characteristics in mining-affected zones, with the central working face area exhibiting Grade I–II high risks due to curvature deformation while maintaining relative stability within the 40 m haulage gateway buffer zone. Tilt deformation is identified as the dominant factor affecting pipeline stability, reaching Grade II risk when the working face advances to 567 m. The established correlation model between the advancement distance and risk grade demonstrates that pipeline placement within 40 m of goaf edges significantly reduces mining impacts.
(2) Pipeline stress response follows a typical three-stage evolution pattern, with peak stress reaching 488.6 MPa during active subsidence, leading to yielding failure. Stress distribution along the axial direction shows characteristic heterogeneity, with 45° and 135° circumferential positions exhibiting the highest failure risk due to combined mechanical effects. This study identifies 15 m/d as the most critical advance rate and proposes a 315 MPa safety threshold.
(3) As mining height increases from 3.5 m to 7.5 m, pipeline peak stress rises correspondingly, while the peak stress location shifts 20 m toward the working face. Notably, when the mining height exceeds 5.5 m, pipe–soil interaction demonstrates abrupt changes characterized by a rapid separation increase and pronounced soil arching effects.
(4) The pipeline’s mechanical response shows significant dependence on intersection angles with the working face. Increasing the angle from 0° to 90° reduces peak stress by approximately 30%. Comprehensive analysis indicates that adopting 45–60° crossing angles effectively controls stress levels while avoiding excessive soil separation.
(5) Three key control measures are proposed: limiting advance rates below 10 m/d, restricting mining heights to 2.5 m in affected zones, and prioritizing perpendicular pipeline alignment. Engineering verification shows these measures can reduce pipeline stress by 30–40% and decrease soil separation by over 50%, providing reliable guidelines for practical applications.
Author Contributions
Conceptualization, S.L. and Y.X.; methodology, S.L. and Y.X.; software, Y.X.; validation, Y.X. and J.S.; formal analysis, Y.X.; investigation, X.L., Y.M., and C.L.; resources, S.X.; data curation, M.Y.; writing—original draft preparation, Y.X.; writing—review and editing, Y.X. and Q.W.; visualization, Y.X. and J.S.; project administration, S.L. All authors have read and agreed to the published version of the manuscript.
Funding
This research was funded by the National Natural Science Foundation of China (52174139), the Postgraduate Research & Practice Innovation Program of Jiangsu Province (KYCX25_2942), and the Graduate Innovation Program of China University of Mining and Technology (2025 WLJCRCZL026).
Data Availability Statement
Data are contained within the article.
Conflicts of Interest
Authors Xu Liang and Yindou Ma were employed by the company Shaanxi Xiaobaodang Mining Corporation Limited. Author Miao Yang was employed by the company Shenhua Xinjie Energy Company Limited. Author Shaoyou Xu and Changheng Luo was employed by the company Sinopec North China Petroleum Bureau and North China Oil, and Gas Branch Gas Production Plant 2. The remaining authors declare that the research was conducted in the absence of any commercial or financial relationships that could be construed as a potential conflict of interest.
Abbreviation
The following abbreviations are used in this manuscript:
| LWWF | Longwall working face |
References
- Yuan, L. Scientific problem and countermeasure for precision mining of coal and associated resources. J. China Coal Soc. 2019, 44, 1–9. [Google Scholar]
- Huang, B.X.; Zhao, X.L.; Zhang, Q. Framework of the theory and technology for simultaneous mining of coal and its associated resources. J. China Univ. Min. Technol. 2016, 45, 653–662. [Google Scholar]
- Xu, Y.N.; Liang, S.; Liang, X.; Yang, B.; Shi, Z.L.; Wu, C.L.; Shen, J.H.; Yang, M.; Ma, Y.D.; Xu, P. Spatio-temporal evolution of loading and deformation of surface gas pipelines for high-intensity coalbed mining and its integrity prediction methodology. Processes 2024, 12, 213. [Google Scholar] [CrossRef]
- Liang, S.; Elsworth, D.; Li, X.H.; Fu, X.H.; Yang, D.; Yao, Q.L.; Wang, Y. Dynamic impacts on the survivability of shale gas wells piercing longwall panels. J. Nat. Gas Sci. Eng. 2015, 26, 1130–1147. [Google Scholar] [CrossRef]
- Liang, S.; Elsworth, D.; Li, X.H.; Fu, X.H.; Sun, B.Y.; Yao, Q.L. Key strata characteristics controlling the integrity of deep wells in longwall mining areas. Int. J. Coal Geol. 2017, 172, 31–42. [Google Scholar] [CrossRef]
- Liang, S.; Elsworth, D.; Fu, X.H.; Li, X.H.; Yao, Q.L. Influence of Stratigraphic Conditions on the Deformation Characteristics of Oil/Gas Wells Piercing Longwall Pillars and Mining Optimization. Energies 2017, 10, 775. [Google Scholar] [CrossRef]
- Liang, S.; Elsworth, D.; Li, X.H.; Yang, D. Topographic influence on stability for gas wells penetrating longwall mining areas. Int. J. Coal Geol. 2014, 132, 23–36. [Google Scholar] [CrossRef]
- Liang, S.; Li, X.H.; Yao, Q.L.; Yang, D. Influence of weak interlayer contacts on the stability of shale gas wells transiting minable coal seams. J. Min. Saf. Eng. 2015, 32, 471–477. [Google Scholar]
- Parmelee, R.; Ludtke, C. Seismic soil-structure interaction of buried pipelines. In Proceedings of the U.S. National Conference on Earthquake Engineering, Oakland, CA, USA, 18–20 June 1975; Earthquake Engineering Research Institute: Oakland, CA, USA, 1975; pp. 406–415. [Google Scholar]
- Ariman, T.; Muleski, G.E. A review of the response of buried pipelines under seismic excitations. J. Earthq. Eng. Struct. Dyn. 1981, 9, 133–152. [Google Scholar] [CrossRef]
- Wang, Z.; Lu, Z.; Zhang, D.; Liu, H. Stress effect of the interface between buried pipeline and sandy soil layer in a cold environment. J. Cold Reg. Sci. Technol. 2020, 172, 102981. [Google Scholar] [CrossRef]
- Ma, Q.; Zeng, G.; Zheng, J.; Pan, Y. Laboratory investigation on the pipeline-soil interaction under different freezing conditions. J. Cold Reg. Sci. Technol. 2024, 217, 104050. [Google Scholar] [CrossRef]
- Li, H.; Lai, Y.; Chen, Y.; Li, L. Upheaval buckling resistance of pipelines buried in unsaturated clay backfills. J. Int. J. Geomech. 2023, 23, 04023032. [Google Scholar] [CrossRef]
- Ding, Y.; Yang, H.; Xu, P.; Zhang, M.; Hou, Z. Coupling interaction of surrounding soil-buried pipeline and additional stress in subsidence soil. J. Geofluids 2021, 2021, 7941989. [Google Scholar] [CrossRef]
- Costa, Y.D.J.; Zornberg, J.G.; Costa, C.M.L. Physical modeling of buried PVC pipes overlying localized ground subsidence. J. Acta Geotech. 2021, 16, 807–825. [Google Scholar] [CrossRef]
- Wu, Y.; You, X.; Zha, S. Mechanical behavior analysis of buried polyethylene pipe under land subsidence. J. Eng. Fail. Anal. 2020, 108, 104351. [Google Scholar] [CrossRef]
- Zhao, B.; Zhang, H.; Wang, Y.; Zhou, Y.; Zhang, J. Mechanical behavior of gas-transmission pipeline in a goaf. Processes 2023, 11, 1022. [Google Scholar] [CrossRef]
- Wang, M.; Zhong, M.S.; Long, Y.; Ding, K.; Xie, X.B.; Ying, L. Study on dynamic strain regularity and influencing factors of shallow buried metal pipe under collapse impact load. J. Shock Vib. 2018, 2018, 8792564. [Google Scholar] [CrossRef]
- Zhang, J.; Xie, R.; Zheng, T.; Lu, G.H.; Xu, J.Y. Buckling behavior of buried pipe crossing stratum subsidence area. J. Eng. Fail. Anal. 2022, 135, 106130. [Google Scholar] [CrossRef]
- Saberi, M.; Arabzadeh, H.; Keshavarz, A. Numerical analysis of buried pipelines with right angle elbow under wave propagation. J. Procedia Eng. 2011, 14, 3260–3267. [Google Scholar] [CrossRef]
- Vazouras, P.; Tsatsis, A.; Dakoulas, P. Thermal upheaval buckling of buried pipelines: Experimental behavior and numerical modeling. J. Pipeline Syst. Eng. Pract. 2021, 12, 04020057. [Google Scholar] [CrossRef]
- Fadaee, M.; Farzaneganpour, F.; Anastasopoulos, I. Response of buried pipeline subjected to reverse faulting. J. Soil Dyn. Earthq. Eng. 2020, 132, 106090. [Google Scholar] [CrossRef]
- Saboya, F., Jr.; Tibana, S.; Reis, R.M.; Farfan, A.D.; Melo, C.M.D.A.R. Centrifuge and numerical modeling of moving traffic surface loads on pipelines buried in cohesionless soil. J. Transp. Geotech. 2020, 23, 100340. [Google Scholar] [CrossRef]
- Alzabeebee, S.; Chapman, D.N.; Faramarzi, A. A comparative study of the response of buried pipes under static and moving loads. J. Transp. Geotech. 2018, 15, 39–46. [Google Scholar] [CrossRef]
- Cheng, Y.; Han, C.J.; Xie, R.; Wang, L. Mechanical behavior analysis of buried pipeline understratum settlement caused by underground mining. J. Int. J. Press. Vessel. Pip. 2020, 188, 104212. [Google Scholar]
- Sarvanis, G.C.; Karamanos, S.A. Analytical model for the strain analysis of continuous buried pipelines in geohazard areas. J. Eng. Struct. 2017, 152, 57–69. [Google Scholar] [CrossRef]
- Zheng, T.; Liang, Z.; Zhang, L.; Tang, S.; Cui, Z.Y. Safety assessment of buried natural gas pipelines with corrosion defects under the ground settlement. J. Eng. Fail. Anal. 2021, 129, 105663. [Google Scholar] [CrossRef]
- Bazaluk, O.; Kuchyn, O.; Saik, P.; Soltabayeva, S.; Brui, H.; Lozynskyi, V.; Cherniaiev, O. Impact of ground surface subsidence caused by underground coal mining on natural gas pipeline. J. Sci. Rep. 2023, 13, 19327. [Google Scholar] [CrossRef]
- Peng, S.S.; Luo, Y. Determination of stress field in buried thin pipelines resulting from ground subsidence due to longwall mining. J. Min. Sci. Technol. 1988, 6, 205–216. [Google Scholar] [CrossRef]
- Luo, Y.; Peng, S.; Chen, H. Protection of pipelines affected by surface subsidence. J. Trans. 1998, 302, 98–103. [Google Scholar]
- Polak, M.A.; Duyvestyn, G.; Knight, M. Experimental strain analysis for polyethylene pipes installed by horizontal directional drilling. J. Tunn. Undergr. Space Technol. 2004, 19, 205–216. [Google Scholar] [CrossRef]
- Guo, W.B.; Wang, Y.G. The definition of high-intensity mining based on green coal mining and its index system. J. Min. Saf. Eng. 2017, 34, 616–623. [Google Scholar]
- Guo, W.B.; Bai, E.H.; Yang, D.M. Study on the technical characteristics and index of thick coal seam high-intensity mining in coalmine. J. China Coal Soc. 2018, 43, 2117–2125. [Google Scholar]
- Q/SY 05487–2017; Specifications for Safety Design and Prevention Technique of Oil and Gas Pipeline in Mining Subsidence Areas. Petroleum Industry Press: Beijing, China, 2017.
- Zhang, J.; Xie, R. Numerical analysis of mechanical behavior of buried pipes in subsidence area caused by underground mining. J. Press. Vessel Technol. 2019, 141, 021703. [Google Scholar] [CrossRef]
- Zhang, J.; Xie, R.; Zhang, H. Mechanical response analysis of the buried pipeline due to adjacent foundation pit excavation. J. Tunn. Undergr. Space Technol. 2018, 78, 135–145. [Google Scholar] [CrossRef]
- Xu, P. Study on the Buried Pipeline-Soil Interaction and Its Mechanical Response by Mining Subsidence. Ph.D. Thesis, China University of Mining and Technology, Xuzhou, China, 2015. [Google Scholar]
- Xu, P.; Zhang, M.; Lin, Z.; Cao, Z.; Chang, X. Additional stress on a buried pipeline under the influence of coal mining subsidence. J. Adv. Civ. Eng. 2018, 2018, 3245624. [Google Scholar] [CrossRef]
- Tong, F.C.; Chen, G.; Tang, M.M.; Cao, Y.B.; Cao, Y.P.; Yang, Y.L. Analysis and optimization of wellbore structure considering casing stress in oil and gas wells within coal mine goaf areas subject to overburden movement. J. Process. 2025, 13, 2948. [Google Scholar] [CrossRef]
- GB/T 9711-2023; Petroleum and Natural Gas Industries—Steel Pipe for Pipeline Transportation Systems. Standards Press of China: Beijing, China, 2023.


Disclaimer/Publisher’s Note: The statements, opinions and data contained in all publications are solely those of the individual author(s) and contributor(s) and not of MDPI and/or the editor(s). MDPI and/or the editor(s) disclaim responsibility for any injury to people or property resulting from any ideas, methods, instructions or products referred to in the content. |
© 2025 by the authors. Licensee MDPI, Basel, Switzerland. This article is an open access article distributed under the terms and conditions of the Creative Commons Attribution (CC BY) license (https://creativecommons.org/licenses/by/4.0/).